Embed Size (px)
Citation preview

AAHSA 2007 Ann al Meeting & E positionAAHSA 2007 Annual Meeting & Exposition
Benchmarking using Management Information SystemsManagement Information Systems
Session 63-E
Tuesday, October 23, 20073:00p – 4:00p

Speakers: Contact Information
Kathleen HarrisKathleen HarrisPresidentK Harris Consulting [email protected]
Paul SheltonChief Financial OfficerWestminster Canterbury of LynchburgWestminster Canterbury of [email protected]
Hunsdon “H” Cary, IIIP id t & CEOPresident & CEOWestminster Canterbury of [email protected]
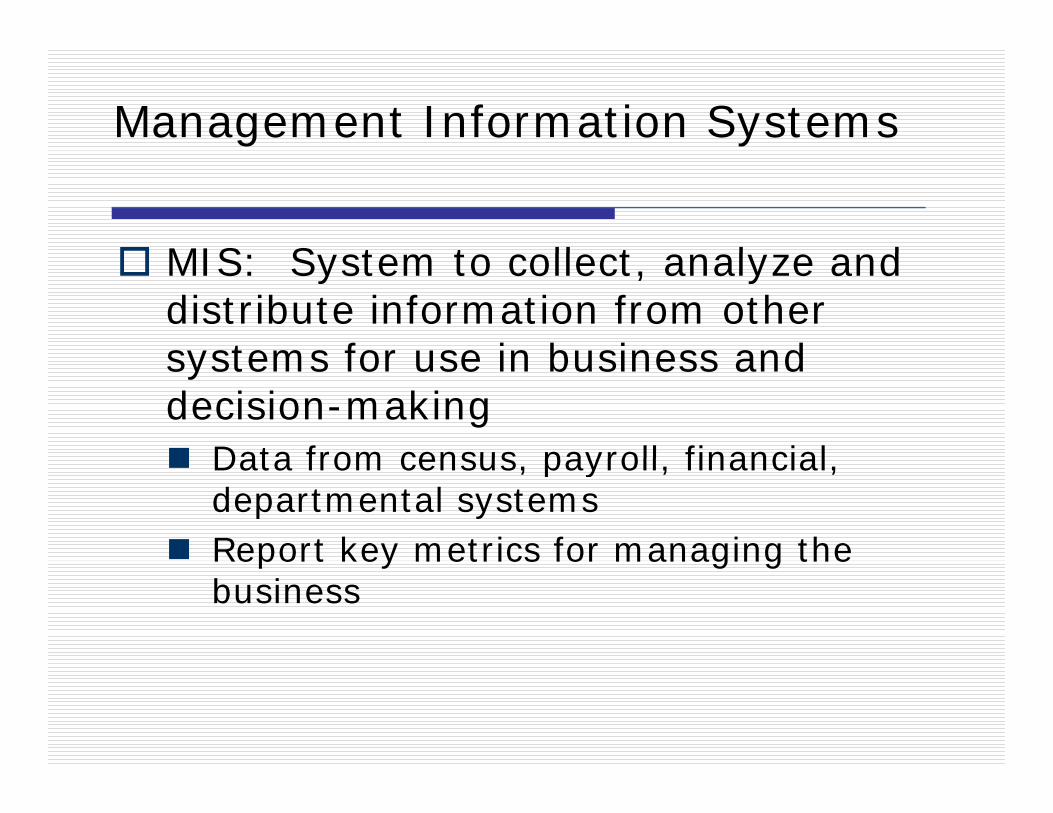
Management Information Systems
MIS S t t ll t l d MIS: System to collect, analyze and distribute information from other systems for use in business and systems for use in business and decision-making
Data from census payroll financial Data from census, payroll, financial, departmental systemsReport key metrics for managing the Report key metrics for managing the business

Barriers to Benchmarkingg
D t t ll t d i tData not collected or inaccurateData not easily accessible
Different systems, manual processes
Uniqueness excuseFocus on financial rather than operationalFocus on lagging indicators rather than leading indicators
4

Balanced Scorecard
“fi i l i d t f “financial measures are inadequate...for guiding and evaluating the journey to create future value journey...to create future value through investment in customers, suppliers employees processes suppliers, employees, processes, technology, and innovation.”
Dr. Robert Kaplan and Dr. David Norton, developers of the balanced scorecard system
5

Balanced Scorecard Perspectivesp
Learning and GrowthLearning and GrowthTechnological tools
Business ProcessMission oriented performance
CustomerSatisfaction is leading indicatorSatisfaction is leading indicator
FinancialTimely, accurate, centralized, automated
©Paul Arveson, 1998; www.balancedscorecard.org
6

CCRC Metrics reflecting Balanced Scorecard PerspectivesScorecard Perspectives
Learning and Growth = HRLearning and Growth = HRtime to fill positionsemployee satisfactionemployee satisfactionemployee turnover
Business Process = Service DeliveryBusiness Process Service DeliveryMaintenance hours/square footHousekeeping square foot cleanedMeals served/labor hourNursing hours/resident day

CCRC Metrics reflecting Balanced Scorecard Perspectives (cont)Scorecard Perspectives (cont)
Customer = resident/family Customer = resident/family satisfaction
referralsreferralsservice satisfactionperception of outcome satisfactionp p
Financial = financial viabilityrisk assessmentcost/benefit analysiscommon CCRC metrics
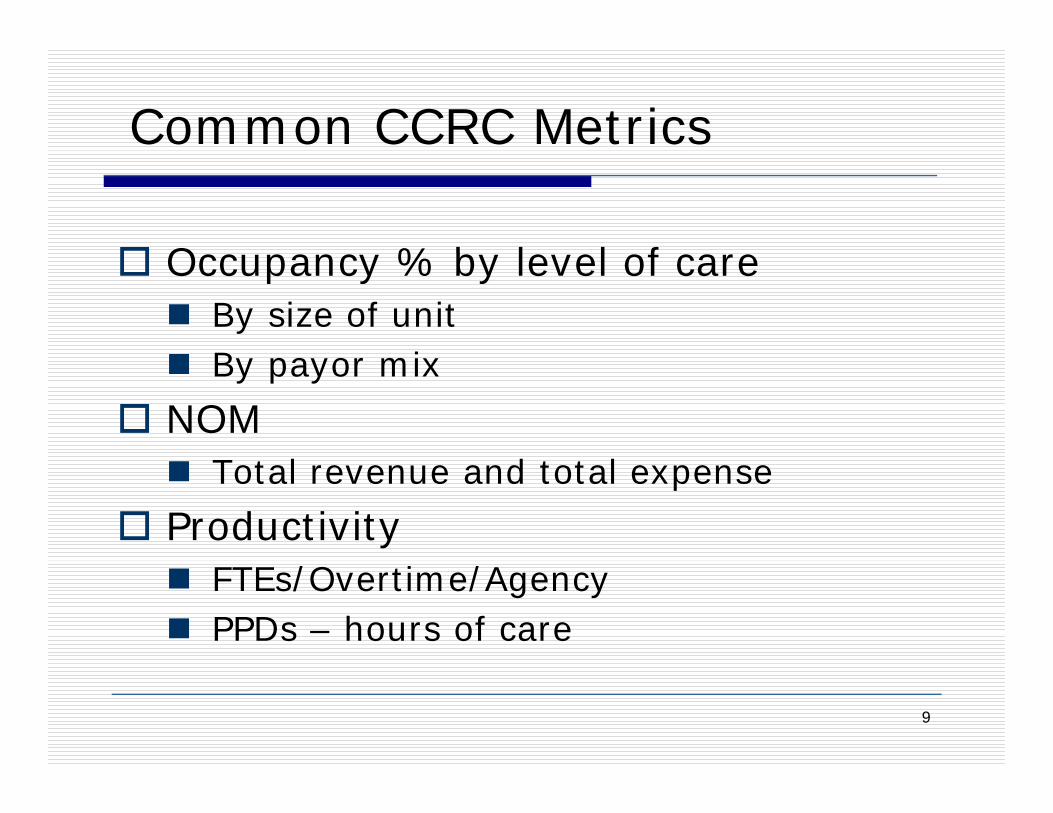
Common CCRC Metrics
O % b l l f Occupancy % by level of careBy size of unitB iBy payor mix
NOMl d lTotal revenue and total expense
ProductivityFTEs/Overtime/AgencyPPDs – hours of care
9

Defining Metrics and Targetsg g
Key indicators/critical success factorsKey indicators/critical success factors“At a glance” and drill down approachIdentify areas where focus is neededIdentify areas where focus is neededEvaluate strategic plans and assess operational and financial goals
Measurement targetsStart with your own past performance
d t t d i d f b d tand targets derived from budgetResearch industry databases and experts
10

Asbury Approachy pp
C t D hb d 4 k t iCorporate Dashboard – 4 key metricsFinancial
NOM budget variance days in ARNOM, budget variance, days in AR
Census & Occupancyby unit, lost revenue reportsby unit, lost revenue reports
HRstaff turnover, retention, termination analysis
Clinical sentinel events, survey results
11

Asbury Approach
B i P t l C t i d t h Business Portal – Customized to each employee based on job/role
Rele ant epo ts dashboa ds ale tsRelevant reports, dashboards, alertsRole-based task lists, P&Ps, instruction setssetsAccess to application softwareTraining tool and unified process toolTraining tool and unified process tool
Contact Chip Burns: [email protected] yg p

Rest Haven/Provinet Approach/ pp
Management/IT Focus:SoftwareSoftware
Integrate best of breedRisk Management
Real time internet system; paperlessSatisfaction – resident, family, staff
State association surveysState association surveysQI/QM
Evaluated in external database before sent to FIAdaptive technologiesAdaptive technologies
Community-based services
Contact Jeff Mukamal: jeffm@provinet com13
Contact Jeff Mukamal: [email protected]

WC of Lynchburg ApproachWC of Lynchburg Approach
CFO t k th l d did ’t it f CFO took the lead – didn’t wait for software vendor or IT to provide MIS
Accessed e ified data f om diffe ent Accessed verified data from different sourcesAutomated processAutomated processDeveloped reports
Result is customized MIS that board Result is customized MIS that board and senior management rely upon
14

Fractured “Database” ChaosFractured Database Chaos
A tiMarketing Accounting
Resident Life
Healthcare
Building & G d
Dining Environmental Services
15
Groundsg Environmental Services
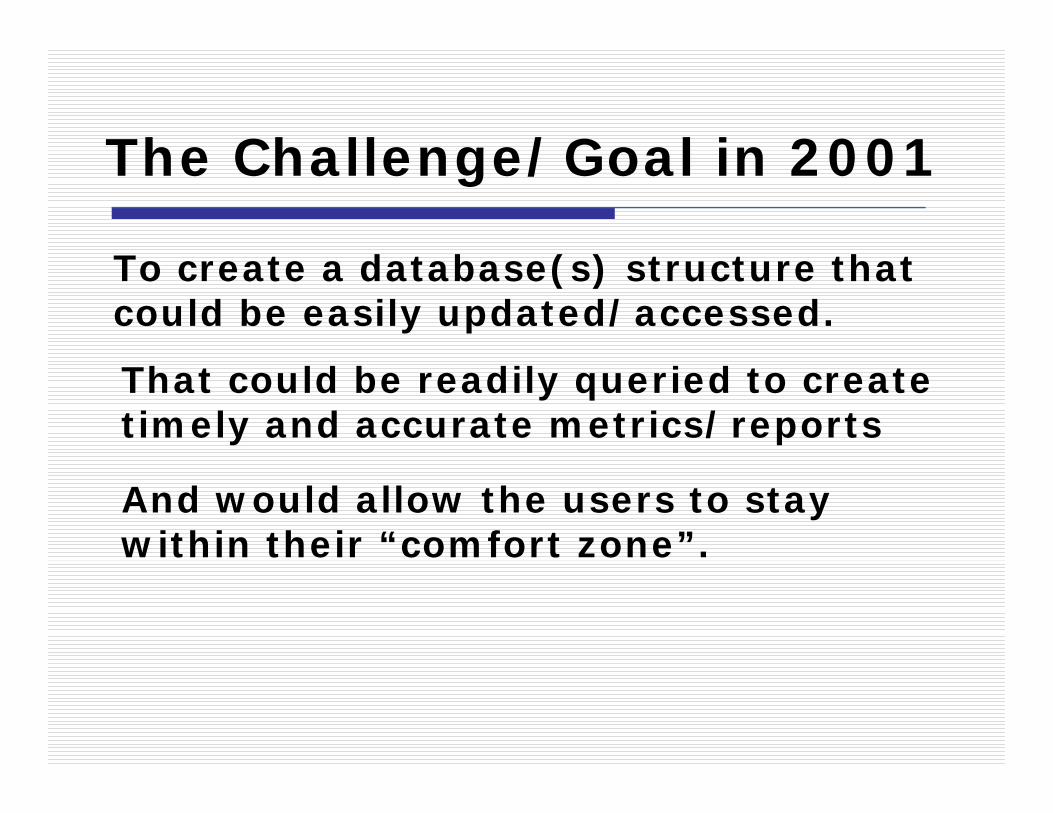
The Challenge/Goal in 2001The Challenge/Goal in 2001
d b ( ) hTo create a database(s) structure that could be easily updated/accessed.
That could be readily queried to create timely and accurate metrics/reports
And would allow the users to stay within their “comfort zone”.

Requirements for timely access to information access to information
Build a common language between Build a common language between departmentsCentralize how and where data is storedCentralize how and where data is stored
Departmental over-reliance on Excel to accumulate information that should be shared centrallyScattered information transmitted via
/i t ffi lpaper/interoffice envelopes
17

Resistance to Changeg
Departmental frustration - having to learn something new
How long has the employee been in the position?
Do we have to?
Why are you changing this?
18

Software and Data Integrationg
GOAL – to have all information entered into a central
A f ll tili i t ft ?
database or databases that can be queried or easily exported
Are you fully utilizing your current software?Do you need new software or can you add to your current software environment?
How extensive is your IT department?
Do you have an IT department?
Retain a database consultant/expert
Does the software cater to your industry?
19
y y

Metrics – Dashboard Creation
D hb d i t d f 4 Dashboard is created from 4 sources:Income StatementCCensusDining RecapPayrollPayroll
Constants – Budget, Square Footage
blVariables – #Pay Periods, # Months

Income Statement can be printed and viewed on the screen. Drill down is allowed.
The printed report definition is also used for the export!
21
p p p

Metrics – Dashboard CreationMetrics – Dashboard CreationThe Income Statement data is output to an Excel Spread Sheet
via a report generatorp g
The report generator allows
you multiple choices for output!choices for output!It is then imported
into the custom financial book that includes a “Dash includes a Dash
Board”.And further
massaged into multiple other multiple other
reports
22

Metrics/Dashboard/Westminster Canterbury Lynchburg - Financial Performance Summary
Dashboard - as of September 30, 2007R ti FY 2006 YTD 2007 CCAC 50%Ratios FY 2006 YTD 2007 CCAC 50%
Operating Ratio (Exp/Rev) Smaller is better 104.0% 104.4% 101.8%Net Operating Margin Ratio Larger is better -3.95% 1.66% 1.0%
Net Operating Margin Ratio - Adjusted Larger is better 19.29% 23.12% 22.3%
Entrance Fees FY 2006 YTD 2007 YTD Budget
Net $4,350,230 $4,610,163 $4,488,000
Occupancy FY 2006 YTD AVG 2007 AVP 50%
Residential Living 93% 94% 94%Assisted Living 84% 87% 87%Health Care 95% 94% 91%
Days Cash on Hand Larger is Better FY 2006 YTD 2007 CCAC 50%
197 260 312
Debt Service Coverage Larger is better FY 2006 YTD 2007 CCAC 50%
Covenant 1.10 2.38 2.41 2.40
Actuarial Valuations as of 9/30/2006 FY 2006 FY 2007 AVP 50%
F d d St t ** 102 3% 102 3% ≥101%
23
Funded Status** 102.3% 102.3% ≥101%New Entrant Pricing Adequacy 23.6% 23.6% ≥12%
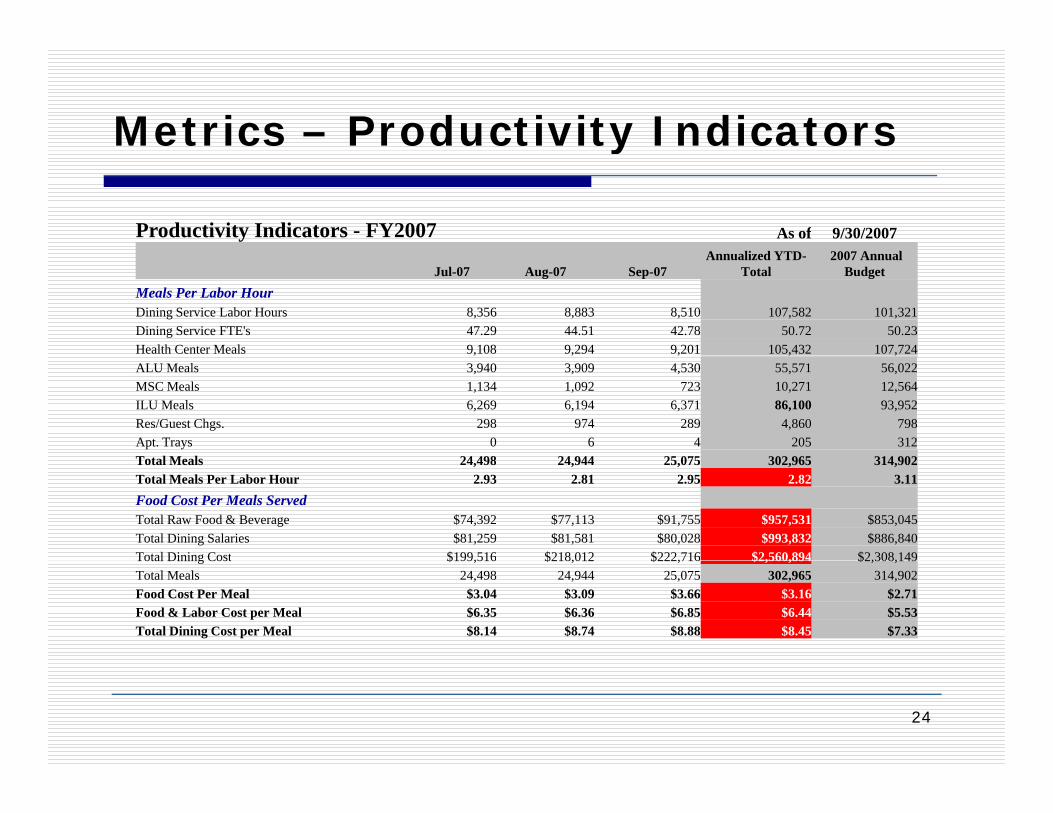
Metrics – Productivity Indicatorsy
Productivity Indicators - FY2007 As of 9/30/2007A li d YTD 2007 A l
Jul-07 Aug-07 Sep-07Annualized YTD-
Total2007 Annual
BudgetMeals Per Labor HourDining Service Labor Hours 8,356 8,883 8,510 107,582 101,321Dining Service FTE's 47.29 44.51 42.78 50.72 50.23Health Center Meals 9,108 9,294 9,201 105,432 107,724, , , , ,ALU Meals 3,940 3,909 4,530 55,571 56,022MSC Meals 1,134 1,092 723 10,271 12,564ILU Meals 6,269 6,194 6,371 86,100 93,952Res/Guest Chgs. 298 974 289 4,860 798Apt. Trays 0 6 4 205 312T t l M l 24 498 24 944 25 075 302 965 314 902Total Meals 24,498 24,944 25,075 302,965 314,902Total Meals Per Labor Hour 2.93 2.81 2.95 2.82 3.11Food Cost Per Meals ServedTotal Raw Food & Beverage $74,392 $77,113 $91,755 $957,531 $853,045Total Dining Salaries $81,259 $81,581 $80,028 $993,832 $886,840Total Dining Cost $199,516 $218,012 $222,716 $2,560,894 $2,308,149Total Dining Cost $199,516 $218,012 $222,716 $2,560,894 $2,308,149Total Meals 24,498 24,944 25,075 302,965 314,902Food Cost Per Meal $3.04 $3.09 $3.66 $3.16 $2.71Food & Labor Cost per Meal $6.35 $6.36 $6.85 $6.44 $5.53Total Dining Cost per Meal $8.14 $8.74 $8.88 $8.45 $7.33
24

Metrics – Productivity Indicatorsy
Productivity Indicators - FY2007 As of 9/30/2007
J l 07 A 07 S 07Annualized YTD-
T t l 2007 A l B d tJul-07 Aug-07 Sep-07 Total 2007 Annual Budget
Staffing IndicatorsHealth Center Resident Days 3,036 3,188 3,030 35,792 36,428Health Center Average Daily Census 97.94 102.84 101.00 98.06 100Occupancy 93.27% 97.94% 96.19% 93.39% 95.1%Medicare Days 523 603 549 7,110 4,370Medicare Average Daily Census 16.87 19.45 18.30 19.56 11.97Medicaid Days 359 403 395 4,600 5,778Medicaid Average Daily Census 11.58 13.00 13.17 12.60 15.83Health Center Direct Total Labor Hours 14,679 13,937 12,925 170,665 175,428HC Direct Labor Hours Per Patient Day 4.84 4.37 4.27 4.77 4.80ALU Resident Days 1670 1687 1614 19,840 19,456ALU Average Daily Census 53.87 54.42 53.80 54.38 53.30ALU Occupancy 88.31% 89.21% 88.20% 90.63% 88.84%ALU Direct Total Labor Hours 4,867 4,919 4,795 59,069 62,558ALU Direct Labor Hours Per Patient Day 2.91 2.92 2.97 2.98 3.22MSC Resident Days 406 369 395 3,616 4502MSC Average Daily Census 13.10 11.90 13.17 9.90 12.33g yOccupancy 93.55% 85.02% 94.05% 70.69% 88.10%MSC Direct Total Labor Hours 1,464 1,428 1374.98 16,829 17,664Direct MSC Labor Hours Per Patient Day 3.61 3.87 3.48 4.65 3.92ILU Resident Days 7010 7024 6940 84,656 84,376ILU Average Daily Census 226.13 226.58 231.33 231.95 231.17Occupancy 91 92% 92 11% 94 04% 93.91% 93 59%
25
Occupancy 91.92% 92.11% 94.04% 93.91% 93.59%ILU 2nd Person Days 1891 1922 1909 22,799 25,947

Metrics – Productivity Indicatorsy
Productivity Indicators - FY2007 As of 9/30/2007Annualized YTD 2007 Annual
Jul-07 Aug-07 Sep-07Annualized YTD-
Total2007 Annual
BudgetOther Financial IndicatorsSalary Costs as a % of Net Revenue 42.35% 51.76% 36.66% 39.53% 40.74%Salary cost as a % of Total Expenses 44.20% 53.81% 39.17% 40.60% 42.03%Avg Hourly Salary Cost Per FTE $15.34 $13.64 $15.84 $14.05 $13.83Emp Benefits as a % of Salary Costs 27.84% 20.57% 29.08% 28.20% 26.62%Benefit cost per Labor Hour $4.27 $2.81 $4.61 $3.96 $3.64Total GAAP Revenues Per /PRD $134.87 $137.58 $157.01 $130.11 $117.46
Total Revenues/PRD Less Earned Ent Fees $114.80 $112.29 $135.63 $107.42 $103.79
Total Revenues/PRD+ Cash Entrance Fees $114.80 $128.27 $264.03 $135.90 $130.85Total Expenses/PRD $129.23 $132.33 $146.94 $126.67 $113.84
Total Expenses less Depr & Amort /PRD $113.58 $116.90 $129.43 $112.10 $104.97Cash Surplus/(Loss) PRD $1.22 -$4.61 $6.21 -$4.68 -$1.19
Cash Surplus or Drain on Cash Reserves $14,807.00 -$56,515.00 $74,364.00 -$735,792.00 -$196,879.07
Cash Surplus/Loss including Entrance Fees $14,807.00 $139,585.00 $1,612,438.00 $3,741,359.00 $4,297,370.93
Cash Surplus/Loss PRD incl Cash Ent Fee's $2.44 $6.77 $140.81 $19.12 $24.69Operating Ratio 98 94 104 10 95 42 104 36 101 14
26
Operating Ratio 98.94 104.10 95.42 104.36 101.14

Metrics – Historical Graphsp
27

Metrics – Payroll FTE report is created from a Crystal Reports query.y p q y
A query is written and run. It selects the data to be reported on,
YTD or MTD.
The raw data is displayed, The raw data is displayed, exported to an excel spread
sheet and imported for display (next screen)
28

Metrics – Payroll/FTE Detaily /
Westminster Canterbury - FTE Report FY2007 - for Check Dates 10/01/2006 to 9/30/2007 2080.08
PR HOURS BUDGETED HOURS PT, BP, BI PT, BP, BI FTE's Using Other Hours FTE's Using
2080 2080 Gross Regular Reg SK,ST,BD SK,ST,BD RG,PT,HP,BD Overtime Overtime Shift Dif,etc. Total RG,PT,HP,BD Budgeted
Labor Code Description Wages Earnings Hours Earnings Hours SK,BP,ST Hours $ $ Hours SK,BP,ST,OT FTE'S001100 HC RN'S0011003
HC RN S INTERMEDIATE 529,076 395,637 17,107 25,632 1,140 8.77 2,165.54 76,319 31,488 32,439 9.81 11.50
0011004
HC LPN'S INTERMEDIATE 714,767 568,570 32,978 30,325 1,842 16.74 2,993.02 78,291 37,580 49,617 18.18 20.00
0011005
HC NURSE AIDES INTERMEDIATE 984,915 811,950 80,410 48,102 5,075 41.10 4,854.45 74,534 50,328 121,603 43.43 48.84
0011008
HC UNIT CLERKS INTERMEDIATE 82,603 70,286 5,677 7,206 580 3.01 75.64 1,410 3,701 6,342 3.04 4.00
0024000024003 HC LIMBO RN 78,277 73,934 2,844 947 39 1.39 29.68 1,158 2,239 3,900 1.40 0.000024004 HC LIMBO LPN 74,710 69,093 3,290 2,679 162 1.66 17.58 554 2,384 4,507 1.67 0.000024005
HC LIMBO NURSE AIDE 126,410 118,241 9,097 1,899 180 4.46 110.37 2,152 4,119 13,910 4.51 0.00
2,590,758 2,107,711 151,403 116,789 9,016.42 77.12 10,246.28 234,418 131,840 232,317 82.05 84.34
29

Metrics – Payroll/FTE Summaryy / y
Gross Gross Regular+OT Regular+OT
Payroll Payroll PT,HP,SK,BP PT,HP,SK,BP Budgeted Budgeted Budgeted -Fav/+UnFav -Fav/+UnFav
$ AHR $ AHR FTE's FTE's AHR $ for YTD FTE's $ for YTD
HC – Dir & Cov $2,590,758.36 $15.18 $2,458,918.04 $14.41 82.05 84.34 $14.79 $2,595,185.00 -2.29 -$4,426.64
Totals/Avgs $2,590,758.36 $15.18 $2,458,918.04 $14.41 82.05 84.34 $14.79 $2,595,185.00 -2.29 -$4,426.64
Test Gross Payroll Pay Periods Paid Pay Periods AnnualizedSalaried Payroll $0.00 24 24 $0.00Hourly Pay $2,590,758.36 26 26 $2,590,758.36Total Payroll $2,590,758.36 $2,590,758.36B d t d $2 595 185 00Budgeted $2,595,185.00Over(+) Under(-) -$4,426.64% Over -0.17%
Gross Hours Worked 161,649.37Gross Wages Worked $2,590,758.36
Gross A erage Ho rl Rate $16 03Gross Average Hourly Rate $16.03 Regular Hours 151,403.09
Regular Wages $2,107,710.76 Regular Average Hourly Rate $13.92
Regular + PT,BP, BI, SK, ST, BD & OT Hours 161,649.37Regular + PT,BP, BI, SK, ST, BD & OT Wages $2,458,918.04
Regular + PT BP BI SK ST BD & OT Avg
30
Regular + PT,BP, BI, SK, ST, BD & OT AvgHourly $15.21

Health Care PPD report updated daily from Time Clock
Daily PPD Report Days Elapsed 16 Westminster-Canterbury
October2007 Healthcare ServicesDay Total SNF ALF MSC RN RN LPN LPN C.N.A. C.N.A. Direct Direct Direct
Census Census Census Census Budget Actual Budget Actual Budget Actual Budget Actual Variance1 98 18 54 12 0.60 0.57 1.08 1.07 2.82 2.44 4.50 4.08 0.422 98 18 54 12 0 60 0 54 1 08 1 10 2 82 2 73 4 50 4 37 0 132 98 18 54 12 0.60 0.54 1.08 1.10 2.82 2.73 4.50 4.37 0.133 98 16 54 12 0.60 0.36 1.08 1.25 2.82 3.04 4.50 4.65 -0.154 97 15 54 12 0.60 0.48 1.08 1.17 2.82 2.97 4.50 4.63 -0.135 98 16 54 12 0.60 0.53 1.08 1.12 2.82 3.16 4.50 4.82 -0.326 97 16 54 12 0.60 0.51 1.08 1.04 2.82 3.07 4.50 4.62 -0.127 97 14 54 12 0 60 0 64 1 08 1 04 2 82 3 17 4 50 4 85 0 357 97 14 54 12 0.60 0.64 1.08 1.04 2.82 3.17 4.50 4.85 -0.358 97 14 54 12 0.60 0.40 1.08 1.25 2.82 2.96 4.50 4.61 -0.119 96 15 54 12 0.60 0.47 1.08 1.22 2.82 2.83 4.50 4.52 -0.02
10 99 18 54 12 0.60 0.60 1.08 1.14 2.82 3.02 4.50 4.77 -0.2711 100 19 54 12 0.60 0.50 1.08 1.18 2.82 2.70 4.50 4.39 0.1112 100 18 54 12 0.60 0.36 1.08 1.10 2.82 2.75 4.50 4.20 0.3013 100 18 54 12 0.60 0.25 1.08 1.19 2.82 2.72 4.50 4.16 0.3414 100 18 54 12 0.60 0.36 1.08 1.20 2.82 2.41 4.50 3.97 0.5315 99 19 54 12 0.60 0.64 1.08 1.05 2.82 2.88 4.50 4.57 -0.0716 99 19 54 12 0.60 0.73 1.08 1.12 2.82 2.89 4.50 4.73 -0.23
31

Select the Best of the Best
Demographic D t b
Resident TrackingCensusMedical
R tiDatabase ReportingExport Query
G l L d
Accounting Database
General LedgerBilling, Payroll
Accounts PayableFixed AssetsDatabase
Financial ReportsExport & Query
32

Tools for Successful Reporting/Metrics Analysisp g/ y
R l ti l D t bRelational Databaseprovides access to multiple years of i f ti i hi tinformation on screen or in historyallows extract/query and ability to link (data dictionary) to external query softwaredictionary) to external query softwareincludes drill down capabilities for invoices, GL entries,
Versatile financial reporterCapable of exporting to multiple formats
33
p p g p

Reflections from the CEO
Operations Review Spring 2005Good News: most accurate, highest quality information
ever received.B d N d il i f d d l dilBad News: detail info needed to control ops not readily
accessible
ResultResult1. WCL quickly determined what information is vital for
successful financial performance and quality resident care
2. Productivity Reports designed and implemented
34
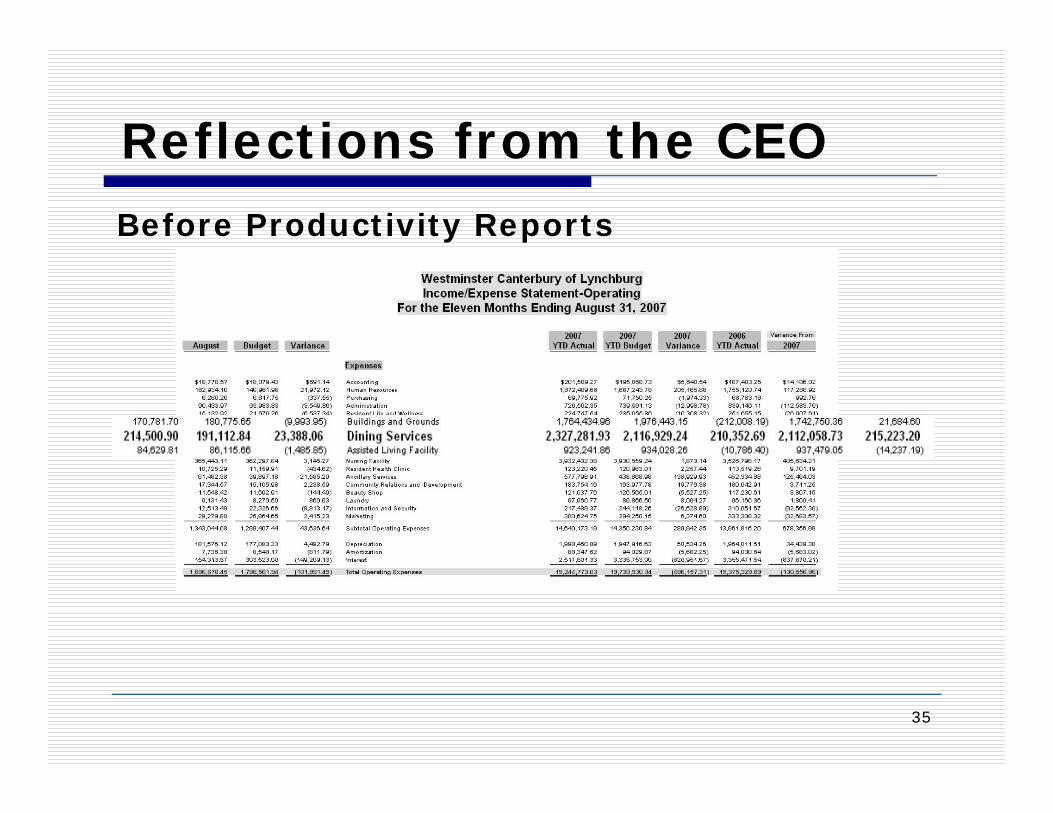
Reflections from the CEOReflections from the CEOBefore Productivity Reports
35

Reflections from the CEOReflections from the CEO
Dig deeper to determine what needs to be done.
36

Reflections from the CEOReflections from the CEOAfter Productivity Reports Night Vs. Day
Productivity Indicators - FY2007 As of 9/30/2007
Jul-07 Aug-07 Sep-07Annualized YTD-
Total2007 Annual
BudgetMeals Per Labor HourDining Service Labor Hours 8 356 8 883 8 510 107 582 101 321Dining Service Labor Hours 8,356 8,883 8,510 107,582 101,321Dining Service FTE's 47.29 44.51 42.78 50.72 50.23Health Center Meals 9,108 9,294 9,201 105,432 107,724ALU Meals 3,940 3,909 4,530 55,571 56,022MSC Meals 1,134 1,092 723 10,271 12,564ILU Meals 6,269 6,194 6,371 86,100 93,952Res/Guest Chgs. 298 974 289 4,860 798Apt. Trays 0 6 4 205 312Total Meals 24,498 24,944 25,075 302,965 314,902 Total Meals Per Labor Hour 2.93 2.81 2.95 2.82 3.11 Food Cost Per Meals ServedT t l R F d & B $74 392 $77 113 $91 755 $957 531 $853 045Total Raw Food & Beverage $74,392 $77,113 $91,755 $957,531 $853,045Total Dining Salaries $81,259 $81,581 $80,028 $993,832 $886,840Total Dining Cost $199,516 $218,012 $222,716 $2,560,894 $2,308,149Total Meals 24,498 24,944 25,075 302,965 314,902Food Cost Per Meal $3.04 $3.09 $3.66 $3.16 $2.71 Food & Labor Cost per Meal $6.35 $6.36 $6.85 $6.44 $5.53
37
Total Dining Cost per Meal $8.14 $8.74 $8.88 $8.45 $7.33

Reflections from the CEOReflections from the CEO
After Productivity ReportsAfter Productivity ReportsNight Vs. Day
• Nursing PPD report daily• Nursing PPD report daily
Census (by level) vs. budget
RN LPN CNA actual vs budgetRN, LPN, CNA actual vs. budget
Day Total HC SNF ALF MSC RN RN LPN LPN C.N.A. C.N.A. Direct Direct Direct
Census Census Census Census Budget Actual Budget Actual Budget Actual Budget Actual Variance
24 98 19 54 12 0.60 0.30 1.08 1.28 2.82 2.58 4.50 4.16 0.34
PPD target 4.5/Direct (4.8 with coverage)
Each 1/10% above or below = $70K/yr
25 98 18 54 12 0.60 0.50 1.08 1.14 2.82 2.77 4.50 4.40 0.10
3838
/ $ /y

Reflections from the CEO
1. Operations Review: Key to developing productivity numbers and reports.
2. Productivity Reports enable you to Quickly “Zero In” on problem areas.
3. Important By-Product: board’s trust & confidence increased markedly.
4. Quality First: Governance Compliance and Accountability, achieving high standards of management... And qualityof care consistent with WC/L mission and values.
3939
Reflections from the CEOReflections from the CEO
Management PrincipalManagement Principal
“Measure results and control operations Measure results and control operations through a reporting system.”
Thanks to an “Operations Review” and developing a Productivity Reporting p g y p gsystem, WC/L has that in spades!
404040