Embed Size (px)
Citation preview
Benchmarking Liability Claims Management
Rod McInnes & Steve Curley
Agenda
• Objective• Best Practice Claims Mgmt• Survey Methodology• Industry Results• Insurer Performance• Conclusions
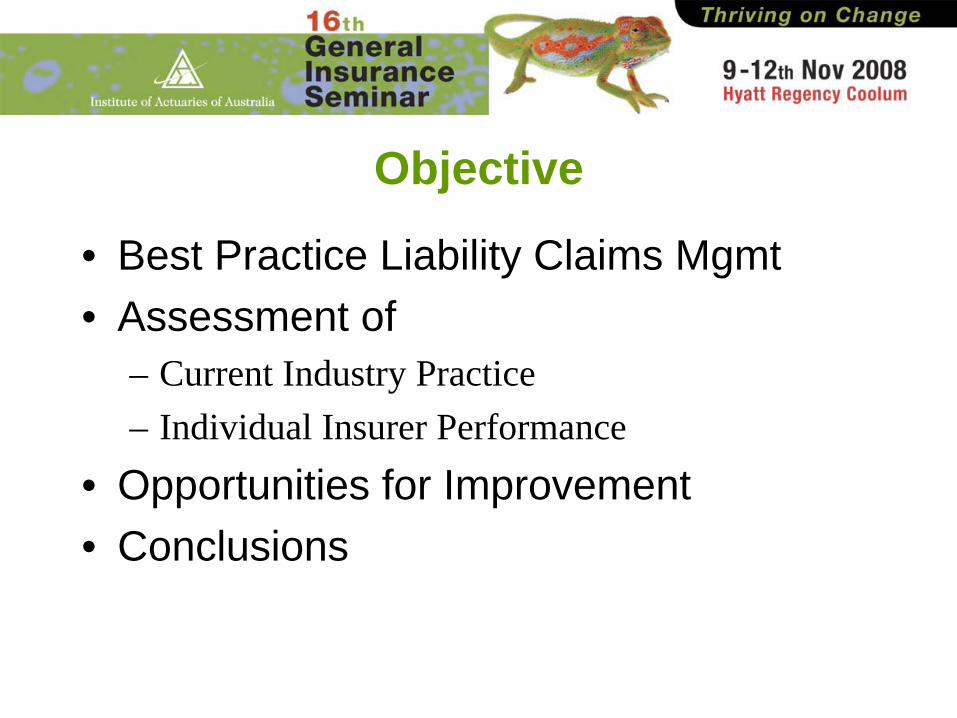
Objective
• Best Practice Liability Claims Mgmt• Assessment of
– Current Industry Practice– Individual Insurer Performance
• Opportunities for Improvement• Conclusions
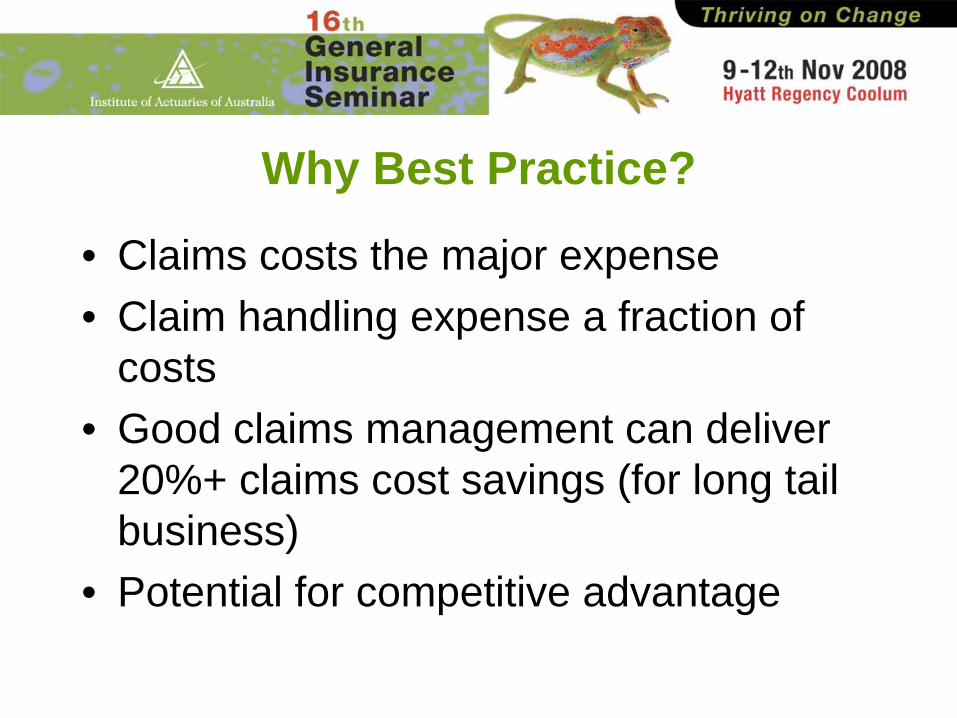
Why Best Practice?
• Claims costs the major expense• Claim handling expense a fraction of
costs• Good claims management can deliver
20%+ claims cost savings (for long tail business)
• Potential for competitive advantage
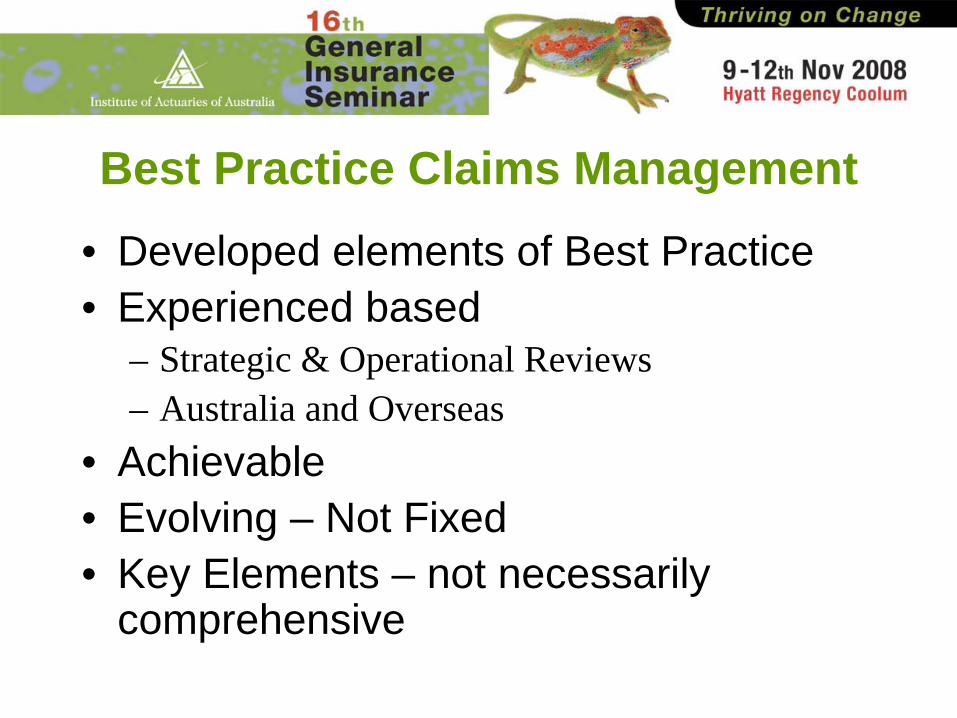
Best Practice Claims Management
• Developed elements of Best Practice• Experienced based
– Strategic & Operational Reviews– Australia and Overseas
• Achievable• Evolving – Not Fixed• Key Elements – not necessarily
comprehensive
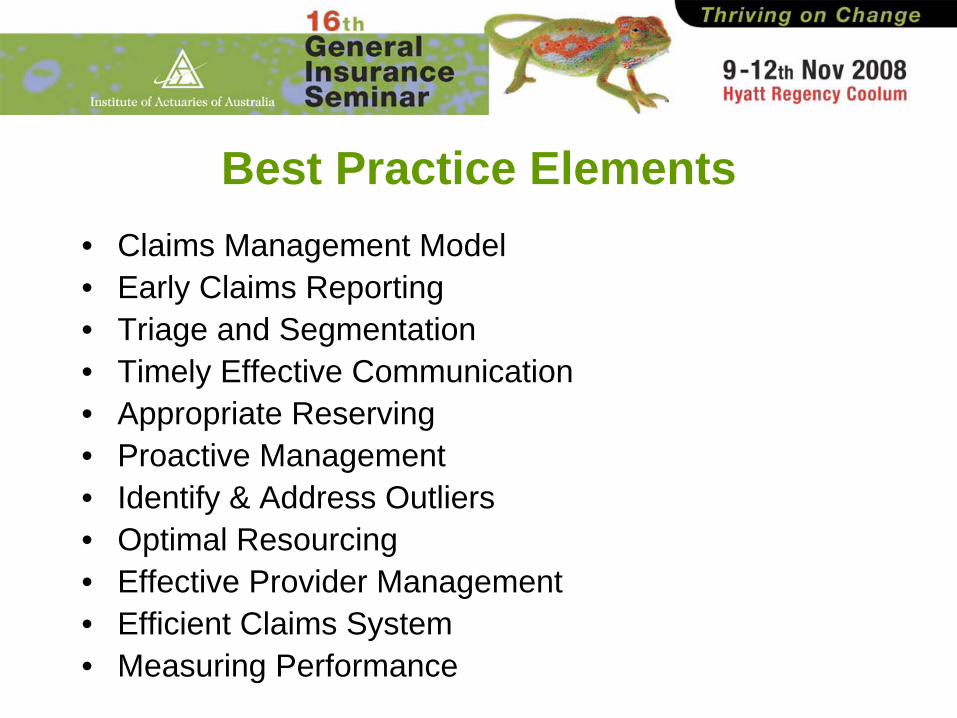
Best Practice Elements• Claims Management Model• Early Claims Reporting • Triage and Segmentation• Timely Effective Communication• Appropriate Reserving• Proactive Management• Identify & Address Outliers• Optimal Resourcing • Effective Provider Management• Efficient Claims System• Measuring Performance
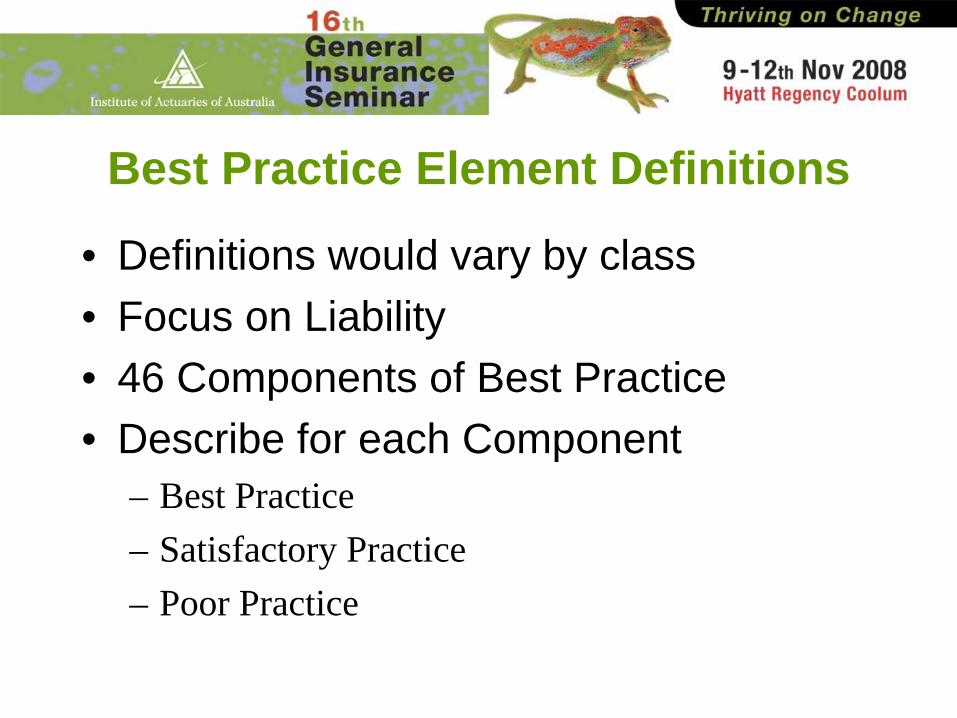
Best Practice Element Definitions
• Definitions would vary by class• Focus on Liability • 46 Components of Best Practice• Describe for each Component
– Best Practice– Satisfactory Practice– Poor Practice
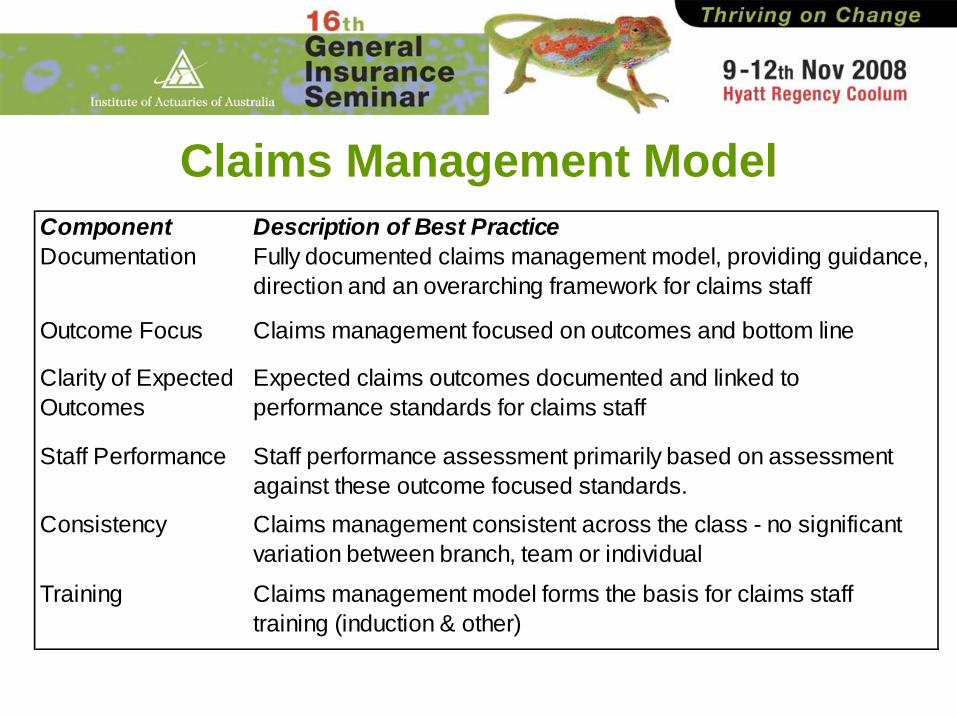
Claims Management ModelComponent Description of Best PracticeDocumentation
Outcome Focus
Fully documented claims management model, providing guidance, direction and an overarching framework for claims staff
Claims management focused on outcomes and bottom line
Expected claims outcomes documented and linked to performance standards for claims staff
Staff performance assessment primarily based on assessment against these outcome focused standards.
Clarity of Expected Outcomes
Staff Performance
Consistency
Training
Claims management consistent across the class - no significant variation between branch, team or individual
Claims management model forms the basis for claims staff training (induction & other)
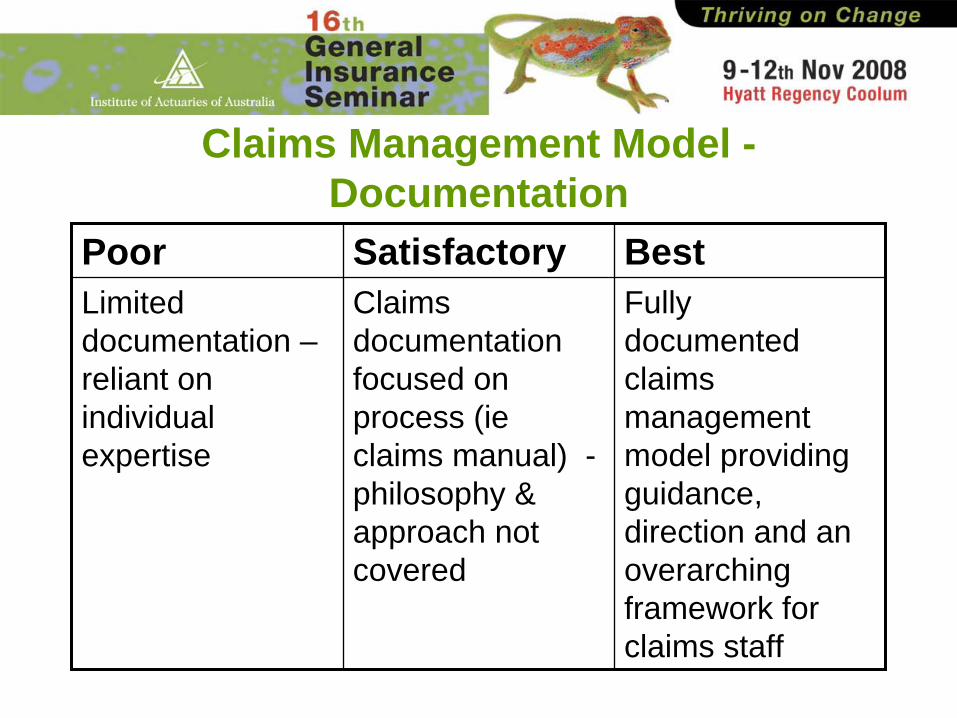
Claims Management Model - Documentation
Poor Satisfactory BestLimited documentation – reliant on individual expertise
Claims documentation focused on process (ie claims manual) - philosophy & approach not covered
Fully documented claims management model providing guidance, direction and an overarching framework for claims staff
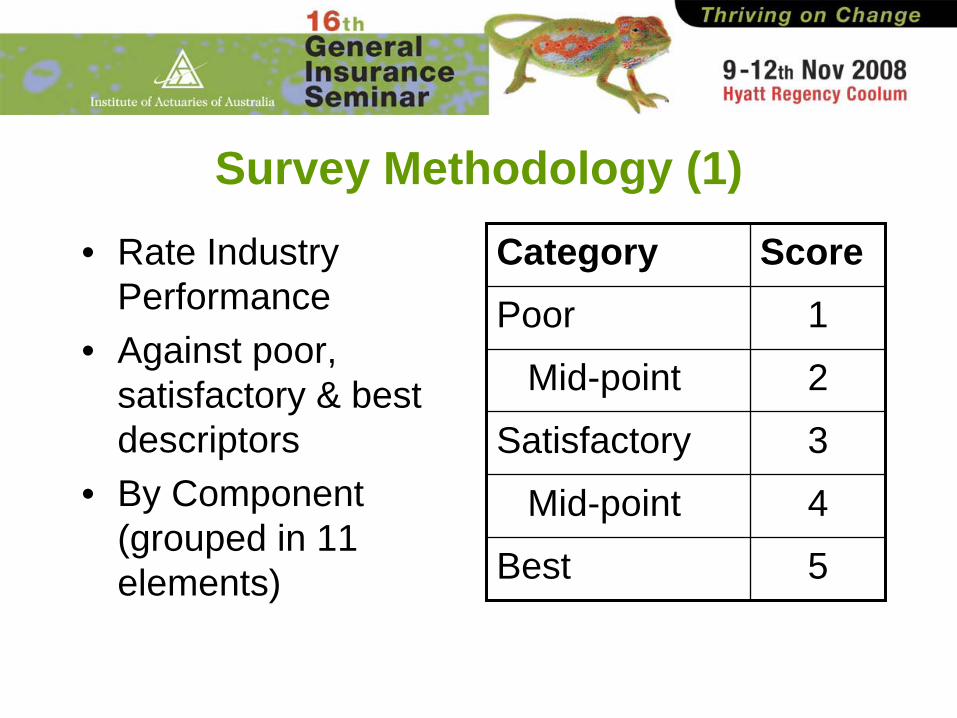
Survey Methodology (1)• Rate Industry
Performance• Against poor,
satisfactory & best descriptors
• By Component (grouped in 11 elements)
Category ScorePoor 1
Mid-point 2
Satisfactory 3
Mid-point 4
Best 5
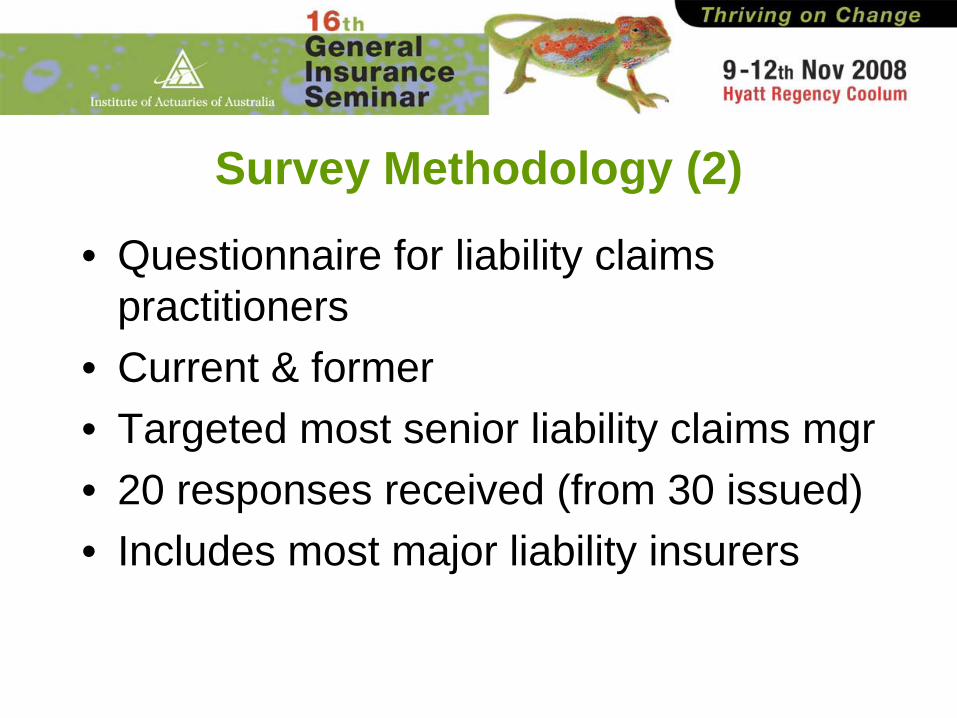
Survey Methodology (2)
• Questionnaire for liability claims practitioners
• Current & former• Targeted most senior liability claims mgr • 20 responses received (from 30 issued)• Includes most major liability insurers
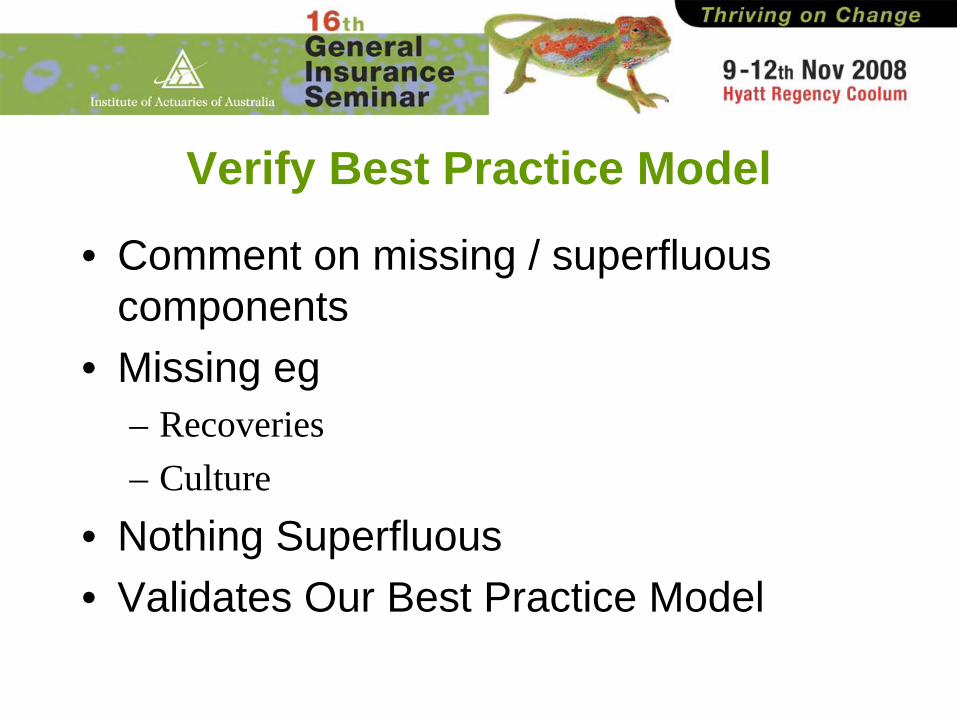
Verify Best Practice Model
• Comment on missing / superfluous components
• Missing eg– Recoveries– Culture
• Nothing Superfluous• Validates Our Best Practice Model
Interpretation of Results• Examined proportion rated
– Best Practice – Above Satisfactory (better than satisfactory but not
best)
• Benchmark of 60% = “Good”• Shortfall below “good” represents opportunity• Summary results for the 11 best practice
elements
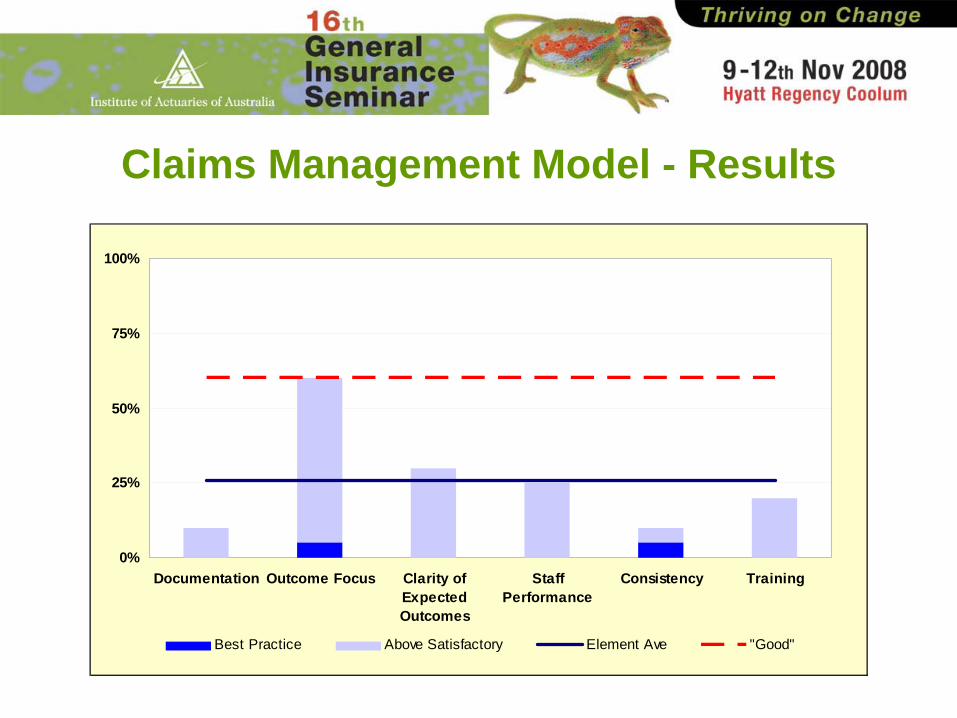
Claims Management Model - Results
0%
25%
50%
75%
100%
Documentation Outcome Focus Clarity ofExpectedOutcomes
StaffPerformance
Consistency Training
Best Practice Above Satisfactory Element Ave "Good"
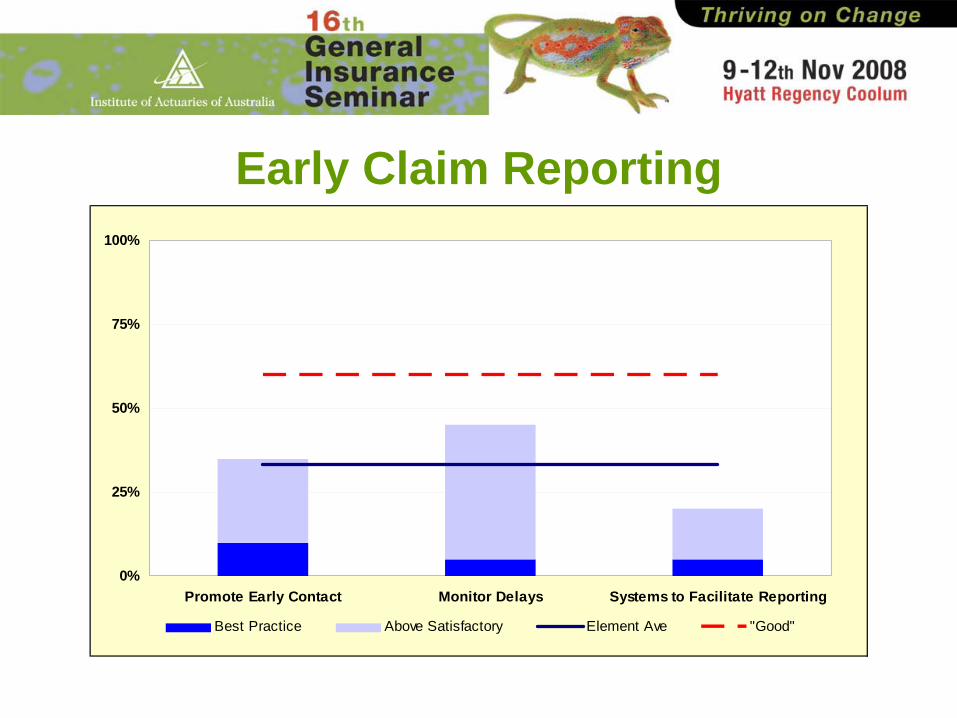
Early Claim Reporting
0%
25%
50%
75%
100%
Promote Early Contact Monitor Delays Systems to Facilitate Reporting
Best Practice Above Satisfactory Element Ave "Good"
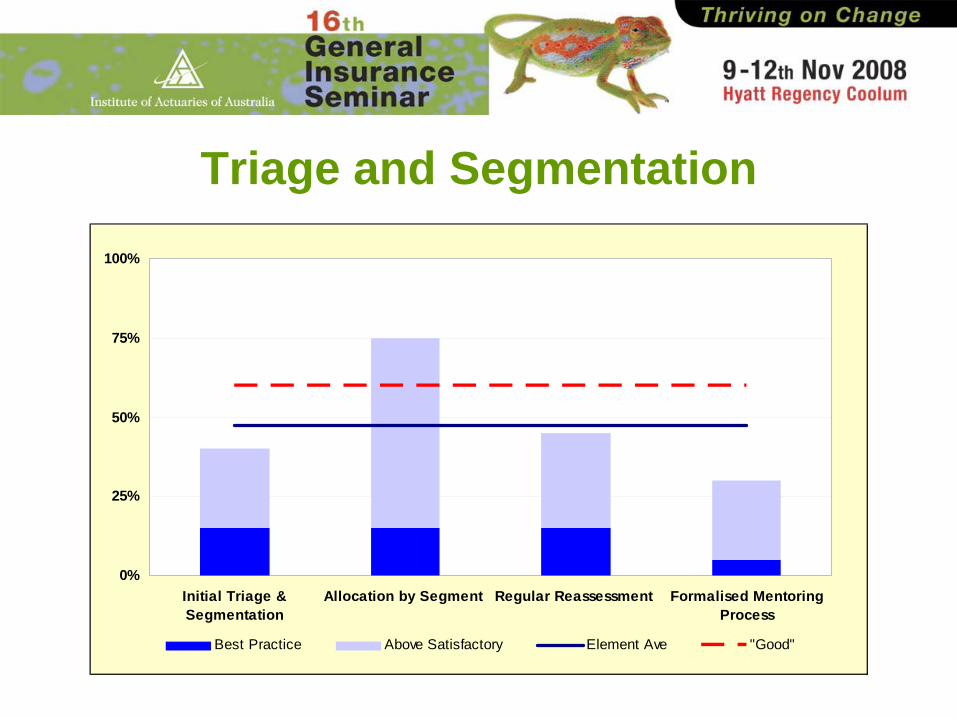
Triage and Segmentation
0%
25%
50%
75%
100%
Initial Triage &Segmentation
Allocation by Segment Regular Reassessment Formalised MentoringProcess
Best Practice Above Satisfactory Element Ave "Good"
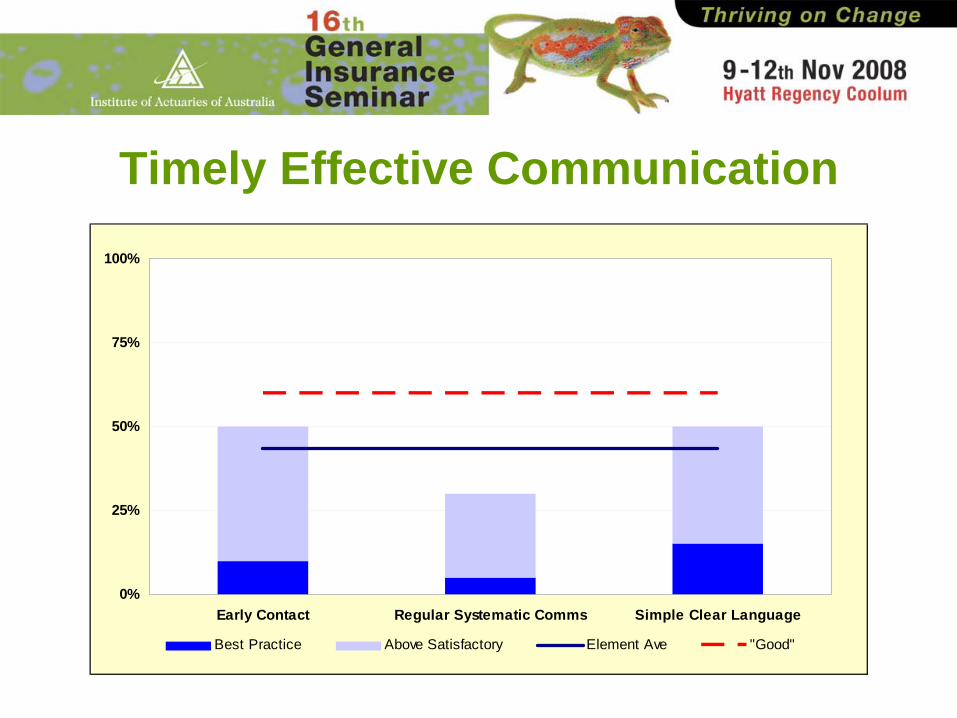
Timely Effective Communication
0%
25%
50%
75%
100%
Early Contact Regular Systematic Comms Simple Clear Language
Best Practice Above Satisfactory Element Ave "Good"
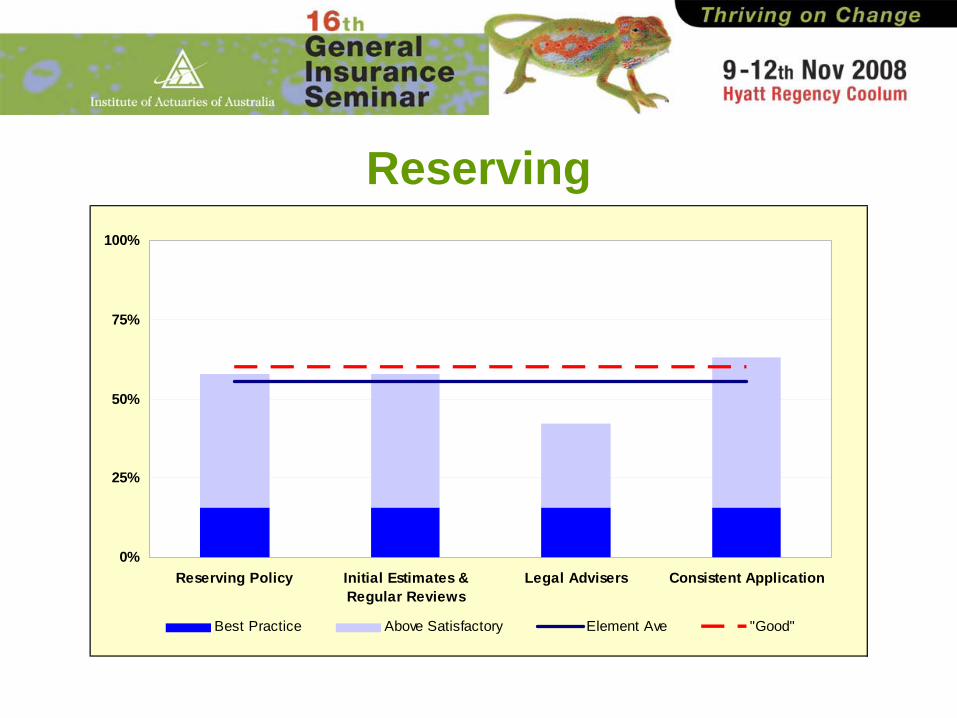
Reserving
0%
25%
50%
75%
100%
Reserving Policy Initial Estimates &Regular Reviews
Legal Advisers Consistent Application
Best Practice Above Satisfactory Element Ave "Good"
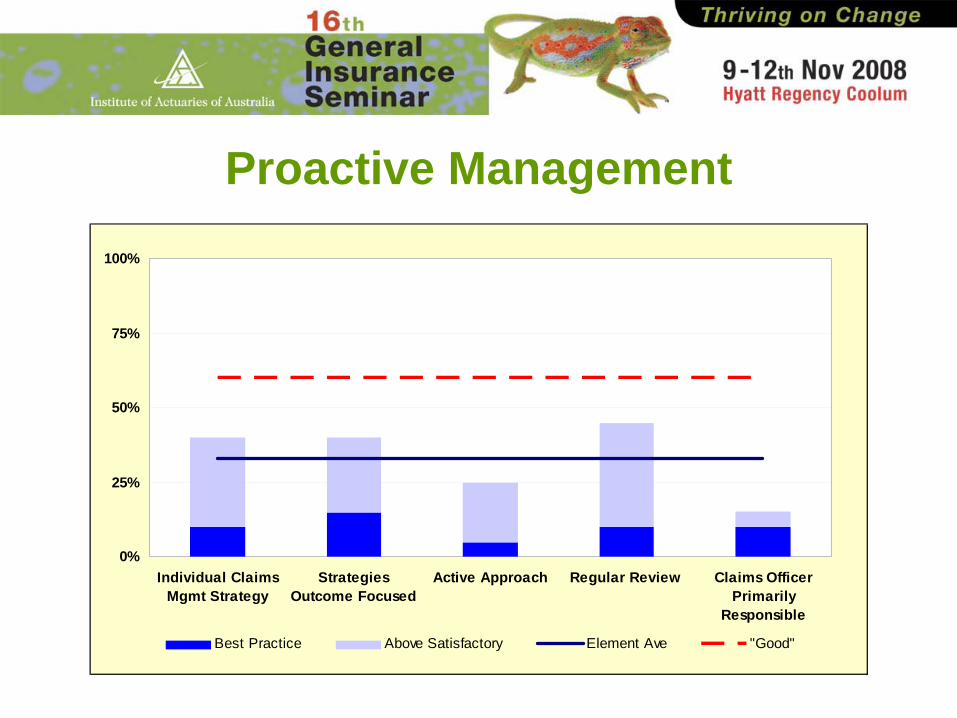
Proactive Management
0%
25%
50%
75%
100%
Individual ClaimsMgmt Strategy
StrategiesOutcome Focused
Active Approach Regular Review Claims OfficerPrimarily
Responsible
Best Practice Above Satisfactory Element Ave "Good"
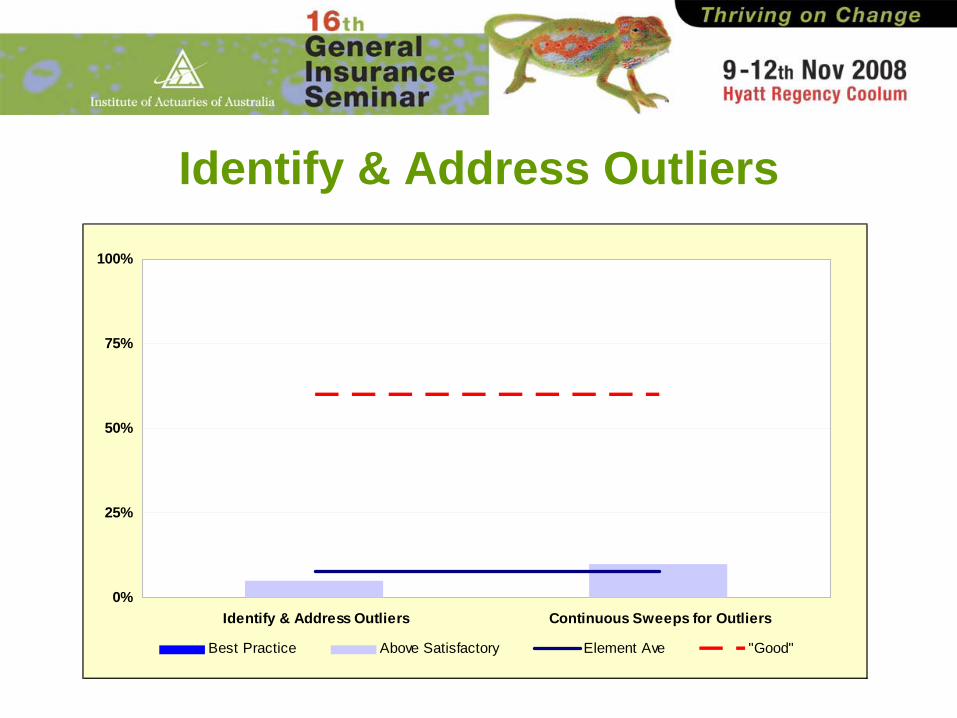
Identify & Address Outliers
0%
25%
50%
75%
100%
Identify & Address Outliers Continuous Sweeps for Outliers
Best Practice Above Satisfactory Element Ave "Good"
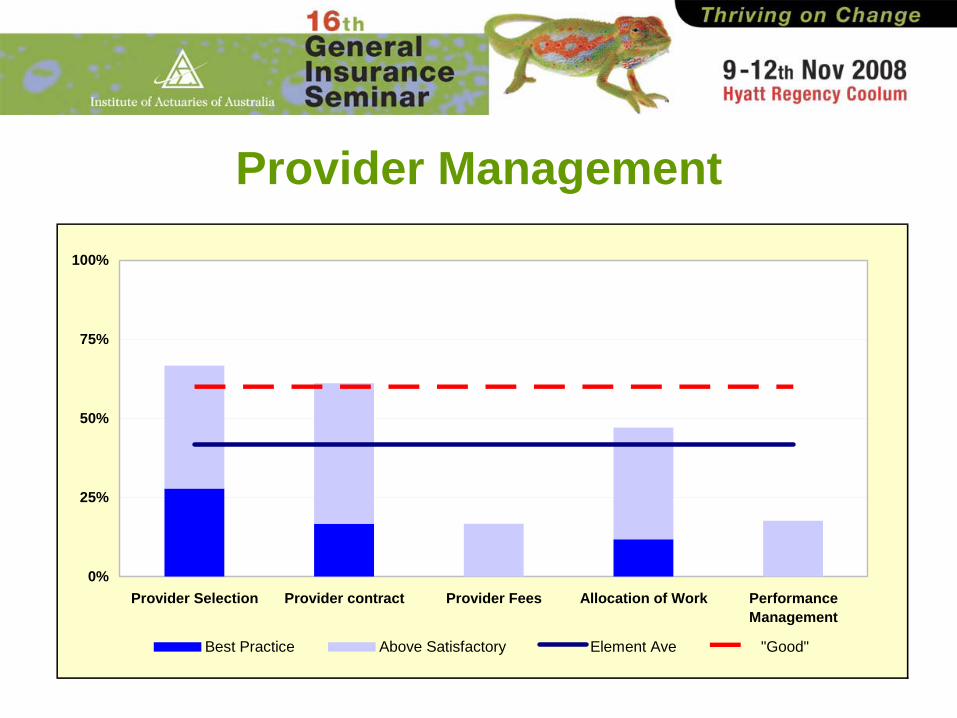
Provider Management
0%
25%
50%
75%
100%
Provider Selection Provider contract Provider Fees Allocation of Work PerformanceManagement
Best Practice Above Satisfactory Element Ave "Good"
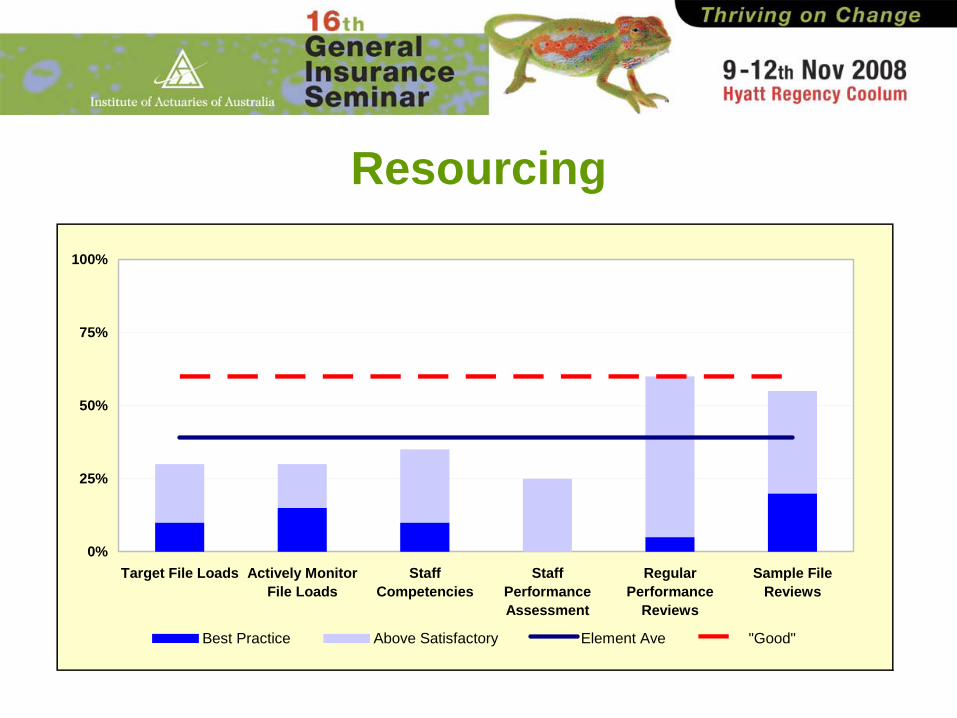
Resourcing
0%
25%
50%
75%
100%
Target File Loads Actively MonitorFile Loads
StaffCompetencies
StaffPerformanceAssessment
RegularPerformance
Reviews
Sample FileReviews
Best Practice Above Satisfactory Element Ave "Good"
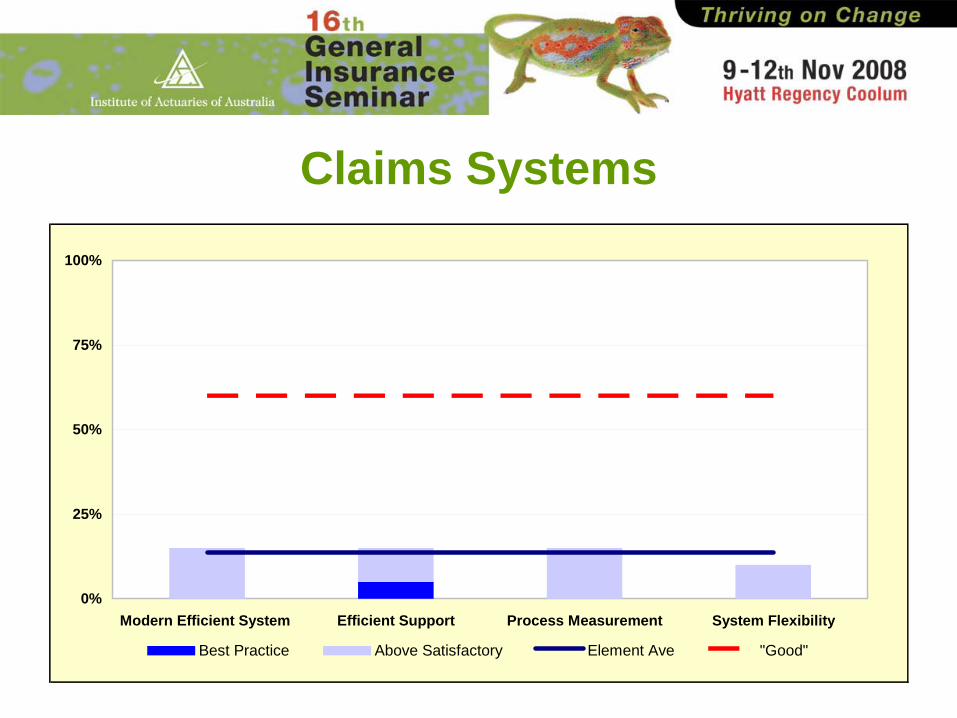
Claims Systems
0%
25%
50%
75%
100%
Modern Efficient System Efficient Support Process Measurement System Flexibility
Best Practice Above Satisfactory Element Ave "Good"
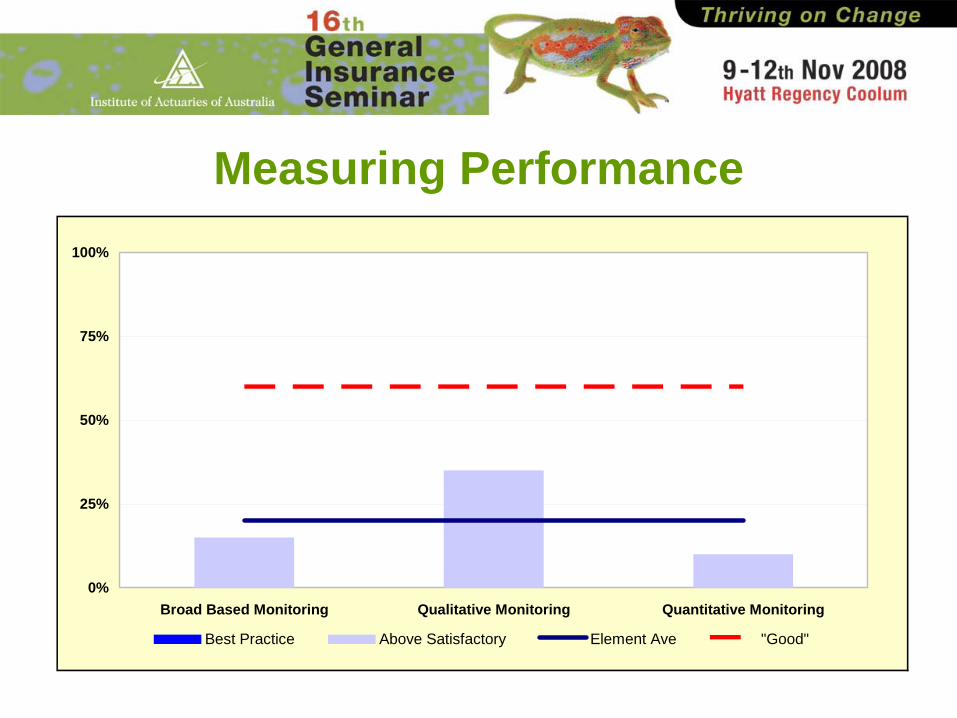
Measuring Performance
0%
25%
50%
75%
100%
Broad Based Monitoring Qualitative Monitoring Quantitative Monitoring
Best Practice Above Satisfactory Element Ave "Good"
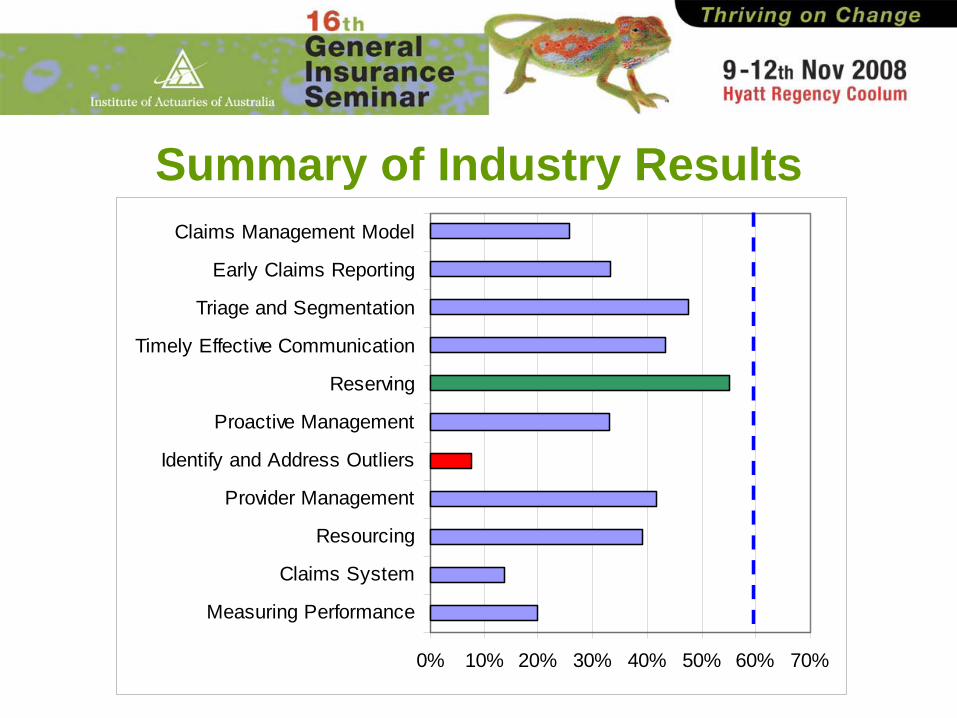
Summary of Industry Results
0% 10% 20% 30% 40% 50% 60% 70%
Claims Management Model
Early Claims Reporting
Triage and Segmentation
Timely Effective Communication
Reserving
Proactive Management
Identify and Address Outliers
Provider Management
Resourcing
Claims System
Measuring Performance
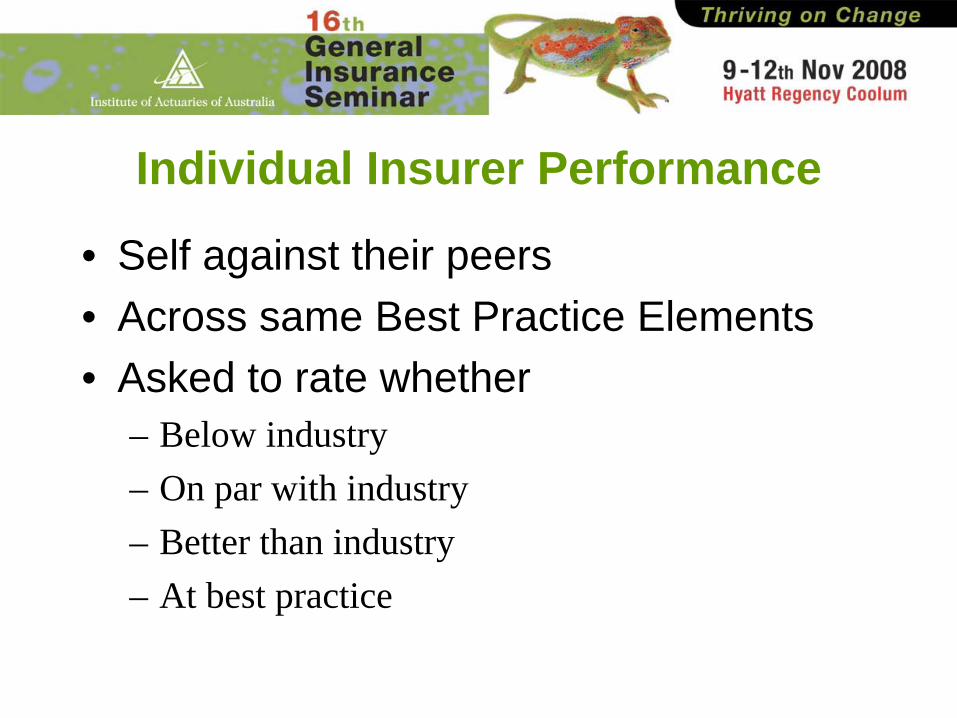
Individual Insurer Performance
• Self against their peers• Across same Best Practice Elements• Asked to rate whether
– Below industry– On par with industry– Better than industry– At best practice
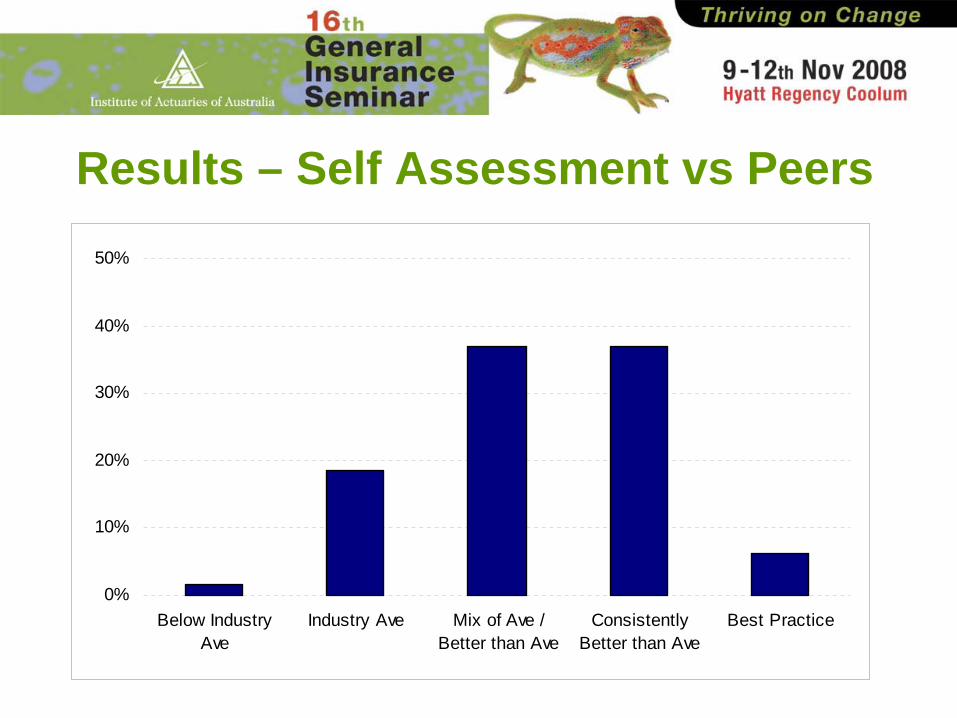
Results – Self Assessment vs Peers
0%
10%
20%
30%
40%
50%
Below IndustryAve
Industry Ave Mix of Ave /Better than Ave
ConsistentlyBetter than Ave
Best Practice
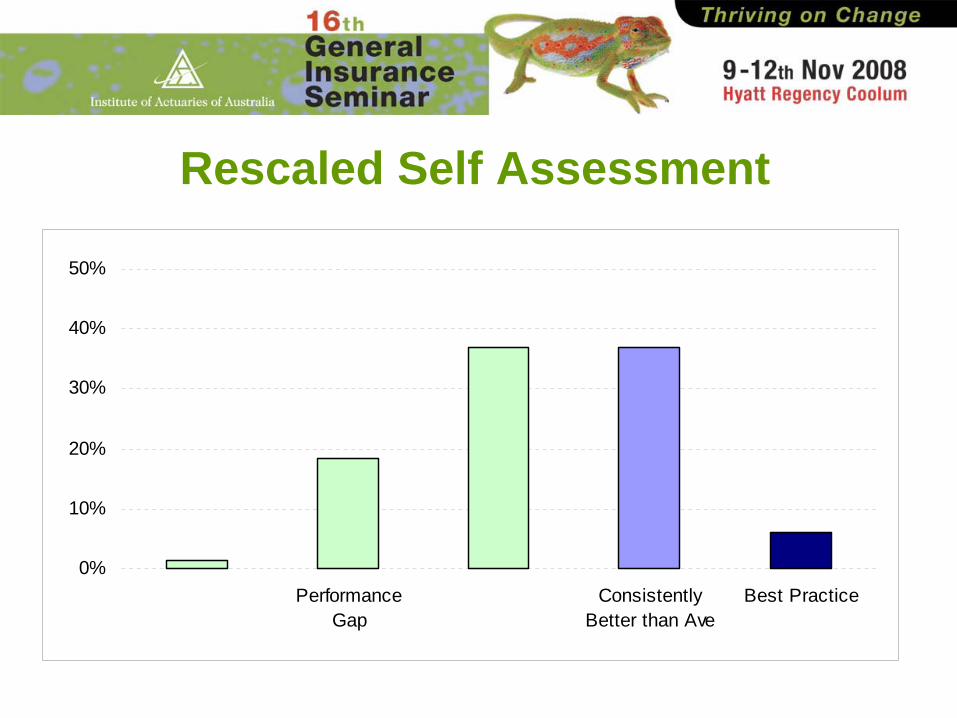
Rescaled Self Assessment
0%
10%
20%
30%
40%
50%
PerformanceGap
ConsistentlyBetter than Ave
Best Practice
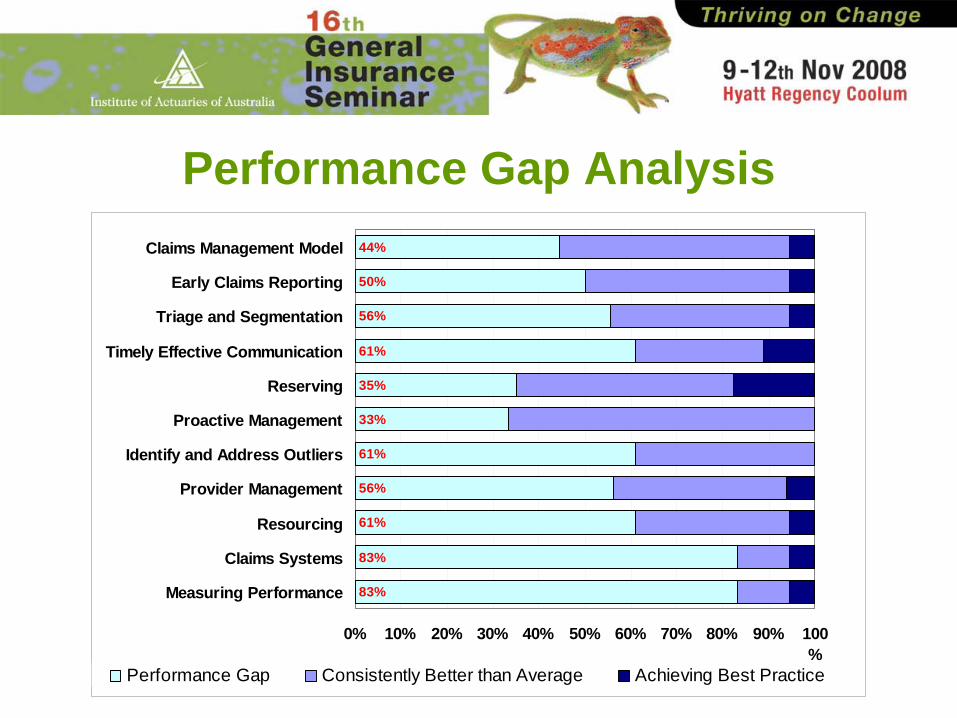
Performance Gap Analysis44%
50%
56%
61%
35%
33%
61%
56%
61%
83%
83%
0% 10% 20% 30% 40% 50% 60% 70% 80% 90% 100%
Claims Management Model
Early Claims Reporting
Triage and Segmentation
Timely Effective Communication
Reserving
Proactive Management
Identify and Address Outliers
Provider Management
Resourcing
Claims Systems
Measuring Performance
Performance Gap Consistently Better than Average Achieving Best Practice
Most Important Elements
• Proactive Management• Resourcing • Reserving
• Some correlation with performance• How to prioritise improvement efforts
Conclusions
• Poor understanding of current performance
• Claims managers not well placed to assess
• Significant scope for improvement• Better understanding insurer position
required• Further benchmarking required
Thank You
Questions?