Embed Size (px)
Citation preview
Benchmarking: It's Much More Than Just a Bunch of Numbers!Teena Shouse, CFM, IFMA Fellow, VP, Facility Engineering Associates
Vision StatementThe FMCC is the resource and voice for Facility Management Consultants worldwide to leverage
our collective expertise to benefit IFMA members, and the Facility Management profession.
Mission StatementTo serve as a global Facility Management
consultants' resource and representative for Knowledge Sharing, Networking and Business
Opportunities in support of our impact upon the built environment and value to their clients..
Today’s PresentationModerator: Josh Amos, IFMA Components Liaison
Presentation Title: Benchmarking: It's Much More Than Just a Bunch of Numbers!
Presenter: Teena Shouse, CFM, IFMA Fellow, VP, Facility Engineering Associates
Presentation Logistics• Polls will be used throughout the webinar
• Q&A at the end of the presentation
• Quick survey at the conclusion of the Webinar
• PowerPoint & Recorded Webinar will be available online via FMCC’s Website (fmcc.ifma.org)
• Your Participation is Greatly Appreciated!
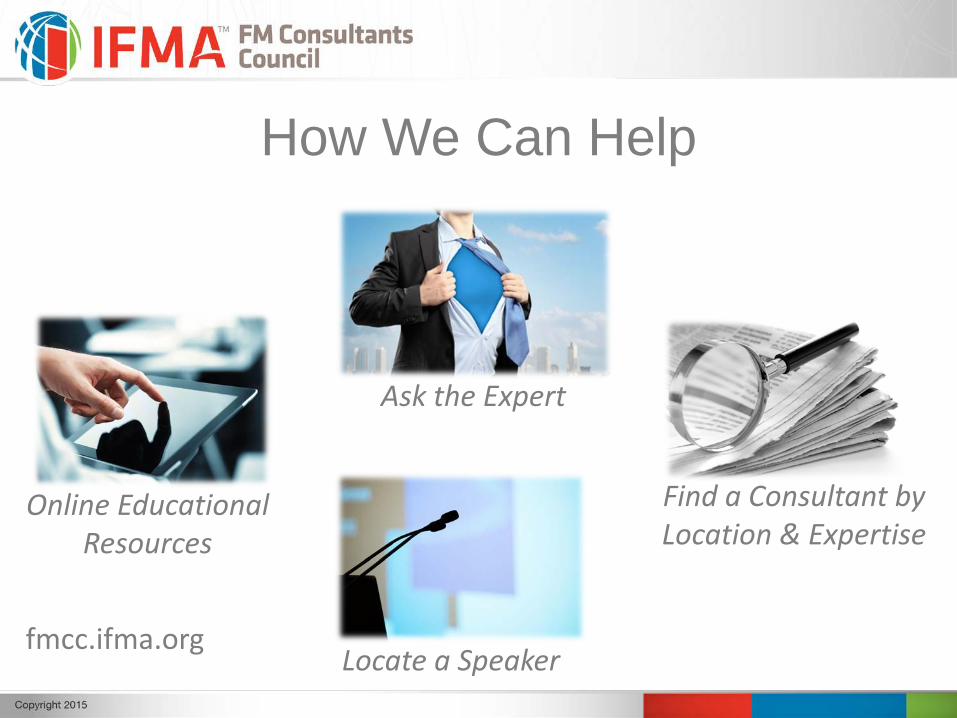
How We Can Help
Ask the Expert
Find a Consultant by Location & Expertise
Locate a Speaker
Online Educational Resources
fmcc.ifma.org
Presentation Logistics• Q&A at the end of the presentation
• Quick survey at the conclusion of the Webinar
• PowerPoint & Recorded Webinar will be available online via FMCC’s Website (fmcc.ifma.org)
• Your Participation is Greatly Appreciated!
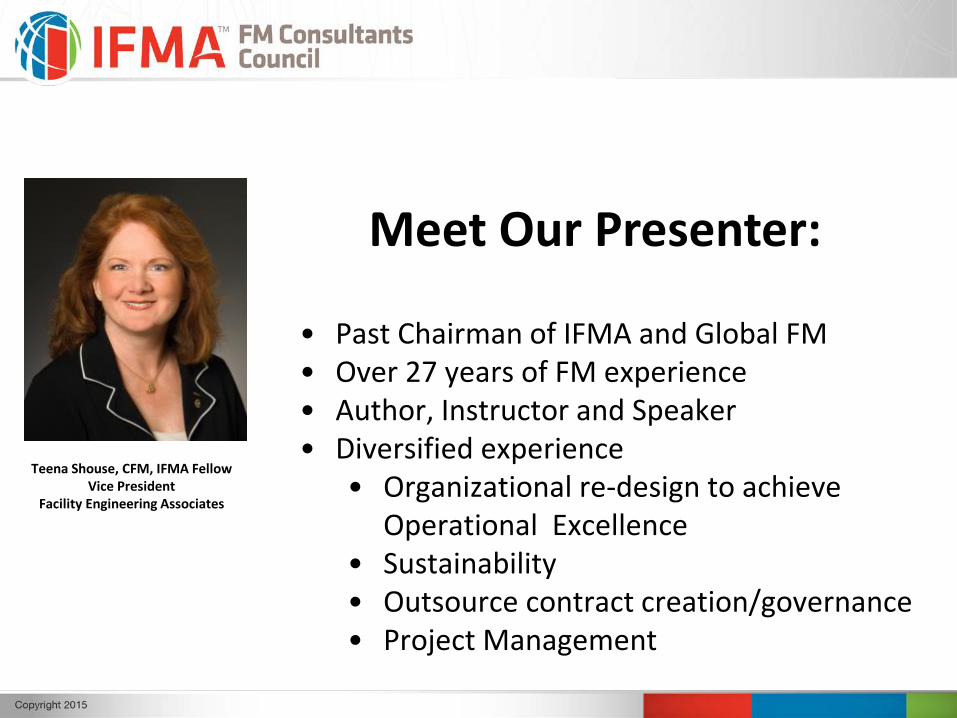
Meet Our Presenter:
Teena Shouse, CFM, IFMA FellowVice President
Facility Engineering Associates
• Past Chairman of IFMA and Global FM• Over 27 years of FM experience• Author, Instructor and Speaker• Diversified experience
• Organizational re-design to achieve Operational Excellence
• Sustainability• Outsource contract creation/governance• Project Management
Review Session Learning Objectives
• Better understand how to use data in decision making
• What questions to ask to choose services/products• How to better communicate accomplishments and
future opportunities using benchmark data• Select the right KPIs which make sense for your
organization
How to tell your story
1. Gather Data2. Interpret Data3. Utilize Data

Definitions
• Big Data– Extensive amounts of complex data about your organization pulled
from many sources• Key Performance Indicators
– Critical metrics that can be measured against to determine success of core processes in an organization
• Balanced Score Card– Aligns and monitors performance in comparison to core business
values• Benchmarking
– Comparison of metrics against “targets”
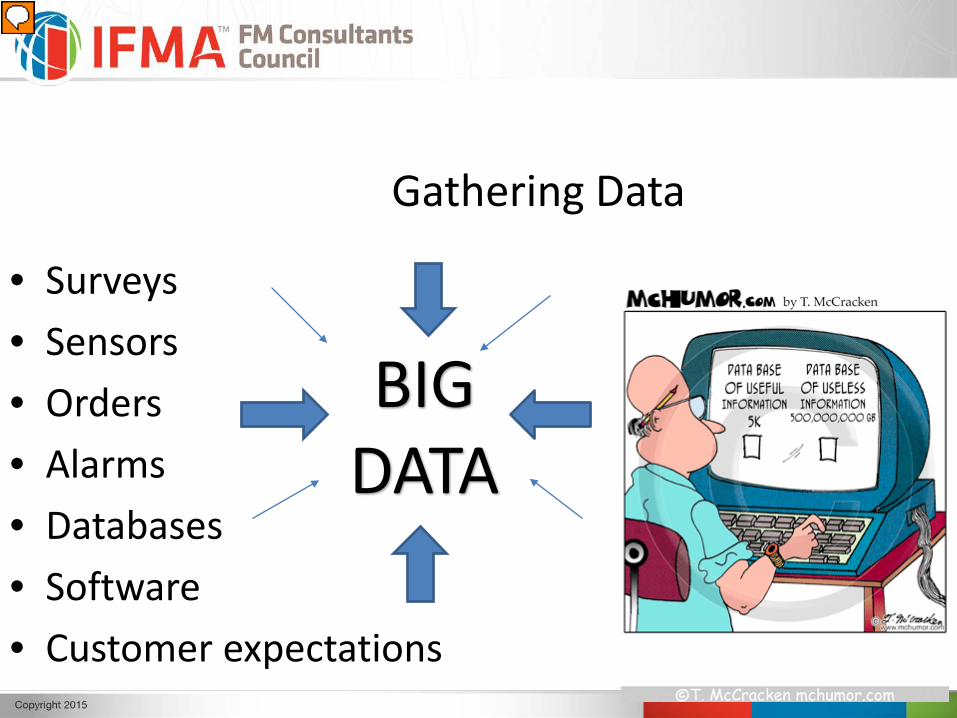
Gathering Data
• Surveys• Sensors• Orders• Alarms• Databases• Software• Customer expectations
BIG DATA
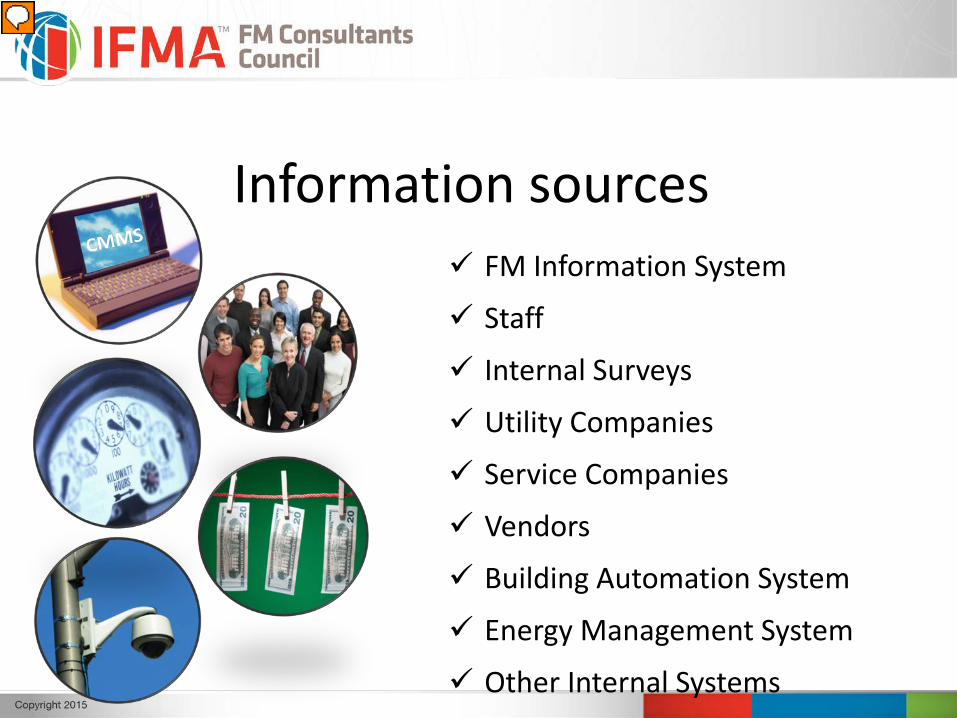
Information sources FM Information System
Staff
Internal Surveys
Utility Companies
Service Companies
Vendors
Building Automation System
Energy Management System
Other Internal Systems
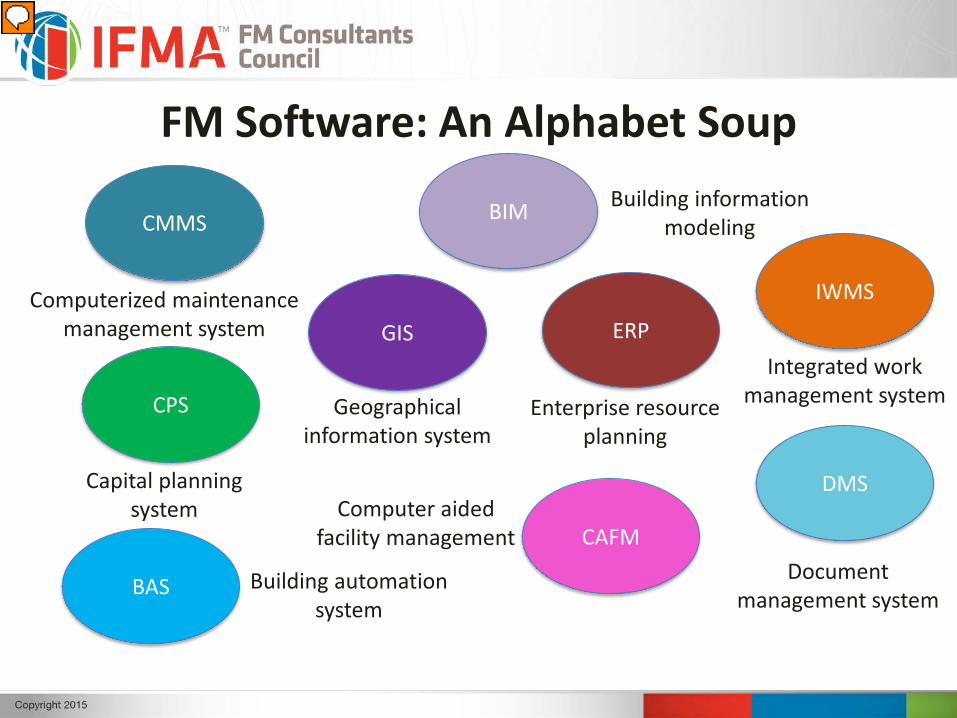
FM Software: An Alphabet Soup
CMMS
CAFM
BAS
BIM
IWMS
ERPGIS
DMS
CPS Geographical information system
Capital planning system
Enterprise resource planning
Integrated work management system
Document management system
Computerized maintenance management system
Building automation system
Computer aided facility management
Building information modeling
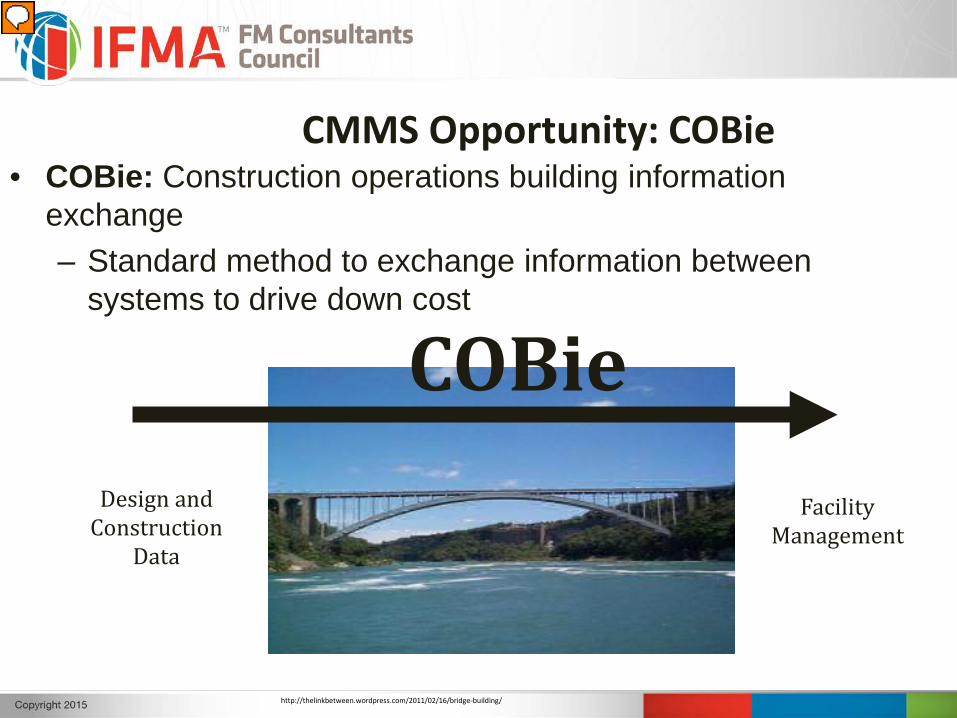
• COBie: Construction operations building information exchange – Standard method to exchange information between
systems to drive down cost
CMMS Opportunity: COBie
Design and Construction
Data
Facility Management
COBie
http://thelinkbetween.wordpress.com/2011/02/16/bridge-building/
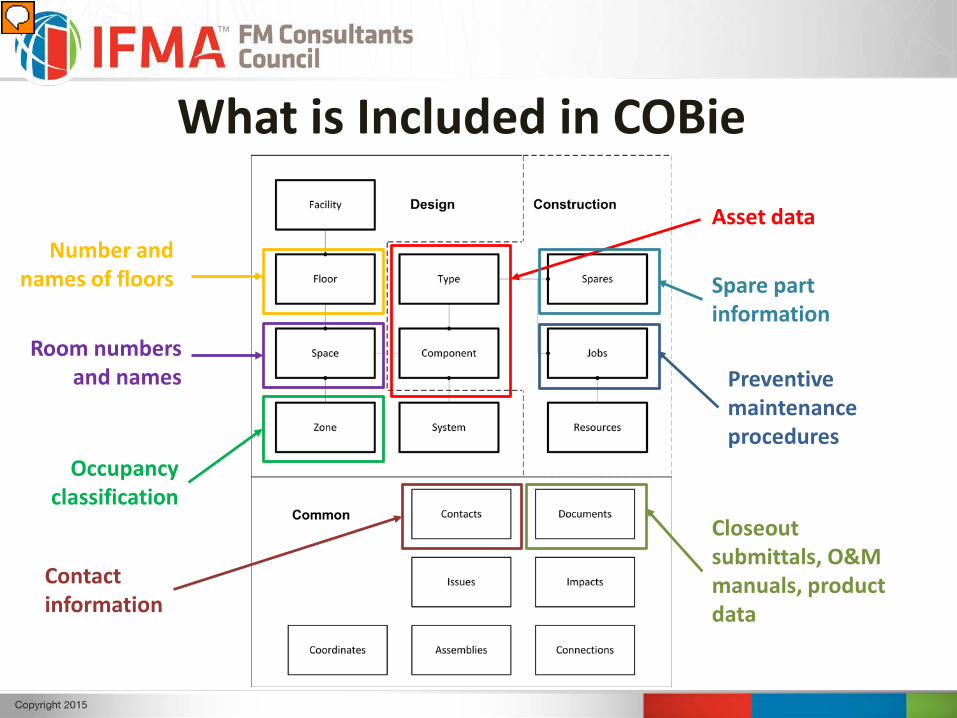
What is Included in COBie
Closeout submittals, O&M manuals, product data
Asset data
Preventive maintenance procedures
Spare part information
Number and names of floors
Room numbers and names
Occupancy classification
Contact information
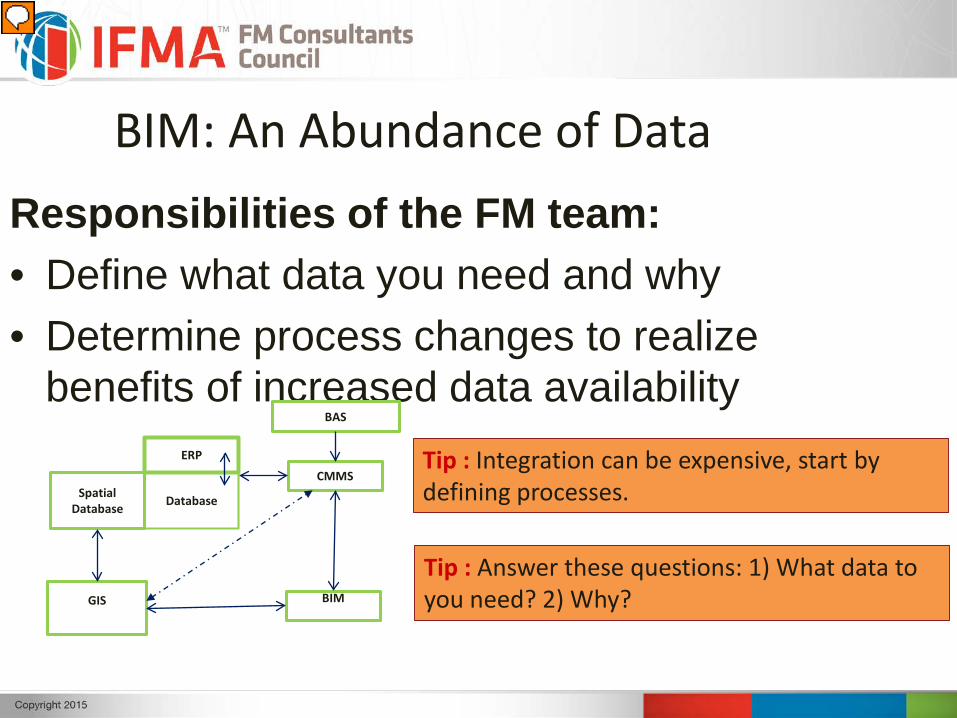
BIM: An Abundance of DataResponsibilities of the FM team:• Define what data you need and why• Determine process changes to realize
benefits of increased data availability
Tip : Answer these questions: 1) What data to you need? 2) Why?
Tip : Integration can be expensive, start by defining processes.
CMMS
ERP
Database
BIMGIS
BAS
Spatial Database
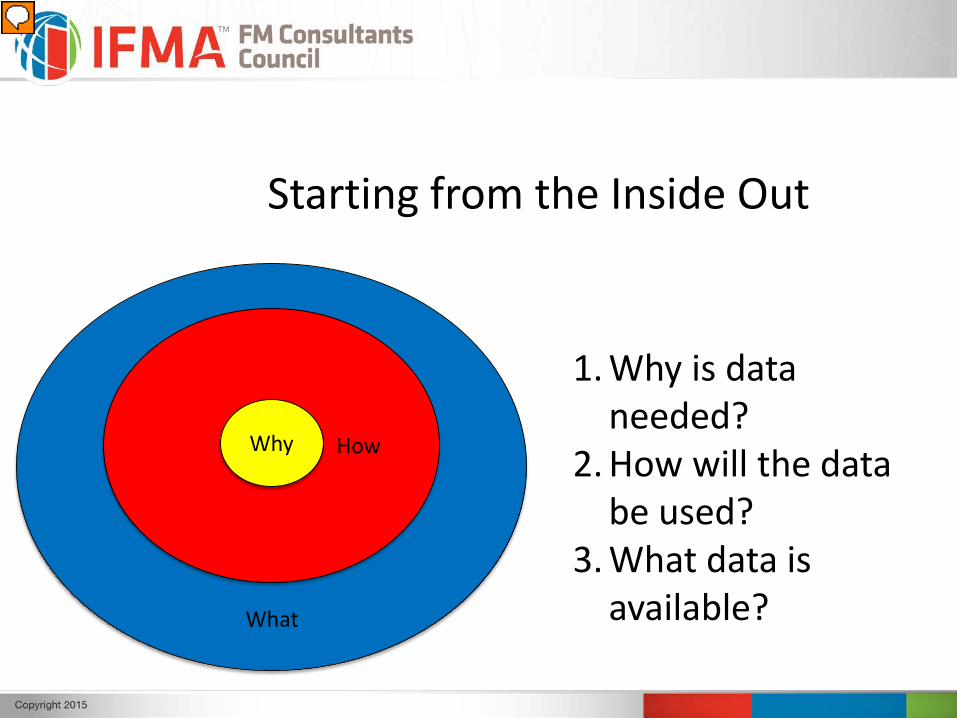
How
Starting from the Inside Out
Why
What
1. Why is data needed?
2. How will the data be used?
3. What data is available?
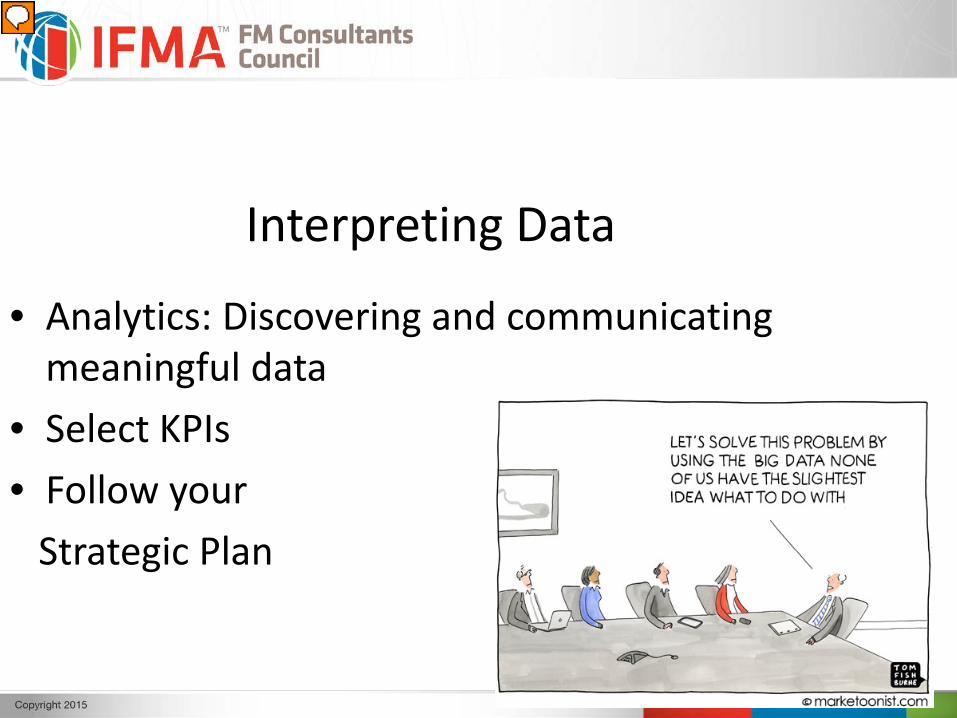
• Analytics: Discovering and communicating meaningful data
• Select KPIs• Follow your
Strategic Plan
Interpreting Data

1. Determine how money/resources are spent (financial)
2. Demonstrate alignment/meeting strategic goals (organizational)
3. Improve the operation of buildings or organization (operational)
Say “yes” to data gathering if it will help…Summary
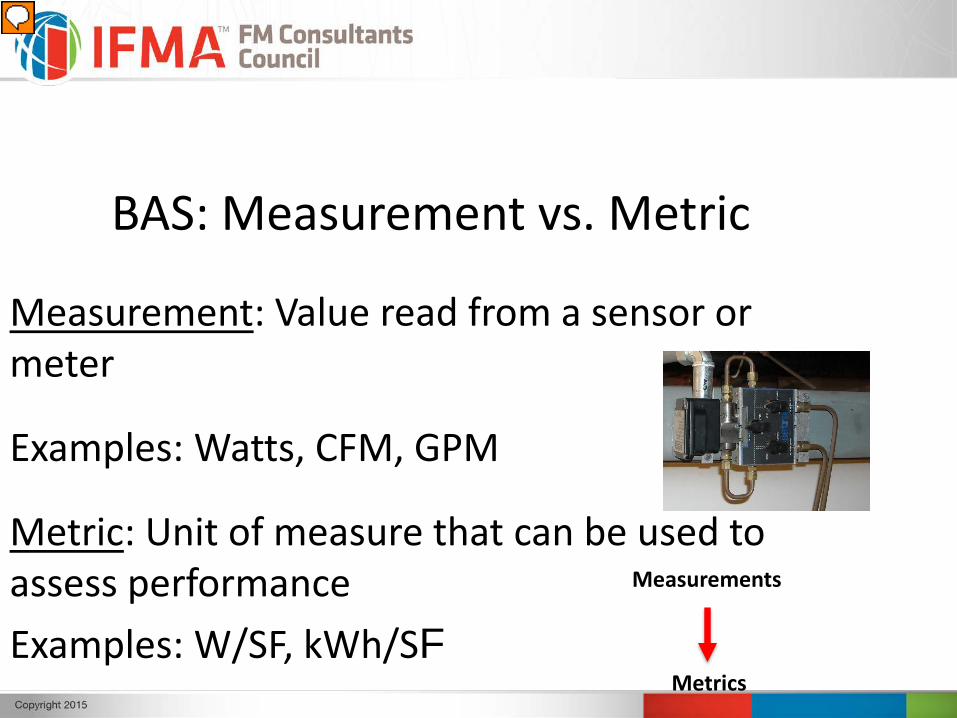
BAS: Measurement vs. Metric
Measurement: Value read from a sensor or meter
Examples: Watts, CFM, GPM
Metric: Unit of measure that can be used to assess performance Examples: W/SF, kWh/SF
Measurements
Metrics
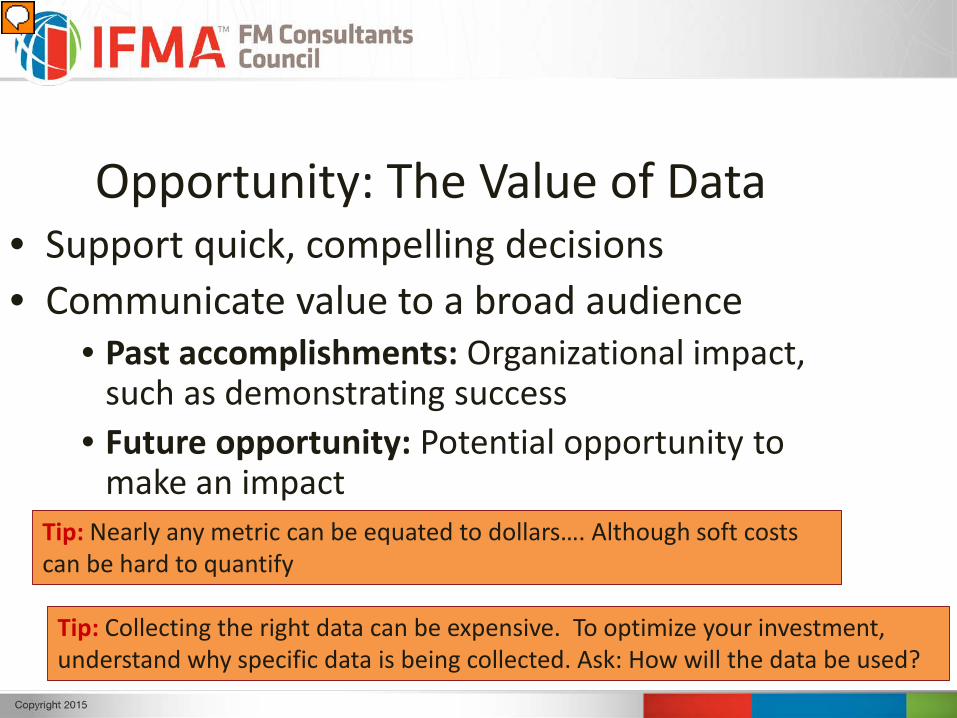
Opportunity: The Value of Data • Support quick, compelling decisions• Communicate value to a broad audience
• Past accomplishments: Organizational impact, such as demonstrating success
• Future opportunity: Potential opportunity to make an impact
Tip: Nearly any metric can be equated to dollars…. Although soft costs can be hard to quantify
Tip: Collecting the right data can be expensive. To optimize your investment, understand why specific data is being collected. Ask: How will the data be used?
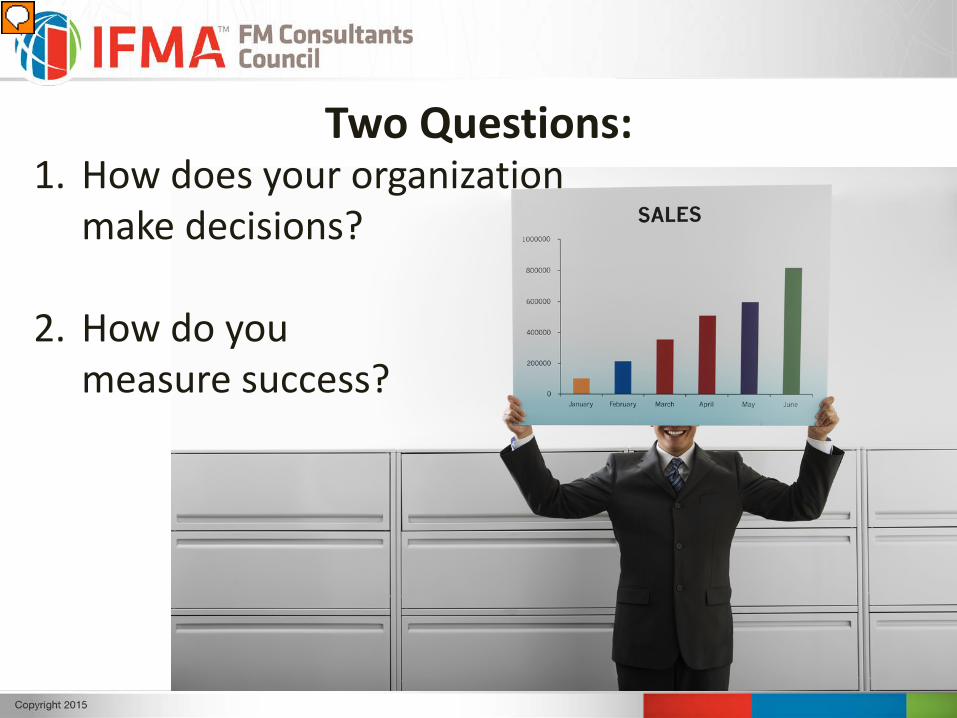
Two Questions:1. How does your organization
make decisions?
2. How do you measure success?
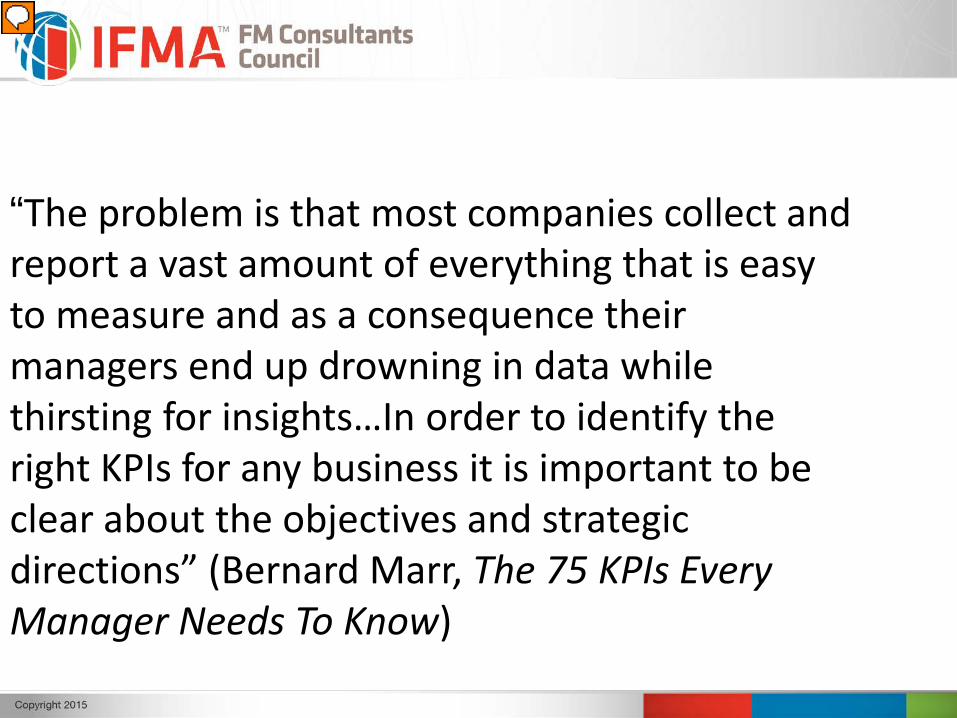
“The problem is that most companies collect and report a vast amount of everything that is easy to measure and as a consequence their managers end up drowning in data while thirsting for insights…In order to identify the right KPIs for any business it is important to be clear about the objectives and strategic directions” (Bernard Marr, The 75 KPIs Every Manager Needs To Know)
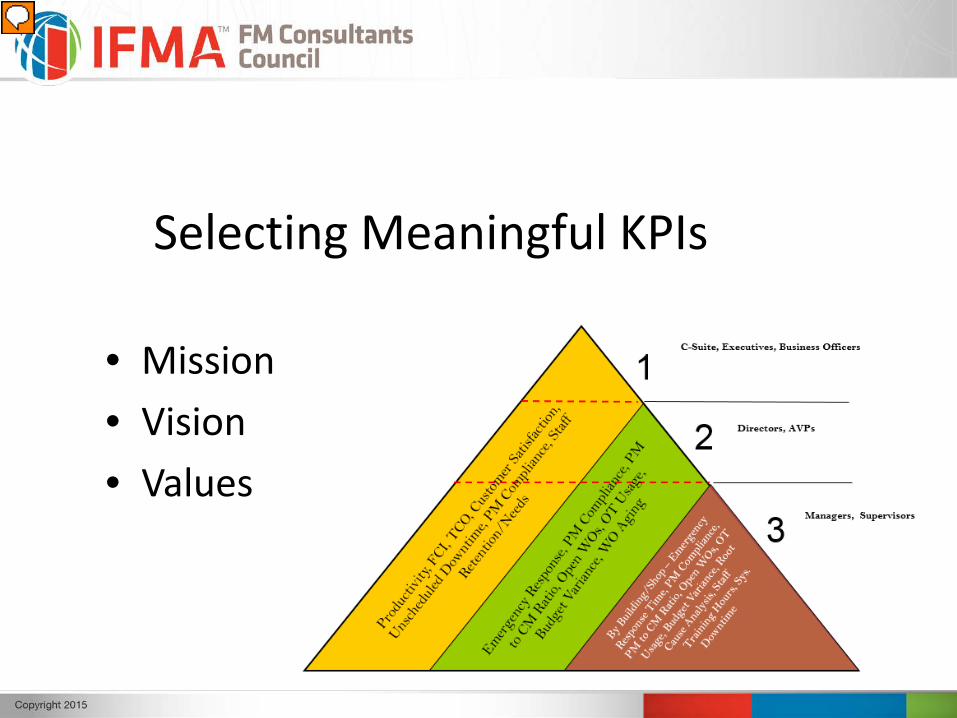
Selecting Meaningful KPIs
• Mission• Vision• Values
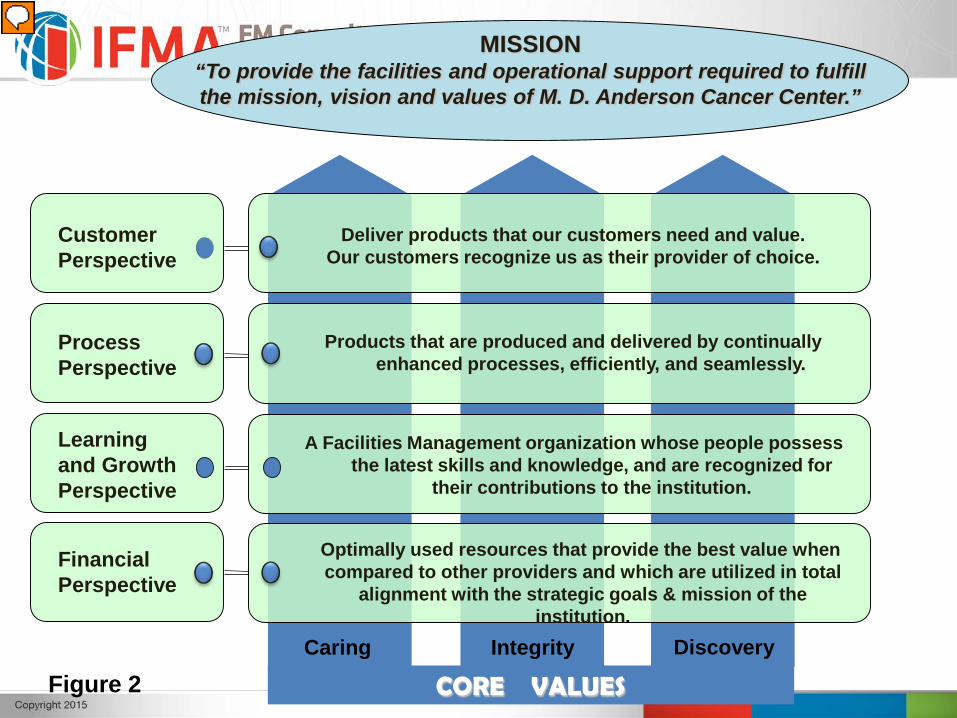
MISSION“To provide the facilities and operational support required to fulfill the mission, vision and values of M. D. Anderson Cancer Center.”
CORE VALUES
Customer Perspective
Process Perspective
Learning and Growth Perspective
Financial Perspective
Deliver products that our customers need and value.Our customers recognize us as their provider of choice.
Caring Integrity Discovery
Products that are produced and delivered by continually enhanced processes, efficiently, and seamlessly.
A Facilities Management organization whose people possess the latest skills and knowledge, and are recognized for
their contributions to the institution.
Optimally used resources that provide the best value when compared to other providers and which are utilized in total
alignment with the strategic goals & mission of the institution.
Figure 2
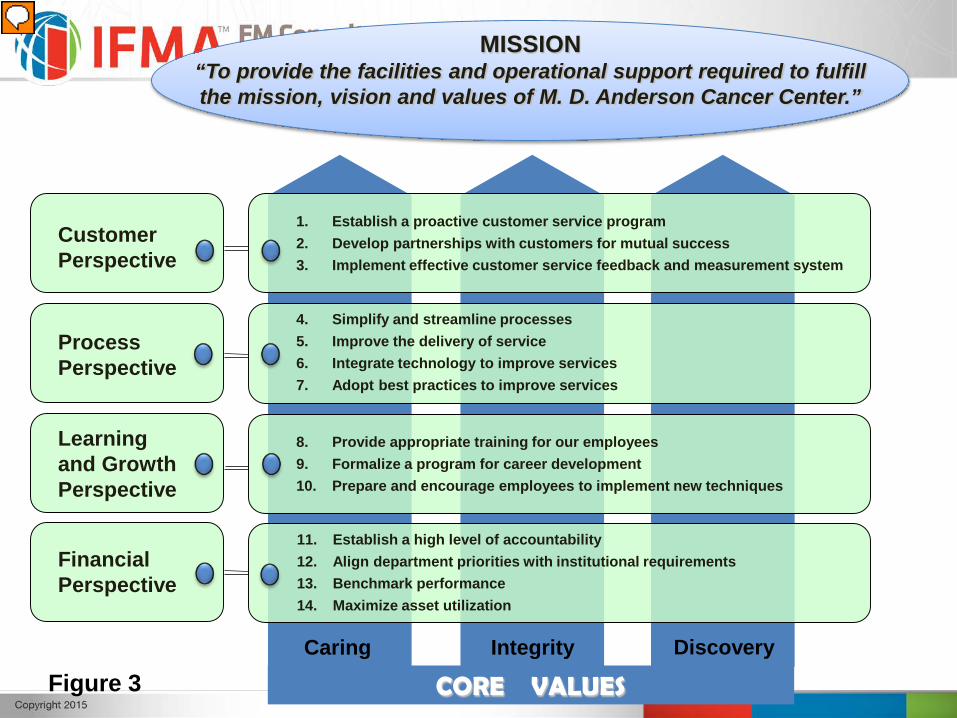
MISSION“To provide the facilities and operational support required to fulfill the mission, vision and values of M. D. Anderson Cancer Center.”
CORE VALUES
Customer Perspective
Process Perspective
Learning and Growth Perspective
Financial Perspective
1. Establish a proactive customer service program2. Develop partnerships with customers for mutual success3. Implement effective customer service feedback and measurement system
4. Simplify and streamline processes5. Improve the delivery of service6. Integrate technology to improve services7. Adopt best practices to improve services
8. Provide appropriate training for our employees9. Formalize a program for career development10. Prepare and encourage employees to implement new techniques
Caring Integrity Discovery
11. Establish a high level of accountability12. Align department priorities with institutional requirements13. Benchmark performance14. Maximize asset utilization
Figure 3
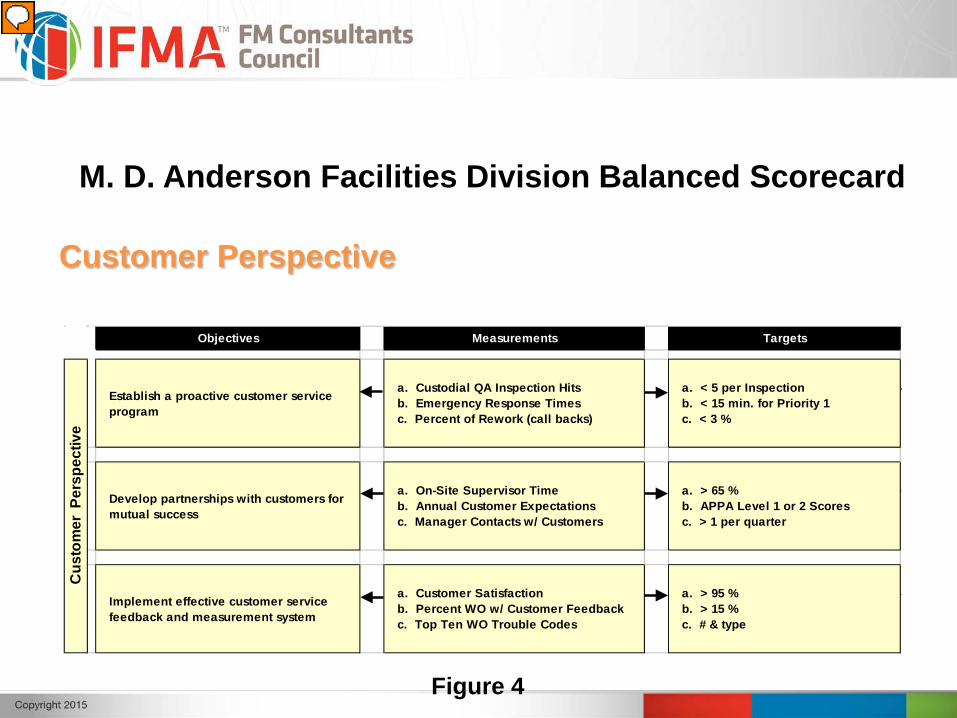
Objectives Measurements Targets
Establish a proactive customer service program
a. Custodial QA Inspection Hits b. Emergency Response Times c. Percent of Rework (call backs)
a. < 5 per Inspection b. < 15 min. for Priority 1 c. < 3 %
Develop partnerships with customers for mutual success
a. On-Site Supervisor Time b. Annual Customer Expectations c. Manager Contacts w/ Customers
a. > 65 % b. APPA Level 1 or 2 Scores c. > 1 per quarter
Implement effective customer service feedback and measurement system
a. Customer Satisfaction b. Percent WO w/ Customer Feedback c. Top Ten WO Trouble Codes
a. > 95 % b. > 15 % c. # & type
Cus
tom
er P
ersp
ectiv
e
M. D. Anderson Facilities Division Balanced Scorecard
Customer Perspective
Figure 4
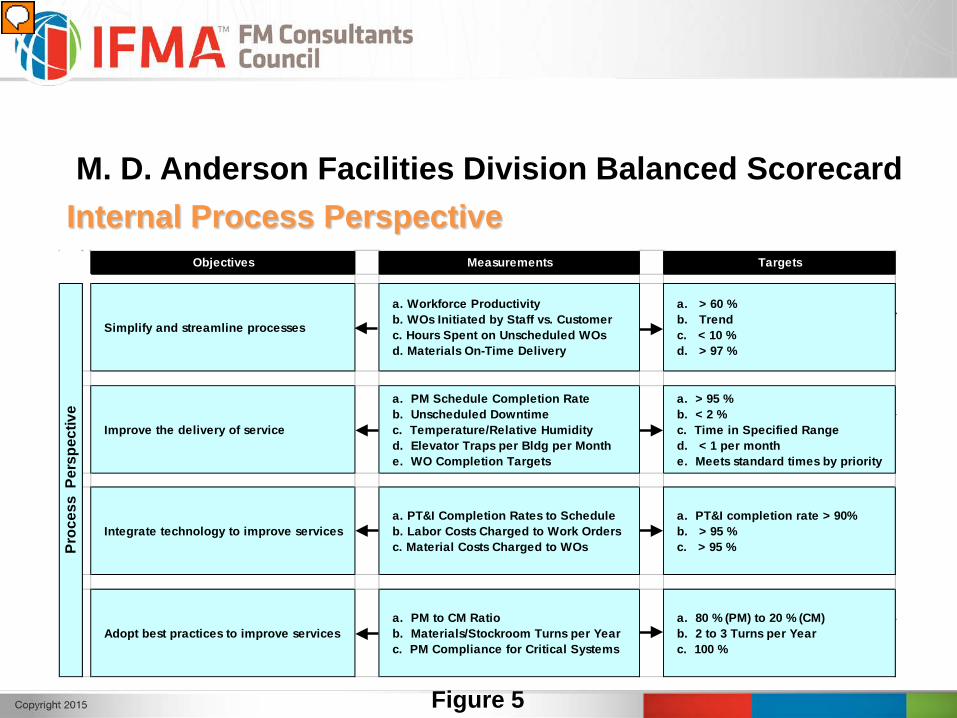
Objectives Measurements Targets
Simplify and streamline processes
a. Workforce Productivity b. WOs Initiated by Staff vs. Customer c. Hours Spent on Unscheduled WOs d. Materials On-Time Delivery
a. > 60 % b. Trend c. < 10 % d. > 97 %
Improve the delivery of service
a. PM Schedule Completion Rate b. Unscheduled Downtime c. Temperature/Relative Humidity d. Elevator Traps per Bldg per Month e. WO Completion Targets
a. > 95 % b. < 2 % c. Time in Specified Range d. < 1 per month e. Meets standard times by priority
Integrate technology to improve servicesa. PT&I Completion Rates to Schedule b. Labor Costs Charged to Work Orders c. Material Costs Charged to WOs
a. PT&I completion rate > 90% b. > 95 % c. > 95 %
Adopt best practices to improve servicesa. PM to CM Ratio b. Materials/Stockroom Turns per Year c. PM Compliance for Critical Systems
a. 80 % (PM) to 20 % (CM) b. 2 to 3 Turns per Year c. 100 %
Proc
ess
Per
spec
tive
M. D. Anderson Facilities Division Balanced ScorecardInternal Process Perspective
Figure 5
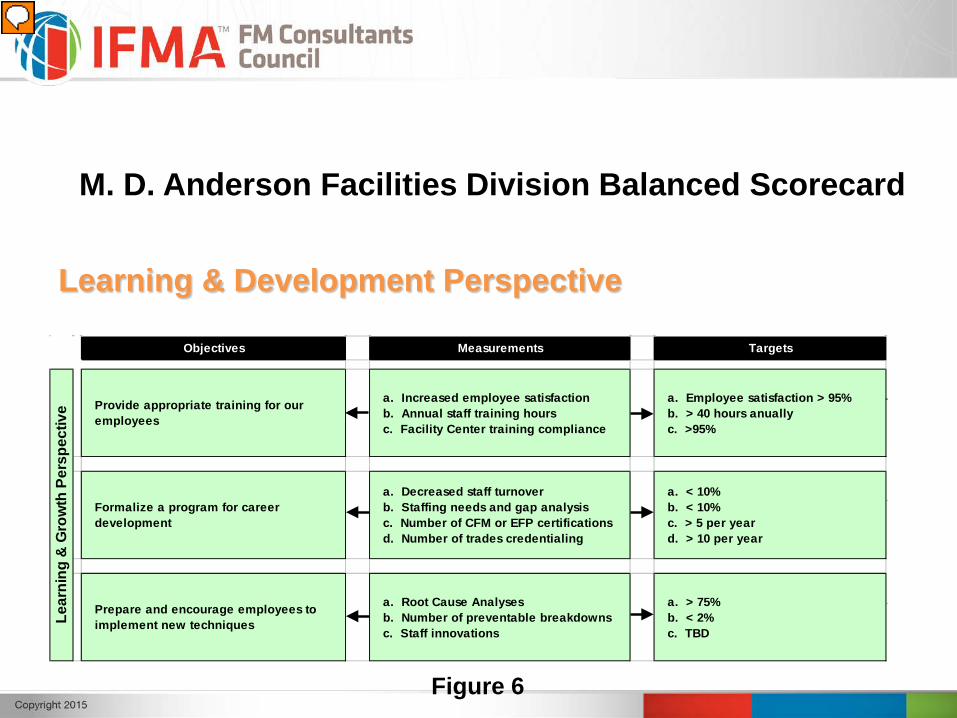
Objectives Measurements Targets
Provide appropriate training for our employees
a. Increased employee satisfaction b. Annual staff training hours c. Facility Center training compliance
a. Employee satisfaction > 95% b. > 40 hours anually c. >95%
Formalize a program for career development
a. Decreased staff turnover b. Staffing needs and gap analysis c. Number of CFM or EFP certifications d. Number of trades credentialing
a. < 10% b. < 10% c. > 5 per year d. > 10 per year
Prepare and encourage employees to implement new techniques
a. Root Cause Analyses b. Number of preventable breakdowns c. Staff innovations
a. > 75% b. < 2% c. TBD
Lear
ning
& G
row
th P
ersp
ectiv
e
M. D. Anderson Facilities Division Balanced Scorecard
Learning & Development Perspective
Figure 6
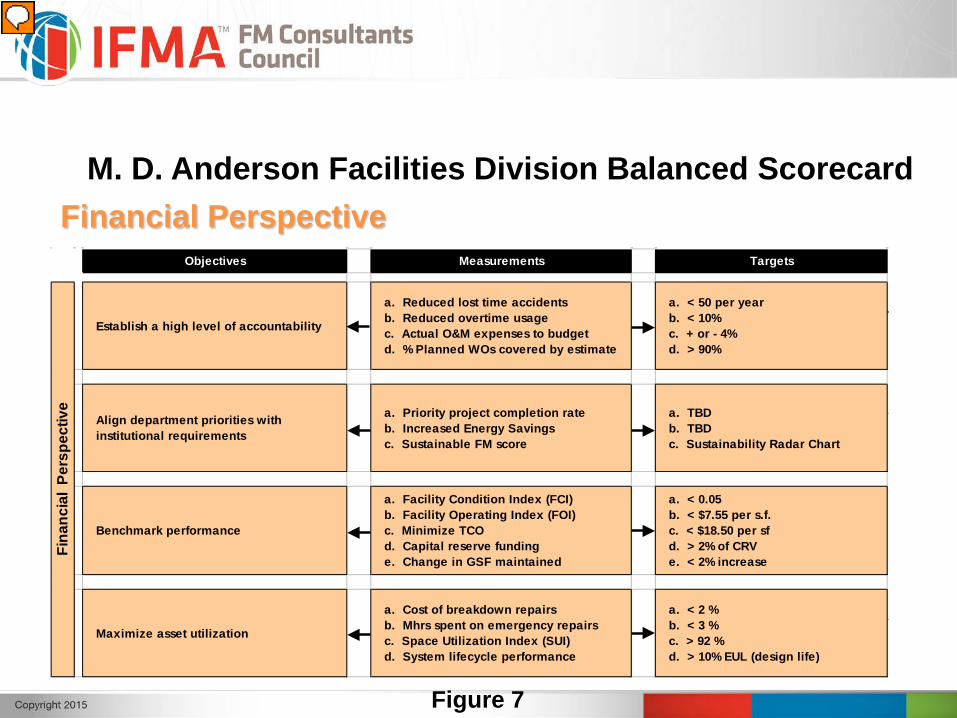
M. D. Anderson Facilities Division Balanced Scorecard
Objectives Measurements Targets
Establish a high level of accountability
a. Reduced lost time accidents b. Reduced overtime usage c. Actual O&M expenses to budget d. % Planned WOs covered by estimate
a. < 50 per year b. < 10% c. + or - 4% d. > 90%
Align department priorities with institutional requirements
a. Priority project completion rate b. Increased Energy Savings c. Sustainable FM score
a. TBD b. TBD c. Sustainability Radar Chart
Benchmark performance
a. Facility Condition Index (FCI) b. Facility Operating Index (FOI) c. Minimize TCO d. Capital reserve funding e. Change in GSF maintained
a. < 0.05 b. < $7.55 per s.f. c. < $18.50 per sf d. > 2% of CRV e. < 2% increase
Maximize asset utilization
a. Cost of breakdown repairs b. Mhrs spent on emergency repairs c. Space Utilization Index (SUI) d. System lifecycle performance
a. < 2 % b. < 3 % c. > 92 % d. > 10% EUL (design life)
Fina
ncia
l Pe
rspe
ctiv
e
Financial Perspective
Figure 7
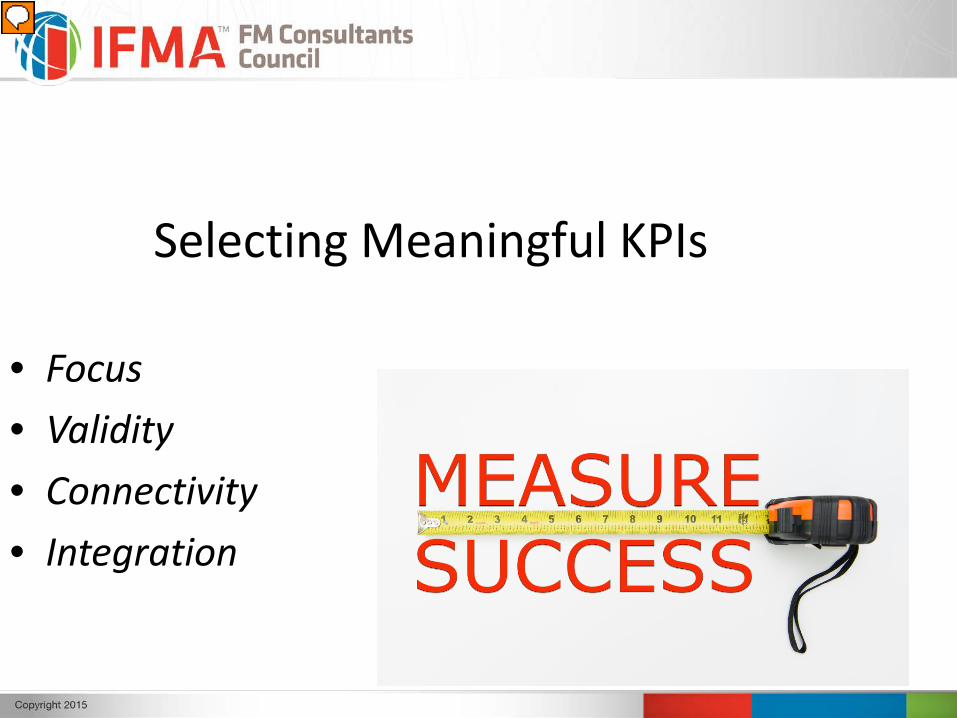
Selecting Meaningful KPIs
• Focus• Validity• Connectivity• Integration
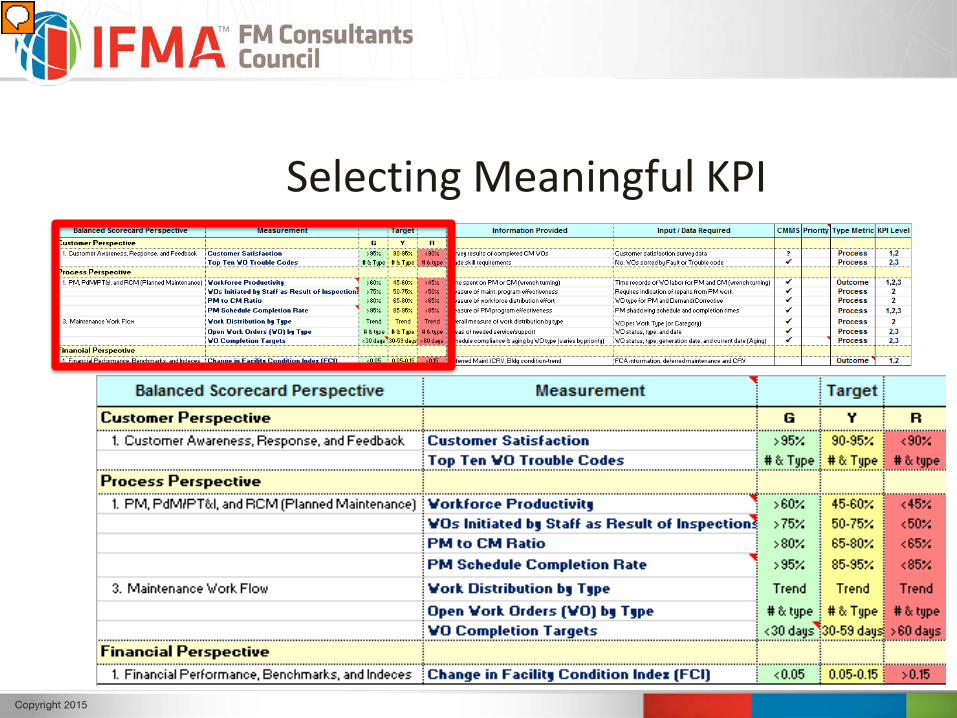
Selecting Meaningful KPI
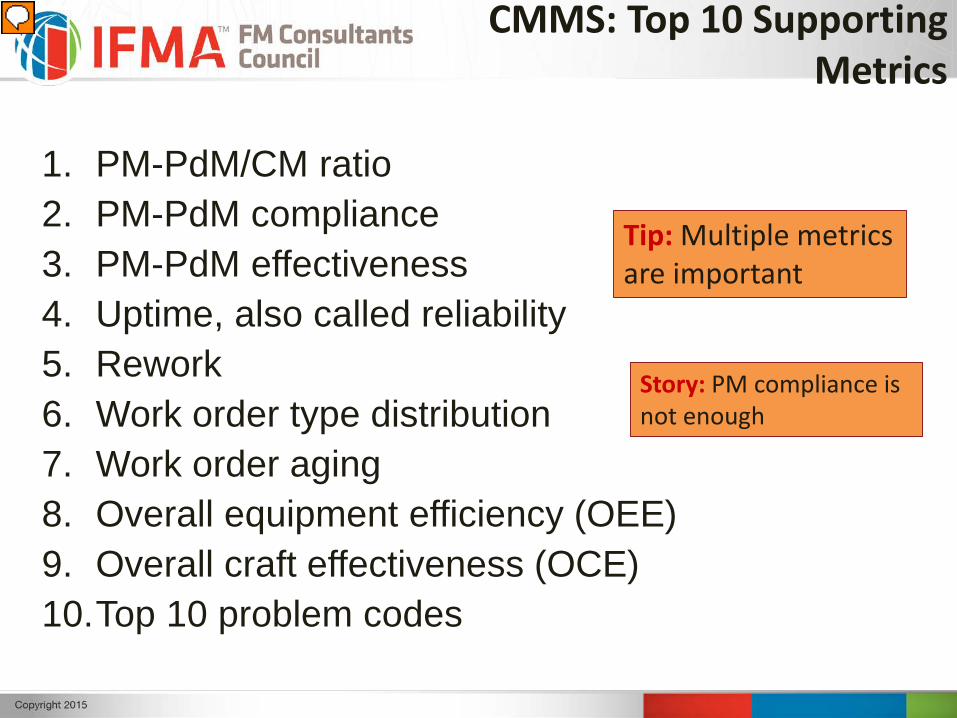
1. PM-PdM/CM ratio2. PM-PdM compliance3. PM-PdM effectiveness4. Uptime, also called reliability5. Rework6. Work order type distribution7. Work order aging8. Overall equipment efficiency (OEE)9. Overall craft effectiveness (OCE)10.Top 10 problem codes
CMMS: Top 10 Supporting Metrics
Tip: Multiple metrics are important
Story: PM compliance is not enough
CAFM: Supporting Metrics
• Total cost of ownership• Space utilization rate• Cost per assignable square foot• Cost per non-assignable square foot
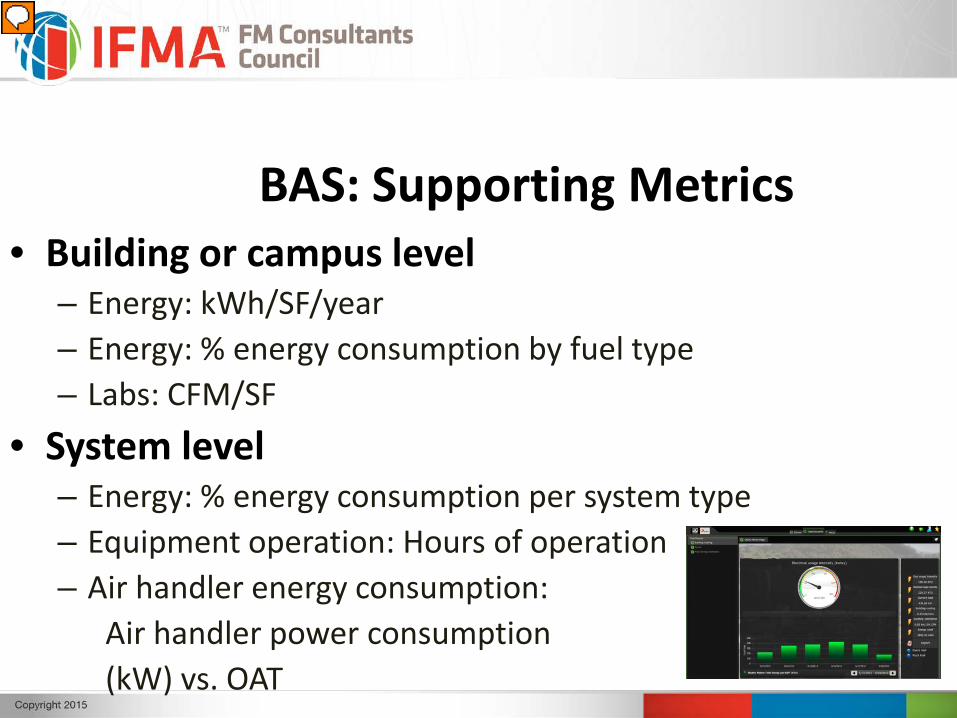
BAS: Supporting Metrics • Building or campus level
– Energy: kWh/SF/year– Energy: % energy consumption by fuel type – Labs: CFM/SF
• System level – Energy: % energy consumption per system type – Equipment operation: Hours of operation– Air handler energy consumption:
Air handler power consumption (kW) vs. OAT
KPIs/Benchmarks/TechnologySummary
1. Start w/ the End in Mind
2. Limit Data and Focus Measurements
3. Technology is a Tool
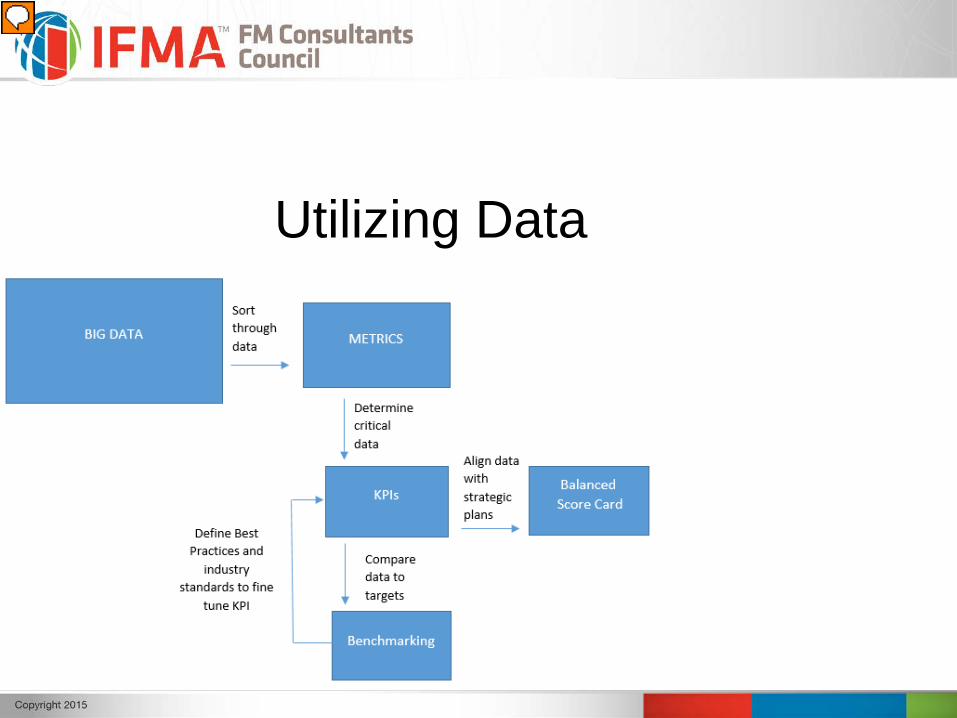
Utilizing Data
Utilization Tools
• Balanced Score Card– Clearly links KPIs to Strategic Plan
• Benchmarking– Compares KPIs to standards and other
organizations
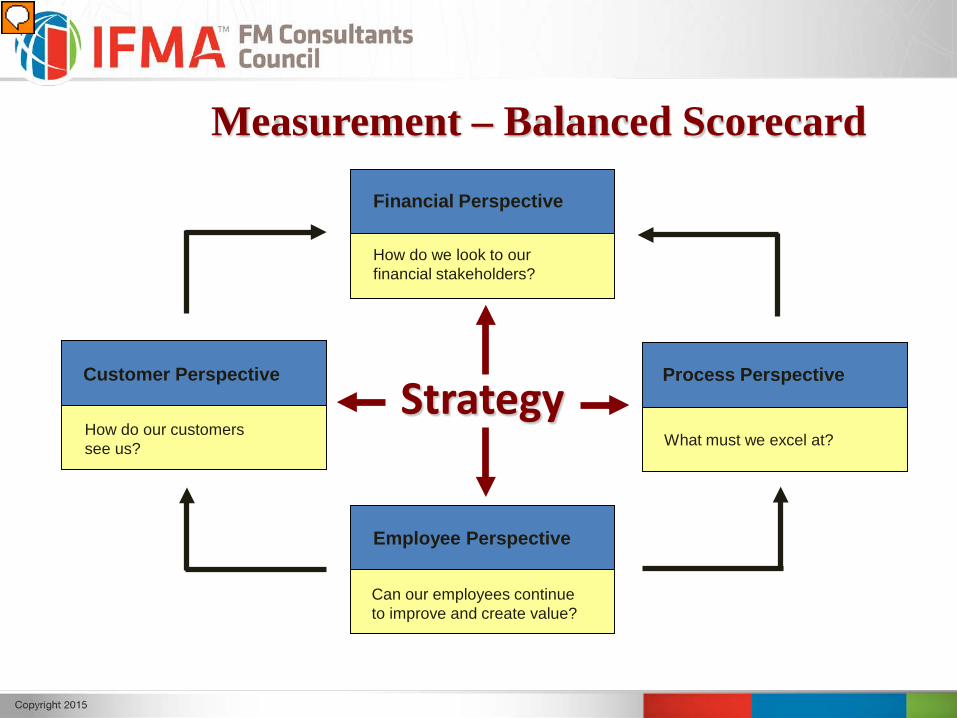
Measurement – Balanced Scorecard
Employee Perspective
Can our employees continue to improve and create value?
Customer Perspective
Financial Perspective
Process Perspective
How do our customers see us?
How do we look to our financial stakeholders?
What must we excel at?
Strategy
Benchmarking“It could be seen as a set of numbers, but the real value of benchmarking comes from how this information is used. It has the most impact when it is used to question concerns, or demonstrate the value that good facilities management delivers to the organization” (BIFM, Benchmarking: Effective performance management for FM).
Benchmarking• Internal vs. External
– Measure against yourself– Measure against other organizations
• “Targets”– Best Practices– Industry Standards– Top Organizations
Internal Benchmarking
• First step in benchmarking• Takes years to get valid results• Continuous and on-going process• Most organizations already do this in some
way
External Benchmarking“In many ways, FMs at ground level are using benchmarking without appreciating that it is ‘benchmarking’, because measuring performance, setting targets and standards, and making continuous improvements is already an intrinsic part of their job. What they are not doing, however, is comparing this data with other organizations, and that is the next required level to deliver the best benefit” (BIFM, Benchmarking: Effective performance management for FM).
External Benchmarking
• Look to industry leaders• Many benchmarking sources are available• Circle back to selecting KPIs• Not just about costs
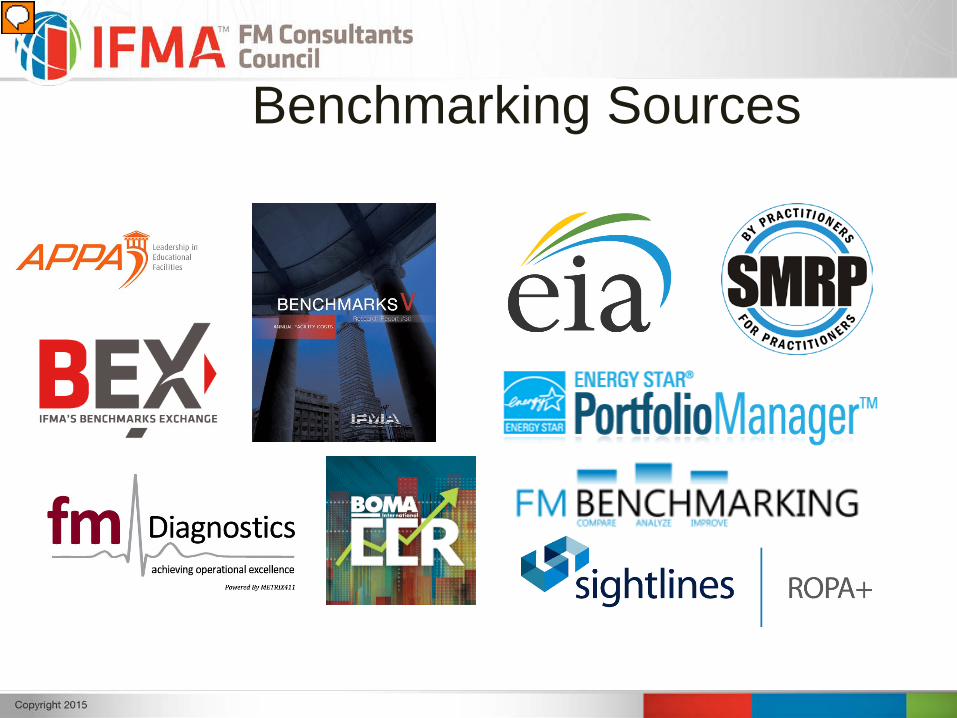
Benchmarking Sources
Benefits of Benchmarking
• Reduce costs• Help earn a “green” designation
– LEED-EBOM– ENERGY STAR
• Identify best practices• Add values to your facilities
Benefits of Benchmarking
• Support business case for change• Identify strengths and weaknesses• Justify costs and practices• Justify energy efficiency improvements• Conduct trend analysis
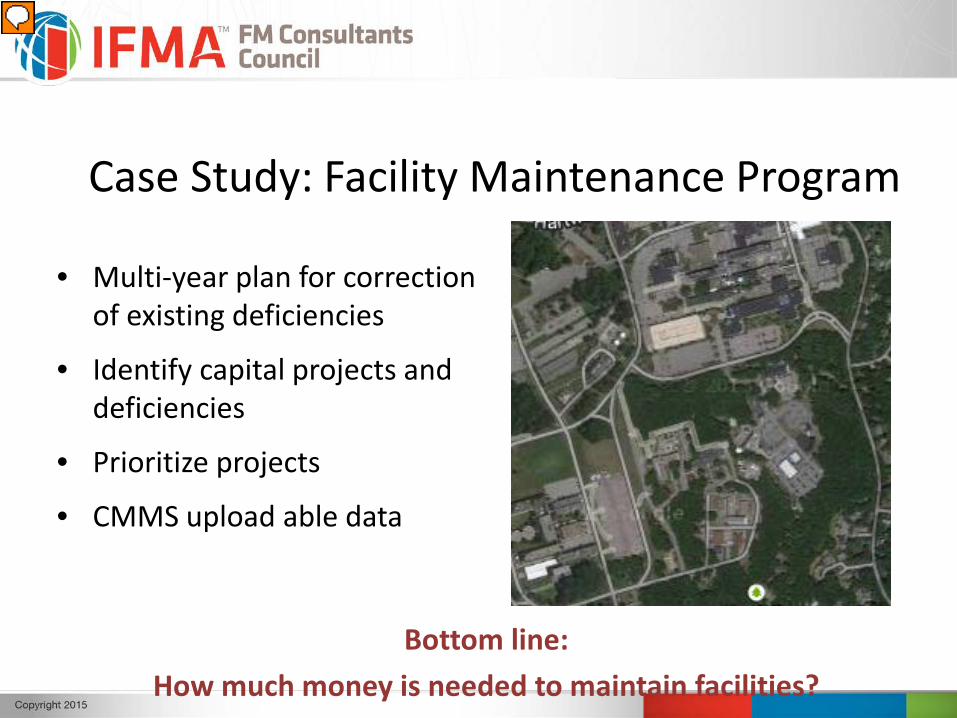
Case Study: Facility Maintenance Program
• Multi-year plan for correction of existing deficiencies
• Identify capital projects and deficiencies
• Prioritize projects
• CMMS upload able data
Bottom line: How much money is needed to maintain facilities?
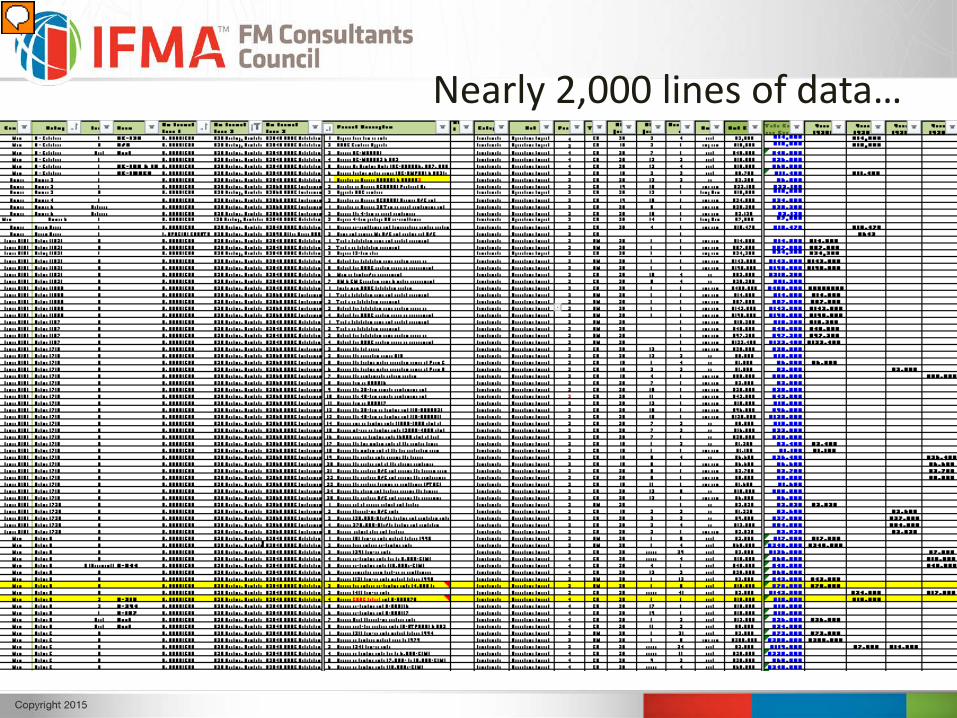
Nearly 2,000 lines of data…
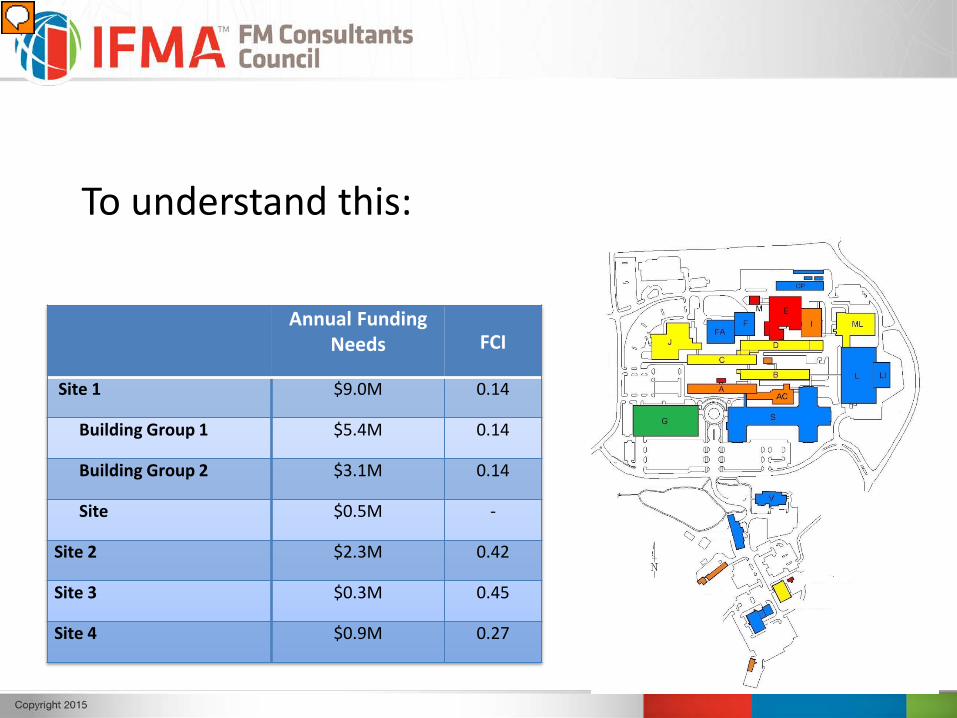
Annual FundingNeeds FCI
Site 1 $9.0M 0.14
Building Group 1 $5.4M 0.14
Building Group 2 $3.1M 0.14
Site $0.5M -
Site 2 $2.3M 0.42
Site 3 $0.3M 0.45
Site 4 $0.9M 0.27
To understand this:
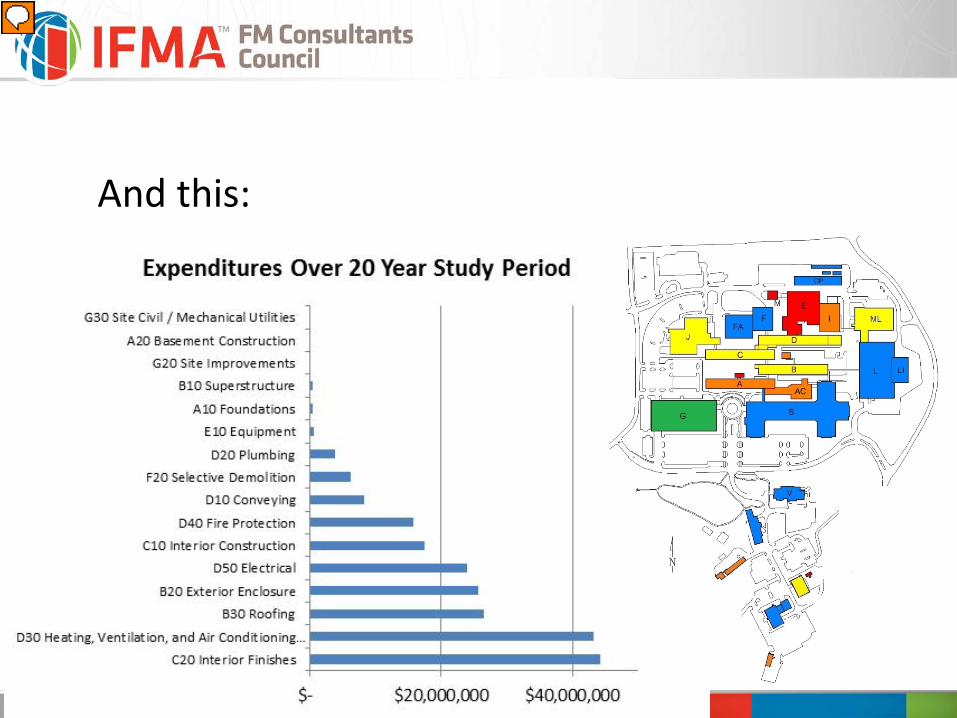
And this:
Summary
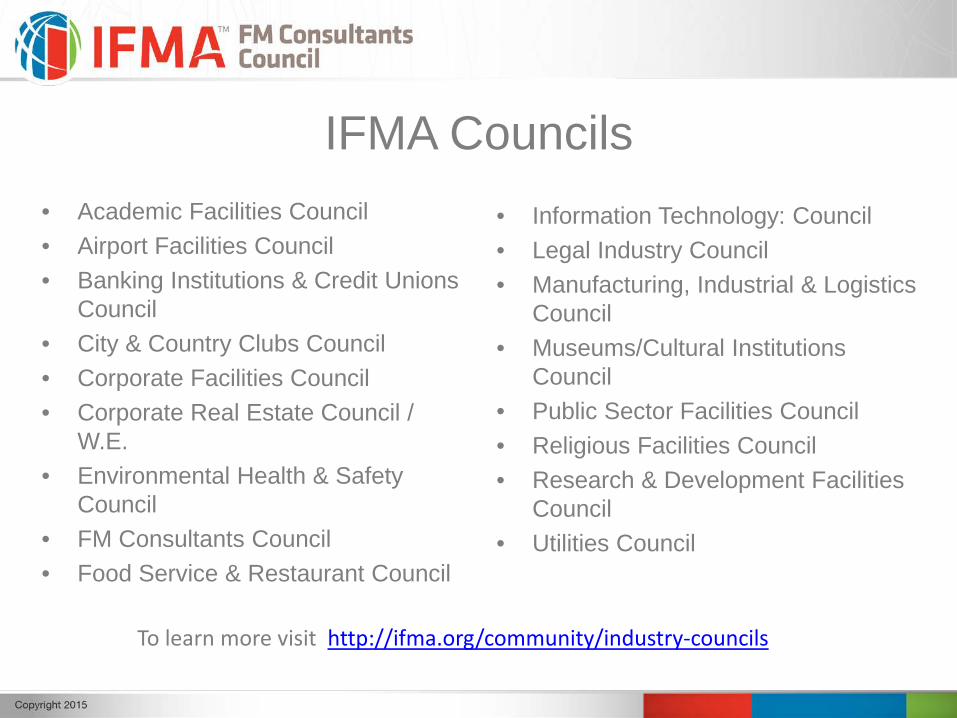
IFMA Councils• Academic Facilities Council• Airport Facilities Council• Banking Institutions & Credit Unions
Council• City & Country Clubs Council• Corporate Facilities Council• Corporate Real Estate Council /
W.E.• Environmental Health & Safety
Council• FM Consultants Council• Food Service & Restaurant Council
• Information Technology: Council• Legal Industry Council• Manufacturing, Industrial & Logistics
Council• Museums/Cultural Institutions
Council• Public Sector Facilities Council• Religious Facilities Council• Research & Development Facilities
Council• Utilities Council
To learn more visit http://ifma.org/community/industry-councils
Thank you for joining us!
Please take a moment to answer our brief survey at the conclusion of the webinar.
Follow Us At:fmcc.ifma.org