Embed Size (px)
Citation preview
Benchmarking in Community Colleges: Status of Two
National Projects
Jeffrey A. Seybert Director, Research, Evaluation, and Instructional Development
Johnson County Community College
George MaloAssociate Vice Chancellor for Research and Assessment
Tennessee Board of Regents
John D. PorterAssociate Provost
The State University of New York
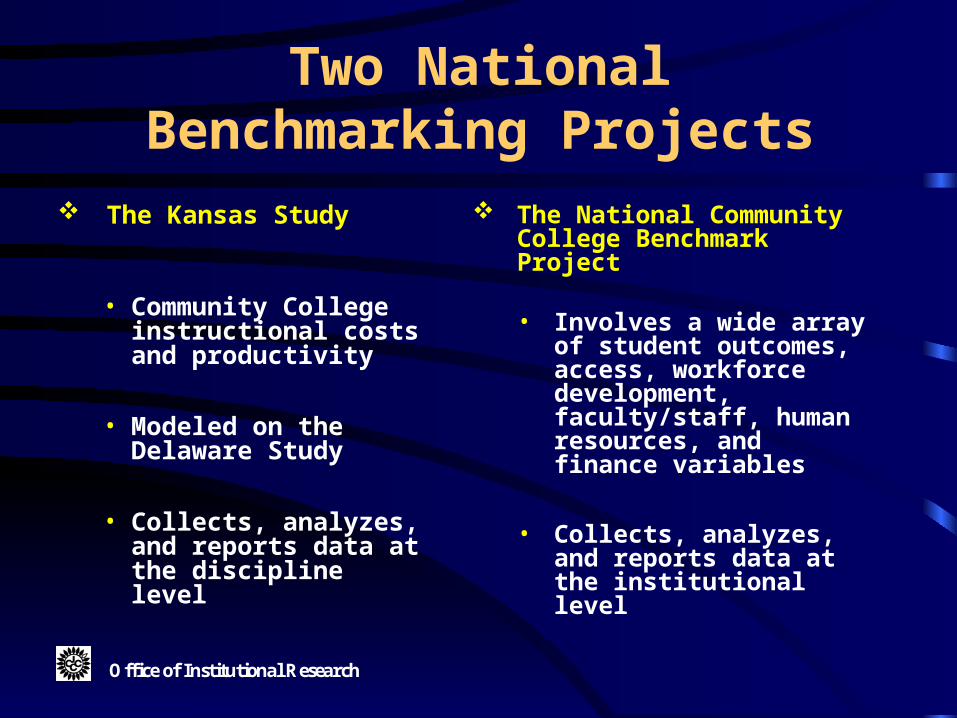
Two National Benchmarking Projects
The Kansas Study
• Community College instructional costs and productivity
• Modeled on the Delaware Study
• Collects, analyzes, and reports data at the discipline level
The National Community College Benchmark Project
• Involves a wide array of student outcomes, access, workforce development, faculty/staff, human resources, and finance variables
• Collects, analyzes, and reports data at the institutional level
Office of Institutional Research
The Kansas Study
Supported by a three-year, $282,000 grant
from FIPSE (USDE).
Colleges will be able to analyze faculty
workload and instructional cost at the
academic discipline level of analysis.
Office of Institutional Research
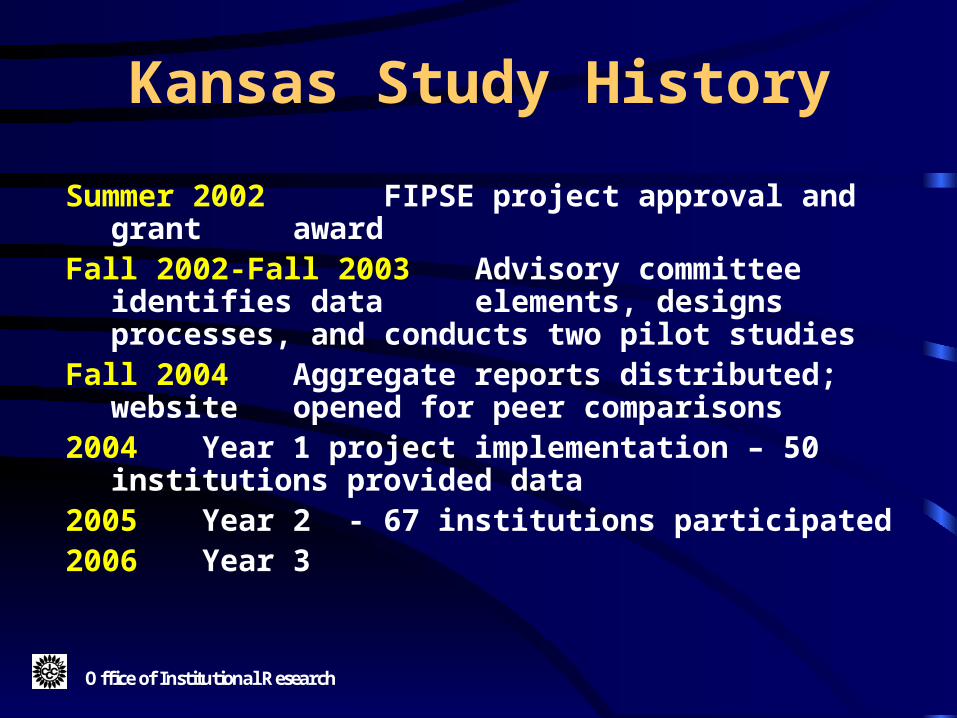
Kansas Study History
Summer 2002 FIPSE project approval and grant award
Fall 2002-Fall 2003 Advisory committee identifies data elements, designs processes, and conducts two pilot studies
Fall 2004 Aggregate reports distributed; website opened for peer comparisons
2004 Year 1 project implementation – 50 institutions provided data
2005 Year 2 - 67 institutions participated2006 Year 3
Office of Institutional Research
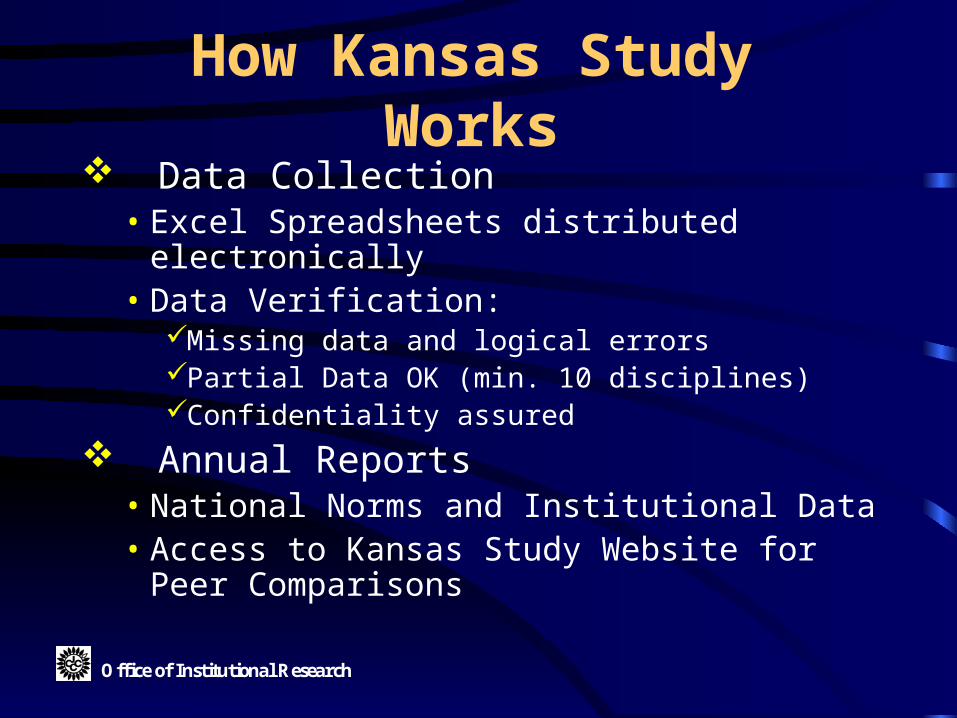
How Kansas Study Works Data Collection
• Excel Spreadsheets distributed electronically• Data Verification:
Missing data and logical errorsPartial Data OK (min. 10 disciplines)Confidentiality assured
Annual Reports• National Norms and Institutional Data• Access to Kansas Study Website for Peer
Comparisons
Office of Institutional Research
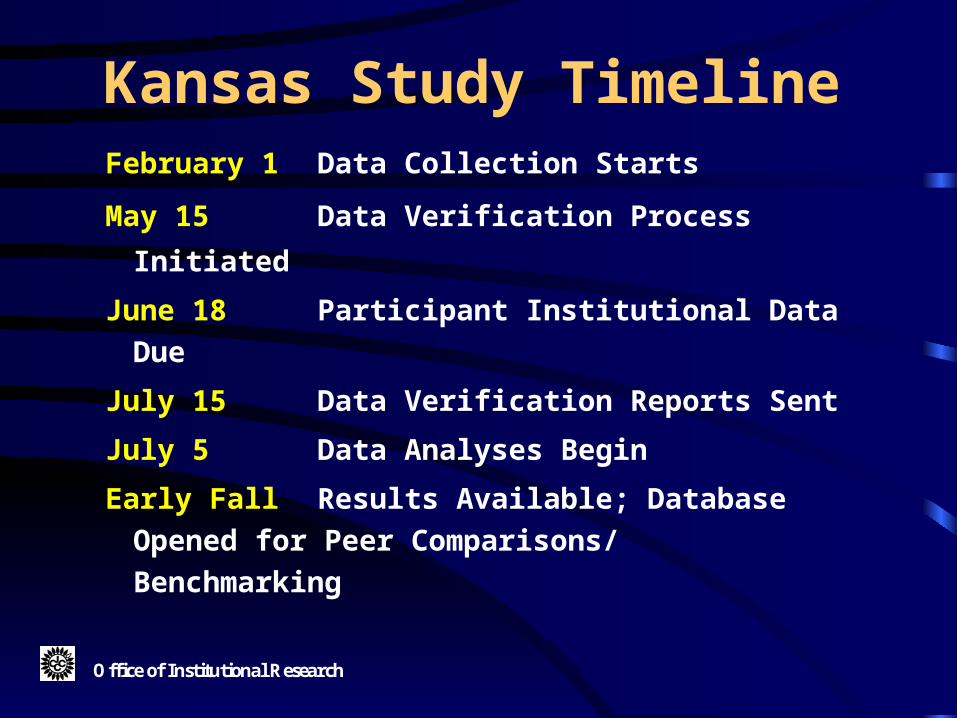
Kansas Study TimelineFebruary 1 Data Collection Starts
May 15 Data Verification Process Initiated
June 18 Participant Institutional Data Due
July 15 Data Verification Reports Sent
July 5 Data Analyses Begin
Early Fall Results Available; Database
Opened for Peer
Comparisons/ Benchmarking
Office of Institutional Research
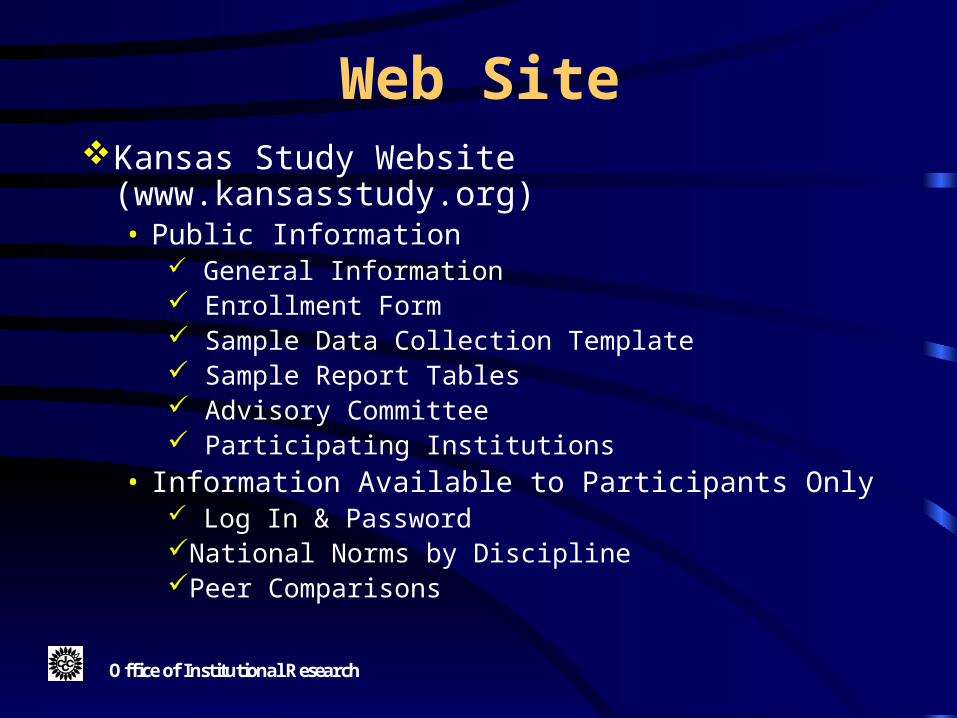
Web SiteKansas Study Website (www.kansasstudy.org)
• Public Information General Information Enrollment Form Sample Data Collection Template Sample Report Tables Advisory Committee Participating Institutions
• Information Available to Participants Only Log In & PasswordNational Norms by DisciplinePeer Comparisons
Office of Institutional Research
Benchmarking Instructional Costs and Productivity:
How a System and Campus Use the Kansas Cost Study
George Malo
Assistant Vice Chancellor for Research and Assessment
Tennessee Board of Regents
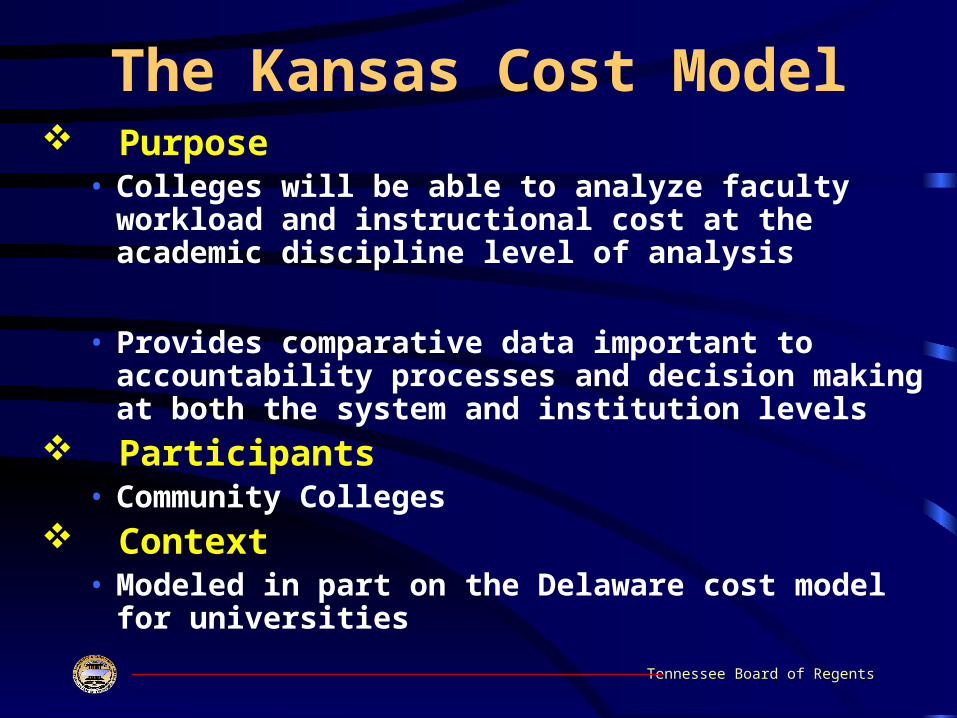
The Kansas Cost Model Purpose
• Colleges will be able to analyze faculty workload and instructional cost at the academic discipline level of analysis
• Provides comparative data important to accountability processes and decision making at both the system and institution levels
Participants• Community Colleges
Context• Modeled in part on the Delaware cost model for
universitiesTennessee Board of Regents
TBR Context Why do we participate?
• Part of TBR and State initiatives Defining Our Future Strategic planning process Accountability reporting Performance funding
• Cost model replaces Board’s former cost study
• Opportunity for national comparisons as well as a management tool for campuses
• Provides consistency across system institutions
• Useful for system policy and management decisionsTennessee Board of Regents
Strategic Planning
Provides benchmarks
Annual monitoring of key program variables
Documentation of activities
Use in Decision-Making
Part of presidential evaluations
Tennessee Board of Regents
Performance Funding Five points awarded as part of assessment standard
All 13 community colleges in TBR system must participate
Report on 4 key indicators (to be discussed later in presentation)
Submit a report providing evidence of the usage of the Kansas model for institutional planning and improvement.
Tennessee Board of Regents
Campus Uses of Kansas StudyProgram Review or Academic Audit
Look at high risk or outlier programs
Look at Peer Costs
Staffing & tenure decisions
Problem–solving tool
SACS accreditation documentation
Tennessee Board of Regents
Caveats to Avoid Misuse Tool for institutional decision-making
Support credible case-making and informed decision-making
Must be used as trend data
Should not be used for inferences of an institution as a whole
Prerequisite for assessing the adequacy of accountability
Tennessee Board of Regents
System Level Ad Hoc Committee
Institutional input through Academic Affairs committee for appropriate use of data
Adoption of key indicators as standard for framing instructional productivity and effectiveness reports
Development of common questions that would lead institutions to evaluate their decisions
Tennessee Board of Regents
System Level Key Indicators
FTE students taught per FTE instructional faculty by discipline
Student credit hours per FTE faculty as a percentage of national norm by discipline
Percentage student credit hours taught by full-time faculty
Tennessee Board of Regents
Comparison Group Selection
Each institution will construct its peer groups according to three standards, two for System use and the third for institutional use only
• System reporting as an aggregate
• System reporting per discipline
• At the institution level, each discipline may select peers
Tennessee Board of Regents
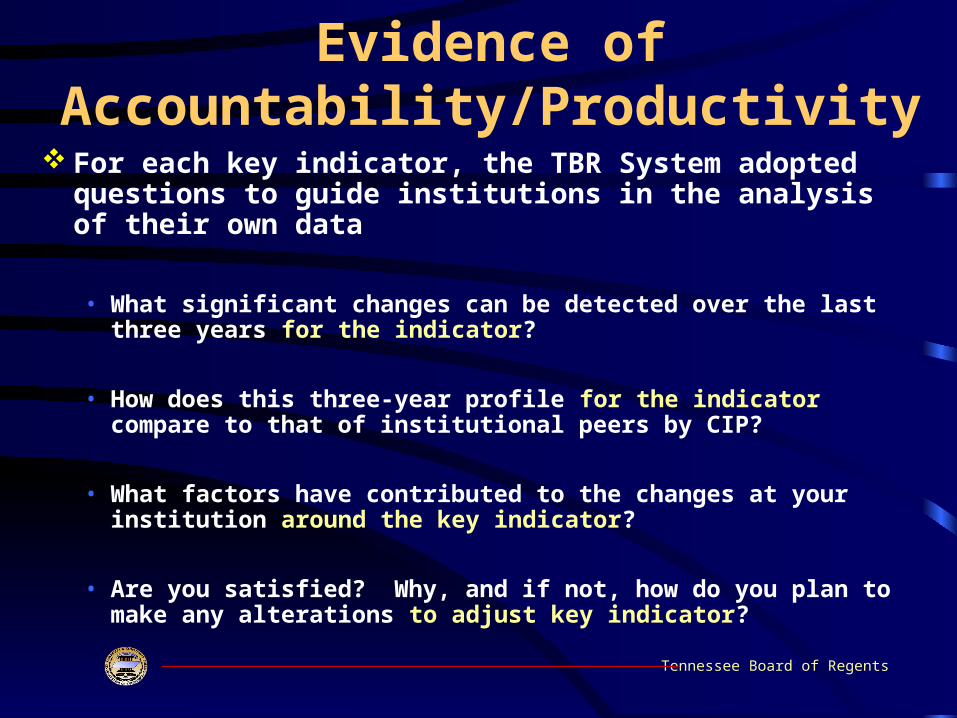
Evidence of Accountability/Productivity
For each key indicator, the TBR System adopted questions to guide institutions in the analysis of their own data
• What significant changes can be detected over the last three years for the indicator?
• How does this three-year profile for the indicator compare to that of institutional peers by CIP?
• What factors have contributed to the changes at your institution around the key indicator?
• Are you satisfied? Why, and if not, how do you plan to make any alterations to adjust key indicator?
Tennessee Board of Regents
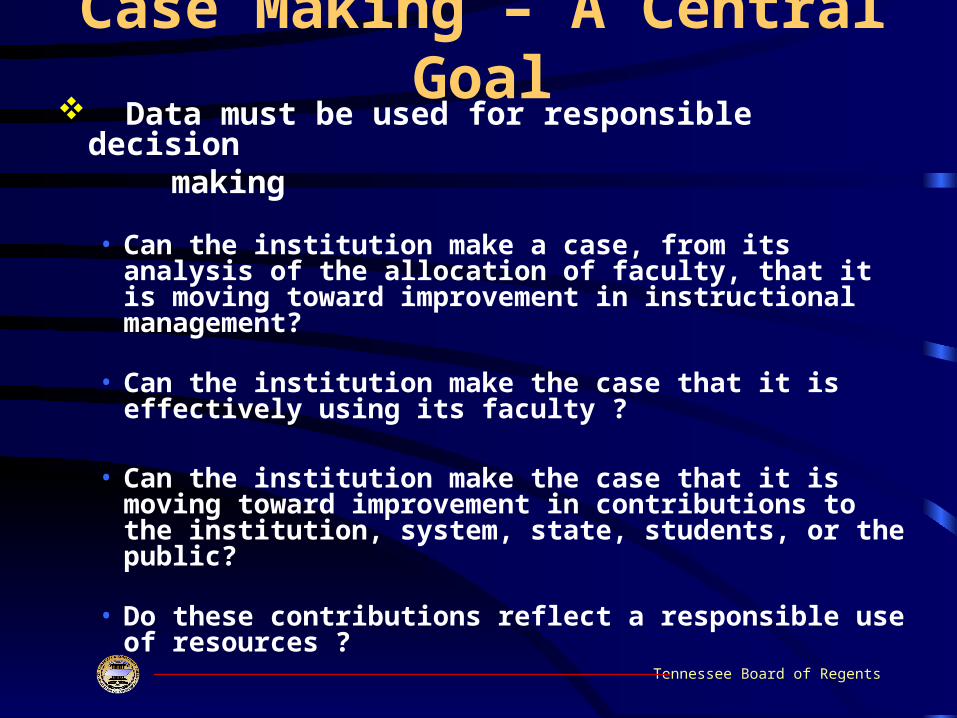
Case Making – A Central Goal Data must be used for responsible decision making
• Can the institution make a case, from its analysis of the allocation of faculty, that it is moving toward improvement in instructional management?
• Can the institution make the case that it is effectively using its faculty ?
• Can the institution make the case that it is moving toward improvement in contributions to the institution, system, state, students, or the public?
• Do these contributions reflect a responsible use of resources ?
Tennessee Board of Regents
System Wide Assistance
Programming for data collection
Programming for analysis of data
Templates for reporting of data
Revisions to/formulation of policies and
guidelines
Tennessee Board of Regents
Campus Uses of Kansas Study
Documenting accreditation compliance
Planning institutional change
Predicting academic/financial impact
Tennessee Board of Regents
Accreditation
Institutional Effectiveness
Adequate Faculty
Sound financial base and adequate resources
Tennessee Board of Regents
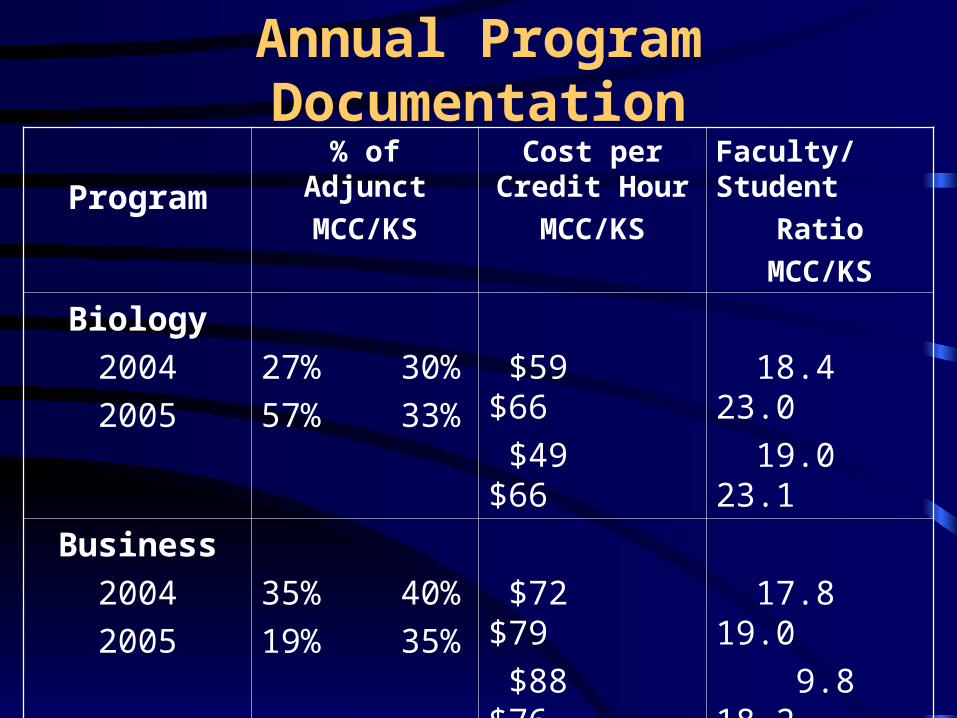
Annual Program Documentation
Program
% of Adjunct
MCC/KS
Cost per Credit Hour
MCC/KS
Faculty/Student
Ratio
MCC/KS
Biology
2004
2005
27% 30%
57% 33%
$59 $66
$49 $66
18.4 23.0
19.0 23.1
Business
2004
2005
35% 40%
19% 35%
$72 $79
$88 $76
17.8 19.0
9.8 18.2
Computers
2004
2005
27% 43%
35% 33%
$89 $88
$106 $101
13.6 15.9
10.7 15.5
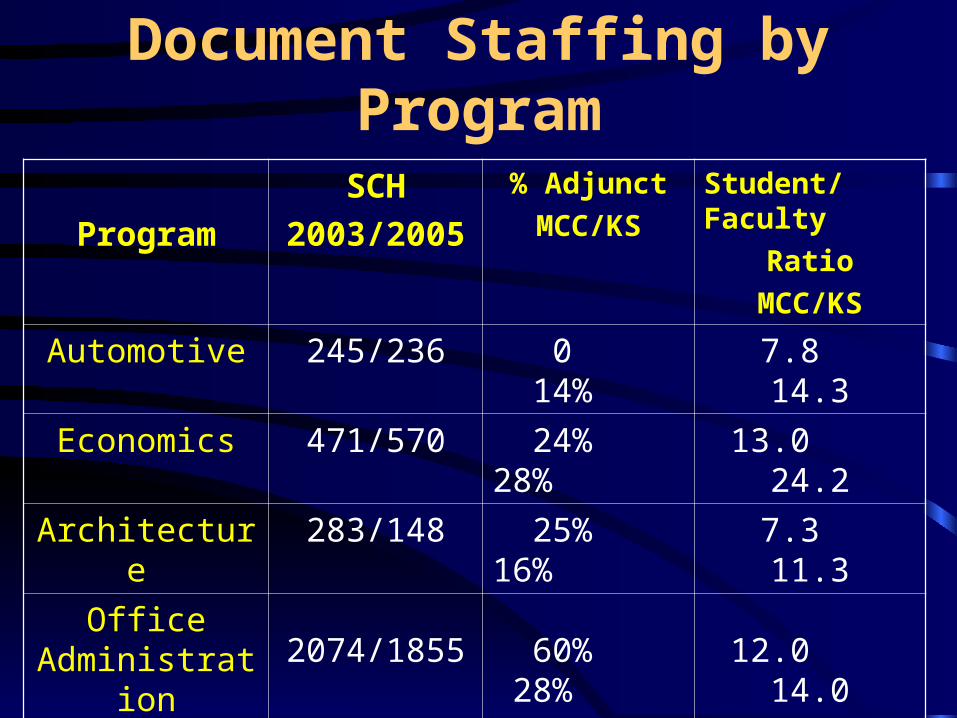
Document Staffing by Program
Program
SCH
2003/2005
% Adjunct
MCC/KS
Student/Faculty
Ratio
MCC/KS
Automotive 245/236 0 14% 7.8 14.3
Economics 471/570 24% 28% 13.0 24.2
Architecture 283/148 25% 16% 7.3 11.3
Office Administration 2074/1855 60% 28% 12.0 14.0
Psychology 1872/2736 60% 43% 17.0 27.0
Early Childhood 1036/946 65% 54% 15.7 18.3
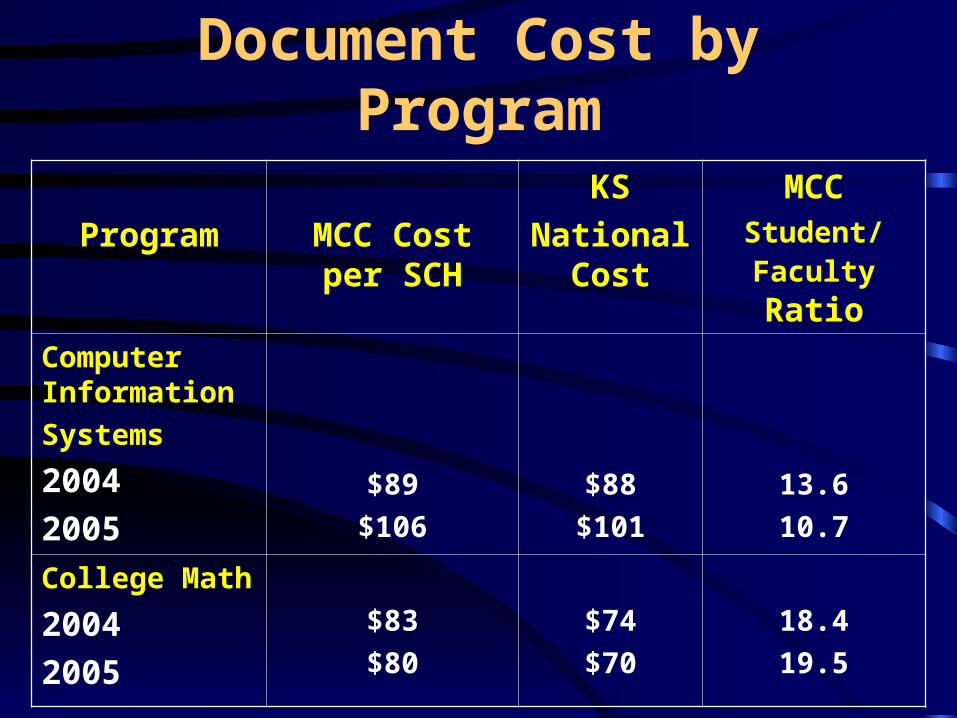
Document Cost by Program
Program MCC Cost per SCH
KS
National Cost
MCC
Student/Faculty Ratio
Computer Information
Systems
2004
2005$89
$106
$88
$101
13.6
10.7
College Math
2004
2005
$83
$80
$74
$70
18.4
19.5
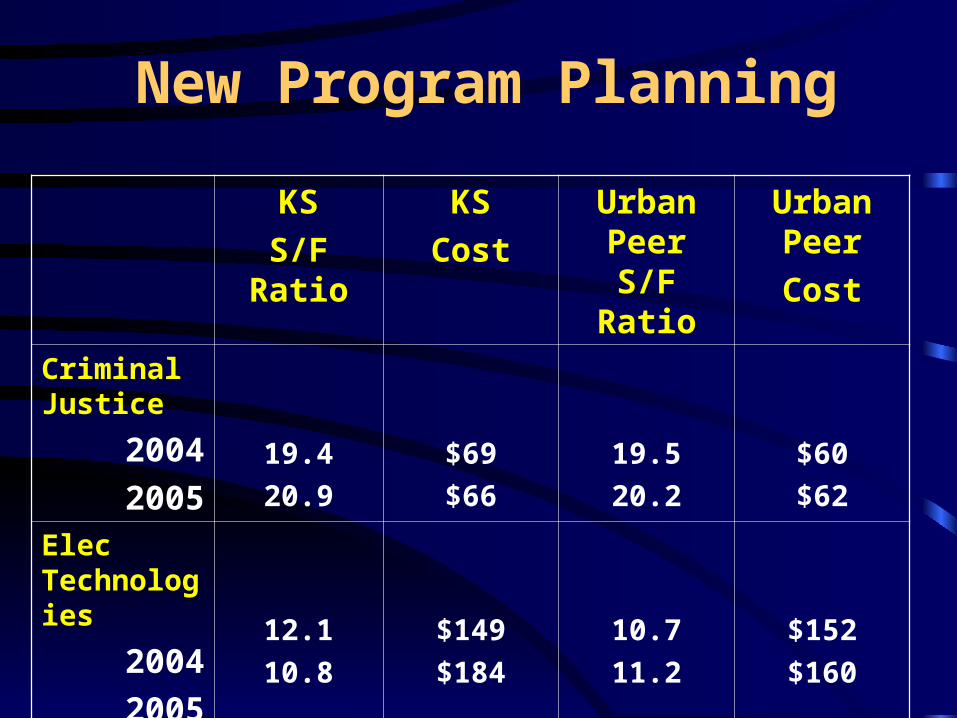
New Program Planning
KS
S/F Ratio
KS
Cost
Urban Peer S/F
Ratio
Urban Peer
Cost
Criminal Justice
2004
200519.4
20.9
$69
$66
19.5
20.2
$60
$62
Elec Technologies
2004
200512.1
10.8
$149
$184
10.7
11.2
$152
$160
The National Community College Benchmark Project
• Involves a wide array of student outcomes, access, workforce development, faculty/staff, human resources, and finance variables
• Collects, analyzes, and reports data at the institutional level
Office of Institutional Research
Purposes
• To collect and report community college benchmark data on a national basis
• To provide data for comparisons and benchmarks of instructional, workforce-development, and other community college activities
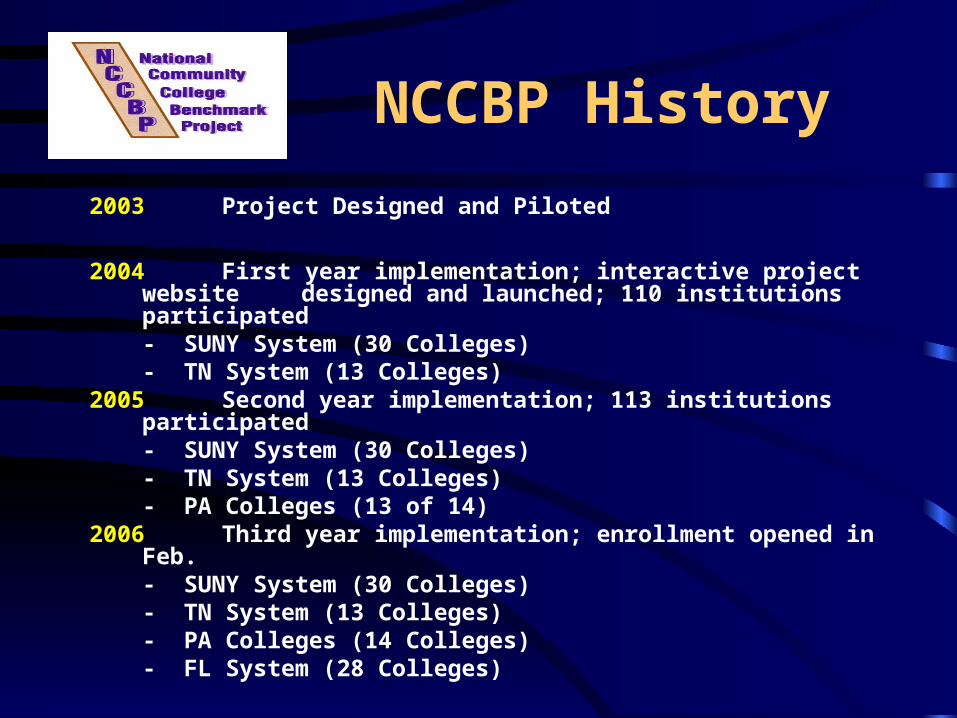
NCCBP History
2003 Project Designed and Piloted
2004 First year implementation; interactive project website designed and launched; 110 institutions participated
- SUNY System (30 Colleges)- TN System (13 Colleges)
2005 Second year implementation; 113 institutions participated
- SUNY System (30 Colleges)- TN System (13 Colleges)- PA Colleges (13 of 14)
2006 Third year implementation; enrollment opened in Feb. - SUNY System (30 Colleges)- TN System (13 Colleges)- PA Colleges (14 Colleges)- FL System (28 Colleges)
How NCCBP Works
Data collection• Excel spreadsheets distributed electronically• Data verification: Missing data and logical errors• Partial data OK; no peer comparison for missing
data• Confidentiality assured
Cost: $1,000/year per institution Annual reports
• Aggregate data delivered electronically
• Access to NCCBP Web site for peer comparisons Website: www.NCCBP.org
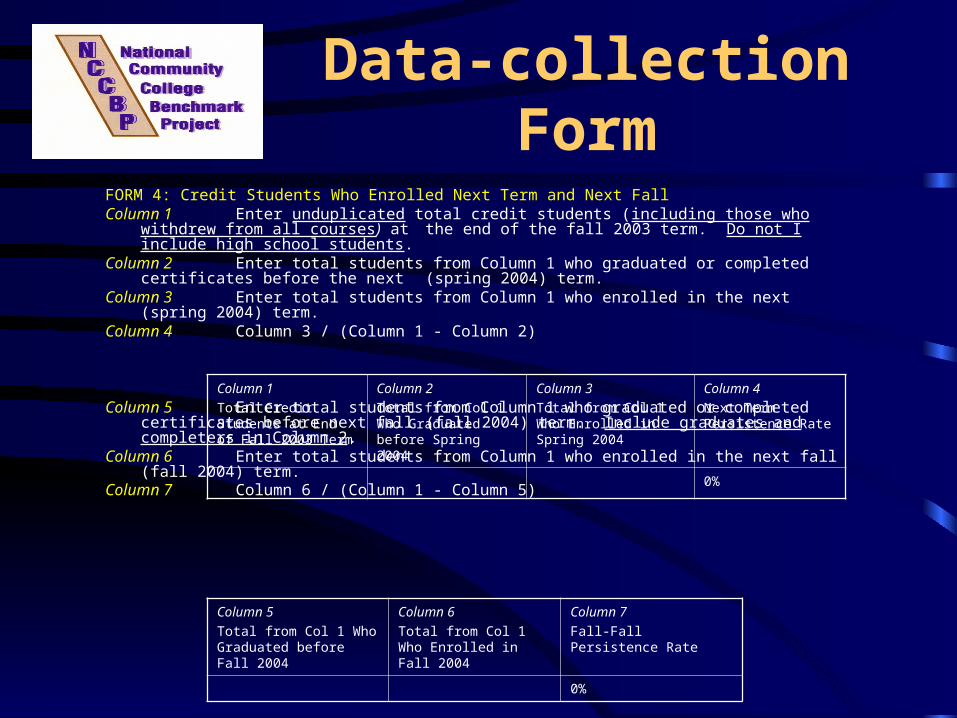
Data-collection Form
FORM 4: Credit Students Who Enrolled Next Term and Next Fall
Column 1 Enter unduplicated total credit students (including those who withdrew from all courses) at the end of the fall 2003 term. Do not I include high school students.
Column 2 Enter total students from Column 1 who graduated or completed certificates before the next (spring 2004) term.
Column 3 Enter total students from Column 1 who enrolled in the next (spring 2004) term.
Column 4 Column 3 / (Column 1 - Column 2)
Column 5 Enter total students from Column 1 who graduated or completed certificates before next fall (fall 2004) term. Include graduates and completers in Column 2.
Column 6 Enter total students from Column 1 who enrolled in the next fall (fall 2004) term.
Column 7 Column 6 / (Column 1 - Column 5)
Column 5
Total from Col 1 Who Graduated before Fall 2004
Column 6
Total from Col 1 Who Enrolled in Fall 2004
Column 7
Fall-Fall Persistence Rate
0%
Column 1
Total Credit Students at End of Fall 2003 Term
Column 2
Total from Col 1 Who Graduated before Spring 2004
Column 3
Total from Col 1 Who Enrolled in Spring 2004
Column 4
Next Term Persistence Rate
0%
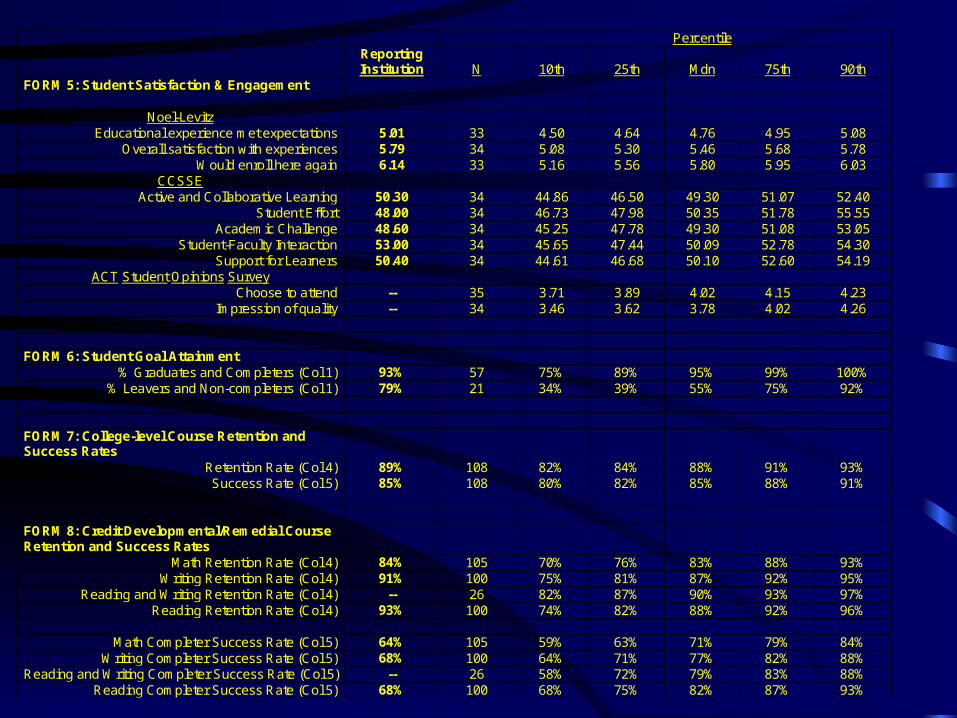
Percentile
Reporting Institution N 10th 25th Mdn 75th 90th
FORM 5: Student Satisfaction & Engagement
Noel-Levitz Educational experience met expectations 5.01 33 4.50 4.64 4.76 4.95 5.08
Overall satisfaction with experiences 5.79 34 5.08 5.30 5.46 5.68 5.78 Would enroll here again 6.14 33 5.16 5.56 5.80 5.95 6.03
CCSSE Active and Collaborative Learning 50.30 34 44.86 46.50 49.30 51.07 52.40
Student Effort 48.00 34 46.73 47.98 50.35 51.78 55.55 Academic Challenge 48.60 34 45.25 47.78 49.30 51.08 53.05
Student-Faculty Interaction 53.00 34 45.65 47.44 50.09 52.78 54.30 Support for Learners 50.40 34 44.61 46.68 50.10 52.60 54.19
ACT Student Opinions Survey Choose to attend -- 35 3.71 3.89 4.02 4.15 4.23
Impression of quality -- 34 3.46 3.62 3.78 4.02 4.26 FORM 6: Student Goal Attainment
% Graduates and Completers (Col 1) 93% 57 75% 89% 95% 99% 100% % Leavers and Non-completers (Col 1) 79% 21 34% 39% 55% 75% 92%
FORM 7: College-level Course Retention and Success Rates
Retention Rate (Col 4) 89% 108 82% 84% 88% 91% 93% Success Rate (Col 5) 85% 108 80% 82% 85% 88% 91%
FORM 8: Credit Developmental/Remedial Course Retention and Success Rates
Math Retention Rate (Col 4) 84% 105 70% 76% 83% 88% 93% Writing Retention Rate (Col 4) 91% 100 75% 81% 87% 92% 95%
Reading and Writing Retention Rate (Col 4) -- 26 82% 87% 90% 93% 97% Reading Retention Rate (Col 4) 93% 100 74% 82% 88% 92% 96%
Math Completer Success Rate (Col 5) 64% 105 59% 63% 71% 79% 84%
Writing Completer Success Rate (Col 5) 68% 100 64% 71% 77% 82% 88% Reading and Writing Completer Success Rate (Col 5) -- 26 58% 72% 79% 83% 88%
Reading Completer Success Rate (Col 5) 68% 100 68% 75% 82% 87% 93%
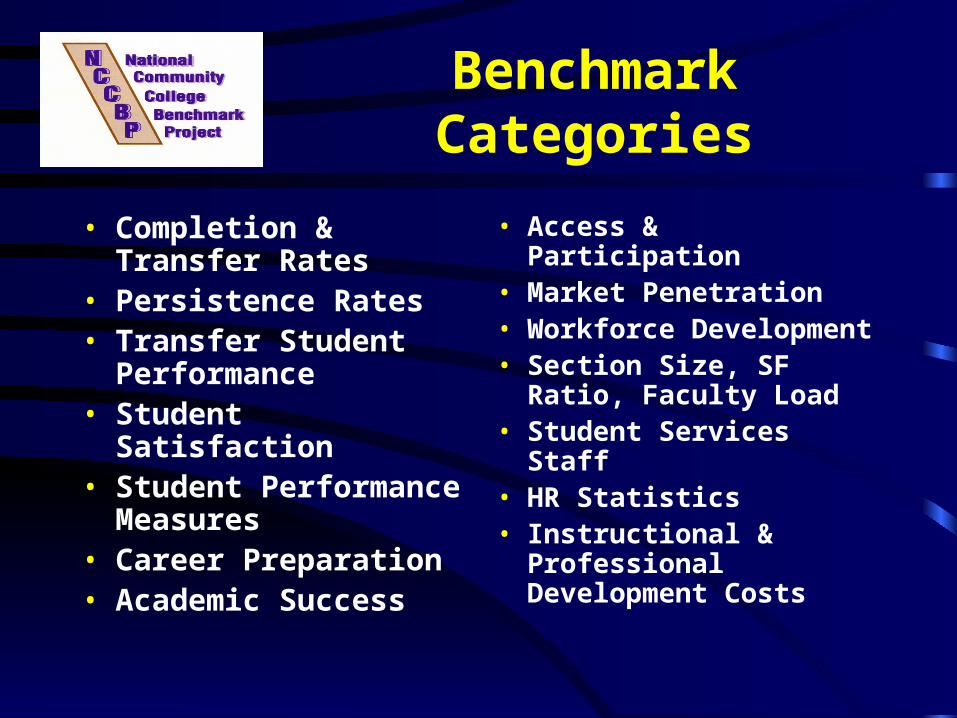
Benchmark Categories
• Completion & Transfer Rates
• Persistence Rates• Transfer Student
Performance• Student Satisfaction• Student Performance
Measures• Career Preparation• Academic Success
• Access & Participation• Market Penetration• Workforce Development• Section Size, SF Ratio,
Faculty Load• Student Services Staff• HR Statistics• Instructional &
Professional Development Costs
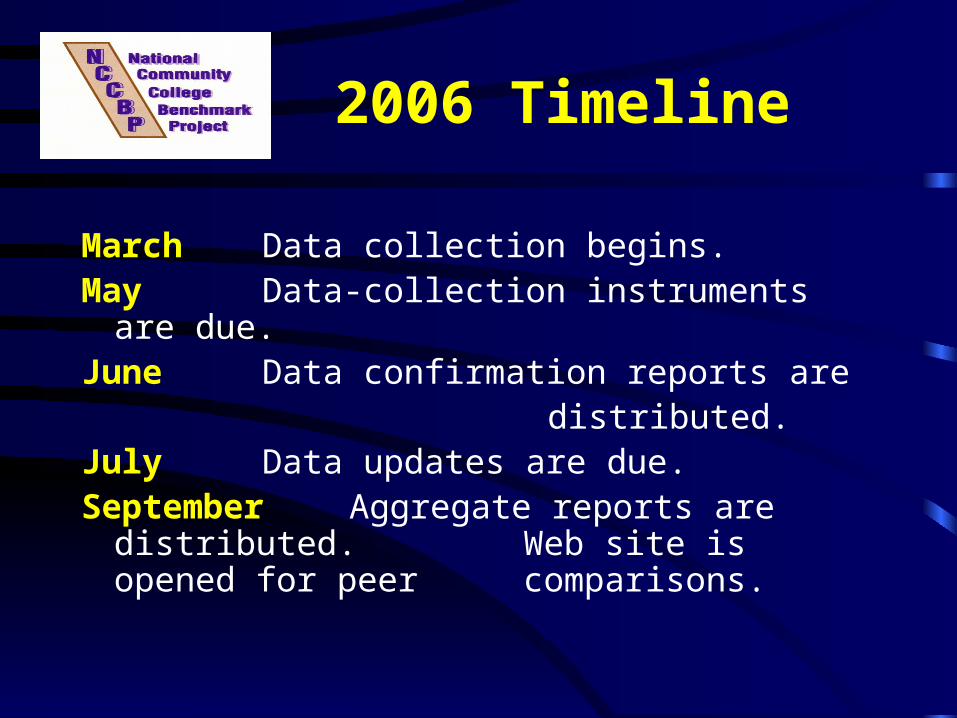
2006 Timeline
March Data collection begins.May Data-collection instruments are
due.June Data confirmation reports are distributed.July Data updates are due.September Aggregate reports are distributed.
Web site is opened for peer comparisons.
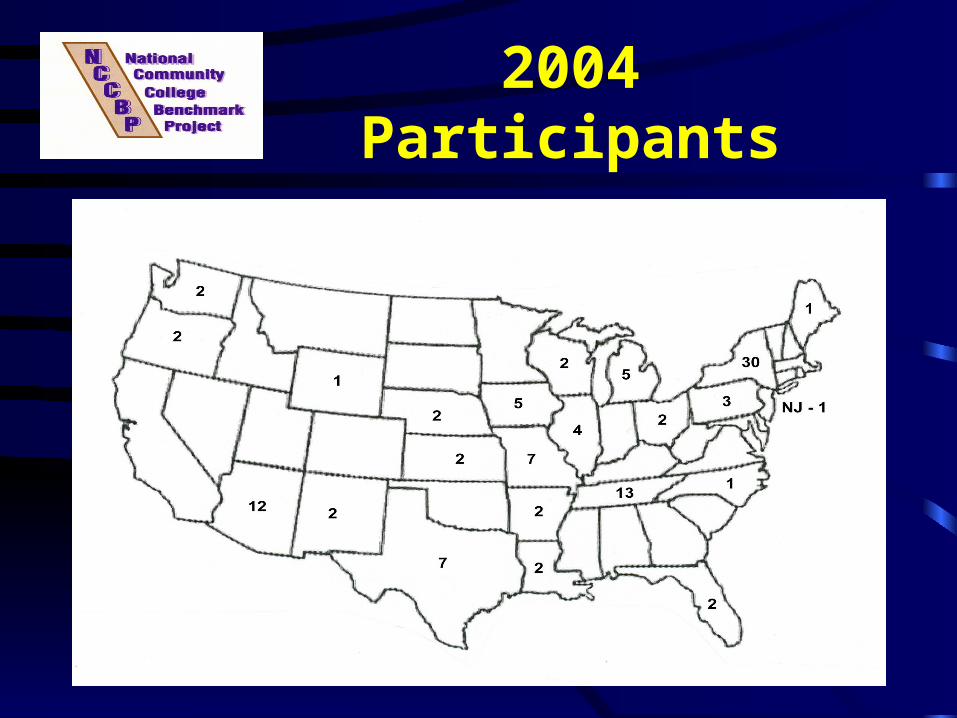
2004 Participants
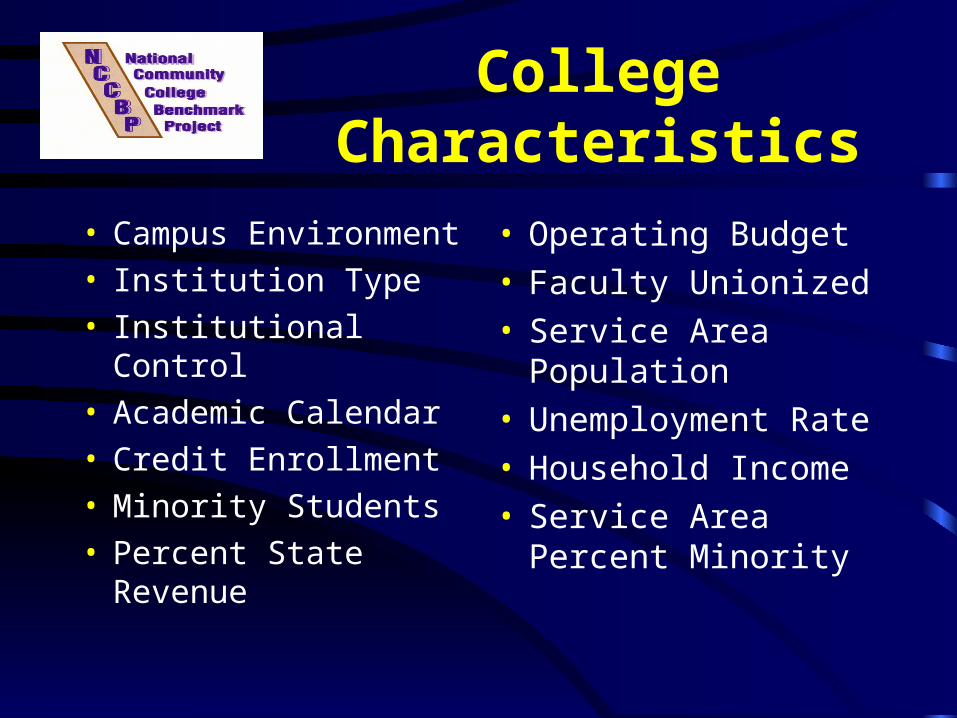
College Characteristics
• Campus Environment• Institution Type• Institutional Control• Academic Calendar• Credit Enrollment• Minority Students• Percent State Revenue
• Operating Budget• Faculty Unionized• Service Area
Population• Unemployment Rate• Household Income• Service Area Percent
Minority
National Community College Benchmark Project: A
System/State Perspective
John D. Porter
Associate Provost
The State University of New York
NCCBP: A Valuable Resource for Systems & States
NY’s CCs are funded based on annual full-time student equivalents (FTE) CCs need to benchmark their operations to maintain & expand state support CC’s are as complex as research universities, which is not understood by most decision makers NCCBP fills a critical void
SUNY’s Community Colleges SUNY’s community colleges enroll 208,374 students 50.3% of SUNY’s overall enrollment Campuses range in size from 21,000 to 1,500 Located throughout New York Stake, including New York City One CC awards bachelor and master degrees (FIT) These institutions have every conceivable governance/funding arrangement
SUNY Support of NCCBP SUNY’s benchmarking has here-to-fore focused on “intra” measures NCCBP offers the potential to benchmark against true peers and other states For the past three years, SUNY has encouraged campus participation by paying the subscription fee This year, all 30 community colleges will participate in NCBBP SUNY’s hope is that other states and systems will see the value of this project and participate
NCCBP: A Valuable Resource for Systems & States
NCCBP has generally been conceived as a tool for
campuses Systems/States need this type of resource, since most
community colleges are funded based on enrollment SUNY requires CCs to plan enrollments 5 years into
the future; also update the institutional mission every
five years NCCBP has the potential for developing reports
tailored to the needs of Systems and States
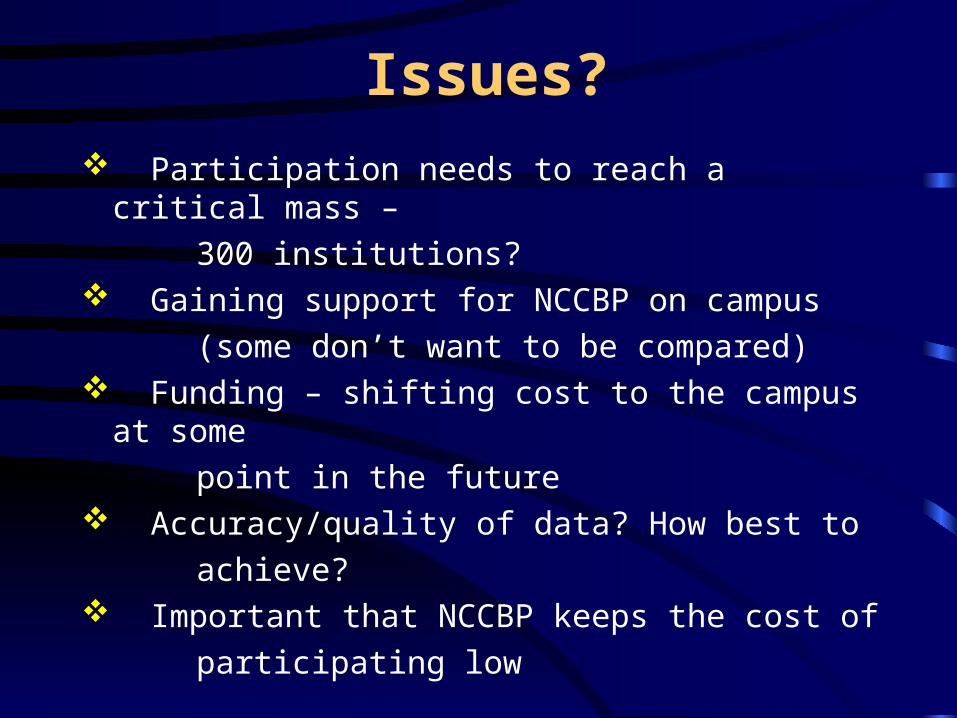
Issues?
Participation needs to reach a critical mass –
300 institutions? Gaining support for NCCBP on campus
(some don’t want to be compared) Funding – shifting cost to the campus at some
point in the future Accuracy/quality of data? How best to
achieve? Important that NCCBP keeps the cost of
participating low

National Community College Benchmarking
Project
George MaloAssociate Vice Chancellor for Research and Assessment
Tennessee Board of Regents
Uses of NCCBP
Strategic planning
Performance funding
Documenting accreditation
Policy development/analysis/evaluation
Tennessee Board of Regents
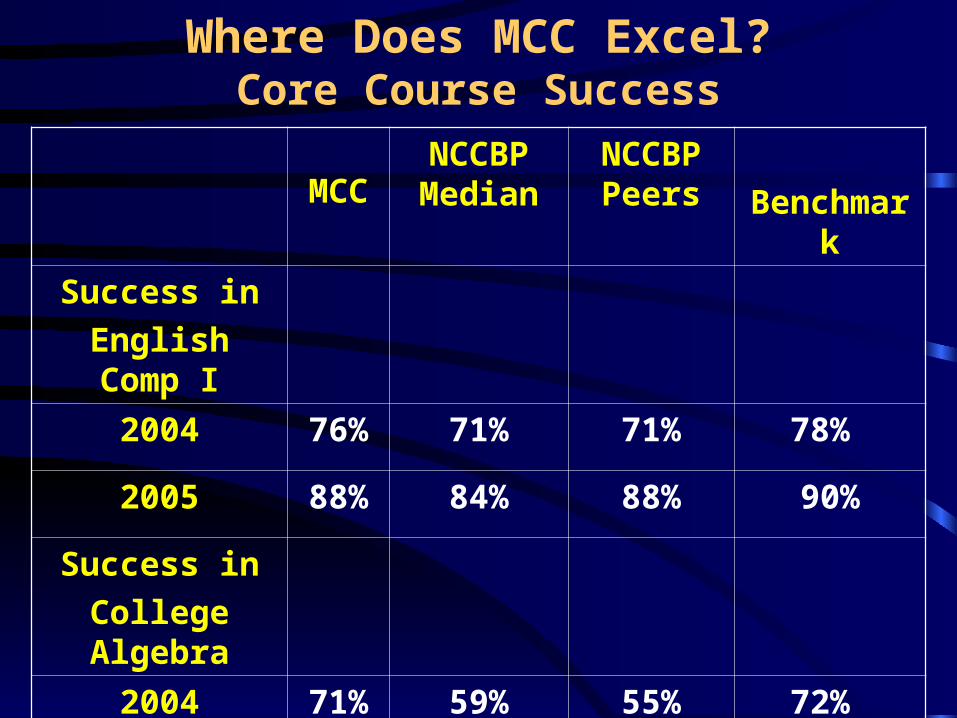
Where Does MCC Excel?Core Course Success
MCCNCCBP Median
NCCBP Peers Benchmark
Success in
English Comp I
2004 76% 71% 71% 78%
2005 88% 84% 88% 90%
Success in
College Algebra
2004 71% 59% 55% 72%
2005 84% 73% 83% 86%
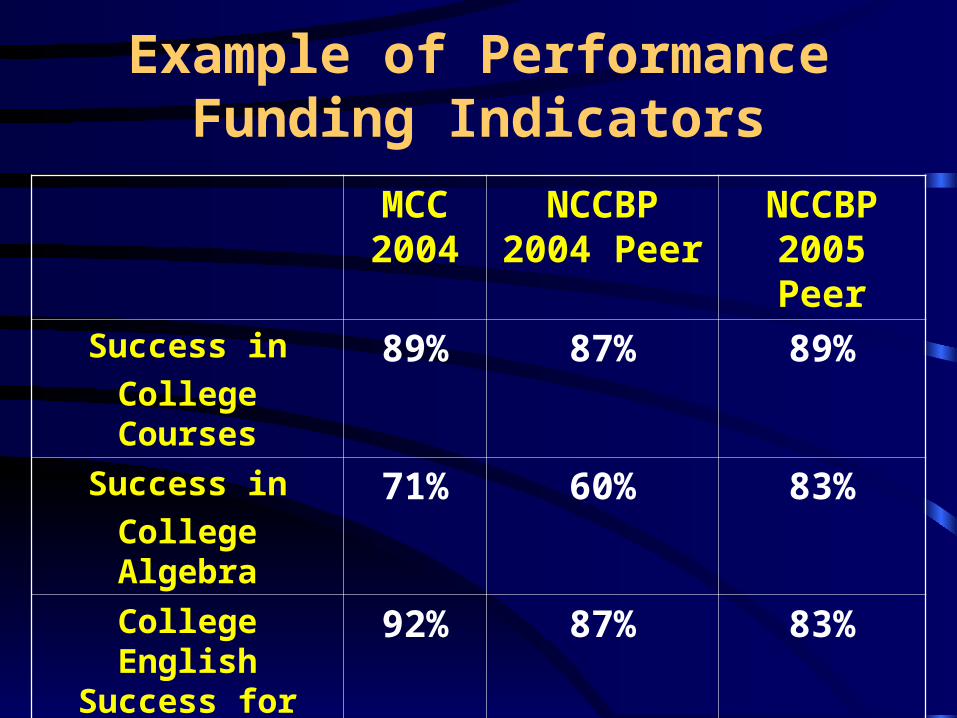
Example of Performance Funding Indicators
MCC 2004
NCCBP 2004 Peer
NCCBP 2005 Peer
Success in
College Courses89% 87% 89%
Success in
College Algebra71% 60% 83%
College English Success for DSP
Students
92% 87% 83%
GPA at
Transfer Institution2.72 2.90 2.91
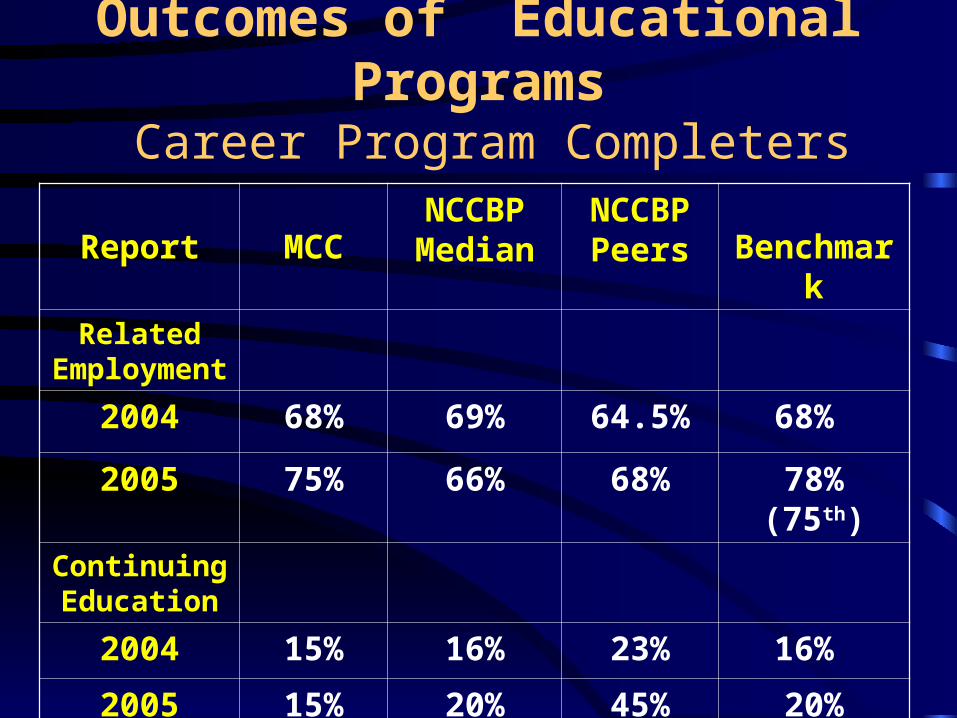
Outcomes of Educational Programs Career Program Completers
Report MCCNCCBP Median
NCCBP Peers Benchmark
Related Employment
2004 68% 69% 64.5% 68%
2005 75% 66% 68% 78% (75th)
Continuing Education
2004 15% 16% 23% 16%
2005 15% 20% 45% 20% (mdn)
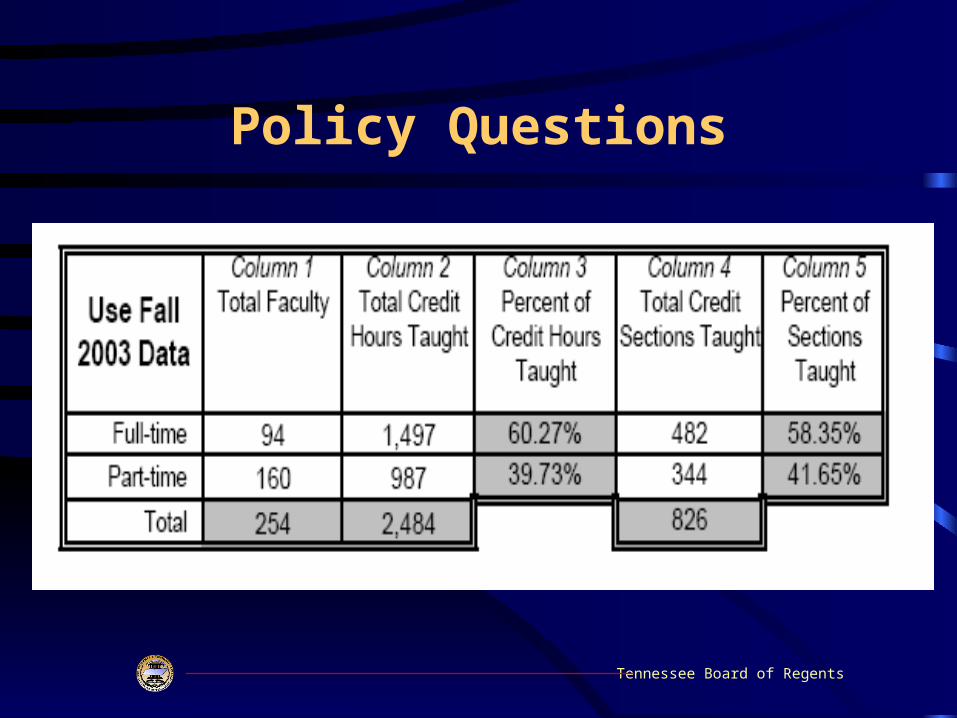
Policy Questions
Tennessee Board of Regents

Questions