Embed Size (px)
Citation preview
Benchmarking Financial Performance and Key Ratios
Kelly DiGiacomo, Steel Founders’ Society of America
2
Top Steel Foundry Trends To Notice During the Presentation Net worth increase Liquidity increase Quicker trade receivables turnover Quicker inventory turnover Quicker trade payables turnover Officers’, directors’, & owners’ compensation
trends
3
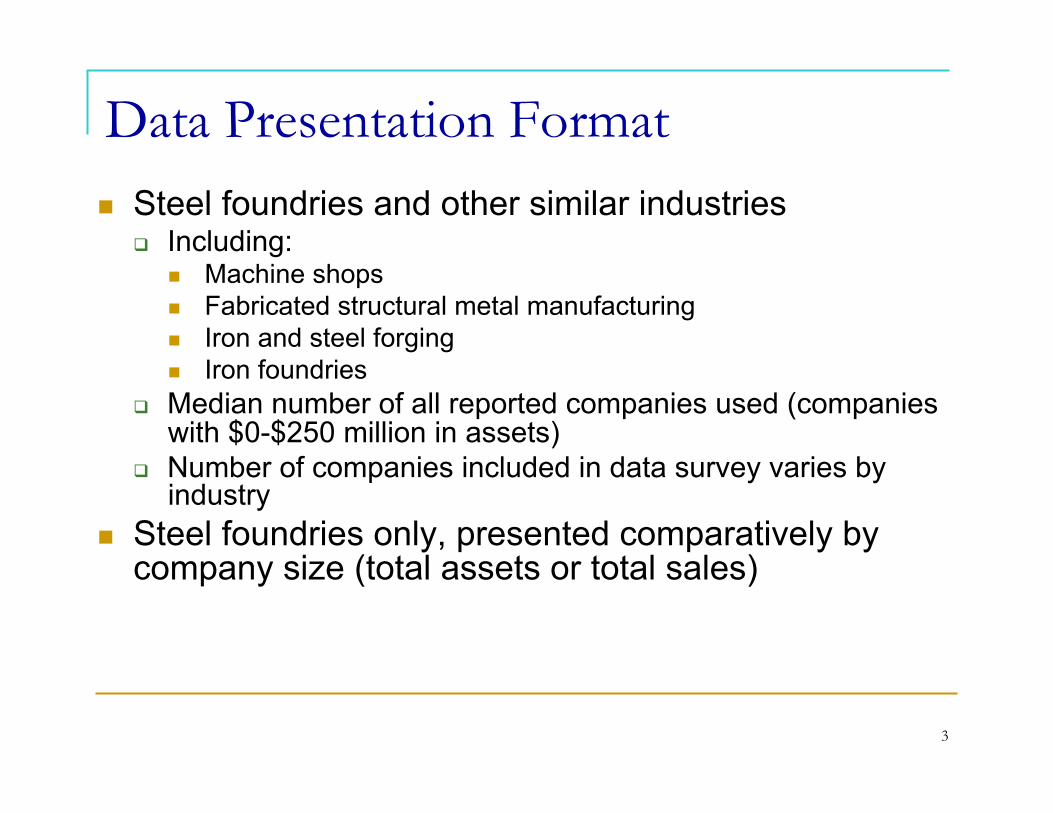
Data Presentation Format Steel foundries and other similar industries
Including: Machine shops Fabricated structural metal manufacturing Iron and steel forging Iron foundries
Median number of all reported companies used (companies with $0-$250 million in assets)
Number of companies included in data survey varies by industry
Steel foundries only, presented comparatively by company size (total assets or total sales)
4
Liquidity Ratios
5
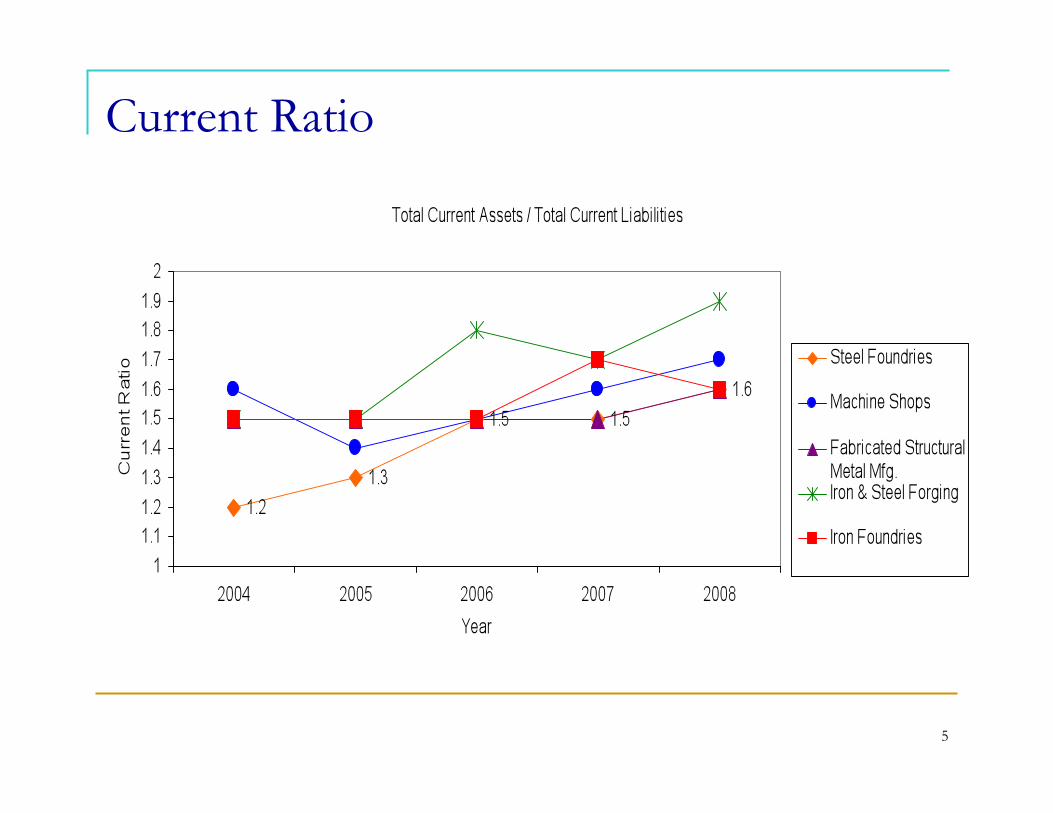
Current Ratio
6
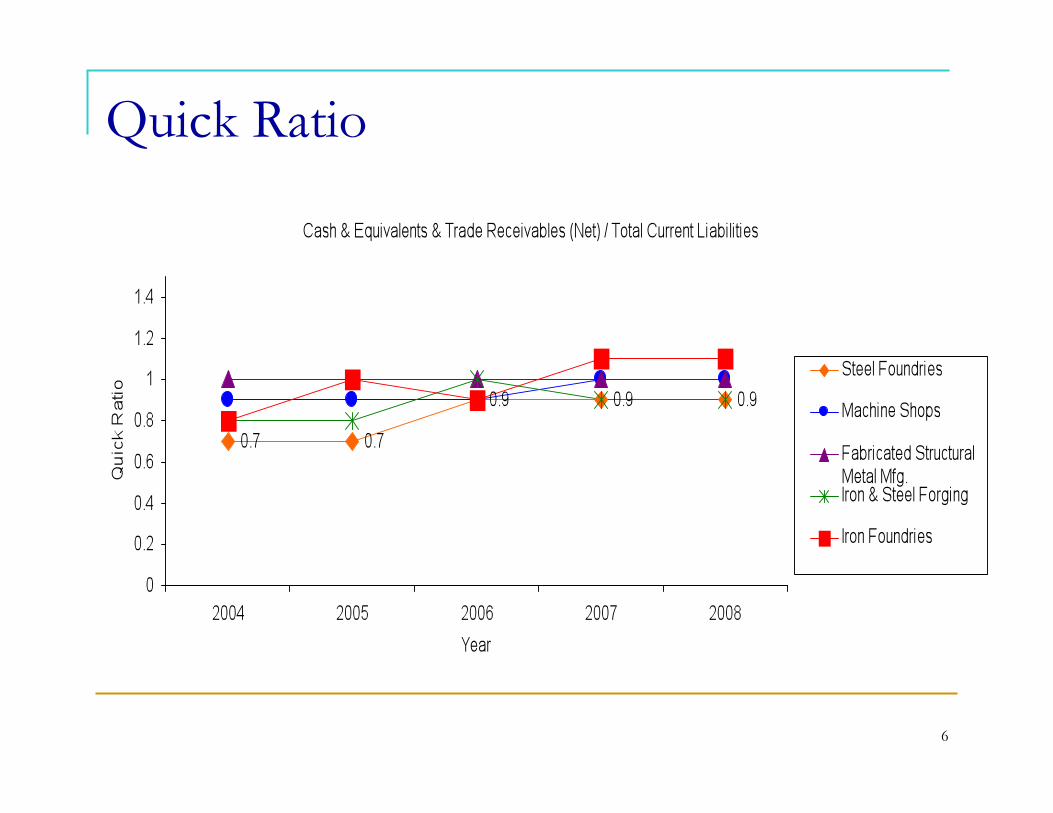
Quick Ratio
7
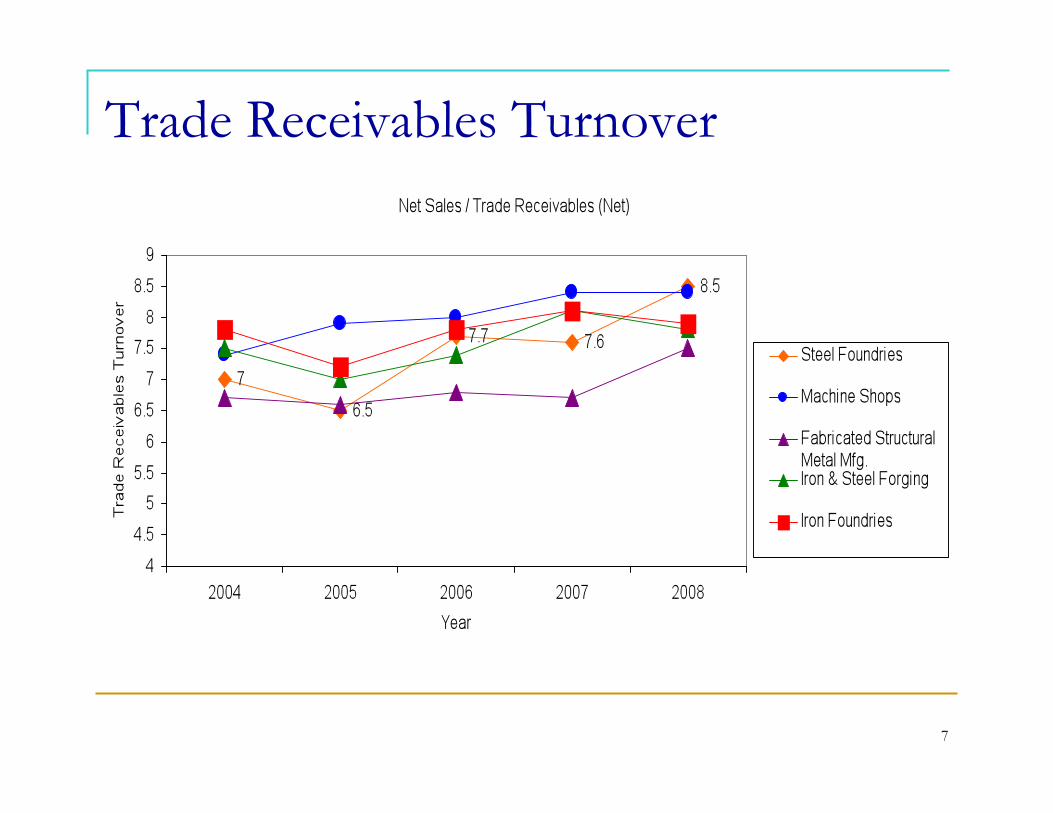
Trade Receivables Turnover
8
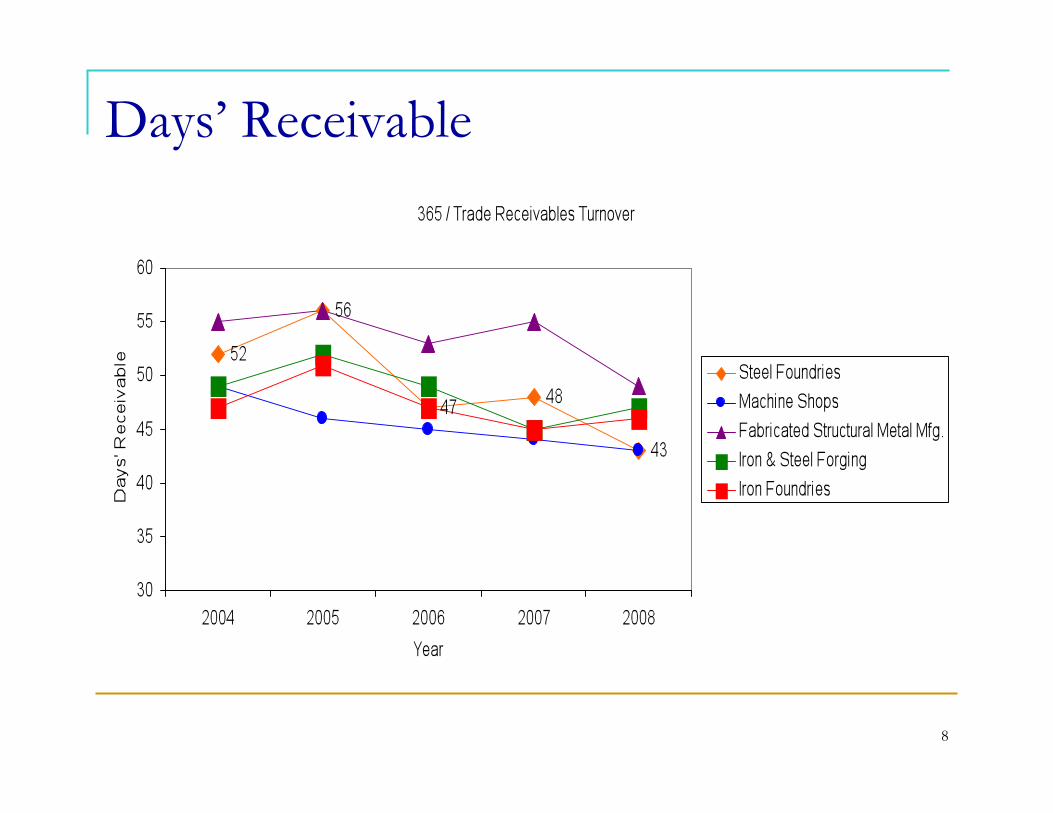
Days’ Receivable
9
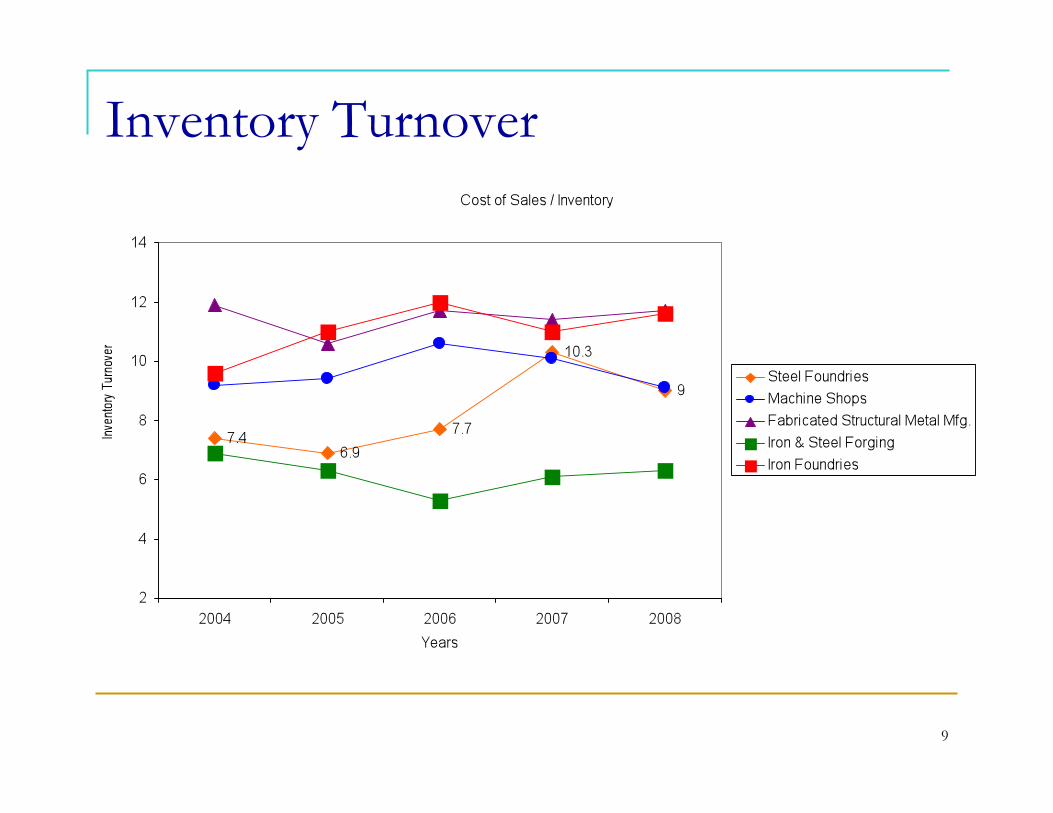
Inventory Turnover
10
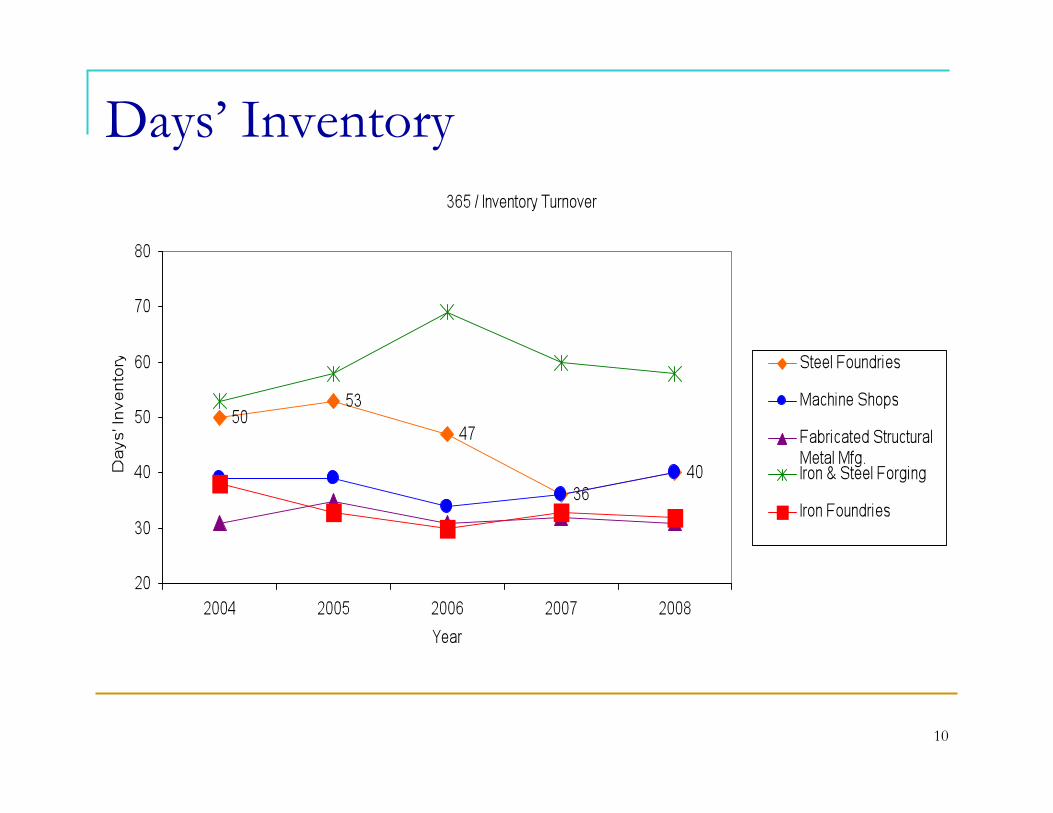
Days’ Inventory
11
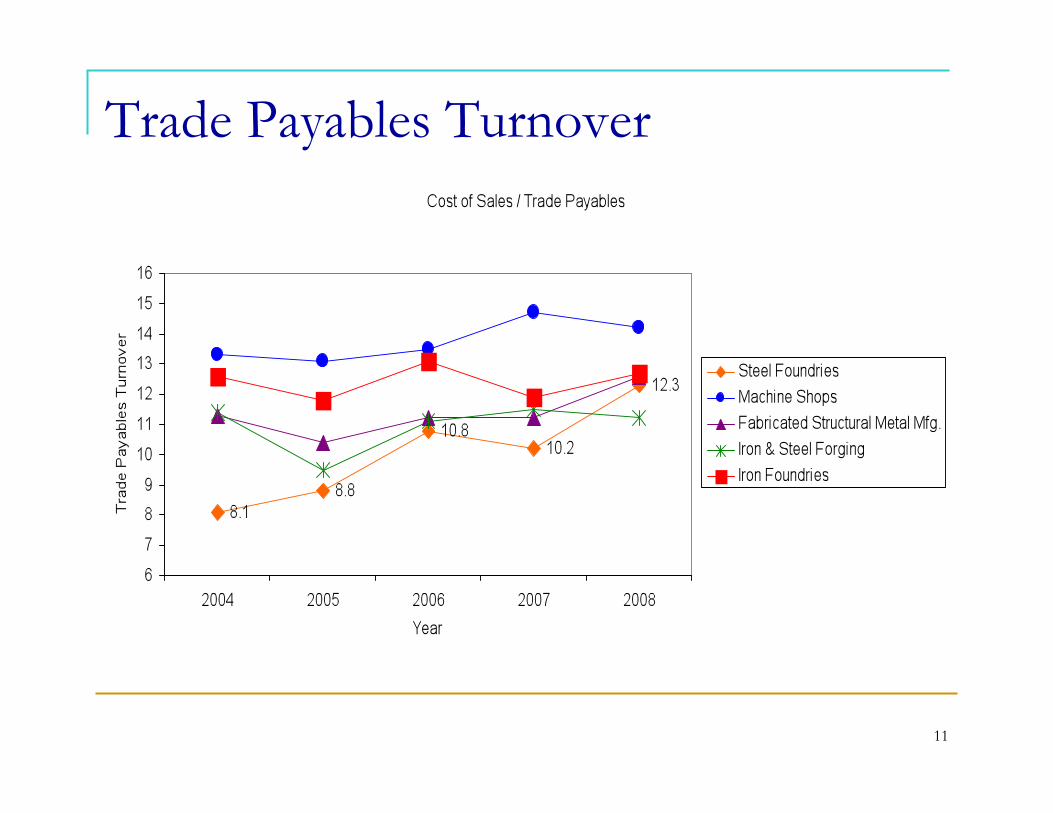
Trade Payables Turnover
12
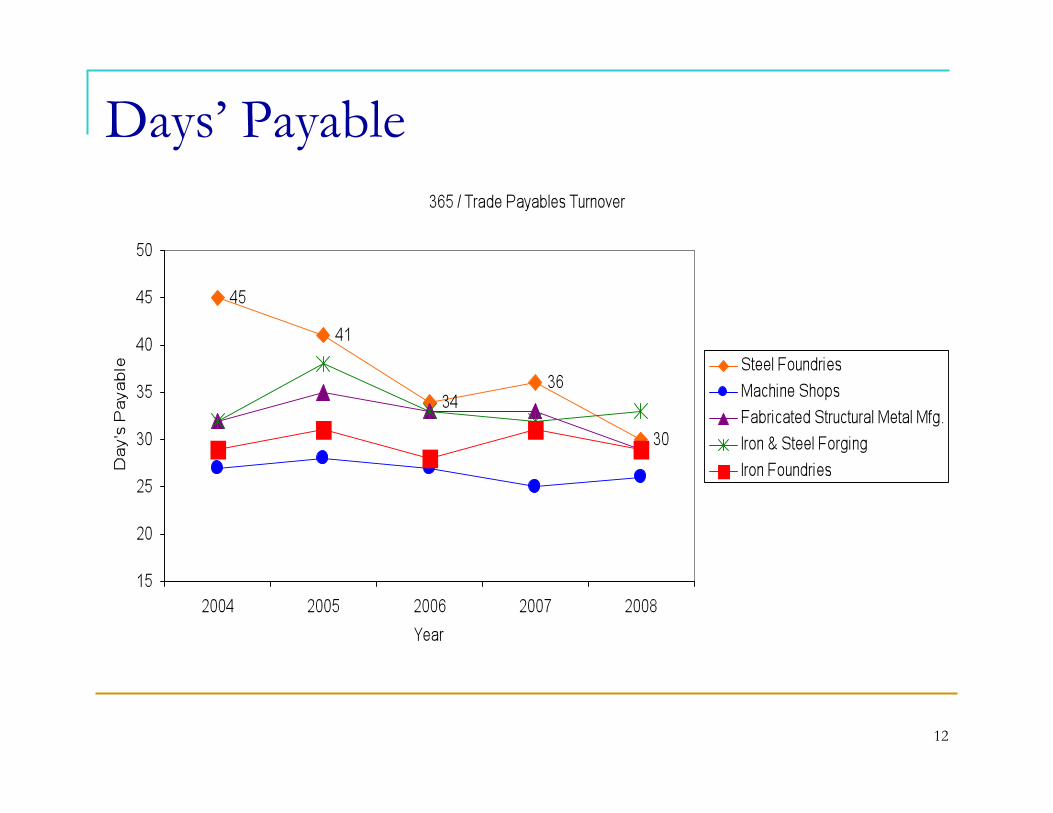
Days’ Payable
13
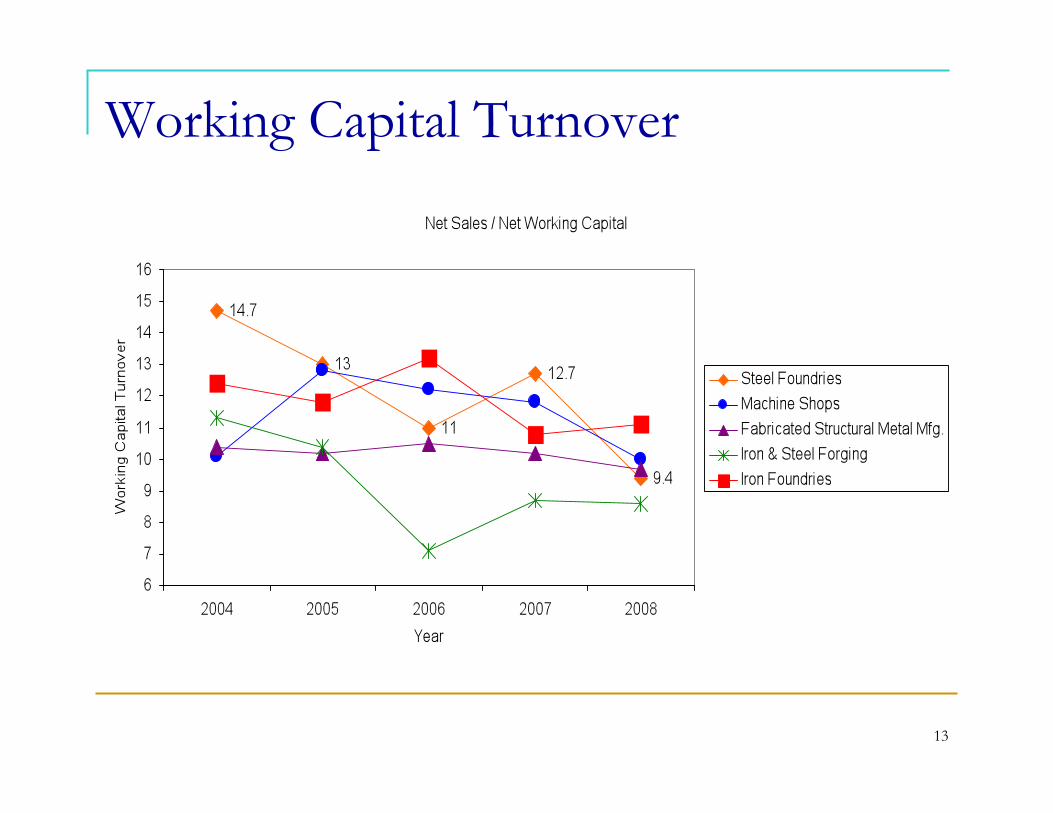
Working Capital Turnover
14
Leverage Ratios
15
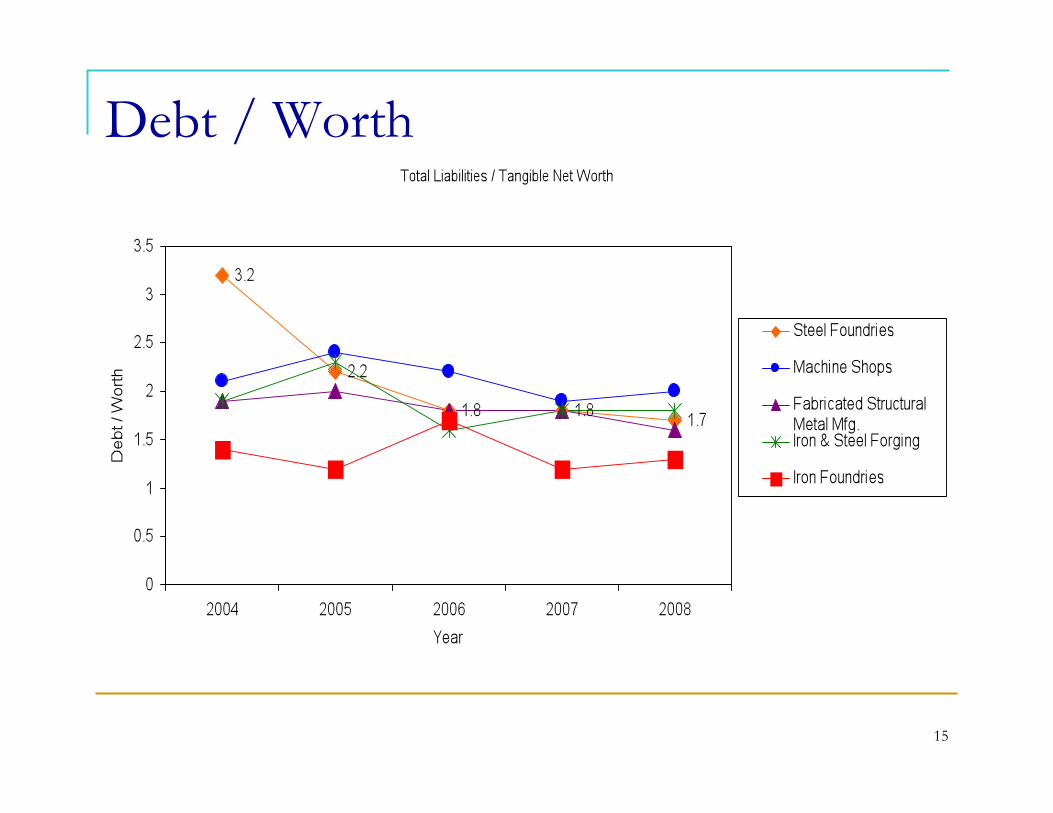
Debt / Worth
16
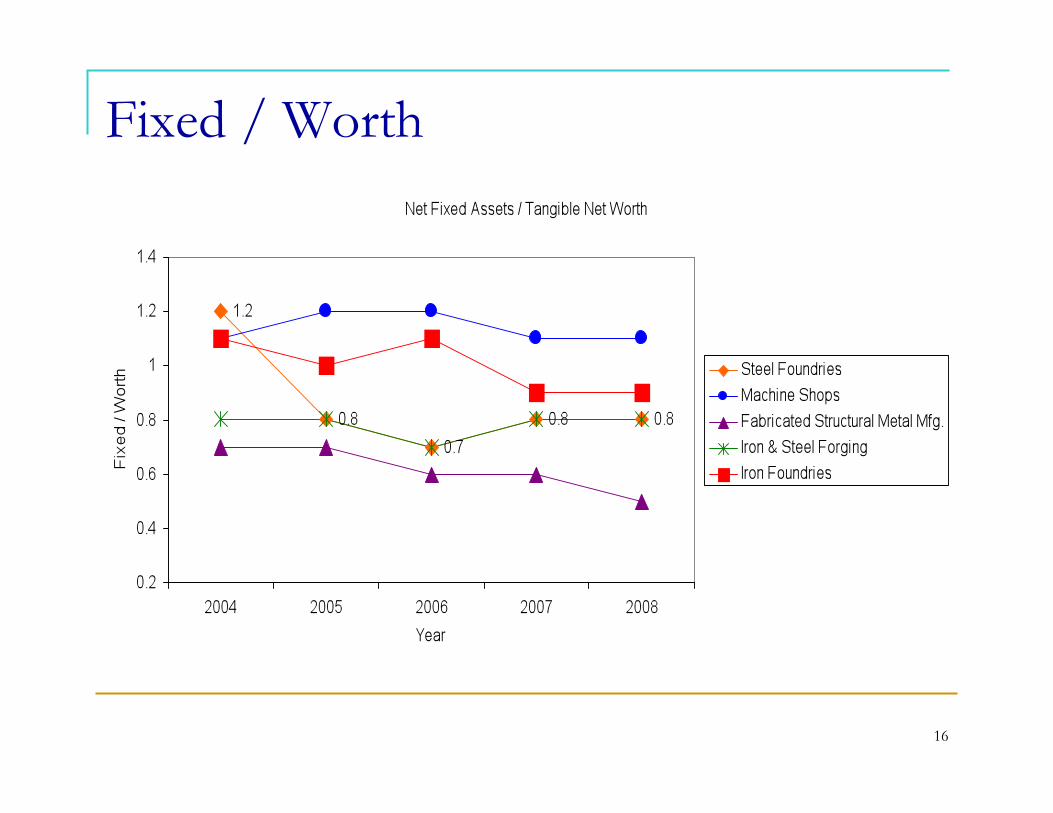
Fixed / Worth
17
Operating Ratios
18
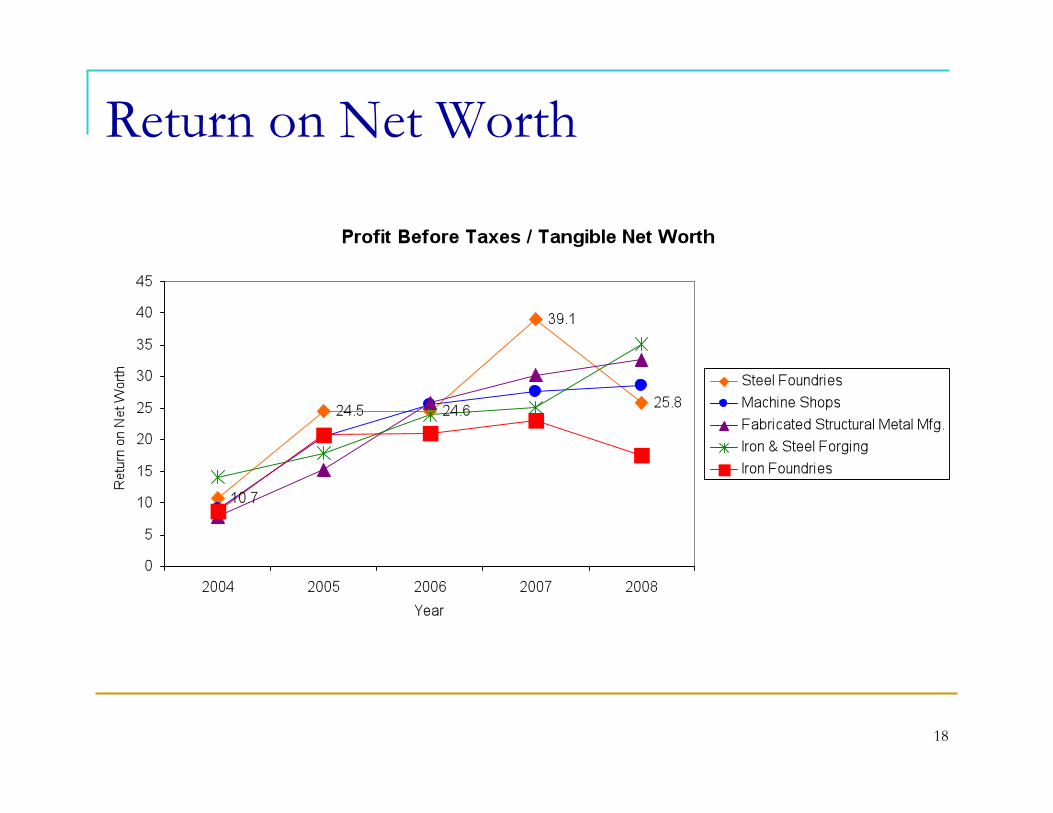
Return on Net Worth
19
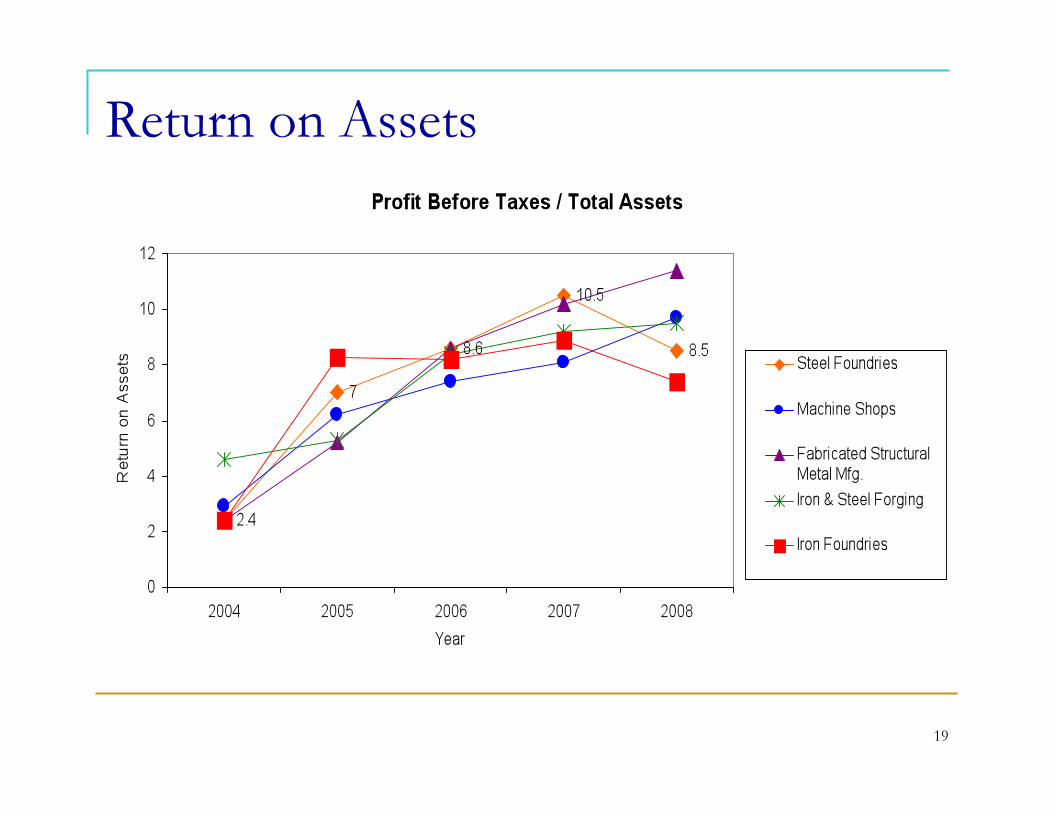
Return on Assets
20
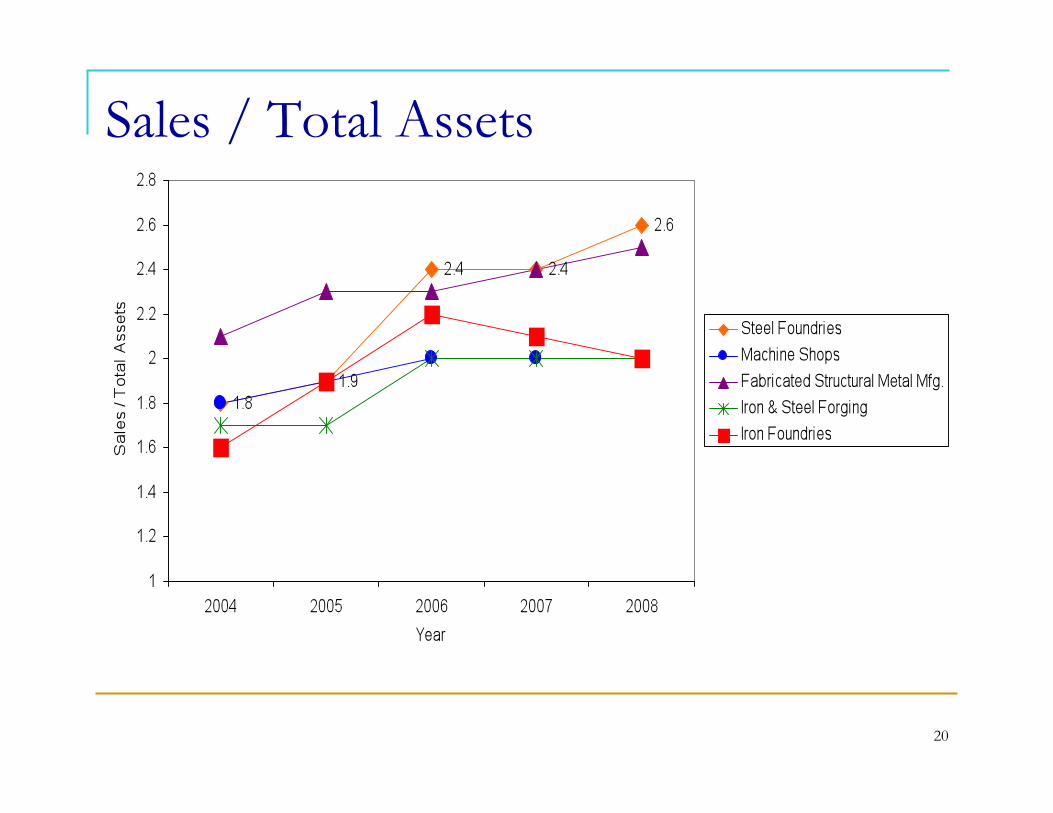
Sales / Total Assets
21
Expense to Sales Ratio
22
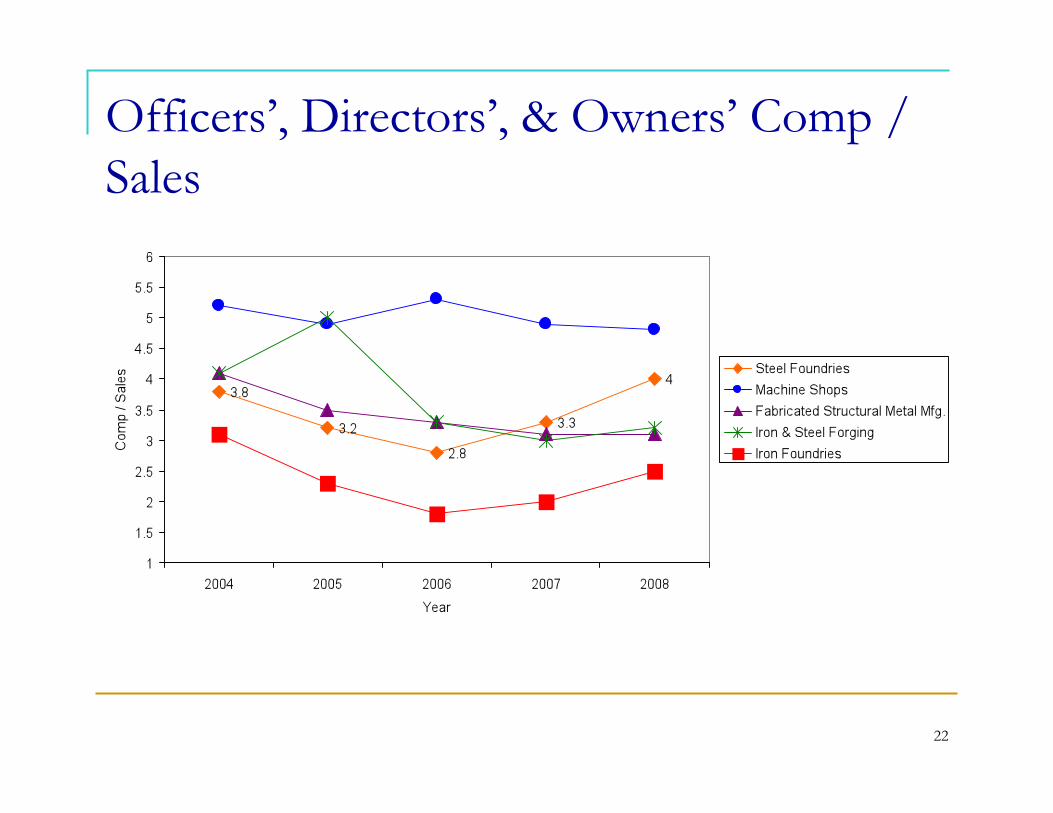
Officers’, Directors’, & Owners’ Comp / Sales
23
Ratio Variances Within Different Size Steel Foundries
24
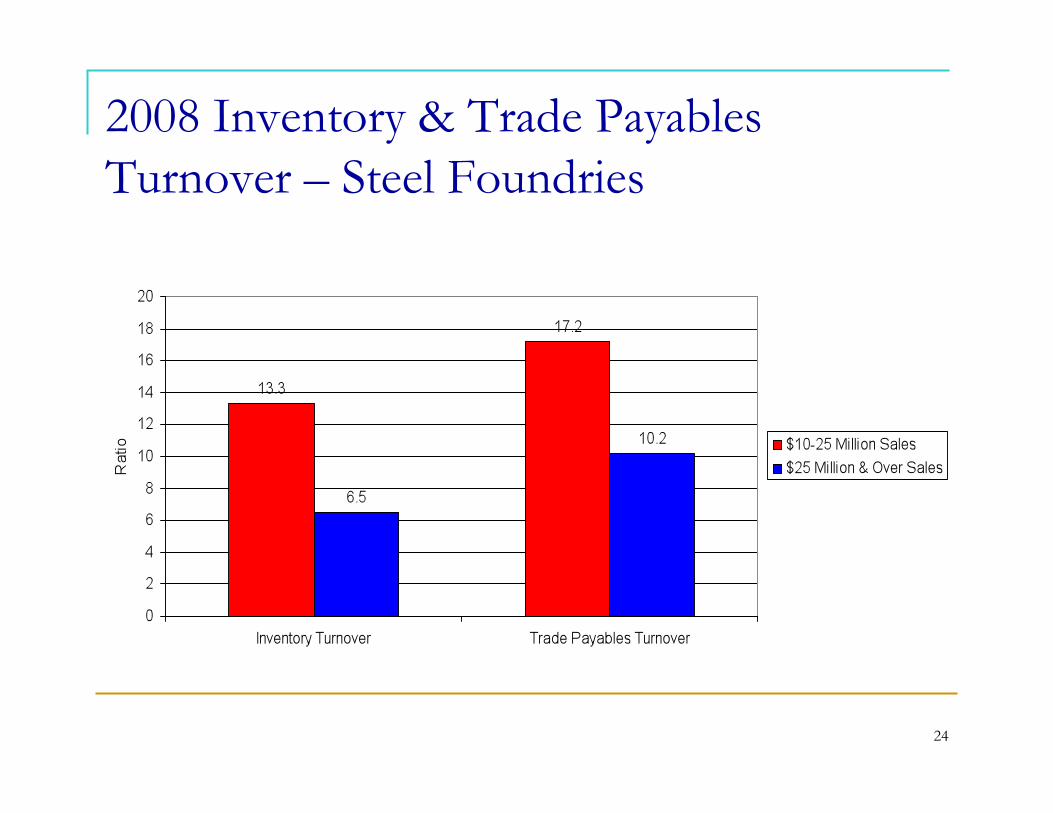
2008 Inventory & Trade Payables Turnover – Steel Foundries
25
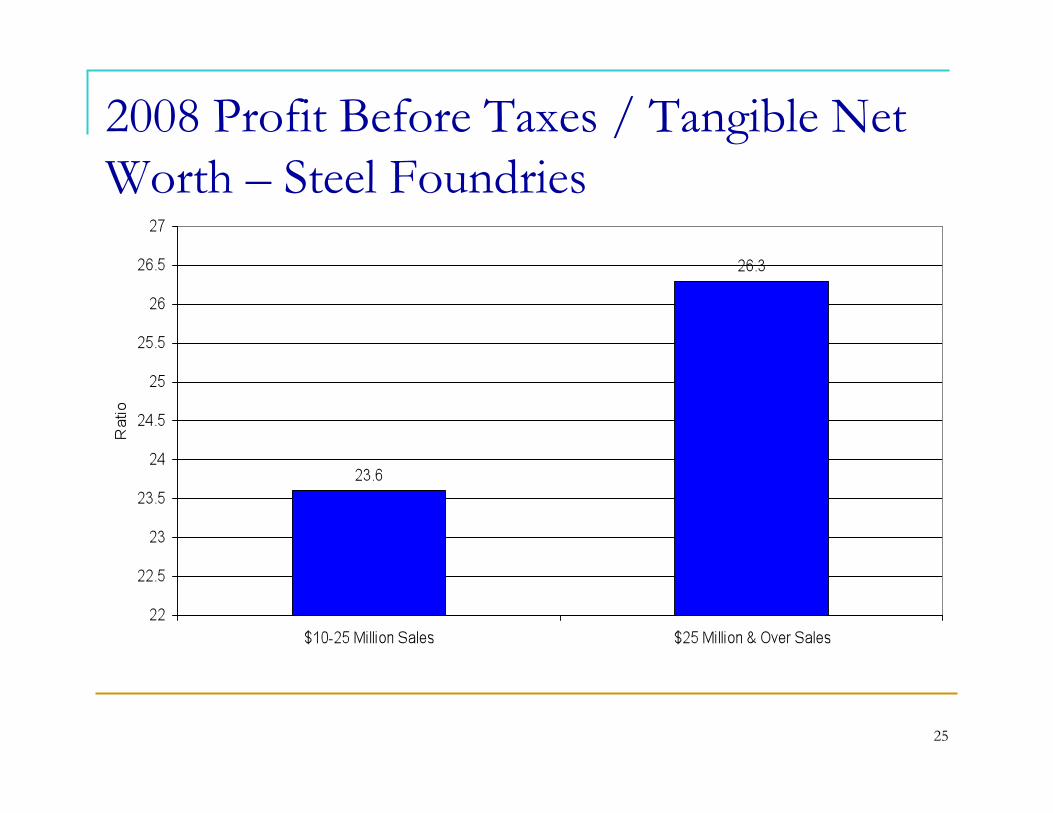
2008 Profit Before Taxes / Tangible Net Worth – Steel Foundries
26
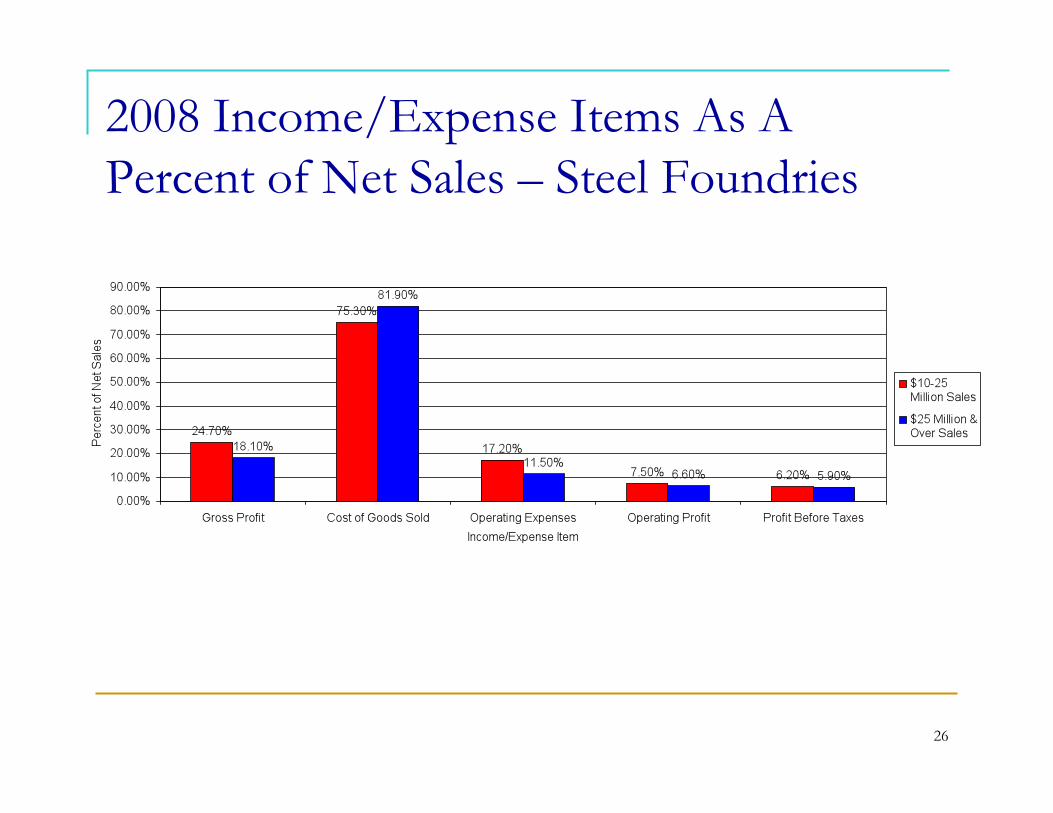
2008 Income/Expense Items As A Percent of Net Sales – Steel Foundries
27
Financial Statement Break-Downs Steel Foundries
28
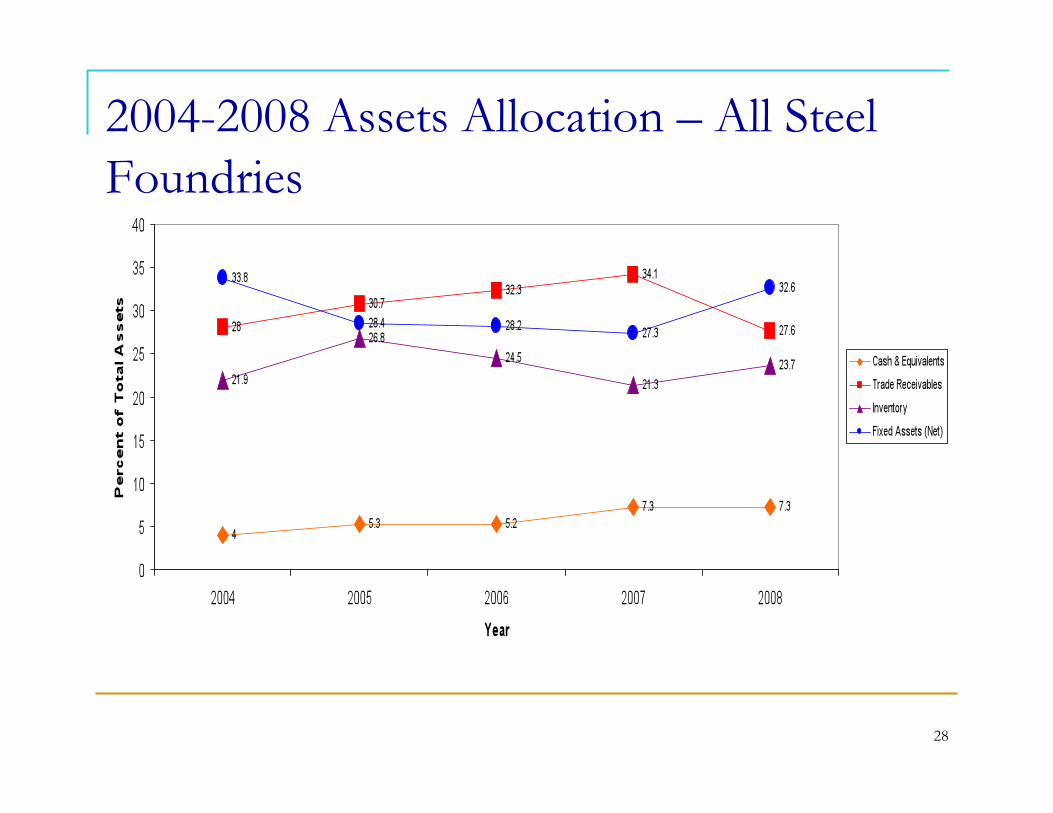
2004-2008 Assets Allocation – All Steel Foundries
29
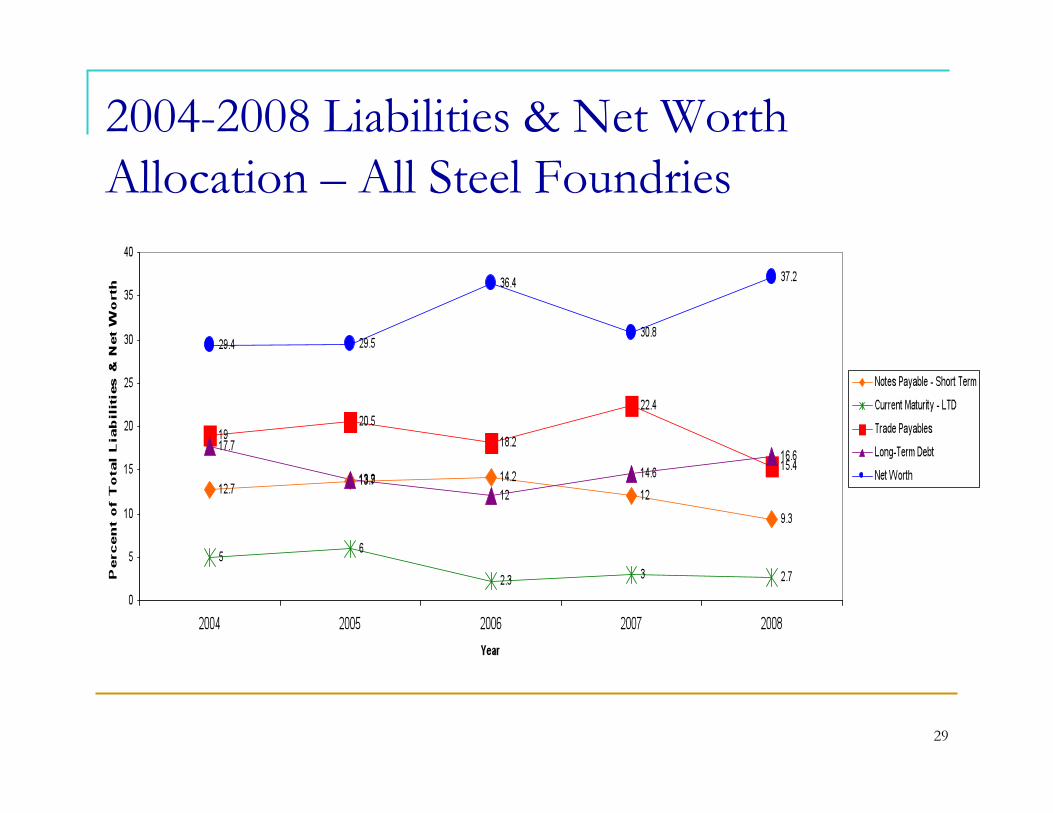
2004-2008 Liabilities & Net Worth Allocation – All Steel Foundries
30
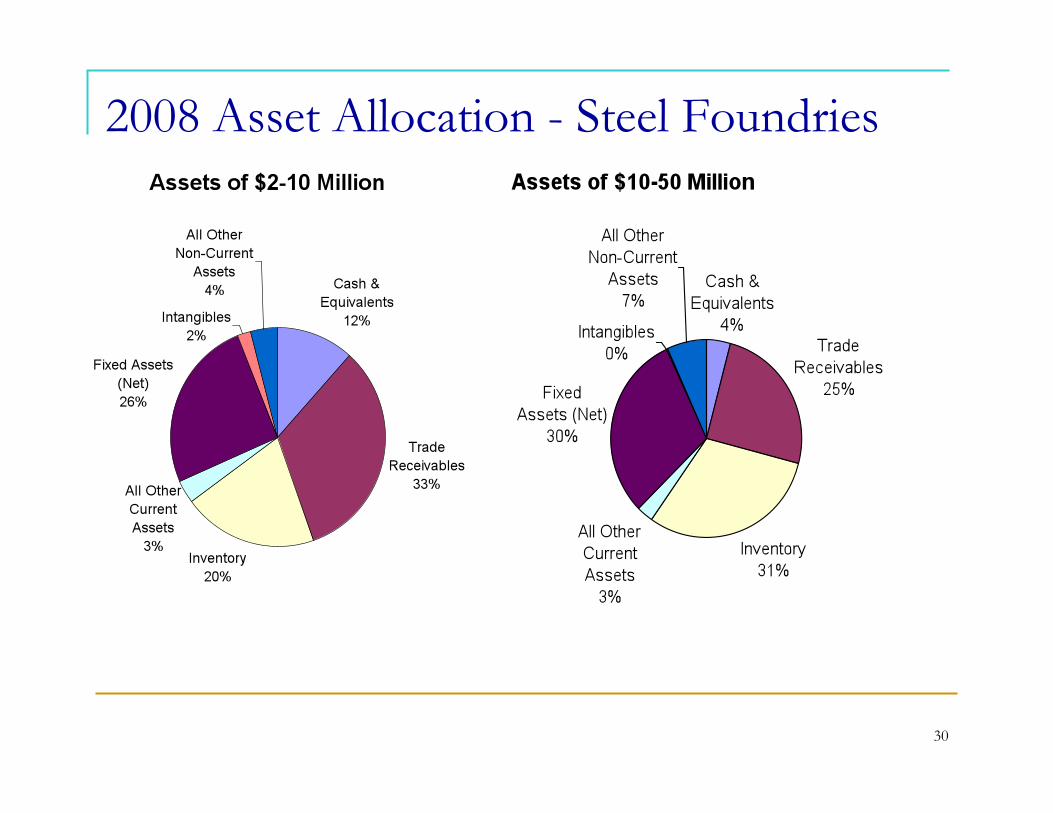
2008 Asset Allocation - Steel Foundries
31
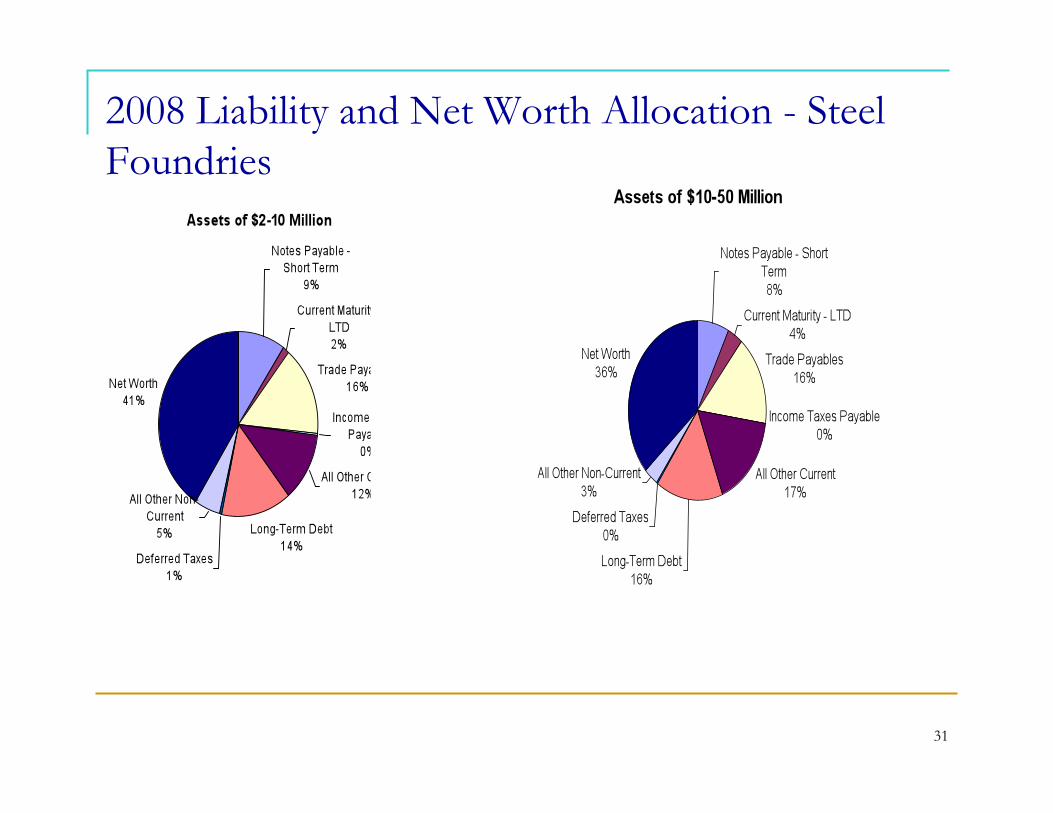
2008 Liability and Net Worth Allocation - Steel Foundries
32
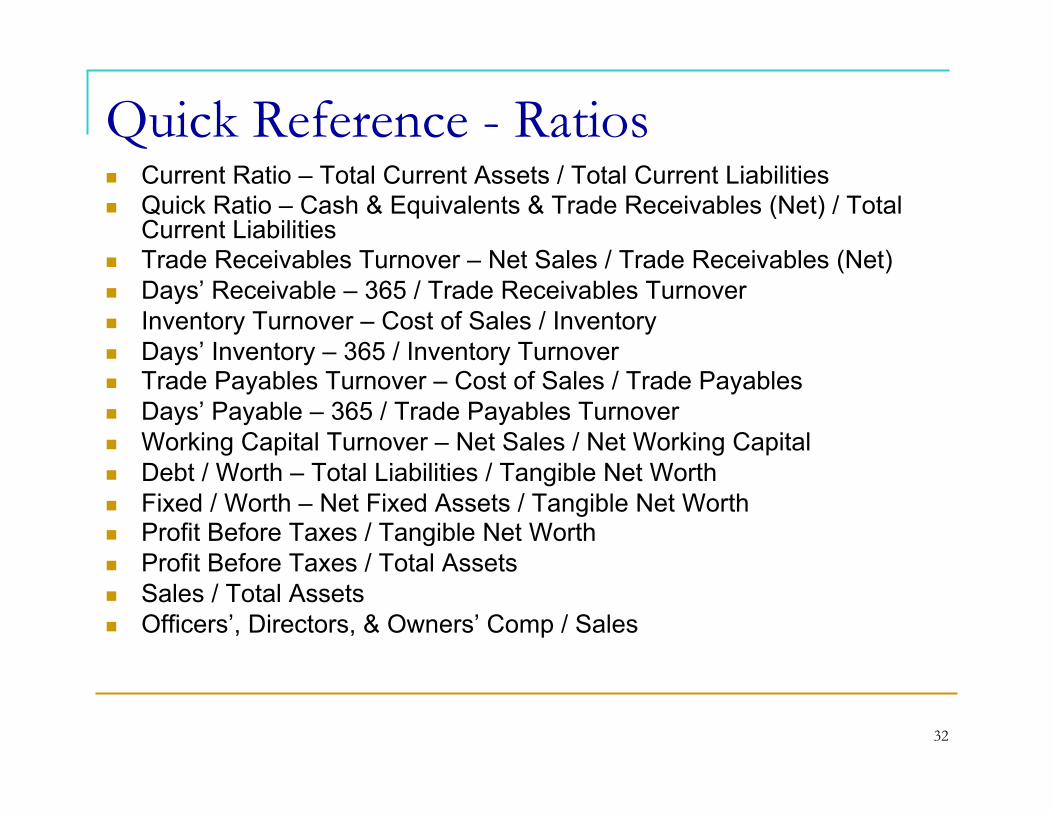
Quick Reference - Ratios Current Ratio – Total Current Assets / Total Current Liabilities Quick Ratio – Cash & Equivalents & Trade Receivables (Net) / Total
Current Liabilities Trade Receivables Turnover – Net Sales / Trade Receivables (Net) Days’ Receivable – 365 / Trade Receivables Turnover Inventory Turnover – Cost of Sales / Inventory Days’ Inventory – 365 / Inventory Turnover Trade Payables Turnover – Cost of Sales / Trade Payables Days’ Payable – 365 / Trade Payables Turnover Working Capital Turnover – Net Sales / Net Working Capital Debt / Worth – Total Liabilities / Tangible Net Worth Fixed / Worth – Net Fixed Assets / Tangible Net Worth Profit Before Taxes / Tangible Net Worth Profit Before Taxes / Total Assets Sales / Total Assets Officers’, Directors, & Owners’ Comp / Sales
33
Data Source Annual Statement Studies Financial Ratio Benchmarks 2008 2009 Version Risk Management Association