Embed Size (px)
Citation preview
SpaBenchmark Survey reportJanuary-March, 2010

Ernst & Young Spa Benchmark Survey
We are pleased to share with you here the results of Ernst & Young’s spa benchmarking survey for first quarter 2010.
Per detailed year-end analysis for 2009, hotel spas showed a strong performance at the end of the year. This positive trend for Dubai hotel spa performance appears to continue through Q1 2010. We invite you to turn the page for more detailed analyses.
This report tracks and compiles the performance of leading Dubai 5-star hotel spas, and the results are presented on a monthly and year-to-date basis in UAE Dirhams and US Dollars. Inside the pages of the report, we track ten key metrics, designed to calculate specific spa operational performance. Some of these metrics are in use internally at spas, while some others are recommended due to their commonality across different types of spas to allow for benchmarking.
This monthly Spa Benchmark Survey has been started as an additional service to the hospitality sector to complement our ongoing monthly Middle East Hotel Benchmark Survey. The EY Hotel Benchmark Survey presently comprises key performance indicators from within major cities and resorts all across the Middle East and North Africa region, and is now in its sixth successful year.
We are confident that the Spa Benchmarking Survey will replicate the success of our Hotel Benchmarking Survey; and both the reports in tandem will provide hotel/ spa operators, owners/ investors and developers alike with invaluable information which can profitably drive their management and investment decisions.
As always, we would like to gratefully thank all of our data partners who have kindly and generously contributed their time and expertise for detailed brainstorming discussions during the development process of this new initiative; and shared their spa performance data to allow for the creation of this report. Your invaluable support, encouragement and continued participation are greatly appreciated.
We thank you for your patronage to date – and look forward to hearing your thoughts.
Sincerely,
Paul Arnold Principal Head of Transaction Real Estate Advisory Services- Middle East Ernst & Young
DisclaimerThe Spa Benchmark Survey was developed and is maintained by Ern st & Young’s Dubai office under the direction of Paul Arnold, Principal of the Transaction Real Estate Advisory Services division. It is intended for informational use only. The reader should consult his or her professional investment advisor, attorney, or accountant before making any decision or taking any action based upon the information presented in this document. Benchmark data is provided by individual hotel/spa companies.
While we believe the data collected is reliable, Ernst & Young has not performed an audit or review of the information gathered and does not express an opinion or any form of assurance on the accuracy of such information. This report is also proprietary of Ernst & Young and no part of this report, in whole or in part, may be reproduced or transmitted without written consent of Ernst & Young. All requests to reproduce this information must be addressed to [email protected]. For information regarding the Spa Benchmark, contact the Dubai office of Ernst & Young at +971 4 332 4000.
2
IntroductionIntroduction

Based on the inputs provided by our data contributors, followed by discussions with spa operators in Dubai, the following are key insights from our survey results:
The positive trend noted in spa performance in last quarter of 2009 continued through • the first quarter of 2010. Aggregate revenues (revenues generated by treatments, retail sales, fitness and related memberships, and other charges) for Dubai hotel spas in Q1 2010 were evidenced to be 45.5% higher than spa revenues in Q1 2009. Spa treatment revenues were approximately 70% higher and number of treatments booked was approximately 62% higher in Q1 2010 as compared to Q1 2009.
Year-to-Date Average Treatment Revenue per Treatment Sold (ATR) stood at AED 372 • for overall Dubai hotel spas in Q1 2010 versus AED 355 in Q1 2009, signifying an approximate 5% upsurge. While spa ATR declined by approximately 3% across overall Dubai hotel spas from January to March in 2009, it increased approximately 4% in 2010 over the same period. Please refer to charts in the year-on-year comparison (Q1 2010 versus Q1 2009) section of this report for more highlights on key improvements this year over previous year.
Given the increased emphasis on operational and business process improvement at • spas this year, trends in Revenue per Available Treatment Room Hour (RevPATH) should be carefully studied as this metric directly opens doors for revenue management techniques. RevPATH can be used for accurate analysis of a spa’s utilization as it allows for fair comparison of varied spa services/ products/ treatments as well as different types of spas by comparing revenue generation over a universal metric – one-hour of time. Year-to-Date RevPATH in Q1 2010 for overall spas came in at AED 77, reflecting a 5.5% increase over the AED 73 RevPATH in 2009 over the same period.
Year-to-Date utilization of treatment room hours for overall Dubai hotel spas was • approximately 25%. Utilization of treatment room hours reflected a marginal improvement of approximately 1pp from January to March.
Year-to-Date utilization of therapists’ hours for overall Dubai hotel spas was 54%, • reflecting a marginal decline of 0.5pp from January to March. However, utilization of therapists’ hours increased by 6.5pp in Q1 2010 compared to Q1 2009, which is indicative of better scheduling and higher staffing efficiencies achieved in the current year.
Year-to-Date percentage split of spa treatments booked by hotel guests versus non-hotel • guests is 61% and 39% respectively. On a monthly basis, the percentage of hotel guests visiting the spa ranged between 60% and 62%, which is higher than the 48% to 58% range witnessed during all the months in 2009.
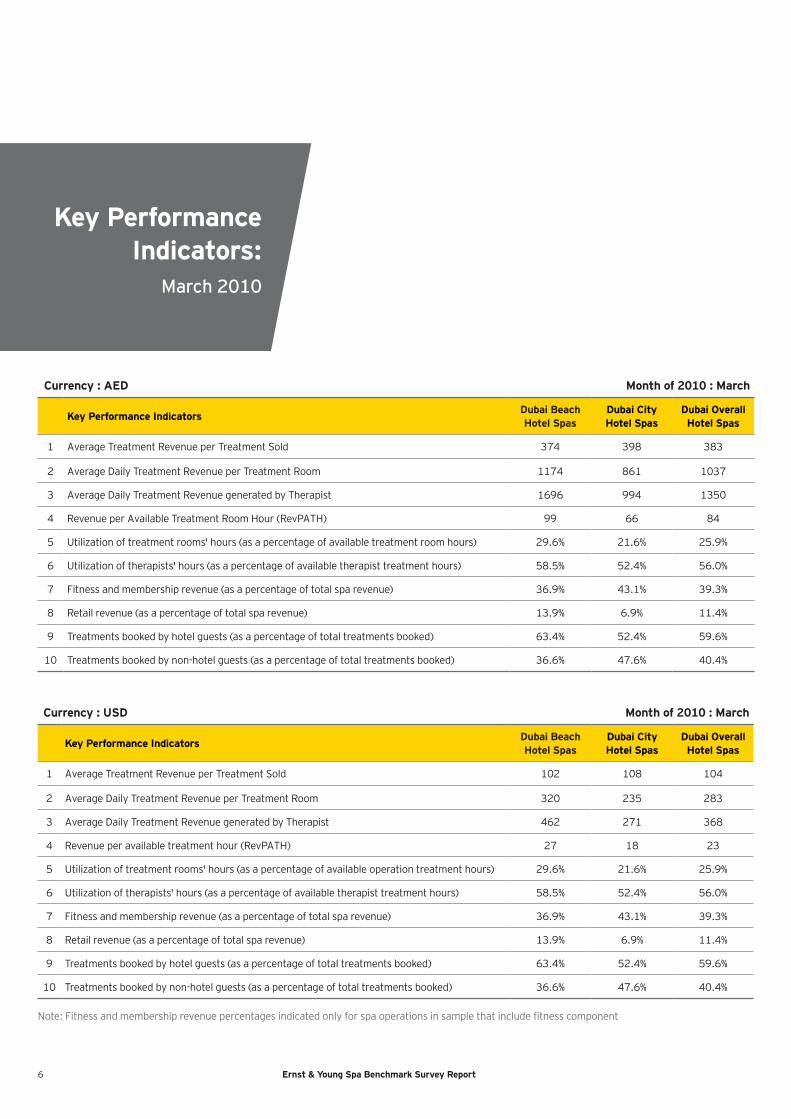
Year-to-Date retail revenue component of the total spa revenue stood at 10.6% for overall • Dubai hotel spas. On a monthly basis for Q1 2010, retail revenue percent contribution to total spa revenue was consistently lower at city hotel spas than beach hotel spas. The retail spend per booking increased approximately 13% from AED 54 in January to AED 61 in March for overall Dubai hotel spas. Retail sales remain an under-exploited component of spa operations. With improvements in spa performance in the last two quarters, it would benefit spa operators to apply increased attention to sales efforts with the goal of maximizing profits from this high-margin revenue stream this year.
Per feedback and request from data spa partners, in addition to monthly averages for • performance of beach and city hotel spas, we have illustrated the spread between highest and lowest performers in the market. The objective is to provide deeper insights into market trends so as to aid spa operators’ internal analyses and decision-making. Please refer to charts in the trends (Q1 2010) section of this report.
3Ernst & Young Spa Benchmark Survey Report
Key Insights

4 Ernst & Young Spa Benchmark Survey Report
Key Performance Indicators:
January 2010
Currency : AED Month of 2010 : January
Key Performance Indicators Dubai Beach Hotel Spas
Dubai City Hotel Spas
Dubai Overall Hotel Spas
1 Average Treatment Revenue per Treatment Sold 371 363 368
2 Average Daily Treatment Revenue per Treatment Room 961 757 873
3 Average Daily Treatment Revenue generated by Therapist 1405 938 1185
4 Revenue per Available Treatment Room Hour (RevPATH) 82 59 72
5 Utilization of treatment rooms' hours (as a percentage of available treatment room hours) 26.2% 21.0% 23.9%
6 Utilization of therapists' hours (as a percentage of available therapist treatment hours) 57.4% 50.9% 54.5%
7 Fitness and membership revenue (as a percentage of total spa revenue) 30.7% 41.9% 35.8%
8 Retail revenue (as a percentage of total spa revenue) 12.7% 7.5% 10.7%
9 Treatments booked by hotel guests (as a percentage of total treatments booked) 67.5% 53.9% 62.4%
10 Treatments booked by non-hotel guests (as a percentage of total treatments booked) 32.5% 46.1% 37.6%
Currency : USD Month of 2010 : January
Key Performance Indicators Dubai Beach Hotel Spas
Dubai City Hotel Spas
Dubai Overall Hotel Spas
1 Average Treatment Revenue per Treatment Sold 101 99 100
2 Average Daily Treatment Revenue per Treatment Room 262 206 238
3 Average Daily Treatment Revenue generated by Therapist 383 256 323
4 Revenue per available treatment hour (RevPATH) 22 16 20
5 Utilization of treatment rooms' hours (as a percentage of available operation treatment hours) 26.2% 21.0% 23.9%
6 Utilization of therapists' hours (as a percentage of available therapist treatment hours) 57.4% 50.9% 54.5%
7 Fitness and membership revenue (as a percentage of total spa revenue) 30.7% 41.9% 35.8%
8 Retail revenue (as a percentage of total spa revenue) 12.7% 7.5% 10.7%
9 Treatments booked by hotel guests (as a percentage of total treatments booked) 67.5% 53.9% 62.4%
10 Treatments booked by non-hotel guests (as a percentage of total treatments booked) 32.5% 46.1% 37.6%
Note: Fitness and membership revenue percentages indicated only for spa operations in sample that include fitness component

5Ernst & Young Spa Benchmark Survey Report
Key Performance Indicators: February 2010
Currency : AED Month of 2010 : February
Key Performance Indicators Dubai Beach Hotel Spas
Dubai City Hotel Spas
Dubai Overall Hotel Spas
1 Average Treatment Revenue per Treatment Sold 348 393 365
2 Average Daily Treatment Revenue per Treatment Room 1018 896 965
3 Average Daily Treatment Revenue generated by Therapist 1423 1054 1247
4 Revenue per Available Treatment Room Hour (RevPATH) 79 68 74
5 Utilization of treatment rooms' hours (as a percentage of available treatment room hours) 25.6% 22.1% 24.1%
6 Utilization of therapists' hours (as a percentage of available therapist treatment hours) 55.1% 46.6% 51.3%
7 Fitness and membership revenue (as a percentage of total spa revenue) 33.5% 39.3% 36.1%
8 Retail revenue (as a percentage of total spa revenue) 11.8% 5.9% 9.4%
9 Treatments booked by hotel guests (as a percentage of total treatments booked) 65.6% 50.3% 59.9%
10 Treatments booked by non-hotel guests (as a percentage of total treatments booked) 34.4% 49.7% 40.1%
Currency : USD Month of 2010 : February
Key Performance Indicators Dubai Beach Hotel Spas
Dubai City Hotel Spas
Dubai Overall Hotel Spas
1 Average Treatment Revenue per Treatment Sold 95 107 99
2 Average Daily Treatment Revenue per Treatment Room 277 244 263
3 Average Daily Treatment Revenue generated by Therapist 388 287 340
4 Revenue per available treatment hour (RevPATH) 22 18 20
5 Utilization of treatment rooms' hours (as a percentage of available operation treatment hours) 25.6% 22.1% 24.1%
6 Utilization of therapists' hours (as a percentage of available therapist treatment hours) 55.1% 46.6% 51.3%
7 Fitness and membership revenue (as a percentage of total spa revenue) 33.5% 39.3% 36.1%
8 Retail revenue (as a percentage of total spa revenue) 11.8% 5.9% 9.4%
9 Treatments booked by hotel guests (as a percentage of total treatments booked) 65.6% 50.3% 59.9%
10 Treatments booked by non-hotel guests (as a percentage of total treatments booked) 34.4% 49.7% 40.1%
Note: Fitness and membership revenue percentages indicated only for spa operations in sample that include fitness component
6 Ernst & Young Spa Benchmark Survey Report
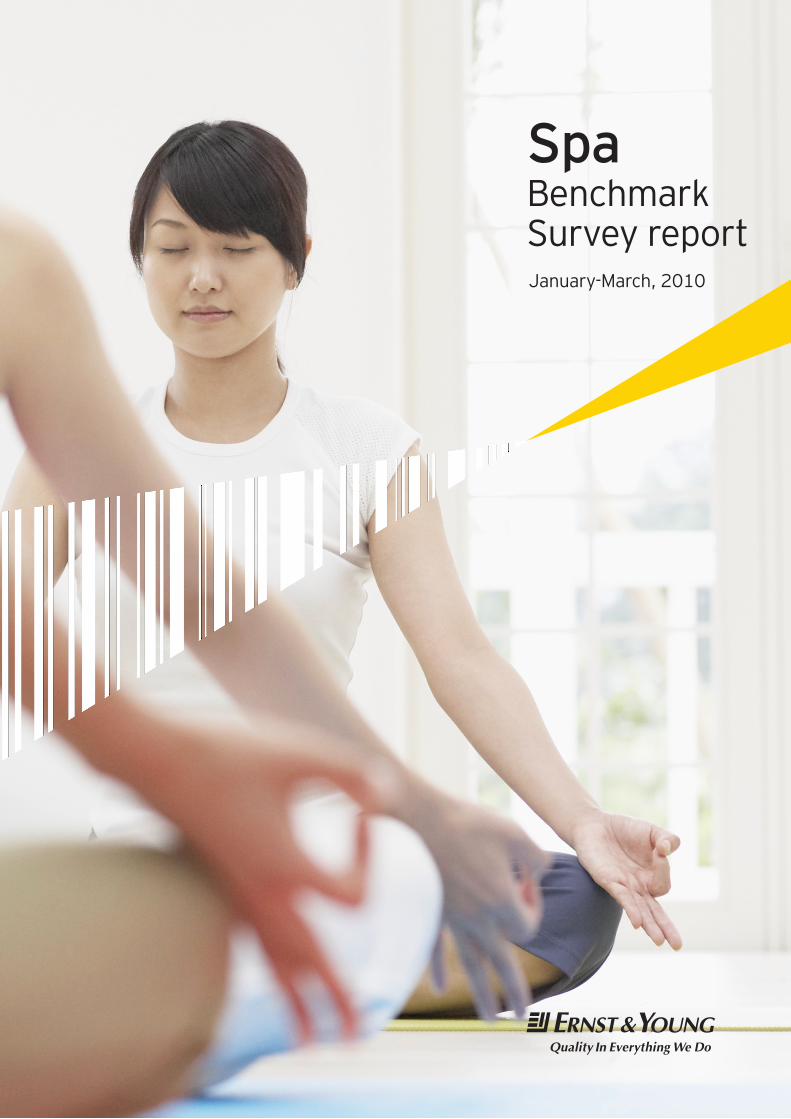
Key Performance Indicators:
March 2010
Currency : AED Month of 2010 : March
Key Performance Indicators Dubai Beach Hotel Spas
Dubai City Hotel Spas
Dubai Overall Hotel Spas
1 Average Treatment Revenue per Treatment Sold 374 398 383
2 Average Daily Treatment Revenue per Treatment Room 1174 861 1037
3 Average Daily Treatment Revenue generated by Therapist 1696 994 1350
4 Revenue per Available Treatment Room Hour (RevPATH) 99 66 84
5 Utilization of treatment rooms' hours (as a percentage of available treatment room hours) 29.6% 21.6% 25.9%
6 Utilization of therapists' hours (as a percentage of available therapist treatment hours) 58.5% 52.4% 56.0%
7 Fitness and membership revenue (as a percentage of total spa revenue) 36.9% 43.1% 39.3%
8 Retail revenue (as a percentage of total spa revenue) 13.9% 6.9% 11.4%
9 Treatments booked by hotel guests (as a percentage of total treatments booked) 63.4% 52.4% 59.6%
10 Treatments booked by non-hotel guests (as a percentage of total treatments booked) 36.6% 47.6% 40.4%
Currency : USD Month of 2010 : March
Key Performance Indicators Dubai Beach Hotel Spas
Dubai City Hotel Spas
Dubai Overall Hotel Spas
1 Average Treatment Revenue per Treatment Sold 102 108 104
2 Average Daily Treatment Revenue per Treatment Room 320 235 283
3 Average Daily Treatment Revenue generated by Therapist 462 271 368
4 Revenue per available treatment hour (RevPATH) 27 18 23
5 Utilization of treatment rooms' hours (as a percentage of available operation treatment hours) 29.6% 21.6% 25.9%
6 Utilization of therapists' hours (as a percentage of available therapist treatment hours) 58.5% 52.4% 56.0%
7 Fitness and membership revenue (as a percentage of total spa revenue) 36.9% 43.1% 39.3%
8 Retail revenue (as a percentage of total spa revenue) 13.9% 6.9% 11.4%
9 Treatments booked by hotel guests (as a percentage of total treatments booked) 63.4% 52.4% 59.6%
10 Treatments booked by non-hotel guests (as a percentage of total treatments booked) 36.6% 47.6% 40.4%
Note: Fitness and membership revenue percentages indicated only for spa operations in sample that include fitness component
Year-on-year comparison
Q1 2010 vs. Q1 2009

7Ernst & Young Spa Benchmark Survey Report
Key InsightsYear-on-year
comparisonQ1 2010 vs. Q1 2009
Aggregate Spa Revenue (AED)
Average Treatment Revenue per Treatment Sold (AED)
0
5,000,000
10,000,000
15,000,000
20,000,000
Jan Feb Mar YTD
2010 Overall Total Spa Revenue 2009 Overall Total Spa Revenue
368365
383
372
361357
349
355
320
340
360
380
400
Jan Feb Mar YTD
2010 ATR 2009 ATR

8 Ernst & Young Spa Benchmark Survey Report
72
74
84
77
7372
7573
65
70
75
80
85
Jan Feb Mar YTD
2010 Overall RevPATH 2009 Overall RevPATH
Year-on-year comparison
Q1 2010 vs. Q1 2009
Revenue per Available Treatment Room Hours (AED)
Number of Treatments Booked
10,081 10,06811,513
31,662
6,570 5,9447,042
19,556
0
5,000
10,000
15,000
20,000
25,000
30,000
35,000
Jan Feb Mar YTD
2010 Overall Treatments Booked 2009 Overall Treatments Booked

9Ernst & Young Spa Benchmark Survey Report
Key Insights
Percentage Split of Treatments Booked by Hotel Guests vs Non-hotel Guests in 2010
Percentage Split of Treatments Booked by Hotel Guests vs Non-hotel Guests in 2009
Year-on-year comparison
Q1 2010 vs. Q1 2009
Hotel Guests65%
Non-hotel Guests35%
Hotel Guests54%
Non-hotel Guest46%

10 Ernst & Young Spa Benchmark Survey Report
Trends Q1 2010
Percentage Split of Treatments Booked by Hotel Guests versus Non-hotel Guests (Overall Dubai Hotel Spas)
Average Retail Revenue per Treatment Booked (AED)
64
56
74
65
37
31
37 35
54
46
61
54
20
40
60
80
100
Jan Feb Mar YTD
Beach City Overall
62% 60% 60% 61%
38% 40% 40% 39%
0%
10%
20%
30%
40%
50%
60%
70%
80%
90%
100%
Jan Feb Mar YTD
% Hotel guests % Non-hotel guests

11Ernst & Young Spa Benchmark Survey Report
Spread for Average Daily Treatment Revenue per Treatment Room (AED)
Spread for Average Daily Treatment Revenue generated by Therapist (AED)
Trends Q1 2010
1405 14231696
9381054 994
0
1000
2000
3000
4000
Jan Feb Mar
Beach City
9611018
1174
757896 861
0
500
1000
1500
2000
2500
3000
Jan Feb Mar
Beach City
12 Ernst & Young Spa Benchmark Survey Report
Spread for Fitness & Membership Revenue (% of Total Spa Revenue)
Spread for Retail Revenue (% of Total Spa Revenue)
13%12%
14%
8%6% 7%
0%
5%
10%
15%
20%
25%
30%
Jan Feb Mar
Beach City
31%34% 37%
42% 39%43%
0%
20%
40%
60%
80%
100%
Jan Feb Mar
Beach City
Trends Q1 2010
13Ernst & Young Spa Benchmark Survey Report
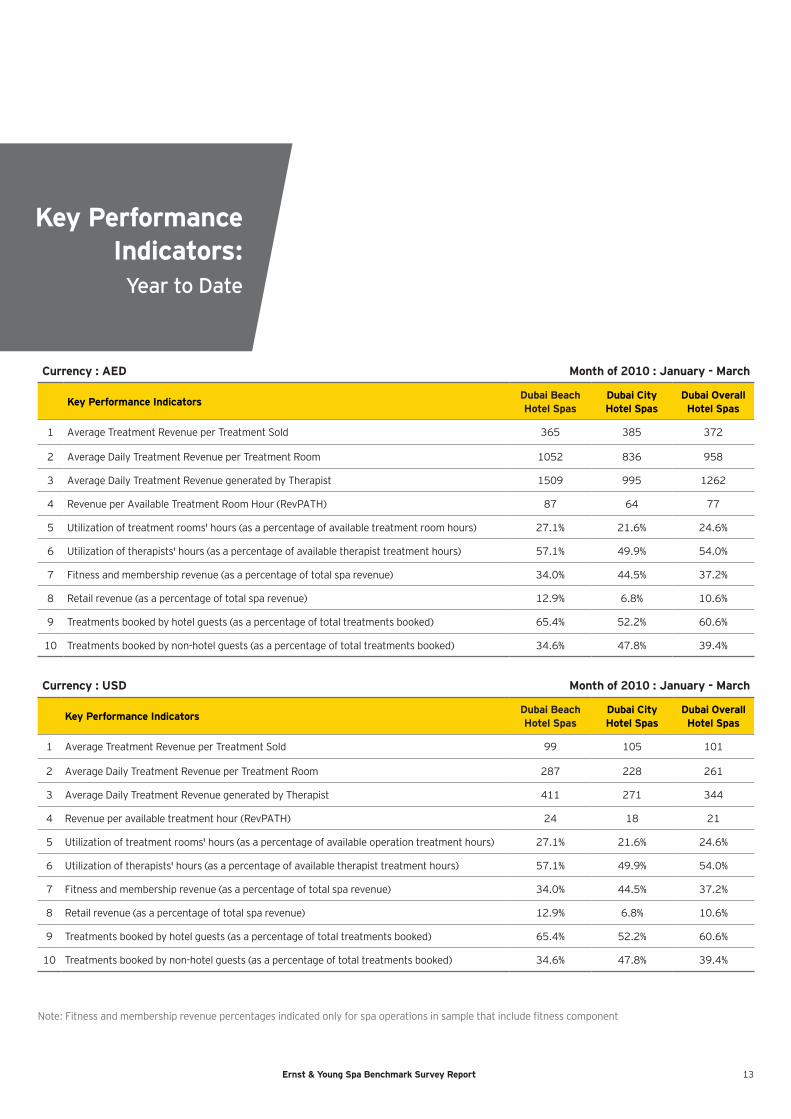
Currency : AED Month of 2010 : January - March
Key Performance Indicators Dubai Beach Hotel Spas
Dubai City Hotel Spas
Dubai Overall Hotel Spas
1 Average Treatment Revenue per Treatment Sold 365 385 372
2 Average Daily Treatment Revenue per Treatment Room 1052 836 958
3 Average Daily Treatment Revenue generated by Therapist 1509 995 1262
4 Revenue per Available Treatment Room Hour (RevPATH) 87 64 77
5 Utilization of treatment rooms' hours (as a percentage of available treatment room hours) 27.1% 21.6% 24.6%
6 Utilization of therapists' hours (as a percentage of available therapist treatment hours) 57.1% 49.9% 54.0%
7 Fitness and membership revenue (as a percentage of total spa revenue) 34.0% 44.5% 37.2%
8 Retail revenue (as a percentage of total spa revenue) 12.9% 6.8% 10.6%
9 Treatments booked by hotel guests (as a percentage of total treatments booked) 65.4% 52.2% 60.6%
10 Treatments booked by non-hotel guests (as a percentage of total treatments booked) 34.6% 47.8% 39.4%
Currency : USD Month of 2010 : January - March
Key Performance Indicators Dubai Beach Hotel Spas
Dubai City Hotel Spas
Dubai Overall Hotel Spas
1 Average Treatment Revenue per Treatment Sold 99 105 101
2 Average Daily Treatment Revenue per Treatment Room 287 228 261
3 Average Daily Treatment Revenue generated by Therapist 411 271 344
4 Revenue per available treatment hour (RevPATH) 24 18 21
5 Utilization of treatment rooms' hours (as a percentage of available operation treatment hours) 27.1% 21.6% 24.6%
6 Utilization of therapists' hours (as a percentage of available therapist treatment hours) 57.1% 49.9% 54.0%
7 Fitness and membership revenue (as a percentage of total spa revenue) 34.0% 44.5% 37.2%
8 Retail revenue (as a percentage of total spa revenue) 12.9% 6.8% 10.6%
9 Treatments booked by hotel guests (as a percentage of total treatments booked) 65.4% 52.2% 60.6%
10 Treatments booked by non-hotel guests (as a percentage of total treatments booked) 34.6% 47.8% 39.4%
Key Performance Indicators:
Year to Date
Note: Fitness and membership revenue percentages indicated only for spa operations in sample that include fitness component

14 Ernst & Young Spa Benchmark Survey Report
Key Performance Indicators Calculation Explanation
1 Average Treatment Revenue per Treatment Sold
Treatment Revenue ÷ No. of Treatments Booked
The portion of total spa revenue generated by treatments only, on a monthly basis; where treatments are defined to include facials, massages, body treatments, etc. Divided by the total number of spa treatments booked for the month (including complimentary treatments, treatments within packages, etc.)
2 Average Daily Treatment Revenue per Treatment Room
Treatment Revenue ÷ Available Treatment Rooms
The portion of total spa revenue generated by treatments only, on a monthly basis; where treatments are defined to include facials, massages, body treatments, etc. Divided by the number of rooms available on monthly basis (Calculated by number of rooms available daily multiplied by days in month minus any out-of-order rooms)
3 Average Daily Treatment Revenue generated by Therapist
Treatment Revenue ÷ Available Therapists
The portion of total spa revenue generated by treatments only, on a monthly basis; where treatments are defined to include facials, massages, body treatments, etc. Divided by number of therapists available for treatments in the month (calculated as a Full Time Equivalent and accounting for therapist unavailability due to holidays, sick leave, training, etc.)
4 Revenue per Available Treatment Room Hour (RevPATH)
Treatment Revenue ÷ Available Treatment Room Hours
The portion of total spa revenue generated by treatments only, on a monthly basis; where treatments are defined to include facials, massages, body treatments, and such spa services. Divided by the total treatment room hours available on monthly basis (i.e. the total hours of operation of spa for month, accounting for variation in day-to-day operational hours for all treatment rooms.)
5 Utilization of treatment rooms' hours (as a percentage of available treatment rooms' hours)
No. of Treatment Rooms Hours Occupied ÷ Available Treatment Room Hours
Treatment room hours booked on monthly basis (including complimentary treatments, treatments within packages, etc.) Divided by the total treatment room hours available on monthly basis (i.e. the total hours of operation of spa for month, accounting for variation in day-to-day operational hours for all treatment rooms)
6 Utilization of therapists' hours (as a percentage of available therapists' hours)
Occupied Therapist Hours ÷ Available Therapist Hours
Total number of hours the therapists are booked on monthly basis i.e. involved in providing treatments. Divided by the total hours therapists are available to provide treatments on a monthly basis (i.e. total hours of all the therapists available for treatment appointments, excluding meals, training, sick leave, etc.)
7 Fitness and membership revenue (as a percentage of total spa revenue)
Fitness & Membership Revenue ÷ Total Spa Revenue
Only the Fitness & Membership Revenue on monthly basis. Divided by the total spa revenue on monthly basis.
8 Retail revenue (as a percentage of total spa revenue)
Retail Revenue ÷ Total Spa Revenue
Only the Retail Revenue on monthly basis. Divided by the total spa revenue on monthly basis.
9 Treatments booked by hotel guests (as a percentage of total treatments booked)
No. of treatments booked by Hotel Guests ÷ Total No. of Treatments Booked
Total number of treatments booked by the guests of the hotel on a monthly basis (including complimentary treatments, treatments within packages, etc.) Divided by the total numbers of treatments booked at the spa on a monthly basis.
10 Treatments booked by non-hotel guests (as a percentage of total treatments booked)
No. of treatments booked by Non-Hotel Guests ÷ Total No. of Treatments Booked
Total number of treatments booked by outside guests i.e. non-hotel guests on a monthly basis (including complimentary treatments, treatments within packages, etc.) Divided by the total numbers of treatments booked at the spa on a monthly basis.
After detailed discussions with numerous spa operators within Dubai, and in keeping with the over-arching objective of simplicity and universal applicability among spa operations, ten key performance indicators were developed and short-listed by Ernst & Young. The following table presents an explanation of the metrics, along with the methodology regarding their calculations:
Definitions

If you have any queries, or wish to express any further views, or suggestions, we would be pleased to discuss the report findings with you.
Transaction Real Estate Advisory Services
Ernst & Young, Dubai Office Tel: 971 4 3324000 Fax: 971 4 3324004
Ernst & Young’s Transaction Real Estate Advisory Services team headquartered in Dubai is the leading business advisory practice in the region. Our team consists of professionals from around the globe with extensive real estate, hospitality operations and advisory experience. We understand and offer a full scope of multidisciplinary services for developers, lenders, owners and operators.
Our specialist services include acquisitions, capital sourcing, highest and best use analysis, development strategy, due diligence, market and financial feasibility studies, management company selection/contract reviews, strategic business planning, repositioning analysis, operational enhancement/diagnostics, valuations/appraisals and disposition, for every real estate industry segment such as hotels, residential, commercial, retail, restaurants, golf, marina, theme parks and convention centers.
Ernst & Young is the largest professional services firm in Middle East with 20 offices in 15 countries and part of the global Ernst & Young network with over 144,000 people in 140 countries.
15Ernst & Young Spa Benchmark Survey Report
Contacts
Paul Arnold Principal Email: [email protected]
Nikita Sarkar Senior Consultant - Spa Industry Specialist Email: [email protected]
Heta Kheni Senior Consultant Email: [email protected]

Ernst & Young
Assurance | Tax | Transactions | Advisory
About Ernst & Young
Ernst & Young is a global leader in assurance, tax, transaction and advisory services. Worldwide, our 144,000 people are united by our shared values and an unwavering commitment to quality. We make a difference by helping our people, our clients and our wider communities achieve their potential.
Ernst & Young refers to the global organization of member firms of Ernst & Young Global Limited, each of which is a separate legal entity. Ernst & Young Global Limited, a UK company limited by guarantee, does not provide services to clients. For more information about our organization, please visit www.ey.com.
The Middle East practice of Ernst & Young has been operating in the region since 1923. For over 85 years, we have evolved to meet the legal and commercial developments of the region. Across the Middle East, we have over 4,200 people united across 20 offices and 15 Arab countries, sharing the same values and an unwavering commitment to quality. We make a difference by helping our people, our clients and our wider communities achieve their potential. For more information, please visit www.ey.com/me
© 2010 Ernst & Young. All rights reserved.