Embed Size (px)
Citation preview

WHY AUSTRALIA BENCHMARK REPORT 2016

25 YEARS OF CONSECUTIVE GROWTH. A SMART, SKILLED WORKFORCE. A CULTURE OF INNOVATION. INTEGRATED WITH ASIA, EUROPE AND NORTH AMERICA. READY FOR BUSINESS.
Australia offers a powerful combination of solid economic credentials, a highly educated labour force, legal and political stability, and proximity to the fast-growing markets of Asia.
With a resilient economy, a AAA sovereign risk profile and diverse, globally competitive industries, Australia remains well placed to build on an impressive record of prosperity.
Australia has strong business and cultural ties with Asia, and longstanding trade, investment and research links in Europe and North America.
Recently completed free trade agreements will make Australia even more competitive and further increase prospects for greater two-way investment.
There are significant commercial opportunities in sectors where Australia has specific strengths and expertise, such as agribusiness, resources and energy, and financial services. Australia’s north in particular offers untapped possibilities.
Australia’s world-class scientific and academic institutions, and commitment to research and development encourage innovation and the commercialisation of new technologies.
There is no better partner for trade, investment and collaboration than Australia.
GROWTH
BUSINESS
INNOVATION
TALENTLOCATION
WHY AUSTRALIA
01
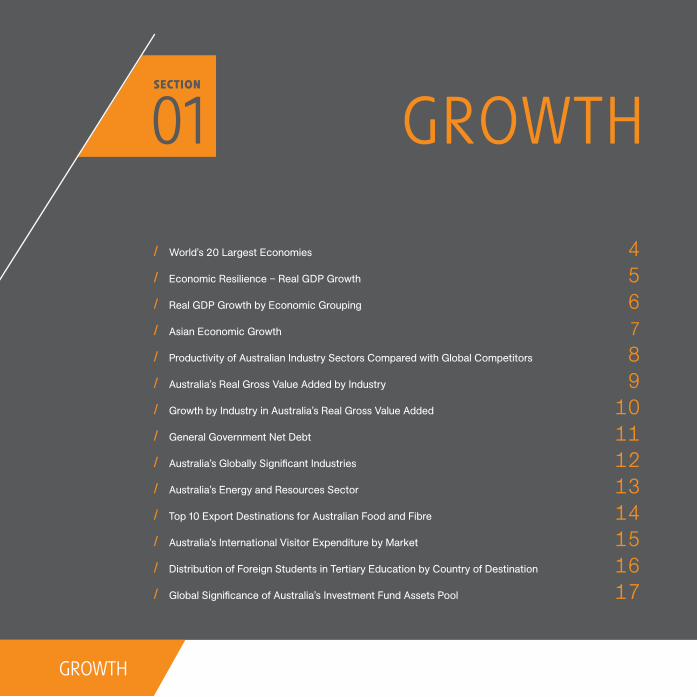
/ World’s 20 Largest Economies 4 / Economic Resilience – Real GDP Growth 5 / Real GDP Growth by Economic Grouping 6 / Asian Economic Growth 7 / Productivity of Australian Industry Sectors Compared with Global Competitors 8 / Australia’s Real Gross Value Added by Industry 9 / Growth by Industry in Australia’s Real Gross Value Added 10 / General Government Net Debt 11 / Australia’s Globally Significant Industries 12 / Australia’s Energy and Resources Sector 13 / Top 10 Export Destinations for Australian Food and Fibre 14 / Australia’s International Visitor Expenditure by Market 15 / Distribution of Foreign Students in Tertiary Education by Country of Destination 16 / Global Significance of Australia’s Investment Fund Assets Pool 17
SECTION
GROWTH
GROWTH
GROWTH

GROWTHAUSTRALIA’S DEMONSTRATED ECONOMIC RESILIENCE AND ENVIABLE RECORD OF STEADY GROWTH PROVIDE A SAFE, LOW-RISK ENVIRONMENT IN WHICH TO DO BUSINESS.
Now in its 25th year of consecutive growth, Australia has achieved a real GDP average growth rate of 3.3 per cent per annum since 1992. Its forecast economic growth rate between 2016 and 2020 is the highest among major advanced economies.
This growth is underpinned by Australia’s close ties with the dynamic Asia-Pacific region and effective national institutions. The country offers significant opportunities across a range of sectors, including agribusiness, education, tourism, mining and wealth management.
While mining remains a major contributor to Australia’s international trade profile, the services sector is growing faster than any other industry. This sector generates the majority of Australia’s economic output, reflecting the depth of professional expertise across the nation.
3.3%AVERAGE GDP GROWTHRATE PER ANNUM
US$1.2TRILLION GDP
1992–2015

SECTION 1 / GROWTH 4
/ AUSTRALIA: AN ECONOMY OF SCALEThe Australian economy is estimated to be the 12th largest in the world in 2015, despite the fact the country is home to only 0.3 per cent of the world’s population. Australia’s nominal GDP is estimated at US$1.2 trillion and accounts for 1.7 per cent of the global economy. Australia has almost doubled the value of its total production from a decade ago.
WORLD’S 20 LARGEST ECONOMIES – 2015E
Percentage share of total world nominal GDP in US$
1. USA 24.5%
2. China 15.6%
3. Japan 5.6%
4. Germany 4.6%
5. UK 3.9%
6. France 3.3%
9 . Brazil 2.5%
8. Italy 2.5%
7. India 3.0%
10. Canada 2.1%
12. Australia 1.7%
20. Saudi Arabia 0.9%19. Switzerland 0.9%18. Turkey 1.0%17. Netherlands 1.0%16. Indonesia 1.2%15. Mexico 1.6%14. Spain 1.7%13. Russia 1.7%
Rest of World 18.8%
9.9%
11. South Korea 1.9%
E = Estimate GDP of the world’s 189 economies: US$73,192 billionGDP of Asia-Pacific Economic Cooperation’s 21 member economies: US$43,872 billion (59.9% of world’s GDP)GDP of 20 largest economies: US$59,409 billion (81.2% of world’s GDP) GDP of ASEAN–10 economies: US$2,459 billion (3.4% of world’s GDP)Sources: International Monetary Fund, World Economic Outlook Database, October 2015; Austrade

SECTION 1 / GROWTH 5
/ 25 YEARS OF UNINTERRUPTED ANNUAL ECONOMIC GROWTHThe Australian economy remains resilient; sustained by sound macroeconomic policies, strong institutions and healthy trade ties with Asia. Australia is the only major developed economy to have recorded no annual recessions from 1992 to 2015 and is now in its 25th year of consecutive growth.
ECONOMIC RESILIENCE – REAL GDP GROWTH1992–2015E
2.2
1.4
43
0.8
6.8
6.0
7.0
5.6
3.3
66
0.6
10.0
3.8
2.8
4.1
2.5
1.6 1.7
5.0 4.9
4.44.74.8
Philip
pines
Russia
7
Aver
age
annu
al g
row
th ra
te (%
)
Note: Colour circles on x-axis represent the number of years in recession. E = Estimate
Sources: International Monetary Fund, World Economic Outlook Database, October 2015; Austrade

SECTION 1 / GROWTH 6
/ AUSTRALIA’S FORECAST GROWTH RATE IS THE HIGHEST AMONG MAJOR ADVANCED ECONOMIESAustralia’s economic growth has outperformed its peers for the past two decades. And the fundamentals are in place for this relative success to continue. According to IMF forecasts released in October 2015, Australia is expected to realise average annual real GDP growth of 2.9 per cent between 2016 and 2020 – the highest among major advanced economies and up from an average growth rate of 2.7 per cent between 2011 and 2015.
REAL GDP GROWTH BY ECONOMIC GROUPINGAverage annual growth rate: 2011–15E and 2016F–20F
E = Estimate F = Forecast1. ASEAN-5 = Indonesia, Malaysia, Philippines, Thailand and Vietnam2. Composed of 19 economies in Europe (data for Lithuania is now included in the Euro aggregates)
Sources: International Monetary Fund, World Economic Outlook Database, October 2015; Austrade
0
1
2
3
4
5
6
7
8
9
Aver
age
annu
al g
row
th ra
te (%
)
0.7 0.7
2.7
World Average ASEAN-51 IndiaJapan Australia USAChina UK Euro Area2
2011 to 2015E
2016F to 2020F
3.53.8
5.05.3
6.6
7.6
6.2
7.8
2.9
2.12.5
1.92.2
0.6
1.6

SECTION 1 / GROWTH 7
/ THE ASIAN REGION WILL ACCOUNT FOR OVER 40 PER CENT OF GLOBAL GDP BY 2020Australia’s medium- and long-term growth outlook is supported by its increasingly strong ties to the rapidly growing Asian region. By 2020, the regional economy is expected to account for 43 per cent of global output, more than double the ratio in 1980. Over the same period, the combined economies of China and India will likely represent 28 per cent of the world’s GDP, significantly up from around five per cent in 1980.
ASIAN ECONOMIC GROWTHGDP based on Purchasing Power Parity valuation (PPP, current international dollar billion)1
0
5,000
10,000
15,000
20,000
25,000
30,000
35,000
40,000
45,000
50,000
55,000
60,000
65,000
19851980 1990 1995 2000 2005 2010 2015E 2020F
Asia % of World GDP (right-hand axis)
China and IndiaJapan, Australia and New ZealandASEAN-52
NIEs3 Other Developing Asia
Cur
rent
inte
rnat
iona
l dol
lar (
$ bi
llion
)
% o
f wor
ld G
DP
0
5
10
15
20
25
30
35
40
45
19.8%22.5% 25.4%
27.1%
28.1%
30.6%
35.5%
39.7%
43.1%
Note: The number on the bar represents the Asian economy as a percentage share of world GDP (PPP).E = Estimate F = Forecast1. An international dollar would buy in the cited country a comparable amount of goods and services a US dollar would buy in the United States. Local currency values are converted into international dollars using PPP exchange rates2. Composed of 5 countries: Indonesia, Malaysia, Philippines, Thailand and Vietnam3. Newly Industrialised Economies: Singapore, Hong Kong, South Korea and Taiwan
Sources: International Monetary Fund, World Economic Outlook Database, October 2015; Austrade

SECTION 1 / GROWTH 8
/ AUSTRALIAN PRODUCTIVITY IS HIGHLY RATED IN KEY FUTURE GROWTH SECTORSThe productivity levels of 15 out of 20 Australian industries rate above the average productivity of global competitors in the same sector. Australia is performing 20 per cent above this global average in five key growth sectors including gas, education, oil, tourism and health, and over 40 per cent in mining and agribusiness.
PRODUCTIVITY OF AUSTRALIAN INDUSTRY SECTORS COMPARED WITH GLOBAL COMPETITORS
0
20
40
60
80
100
120
140
160
Man
ufac
turin
g
Reta
il an
d W
hole
sale
Tran
spor
t and
Log
istic
s
Wat
er a
nd W
aste
Ser
vice
s
Busi
ness
and
Pro
pert
y Se
rvic
es ICT
Med
ia
Tele
com
mun
icat
ions
Bank
ing
Wea
lth
Publ
ic A
dmin
istr
atio
n
Con
stru
ctio
n
Gas
Inte
rnat
iona
l Edu
catio
n
Oth
er E
duca
tion
and
Trai
ning O
il
Tour
ism
Hea
lth
Min
ing
Agrib
usin
ess
7580
9096
105 105105105105
98
116119 120 122122 124
127 127
142146
Prod
uctiv
ity in
dex
(%)
Note: A score of 110 means Australia is 10% more productive than the average productivity of global competitors in the industry.
Sources: Deloitte Access Economics analysis, 2015. Based on data provided in The Conference Board Total Economy Database™, May 2015; Austrade

SECTION 1 / GROWTH 9
/ AUSTRALIA: A DIVERSIFIED, SERVICES-BASED ECONOMYAustralia’s services sector (excluding construction) accounts for more than 70 per cent of real gross value added (GVA). The country’s sophisticated financial services industry is the largest contributor to its economy, generating 9.3 per cent of total GVA. Professional, scientific and technical services, education and training, and information media and telecommunications together make up almost 15 per cent of total output, reflecting Australia’s highly skilled, well-educated and innovative workforce.
AUSTRALIA’S REAL GROSS VALUE ADDED BY INDUSTRYAnnual total ending June 2014–15, as a percentage of total industry
Note: Gross value added measures the contribution to the economy of each individual producer, industry or sector.1. Other Services include: Ownership of Dwellings (9.0%), Arts and Recreation Services (0.8%) and other (1.9%)
Sources: Australian Bureau of Statistics, Cat. No. 5206.0 Australian National Accounts: National Income, Expenditure and Product (released 2 September 2015), Table 37. Industry Gross Value Added, Chain Volume Measures, Annual; Austrade
Health Care and Social Assistance 7.0%
Financial and Insurance 9.3%
Professional, Scientific and Technical 6.4%
Public Administration and Safety 5.6%
Transport, Postal and Warehousing 4.9%
Education and Training 4.9%
Retail Trade 4.8%
Wholesale Trade 4.2%
Electricity, Gas, Water and Waste Services 2.9%
Accommodation and Food Services 2.6%
Administrative and Support Services 2.9%
Rental, Hiring and Real Estate 3.0%
Construction 8.2%
Other Services1 11.8%
Mining 9.3%
Agriculture, Forestry and Fishing 2.4%
Manufacturing 6.6%
Information Media and Telecommunications 3.2%
SECTION 1 / GROWTH 10
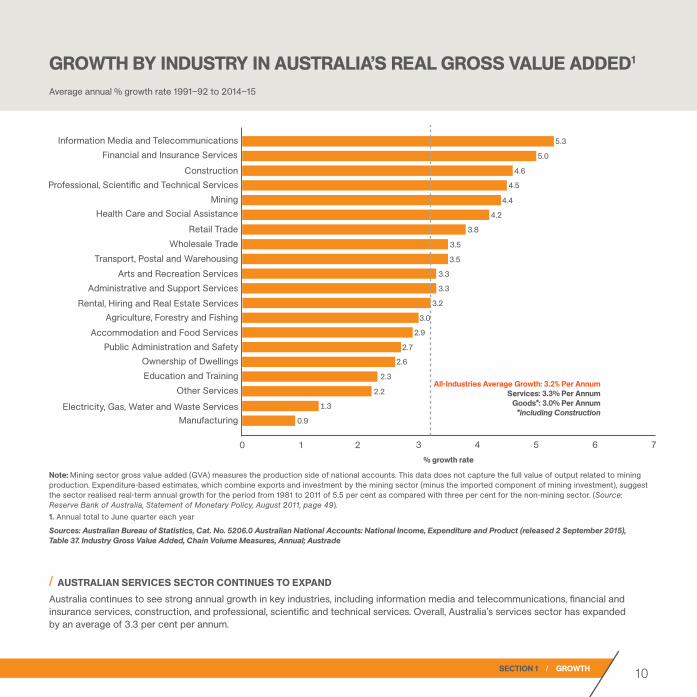
/ AUSTRALIAN SERVICES SECTOR CONTINUES TO EXPANDAustralia continues to see strong annual growth in key industries, including information media and telecommunications, financial and insurance services, construction, and professional, scientific and technical services. Overall, Australia’s services sector has expanded by an average of 3.3 per cent per annum.
GROWTH BY INDUSTRY IN AUSTRALIA’S REAL GROSS VALUE ADDED1
Average annual % growth rate 1991–92 to 2014–15
0 1 2 3 4 5 6 7
Manufacturing
Public Administration and Safety
Education and TrainingOther Services
Electricity, Gas, Water and Waste Services
Rental, Hiring and Real Estate Services
Accommodation and Food Services
Ownership of Dwellings
Mining
Arts and Recreation ServicesAdministrative and Support Services
Retail Trade
Agriculture, Forestry and Fishing
Wholesale Trade
Health Care and Social Assistance
Information Media and Telecommunications
Transport, Postal and Warehousing
Professional, Scientific and Technical ServicesConstruction
Financial and Insurance Services
All-Industries Average Growth: 3.2% Per AnnumServices: 3.3% Per Annum
Goods*: 3.0% Per Annum*including Construction
5.0
4.6
4.5
5.3
4.4
4.2
3.5
3.5
3.8
3.3
3.3
3.2
3.0
2.9
2.7
2.6
2.3
1.3
0.9
% growth rate
2.2
Note: Mining sector gross value added (GVA) measures the production side of national accounts. This data does not capture the full value of output related to mining production. Expenditure-based estimates, which combine exports and investment by the mining sector (minus the imported component of mining investment), suggest the sector realised real-term annual growth for the period from 1981 to 2011 of 5.5 per cent as compared with three per cent for the non-mining sector. (Source: Reserve Bank of Australia, Statement of Monetary Policy, August 2011, page 49).1. Annual total to June quarter each year
Sources: Australian Bureau of Statistics, Cat. No. 5206.0 Australian National Accounts: National Income, Expenditure and Product (released 2 September 2015), Table 37. Industry Gross Value Added, Chain Volume Measures, Annual; Austrade

SECTION 1 / GROWTH 11
/ AUSTRALIAN GOVERNMENT DEBT IS ONE OF THE WORLD’S LOWESTIn its October 2015 Fiscal Monitor, the International Monetary Fund estimated that the Australian Government’s net debt would be just 18.3 per cent of GDP in 2016, well below the 71.9 per cent forecast for advanced economies as a group. The low level of public sector debt reinforces the Australian Government’s healthy financial position and sound economic credentials, and underpins its strong sovereign ratings.
GENERAL GOVERNMENT NET DEBT1 – 2016F
As a percentage of GDP
0
20
40
60
80
100
120
140
160
180
200
220
Gre
ece
Japa
n
Port
ugal
Italy
Irela
nd
Fran
ce
USA
3
Belg
ium
Spai
n
UK
Ger
man
y
Sout
h Af
rica
Mex
ico
Can
ada3
Net
herla
nds
Braz
il
Sout
h Ko
rea
New
Zea
land
Switz
erla
nd
Turk
ey
Aust
ralia
3
Den
mar
k
Peru
202.8
128.1118.0
112.8
90.380.7 79.5 78.7
66.3 66.0
46.4 45.7 45.6 42.1 38.7 38.0 35.425.0 24.2
8.818.3
8.6 7.3
% o
f GDP
F = Forecast1. IMF staff estimates and projections. Projections are based on staff assessment of current policies2. Gross debt as a percentage of GDP (Source: IMF, Fiscal Monitor October 2015, Statistical Table A15)3. For cross-country comparability, gross and net debt levels reported by national statistical agencies for countries that have adopted the 2008 System of National Accounts (Australia, Canada and USA) are adjusted to exclude unfunded pension liabilities of government employees’ defined benefit pension plans
Sources: International Monetary Fund, Fiscal Monitor October 2015, Statistical Tables A8 and A16; Austrade
Advanced Economies Average: 71.9 G20 Advanced 79.4 Euro Area 69.7 G7 83.3Emerging Economies Average: 14.9 Asia 47.52
Europe 27.3 Latin America 38.2 G20 Emerging 31.8

SECTION 1 / GROWTH 12
/ AUSTRALIA: AN IMPORTANT CONTRIBUTOR TO THE GLOBAL GROWTH SECTORS OF THE FUTUREAustralia is globally successful in five significant and diverse sectors: agribusiness, education, tourism, mining and wealth management. Ongoing demand across these sectors is expected to drive trade and investment in Australia and internationally.
AUSTRALIA’S GLOBALLY SIGNIFICANT INDUSTRIES
AUSTRALIA’S INVESTMENT FUND ASSETS (US$1.6 trillion, June 2015)
SEVENTH LARGEST IN THE WORLD
Source: Investment Company Institute, Worldwide Mutual Fund Assets and Flows
MERCHANDISE EXPORT – FUELS AND MINING (US$153.0 billion, 2014)
TOP 5 IN THE WORLD
Source: World Trade Organization Statistics Database
FOREIGN STUDENTS IN TERTIARY EDUCATION (6.4% of the world’s total, 2013)
THIRD LARGEST IN THE WORLD
Source: UNESCO, Institute for Statistics
INTERNATIONAL TOURISM RECEIPTS (US$32.0 billion, 2014)
11TH LARGEST IN THE WORLD
Source: UNWTO Tourism Highlights 2015 Edition
MERCHANDISE EXPORT – AGRICULTURAL PRODUCTS (US$38.6 billion, 2014)
TOP 14 IN THE WORLD AGRICULTURAL PRODUCT CATEGORIES
Source: World Trade Organization Statistics Database

SECTION 1 / GROWTH 13
/ A GLOBAL LEADER IN RESOURCES AND ENERGYAustralia’s abundant resources and proximity to Asia underpin its position as a major global exporter of minerals and energy resources and products. From 2004–05 to 2014–15, the country’s total resources and energy exports increased about two and a half-fold to A$172 billion, with the majority of these exports going to Asian countries including China, Japan and South Korea. Australia has the world’s largest share of iron ore, gold, zinc, nickel and uranium reserves.
AUSTRALIA’S ENERGY AND RESOURCES SECTORValue of exports
1. Information correct as at December 2013. Source: Geoscience Australia, Australia’s Identified Mineral Resource Assessment 2014
Sources: Bureau of Resources and Energy Economics (BREE), Resources and Energy Quarterly, September Quarter 2015, page 17, Table 1.3: Outlook for Australia’s resources and energy commodities; Austrade
0
20
40
60
80
100
120
140
160
A$ b
illio
n, fo
b
EnergyResources
F = BREE forecastZ = BREE projection
2000
–01
2001
–02
2002
–03
2003
–04
2004
–05
2005
–06
2006
–07
2007
–08
2008
–09
2009
–10
2010
–11
2011
–12
2012
–13
2013
–14
2014
–15
2015
–16F
2016
–17Z
2017
–18Z
2018
–19Z
2019
–20Z
Commodity1 Reserves World Ranking Iron ore 52,578 Mt 1Gold 9,808 t 1Zinc 62.3 Mt 1Nickel 19 Mt 1Uranium 1,167 Kt 1Bauxite 6,281 Mt 2Copper 93.1 Mt 2Coal (brown) 44,164 Mt 2Coal (black) 62,095 Mt 5

SECTION 1 / GROWTH 14
/ CLEAN, GREEN AND SAFE SOURCE OF AGRICULTURAL AND FOOD EXPORTS Australian food and fibre exports rose to almost A$42 billion in 2014, with eight of the top 10 destination markets (56 per cent of exports) in Asia. According to the OECD Development Centre, the number of middle-class consumers in the Asia-Pacific region is forecast to grow to approximately 3.2 billion by 2030. Australia’s proximity to Asia and reputation as a safe and reliable source of quality produce and premium products ensure the country is well placed to capitalise on this growth.
TOP 10 EXPORT DESTINATIONS FOR AUSTRALIAN FOOD AND FIBREA$ billion
$2.8b4. USA
1. CHINA
2. JAPAN
9. HONG KONG
7. NEW ZEALAND
8. MALAYSIA
6. VIETNAM $1.7b
3. INDONESIA
$8.7b
$3.9b
$1.0b
4b$1.
$1.2b
$3.0b
TURNOVER(A$ billion)
EXPORTS(A$ billion)
TOTAL : $173.4b
$73.4b$100.0b
TOTAL : $41.6b$20.2b$21.4b unprocessed
processed
10. SAUDI ARABIA $0.9b
5. KOREA $2.3b
Sources: Exports by country based on DFAT, Country and Commodity pivot table – FY2005 to FY2014; turnover based on ABS Catalogue 8155.0 Australian Industry 2013–14, June 2015 (released 29 June 2015); exports of processed and unprocessed food and fibre based on DFAT, Composition of Trade 2013–14; Austrade

SECTION 1 / GROWTH 15
/ INTERNATIONAL TOURISM EXPENDITURE SURGEDAustralia experienced record inbound tourism expenditure in 2014–15, driven by strong growth from Asian markets such as China, Hong Kong, Singapore and India. Traditional markets such as the USA and New Zealand also performed well, up 12.5 per cent and 3.6 per cent respectively. The outlook to 2019–20 remains robust, with international visitor spending expected to rise by 4.7 per cent per annum to reach A$42 billion (in real terms). China, India and other Asian nations are anticipated to account for the majority of this forecast growth. Total visitor spending is projected to increase to A$128 billion by 2019–20.
AUSTRALIA’S INTERNATIONAL VISITOR EXPENDITURE BY MARKET
0
1,000
2,000
3,000
4,000
5,000
6,000
7,000
8,000
9,000
10,000
11,000
12,000
0
1
2
3
4
5
6
7
8
9
10
Chi
na UK
USA
New
Zea
land
Sout
h Ko
rea
Japa
n
Indi
a
Sing
apor
e
Hon
g Ko
ng
Ger
man
y
Mal
aysi
a
Fran
ce
Indo
nesi
a
Thai
land
Real
exp
endi
ture
(A$
mill
ion)
1
CAG
R (%
)
2014–15 (actual, Left-hand axis)
2019–2020F (Left-hand axis)1
Compound annual growth rate (2014–15 to 2019–20F, Right-hand axis)
F = Forecast1. Real, base = Quarter 2, 2015
Sources: Tourism Research Australia, Tourism Forecasts 2015 (released 2 November 2015); Austrade
FORECAST INTERNATIONAL VISITOR EXPENDITURE
A$42.2 billion
TOTAL FORECAST TOURISM EXPENDITURE
A$128.4 billion
4.7%
3.6% (2014–15 to 2019–20F)
(2014–15 to 2019–20F)

SECTION 1 / GROWTH 16
/ AUSTRALIA IS A TOP THREE DESTINATION FOR INTERNATIONAL STUDENTSAustralia is the third most popular destination for students choosing to study overseas, attracting more international students than much larger economies like Japan, Germany and France. Education services are one of Australia’s leading exports, worth A$18.1 billion in 2014–15.
DISTRIBUTION OF FOREIGN STUDENTS IN TERTIARY EDUCATION BY COUNTRY OF DESTINATION – 2013
1. USA 20.0%
Other countries 25.8%
2. UK1 10.6%
3. Australia 6.4%
7. Russia 3.5%
6. Japan3 3.8%
5. Germany 5.0%
4. France 6.1%
16. Spain 1.4%
15. UAE2 1.5%
13. Saudi Arabia 1.6%
8. Canada3 3.4%
12. Netherlands 1.8%
14. South Korea 1.5%
9. China 2.5%
10. Italy3 2.0%
11. Austria 1.8%
17. Malaysia3 1.4%
1. United Kingdom of Great Britain and Northern Ireland2. United Arab Emirates3. 2012 data
Sources: United Nations Educational, Scientific and Cultural Organization (UNESCO), Institute for Statistics, Education, Total inbound internationally mobile students, both sexes (data extracted on 12 October 2015); Austrade
SECTION 1 / GROWTH 17
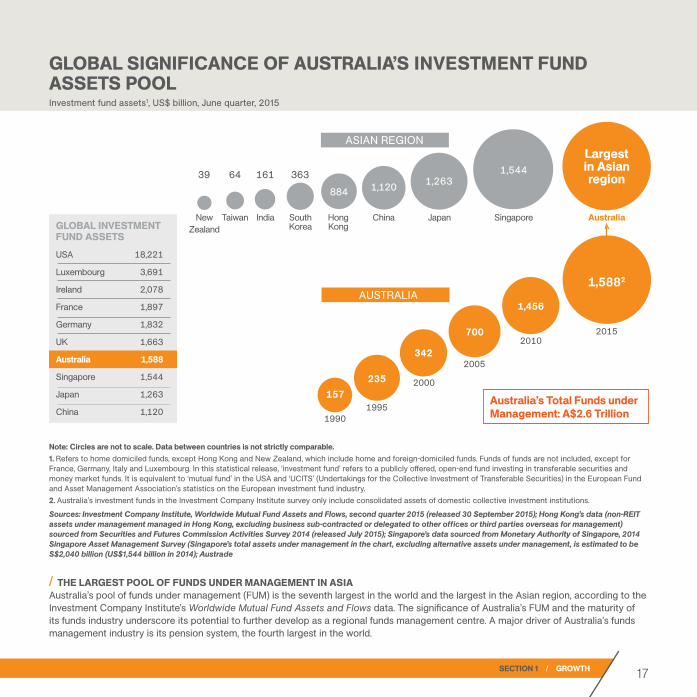
/ THE LARGEST POOL OF FUNDS UNDER MANAGEMENT IN ASIAAustralia’s pool of funds under management (FUM) is the seventh largest in the world and the largest in the Asian region, according to the Investment Company Institute’s Worldwide Mutual Fund Assets and Flows data. The significance of Australia’s FUM and the maturity of its funds industry underscore its potential to further develop as a regional funds management centre. A major driver of Australia’s funds management industry is its pension system, the fourth largest in the world.
GLOBAL SIGNIFICANCE OF AUSTRALIA’S INVESTMENT FUND ASSETS POOLInvestment fund assets1, US$ billion, June quarter, 2015
342
235157
AUSTRALIA
ASIAN REGION
64
Taiwan
161
India
39
New Zealand
363
South Korea
HongKong
1,263
Japan Singapore
1,120 884
China
19901995
2000
700
2005
1,456
2010
$1,473bn
GLOBAL INVESTMENT FUND ASSETS USA 18,221
Luxembourg 3,691
Ireland 2,078
France 1,897
Germany 1,832
UK 1,663
Australia 1,588
Singapore 1,544
Japan 1,263
China 1,120
1,5882
Largestin Asianregion
Australia
2015
1,544
Note: Circles are not to scale. Data between countries is not strictly comparable.1. Refers to home domiciled funds, except Hong Kong and New Zealand, which include home and foreign-domiciled funds. Funds of funds are not included, except for France, Germany, Italy and Luxembourg. In this statistical release, ‘investment fund’ refers to a publicly offered, open-end fund investing in transferable securities and money market funds. It is equivalent to ‘mutual fund’ in the USA and ‘UCITS’ (Undertakings for the Collective Investment of Transferable Securities) in the European Fund and Asset Management Association’s statistics on the European investment fund industry.2. Australia’s investment funds in the Investment Company Institute survey only include consolidated assets of domestic collective investment institutions.
Sources: Investment Company Institute, Worldwide Mutual Fund Assets and Flows, second quarter 2015 (released 30 September 2015); Hong Kong’s data (non-REIT assets under management managed in Hong Kong, excluding business sub-contracted or delegated to other of f ices or third parties overseas for management) sourced from Securities and Futures Commission Activities Survey 2014 (released July 2015); Singapore’s data sourced from Monetary Authority of Singapore, 2014 Singapore Asset Management Survey (Singapore’s total assets under management in the chart, excluding alternative assets under management, is estimated to be S$2,040 billion (US$1,544 billion in 2014); Austrade
Australia’s Total Funds under Management: A$2.6 Trillion
02
/ How Australia Compares with Leading OECD Countries: Key Innovation Indicators 20 / Australia’s Gross Expenditure on Research and Development 21 / World of Research and Development 22 / Gross Domestic Expenditure on Research And Development 23 / Relative Impacts of Australian Scientific Publications by Research Field 24 / Australian Universities’ Academic Ranking in Five Broad Subject Fields 25
SECTION
INNOVATION
INNOVATION

SECTION 1 / GROWTH 19
INNOVATIONAUSTRALIA IS COMMITTED TO INNOVATION AND SCIENCE, RECOGNISING THAT IT UNDERPINS THE COUNTRY’S GROWTH, ECONOMIC PROSPERITY AND JOB CREATION.
The country’s intellectual capital, commercial focus and collaborative approach make it an ideal partner for business and investment activities.
Australia is rated fifth in a ranking of the world’s top 200 universities by five key subject fields.
Australian researchers are driving or collaborating on cutting-edge research and regularly publish their findings in many of the world’s most cited publications.
There is strong support for research and development (R&D) in Australia, with significant funding from public and private sector organisations and generous R&D tax incentives.
International organisations have numerous opportunities to collaborate with Australian research institutions, invest in or incorporate Australian solutions into existing products, or enter into joint ventures to take them to the global market.
AUSTRALIA’S
CSIRORANKS IN THE
TOP 1% OF THE WORLD’SSCIENTIFICINSTITUTIONS
IN 15RESEARCH FIELDS

20SECTION 2 / INNOVATION
/ A STRONG RECORD OF INNOVATIONAustralia ranks in the top 10 countries for scientific and technical articles published, adjusted for GDP in terms of Purchasing Power Parity. The country also has a higher percentage of employed persons in knowledge-intensive services than the USA, Germany, Japan and South Korea. Australia’s quality-enabling ICT infrastructure and significant government and private sector R&D investment underpin its strong innovation record.
HOW AUSTRALIA COMPARES WITH LEADING OECD COUNTRIES: KEY INNOVATION INDICATORS
1. Australia’s GERD & BERD represent 2011 and HERD 2012; 2. Data for Australia and Canada represent 2011 and Germany 2013; 3. Number of journal articles (per billion PPP$ GDP); 4. The H index is the economy’s number of published articles (H) that have received at least H citations in the period 1996–2013; 5. Average score of the top 3 universities at the QS world university ranking; 6. USA figure represents 2007; 7. The Global Entrepreneurship Index is an index made up of three sub-indexes, Attitudes, Abilities and Aspirations; 8. Average score of ICT access, ICT use, government’s online service and e-participation; 9. Swedish figure represents 2012; NA = Not available for publicationSources: (a) OECD, Dataset: Main Science and Technology Indicators (data extracted 2 November 2015); (b) OECD, Education at a Glance Interim Report, January 2015, Table 1.4; (c) Cornell University, INSEAD, and the World Intellectual Property Organization, The Global Innovation Index 2015; (d) OECD, Science, Technology and Industry Scoreboard 2015, Figure 2.4.1, Doctorate Holders and Figure 2.1.3, ICT Investment by Asset 2013 (last updated 5 Oct 2015); (e) WEF, Global Competitiveness Report 2015–16; (f) OECD Science, Technology and Industry Scoreboard 2015, Chapter 4 Barriers to Entrepreneurship 2013 (last updated 5 Oct 2015); (g) The Global Entrepreneurship and Development Institute, Washington, D.C., USA. Global Entrepreneurship Index 2015, Table 1.2; Austrade
South Australia Canada France UK Germany Japan Korea Sweden USA
High levels of innovation investment (a) Gross Domestic Expenditure on R&D (GERD, % of GDP)1 2013 2.13 1.62 2.23 1.63 2.85 3.47 4.15 3.30 2.73(a) Higher Education Expenditure on R&D (HERD, % of GDP)1 2013 0.63 0.65 0.46 0.43 0.51 0.47 0.38 0.90 0.39(a) Business Expenditure on R&D (BERD, % of GDP)1 2013 1.23 0.82 1.44 1.05 1.91 2.64 3.26 2.28 1.92
Skilled workforce (b) Proportion of population aged 25–64 attaining 2013 39.5 53.2 32.1 41.9 28.5 47.3 43.1 37.0 43.9
tertiary education (c) Employment in knowledge-intensive services 2013 43.8 44.2 44.4 47.7 42.9 24.3 21.3 49.4 38.0
(% of workforce) (d) Doctorate holders in the working age population 2012 8.2 8.1 7.7 11.8 12.8 NA 6.9 13.6 14.0 (men & women, per thousand population aged 25–64 )2
World-class research (c) Scientific and technical publications3 2014 47.7 37.4 25.7 41.5 26.0 15.7 29.8 53.7 20.6(c) Citable documents H index4 2013 583 725 742 934 815 694 375 567 1,518(e) Quality of scientific research institutions scores 2015–16 5.8 5.4 5.6 6.3 5.8 5.8 4.8 5.7 6.1(c) Average score top 3 universities index5 2014 86.8 88.8 80.5 99.3 80.2 83.7 79.8 73.5 99.2
Entrepreneurship (f) Administrative burden on start-ups (0 = best)6 2013 0.31 0.44 0.72 0.45 0.54 0.51 0.62 0.48 0.53(g) Global Entrepreneurship Index7 2015 77.6 81.5 67.3 72.7 67.4 49.5 54.1 71.8 85.0
World-class ICT infrastructure (c) Information & communication technologies (ICT) score8 86.0 80.0 87.5 89.1 72.9 88.1 92.4 75.8 84.9(d) ICT Investment (% of gross fixed capital formation)9 2013 9.3 9.2 13.6 12.7 8.5 15.7 7.2 14.8 16.4

21SECTION 2 / INNOVATION
/ AUSTRALIAN INDUSTRY: A SIGNIFICANT SOURCE OF R&D EXPENDITUREAustralia’s annual gross R&D expenditure rose by 9 per cent per annum between 2000–01 and 2013–14 to reach A$33 billion. Business Expenditure on R&D accounts for 57 per cent of Australia’s total R&D expenditure, expanding from A$5 billion in 2000–01 to A$19 billion in 2013–14. This represents a compound annual growth rate of 11 per cent, well above Australia’s nominal GDP growth rate of 6.4 per cent.
AUSTRALIA’S GROSS EXPENDITURE ON RESEARCH AND DEVELOPMENTA$ billion by category
0
5
10
15
20
25
30
35
2000–01 2002–03 2004–05 2006–07 2008–09 2013–14E
Gro
ss re
sour
ces
devo
ted
to R
&D (A
$ bi
llion
)
BERDGOVERDHERDPrivate non-profit
5.0
2.4
2.80.29
6.9
2.5
3.40.36
8.7
2.5
4.3
0.48
12.6
3.1
5.4
0.61
17.3
3.4
6.8
0.74
18.8
3.7
9.6
0.96
BERD = Business expenditure on research & development (R&D); GOVERD = Government expenditure on R&D; HERD = Higher education expenditure on R&D; Private non-profit = Private non-profit expenditure on R&DE = Data for BERD on FY2013–14, GOVERD on FY2012–13, HERD on 2012 and Private non-profit on FY2012–13
Sources: Australian Bureau of Statistics, Cat. No. 81040DO001_201314 Research and Experimental Development, Businesses, Australia, 2013–14 (released 4 September 2015); ABS Cat. No. 8109DO001 and ABS Cat. No. 8109DO005_201213 Research and Experimental Development, Australia, Government and Private Non-Profit Organisations (released 9 July 2014); ABS Cat. No. 81110DO001_2012 Research and Experimental Development, Higher Education Organisations, Australia, 2012 (released 20 May 2014); Austrade

22SECTION 2 / INNOVATION
/ AUSTRALIA IS WELL PLACED AMONG LEADING INNOVATIVE ECONOMIESWith strong R&D expenditure as a percentage of GDP in Purchasing Power Parity terms and a high proportion of researchers, Australia’s R&D spend places it among the leading innovative countries in the world, including the USA, Japan, France, Germany and South Korea.
WORLD OF RESEARCH AND DEVELOPMENTSize of circle reflects the relative amount of annual R&D spending (in 2010 US$ in constant prices and Purchasing Power Parity terms)
JPN
KOR
0.0
5.0
10.0
15.0
0.0 1.0 2.0 3.0 4.0
Italy
New Zealand
Spain
Russia
Turkey
France
Netherlands
GermanyCanada
United Kingdom
China
Brazil
Gross domestic expenditures on R&D as a percentage of GDP
SouthAfrica
IndiaIndonesia
Sweden
Japan
SouthKorea
Mexico
USA
Rese
arch
ers
per t
hous
and
empl
oym
ent
10
BRICSNorth AmericaEUOther OECD members
R&D expenditures in 2010 US$ – constant prices and PPP terms
100 billion
10 billion
1 billion
AUSTRALIA
Note: Researchers data is in full-time units and refer to 2013 except for Australia (2008), Brazil and India (2010), Canada and the United States (2012), and Mexico (2011). For Brazil, India and Indonesia, data is provided by the UNESCO Institute for Statistics. For Indonesia, data refers to 2009. For United States, data for researchers has been estimated based on contemporaneous data on business researchers and past data for other sectors.
Sources: OECD, Main Science and Technology Indicators Database, www.oecd.org/sti/msti.htm and UNESCO Institute for Statistics, June 2015; Austrade

23SECTION 2 / INNOVATION
/ AUSTRALIA IS ONE OF THE FASTEST-GROWING R&D SPENDING ECONOMIESGross R&D expenditure in Australia has increased on average by 6.6 per cent a year in real terms between 2000 and 2011, well above the OECD average growth rate of 2.7 per cent. Australia’s expenditure on R&D is one of the fastest growing in the world, reflecting the country’s ongoing commitment to innovation.
GROSS DOMESTIC EXPENDITURE ON RESEARCH AND DEVELOPMENT1 – 2000–11
0
3
6
9
12
15
18
% c
ompo
und
annu
al g
row
th ra
te: 2
000–
11
Chi
na
17.7
Turk
ey
10.0
Sout
h K
orea
9.6
Taiw
an
Aust
ralia
7.4
Irela
nd
Pola
nd
5.7
6.6
Sing
apor
e
5.7M
exic
o
Spai
n
Rus
sia
5.5
Aus
tria
4.9Is
rael
2
Finl
and
5.14.4
EU 2
83
2.8
Luxe
mbo
urg
2.6
Italy
2.6
OEC
D –
Tot
al
2.7
Belg
ium
Ger
man
y
2.52.1
Fran
ce
2.0 1.9 1.8 1.8
USA
Can
ada
Japa
n
Net
herla
nds
1.6 1.5 1.5
UK
8.1
3.8
1. Based on gross domestic expenditure on R&D (GERD) at 2010 prices and Purchasing Power Parity terms 2. Information on data for Israel: http://dx.doi.org/10.1787/888932315602 3. OECD estimate and also see detailed standard footnotes for individual economies on page 11, OECD (2015), Main Science and Technology Indicators Volume 2015 Issue 1
Sources: OECD (2015), Main Science and Technology Indicators Volume 2015 Issue 3, OECD Publishing, Table 3, page 22; Austrade

24
/ AUSTRALIAN SCIENTIFIC RESEARCH HAS A MAJOR IMPACT Across 22 scientific research fields, almost 80 per cent of Australia’s major scientific research publications have a relative impact of at least 20 per cent above the global average. Among Australia’s strongest categories of published research are multidisciplinary, engineering, space science, materials science, physics, clinical medicine, environment/ecology, and geosciences.
RELATIVE IMPACTS OF AUSTRALIAN SCIENTIFIC PUBLICATIONS BY RESEARCH FIELD
0.0 0.2 0.4 0.6 0.8 1.0 1.2 1.4 1.6 1.8
1.551.48
1.461.43
1.431.43
1.42
1.41
1.391.39
1.381.38
1.331.30
1.27
1.271.22
1.19
Biology & BiochemistryMathematics
Social Sciences, GeneralNeuroscience & Behaviour
Psychiatry/PsychologyEconomics & Business
Pharmacology & ToxicologyMicrobiology
ChemistryImmunology
Molecular Biology & GeneticsAgricultural Sciences
Plant & Animal ScienceComputer Science
GeosciencesEnvironment/Ecology
Clinical MedicinePhysics
Materials ScienceSpace Science
EngineeringMultidisciplinary
1.18
1.131.08
0.97
Global Average: 1.0
Sources: InCitesTM, Thomson Reuters, data as at 17 November 2015; Austrade
SECTION 2 / INNOVATION

25SECTION 2 / INNOVATION
/ AUSTRALIA’S ACADEMIC AND RESEARCH INSTITUTIONS ARE AMONG THE BEST IN THE WORLDIn a ranking of the world’s top 200 universities by five key subject fields, Australia was the fifth highest ranked country overall, with particularly strong performances in Life and Agriculture Sciences, and Engineering/Technology and Computer Sciences.
AUSTRALIAN UNIVERSITIES’ ACADEMIC RANKING IN FIVE BROAD SUBJECT FIELDS – 2015
Note: The Academic Ranking of World Universities (ARWU) uses six objective indicators to rank world universities, including the number of alumni and staff winning Nobel Prizes and Fields Medals, number of highly cited researchers selected by Thomson Reuters, number of articles published in journals of Nature and Science, number of articles indexed in Science Citation Index – Expanded and Social Sciences Citation Index, and per capita performance of a university. More than 1,200 universities are actually ranked by ARWU every year and the best 500 are published.
Sources: The Academic Ranking of World Universities, The Center for World-Class Universities at Shanghai Jiao Tong University (CWCU) (http://www.ShanghaiRanking.com); Austrade
World’s Top 200 Universities’ Ranking
Natural Sciences Engineering/Technology Life and Agriculture Clinical Medicine Social Five Broad SubjectCountry and Mathematics and Computer Sciences Sciences and Pharmacy Sciences Fields Total
USA 68 54 81 79 100 382UK 17 12 21 20 26 96China 16 46 7 8 8 85Germany 15 5 13 16 5 54Australia 8 10 11 7 9 45Canada 5 6 8 12 13 44Netherlands 6 3 7 8 11 35France 11 8 9 6 — 34Japan 9 7 6 4 — 26Sweden 3 5 7 5 5 25Italy 8 5 1 8 — 22Switzerland 6 2 6 4 3 21Belgium 3 3 3 4 4 17Spain 4 4 3 2 2 15Denmark 3 2 3 3 3 14South Korea 3 7 1 2 — 13Israel 4 2 2 1 3 12Austria 2 1 2 3 1 9Singapore 2 2 1 1 2 8Norway — 1 2 3 2 8Other countries 7 15 6 4 3 35Total 200 200 200 200 200 1000

03
/ Workforce Skill Base Comparisons 28 / Percentage Employed Persons with Tertiary Education by Industry 29 / Australia’s Employed Persons by Industry 30 / Australia’s Labour Productivity and Costs 31 / Global Talent Competitiveness Ranking 32 / International Student Enrolments in Australia by Sub-sector 33 / All Overseas Students by Regional Grouping 34 / Australia’s Labour Force by Birthplace 35 / Foreign-Born Population 36
SECTION
TALENT
TALENT

SECTION 1 / GROWTH 27
TALENTAUSTRALIA HAS ONE OF THE MOST EDUCATED, MULTICULTURAL AND MULTILINGUAL LABOUR FORCES IN THE WORLD.
Ranked in the world’s top 10 for the talent of its people, Australia’s education system, research expertise and excellence in attracting and retaining human capital is among the best in the world.
Australia’s higher education enrolment rate is ranked in the world’s top 10. The nation is the third most popular destination for international students, the majority of whom are enrolled in business and technology-related courses.
Almost 30 per cent of Australia’s workers were born overseas. Around 2.1 million Australians speak an Asian language and 1.3 million speak a European language in addition to English.
With a ready supply of skilled workers, businesses will find easy access to a smart and culturally aware workforce in Australia.
ALMOST 40%OF AUSTRALIA’S WORKFORCE HOLDS A TERTIARY QUALIFICATION

28SECTION 3 / TALENT
/ WORLD’S HIGHEST SECONDARY EDUCATION ENROLMENT RATEInternational studies recognise the high levels of skill and education that make up Australia’s workforce. According to the World Economic Forum’s Global Competitiveness Report 2015–16, Australia’s secondary education enrolment rate is the world’s highest and the tertiary education enrolment rate the fifth highest. Australia also ranks second in the United Nations Development Programme’s Human Development Report 2014, which measures a country’s human, physical and educational wellbeing based on years of schooling, life expectancy and income.
WORKFORCE SKILL BASE COMPARISONS – 2015
NA = not available for publication
Sources: (a) World Economic Forum, Switzerland and Harvard University, Global Competitiveness Report 2015–16 (September 2015, 144 economies); (b) International Institute for Management Development (IMD), Switzerland, IMD World Competitiveness Yearbook 2015 (May 2015, 61 economies); (c) The United Nations Development Programme (UNDP), Human Development Report 2014 (published July 2014, 187 economies), Table 1; Austrade
South Hong Australia USA UK China Japan Korea India Kong Singapore
Global Competitiveness Report 2015–16 Ranking(a) in:
Secondary Education Enrolment Rate 1 61 54 74 24 48 105 37 17
Tertiary Education Enrolment Rate 5 3 37 83 40 2 86 30 9
Quality of Scientific Research Institutions 8 4 2 42 7 27 45 29 12
Higher Education and Training 8 6 18 68 21 23 90 13 1
Availability of Specialised Training Services 10 11 7 63 19 48 68 15 8
World Competitiveness Yearbook 2015 Ranking(b) in:
Foreign Labour Force 5 9 19 NA 32 27 NA NA 4
Finance Skills 5 11 14 47 35 33 30 7 18
Skilled Labour 7 25 31 40 49 23 38 22 32
Foreign High-skilled People 9 3 6 18 50 37 36 10 5
Educational System 10 19 18 40 36 25 33 15 3
Ethical Practices 12 11 18 37 10 39 46 16 20
UNDP’s Human Development Report 2014 Ranking(c) in:
Human Development Index 2 5 14 91 17 =15 135 =15 9

29SECTION 3 / TALENT
/ AUSTRALIA OFFERS SMART, SKILLED WORKERSAustralia has one of the most highly educated workforces in the world, with almost 40 per cent of workers on average holding a tertiary qualification. In six major sectors, including education and training; professional, scientific and technical services; financial and insurance services; healthcare; information media and telecommunications; and public administration, over half the workforce has a tertiary qualification or higher.
PERCENTAGE EMPLOYED PERSONS WITH TERTIARY EDUCATION BY INDUSTRY1 – 2014
0 10 20 30 40 50 60 70 80
Construction
Accommodation and Food Services
Retail Trade
Agriculture, Forestry and Fishing
Other Services
Manufacturing
Transport, Postal and Warehousing
Mining
Wholesale Trade
Administrative and Support Services
Rental, Hiring and Real Estate Services
Arts and Recreation Services
Electricity, Gas, Water and Waste Services
Public Administration and Safety
Information Media and Telecommunications
Financial and Insurance Services
Health Care and Social Assistance
Professional, Scientific and Technical Services
Education and Training
All-Industries Average: 39.6%
72.2
70.1
63.2
59.4
55.1
53.1
38.1
36.7
33.7
31.9
31.0
27.8
24.7
24.3
23.4
21.0
21.0
20.5
16.2
1. In this statistical release, tertiary education refers to Advanced Diploma/Diploma or higher
Sources: Australian Bureau of Statistics, Cat. No. 62270DO001_201405 Education and Work, Australia, May 2014 , Table 10 (released 12 December 2014); Austrade

30SECTION 3 / TALENT
/ A HIGHLY DIVERSE WORKFORCEAround 80 per cent of Australians are employed in the services sector. Forty per cent of people work in sectors where tertiary education is standard for many employees, including education and training; professional, scientific and technical services; financial and insurance services; healthcare; information media and telecommunications; and public administration.
AUSTRALIA’S EMPLOYED PERSONS BY INDUSTRY – 2015August 2015, trend terms
1. Including Administrative and Support Services (3.5%), Arts and Recreation Services (2.0%), Rental, Hiring and Real Estate Services (1.7%), Electricity, Gas, Water and Waste Services (1.2%) and Other (4.1%)
Sources: Australian Bureau of Statistics, Cat. No. 6291.0.55.003 Labour Force, Australia, Detailed, Quarterly, Table 04. Employed persons by Industry division of main job (ANZSIC) – Trend, Seasonally Adjusted and Original Time Series Workbook (released 17 September 2015); Austrade
Retail Trade 10.4% Construction 8.9%
Health Care and Social Assistance 12.7%
Professional, Scientific and Technical 8.5%
Accommodation and Food Services 7.1%
Education and Training 7.9%
Financial and Insurance Services 3.3%
Wholesale Trade 3.3%
Information Media and Telecommunications 1.7%
Public Administration and Safety 6.2%
Transport, Postal and Warehousing 5.3%
Manufacturing 7.6%
Other Services1 12.6%
Mining 2.0%
Agriculture, Forestry and Fishing 2.6%

31SECTION 3 / TALENT
/ GROWTH IN PRODUCTIVITY OUTPACING LABOUR COSTSAustralia has enjoyed a sustained period of labour productivity growth exceeding growth in real wages. The country’s labour productivity has recorded a compound annual growth rate of 1.7 per cent per annum since 1991, while real unit labour costs have fallen by 0.5 per cent each year. Australia has experienced a 7.2 per cent increase in average labour productivity between 2011 and 2015, while real unit labour costs have broadly remained stable, indicating that the effective cost of labour has remained in line with productivity improvements.
AUSTRALIA’S LABOUR PRODUCTIVITY AND COSTS – 1991–2015As at 30 June each year, trend terms
80
90
100
110
120
130
140
150
160
Inde
x, J
une
1991
= 10
0
Labour Productivity – GDP per Hour Worked
Real Unit Labour Costs
1991
1992
1993
1994
1995
1996
1997
1998
1999
2000
2001
2002
2003
2004
2005
2006
2007
2008
2009
2010
2011
2012
2013
2014
2015
Sources: Australian Bureau of Statistics, Cat. No. 5206.0 – Australian National Accounts: National Income, Expenditure and Product, Table 1. Key National Account Aggregates, Time Series Workbook (released 2 September 2015); Austrade
Compound Annual Growth Rate: 1991 to 2015
Labour Productivity: 1.7% pa
Real Unit Labour Costs: -0.5% pa

32SECTION 3 / TALENT
/ AUSTRALIA’S TALENT RANKING IS AMONG THE WORLD’S HIGHESTAccording to the Global Talent Competitiveness Index, Australia is in the world’s top 10 for the talent of the people it produces, attracts and retains. Australia is ranked 9th out of 93 countries, up from 15th place in 2013. The country is ranked first for education; and also placed highly for its openness to foreign investment, excellence in retaining talent, and research quality.
GLOBAL TALENT COMPETITIVENESS RANKING – 2014
Note: The Global Talent Competitiveness Index (GTCI) is produced jointly by INSEAD, Singapore’s Human Capital Leadership Institute and the Adecco Group. All scores range between 0 and 100. The GTCI is composed of Input and Output indexes. The Input sub-Index is composed of four pillars, describing the policies, resources and efforts that a particular country can harness to foster its talent competitiveness. Enablers (Pillar 1) reflects the extent to which the regulatory, market and business environments create a favourable climate for talent to develop and thrive. The other three pillars describe the three levers of talent competitiveness, which focus respectively on what countries are doing to Attract (Pillar 2), Grow (Pillar 3) and Retain (Pillar 4) talent. The Output sub-index, which aims to describe and measure the quality of talent, includes two pillars, describing the current situation of a particular country in terms of Labour and Vocational and Global Knowledge skills.
Sources: The Global Talent Competitiveness Index 2014, Growing talent for today and tomorrow, 2014; Austrade
Overall IndexSub-index Global Ranking
Input Output Global Rank (out of Labour & Global Score 93 economies) Enablers Attract Grow Retain Vocational Skills Knowledge
Switzerland 71.5 1 2 9 3 2 5 5Singapore 70.7 2 1 1 13 9 7 2Luxembourg 70.2 3 24 2 16 1 6 1USA 68.3 4 9 11 2 3 13 4Canada 66.5 5 4 7 4 5 20 16Sweden 65.7 6 5 10 6 18 9 10UK 64.7 7 10 13 8 21 10 6Denmark 64.1 8 3 15 5 25 18 7Australia 64.0 9 18 5 7 4 38 12Ireland 63.7 10 6 6 11 19 32 15Norway 63.6 11 14 8 10 7 19 19Netherlands 63.3 12 15 14 1 13 22 13Germany 61.8 14 19 18 19 6 3 25New Zealand 60.6 16 7 12 14 40 44 8Japan 58.0 20 13 54 27 11 8 17UAE 56.7 22 11 4 24 32 31 52France 56.5 23 33 28 17 23 11 21South Korea 52.2 29 26 65 31 35 28 18Spain 51.3 30 45 29 22 16 50 33Malaysia 49.9 35 22 44 38 52 26 38Italy 49.5 36 55 58 30 28 14 40China 45.2 41 52 61 33 65 47 24Brazil 42.8 49 57 33 49 33 68 76Philippines 41.6 54 70 57 44 72 69 29Thailand 40.2 61 47 78 35 66 80 54Vietnam 36.5 75 60 79 83 77 76 48India 34.1 78 69 82 75 89 66 64Indonesia 31.1 86 87 85 79 82 84 83
33SECTION 3 / TALENT
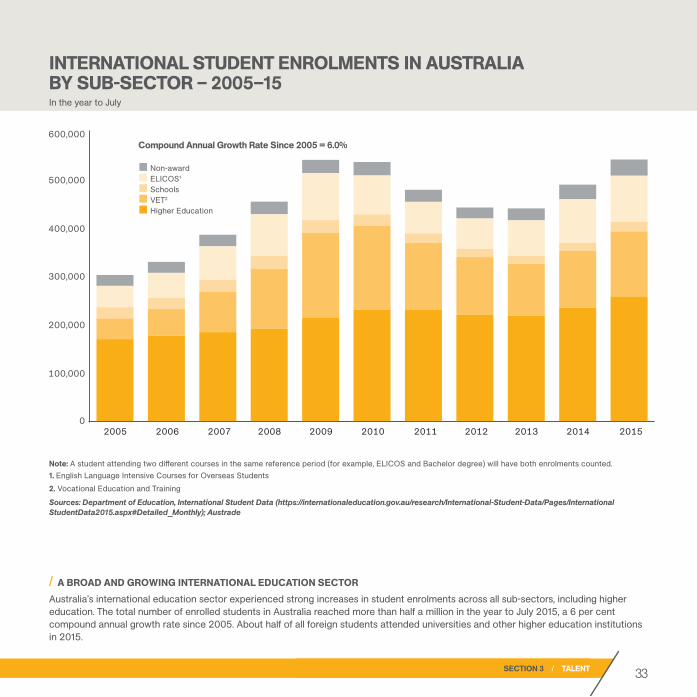
/ A BROAD AND GROWING INTERNATIONAL EDUCATION SECTORAustralia’s international education sector experienced strong increases in student enrolments across all sub-sectors, including higher education. The total number of enrolled students in Australia reached more than half a million in the year to July 2015, a 6 per cent compound annual growth rate since 2005. About half of all foreign students attended universities and other higher education institutions in 2015.
INTERNATIONAL STUDENT ENROLMENTS IN AUSTRALIA BY SUB-SECTOR – 2005–15In the year to July
Note: A student attending two different courses in the same reference period (for example, ELICOS and Bachelor degree) will have both enrolments counted.1. English Language Intensive Courses for Overseas Students2. Vocational Education and Training
Sources: Department of Education, International Student Data (https://internationaleducation.gov.au/research/International-Student-Data/Pages/International StudentData2015.aspx#Detailed_Monthly); Austrade
0
100,000
200,000
300,000
400,000
500,000
600,000
2005 2006 2007 2008 2009 2010 2011 2012 2013 2014 2015
Gro
ss re
sour
ces
devo
ted
to R
&D (A
$ bi
llion
)
Non-awardELICOS1
SchoolsVET2
Higher Education
Compound Annual Growth Rate Since 2005 = 6.0%
34SECTION 3 / TALENT
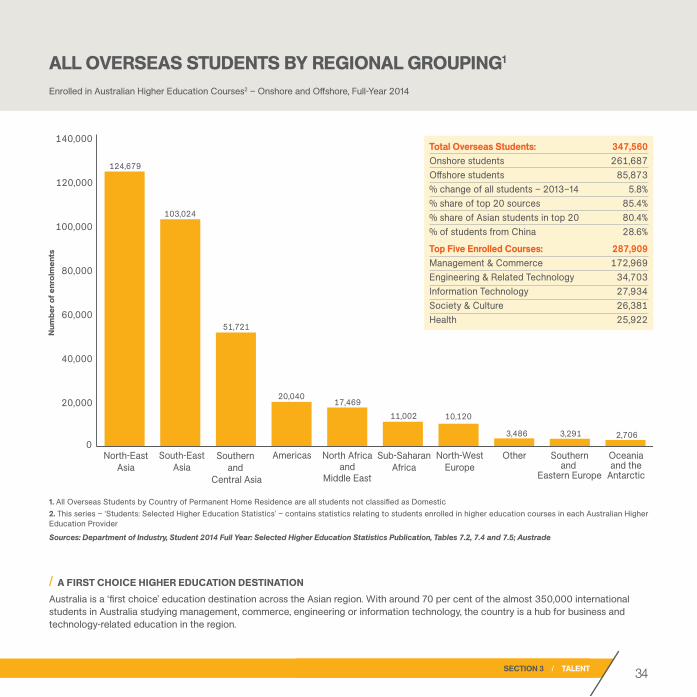
/ A FIRST CHOICE HIGHER EDUCATION DESTINATIONAustralia is a ‘first choice’ education destination across the Asian region. With around 70 per cent of the almost 350,000 international students in Australia studying management, commerce, engineering or information technology, the country is a hub for business and technology-related education in the region.
ALL OVERSEAS STUDENTS BY REGIONAL GROUPING1
Enrolled in Australian Higher Education Courses2 – Onshore and Offshore, Full-Year 2014
0
20,000
40,000
60,000
80,000
100,000
120,000
140,000
North-East Asia
South-East Asia
Southern and
Central Asia
North Africa and
Middle East
Americas Sub-Saharan Africa
North-West Europe
Southern and
Eastern Europe
Oceania and the
Antarctic
Other
Total Overseas Students: 347,560 Onshore students 261,687 Offshore students 85,873 % change of all students – 2013–14 5.8% % share of top 20 sources 85.4% % share of Asian students in top 20 80.4% % of students from China 28.6%
Top Five Enrolled Courses: 287,909 Management & Commerce 172,969 Engineering & Related Technology 34,703 Information Technology 27,934 Society & Culture 26,381 Health 25,922
124,679
103,024
20,040 17,469
11,002 10,120
3,486 3,291 2,706
51,721
Num
ber o
f enr
olm
ents
1. All Overseas Students by Country of Permanent Home Residence are all students not classified as Domestic2. This series – ‘Students: Selected Higher Education Statistics’ – contains statistics relating to students enrolled in higher education courses in each Australian Higher Education Provider
Sources: Department of Industry, Student 2014 Full Year: Selected Higher Education Statistics Publication, Tables 7.2, 7.4 and 7.5; Austrade

35SECTION 3 / TALENT
/ A CULTURALLY DIVERSE LABOUR FORCEAlmost 30 per cent of Australia’s labour force of 12.5 million people was born overseas. Many foreign-born workers are from Asia or Europe, enriching Australia’s reputation for multilingual, multicultural workplaces.
AUSTRALIA’S LABOUR FORCE BY BIRTHPLACE – 2015Total labour force as at September 2015: 12,517,100
Australian Born 70.9%
Overseas Born 29.1%
Americas 1.3%
Sub-Saharan Africa 1.8%
North-West Europe 6.9%
North Africa & The Middle East 1.3%
Southern & Central Asia 3.9%
North-East Asia 3.4%
Southern & Eastern Europe 2.4%
South-East Asia 4.1%
Oceania & the Antarctic 3.9%
Sources: Australian Bureau of Statistics, Cat. No. 6291.055.001 – Labour Force, Australia, Detailed – Electronic Delivery, September 2015, data cubes LM5 (released 22 October 2015); Austrade

36SECTION 3 / TALENT
/ A CULTURALLY DIVERSE COUNTRYAustralia is one of the most culturally diverse countries in the OECD. Around 2.1 million Australians speak an Asian language and 1.3 million speak a European language in addition to English, providing companies with access to a workforce that is well equipped with the cultural understanding and language capabilities to service international businesses in their own languages.
FOREIGN-BORN POPULATIONAs a percentage of the total population, 2000 and 2013
Note: Data refers to 2000 or to the closest year with available data and to 2013 or most recent available year.
Sources: OECD International Migration Database; Austrade
0
10
20
30
40
50
Mex
ico
Japa
n
Pola
nd
Sout
h Ko
rea
Turk
ey
Chi
le
Hun
gary
Finl
and
Port
ugal
Den
mar
k
Italy
Net
herla
nds
Fran
ce
UK
OEC
D a
vera
ge
USA
Ger
man
y
Spai
n
Nor
way
Belg
ium
Swed
en
Irela
nd
Aust
ria
Can
ada
New
Zea
land
Aust
ralia
Switz
erla
nd
Luxe
mbo
urg
2000 2013
0.8
1.
6
1.8 2.0
2.0 2.4
4.5 5.
6
8.3
8.5
9.4
11
.6
11.9
12
.3
12.7
13.1
13.3
13.4
13.9
15.5
16.0
16.4
16.7
19.8
25.2
27.6
28.3
42.6

04
/ Australia’s Trade by Broad Sector and Top Five Commodities 39 / Australia’s Trade in Goods and Services by Top 15 Partners 40 / Australia: A Partner for Growth in Asia 41 / Total Foreign Investment Stock in Australia 42 / Australia’s Share of Global Foreign Direct Investment Stock 43 / Main Sources of Foreign Direct Investment Stock in Australia 44 / Australia’s International Visitors and Total Trip Expenditure 45
by Country of Residence
SECTION
LOCATION
LOCATION

SECTION 1 / GROWTH 38
LOCATION
Existing and new trade agreements are set to drive the flow of goods, services and investments between Australia and its major trading partners in Asia, Europe and North America.
Australia remains a favoured destination for international investment and tourism, with Asia a fast-growing source of foreign direct investment and overseas visitors.
Australia’s location also bridges the world’s major time zones, offering 24-hour access for organisations with round-the-clock operations.
CHINAJAPANUSASOUTH KOREASINGAPORE
TOP TRADINGPARTNERS
AUSTRALIA IS WELL PLACED AS A TRADE AND INVESTMENT BASE FOR ASIAN EXPANSION. TEN OF THE NATION’S TOP 12 EXPORT MARKETS ARE WITHIN THIS RAPIDLY GROWING REGION.

39SECTION 4 / LOCATION
/ AUSTRALIA’S EXPORTS ARE IN DEMANDWhile export volumes of commodities such as iron ore continued to grow strongly last year, food exports rose 9 per cent in 2014–15 to account for more than 15 per cent (almost A$39 billion) of Australia’s total merchandise exports. Australia’s services sector contributed A$62 billion to export earnings in 2014–15, thanks to the country’s world-class education and tourism sectors.
AUSTRALIA’S TRADE BY BROAD SECTOR AND TOP FIVE COMMODITIES
Australia’s Trade by Broad Sector1
2013–14 2014–15 Change A$ billion A$ billion %
Exports of Goods and Services 331.2 318.4 -3.9
Goods Exports 272.9 254.3 -6.8
Primary product – Food 35.7 38.9 8.8
Unprocessed food 15.5 15.3 -1.2
Processed food 20.2 23.6 16.5
Primary products – Resources2 167.5 144.3 -13.9
Minerals 96.5 78.1 -19.1
Fuels 71.0 66.2 -6.8
Other primary 7.7 7.4 -3.9
Manufactured products 42.1 43.4 3.2
Other goods (incl. gold) 19.9 20.4 2.0
Services Exports 57.4 62.4 8.8
BOP adjustment3 1.0 1.6 64.9
Imports of Goods and Services 339.1 341.1 0.6
Two-way Trade 670.3 659.6 -1.6
Top 5 Commodities (Goods and Services)1
2013–14 2014–15 Change A$ billion A$ billion %
Exports of Goods and Services
1 Iron ore and concentrates 74.7 54.4 -27.1
2 Coal 40.0 37.9 -5.1
3 Education services4 15.9 18.2 14.5
4 Natural gas 16.3 16.9 3.8
5 Personal travel (excl. edu)5 13.9 14.4 3.9
Imports of Goods and Services
1 Personal travel (excl. edu)5 25.5 24.3 -4.7
2 Passenger motor vehicles 17.8 18.7 4.9
3 Refined petroleum 19.2 18.1 -5.9
4 Crude petroleum 21.6 14.7 -31.9
5 Telecom equipment and parts 9.1 11.0 21.8
1. Goods on a recorded trade basis, services on balance of payment basis, original data 2. Primary products include the ABS adjustment for coal (refer ABS Cat. No. 5368.0 value adjustments, August 2015) 3. BOP adjustment includes low-value goods for imports and timing and valuation adjustments 4. Education-related travel services 5. Mainly recreational travel services
Sources: Department of Foreign Affairs and Trade (DFAT), Trade and economic statistics, Monthly Trade Data – August 2015, Table 1 (last updated 8 October 2015); ABS Cat. No. 5386.0 International Trade in Goods and Services, Australia, Tables 11a and 11b; DFAT, Trade and economic statistics, Trade time series data, Country and commodity pivot table 2005–06 to 2014–15 (last updated: September 2015 using ABS catalogue 5368.0, July 2015 data); Austrade
40SECTION 4 / LOCATION
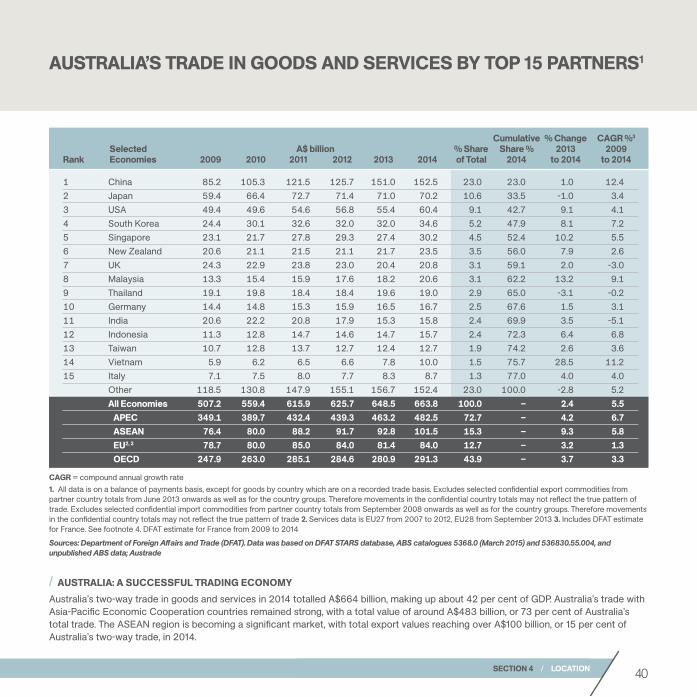
/ AUSTRALIA: A SUCCESSFUL TRADING ECONOMYAustralia’s two-way trade in goods and services in 2014 totalled A$664 billion, making up about 42 per cent of GDP. Australia’s trade with Asia-Pacific Economic Cooperation countries remained strong, with a total value of around A$483 billion, or 73 per cent of Australia’s total trade. The ASEAN region is becoming a significant market, with total export values reaching over A$100 billion, or 15 per cent of Australia’s two-way trade, in 2014.
AUSTRALIA’S TRADE IN GOODS AND SERVICES BY TOP 15 PARTNERS1
CAGR = compound annual growth rate1. All data is on a balance of payments basis, except for goods by country which are on a recorded trade basis. Excludes selected confidential export commodities from partner country totals from June 2013 onwards as well as for the country groups. Therefore movements in the confidential country totals may not reflect the true pattern of trade. Excludes selected confidential import commodities from partner country totals from September 2008 onwards as well as for the country groups. Therefore movements in the confidential country totals may not reflect the true pattern of trade 2. Services data is EU27 from 2007 to 2012, EU28 from September 2013 3. Includes DFAT estimate for France. See footnote 4. DFAT estimate for France from 2009 to 2014
Sources: Department of Foreign Affairs and Trade (DFAT). Data was based on DFAT STARS database, ABS catalogues 5368.0 (March 2015) and 536830.55.004, and unpublished ABS data; Austrade
Cumulative % Change CAGR %3
Selected A$ billion % Share Share % 2013 2009 Rank Economies 2009 2010 2011 2012 2013 2014 of Total 2014 to 2014 to 2014
1 China 85.2 105.3 121.5 125.7 151.0 152.5 23.0 23.0 1.0 12.42 Japan 59.4 66.4 72.7 71.4 71.0 70.2 10.6 33.5 -1.0 3.43 USA 49.4 49.6 54.6 56.8 55.4 60.4 9.1 42.7 9.1 4.14 South Korea 24.4 30.1 32.6 32.0 32.0 34.6 5.2 47.9 8.1 7.25 Singapore 23.1 21.7 27.8 29.3 27.4 30.2 4.5 52.4 10.2 5.56 New Zealand 20.6 21.1 21.5 21.1 21.7 23.5 3.5 56.0 7.9 2.67 UK 24.3 22.9 23.8 23.0 20.4 20.8 3.1 59.1 2.0 -3.08 Malaysia 13.3 15.4 15.9 17.6 18.2 20.6 3.1 62.2 13.2 9.19 Thailand 19.1 19.8 18.4 18.4 19.6 19.0 2.9 65.0 -3.1 -0.210 Germany 14.4 14.8 15.3 15.9 16.5 16.7 2.5 67.6 1.5 3.111 India 20.6 22.2 20.8 17.9 15.3 15.8 2.4 69.9 3.5 -5.112 Indonesia 11.3 12.8 14.7 14.6 14.7 15.7 2.4 72.3 6.4 6.813 Taiwan 10.7 12.8 13.7 12.7 12.4 12.7 1.9 74.2 2.6 3.614 Vietnam 5.9 6.2 6.5 6.6 7.8 10.0 1.5 75.7 28.5 11.215 Italy 7.1 7.5 8.0 7.7 8.3 8.7 1.3 77.0 4.0 4.0 Other 118.5 130.8 147.9 155.1 156.7 152.4 23.0 100.0 -2.8 5.2 All Economies 507.2 559.4 615.9 625.7 648.5 663.8 100.0 – 2.4 5.5 APEC 349.1 389.7 432.4 439.3 463.2 482.5 72.7 – 4.2 6.7 ASEAN 76.4 80.0 88.2 91.7 92.8 101.5 15.3 – 9.3 5.8 EU2, 3 78.7 80.0 85.0 84.0 81.4 84.0 12.7 – 3.2 1.3 OECD 247.9 263.0 285.1 284.6 280.9 291.3 43.9 – 3.7 3.3

41SECTION 4 / LOCATION
/ ASIAN DEMAND DRIVING TRADE GROWTHAustralia’s integration with the dynamic Asian region is driving wealth creation and overall growth. Australia’s goods and services exports totalled A$327 billion in 2014. Of the top 12 export markets in 2014, 10 were in the Asian region and all were rated above investment-grade. Their combined value was around A$235 billion, making up about 72 per cent of Australia’s total export earnings in 2014.
AUSTRALIA: A PARTNER FOR GROWTH IN ASIATen of Australia’s top 12 goods and services export markets were in the Asian region in 2014
Australia
MalaysiaA$8.0b
Indonesia
IndiaA$11.4b A$6.1b
TaiwanA$7.9b
ChinaA$98.3b
SouthKoreaA$22.1b
EuropeA$25.9b(Incl. UK:A$8.3b)
JapanA$50.4b
SingaporeA$12.1b
NZA$12.1b
A$6.9b
AmericaA$24.6b(Incl. USA:A$18.5b)
Source: Country ceiling for foreign currencybonds (Moody’s, 25 September 2015)
A (A1, A2)Baa (Baa2)
AaaAa (Aa1, Aa2, Aa3)
Note: Country ceiling for Europe and North America only reflect the UK and the USA.
Sources: Department of Foreign Affairs and Trade, Composition of Trade 2014, pages 43 and 46 (released 4 August 2015); Austrade

42SECTION 4 / LOCATION
/ A HIGH-GROWTH DESTINATION FOR FOREIGN INVESTMENTAustralia presently hosts almost A$3 trillion of foreign investment stock. Both foreign direct investment and other investment (including portfolio investment) have recorded strong growth, up 8.7 per cent and 10.4 per cent each year respectively since 1995. As a percentage of GDP, Australia’s total value of foreign investment stock reached 185 per cent in June 2015, double that of two decades ago.
TOTAL FOREIGN INVESTMENT STOCK IN AUSTRALIA – 1995–2015
0
300
600
900
1,200
1,500
1,800
2,100
2,400
2,700
3,000
0
30
60
90
120
150
180
210
240
270
300
Fina
ncia
l yea
r tot
al e
ndin
g Ju
ne (A
$ bi
llion
)
% o
f GDP
Total Investment % of GDP (right-hand axis)
Direct Investment (left-hand axis, 8.7%)
Other Investment1 (left-hand axis, 10.4%)
Figure in the bracket represents the compound annual growth rate from 1995 to 2015
Jun
1995
Jun
1996
Jun
1997
Jun
1998
Jun
1999
Jun
2000
Jun
2001
Jun
2002
Jun
2003
Jun
2004
Jun
2005
Jun
2006
Jun
2007
Jun
2008
Jun
2009
Jun
2010
Jun
2011
Jun
2012
Jun
2013
Jun
2014
Jun
2015
185%
92%
1. Other investment is the balance of Total Investment less Direct Investment. As such, it represents Portfolio Investment, Financial Derivatives and Other Investment categories from the source ABS data
Sources: Australian Bureau of Statistics, Cat. No. 5302.0 Balance of Payments and International Investment Position, Australia, Table 79. International Investment: Levels of Foreign Liabilities – Financial Year (latest issue released 02 September 2015); ABS Cat. No. 5206.0 Australian National Accounts: National Income, Expenditure and Product, Table 34. Key Aggregates and analytical series, Annual; Austrade

43SECTION 4 / LOCATION
/ AN ATTRACTIVE DESTINATION FOR FDIAustralia remained one of the top 15 destinations for global foreign direct investment (FDI) stock in 2014, with a 2.2 per cent share of the global stock of FDI. Australia received US$565 billion in FDI in 2014, up from US$291 billion in 2004. As a percentage of GDP, FDI in Australia remained strong at 39 per cent on the back of continued economic expansion and integration with trading partners, particularly the Asian region.
AUSTRALIA’S SHARE OF GLOBAL FOREIGN DIRECT INVESTMENT STOCK – 2004–14
CAGR = compound annual growth rate
Sources: United Nations Conference Trade and Development (UNCTAD), FDI/TNC database (www.unctad.org/fdistatistics), Web tables 3 and 7; Austrade
Inward FDI Stock (US$ billion)
Inward FDI Stock as % of GDP
Inward FDI Stock % of Market Share
% Change
% CAGR
Economy 2004 2014 2004 2014 2004 2014 2004–09 2009–14 2004–14
World 10,192 26,039 23.7 33.6 100.0 100.0 72.8 47.9 9.8 Developed economies 7,755 17,004 23.6 37.4 76.1 65.3 56.3 40.3 8.2 Developing economies 2,256 8,310 24.0 28.3 22.1 31.9 117.4 69.4 13.9 South-East Asia (ASEAN) 373 1,687 43.9 68.1 3.7 6.5 139.3 89.1 16.3 Transition economies 181 725 22.7 27.8 1.8 2.8 224.1 23.7 14.9 USA 2,717 5,410 22.1 31.1 26.7 20.8 10.2 80.6 7.1 UK 740 1,663 32.2 56.5 7.3 6.4 42.1 58.1 8.4 Hong Kong 427 1,550 252.5 535.1 4.2 6.0 111.8 71.4 13.8 China 245 1,085 12.6 10.5 2.4 4.2 92.7 129.4 16.0 Singapore 216 912 189.1 296.2 2.1 3.5 135.2 79.6 15.5 Brazil 161 755 24.1 32.1 1.6 2.9 148.5 88.3 16.7 Germany 512 744 18.2 19.3 5.0 2.9 36.9 6.0 3.8 France 403 729 19.0 25.6 4.0 2.8 60.6 12.5 6.1 Spain 407 722 38.0 51.3 4.0 2.8 55.2 14.2 5.9 Switzerland 198 682 50.3 95.8 1.9 2.6 152.7 36.5 13.2 Netherlands 545 664 84.3 76.7 5.3 2.6 30.3 -6.5 2.0 Canada 315 631 31.0 35.3 3.1 2.4 73.9 15.1 7.2 Australia 291 565 44.3 39.1 2.9 2.2 51.0 28.5 6.9 Russia 122 379 20.7 20.4 1.2 1.5 209.8 -0.1 12.0 Italy 232 374 12.9 17.4 2.3 1.4 57.2 2.6 4.9 Indonesia 16 253 5.7 28.5 0.2 1.0 586.1 132.6 31.9 India 38 252 5.3 12.3 0.4 1.0 349.9 47.4 20.8 Thailand 54 199 33.4 53.3 0.5 0.8 98.5 86.4 14.0 South Korea 88 182 11.5 12.8 0.9 0.7 38.9 49.3 7.6 Japan 97 171 2.1 3.7 1.0 0.7 106.4 -14.8 5.8 Malaysia 43 134 34.5 40.9 0.4 0.5 83.5 69.3 12.0 Vietnam 20 91 41.4 48.9 0.2 0.3 139.2 85.7 16.1 New Zealand 44 77 43.6 38.8 0.4 0.3 27.9 35.5 5.7 Taiwan 38 69 11.0 13.0 0.4 0.3 45.4 23.3 6.0 Philippines 13 57 13.9 20.0 0.1 0.2 80.0 149.0 16.2

44SECTION 4 / LOCATION
/ TRADITIONAL MARKETS STILL STRONGEST, BUT INVESTMENT FROM ASIA IS INCREASINGAustralia’s inward FDI stock reached A$688 billion in 2014, up 40 per cent from 2009 figures. The European Union (including the UK) and the United States remain dominant sources of FDI, with totals of A$170 billion and A$163 billion respectively. Major Asian nations are fast-growing sources of FDI, with China FDI stock recording a compound annual growth rate over the past five years of 27 per cent, followed by South Korea (20 per cent), Malaysia (17 per cent) and Hong Kong (16 per cent).
MAIN SOURCES OF FOREIGN DIRECT INVESTMENT STOCK IN AUSTRALIA – 2009–14
ASEAN = The Association of Southeast Asian Nations; CAGR = compound annual growth rate from 2009 to 2014; np = not available for publication but included in totals where applicable, unless otherwise indicated; na = not applicable; UAE = United Arab Emirates Sources: Australian Bureau of Statistics, Cat. No. 5352.0 – International Investment Position, Australia: Supplementary Statistics, 2014 (released 8 May 2015), Table 2. Foreign Investment in Australia: Level of Investment by Country and Country Groups by type of investment and year ($million); Austrade
A$ billion % Share % Change % CAGR Economy 2009 2010 2011 2012 2013 2014 2014 2013–14 2009–14 2009–14
1 USA 98.2 110.3 113.5 125.5 144.9 163.4 23.7 12.8 66.4 10.72 UK 61.0 53.7 68.2 78.8 87.6 87.4 12.7 -0.3 43.3 7.53 Japan 45.6 51.1 54.1 62.2 64.4 66.1 9.6 2.7 44.9 7.74 Netherlands 31.4 27.6 29.7 29.7 29.1 38.4 5.6 32.1 22.4 4.15 China 9.1 12.9 14.4 16.4 23.4 30.0 4.4 28.3 230.9 27.06 Singapore 16.7 18.7 19.9 22.4 23.3 28.0 4.1 20.2 67.5 10.97 Canada 12.2 14.9 19.0 21.0 16.8 23.6 3.4 40.7 92.9 14.08 Switzerland 17.8 20.9 22.9 22.5 19.4 19.0 2.8 -1.8 7.0 1.49 Germany 18.1 16.8 14.1 13.6 13.5 15.8 2.3 16.8 -13.0 -2.710 UAE np np np np np 14.6 2.1 na na na11 Hong Kong 5.4 6.6 7.6 7.4 7.9 11.5 1.7 44.5 110.8 16.112 Malaysia 4.5 3.7 – 7.1 9.1 9.6 1.4 4.8 114.7 16.513 Bermuda 9.5 7.5 5.8 6.4 9.8 9.2 1.3 -6.1 -3.2 -0.614 France 13.0 13.0 7.2 6.9 5.5 5.8 0.8 5.1 -55.3 -14.915 New Zealand 6.2 6.4 5.6 4.5 5.4 5.4 0.8 -0.8 -13.0 -2.716 Thailand np np np np 4.6 4.6 0.7 -1.7 na na17 Belgium 5.6 6.2 5.7 4.5 4.8 4.3 0.6 -8.7 -22.7 -5.018 South Korea 1.3 2.1 – 2.6 2.9 3.2 0.5 7.2 144.9 19.6 Total all countries 489.9 518.6 545.4 587.3 633.4 688.4 100.0 8.7 40.5 7.0 EU 144.8 133.8 140.1 149.9 155.9 169.6 24.6 8.8 17.2 3.2 ASEAN 22.1 25.8 28.0 32.7 37.1 42.3 6.1 13.9 91.7 13.9

45SECTION 4 / LOCATION
/ RECORD NUMBER OF VISITORS PROVIDES GREATER OPPORTUNITY FOR INVESTMENTAustralia’s international visitor numbers rose by 7 per cent to a new high of 6.6 million in 2014–15. These visitors spent a record A$33.4 billion, a 10 per cent increase on the previous year. Visitors from the Asian region accounted for more than 60 per cent of Australia’s total number of tourists. There were 864,000 Chinese visitors in 2014–15, up 22 per cent on the previous year. There was also strong growth in visitors from the United States (up 9 per cent to 544,000).
AUSTRALIA’S INTERNATIONAL VISITORS AND TOTAL TRIP EXPENDITURE BY COUNTRY OF RESIDENCE1 – 2014–15
1. Estimates are for international visitors aged 15 years and over 2. Individual percentages may not add to 100 due to rounding
Sources: Tourism Research Australia: International Visitors Survey; Austrade
Country of Residence
TotalNew ZealandChinaUKUSASingaporeJapanMalaysiaIndiaSouth KoreaHong KongGermanyIndonesiaCanadaTaiwanFranceScandinaviaThailandItalySwitzerlandNetherlandsOther countriesOther AsiaOther Europe
Year Ending % Change Year June 2015 Ending June 2014 to Visitors (‘000) % of Visitors2 Year Ending 2015
6,567 100.0 6.6 1,154 17.6 3.5 864 13.2 21.7 629 9.6 0.4 544 8.3 8.7 325 5.0 2.1 297 4.5 -0.2 293 4.5 5.7 207 3.2 19.9 197 3.0 7.4 186 2.8 2.9 181 2.8 4.6 137 2.1 2.7 135 2.1 5.7 114 1.7 4.6 113 1.7 3.7 95 1.4 1.3 70 1.1 -2.4 70 1.1 -1.8 51 0.8 9.1 43 0.7 -4.6 435 6.6 7.9 216 3.3 16.4 211 3.2 1.1
Year Ending % Change Year June 2015 Trip % of Trip Ending June 2014 toExpenditure (A$m) Expenditure2 Year Ending 2015
33,422 100.0 10.4 2,493 7.5 5.4 6,996 20.9 32.1 3,507 10.5 -2.0 3,028 9.1 14.5 1,216 3.6 12.5 1,337 4.0 -1.3 1,100 3.3 7.5 1,041 3.1 38.9 1,179 3.5 6.6 1,074 3.2 14.1 1,015 3.0 -1.7 593 1.8 -7.7 818 2.4 6.5 708 2.1 13.4 755 2.3 5.3 596 1.8 9.9 325 1.0 -13.8 469 1.4 -9.6 366 1.1 16.0 241 0.7 -8.7 2,217 6.6 9.2 1,083 3.2 10.3 1,264 3.8 -3.3

05
/ Index of Economic Freedom World Ranking 48 / Key Indicators of Ease of Doing Business 49 / Global Prime Office Occupancy Costs 50 / Remuneration of Management 51 / Business Efficiency and Environment 52 / Worldwide Governance Indicators 53 / Assets of Australian Financial Institutions 54 / Australia’s Superannuation Assets – Trends and Projections 55 / Australian Financial Markets Annual Turnover 56 / Size of Key Global Stock Markets 57 / International and Domestic Debt Securities in Asia-Pacific Region 58
SECTION
BUSINESS
BUSINESS

SECTION 1 / GROWTH 47
BUSINESS
For the seventh year in a row, Australia is ranked in the global top five on the Index of Economic Freedom. Remuneration rates for professionals and the cost of prime office space is among the most competitive in the world.
Australia has a sophisticated financial sector that offers access to one of the Asia-Pacific region’s largest pools of bank assets, as well as the world’s fourth largest pension assets pool.
These credentials attract some of the world’s largest organisations to Australia. Eighteen of the Top 20 FT Global 500 companies and eight of the Top 10 Fortune 100 have operations in Australia. One in four businesses in Australia with more than 200 employees is at least 50 per cent foreign-owned.
AUSTRALIA’S POLITICAL STABILITY, TRANSPARENT REGULATORY SYSTEM, AND SOUND GOVERNANCE FRAMEWORKS PROVIDE A SECURE SETTING FOR TRADE AND INVESTMENT.
MORE THAN 21,000FOREIGN COMPANIES
REGISTERED INAUSTRALIA

48SECTION 5 / BUSINESS
/ AUSTRALIA’S POLICIES CREATE AN ENVIRONMENT OF ECONOMIC FREEDOMAustralia ranks fourth in the 2015 Index of Economic Freedom. The survey states that ‘regulatory efficiency remains firmly institutionalised, and well-established open-market policies sustain flexibility, competitiveness, and large flows of trade and investment’.
INDEX OF ECONOMIC FREEDOM WORLD RANKING – 20151
Economic Freedom Score80 to 100 Free70 to 79.9 Mostly Free60 to 69.9 Moderately Free50 to 59.9 Mostly Unfree0 to 49.9 Repressed
0 20 40 60 80 100
Hong Kong (1)Singapore (2)
New Zealand (3)Australia (4)
Switzerland (5)Canada (6)
Chile (7)Estonia (8)Ireland (9)
Mauritius (10)Denmark (11)
USA (12)UK (13)
Taiwan (14)Germany (16)
Netherlands (17)Japan (20)
UAE (25)Norway (27)
South Korea (29)Malaysia (31)Mexico (59)France (73)
Thailand (75)Philippines (76)
Italy (80)Brazil (118)India (128)
China (139)Russia (143)
Vietnam (148)
89.689.4
82.181.4
80.579.1
78.576.876.676.476.376.2
75.875.1
73.873.773.3
72.471.871.5
70.866.4
62.562.4
62.261.7
56.654.6
52.752.151.7
1. The 2015 Index of Economic Freedom covers 186 economies and measures 10 components of economic freedom (Business Freedom, Trade Freedom, Fiscal Freedom, Government Spending, Monetary Freedom, Investment Freedom, Financial Freedom, Property Rights, Freedom from Corruption and Labour Freedom). The 10 component scores are equally weighted and averaged to get an overall economic freedom score for each economy. The number in brackets in the chart indicates the country’s world ranking
Sources: The Wall Street Journal and The Heritage Foundation, 2015 Index of Economic Freedom; Austrade

49SECTION 5 / BUSINESS
/ A GOOD PLACE TO DO BUSINESSAustralia is ranked 13th out of 189 economies for ease of doing business, and fifth when compared to economies with a similar or larger population. The country’s quality of judicial processes index is rated the world’s best. Australia also ranks well for enforcing contracts (4th out of 189 economies) and in the ease of getting credit (5th out of 189 economies).
KEY INDICATORS OF EASE OF DOING BUSINESS1
Note: Australia’s 2015 ranking was changed from the 10th position to the 12th because of changes to the methodology and data revisions due to new information.1. Doing Business 2016 is the 13th in a series of annual reports measuring the regulations that enhance business activity and those that constrain it. All Doing Business 2015 rankings have been recalculated to reflect changes to the methodology and revisions of data due to new information. Doing Business measures regulations affecting 11 areas of the life of a business. Ten of these areas are included in this year’s ranking on the ease of doing business: starting a business, dealing with construction permits, getting electricity, registering property, getting credit, protecting minority investors, paying taxes, trading across borders, enforcing contracts and resolving insolvency. Data in Doing Business 2016 is current as of 1 June 2015
Sources: World Bank Group, Doing Business 2016: Measuring Regulatory Quality and Efficiency. Washington, DC: World Bank Group (released 27 October 2015); Austrade
Ease of Doing Business
Starting a Business
Getting Credit
Enforcing Contracts
Resolving Insolvency
Overall Strength of Depth of Quality of Recovery Ranking Legal Rights Credit Judicial Rate (cents Out of 189 Procedures Time Index Information Time Processes in the Time Economies Rank (number) (days) Rank (0-12) Index (0-8) Rank (days) Index (0-18) Rank dollar) (years)
Singapore 1 10 3 2.5 19 8 7 1 150 15.5 27 89.7 0.8New Zealand 2 1 1 0.5 1 12 8 15 216 11.0 31 83.3 1.3Denmark 3 29 4 3.0 28 8 6 37 410 10.0 9 87.8 1.0South Korea 4 23 3 4.0 42 5 8 2 230 13.5 4 83.6 1.5Hong Kong 5 4 2 1.5 19 8 7 22 360 11.0 26 87.2 0.8UK 6 17 4 4.5 19 7 8 33 437 15.0 13 88.6 1.0USA 7 49 6 5.6 2 11 8 21 420 13.8 5 80.4 1.5Sweden 8 16 3 7.0 70 6 5 24 321 12.0 19 76.6 2.0Norway 9 24 4 4.0 70 5 6 8 280 10.0 6 92.5 0.9Finland 10 33 3 14.0 42 7 6 30 375 9.0 1 90.1 0.9Taiwan 11 22 3 10.0 59 4 8 16 510 13.0 21 81.8 1.9Australia 13 11 3 2.5 5 11 7 4 395 15.5 14 82.1 1.0Malaysia 18 14 3 4.0 28 7 7 44 425 12.0 45 81.3 1.0Japan 34 81 8 10.2 79 4 6 51 360 7.5 2 92.9 0.6Thailand 49 96 6 27.5 97 3 6 57 440 6.5 49 42.5 2.7China 84 136 11 31.4 79 4 6 7 453 14.1 55 36.2 1.7Vietnam 90 119 10 20.0 28 7 7 74 400 6.5 123 20.1 5.0Philippines 103 165 16 29.0 109 3 5 140 842 7.5 53 21.4 2.7Indonesia 109 173 13 47.8 70 5 6 170 471 6.3 77 31.2 1.9India 130 155 13 29.0 42 6 7 178 1,420 7.5 136 25.7 4.3

50SECTION 5 / BUSINESS
/ A COST-COMPETITIVE LOCATION FOR OFFICE SPACEThe cost of prime office space in Australia (using an average of all major cities) is among the most competitively priced in the world, and compares favourably to global and regional business centres. The cost of prime office space in Sydney is a third of the cost of London (West End) and Hong Kong, and half of that in Beijing.
GLOBAL PRIME OFFICE OCCUPANCY COSTS – 2015US$ per square feet/annum
Note: Occupancy costs include service charges and taxes and are standardised on a net internal area basis.
Sources: CB Richard Ellis Research, June 2015 Global Prime Off i ce Occupancy Costs; Austrade
0 50 100 150 200 250 300
267.1 254.2
195.8 157.0
142.8 142.7
128.1 127.0 126.4
114.0 110.3
107.6 99.9
98.7 92.6
87.7 86.4
82.8 75.9
73.1 66.1 65.9
62.6 58.7 57.1 56.7
48.7 44.6
41.3 37.3 36.5
30.8 29.9 Canberra
Bangkok Bangalore Adelaide
Manila Calgary (CBD)
MelbourneFrankfurt am Main
BrisbaneMilan
Ho Chi Minh City PerthTaipei
Jakarta Mumbai (CBD)
Zurich New York (Downtown)
SydneyDubai Seoul
Paris Ile-de-France Singapore
Shanghai (Puxi) San Francisco
Shanghai (Pudong) New York (Midtown)
Moscow London (City)
Tokyo (Inner Central) New Delhi (CBD)
Beijing (Finance Street)
(Finance street)
Hong Kong London (West End)

51SECTION 5 / BUSINESS
/ COMPETITIVE REMUNERATION RATES FOR PROFESSIONALSAustralia offers a highly skilled, multilingual and competitively priced domestic workforce. Salary levels in Australia for skilled professionals are generally competitive relative to major centres around the world, due to moderate wage growth over the past three years and a depreciating Australian dollar.
REMUNERATION OF MANAGEMENT Total base salary plus bonuses and long-term incentives, US$’000
Director Human Resources CEO Engineer Manufacturing Director
2014 2014 2014 2014
Switzerland 857 198 360 343USA 757 112 321 267Germany 602 165 275 270UK 642 110 208 211France 578 120 235 208Italy 526 124 234 219Netherlands 487 143 219 212Japan 456 141 209 237Singapore 459 97 249 236Sweden 372 127 344 185HongKong 456 100 233 212Spain 406 93 219 176SouthKorea 430 102 177 174Canada 387 105 195 194Mexico 362 69 219 187Australia 348 88 180 145NewZealand 383 55 117 189UAE 303 90 150 190Norway 274 122 157 156Brazil 310 72 136 124Taiwan 274 76 143 133Thailand 277 55 132 138Philippines 188 55 160 123China 184 63 107 131Malaysia 179 48 108 101India 171 43 74 72Indonesia 142 33 76 64
Sources: IMD World Competitiveness Online 1995–2015; Austrade

52SECTION 5 / BUSINESS
/ A STABLE, FRIENDLY AND EFFICIENT ENVIRONMENT FOR DOING BUSINESSAustralia has one of the world’s most robust regulatory environments and is rated among the most business-friendly economies. The country ranks highly in terms of the soundness of its banks, legal rights and corporate debt. Australia also has one of the world’s most efficient stock markets, and strongest finance and banking regulation and competition legislation.
BUSINESS EFFICIENCY AND ENVIRONMENT – 2015
Sources: (a) World Economic Forum, Switzerland and Harvard University, Global Competitiveness Report 2015–16 (released September 2015, 144 economies); (b) Institute for Management Development (IMD), Switzerland, World Competitiveness Yearbook 2015 (released May 2015, 61 economies); Austrade
South Hong Australia USA UK China Japan Korea India Kong Singapore
Global Competitiveness Report 2015–16 Ranking(a) in:
Inflation, Annual % Change =1 =1 =1 =1 =1 =1 105 93 =1
Soundness of Banks 3 39 63 78 28 113 100 7 5
Legal Rights Index =4 =4 24 =80 =80 63 44 24 17
Number of Days to Start a Business =4 27 28 117 58 10 110 =4 =4
Efficacy of Corporate Boards 9 15 16 105 22 120 96 26 6
Strength of Auditing and Reporting Standards 9 23 15 80 14 72 95 6 7
No. of Procedures to Start a Business 9 =57 =57 123 93 =9 129 =9 =9
Intensity of Local Competition 9 4 3 36 1 13 101 2 21
Regulation of Securities Exchanges 10 24 21 52 11 78 69 4 3
World Competitiveness Yearbook 2015 Ranking(b) in:
Finance Management – Corporate Debt 3 7 21 43 20 51 35 6 15
Business Legislation – Openness – Tariff on Imports 4 6 15 54 12 57 60 1 2
Stock Market Efficiency – Stock Markets 5 4 19 38 9 35 24 1 15
Stock Market Efficiency – Shareholders’ Rights 6 13 16 52 41 57 36 14 19
Bank Efficiency – Finance and Banking Regulation 7 23 38 40 39 51 29 2 1
Bank Efficiency – Regulatory Compliance (Banking Laws) 7 21 39 55 13 50 33 3 4
Business Legislation – Competition Legislation 7 23 12 46 22 31 42 16 4
Societal Framework – Justice 8 17 12 43 16 39 34 5 13
Institutional Framework – Rule of Law 8 19 =11 48 =11 14 45 15 10

53SECTION 5 / BUSINESS
/ STRONG GOVERNANCE PROVIDES A STABLE BASE FOR BUSINESS AND INVESTMENTThe quality of governance in Australia ranks among the best in the world. Strong governance and healthy institutions are key to sustaining economic growth and security, providing a drawcard for multinationals expanding their businesses or considering Australia as a base in the Asian region.
WORLDWIDE GOVERNANCE INDICATORS1
1. Country scores are reported as percentile ranks, with higher values indicating better governance ratings. Percentile ranks indicate the percentage of countries worldwide that score below that country. There are 215 economies surveyed in the report. The six aggregate indicators are based on over 30 underlying data sources reporting the governance perceptions of survey respondents and expert assessments worldwide
Sources: The World Bank, Worldwide Governance Indicators 2015 (released 25 September 2015); Austrade
Political Stability 2014 Rank Voice and & Absence of Government Regulatory Rule of Control of by Economy Accountability Violence/Terrorism Effectiveness Quality Law Corruption
New Zealand 97.5 99.0 98.6 99.0 98.6 100.0Finland 98.0 95.6 99.0 98.6 100.0 98.1Switzerland 99.0 93.7 99.5 96.6 98.1 98.6Norway 100.0 90.3 96.6 92.3 99.0 99.0Sweden 99.5 86.9 95.7 96.2 97.6 97.6Luxembourg 96.6 98.1 93.3 92.8 95.7 96.6Netherlands 98.5 85.9 97.6 95.7 97.1 95.7Canada 95.6 91.3 95.2 97.6 94.7 93.8Denmark 97.0 79.6 96.2 94.7 99.5 99.5Australia 93.6 87.4 91.8 98.1 96.2 95.2Germany 96.1 79.1 94.7 94.2 93.3 94.7Ireland 92.6 86.4 92.3 95.2 92.8 91.8Hong Kong 65.0 89.8 98.1 99.5 93.8 92.3Singapore 45.3 92.2 100.0 100.0 95.2 97.1UK 92.1 60.7 92.8 97.1 94.2 92.8Japan 79.3 84.5 97.1 84.1 89.4 93.3USA 79.8 67.0 89.9 88.5 89.9 89.4France 89.2 59.2 88.9 82.2 88.5 88.0Taiwan 72.9 75.2 88.0 88.9 85.6 77.4Spain 77.3 58.3 84.6 75.5 79.8 70.2South Korea 69.0 53.9 86.5 83.7 80.8 69.7UAE 19.2 75.7 90.4 80.3 76.4 84.1Italy 75.9 64.1 66.8 72.6 66.8 55.3Malaysia 36.9 58.7 83.7 76.0 75.0 68.3Brazil 60.6 45.1 47.1 50.5 55.3 44.2Philippines 52.7 22.8 61.5 51.9 43.3 39.9Indonesia 53.2 31.1 54.8 49.0 41.8 34.1Thailand 25.6 16.5 65.9 62.0 51.4 42.3India 61.1 13.6 45.2 34.6 54.3 38.9China 5.4 29.6 66.3 45.2 42.8 47.1Vietnam 9.9 46.1 52.4 30.3 44.7 37.5

54SECTION 5 / BUSINESS
/ SUBSTANTIAL FINANCE SECTOR PROVIDES ACCESS TO CAPITALAustralia’s sophisticated financial services sector has significant depth with assets of more than A$7 trillion – over four times the country’s nominal GDP. The sector has grown 10 per cent a year over the past two decades, making it Australia’s largest contributor to gross value added and one of its highest growth sectors.
ASSETS OF AUSTRALIAN FINANCIAL INSTITUTIONSA$ billion
Managed Fund Sources – Consolidated Authorised Deposit-taking Reserve Bank Institutions2 and Total Total Life Other Domestic Other All Financial of Australia Registered Financial Managed Offices and Managed FinancialYear Ending June Systems (AFS)1 (RBA) Corporations Funds Industry Superannuation Funds3 Institutions4
Jun–1995 982 38 561 336 241 95 47
Jun–2000 1,787 55 900 707 455 252 124
Jun–2005 3,100 84 1,579 1,149 662 487 287
Jun–2010 4,953 86 2,855 1,734 1,041 693 279
Jun–2015 7,092 165 3,995 2,622 1,734 888 309
% of AFS assets 100.0 2.3 56.3 37.0 24.5 12.5 4.4
% of nominal GDP 440.2 10.3 248.0 162.8 107.7 55.1 19.2
% CAGR since 1995 10.4 7.7 10.3 10.8 10.4 11.8 9.8
CAGR = compound annual growth rateNote: The US$/A$ exchange rate was US$0.768 as at 30 June 2015 (sourced from RBA statistics, Table F11); the nominal value of Australia’s GDP in the year to June quarter 2015 was A$1,611 billion. .1. The sum may not be accurate due to rounding errors 2. The combined assets of banks, building societies and credit unions 3. The combined assets of public unit trusts, cash management trusts, common funds, friendly societies and funds managed by Australian investment managers on behalf of Australian entities other than collective investment institutions, and overseas investors 4. The combined assets of general insurance offices and securitisation vehicles
Sources: Reserve Bank of Australia Statistics, B1 Assets of Financial Institutions (updated 1 October 2015); RBA Statistics, B18 Managed Funds (updated 28 August 2015); Australian Bureau of Statistics, Cat. No. 5206.0 – Australian National Accounts: National Income, Expenditure and Product, June 2015 (released 2 September 2015), Table 34; Austrade

55SECTION 5 / BUSINESS
/ LONG-TERM PENSION POOL GROWTH SUPPORTS FUTURE INVESTMENT OPPORTUNITIESAustralia’s pension (superannuation) system is the fourth largest in the world, according to Towers Watson’s Global Pension Assets Study 2015. Australia’s A$2.1 trillion superannuation system is a major driver behind its globally significant funds management industry. This pool of assets is expected to grow to A$3.5 trillion over the next decade.
AUSTRALIA’S SUPERANNUATION ASSETS – TRENDS AND PROJECTIONS – 2004–25F
0
500
1,000
1,500
2,000
2,500
3,000
3,500
4,000
0
20
40
60
80
100
120
140
Jun
2004
Jun
2005
Jun
2006
Jun
2007
Jun
2008
Jun
2009
Jun
2010
Jun
2011
Jun
2012
Jun
2013
Jun
2014
Jun
2015
F
Jun
2018
F
Jun
2021
F
Jun
2025
F
A$ b
illio
n%
of GDP
635751
904
1,173 1,130 1,0361,190
1,337
1,619
1,8542,071
2,427
3,453
2,808
1,399
Superannuation asset % of GDP (right-hand axis)
F = KPMG projections
Sources: Australian Prudential Regulation Authority (APRA) Statistics – Annual Superannuation Bulletin June 2013, APRA Statistics – Quarterly Superannuation Performance, June 2015; asset projections for 2015 to 2025 by KPMG in the publication Supertrends (released May 2015), Figure 1, Page 8; Australia’s GDP figures were sourced from Australian Bureau of Statistics, Cat. No. 5206.0 Australian National Accounts: National Income, Expenditure and Product; Austrade
Compound annual growth rate of Australia’s superannuation assets from 2001 to 2015 = 11.3%

56SECTION 5 / BUSINESS
/ AUSTRALIA’S FINANCIAL MARKETS ARE AMONG THE LARGEST AND MOST SOPHISTICATED IN THE ASIAN REGIONOver the five years to June 2015, Australia’s financial markets have expanded, with total annual turnover (over-the-counter and exchange traded) rising 32 per cent to A$135 trillion. The latest figure is 84 times the size of Australia’s nominal GDP, reflecting the depth of the country’s financial markets.
AUSTRALIAN FINANCIAL MARKETS ANNUAL TURNOVER – 2015
0
20
40
60
80
100
120
140
2004–05 2005–06 2006–07 2007–08 2008–09 2009–10 2010–11 2011–12 2012–13 2013–14 2014–15
OTC Markets – Foreign Exchange OTC Markets – Other Exchange-Traded Markets
34
26
24
42
19
29
47
24
40
46
26
44
44
26
29
41
26
35
45
33
48
40
40
47
44
35
47
39
45
52
42
41
51
A$ tr
illio
n
Sources: Australian Financial Markets Association, 2015 Australian Financial Markets Report; Austrade

57SECTION 5 / BUSINESS
/ AUSTRALIA HAS THE THIRD LARGEST STOCK MARKET IN THE ASIAN REGIONAustralia is home to the third largest liquid stock market after Japan and China in the Asian region. It is the ninth largest in the world with total capitalisation value of over US$900 billion. Australia’s market capitalisation of free-floating shares is greater than South Korea’s US$776 billion, almost 75 per cent larger than Hong Kong’s US$540 billion and over four times the market capitalisation of Singapore’s at US$217 billion.
SIZE OF KEY GLOBAL STOCK MARKETS – 2015Market capitalisation of free-floating stocks (US$ billion, 30 October 2015)
Note: The number in brackets is the world ranking of each country or economy (out of 47). Standard & Poor’s capitalisation-weighted indices are float adjusted. Under float adjustment, the share counts used in calculating the indices reflect only those shares available to investors rather than all of a company’s outstanding shares. Float adjustment excludes shares that are closely held by control groups, other publicly traded companies or government agencies.
Sources: Standard & Poor’s, S&P Dow Jones Indices World-By-Numbers: October 2015; Austrade
0
200
400
600
800
1,000
1,200
1,400
Australia(9)
China(6)
SouthKorea
(10)
Taiwan(11)
HongKong(12)
India(13)
Singapore(22)
Malaysia(27)
Indonesia(31)
Thailand(28)
Philippines(32)
NewZealand
(37)
US$
billi
on
USA (1) 22,584 Japan (2) 3,939 UK (3) 2,997 France (4) 1,401 Switzerland (5) 1,313 China (6) 1,297 Canada (7) 1,289 Germany (8) 1,276 Australia (9) 936 Global 44,286
936
1,297
776
564 540493
217
121 119 99 76 46

58SECTION 5 / BUSINESS
/ REGIONAL LEADER IN THE ISSUANCE OF INTERNATIONAL AND DOMESTIC DEBT SECURITIESAustralia’s debt securities market remains the third largest in the Asian region with total amounts outstanding of around US$1.9 trillion in 2015, behind Japan’s US$11.2 trillion and China’s US$4.8 trillion. Australia is a regional leader in the issuance of both international and domestic debt securities. The country has more international debt securities outstanding than any other Asian nation and ranks fourth in the region in terms of domestic securities.
INTERNATIONAL AND DOMESTIC DEBT SECURITIES IN ASIA-PACIFIC REGIONAmount outstanding – residence of issuer, US$ billion
0
600
1,200
1,800
2,400
3,000
3,600
4,200
4,800
China Australia SouthKorea
India TaiwanMalaysia SingaporeHongKong
Thailand Indonesia Philippines NewZealand
4,71876
1,284
586
70429
31243
3361013
204313 28411965 87
4773
111
5120
1,449175
Domestic Debt Securities (Mar 2015) International Debt Securities (Mar 2015)
Japan 10,964 241
US$
bill
ion
Sources: Bank for International Settlements, Debt Security Statistics, Table C1 Summary of Debt Securities Outstanding; Austrade
AUSTRALIAN TRADE COMMISSION LOCATIONS
AUSTRALIA
AdelaideBrisbaneCanberraDarwinHobart Melbourne Newcastle Perth Sydney Wollongong
EAST ASIAN GROWTH MARKETS
Bandar Seri BegawanBangkokBeijingChengduGuangzhouHanoiHo Chi Minh CityHong KongJakartaKuala LumpurKunming Manila Nanjing Qingdao Shanghai Shenyang Shenzhen Singapore TaipeiWuhan Yangon
ESTABLISHED MARKETS
Auckland Chicago Frankfurt FukuokaHouston Istanbul London Madrid Milan New York Osaka Paris Port Moresby PragueSan Francisco Sapporo Seoul Stockholm SuvaTel Aviv Tokyo Toronto Ulaanbaatar Vancouver Warsaw Washington DCZurich
GROWTH AND EMERGING MARKETS
Abu Dhabi Accra Ahmedabad Bangalore Bogota Buenos Aires Chandigarh Chennai Colombo DhakaDubai Hyderabad Islamabad Jaipur Jeddah Johannesburg KarachiKochi Kolkata Kuwait Lahore Lima Mexico City Moscow Mumbai Nairobi New Delhi Port Louis Riyadh Santiago Sao Paulo Vladivostok
ABN 11 764 698 227 Date: January 2016 ISSN 2205-9415 (Print) ISSN 2205-9423 (Online)
DISCLAIMERThis report has been prepared as a general overview. It is not intended to provide an exhaustive coverage of the topic. The information is made available on the understanding that the Australian Trade Commission (Austrade) is not providing professional advice. Therefore, while all care has been taken in the preparation of this report, Austrade does not accept responsibility for any losses suffered by persons relying on the information contained in this report or arising from any error or omission in the report. Any person relying on this information does so entirely at their own discretion and Austrade strongly recommends the reader obtain independent professional advice prior to acting on this information.Austrade assumes no responsibility for any company, product or service mentioned in this document, for any materials provided in relation to such products, nor for any act or omission of any business connected with such products. Investors should always consider whether an investment is appropriate for their needs and seek out independent advice as appropriate.Cover: Waterfront Place, Brisbane. Image courtesy of Brisbane Marketing.

The Australian Trade Commission – Austrade – contributes to Australia’s economic prosperity by helping Australian businesses, education institutions, tourism operators, governments and citizens as they:
/ develop international markets
/ win productive foreign direct investment
/ promote international education
/ strengthen Australia’s tourism industry
/ seek consular and passport services.
Austrade helps companies around the world to identify and take up investment opportunities in Australia as well as to source Australian goods and services. Our assistance includes:
/ providing insight on Australian capabilities
/ identifying potential investment projects and strategic alliance partners
/ helping you to identify and contact Australian suppliers.
www.austrade.gov.au