Embed Size (px)
Citation preview
18 May 2021 Information within this announcement is deemed by the Company to constitute inside information under the Market Abuse Regulations (EU) No. 596/2014.
Benchmark Holdings plc
(“Benchmark”, the “Company” or the “Group”)
Second Quarter and Interim results for the six months ended 31 March 2021
Good performance in the first half of the year and strategic progress in all business areas
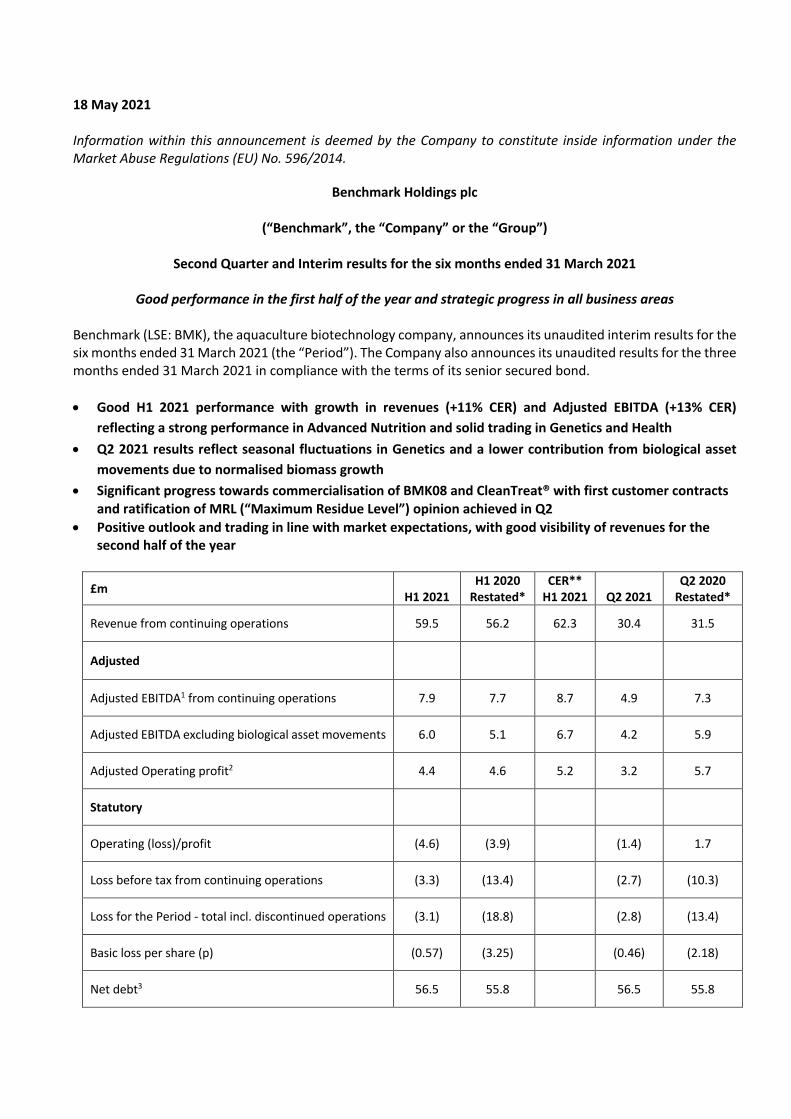
Benchmark (LSE: BMK), the aquaculture biotechnology company, announces its unaudited interim results for the six months ended 31 March 2021 (the “Period”). The Company also announces its unaudited results for the three months ended 31 March 2021 in compliance with the terms of its senior secured bond. • Good H1 2021 performance with growth in revenues (+11% CER) and Adjusted EBITDA (+13% CER)
reflecting a strong performance in Advanced Nutrition and solid trading in Genetics and Health • Q2 2021 results reflect seasonal fluctuations in Genetics and a lower contribution from biological asset
movements due to normalised biomass growth • Significant progress towards commercialisation of BMK08 and CleanTreat® with first customer contracts
and ratification of MRL (“Maximum Residue Level”) opinion achieved in Q2 • Positive outlook and trading in line with market expectations, with good visibility of revenues for the
second half of the year
£m H1 2021
H1 2020 Restated*
CER** H1 2021
Q2 2021
Q2 2020 Restated*
Revenue from continuing operations 59.5 56.2 62.3 30.4 31.5
Adjusted
Adjusted EBITDA1 from continuing operations 7.9 7.7 8.7 4.9 7.3
Adjusted EBITDA excluding biological asset movements 6.0 5.1 6.7 4.2 5.9
Adjusted Operating profit2 4.4 4.6 5.2 3.2 5.7
Statutory
Operating (loss)/profit (4.6) (3.9) (1.4) 1.7
Loss before tax from continuing operations (3.3) (13.4) (2.7) (10.3)
Loss for the Period - total incl. discontinued operations (3.1) (18.8) (2.8) (13.4)
Basic loss per share (p) (0.57) (3.25) (0.46) (2.18)
Net debt3 56.5 55.8 56.5 55.8
Net debt excluding lease liabilities 42.5 46.4 42.5 46.4
* H1 2020 and Q2 2020 numbers have been restated to reflect changes to the ongoing continuing business since the previous reporting date (note 5). ** Constant exchange rate (CER) figures derived by retranslating current year figures using previous year’s foreign exchange rates (1) Adjusted EBITDA is EBITDA (earnings before interest, tax, depreciation and amortisation and impairment), before exceptional items including acquisition related expenditure. (2) Adjusted Operating Profit is operating loss before exceptional items including acquisition related items and amortisation of intangible assets excluding development costs. (3) Net debt is cash and cash equivalents less loans and borrowings.
Divisional summary (Continuing and discontinued operations) £m
H1 2021 H1 2020
Restated* CER**
H1 2021
Q2 2021 Q2 2020
Restated* CER**
Q2 2021
Revenue
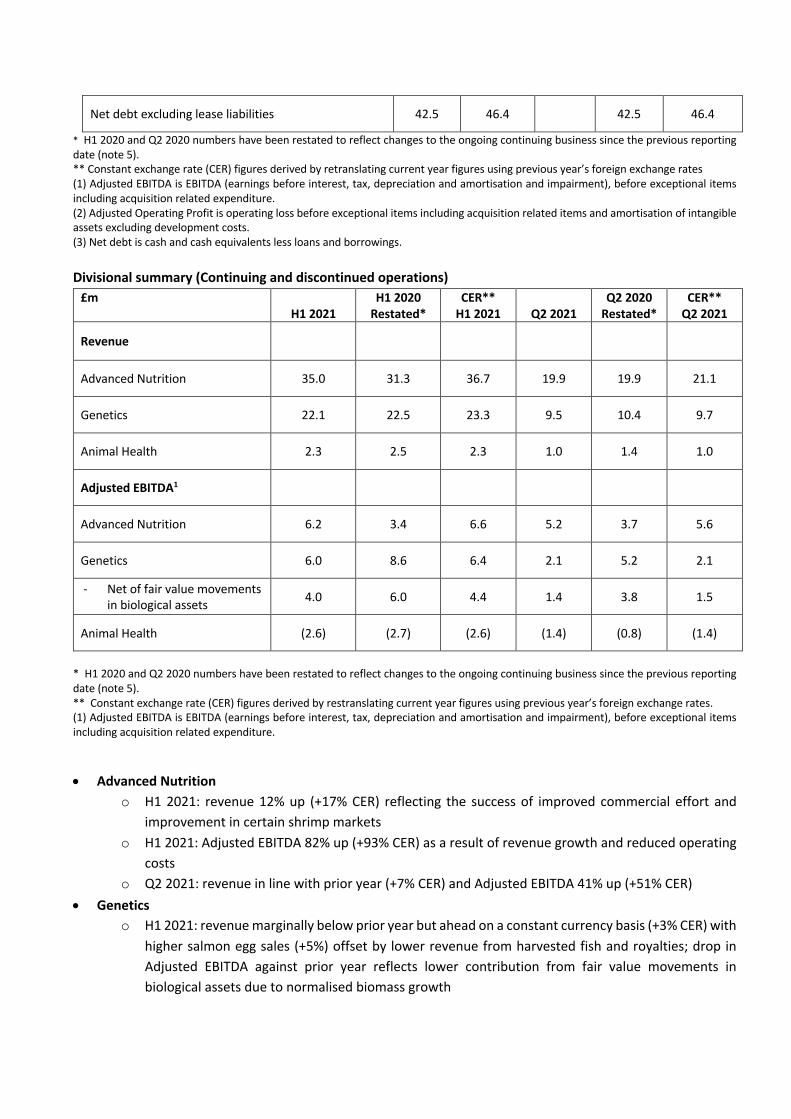
Advanced Nutrition 35.0 31.3 36.7 19.9 19.9 21.1
Genetics 22.1 22.5 23.3 9.5 10.4 9.7
Animal Health 2.3 2.5 2.3 1.0 1.4 1.0
Adjusted EBITDA1
Advanced Nutrition 6.2 3.4 6.6 5.2 3.7 5.6
Genetics 6.0 8.6 6.4 2.1 5.2 2.1
- Net of fair value movements in biological assets 4.0 6.0 4.4 1.4 3.8 1.5
Animal Health (2.6) (2.7) (2.6) (1.4) (0.8) (1.4)
* H1 2020 and Q2 2020 numbers have been restated to reflect changes to the ongoing continuing business since the previous reporting date (note 5). ** Constant exchange rate (CER) figures derived by restranslating current year figures using previous year’s foreign exchange rates. (1) Adjusted EBITDA is EBITDA (earnings before interest, tax, depreciation and amortisation and impairment), before exceptional items including acquisition related expenditure.
• Advanced Nutrition o H1 2021: revenue 12% up (+17% CER) reflecting the success of improved commercial effort and
improvement in certain shrimp markets o H1 2021: Adjusted EBITDA 82% up (+93% CER) as a result of revenue growth and reduced operating
costs o Q2 2021: revenue in line with prior year (+7% CER) and Adjusted EBITDA 41% up (+51% CER)
• Genetics o H1 2021: revenue marginally below prior year but ahead on a constant currency basis (+3% CER) with
higher salmon egg sales (+5%) offset by lower revenue from harvested fish and royalties; drop in Adjusted EBITDA against prior year reflects lower contribution from fair value movements in biological assets due to normalised biomass growth
o Q2 2021: revenue down due to seasonal fluctuations affecting the timing of egg deliveries against prior year and lower royalty income. Adjusted EBITDA reflects lower sales and lower contribution from fair value movements in biological assets
o Good visibility of revenues for H2 2021 • Animal Health
o H1 2021: revenue and Adjusted EBITDA in line with prior year o Q2 2021: lower revenue and Adjusted EBITDA reflect normalised sales against the same period in
the prior year which benefitted from customer stockpiling due to Covid-19 uncertainty o Significant progress towards commercialisation of new sea lice treatment BMK08 and CleanTreatâ
– first customer agreements signed and ratification of MRL opinion achieved in Q2 2021
Cash generation; liquidity and net debt
• H1 2021 operating cash outflow of £1.5m including £7.2m from increase in working capital in line with expectations; net cash outflow of £17.3m includes £9.1m outflow from investing activities in the period and a £6.8m outflow from financing activities
• Liquidity (defined as cash and undrawn facility) as at 14 May 2021 was c.£62.5m (30 September 2020: £83.2m) against a liquidity covenant of £10m
• Net debt at the half year end was £56.5m (30 September 2020: £37.6m), including lease obligations of £14.0m (30 September 2020: £10.4m)
Good strategic progress
• Significant progress towards commercialisation of new sea lice treatment BMK08 and CleanTreatâ – first customer agreements signed and EU ratification of MRL opinion achieved in Q2
• Land based salmon farming - new customer wins with selected clients building a leading position in genetics • Construction of new incubation centre in Iceland to increase genetics capacity progressing as planned • SPR shrimp – Expansion of breeder capacity in Fellsmere progressing as planned, test market ongoing and
construction of multiplication centre in Thailand advancing after delays caused by Covid-19 • “One Benchmark”- further actions undertaken to integrate the Group and streamline the organisation
including co-location of Genetics and Health activities in Norway and Chile • ESG (Environmental Social and Governance) continues to be an important focus through the positive impact
of our products and solutions on the sustainability of aquaculture, and through our commitment as a responsible operator to reduce greenhouse gas emissions and improve the sustainability of our supply chain
Current trading and outlook
• Current trading in line with management expectations with good visibility of revenues for the second half of the year
• Progress towards commercialisation of BMK08 & CleanTreatâ, subject to marketing authorisation in Norway
Trond Williksen, CEO, commented:
“Benchmark has performed well in the first half and has made good strategic progress across our three business areas. This reflects our successful restructuring and the new focus and discipline on delivering on our strategic priorities to create profitable growth. “Our financial discipline including cost containment and strict cash management enables us to invest selectively in our core business, strengthen our position in our markets and deliver on the growth opportunities ahead. “As a leading aquaculture biotechnology company focused on delivering sustainable solutions, we are well positioned to make a positive impact on our industry and create value for all our stakeholders.” Details of analyst / investor call today There will be a call at 9:30am UK time today for analysts and investors. To register for the call please contact MHP Communications on +44 (0)20 3128 8990 or 8742, or by email on [email protected] Enquiries For further information, please contact:
Benchmark Holdings plc [email protected] Trond Williksen, CEO
Septima Maguire, CFO
Ivonne Cantu, Investor Relations
Numis (Broker and NOMAD) Tel: 020 7260 1000 James Black, Freddie Barnfield, Duncan Monteith
MHP Communications Tel: 020 3128 8742 Katie Hunt, Reg Hoare, Alistair de Kare-Silver [email protected] About Benchmark
Benchmark's mission is to enable aquaculture producers to improve their sustainability and profitability.
We are a leading aquaculture biotechnology company developing innovative products and solutions which improve yield, quality and animal health and welfare for our customers. We do this by improving the genetic make-up, health and nutrition of their stock - from broodstock and hatchery through to nursery and grow out.
Benchmark has a broad portfolio of products and solutions, including salmon eggs with specialist genetic traits, shrimp broodstock, tilapia fry, technology enhanced live feed (Artemia), specialist diets, probiotics and sea lice treatments. Find out more at www.benchmarkplc.com
Management Report
Benchmark performed well in the first half of the year with revenue from continuing operations increasing by 6% to £59.5m (11% in constant currency, i.e., retranslating current period results using last year’s foreign exchange rates), and Adjusted EBITDA from continuing operations up 3% to £7.9m (+13% in constant currency). Excluding biological asset movements, Adjusted EBITDA increased by 17% (31% in constant currency).
Notably, Advanced Nutrition had a strong performance in Q2 2021 and H1 2021, showing the benefits of our enhanced commercial effort and focus over the past 12 months, as well as improvement in certain shrimp markets with lockdown easing. From the outset of the Covid-19 pandemic we launched new digital means to communicate with our customers, including webinars and technical briefings which have proven effective and will continue. These, together with our commercial focus and operational continuity in the face of logistical challenges, have enabled us to maintain and strengthen our position in the market. We intend to build on this momentum to take advantage of the market recovery as we emerge from the pandemic.
Our Genetics business area continues to perform well and make good strategic progress. While Q2 results show a drop against last year, this is the result of expected fluctuations in the order profile of salmon eggs in Q2 and a lower contribution from the movement in fair value of biological assets due to normalised biomass growth. We have good revenue visibility for the remainder of the year. During the period we continued to win new contracts with selected clients in the emerging land-based salmon sector, establishing a leading position in that market.
Following the restructuring conducted last year, results in Health derive primarily from sales of Salmosan and the investment in the launch of BMK08 and CleanTreatâ. Salmosan revenues in the first half were below H1 2020 which had benefitted from stockpiling in certain high margin markets driven by the uncertainty of Covid-19. In this context, Salmosan sales were normalised and in line with management expectations.
We maintain our focus on cost containment, cash management and disciplined investment. Operating expenses in H1 2021 of £18.7m were 2% below the prior year and R&D expenses of £3.6m were 23% down. Total R&D investment was £5.8m (H1 2020: £6.7m).
Our cash position at the end of the period of £53.6m reflects a net cash outflow of £17.3m. Cash outflow from operating activities in H1 2021 of £1.5m includes a £7.2m increase in working capital to support growth and £2m tax payments. This means our core established business is generating cash to invest in organic growth.
We have a disciplined investment programme to support our new growth vectors including BMK08 and CleanTreatâ, the expansion of our incubation capacity in Iceland and the roll-out of SPR shrimp in Genetics. In addition, we are making investments to upgrade some of our facilities which have been underinvested in recent years, including installing new fire safety equipment in our main production facility in Thailand. Under our new disciplined approach, investments are made supported by a solid assessment of commercial prospects and return on investment. During the period we invested £9.1m including £6.6m in PPE capex and £2.2m in capitalised R&D.
Net debt at the half year was £56.5m (FY 2020: £37.6m; H1 2020: £55.8m), including finance lease liabilities of £14.0m under IFRS 16 (FY 2020: £10.4m; H1 2020: £9.4m).
The Group’s operating loss was £4.6m (H1 2020: loss of £3.9m) after depreciation and amortisation during the period of £11.7m (H1 2020: £11.4m). Loss before taxation was £3.3m (H1 2020: £13.4m) after a significant reduction in net finance costs; net finance income in H1 2021 was £1.4m (H1 2020: £9.6m cost) with the main difference being a credit of £2.4m in the fair value of financial derivatives (H1 2020: £3.7m charge) and forex gains of £3.3m (H1 2020: £1.8m loss). The loss for the period was £3.1m (H1 2020: £18.8m). Loss per share was 0.57p (H1 2020: 3.25p).
Q2 2021 Commentary The Group reported revenue of £30.4m, 3% below prior year of £31.5m, but 2% higher on a constant currency basis (£32.0m CER). This was driven by revenue growth in Advanced Nutrition (+7% CER) offset by a drop in Genetics and Health in the quarter. As previously explained the drop in Genetics is the result of seasonal fluctuations which drove the timing of delivery of salmon eggs into H2 2021, whilst Health revenues were below last year’s strong result. Adjusted EBITDA of £4.9m (£5.3m CER) was lower than the prior year (Q2 2020: £7.3m) reflecting a strong performance in Advanced Nutrition offset by a lower contribution from Genetics and Health. This was partially driven by lower sales and a lower contribution from biological assets in Genetics and increased expenditure in Health related to the preparations for the commercial launch of BMK08 and CleanTreatâ. Operating costs including R&D expenses of £11.2m were up 3% on the prior year (Q2 2020: £10.9m). Net finance costs for the quarter of £1.4m were £10.5m lower than the same quarter last year (Q2 2020: £11.9m). The main reasons for the significant reduction were smaller movements in fair value of financial derivatives (Q2 2021: £0.1m credit; Q2 2020: £4.6m charge) and forex gains in the period of £0.7m versus forex losses of £5.0m in the comparative quarter. Progress on strategic priorities At the beginning of the year we established five strategic priorities for the Group. These form part of a Group-wide strategic priority framework which allows us to prioritise, allocate resources and manage performance. Delivery against strategic priorities in the first half of the year has been good with particular progress towards the delivery of our top priority – the launch of BMK08 and CleanTreatâ.
• Launch of BMK08 and CleanTreatâ – significant progress with signing of first customer agreements and ratification under European Law of the MRL (Maximum Residue Level), an important food safety standard
• Launch of Specific Pathogen Resistant shrimp – expansion of production capacity in Fellsmere, US progressing to plan; ongoing test market in Asia; progress towards completion of multiplication centre in Thailand after delays caused by Covid-19
• Maintain leadership in hatchery by regaining Artemia position – +18.3% Artemia revenues in H1 2021 driven by targeted marketing and technical support activities, enhanced commercial effort which has been upskilled, and adjustment of pricing strategy
• Implement simplified structure toward further integration as “One Benchmark” – organisation streamlining including co-location of Genetics and Health activities in Norway and Chile
• Align culture, values and people processes towards delivery of strategy – development of new company values to drive change in culture from R&D centric to commercially focused, and implementation of new remuneration policy aligning incentives to delivery of targets across the Group
Covid-19 Many of the countries in which we operate continue to be affected by the Covid-19 pandemic. We continue to operate remotely where possible and have rigorous protocols in place to safeguard our employees. Mindful of the overall wellbeing of our people, during H1 2021 we delivered a wellbeing programme to support our people and trained additional mental health first aiders. Our teams around the world have shown great commitment and dedication which have allowed us to maintain operational continuity and service for our customers and to continue to make progress on our strategic priorities. We recognise each individual contribution and extend our gratitude on behalf of the Board.
Outlook The salmon market is expected to remain stable with salmon prices having recovered in recent months. There has been some improvement in certain shrimp markets and this is expected to continue through the remainder of the year as restrictions ease in many territories, although a high level of uncertainty remains as currently seen in India. The sea bass and bream markets have also shown some recovery and are expected to remain stable for the rest of the year. We have had a positive start to Q3 2021 to date and have good visibility of revenues for H2 2021 which, together with our ongoing cost and cash management discipline, supports a positive outlook for the year. We therefore expect to deliver results in line with management expectations for the full year. Longer term our fundamentals are strong and our opportunities are significant. Aquaculture is a growth industry supported by strong megatrends. Like in most industries growth creates sustainability challenges and the focus on these challenges is growing as the industry expands. The answer to sustainability lies in innovation – bringing forward new sustainable solutions. As a focused aquaculture biotechnology company and proactive industry leader, Benchmark is well positioned to play an important role, helping to improve sustainability across the aquaculture value chain from genetics to grow-out and the quality of the end product. Divisional Commentary Advanced Nutrition
Advanced Nutrition reported significant growth in H1 2021 with revenues of £35.0m, 12% ahead of the prior year (H1 2020: £31.3m) and Q2 2021 revenues of £19.9m in line with the prior year (Q2 2020: £19.9m) Q2 2021 but up in constant currency (+7% CER).
The strong H1 2021 performance reflects the initial benefits of our enhanced commercial effort and some improvement in certain shrimp markets. By product area, revenues from Artemia in H1 2021 were 18% higher than the prior year mainly driven by India, Vietnam and Turkey. Diet sales were up 26% driven by India and Indonesia while sales from Health products were down 11%.
Adjusted EBITDA in H1 was £6.2m (H1 2020: £3.4m) and Adjusted EBITDA in Q2 was £5.2m (Q2 2020: £3.7m) reflecting increased sales and successful cost containment. Genetics Genetics revenues in H1 2021 were £22.1m, broadly in line with the prior year (H1 2020: £22.5m) and £9.5m in Q2 2021, 8% below the same period in the prior year (Q2 2020: £10.4m). By source of income, egg sales in H1 2021 were higher than the prior year, but these were offset by lower revenue from harvested fish due to lower salmon prices in the period and lower royalty income. Lower revenues in Q2 2021 were driven by lower egg sales due to expected fluctuations in the order profile against prior year and lower royalty income. The lower Adjusted EBITDA in H1 2021 of £6.0m against prior year (H1 2020: £8.6m) reflect a smaller contribution from fair value movements of biological assets due to normalised biomass growth and lower margin from a different sales mix. Q2 2021 Adjusted EBITDA of £2.1m (Q2 2020: £5.2m) reflects lower sales due to normal seasonal fluctuations and lower contribution from biological assets as above.
R&D investment (expensed and capitalised) in the division was in line with the prior year at £3.5m (H1 2020: £3.5m) as investment continues in our breeding programmes in Chile and SPR shrimp.

Health
Health revenues in H1 2021 of £2.3m were below the prior year (H1 2020: £2.5m) which benefitted from customer stockpiling of Salmosan due to the uncertainty caused by Covid-19. Adjusted EBITDA was in line with the prior year with a loss of £2.6m (H2 2020: £2.7m). Q2 2021 results show a similar trend in revenues and the impact of investment associated with the launch of CleanTreat® and BMK08.
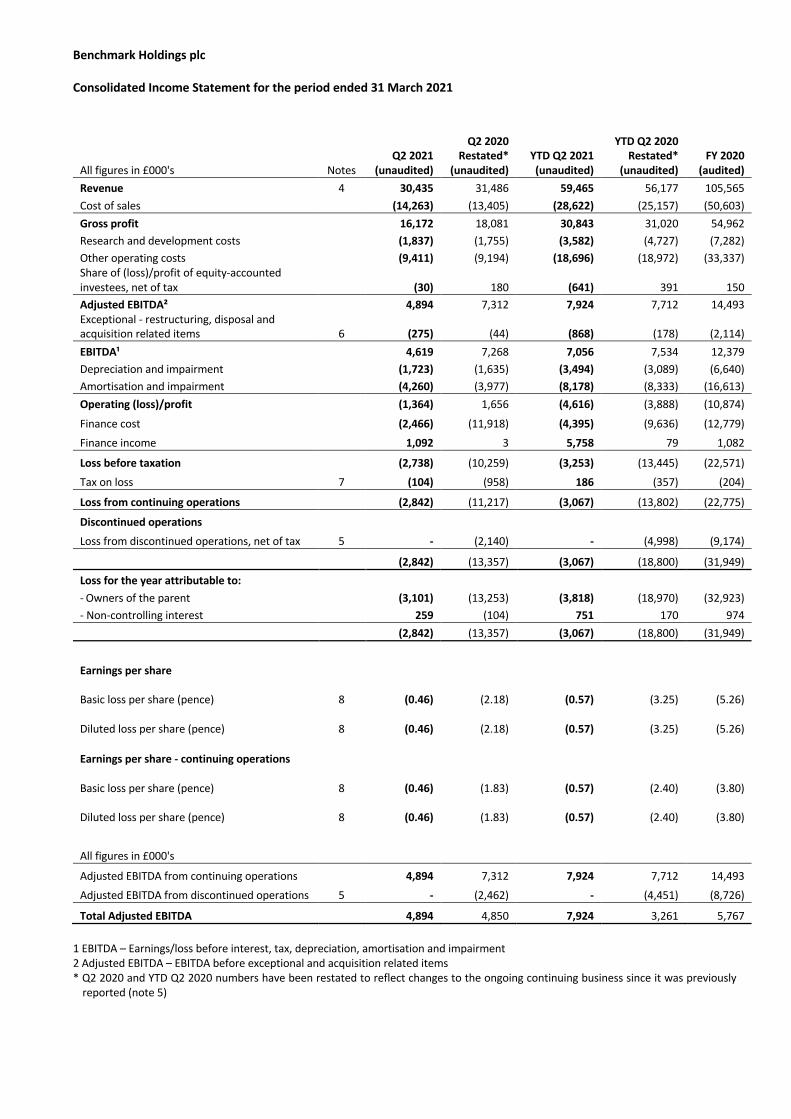
Benchmark Holdings plc Consolidated Income Statement for the period ended 31 March 2021
All figures in £000's Notes Q2 2021
(unaudited)
Q2 2020 Restated*
(unaudited) YTD Q2 2021 (unaudited)
YTD Q2 2020 Restated*
(unaudited) FY 2020
(audited) Revenue 4 30,435 31,486 59,465 56,177 105,565 Cost of sales (14,263) (13,405) (28,622) (25,157) (50,603) Gross profit 16,172 18,081 30,843 31,020 54,962 Research and development costs (1,837) (1,755) (3,582) (4,727) (7,282) Other operating costs (9,411) (9,194) (18,696) (18,972) (33,337) Share of (loss)/profit of equity-accounted investees, net of tax (30) 180 (641) 391 150 Adjusted EBITDA² 4,894 7,312 7,924 7,712 14,493 Exceptional - restructuring, disposal and acquisition related items 6 (275) (44) (868) (178) (2,114) EBITDA¹ 4,619 7,268 7,056 7,534 12,379 Depreciation and impairment (1,723) (1,635) (3,494) (3,089) (6,640) Amortisation and impairment (4,260) (3,977) (8,178) (8,333) (16,613) Operating (loss)/profit (1,364) 1,656 (4,616) (3,888) (10,874)
Finance cost (2,466) (11,918) (4,395) (9,636) (12,779) Finance income 1,092 3 5,758 79 1,082
Loss before taxation (2,738) (10,259) (3,253) (13,445) (22,571) Tax on loss 7 (104) (958) 186 (357) (204)
Loss from continuing operations (2,842) (11,217) (3,067) (13,802) (22,775)
Discontinued operations Loss from discontinued operations, net of tax 5 - (2,140) - (4,998) (9,174)
(2,842) (13,357) (3,067) (18,800) (31,949) Loss for the year attributable to: - Owners of the parent (3,101) (13,253) (3,818) (18,970) (32,923) - Non-controlling interest 259 (104) 751 170 974 (2,842) (13,357) (3,067) (18,800) (31,949)
Earnings per share
Basic loss per share (pence) 8
(0.46)
(2.18)
(0.57)
(3.25)
(5.26)
Diluted loss per share (pence) 8
(0.46)
(2.18)
(0.57)
(3.25)
(5.26)
Earnings per share - continuing operations
Basic loss per share (pence) 8
(0.46)
(1.83)
(0.57)
(2.40)
(3.80)
Diluted loss per share (pence) 8
(0.46)
(1.83)
(0.57)
(2.40)
(3.80)
All figures in £000's
Adjusted EBITDA from continuing operations 4,894 7,312 7,924 7,712 14,493 Adjusted EBITDA from discontinued operations 5 - (2,462) - (4,451) (8,726)
Total Adjusted EBITDA 4,894 4,850 7,924 3,261 5,767 1 EBITDA – Earnings/loss before interest, tax, depreciation, amortisation and impairment 2 Adjusted EBITDA – EBITDA before exceptional and acquisition related items * Q2 2020 and YTD Q2 2020 numbers have been restated to reflect changes to the ongoing continuing business since it was previously
reported (note 5)
Benchmark Holdings plc
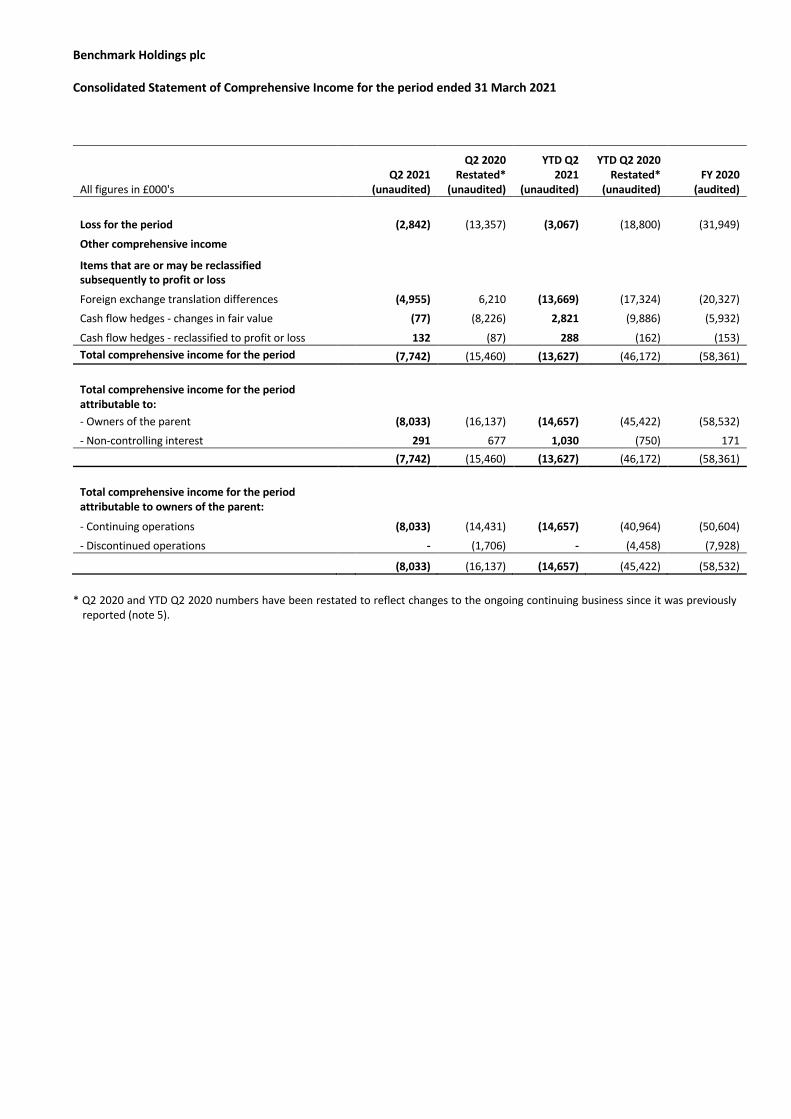
Consolidated Statement of Comprehensive Income for the period ended 31 March 2021
All figures in £000's Q2 2021
(unaudited)
Q2 2020 Restated*
(unaudited)
YTD Q2 2021
(unaudited)
YTD Q2 2020 Restated*
(unaudited) FY 2020
(audited)
Loss for the period (2,842) (13,357) (3,067) (18,800) (31,949)
Other comprehensive income Items that are or may be reclassified subsequently to profit or loss Foreign exchange translation differences (4,955) 6,210 (13,669) (17,324) (20,327) Cash flow hedges - changes in fair value (77) (8,226) 2,821 (9,886) (5,932)
Cash flow hedges - reclassified to profit or loss 132 (87) 288 (162) (153) Total comprehensive income for the period (7,742) (15,460) (13,627) (46,172) (58,361)
Total comprehensive income for the period attributable to: - Owners of the parent (8,033) (16,137) (14,657) (45,422) (58,532) - Non-controlling interest 291 677 1,030 (750) 171 (7,742) (15,460) (13,627) (46,172) (58,361)
Total comprehensive income for the period attributable to owners of the parent: - Continuing operations (8,033) (14,431) (14,657) (40,964) (50,604) - Discontinued operations - (1,706) - (4,458) (7,928) (8,033) (16,137) (14,657) (45,422) (58,532)
* Q2 2020 and YTD Q2 2020 numbers have been restated to reflect changes to the ongoing continuing business since it was previously
reported (note 5).
Benchmark Holdings plc
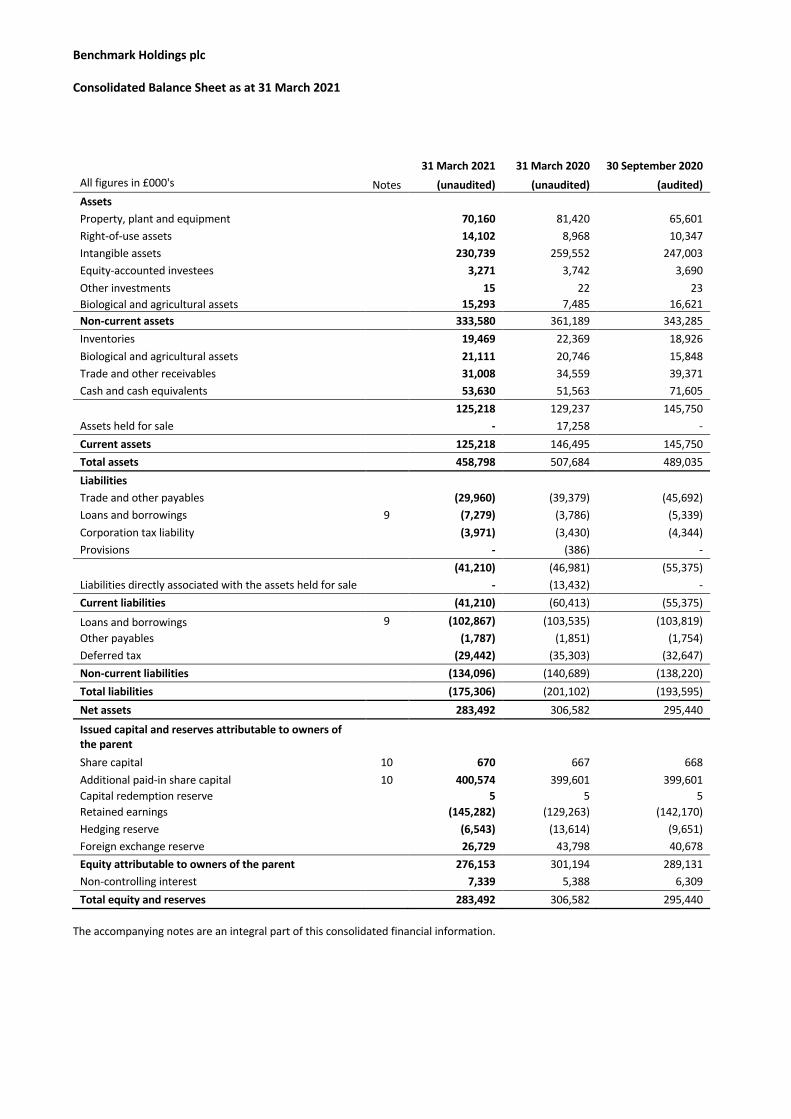
Consolidated Balance Sheet as at 31 March 2021
31 March 2021 31 March 2020
30 September 2020
All figures in £000's Notes (unaudited) (unaudited) (audited) Assets Property, plant and equipment 70,160 81,420 65,601 Right-of-use assets 14,102 8,968 10,347 Intangible assets 230,739 259,552 247,003 Equity-accounted investees 3,271 3,742 3,690 Other investments 15 22 23 Biological and agricultural assets 15,293 7,485 16,621 Non-current assets 333,580 361,189 343,285 Inventories 19,469 22,369 18,926 Biological and agricultural assets 21,111 20,746 15,848 Trade and other receivables 31,008 34,559 39,371 Cash and cash equivalents 53,630 51,563 71,605
125,218 129,237 145,750 Assets held for sale - 17,258 - Current assets 125,218 146,495 145,750 Total assets 458,798 507,684 489,035 Liabilities Trade and other payables (29,960) (39,379) (45,692) Loans and borrowings 9 (7,279) (3,786) (5,339) Corporation tax liability (3,971) (3,430) (4,344) Provisions - (386) -
(41,210) (46,981) (55,375) Liabilities directly associated with the assets held for sale - (13,432) - Current liabilities (41,210) (60,413) (55,375)
Loans and borrowings 9 (102,867) (103,535) (103,819) Other payables (1,787) (1,851) (1,754) Deferred tax (29,442) (35,303) (32,647) Non-current liabilities (134,096) (140,689) (138,220) Total liabilities (175,306) (201,102) (193,595) Net assets 283,492 306,582 295,440
Issued capital and reserves attributable to owners of the parent
Share capital 10 670 667 668 Additional paid-in share capital 10 400,574 399,601 399,601 Capital redemption reserve 5 5 5 Retained earnings (145,282) (129,263) (142,170) Hedging reserve (6,543) (13,614) (9,651) Foreign exchange reserve 26,729 43,798 40,678 Equity attributable to owners of the parent 276,153 301,194 289,131 Non-controlling interest 7,339 5,388 6,309 Total equity and reserves 283,492 306,582 295,440
The accompanying notes are an integral part of this consolidated financial information.
Benchmark Holdings plc
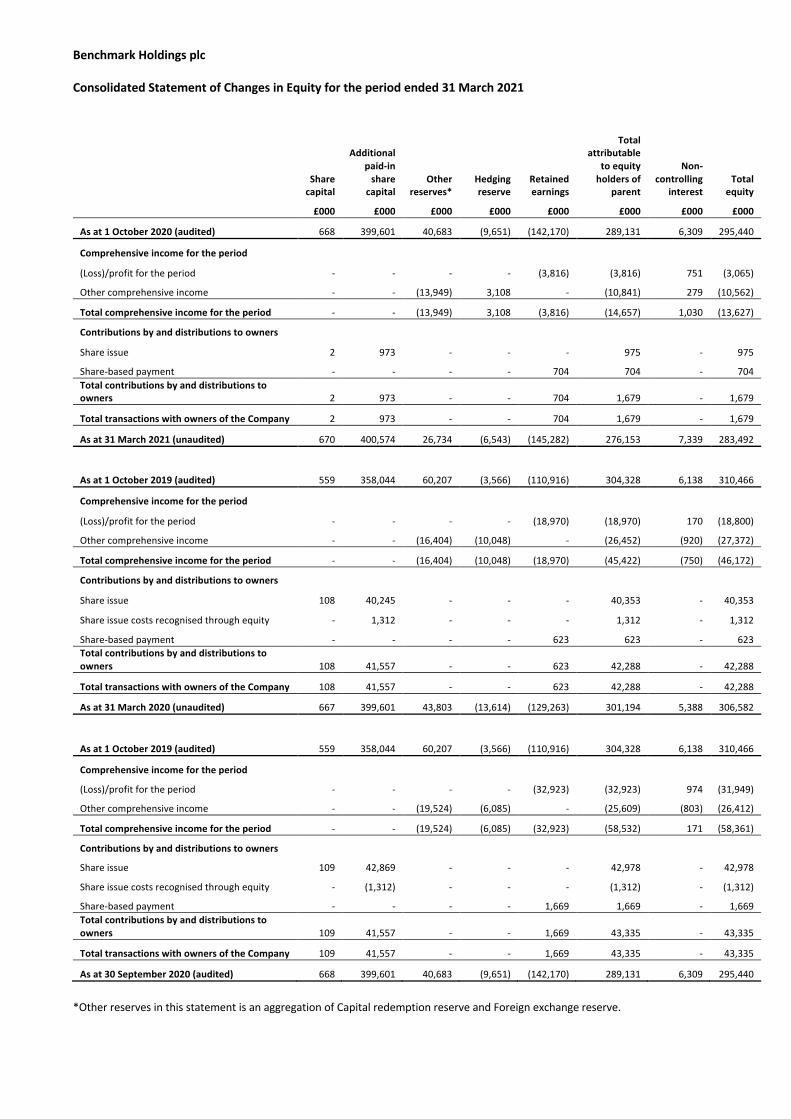
Consolidated Statement of Changes in Equity for the period ended 31 March 2021
Share capital
Additional
paid-in share
capital Other
reserves* Hedging
reserve Retained earnings
Total attributable
to equity holders of
parent
Non- controlling
interest Total
equity £000 £000 £000 £000 £000 £000 £000 £000
As at 1 October 2020 (audited) 668 399,601 40,683 (9,651) (142,170) 289,131 6,309 295,440
Comprehensive income for the period (Loss)/profit for the period - - - - (3,816) (3,816) 751 (3,065)
Other comprehensive income - - (13,949) 3,108 - (10,841) 279 (10,562)
Total comprehensive income for the period - - (13,949) 3,108 (3,816) (14,657) 1,030 (13,627)
Contributions by and distributions to owners Share issue 2 973 - - - 975 - 975
Share-based payment - - - - 704 704 - 704 Total contributions by and distributions to owners 2 973 - - 704 1,679 - 1,679
Total transactions with owners of the Company 2 973 - - 704 1,679 - 1,679
As at 31 March 2021 (unaudited) 670 400,574 26,734 (6,543) (145,282) 276,153 7,339 283,492
As at 1 October 2019 (audited) 559 358,044 60,207 (3,566) (110,916) 304,328 6,138 310,466
Comprehensive income for the period (Loss)/profit for the period - - - - (18,970) (18,970) 170 (18,800)
Other comprehensive income - - (16,404) (10,048) - (26,452) (920) (27,372)
Total comprehensive income for the period - - (16,404) (10,048) (18,970) (45,422) (750) (46,172)
Contributions by and distributions to owners Share issue 108 40,245 - - - 40,353 - 40,353
Share issue costs recognised through equity - 1,312 - - - 1,312 - 1,312
Share-based payment - - - - 623 623 - 623 Total contributions by and distributions to owners 108 41,557 - - 623 42,288 - 42,288
Total transactions with owners of the Company 108 41,557 - - 623 42,288 - 42,288
As at 31 March 2020 (unaudited) 667 399,601 43,803 (13,614) (129,263) 301,194 5,388 306,582
As at 1 October 2019 (audited) 559 358,044 60,207 (3,566) (110,916) 304,328 6,138 310,466
Comprehensive income for the period
(Loss)/profit for the period - - - - (32,923) (32,923) 974 (31,949)
Other comprehensive income - - (19,524) (6,085) - (25,609) (803) (26,412)
Total comprehensive income for the period - - (19,524) (6,085) (32,923) (58,532) 171 (58,361)
Contributions by and distributions to owners
Share issue 109 42,869 - - - 42,978 - 42,978
Share issue costs recognised through equity - (1,312) - - - (1,312) - (1,312)
Share-based payment - - - - 1,669 1,669 - 1,669 Total contributions by and distributions to owners 109 41,557 - - 1,669 43,335 - 43,335
Total transactions with owners of the Company 109 41,557 - - 1,669 43,335 - 43,335
As at 30 September 2020 (audited) 668 399,601 40,683 (9,651) (142,170) 289,131 6,309 295,440
*Other reserves in this statement is an aggregation of Capital redemption reserve and Foreign exchange reserve.
Benchmark Holdings plc
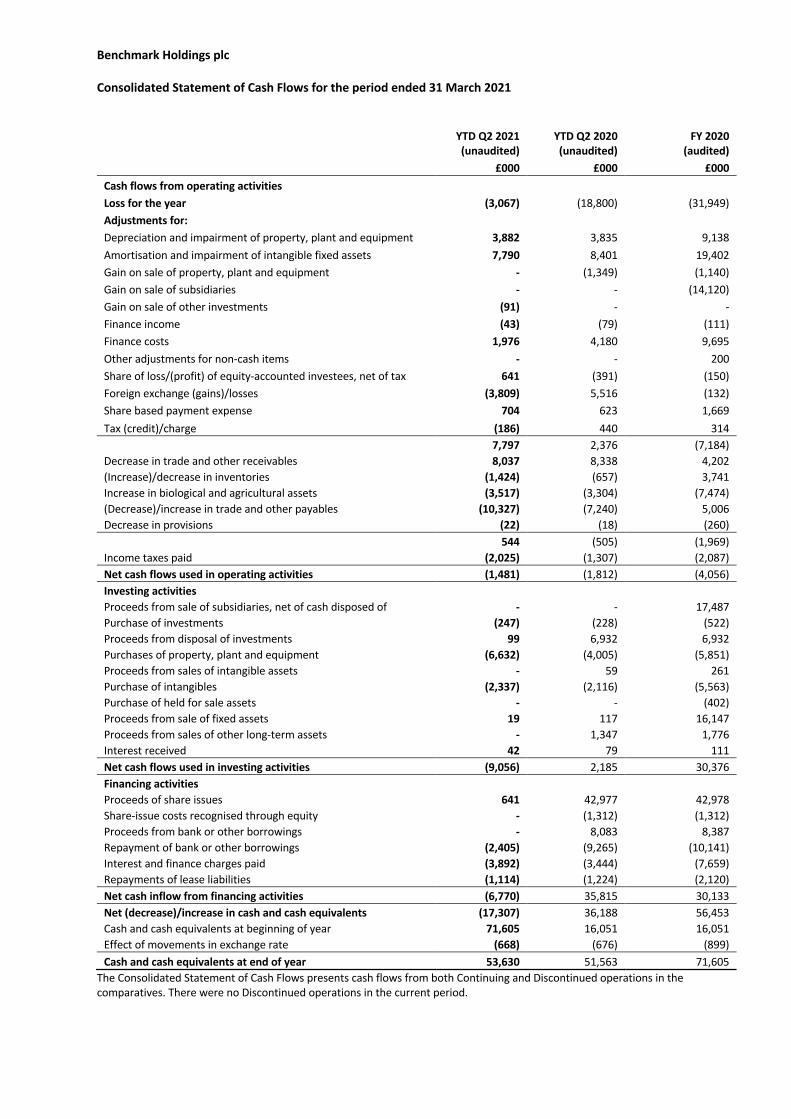
Consolidated Statement of Cash Flows for the period ended 31 March 2021
YTD Q2 2021
(unaudited) YTD Q2 2020 (unaudited)
FY 2020 (audited)
£000 £000 £000 Cash flows from operating activities Loss for the year (3,067) (18,800) (31,949) Adjustments for: Depreciation and impairment of property, plant and equipment 3,882 3,835 9,138 Amortisation and impairment of intangible fixed assets 7,790 8,401 19,402 Gain on sale of property, plant and equipment - (1,349) (1,140) Gain on sale of subsidiaries - - (14,120) Gain on sale of other investments (91) - - Finance income (43) (79) (111) Finance costs 1,976 4,180 9,695 Other adjustments for non-cash items - - 200 Share of loss/(profit) of equity-accounted investees, net of tax 641 (391) (150) Foreign exchange (gains)/losses (3,809) 5,516 (132) Share based payment expense 704 623 1,669 Tax (credit)/charge (186) 440 314
7,797 2,376 (7,184) Decrease in trade and other receivables 8,037 8,338 4,202 (Increase)/decrease in inventories (1,424) (657) 3,741 Increase in biological and agricultural assets (3,517) (3,304) (7,474) (Decrease)/increase in trade and other payables (10,327) (7,240) 5,006 Decrease in provisions (22) (18) (260)
544 (505) (1,969) Income taxes paid (2,025) (1,307) (2,087) Net cash flows used in operating activities (1,481) (1,812) (4,056) Investing activities Proceeds from sale of subsidiaries, net of cash disposed of - - 17,487 Purchase of investments (247) (228) (522) Proceeds from disposal of investments 99 6,932 6,932 Purchases of property, plant and equipment (6,632) (4,005) (5,851) Proceeds from sales of intangible assets - 59 261 Purchase of intangibles (2,337) (2,116) (5,563) Purchase of held for sale assets - - (402) Proceeds from sale of fixed assets 19 117 16,147 Proceeds from sales of other long-term assets - 1,347 1,776 Interest received 42 79 111 Net cash flows used in investing activities (9,056) 2,185 30,376 Financing activities Proceeds of share issues 641 42,977 42,978 Share-issue costs recognised through equity - (1,312) (1,312) Proceeds from bank or other borrowings - 8,083 8,387 Repayment of bank or other borrowings (2,405) (9,265) (10,141) Interest and finance charges paid (3,892) (3,444) (7,659) Repayments of lease liabilities (1,114) (1,224) (2,120) Net cash inflow from financing activities (6,770) 35,815 30,133 Net (decrease)/increase in cash and cash equivalents (17,307) 36,188 56,453 Cash and cash equivalents at beginning of year 71,605 16,051 16,051 Effect of movements in exchange rate (668) (676) (899) Cash and cash equivalents at end of year 53,630 51,563 71,605
The Consolidated Statement of Cash Flows presents cash flows from both Continuing and Discontinued operations in the comparatives. There were no Discontinued operations in the current period.
Benchmark Holdings plc
Unaudited notes to the interim financial statements for period ended 31 March 2021
1. Basis of preparation Benchmark Holdings plc (the ‘Company’) is a company incorporated domiciled in the United Kingdom. These consolidated quarterly financial statements as at and for the six months ended 31 March 2021 represents that of the Company and its subsidiaries (together referred to as the ‘Group’). These interim financial statements have been prepared in accordance with IAS 34 Interim Financial Reporting and should be read in conjunction with the Group’s consolidated financial statements as at and for the year ended 30 September 2020. They do not include all of the information required for a complete set of IFRS financial statements. However, selected explanatory notes are included to explain events and transactions that are significant to an understanding of the changes in the Group’s financial position and performance since the last annual financial statements. Statutory accounts for the year ended 30 September 2020 were approved by the Directors on 27 November 2020 and have been delivered to the Registrar of Companies. The audit report received on those accounts was unqualified and did not make a statement under section 498 of the Companies Act 2006. Going concern The Group’s business activities, together with the factors likely to affect its future development, performance and position are set out in the Management Report. As at 31 March 2021 the Group had net assets of £283.5m (30 September 2020: £295.4m), including cash of £53.6m (30 September 2020: £71.6m) as set out in the consolidated balance sheet. The Group made a loss for the period of £2.8m (30 September 2020: £31.9m). As noted in the Management Report, the impact of the Covid-19 pandemic has continued to affect parts of the Group’s businesses to varying degrees. The ultimate lasting impact of the pandemic on industry, the economy, Benchmark’s markets and its businesses remains to some extent uncertain. Our main markets have experienced mixed fortunes, with weak shrimp markets, resilient salmon markets and sea bass/bream which have experienced modest impact from Covid-19. The Directors monitor available market analysis as this situation has continued into 2021. Whilst the outlook for the shrimp market retains some uncertainty in certain territories still suffering from the ongoing pandemic, the outlook for the salmon sector (underpinning the Genetics and Health businesses) remains positive and the Directors therefore believe that large parts of the Group are well placed to deal with the uncertain global economic future ahead. The Directors prepared cash flow projections covering the period to September 2022 to assess the Group’s trading and cash flow forecasts and the forecast compliance with the covenants included within the Group’s financing arrangements. Year to date performance has been in line with these forecasts. Cash resources were boosted by non-core business disposals during the previous year and the ongoing cost base following these transactions has been significantly reduced. The uncertainty relating to the future impact on the Group of the pandemic has been considered as part of the Directors’ assessment of the going concern assumption. The positive preventative measures implemented by the Directors at an early stage in response to the pandemic continue to be in force where necessary. In the downside scenario analysis performed, the Directors considered severe but plausible impacts of Covid-19 on the Group’s trading and cash flow forecasts, modelling reductions in the revenues and cash flows in Advanced Nutrition, being the segment most impacted by Covid-19 because of its exposure to global shrimp markets, alongside modelling delays to new product launches in the Health business area. Key downside sensitivities modelled include assumptions that there is limited recovery in global shrimp markets in FY21, affecting demand for Advanced Nutrition products and a three-month potential delay in the launch of BMK08, pushing commercial launch back to September 2021. As noted in the Management Report, the Directors have observed some recovery in the shrimp markets in the performance of the Advanced Nutrition business during the period and have noted significant and expected progress towards the commercialisation of BMK08 and CleanTreat. Nevertheless, mitigating measures within the control of management were implemented early in the pandemic and remain in place and have been factored into the downside analysis performed. These measures include reductions in areas of discretionary spend, temporary furlough of certain staff or reduced working hours, deferral of capital projects and temporary hold on R&D for non-imminent products. It remains difficult to predict the overall outcome and lasting impact of the pandemic, but under the severe but plausible downside scenarios modelled, which the Group has so far outperformed, the Group has sufficient liquidity and resources throughout the period under review whilst still maintaining adequate headroom against the borrowing covenants. The Directors therefore remain confident that the Group has adequate resources to continue to meet its liabilities as and when they fall due within the period of 12 months from the date of approval of these interim financial statements. Accordingly, these interim financial statements have been prepared on a going concern basis.
Benchmark Holdings plc
Unaudited notes to the interim financial statements for period ended 31 March 2021
2. Accounting policies The accounting policies adopted are consistent with those used in preparing the consolidated financial statements for the financial year ended 30 September 2020. Taxes on income in the interim periods are accrued using the tax rate that would be applicable to expected total earnings.
Alternative performance measures (‘APMs’)
The Directors measure the performance of the Group based on a range of financial measures, including measures not recognised by EU-adopted IFRS. These APMs may not be directly comparable with other companies’ APMs and the Directors do not intend these as a substitute for, or superior to, IFRS measures.
Directors have presented the performance measures Adjusted EBITDA, Adjusted Operating Profit, Adjusted Profit Before Tax and Adjusted EBITDA excluding fair value movement on biological assets because it monitors performance at a consolidated level using these and believes that these measures are relevant to an understanding of the Group’s financial performance (see note 11). Furthermore, the Directors also refer to current period results using constant currency, which are derived by retranslating current period results using prior year's foreign exchange rates.
Use of estimates and judgements
The preparation of quarterly financial information requires management to make certain judgements, estimates and assumptions that affect the application of accounting policies and the reported amounts of assets and liabilities, income and expense. Actual amounts may differ from these estimates. In preparing these quarterly financial statements the significant judgements made by management in applying the Group’s accounting policies and the key sources of estimation uncertainty were the same as those applied to the consolidated financial statements for the year ended 30 September 2020. 3. Segment information Operating segments are reported in a manner consistent with the reports made to the chief operating decision maker. It is considered that the role of chief operating decision maker is performed by the Board of Directors. The Group operates globally and for management purposes is organised into reportable segments based on the following business areas:
• Genetics - harnesses industry leading salmon breeding technologies combined with state-of-the-art production facilities to provide a range of year-round high genetic merit ova;
• Advanced Nutrition - manufactures and provides technically advanced nutrition and health products to the global aquaculture industry.
• Health - provided veterinary services, environmental services diagnostics and health products to the global aquaculture market, and manufactures licenced veterinary vaccines and vaccine components; following the divestment programme the segment now focusses on providing health products to the global aquaculture market.
In addition to the above, reported as “all other segments” is the Knowledge Services business area, the operations of which were disposed of or discontinued in the two previous years. The business area provided sustainable food production consultancy, technical consultancy and assurance services and promotes sustainable food production and ethics through online news and technical publications for the international agriculture and food processing sectors and through delivery of training courses to the industries. In order to reconcile the segmental analysis to the Consolidated Income Statement, Corporate and Inter-segment sales are also shown. Corporate represents revenues earned from recharging certain central costs to the operating divisions, together with unallocated central costs.
Measurement of operating segment profit or loss
Inter-segment sales are priced along the same lines as sales to external customers, with an appropriate discount being applied to encourage use of Group resources at a rate acceptable to local tax authorities. This policy was applied consistently throughout the current and prior period.
Benchmark Holdings plc
Unaudited notes to the interim financial statements for period ended 31 March 2021
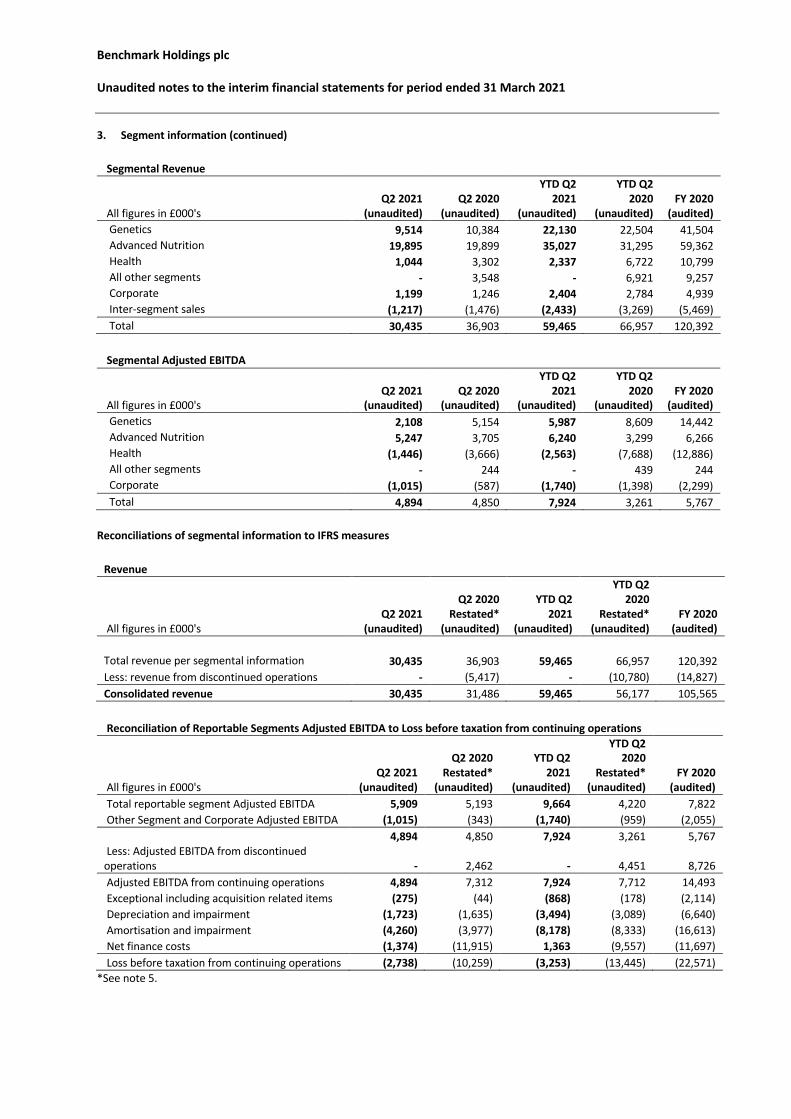
3. Segment information (continued)
Segmental Revenue
All figures in £000's Q2 2021
(unaudited) Q2 2020
(unaudited)
YTD Q2 2021
(unaudited)
YTD Q2 2020
(unaudited) FY 2020
(audited) Genetics 9,514 10,384 22,130 22,504 41,504 Advanced Nutrition 19,895 19,899 35,027 31,295 59,362 Health 1,044 3,302 2,337 6,722 10,799 All other segments - 3,548 - 6,921 9,257 Corporate 1,199 1,246 2,404 2,784 4,939 Inter-segment sales (1,217) (1,476) (2,433) (3,269) (5,469) Total 30,435 36,903 59,465 66,957 120,392
Segmental Adjusted EBITDA
All figures in £000's Q2 2021
(unaudited) Q2 2020
(unaudited)
YTD Q2 2021
(unaudited)
YTD Q2 2020
(unaudited) FY 2020
(audited) Genetics 2,108 5,154 5,987 8,609 14,442 Advanced Nutrition 5,247 3,705 6,240 3,299 6,266 Health (1,446) (3,666) (2,563) (7,688) (12,886) All other segments - 244 - 439 244 Corporate (1,015) (587) (1,740) (1,398) (2,299) Total 4,894 4,850 7,924 3,261 5,767
Reconciliations of segmental information to IFRS measures
Revenue
All figures in £000's Q2 2021
(unaudited)
Q2 2020 Restated*
(unaudited)
YTD Q2 2021
(unaudited)
YTD Q2 2020
Restated* (unaudited)
FY 2020 (audited)
Total revenue per segmental information 30,435 36,903 59,465 66,957 120,392 Less: revenue from discontinued operations - (5,417) - (10,780) (14,827) Consolidated revenue 30,435 31,486 59,465 56,177 105,565
Reconciliation of Reportable Segments Adjusted EBITDA to Loss before taxation from continuing operations
All figures in £000's Q2 2021
(unaudited)
Q2 2020 Restated*
(unaudited)
YTD Q2 2021
(unaudited)
YTD Q2 2020
Restated* (unaudited)
FY 2020 (audited)
Total reportable segment Adjusted EBITDA 5,909 5,193 9,664 4,220 7,822 Other Segment and Corporate Adjusted EBITDA (1,015) (343) (1,740) (959) (2,055)
4,894 4,850 7,924 3,261 5,767 Less: Adjusted EBITDA from discontinued operations - 2,462 - 4,451 8,726 Adjusted EBITDA from continuing operations 4,894 7,312 7,924 7,712 14,493 Exceptional including acquisition related items (275) (44) (868) (178) (2,114) Depreciation and impairment (1,723) (1,635) (3,494) (3,089) (6,640) Amortisation and impairment (4,260) (3,977) (8,178) (8,333) (16,613) Net finance costs (1,374) (11,915) 1,363 (9,557) (11,697) Loss before taxation from continuing operations (2,738) (10,259) (3,253) (13,445) (22,571)
*See note 5.
Benchmark Holdings plc
Unaudited notes to the interim financial statements for period ended 31 March 2021
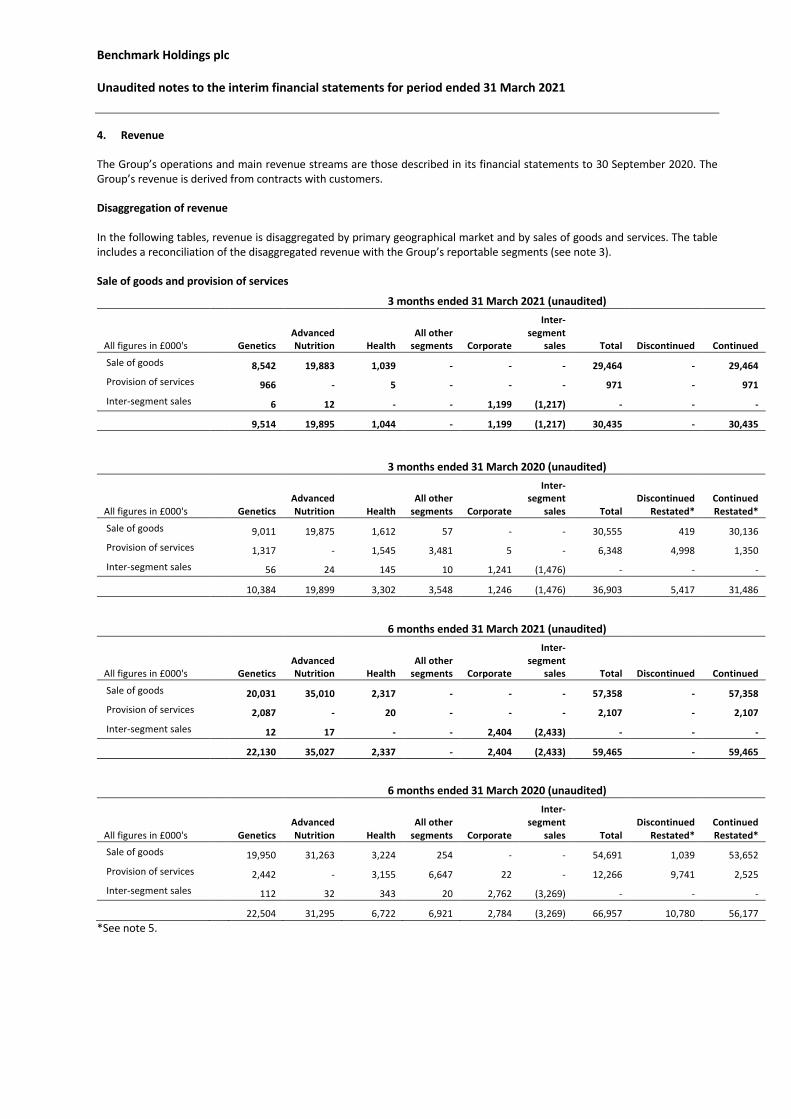
4. Revenue
The Group’s operations and main revenue streams are those described in its financial statements to 30 September 2020. The Group’s revenue is derived from contracts with customers. Disaggregation of revenue In the following tables, revenue is disaggregated by primary geographical market and by sales of goods and services. The table includes a reconciliation of the disaggregated revenue with the Group’s reportable segments (see note 3). Sale of goods and provision of services
3 months ended 31 March 2021 (unaudited)
All figures in £000's
Genetics
Advanced Nutrition Health
All other segments
Corporate
Inter-segment
sales Total
Discontinued Continued
Sale of goods 8,542 19,883 1,039 - - - 29,464 - 29,464
Provision of services 966 - 5 - - - 971 - 971
Inter-segment sales 6 12 - - 1,199 (1,217) - - - 9,514 19,895 1,044 - 1,199 (1,217) 30,435 - 30,435
3 months ended 31 March 2020 (unaudited)
All figures in £000's
Genetics
Advanced Nutrition Health
All other segments
Corporate
Inter-segment
sales Total
Discontinued
Restated* Continued Restated*
Sale of goods 9,011 19,875 1,612 57 - - 30,555 419 30,136
Provision of services 1,317 - 1,545 3,481 5 - 6,348 4,998 1,350
Inter-segment sales 56 24 145 10 1,241 (1,476) - - -
10,384 19,899 3,302 3,548 1,246 (1,476) 36,903 5,417 31,486
6 months ended 31 March 2021 (unaudited)
All figures in £000's
Genetics
Advanced Nutrition Health
All other segments
Corporate
Inter-segment
sales Total
Discontinued Continued
Sale of goods 20,031 35,010 2,317 - - - 57,358 - 57,358
Provision of services 2,087 - 20 - - - 2,107 - 2,107
Inter-segment sales 12 17 - - 2,404 (2,433) - - - 22,130 35,027 2,337 - 2,404 (2,433) 59,465 - 59,465
6 months ended 31 March 2020 (unaudited)
All figures in £000's
Genetics
Advanced Nutrition Health
All other segments
Corporate
Inter-segment
sales Total
Discontinued
Restated* Continued Restated*
Sale of goods 19,950 31,263 3,224 254 - - 54,691 1,039 53,652
Provision of services 2,442 - 3,155 6,647 22 - 12,266 9,741 2,525
Inter-segment sales 112 32 343 20 2,762 (3,269) - - -
22,504 31,295 6,722 6,921 2,784 (3,269) 66,957 10,780 56,177 *See note 5.
Benchmark Holdings plc
Unaudited notes to the interim financial statements for period ended 31 March 2021
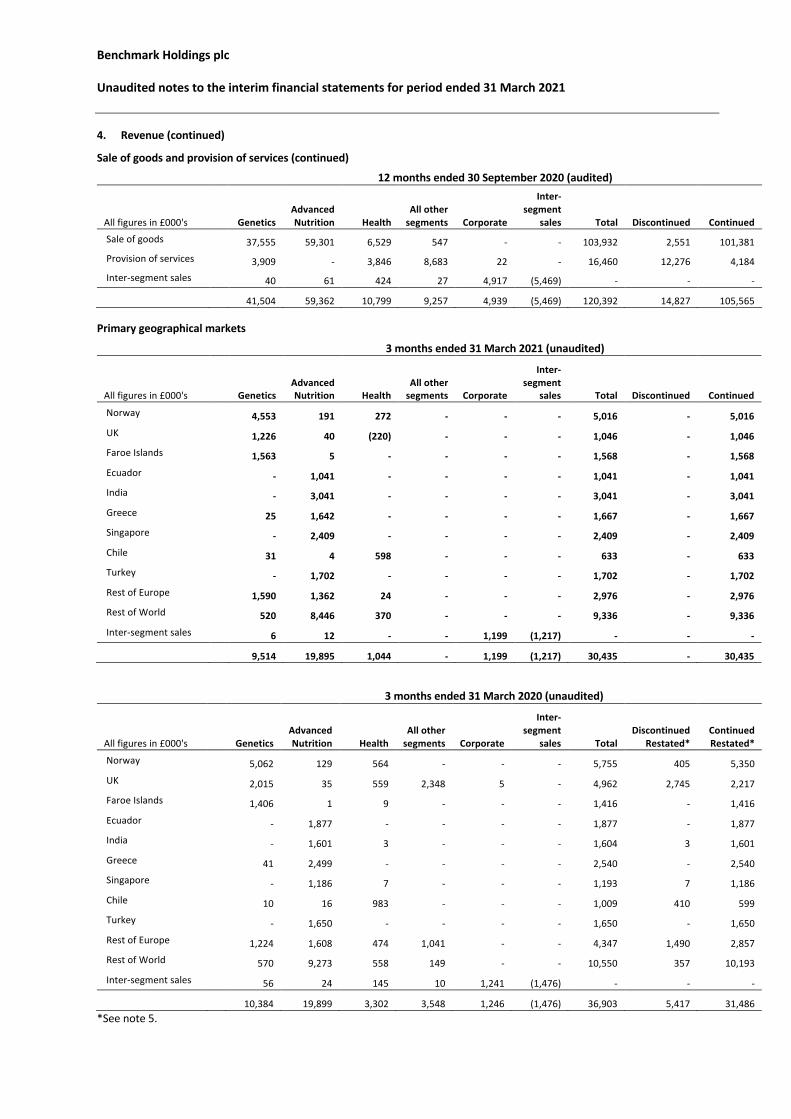
4. Revenue (continued)
Sale of goods and provision of services (continued) 12 months ended 30 September 2020 (audited)
All figures in £000's
Genetics
Advanced Nutrition Health
All other segments
Corporate
Inter-segment
sales Total
Discontinued Continued Sale of goods
37,555 59,301 6,529 547 - - 103,932 2,551 101,381 Provision of services
3,909 - 3,846 8,683 22 - 16,460 12,276 4,184 Inter-segment sales 40 61 424 27 4,917 (5,469) - - -
41,504 59,362 10,799 9,257 4,939 (5,469) 120,392 14,827 105,565 Primary geographical markets
3 months ended 31 March 2021 (unaudited)
All figures in £000's
Genetics
Advanced Nutrition Health
All other segments
Corporate
Inter-segment
sales Total
Discontinued Continued
Norway 4,553 191 272 - - - 5,016 - 5,016
UK 1,226 40 (220) - - - 1,046 - 1,046
Faroe Islands 1,563 5 - - - - 1,568 - 1,568
Ecuador - 1,041 - - - - 1,041 - 1,041
India - 3,041 - - - - 3,041 - 3,041
Greece 25 1,642 - - - - 1,667 - 1,667
Singapore - 2,409 - - - - 2,409 - 2,409
Chile 31 4 598 - - - 633 - 633
Turkey - 1,702 - - - - 1,702 - 1,702
Rest of Europe 1,590 1,362 24 - - - 2,976 - 2,976
Rest of World 520 8,446 370 - - - 9,336 - 9,336
Inter-segment sales 6 12 - - 1,199 (1,217) - - -
9,514 19,895 1,044 - 1,199 (1,217) 30,435 - 30,435
3 months ended 31 March 2020 (unaudited)
All figures in £000's
Genetics
Advanced Nutrition Health
All other segments
Corporate
Inter-segment
sales Total
Discontinued
Restated* Continued Restated*
Norway 5,062 129 564 - - - 5,755 405 5,350
UK 2,015 35 559 2,348 5 - 4,962 2,745 2,217
Faroe Islands 1,406 1 9 - - - 1,416 - 1,416
Ecuador - 1,877 - - - - 1,877 - 1,877
India - 1,601 3 - - - 1,604 3 1,601
Greece 41 2,499 - - - - 2,540 - 2,540
Singapore - 1,186 7 - - - 1,193 7 1,186
Chile 10 16 983 - - - 1,009 410 599
Turkey - 1,650 - - - - 1,650 - 1,650
Rest of Europe 1,224 1,608 474 1,041 - - 4,347 1,490 2,857
Rest of World 570 9,273 558 149 - - 10,550 357 10,193
Inter-segment sales 56 24 145 10 1,241 (1,476) - - -
10,384 19,899 3,302 3,548 1,246 (1,476) 36,903 5,417 31,486 *See note 5.
Benchmark Holdings plc
Unaudited notes to the interim financial statements for period ended 31 March 2021
4. Revenue (continued)
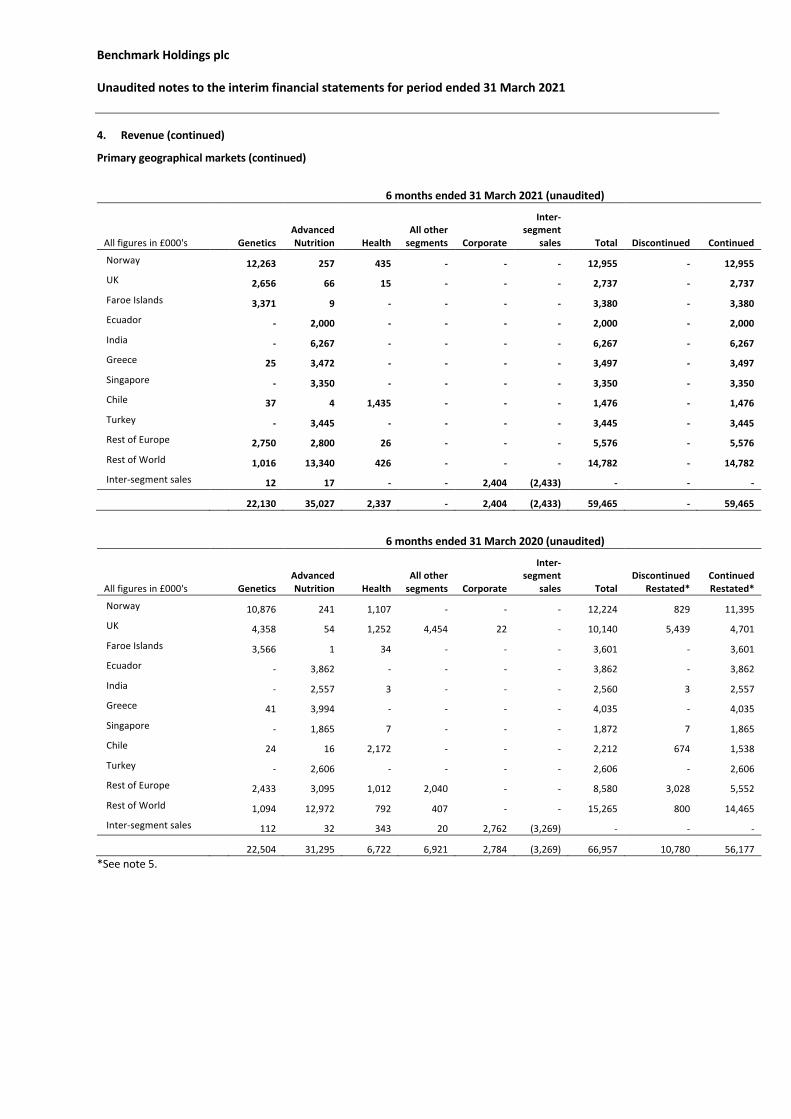
Primary geographical markets (continued)
6 months ended 31 March 2021 (unaudited)
All figures in £000's
Genetics
Advanced Nutrition Health
All other segments
Corporate
Inter-segment
sales Total
Discontinued Continued
Norway 12,263 257 435 - - - 12,955 - 12,955
UK 2,656 66 15 - - - 2,737 - 2,737
Faroe Islands 3,371 9 - - - - 3,380 - 3,380
Ecuador - 2,000 - - - - 2,000 - 2,000
India - 6,267 - - - - 6,267 - 6,267
Greece 25 3,472 - - - - 3,497 - 3,497
Singapore - 3,350 - - - - 3,350 - 3,350
Chile 37 4 1,435 - - - 1,476 - 1,476
Turkey - 3,445 - - - - 3,445 - 3,445
Rest of Europe 2,750 2,800 26 - - - 5,576 - 5,576
Rest of World 1,016 13,340 426 - - - 14,782 - 14,782
Inter-segment sales 12 17 - - 2,404 (2,433) - - -
22,130 35,027 2,337 - 2,404 (2,433) 59,465 - 59,465
6 months ended 31 March 2020 (unaudited)
All figures in £000's
Genetics
Advanced Nutrition Health
All other segments
Corporate
Inter-segment
sales Total
Discontinued
Restated* Continued Restated*
Norway 10,876 241 1,107 - - - 12,224 829 11,395
UK 4,358 54 1,252 4,454 22 - 10,140 5,439 4,701
Faroe Islands 3,566 1 34 - - - 3,601 - 3,601
Ecuador - 3,862 - - - - 3,862 - 3,862
India - 2,557 3 - - - 2,560 3 2,557
Greece 41 3,994 - - - - 4,035 - 4,035
Singapore - 1,865 7 - - - 1,872 7 1,865
Chile 24 16 2,172 - - - 2,212 674 1,538
Turkey - 2,606 - - - - 2,606 - 2,606
Rest of Europe 2,433 3,095 1,012 2,040 - - 8,580 3,028 5,552
Rest of World 1,094 12,972 792 407 - - 15,265 800 14,465
Inter-segment sales 112 32 343 20 2,762 (3,269) - - -
22,504 31,295 6,722 6,921 2,784 (3,269) 66,957 10,780 56,177 *See note 5.
Benchmark Holdings plc
Unaudited notes to the interim financial statements for period ended 31 March 2021
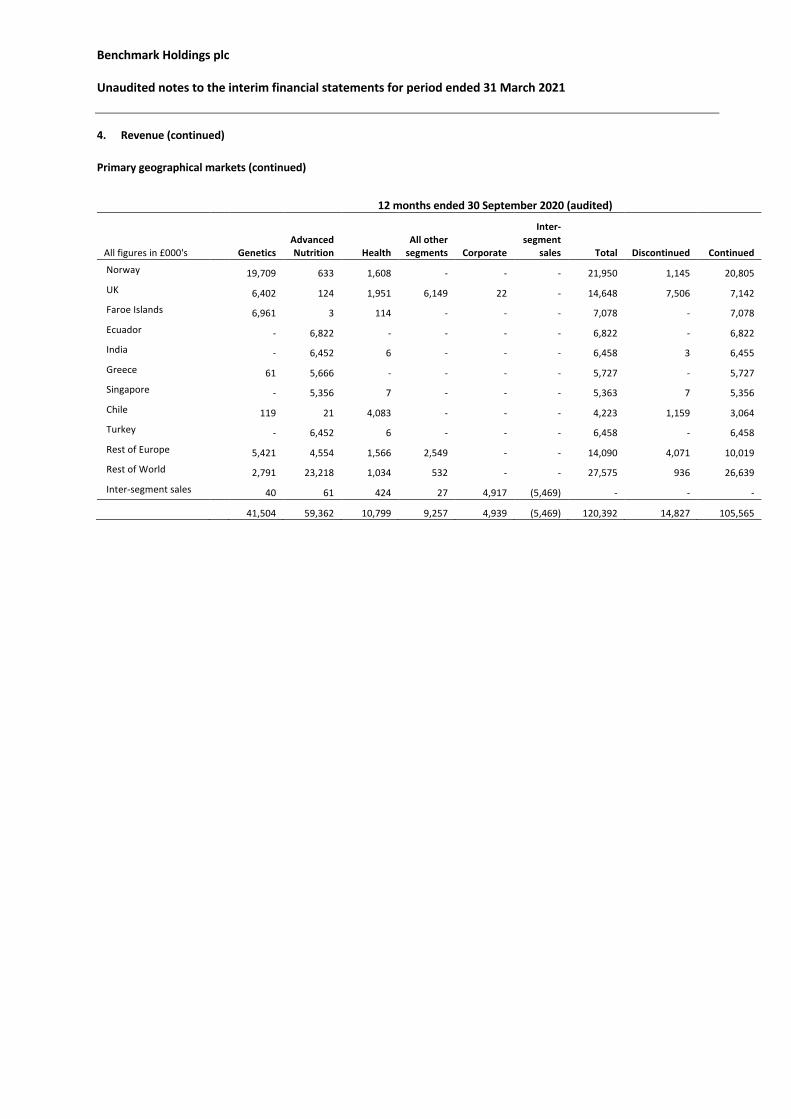
4. Revenue (continued) Primary geographical markets (continued)
12 months ended 30 September 2020 (audited)
All figures in £000's
Genetics
Advanced Nutrition Health
All other segments
Corporate
Inter-segment
sales Total
Discontinued Continued
Norway 19,709 633 1,608 - - - 21,950 1,145 20,805
UK 6,402 124 1,951 6,149 22 - 14,648 7,506 7,142
Faroe Islands 6,961 3 114 - - - 7,078 - 7,078
Ecuador - 6,822 - - - - 6,822 - 6,822
India - 6,452 6 - - - 6,458 3 6,455
Greece 61 5,666 - - - - 5,727 - 5,727
Singapore - 5,356 7 - - - 5,363 7 5,356
Chile 119 21 4,083 - - - 4,223 1,159 3,064
Turkey - 6,452 6 - - - 6,458 - 6,458
Rest of Europe 5,421 4,554 1,566 2,549 - - 14,090 4,071 10,019
Rest of World 2,791 23,218 1,034 532 - - 27,575 936 26,639
Inter-segment sales 40 61 424 27 4,917 (5,469) - - -
41,504 59,362 10,799 9,257 4,939 (5,469) 120,392 14,827 105,565
Benchmark Holdings plc
Unaudited notes to the interim financial statements for period ended 31 March 2021
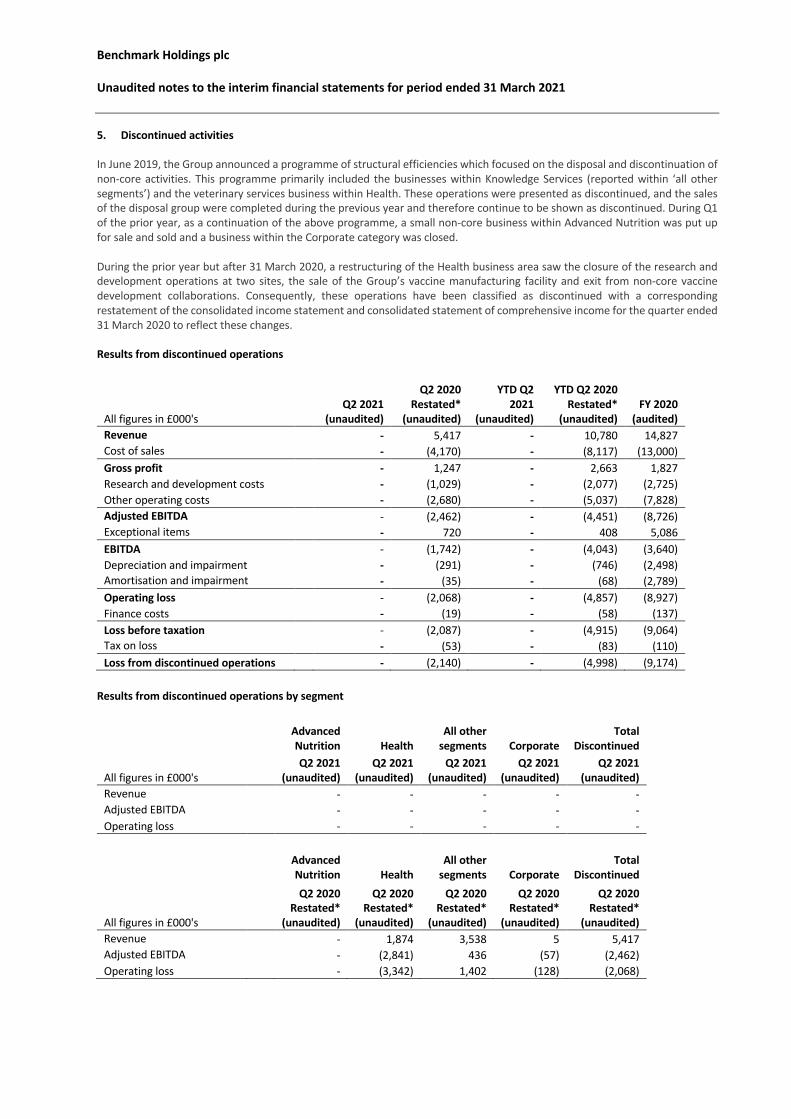
5. Discontinued activities
In June 2019, the Group announced a programme of structural efficiencies which focused on the disposal and discontinuation of non-core activities. This programme primarily included the businesses within Knowledge Services (reported within ‘all other segments’) and the veterinary services business within Health. These operations were presented as discontinued, and the sales of the disposal group were completed during the previous year and therefore continue to be shown as discontinued. During Q1 of the prior year, as a continuation of the above programme, a small non-core business within Advanced Nutrition was put up for sale and sold and a business within the Corporate category was closed. During the prior year but after 31 March 2020, a restructuring of the Health business area saw the closure of the research and development operations at two sites, the sale of the Group’s vaccine manufacturing facility and exit from non-core vaccine development collaborations. Consequently, these operations have been classified as discontinued with a corresponding restatement of the consolidated income statement and consolidated statement of comprehensive income for the quarter ended 31 March 2020 to reflect these changes. Results from discontinued operations
All figures in £000's Q2 2021
(unaudited)
Q2 2020 Restated*
(unaudited)
YTD Q2 2021
(unaudited)
YTD Q2 2020 Restated*
(unaudited) FY 2020
(audited) Revenue - 5,417 - 10,780 14,827 Cost of sales - (4,170) - (8,117) (13,000) Gross profit - 1,247 - 2,663 1,827 Research and development costs - (1,029) - (2,077) (2,725) Other operating costs - (2,680) - (5,037) (7,828) Adjusted EBITDA - (2,462) - (4,451) (8,726) Exceptional items - 720 - 408 5,086 EBITDA - (1,742) - (4,043) (3,640) Depreciation and impairment - (291) - (746) (2,498) Amortisation and impairment - (35) - (68) (2,789) Operating loss - (2,068) - (4,857) (8,927) Finance costs - (19) - (58) (137) Loss before taxation - (2,087) - (4,915) (9,064) Tax on loss - (53) - (83) (110) Loss from discontinued operations - (2,140) - (4,998) (9,174)
Results from discontinued operations by segment
Advanced Nutrition Health
All other segments Corporate
Total Discontinued
All figures in £000's Q2 2021
(unaudited) Q2 2021
(unaudited) Q2 2021
(unaudited) Q2 2021
(unaudited) Q2 2021
(unaudited) Revenue - - - - - Adjusted EBITDA - - - - - Operating loss - - - - -
Advanced Nutrition Health
All other segments Corporate
Total Discontinued
All figures in £000's
Q2 2020 Restated*
(unaudited)
Q2 2020 Restated*
(unaudited)
Q2 2020 Restated*
(unaudited)
Q2 2020 Restated*
(unaudited)
Q2 2020 Restated*
(unaudited) Revenue - 1,874 3,538 5 5,417 Adjusted EBITDA - (2,841) 436 (57) (2,462) Operating loss - (3,342) 1,402 (128) (2,068)
Benchmark Holdings plc
Unaudited notes to the interim financial statements for period ended 31 March 2021
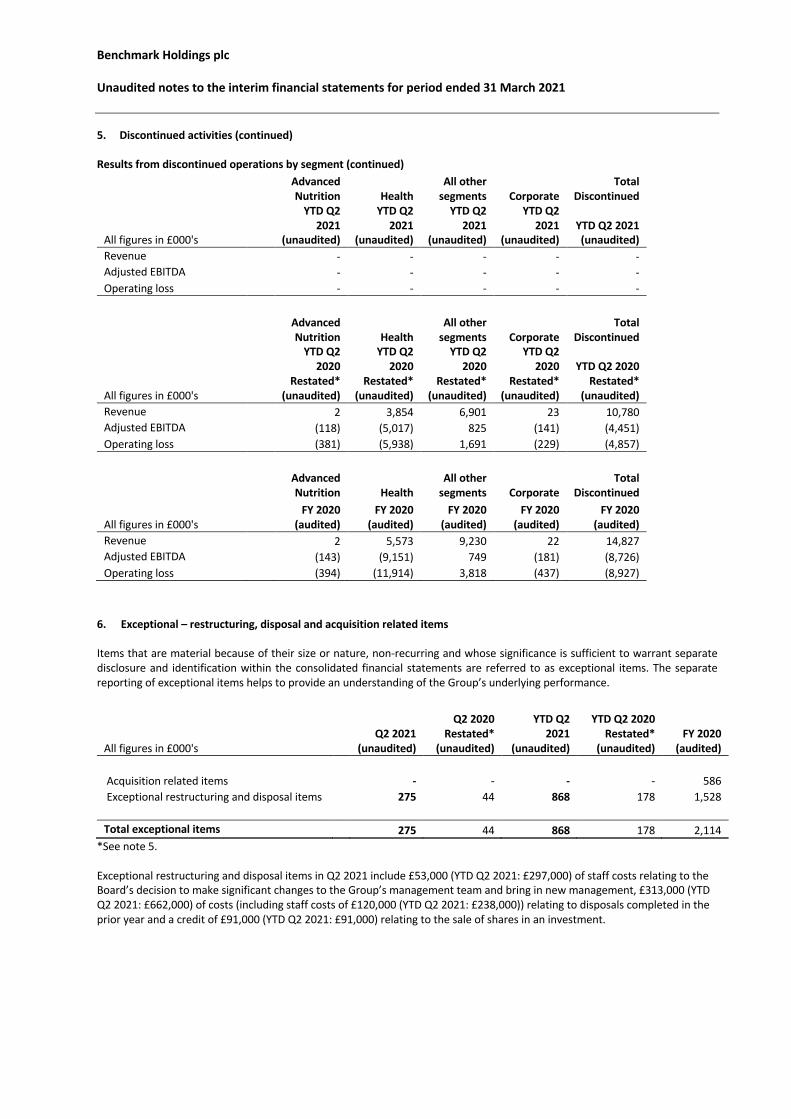
5. Discontinued activities (continued) Results from discontinued operations by segment (continued)
Advanced Nutrition Health
All other segments Corporate
Total Discontinued
All figures in £000's
YTD Q2 2021
(unaudited)
YTD Q2 2021
(unaudited)
YTD Q2 2021
(unaudited)
YTD Q2 2021
(unaudited) YTD Q2 2021 (unaudited)
Revenue - - - - - Adjusted EBITDA - - - - - Operating loss - - - - -
Advanced Nutrition Health
All other segments Corporate
Total Discontinued
All figures in £000's
YTD Q2 2020
Restated* (unaudited)
YTD Q2 2020
Restated* (unaudited)
YTD Q2 2020
Restated* (unaudited)
YTD Q2 2020
Restated* (unaudited)
YTD Q2 2020 Restated*
(unaudited) Revenue 2 3,854 6,901 23 10,780 Adjusted EBITDA (118) (5,017) 825 (141) (4,451) Operating loss (381) (5,938) 1,691 (229) (4,857)
Advanced Nutrition Health
All other segments Corporate
Total Discontinued
All figures in £000's FY 2020
(audited) FY 2020
(audited) FY 2020
(audited) FY 2020
(audited) FY 2020
(audited) Revenue 2 5,573 9,230 22 14,827 Adjusted EBITDA (143) (9,151) 749 (181) (8,726) Operating loss (394) (11,914) 3,818 (437) (8,927)
6. Exceptional – restructuring, disposal and acquisition related items Items that are material because of their size or nature, non-recurring and whose significance is sufficient to warrant separate disclosure and identification within the consolidated financial statements are referred to as exceptional items. The separate reporting of exceptional items helps to provide an understanding of the Group’s underlying performance.
All figures in £000's Q2 2021
(unaudited)
Q2 2020 Restated*
(unaudited)
YTD Q2 2021
(unaudited)
YTD Q2 2020 Restated*
(unaudited) FY 2020
(audited)
Acquisition related items - - - - 586 Exceptional restructuring and disposal items 275 44 868 178 1,528 Total exceptional items 275 44 868 178 2,114
*See note 5. Exceptional restructuring and disposal items in Q2 2021 include £53,000 (YTD Q2 2021: £297,000) of staff costs relating to the Board’s decision to make significant changes to the Group’s management team and bring in new management, £313,000 (YTD Q2 2021: £662,000) of costs (including staff costs of £120,000 (YTD Q2 2021: £238,000)) relating to disposals completed in the prior year and a credit of £91,000 (YTD Q2 2021: £91,000) relating to the sale of shares in an investment.
Benchmark Holdings plc
Unaudited notes to the interim financial statements for period ended 31 March 2021
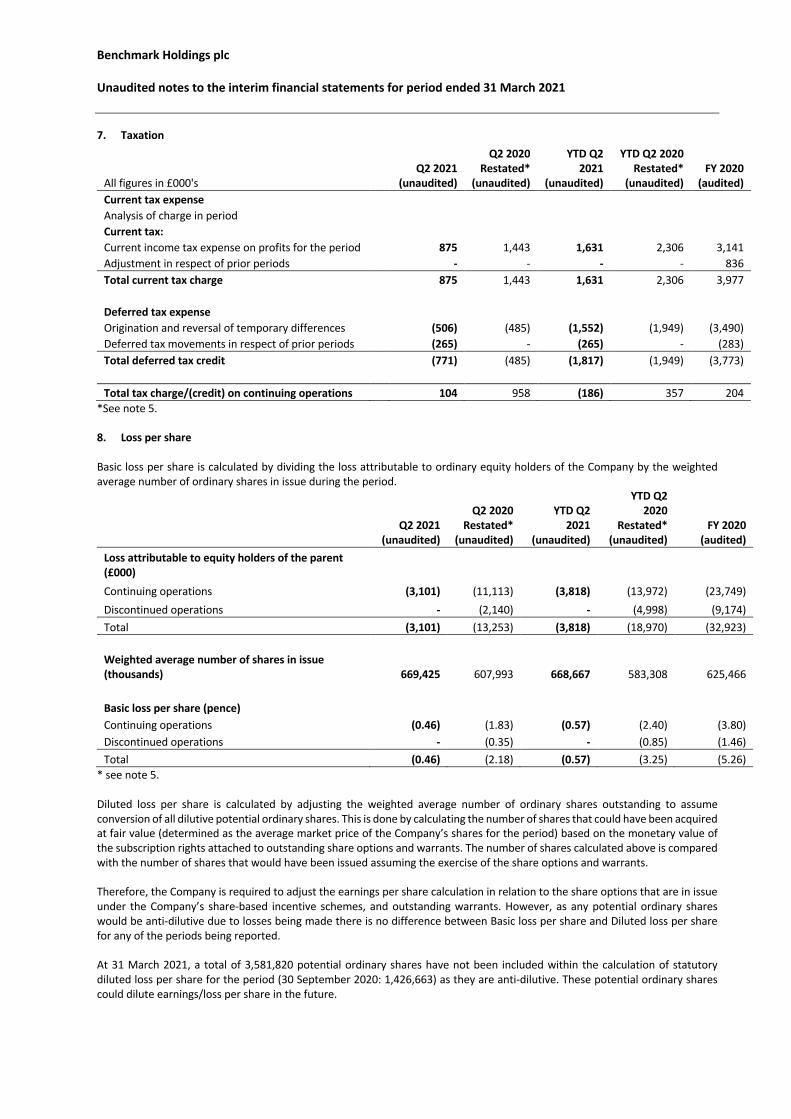
7. Taxation
All figures in £000's Q2 2021
(unaudited)
Q2 2020 Restated*
(unaudited)
YTD Q2 2021
(unaudited)
YTD Q2 2020 Restated*
(unaudited) FY 2020
(audited) Current tax expense Analysis of charge in period Current tax: Current income tax expense on profits for the period 875 1,443 1,631 2,306 3,141 Adjustment in respect of prior periods - - - - 836 Total current tax charge 875 1,443 1,631 2,306 3,977
Deferred tax expense Origination and reversal of temporary differences (506) (485) (1,552) (1,949) (3,490) Deferred tax movements in respect of prior periods (265) - (265) - (283) Total deferred tax credit (771) (485) (1,817) (1,949) (3,773) Total tax charge/(credit) on continuing operations 104 958 (186) 357 204
*See note 5.
8. Loss per share Basic loss per share is calculated by dividing the loss attributable to ordinary equity holders of the Company by the weighted average number of ordinary shares in issue during the period.
Q2 2021
(unaudited)
Q2 2020 Restated*
(unaudited)
YTD Q2 2021
(unaudited)
YTD Q2 2020
Restated* (unaudited)
FY 2020 (audited)
Loss attributable to equity holders of the parent (£000) Continuing operations (3,101) (11,113) (3,818) (13,972) (23,749) Discontinued operations - (2,140) - (4,998) (9,174) Total (3,101) (13,253) (3,818) (18,970) (32,923)
Weighted average number of shares in issue (thousands) 669,425 607,993 668,667 583,308 625,466
Basic loss per share (pence) Continuing operations (0.46) (1.83) (0.57) (2.40) (3.80) Discontinued operations - (0.35) - (0.85) (1.46) Total (0.46) (2.18) (0.57) (3.25) (5.26)
* see note 5. Diluted loss per share is calculated by adjusting the weighted average number of ordinary shares outstanding to assume conversion of all dilutive potential ordinary shares. This is done by calculating the number of shares that could have been acquired at fair value (determined as the average market price of the Company’s shares for the period) based on the monetary value of the subscription rights attached to outstanding share options and warrants. The number of shares calculated above is compared with the number of shares that would have been issued assuming the exercise of the share options and warrants. Therefore, the Company is required to adjust the earnings per share calculation in relation to the share options that are in issue under the Company’s share-based incentive schemes, and outstanding warrants. However, as any potential ordinary shares would be anti-dilutive due to losses being made there is no difference between Basic loss per share and Diluted loss per share for any of the periods being reported. At 31 March 2021, a total of 3,581,820 potential ordinary shares have not been included within the calculation of statutory diluted loss per share for the period (30 September 2020: 1,426,663) as they are anti-dilutive. These potential ordinary shares could dilute earnings/loss per share in the future.
Benchmark Holdings plc
Unaudited notes to the interim financial statements for period ended 31 March 2021
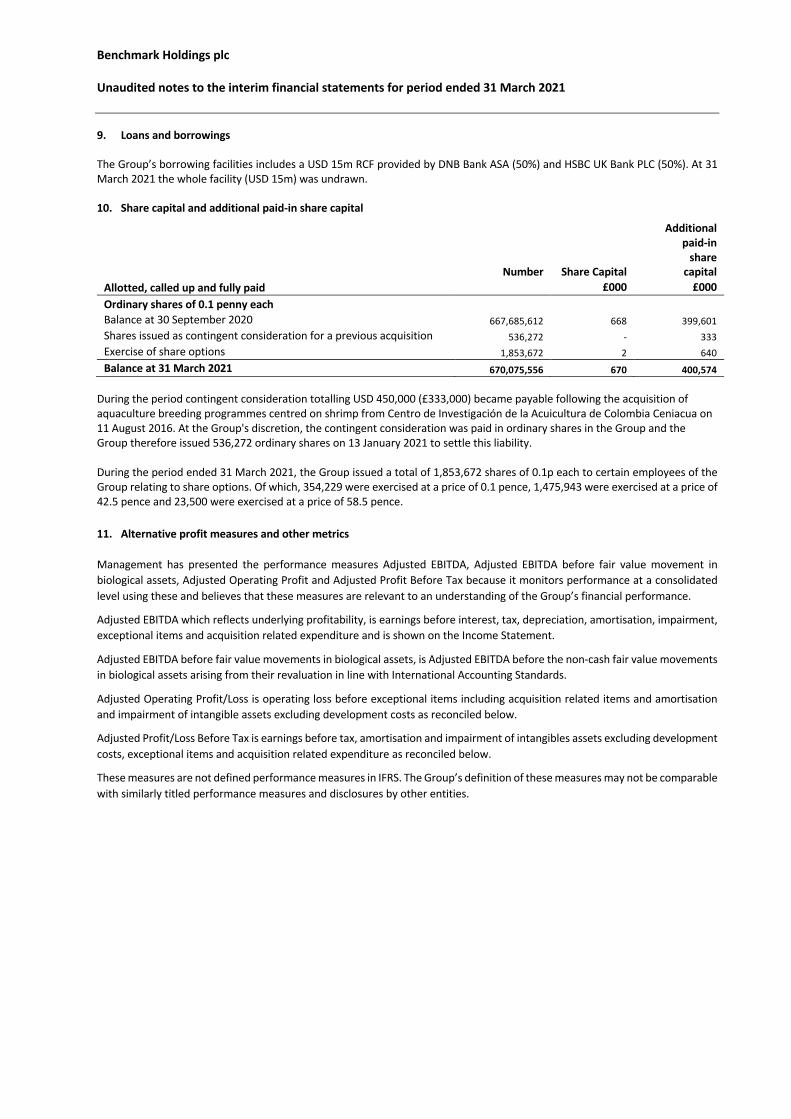
9. Loans and borrowings The Group’s borrowing facilities includes a USD 15m RCF provided by DNB Bank ASA (50%) and HSBC UK Bank PLC (50%). At 31 March 2021 the whole facility (USD 15m) was undrawn. 10. Share capital and additional paid-in share capital
Number Share Capital
Additional paid-in
share capital
Allotted, called up and fully paid £000 £000 Ordinary shares of 0.1 penny each Balance at 30 September 2020 667,685,612 668 399,601 Shares issued as contingent consideration for a previous acquisition 536,272 - 333 Exercise of share options 1,853,672 2 640 Balance at 31 March 2021 670,075,556 670 400,574
During the period contingent consideration totalling USD 450,000 (£333,000) became payable following the acquisition of aquaculture breeding programmes centred on shrimp from Centro de Investigación de la Acuicultura de Colombia Ceniacua on 11 August 2016. At the Group's discretion, the contingent consideration was paid in ordinary shares in the Group and the Group therefore issued 536,272 ordinary shares on 13 January 2021 to settle this liability.
During the period ended 31 March 2021, the Group issued a total of 1,853,672 shares of 0.1p each to certain employees of the Group relating to share options. Of which, 354,229 were exercised at a price of 0.1 pence, 1,475,943 were exercised at a price of 42.5 pence and 23,500 were exercised at a price of 58.5 pence. 11. Alternative profit measures and other metrics Management has presented the performance measures Adjusted EBITDA, Adjusted EBITDA before fair value movement in biological assets, Adjusted Operating Profit and Adjusted Profit Before Tax because it monitors performance at a consolidated level using these and believes that these measures are relevant to an understanding of the Group’s financial performance.
Adjusted EBITDA which reflects underlying profitability, is earnings before interest, tax, depreciation, amortisation, impairment, exceptional items and acquisition related expenditure and is shown on the Income Statement.
Adjusted EBITDA before fair value movements in biological assets, is Adjusted EBITDA before the non-cash fair value movements in biological assets arising from their revaluation in line with International Accounting Standards.
Adjusted Operating Profit/Loss is operating loss before exceptional items including acquisition related items and amortisation and impairment of intangible assets excluding development costs as reconciled below.
Adjusted Profit/Loss Before Tax is earnings before tax, amortisation and impairment of intangibles assets excluding development costs, exceptional items and acquisition related expenditure as reconciled below.
These measures are not defined performance measures in IFRS. The Group’s definition of these measures may not be comparable with similarly titled performance measures and disclosures by other entities.
Benchmark Holdings plc
Unaudited notes to the interim financial statements for period ended 31 March 2021
11. Alternative profit measures and other metrics (continued)
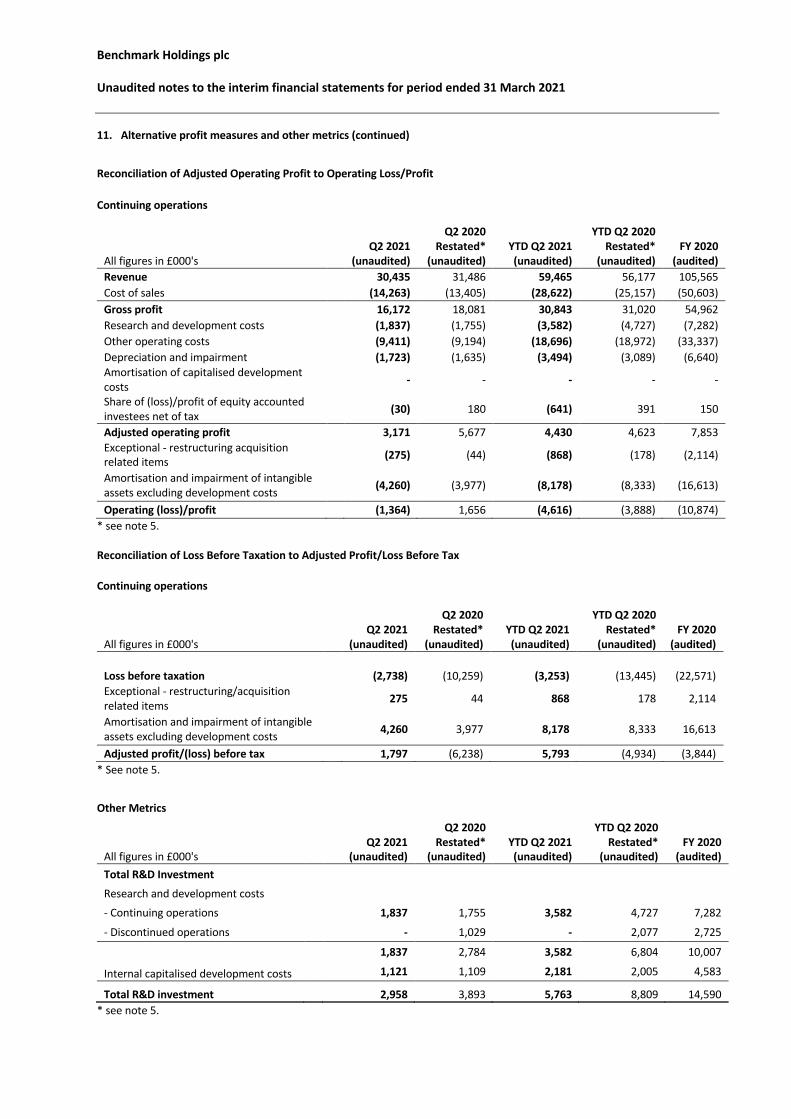
Reconciliation of Adjusted Operating Profit to Operating Loss/Profit
Continuing operations
All figures in £000's Q2 2021
(unaudited)
Q2 2020 Restated*
(unaudited) YTD Q2 2021 (unaudited)
YTD Q2 2020 Restated*
(unaudited) FY 2020
(audited) Revenue 30,435 31,486 59,465 56,177 105,565 Cost of sales (14,263) (13,405) (28,622) (25,157) (50,603) Gross profit 16,172 18,081 30,843 31,020 54,962 Research and development costs (1,837) (1,755) (3,582) (4,727) (7,282) Other operating costs (9,411) (9,194) (18,696) (18,972) (33,337) Depreciation and impairment (1,723) (1,635) (3,494) (3,089) (6,640) Amortisation of capitalised development costs
- - - - -
Share of (loss)/profit of equity accounted investees net of tax (30) 180 (641) 391 150
Adjusted operating profit 3,171 5,677 4,430 4,623 7,853 Exceptional - restructuring acquisition related items
(275) (44) (868) (178) (2,114)
Amortisation and impairment of intangible assets excluding development costs (4,260) (3,977) (8,178) (8,333) (16,613)
Operating (loss)/profit (1,364) 1,656 (4,616) (3,888) (10,874) * see note 5. Reconciliation of Loss Before Taxation to Adjusted Profit/Loss Before Tax
Continuing operations
All figures in £000's Q2 2021
(unaudited)
Q2 2020 Restated*
(unaudited) YTD Q2 2021 (unaudited)
YTD Q2 2020 Restated*
(unaudited) FY 2020
(audited)
Loss before taxation (2,738) (10,259) (3,253) (13,445) (22,571) Exceptional - restructuring/acquisition related items
275 44 868 178 2,114
Amortisation and impairment of intangible assets excluding development costs 4,260 3,977 8,178 8,333 16,613
Adjusted profit/(loss) before tax 1,797 (6,238) 5,793 (4,934) (3,844) * See note 5.
Other Metrics
All figures in £000's Q2 2021
(unaudited)
Q2 2020 Restated*
(unaudited) YTD Q2 2021 (unaudited)
YTD Q2 2020 Restated*
(unaudited) FY 2020
(audited) Total R&D Investment
Research and development costs
- Continuing operations 1,837 1,755 3,582 4,727 7,282
- Discontinued operations - 1,029 - 2,077 2,725 1,837 2,784 3,582 6,804 10,007
Internal capitalised development costs 1,121 1,109 2,181 2,005 4,583
Total R&D investment 2,958 3,893 5,763 8,809 14,590 * see note 5.
Benchmark Holdings plc
Unaudited notes to the interim financial statements for period ended 31 March 2021
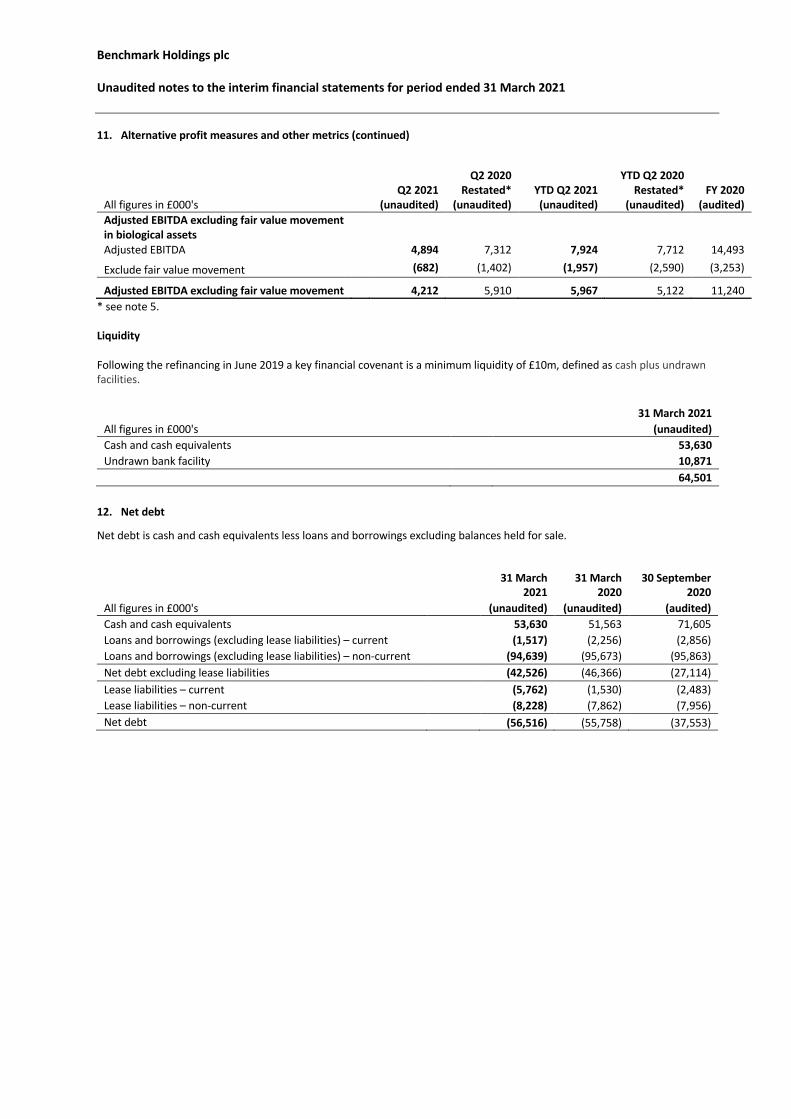
11. Alternative profit measures and other metrics (continued)
All figures in £000's Q2 2021
(unaudited)
Q2 2020 Restated*
(unaudited) YTD Q2 2021 (unaudited)
YTD Q2 2020 Restated*
(unaudited) FY 2020
(audited) Adjusted EBITDA excluding fair value movement in biological assets
Adjusted EBITDA 4,894 7,312 7,924 7,712 14,493
Exclude fair value movement (682) (1,402) (1,957) (2,590) (3,253)
Adjusted EBITDA excluding fair value movement 4,212 5,910 5,967 5,122 11,240 * see note 5. Liquidity Following the refinancing in June 2019 a key financial covenant is a minimum liquidity of £10m, defined as cash plus undrawn facilities. 31 March 2021 All figures in £000's (unaudited) Cash and cash equivalents 53,630 Undrawn bank facility 10,871 64,501
12. Net debt
Net debt is cash and cash equivalents less loans and borrowings excluding balances held for sale.
31 March 2021
31 March 2020
30 September
2020 All figures in £000's (unaudited) (unaudited) (audited) Cash and cash equivalents 53,630 51,563 71,605 Loans and borrowings (excluding lease liabilities) – current (1,517) (2,256) (2,856) Loans and borrowings (excluding lease liabilities) – non-current (94,639) (95,673) (95,863) Net debt excluding lease liabilities (42,526) (46,366) (27,114) Lease liabilities – current (5,762) (1,530) (2,483) Lease liabilities – non-current (8,228) (7,862) (7,956) Net debt (56,516) (55,758) (37,553)