Embed Size (px)
Citation preview

UNICEThe UNICE Benchmarking Report 2001
The reNewed EconomyThe reNewed EconomyBusiness for a dynamic EuropeBusiness for a dynamic Europe

UNICEThe UNICE Benchmarking Report 2001
The reNewed EconomyThe reNewed EconomyBusiness for a dynamic EuropeBusiness for a dynamic Europe

THE VOICE OF BUSINESS IN EUROPE
4 The reNewed Economy
Foreword . . . . . . . . . . . . . . . . . . . . . . . . . . . . . . . . . . . . . . . . . . . . . . . . . . . . . . . . . . . . . . . . . . . . . . . . . . . . . . . . . . . . .5Introduction . . . . . . . . . . . . . . . . . . . . . . . . . . . . . . . . . . . . . . . . . . . . . . . . . . . . . . . . . . . . . . . . . . . . . . . . . . . . . . . . . . .6
Chapter I The Emergence of the "New Economy" . . . . . . . . . . . . . . . . . . . . . . . . . . . . . . . . . . . . . . . . . . . . . . . . . .8• The USA pulls further ahead• How Information and Communications Technology drives the "new economy"
Chapter II New technologies transform the economy . . . . . . . . . . . . . . . . . . . . . . . . . . . . . . . . . . . . . . . . . . . . . . .13• Markets and companies are reorganised• People are empowered• Governments can increase their efficiency
Chapter III Policies to realise the full potential of the new economy . . . . . . . . . . . . . . . . . . . . . . . . . . . . . . . . . . . .22• Stimulate the development and diffusion of new ideas• Create a supportive infrastructure• Increase customer acceptance• Improve labour markets• Integrate capital markets• Reward risk and effort
Conclusions . . . . . . . . . . . . . . . . . . . . . . . . . . . . . . . . . . . . . . . . . . . . . . . . . . . . . . . . . . . . . . . . . . . . . . . . . . . . . . . . . .45
Annex . . . . . . . . . . . . . . . . . . . . . . . . . . . . . . . . . . . . . . . . . . . . . . . . . . . . . . . . . . . . . . . . . . . . . . . . . . . . . . . . . . . . . . .46
• List of indicators, boxes and abbreviations• The UNICE Competitiveness Group
Table of Contents

THE VOICE O F BUSINESS IN EUROPE
5The UNICE Benchmarking Report 2001
This is the fourth UNICE benchmarking report, and itfocuses on "The reNewed Economy". It reviews
some of the major themes of previous reports:"Competitiveness" (1998), "Entrepreneurship" (1999)and "Innovation" (2000). It stresses the importance ofinnovation and entrepreneurship for competitivenessin the new economy.
The new economy is much more than the generationof new technologies, particularly new information andcommunications technologies (ICT). It includes thewidespread diffusion and adoption of thesetechnologies, the development of new skills in the workforce and the use of new forms of work organisation.The report concludes that the new economy providesa unique opportunity for Europe to improve its livingstandards, increase employment and speed upgrowth.
The stock-market fortunes and failures of the new"dot.coms" make the headlines every week, yet thenew economy permeates more deeply into the old.The impact of the new technologies will have a long-lasting effect on the whole of our economy, even if theinitial enthusiasm about the most prominent features ofthe "new economy" fades.
At the European Union summit in Lisbon in March2000, governments made a commitment to build acompetitive and dynamic knowledge-based economy,through measures to facilitate the development of theinformation society, to increase the level of Researchand Development, to stimulate the growth ofinnovative small and medium-sized enterprises, and tocreate jobs. The Lisbon conclusions are a good first
step on the road to greater European competitivenessin the new economy, but there is still a long way to go.
Measures need to be taken on a European and at anational level to create a single market forentrepreneurship and innovations, a single financialmarket, and a world-class ICT infrastructure. The neweconomy may have appeared first in the United States,but that country is not the only benchmark. The reportalso shows that progress has been made in severalEuropean countries. Other countries can benefit fromtheir experiences, in particular how to combineeconomic change with social cohesion.
The Stockholm Summit in March 2001 provides thefirst opportunity for heads of state and government totake stock of the progress made in implementing theLisbon recommendations and to maintain momentumand direction in the process. If the conclusions ofLisbon are to remain credible, the targets set byMember States should be implemented as promised.Governments, business and citizens have a commoninterest in their success.
Georges JacobsPresident
Foreword
The EU's strategic goal for thenext decade is: "to become themost competitive and dynamicknowledge-based economy in theworld capable of sustainableeconomic growth with more andbetter jobs and greater socialcohesion".
Presidency conclusions of theLisbon summit, March 2000

THE VOICE OF BUSINESS IN EUROPE
6 The reNewed Economy
The term the "new economy" is often used to describethe remarkable performance of the US economyduring recent years - consistently high rates of growth,strong productivity growth and rising employment butwith stable, low inflation. Yet the term means differentthings to different people.
It refers, in this report, not only to the emergence ofthe new information and communication technologiessymbolised by "Silicon Valley" but also to theincreasing use of these technologies in the "oldeconomy". This enables individuals, companies andgovernments both to do new things and to do oldthings in new and better ways. It is the diffusion of ahost of inventions throughout the whole economy.
The new economy is based on general-purposetechnologies - symbolised by the memory chip,computer, Internet, and the mobile phone - that havedramatically reduced the cost of storing, processingand communicating information. Fuelled byderegulation and globalisation, these technologies aretransforming the way markets, companies andindividuals work, leading to new business strategiesand new methods of organisation - in short, to arenewal of the whole economy.
These changes may well be sufficiently extensive toadd up to a third industrial revolution. Like the first(steam power) and the second (electric power), thethird (automated brain power and the "death ofdistance") will transform industry and the economy.
This transformation will take time. It will beunpredictable and have widespread ramifications forsociety.
Governments today cannot foresee its timing, courseor effects any more than their predecessors could twohundred years ago. What they can do is to provide theframework conditions necessary to allow humaningenuity to flourish and the opportunities offered bythe new technologies to spread throughout theeconomy within a modernised European social model.This is the challenge that European governmentsaccepted at Lisbon.
Much is at stake. The speed of change is faster thanbefore, with a commensurate increase of risk.Companies that are slower than their competitors toadopt new technologies will disappear. Societies thatfail to adapt to new technologies as quickly as otherswill suffer a fall in relative living standards and a risein unemployment.
If Europe is to catch up and compete with the USA,governments must provide companies and individualswith stronger incentives to innovate, and to adopt andadapt innovations made by others. Entrepreneursmust be better rewarded for risk-taking. Employeesmust be more motivated to update their knowledgeand skills continually. Private and public organisationsmust be both willing and able to adapt their strategiesand their structures to changing circumstances andnew opportunities.
Introduction
"...when technology reshapessociety, it is not the result of asingle invention but of a host ofadditional, completelyunanticipated inventions.."
Herbert A. Simon, 1987 TheSteam Engine and the Computer:What makes TechnologyRevolutionary.

THE VOICE O F BUSINESS IN EUROPE
7The UNICE Benchmarking Report 2001
This report compares and contrasts the spread of the newtechnologies in Europe, the United States and Japan. It concludesthat if Europe is to be a dynamic and competitive knowledge-based economy, it needs to have:
1. A stronger spirit of enterprise• Governments must acknowledge entrepreneurship as the
key to growth. The creation - and destruction - of firms is thevehicle for technical progress.
• Start-up costs for new businesses must be competitive, andregulations must be simple and cost-efficient.
• Society must reward entrepreneurial success and viewoccasional failure as a learning experience. High risks mustbe offset by high returns.
• Governments must lead by example, providing publicservices electronically.
2. A more competitive environment• Labour markets must be sufficiently flexible so that
companies can obtain the right skills, at the right times atcompetitive costs and change their work organisations inresponse to changing circumstances.
• Capital markets must be sufficiently large, diversified andcompetitive to provide firms with attractive financingoptions.
• Markets for all goods and services, including public utilities,should be sufficiently flexible to encourage the entry of newcompetitors and new ways of competing, and to ease theexit of inefficient companies.
• New legislation must facilitate e-commerce and providecost-efficient dispute settlement between buyers andsellers: the citizen must be protected in the informationsociety through secure communications and databases,which maintain personal integrity.
3. A world-class knowledge infrastructure• Educational and training systems must provide people with
useful knowledge and skills throughout their working lives.• Research and development institutions, private and public,
and individual researchers must have strong incentives topursue new knowledge and to commercialise it.
• Infrastructure must be deregulated and exposed tocompetition.
• Access to high bandwidth services must be efficient andaffordable, across Europe.
4. A society more supportive of change• Governments and companies must implement policies to
improve employability, so that individuals are able to adaptto the changes involved in technical progress.
• Governments must encourage individuals andorganisations to experiment with new technologies and withnew products and services.
• Social security must be provided in ways that encourageindividuals to adjust to change, not to resist it.
• Individuals must be more flexible: in a changingenvironment the ability to adjust is the individual's only truesecurity.
Per Magnus WijkmanChairman, Competitiveness Group

THE VOICE OF BUSINESS IN EUROPE
8 The reNewed Economy
Chapter I - The emergence of the “New Economy”
n The USA pulls further ahead
0.0
0.5
1.0
1.5
2.0
2.5
3.0
3.5
4.0
1980-90 1990-95 1995-99
USA EU Japan
%
Indicator 1: Annual growth of real GDP per capita since 1980
Source: OECD Economic Outlook 2000.
Since 1991 the US economy has experienced one of the longest periods of sustained growth, in living standards and in employment, inits history, with acceleration in economic growth since 1995. The recent slowdown does not detract from the fundamental changes thathave taken place in the economy. The development and diffusion of new information and communications technologies (ICT) andassociated structural changes have led to major improvements in productivity, output and employment, without inflation. Thiscombination is, in the view of many, at the root of a new economic paradigm.
Since 1995, living standards have increased much more rapidly in theUSA than in the EU and Japan. The motor of growth has been theAmerican business sector, where output has grown at a much fasterrate than it did during the early part of the decade, and indeed in the1980s. The rate of growth in the European business sector haslagged behind that of the USA, only regaining 1980s levels in thesecond half of the 1990s.A larger share of the population works in the USA and, on average,each person works more hours and produces more output per hour.Hence, US residents enjoy 50% more purchasing power than their EUcounterparts.
Index: 1980 = 100
100
105
110
115
120
125
130
135
140
145
150
1980 1985 1990 1995
2000
USA
EU
Indicator 2: Employment growth in the business sector
Total employment has grown twice as rapidly in the USA as in the EU,in the last two decades. Behind this lies job creation in the US businesssector. The level of employment in the business sector has grown bymore than 40% in the last twenty years compared with only 5% inEurope. Demographic factors have also played a part in this, linked tofaster population growth.
Although unemployment in the EU has fallen since 1998, theemployment rate has failed to increase, and the population is ageing.This puts a high burden on the working population to finance welfaresystems and threatens their sustainability.
Source: OECD, 2000.

THE VOICE O F BUSINESS IN EUROPE
9The UNICE Benchmarking Report 2001
0
10
20
30
40
50
USA Japan EU
% value added
Source: OECD STI (Science and Technology Indicators) Outllook, 2000.
Indicator 3: The share of knowledge-intensive sectors intotal value-added, late 1990s
Another reason for the faster rate of growth of the US economy isthe use of more efficient production methods. This results in morerapid total factor productivity growth, i.e. growth that is attributed tobetter use of existing stocks of capital and labour. Total factorproductivity growth has increased in the USA from 1.1% per annumin the 1980s to 1.6% since 1995. At the same time, inflation hasfallen from 5.5% to 2.5%.
In recent years, in Japan and in most EU countries the picture isdifferent. Total factor productivity growth has in fact slowed downrather than increased. Structural reforms have, as yet, beeninsufficient to allow the new technologies to increase total factorproductivity growth in Europe as much as in the USA.
The Nordic countries of Denmark, Finland, Norway and Sweden arethe exception. These small open economies have been quick toderegulate key markets, particularly the ICT infrastructure, andbenefit from the opportunities offered by the new technologies. Theyhave managed even faster increases in total factor productivitywhile reducing inflation. Through these countries, the "neweconomy" is arriving in Europe.
0.5
1.0
1.5
2.0
2.5
1980 - 1990 1995 - 1999
%
EU 10
Nordics
Japan
USA
Indicator 4: Evolution of total factor productivity growth
One factor that explains the more rapid growth of per capita incomein the USA is the increasing share of knowledge-intensive output intotal GDP. These sectors now constitute 44 % of GDP in the USAcompared to 33 % in the EU.
The shift towards high value, knowledge-based output is illustratedby the growing importance of ICT companies. In 1997, only five ofthe 25 highest valued companies in the world were ICT companies.By 2000, 15 out of the top 25 were ICT companies. Of these 15companies, seven were American, four European and threeJapanese.
Note: OECD definition of knowledge-intensive: high-tech + medi-um-high-tech + communications services + finance, insur-ance and other business services + community, social andpersonal services.
Source: OECD, 2000.
Note: Nordics refers to Denmark, Finland, Norway, Sweden.
THE VOICE OF BUSINESS IN EUROPE
10 The reNewed Economy
n How Information and Communications Technology drives the "new economy"
Indicator 5: Total ICT expenditure as % GDP, 1999
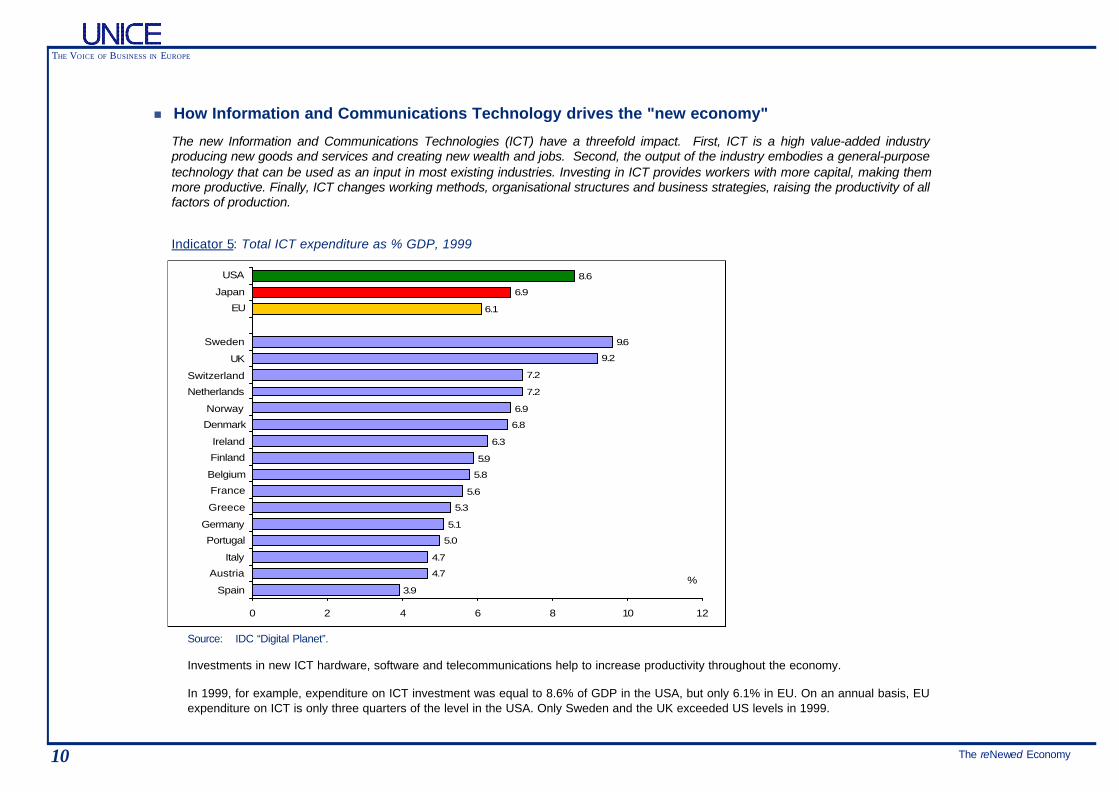
The new Information and Communications Technologies (ICT) have a threefold impact. First, ICT is a high value-added industryproducing new goods and services and creating new wealth and jobs. Second, the output of the industry embodies a general-purposetechnology that can be used as an input in most existing industries. Investing in ICT provides workers with more capital, making themmore productive. Finally, ICT changes working methods, organisational structures and business strategies, raising the productivity of allfactors of production.
Investments in new ICT hardware, software and telecommunications help to increase productivity throughout the economy.
In 1999, for example, expenditure on ICT investment was equal to 8.6% of GDP in the USA, but only 6.1% in EU. On an annual basis, EUexpenditure on ICT is only three quarters of the level in the USA. Only Sweden and the UK exceeded US levels in 1999.
3.9
4.7
4.7
5.0
5.1
5.3
5.6
5.8
5.9
6.3
6.8
6.9
7.2
7.2
9.2
9.6
6.1
6.9
8.6
0 2 4 6 8 10 12
Spain
Austria
Italy
Portugal
Germany
Greece
France
Belgium
Finland
Ireland
Denmark
Norway
Netherlands
Switzerland
UK
Sweden
EU
Japan
USA
%
Source: IDC “Digital Planet”.

THE VOICE O F BUSINESS IN EUROPE
11The UNICE Benchmarking Report 2001
Indicator 6: Share of ICT value-added in total business sector (%) 1997
Source: OECD, 2000 (Spain: CEOE).
ICT industries (computer hardware, software and telecommunications) are an important component of business sector growth in the USA. In 1997,their share of total value added was almost 9%, compared to a 6% share in the EU, although a few European countries - such as Sweden, Hungary,UK and Finland - have an equivalent share.
The ICT industries account for over 40 % of the acceleration in US productivity growth since 1995. They are one of the principal motors of economicgrowth in the USA and in the Nordic countries.
8.75.8
6.4
9.39.2
8.48.3
6.86.4
6.15.85.8
5.65.3
5.15.1
4.7
0 2 4 6 8 10
USAJapanEU 10
SwedenHungary
UKFinlandAustria
NorwayGermanyBelgium
ItalyPortugalFrance
SpainNetherlands
Czech
%
va
Note: Spain is not included in EU10.

THE VOICE OF BUSINESS IN EUROPE
12 The reNewed Economy
0
1
2
3
4
5
Years since implementation
% produ
ctivity ch
ange
ICT only ICT & new work organisation
0 1 2 3 4
A study of 1000 Danish manufacturing enterprises shows that productivity gains are 4to 5 times larger in companies that introduce new work systems together with ICT, thanin firms that introduce ICT only.
Another study (Brynjolfsson & Hitt, “Paradox lost? Firm-level evidence of high returnsto Information System spending”, MIT Sloan school 1994) reveals that the biggestproductivity gains from IT arose in those US firms that coupled IT investments withchanges in organisational structure. A Norwegian study (Sitma & Econ, NorwegianResearch Council 2000) shows that return on own capital is about 50% higher incompanies that also introduced a comprehensive ICT strategy integrating newproduction and distribution logistics.
Source: European Commission, 2000, based on a 1996Danish survey of 1000 manufacturing companies.
Ø ICT has been credited for muchof the recent increase ineconomic growth in the USAand a similar development canbe seen in parts of northernEurope.
Ø The new economy ischaracterised by increasedoutput in the new IT hardwareand software industries and intelecommunications; by the useof these outputs as inputs inexisting industries; and byreorganisation at the firm levelof work structures and ofbusiness strategies.
Ø The greatest macroeconomicimpact of ICT can be expectedin countries where each ofthese three factors is strong.
Box 1: ICT and new organisational structures
Full benefits of investments in the new information and communications technologiesare only realised if companies also adopt new operating methods, new organisationalstructures and new business strategies. Without such changes ICT remains a toyrather than a tool.
Productivity gains of ICT with and without organisational change

THE VOICE O F BUSINESS IN EUROPE
13The UNICE Benchmarking Report 2001
"Reaping the benefits ofinnovation will require profoundreorganization of firms, industriesand markets."
Thomas Andersson, OECD, “Isthere a new economy and hasEurope joined it?”, May 2000.
Chapter II - New technologies transform the economy
ICT improves markets, expands the global reach of companies and allows the customer greater market power.Increased global competition passes the benefits of innovations on more quickly to consumers through lowerprices and to employees through higher incomes. Market deregulation, increased globalisation and restructuringof companies, are transforming the business environment and society.
In this structural transformation, most EU countries lag behind the US. While firms, households and governmentsin some European countries have adapted quickly to the new environment, many others still have far to go.
n Markets and companies are reorganised
Markets are evolving. The most dramatic changes to date involve business-to-business (B2B) and business-to-consumer (B2C) transactions. There are also websites for consumer-to-consumer activities. Governments,however, have been slow to establish electronic relations with business and households.
Indicator 7: e-commerce in major regions, 1999
0
10
20
30
40
50
USA EU Japan Rest ofWorld
B2B
B2C
€ bn
Source: Booz-Allen & Hamilton, 2000.
Note: Rest of World shows B2B+B2C combined.

THE VOICE OF BUSINESS IN EUROPE
14 The reNewed Economy
The value of global e-commerce (B2B and B2C) was estimated at €100 billion in 1999. This represents a very small share of the global economybut e-commerce is developing quickly. All told, e-commerce in the USA represents less than 1% of retail trade. The USA accounts for two thirds oftotal e-sales. This reflects its pioneering role in e-commerce.
B2B transactions account for approximately two thirds of the total, and represent a relatively larger share of on-line markets in the EU and Japan.B2C accounts for a much greater proportion of e-commerce in the USA than in the EU and Japan.
E-commerce changes the relationship between business and consumer by:
• Increasing the speed and quality of information on products and prices• Allowing small companies access to international suppliers and customers• Making geographical distance less important • Giving consumers more choice
Source: OECD STI Department, 2000.
0 20 40 60 80 100
USAJapan
EU12
Sweden
Switzerland
UK
Germany
NorwayAustria
NetherlandsFinland
Denmark
Belgium
Portugal
France
ItalySpain
US $
Indicator 8: Value of business-to-consumer transactions per capita, 1999
B2C is growing rapidly, and is expected to continueto do so, particularly in Europe where uptake hasbeen slow to date.
At present, the value of B2C transactions per capitais ten times larger in the US than in Europe,reflecting a greater openness to on-line activity,more frequent use of credit cards, and a moreintegrated home market with a common currency.Sweden, Switzerland and the UK lead in Europe,though they lag far behind the USA.
B2C has grown most rapidly in products andservices that can either be ordered and delivereddigitally on-line, or where off-line delivery is cheap,rapid and reliable. Examples of such products arefinancial brokerage, computer hardware andsoftware, books, and event tickets. These have aretail sale penetration ratio in the USA of between 5-15 %, more than twice that in Europe. Sweden, theNetherlands and the United Kingdom havepenetration rates similar to those in the USA.

THE VOICE O F BUSINESS IN EUROPE
15The UNICE Benchmarking Report 2001
0
10
20
30
40
50
60
70
80
UK France Germany Italy Sweden USA Canada Japan
check availability on-line order on-line pay on-line
% of businesses
Indicator 9: Percentage of businesses that allow business-to-customer interaction on-line
Source: UK DTI, 2000.
An indicator of the scope of supply chain management is the extent to which companies use electronic means to interface with suppliers andcustomers (such as e-commerce and the Intranet).
German companies lead in the capability to place orders on-line and accept payments on-line, while Swedish companies lead in providing customerswith a capability to check on-line stock availability.
Few companies in any country yet provide customers with interactive services across the whole range of their business operations.
However, a recent CBI survey on e-business ("The Quiet Revolution", February 2001) reported that 38% of UK companies expect e-business toaccount for more than 20% of their overall turnover in the next 2-3 years.
The same survey identified three stages in the evolution of e-business within companies. First the Internet is used as a tool for information andmarketing. Second, companies use ICT for customer relations management, and the final phase is the integration of the supply chain.

THE VOICE OF BUSINESS IN EUROPE
16 The reNewed Economy
0 20 40 60 80 100
Competitive environment
Enterprise culture
Human resource management
Research & development
Purchases
Services
Marketing & sales
Output logistics
Operations / production
Input logistics
by 2000
by 2003
% of answers
Note: Survey of top management of Belgium-basedcompanies (163 respondents).
ICT enables companies to control and coordinate the supplychain better. They can outsource components to subcontractorsfor just-in-time delivery and focus on those activities where theyhave their core competences.
ICT facilitates better quality forecasts of demand and supply,closer relationships between customers and suppliers, faster andmore accurate ordering, access to a wider range of suppliers,and lower costs in order handling and procurement processes.Electronic data storage makes it easier to identify defects earlier,to customise products more extensively, to reduce overheads,and to lower inventory. The demands of e-business often lead toflatter organisations, new logistics and changes in managementstyle.
Potential cost savings from B2B have been estimated to varyfrom small savings in the food and healthcare industries (lessthan 5%), to large savings in the manufacture of electroniccomponents (in excess of 25%).
Source: In Sites 2000, FEB-VBO.
Box 2: Supply chain improvements Impact of Internet technology on the value chain: percent ofenterprises who believe that the Internet has brought or willbring a medium to significant change by 2003.
Individuals experience the impact of ICT in many ways. As consumers, they can benefit from better information, from a greater choiceof goods and services and from lower prices through access to a global marketplace. As employees they can benefit from moreindependent work, both individually and in teams, and from greater responsibility and authority. As citizens, they can be better informed,more influential and learn new skills throughout their working lives.
The borders between leisure and work, home and office, public and private sectors become more fluid. New ways of working developand lifestyles change.
n People are empowered

THE VOICE O F BUSINESS IN EUROPE
17The UNICE Benchmarking Report 2001
6
9
9
12
13
14
19
22
25
26
30
30
31
32
36
36
40
41
41
45
51
51
25
29
52
0 10 20 30 40 50 60
Greece
Poland
PortugalSpain
Czech RepublicHungary
Italy
FranceSlovenia
AustriaGermany
UKBelgium
Ireland
NetherlandsFinland
Luxembourg
SwitzerlandDenmarkSweden
NorwayIceland
EU15
JapanUSA
Indicator 10: Computers per 100 people, 1999
Source: Eurostat, 2001; Iceland, Norway, Switzerland, Slovenia, Hungary, CzechRepublic, Poland, Turkey: Computer Industry Almanac, 1999.
The number of computers indicates the extentto which individuals are able to benefit fromthe opportunities offered by the newtechnologies - as consumers, employees andcitizens.
The EU lags significantly behind the USA interms of computers per head of population.Only the Nordic countries come close to theUSA level. While there is an equivalent of onecomputer for every two people in the Nordiccountries, there is less than one computer forevery ten people in Portugal and Greece.

THE VOICE OF BUSINESS IN EUROPE
18 The reNewed Economy
Indicator 11: Mobile phone subscribers (% total population), October 2000
4044
58
7673
7271
7070
68646463
62616059
5452
4746
29
0 10 20 30 40 50 60 70 80
USAJapanEU15
FinlandIcelandAustria
NorwaySweden
ItalyIreland
NetherlandsLuxembourg
DenmarkSwitzerland
PortugalUK
SpainGreece
GermanyBelgiumFranceEstonia
%
The potential for mobile-commerce is largest in countrieswith a high mobile phone penetration. The EU leads theUS in this area, with nearly two thirds of the population inOctober 2000 subscribing to a mobile phone, comparedwith 40% in the US. One reason for this is the moreefficient pricing system (caller pays) used in Europe.Another is the early adoption of a common technicalstandard. Within Europe, there are large differencesbetween Member States, with Nordic countries, Austriaand Italy leading the field.
While accessing the Internet via a PC has been thenormal method, alternative technologies may havegreater appeal for users, such as mobile phone and digitaltelevision. The mobile phone is portable, giving immediateaccess to the Internet from almost anywhere, but its usefor m-commerce is at an early stage of development.Various new technologies to connect the mobile phoneand other portable devices to the Internet are emerging,including GPRS (General Packet Radio Services) andWAP (Wireless Application Protocol), with new marketopportunities. However, excessively complicatedprocedures for granting Universal MobileTelecommunications System (UMTS) licences in Europehave delayed development of the technology to the extentthat the EU is in danger of losing world leadership in thisarea to Japan. European companies are still at thedevelopment stage of third generation mobile phones.
Source: Global Mobile, 2000.
THE VOICE O F BUSINESS IN EUROPE
19The UNICE Benchmarking Report 2001
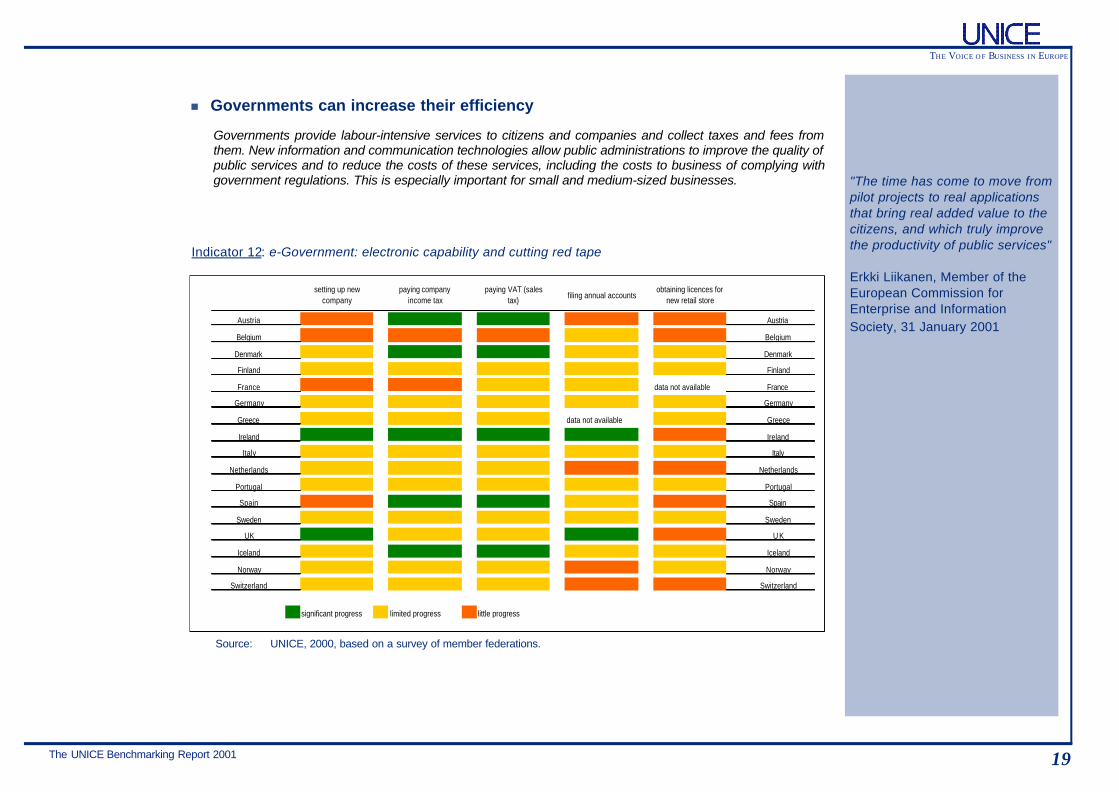
Governments provide labour-intensive services to citizens and companies and collect taxes and fees fromthem. New information and communication technologies allow public administrations to improve the quality ofpublic services and to reduce the costs of these services, including the costs to business of complying withgovernment regulations. This is especially important for small and medium-sized businesses.
n Governments can increase their efficiency
Indicator 12: e-Government: electronic capability and cutting red tape
setting up new company
paying company income tax
paying VAT (sales tax) filing annual accounts
obtaining licences for new retail store
Austria Austria
Belgium Belgium
Denmark Denmark
Finland Finland
France data not available France
Germany Germany
Greece data not available Greece
Ireland Ireland
Italy Italy
Netherlands Netherlands
Portugal Portugal
Spain Spain
Sweden Sweden
UK U K
Iceland Iceland
Norway Norway
Switzerland Switzerland
significant progress limited progress little progress
Source: UNICE, 2000, based on a survey of member federations.
"The time has come to move frompilot projects to real applicationsthat bring real added value to thecitizens, and which truly improvethe productivity of public services"
Erkki Liikanen, Member of theEuropean Commission forEnterprise and InformationSociety, 31 January 2001

THE VOICE OF BUSINESS IN EUROPE
20 The reNewed Economy
Governments are leading advocates of the information society. UNICE’s survey provides an assessment of the progress national governments havemade in exploiting the potential of the Internet. It measures the "capability" of companies and governments to use the Internet to completemandatory administrative processes.
A few European countries (notably Ireland) are using ICT to reduce the cost and time needed to comply with government regulations. However,despite government enthusiasm for the new technology, implementation of on-line government services has been slow in most countries.
At the national level, most progress has been made in introducing electronic capability for submitting company income tax returns and VAT returns.Local governments, on the other hand, have made little progress in "computerising" the licensing process.
0 20 40 60 80
Portugal
France
Ireland
Luxembourg
Italy
Spain
Sweden
Greece
UK
EU15
Belgium
Denmark
Germany
Austria
Netherlands
Finland
finding information e-mail questions submitting forms
%
Indicator 13: Citizens’ interaction with public administration on-line
Source: Eurobarometer, October 2000.
Half of EU citizens have already contacted their publicadministration on-line, but there are large variations betweendifferent Member States, from Finland to Portugal.
Of those who have interacted with government electronically,the majority have only done so to find information. In theNetherlands, Sweden, Denmark and Finland, a substantialminority have actually submitted forms on-line.
THE VOICE O F BUSINESS IN EUROPE
21The UNICE Benchmarking Report 2001
Box 3: Examples of e-Government
Local information society project "Learning Upper Karelia", in Finland, created a communityinformation network in a rural community, with scattered and distant populations, aimed atpreventing social exclusion, supporting social innovations, improving services and livingconditions. After 2 years, 25% of the local population was registered as users, with the bulkof project activities focused on creating and supporting local capabilities for using computersand networks.
The Irish Revenue On-line Service (ROS) enables customers to use the Internet to filereturns electronically, make payments and enquire about their current tax position andprevious tax transactions. Those filing monthly and bi-monthly VAT and Employer PAYEreturns are able to send their returns over the Internet. From April 2001 income tax andcorporation tax returns will be added to the system. Customers are issued with digitalcertificates to enable them to sign legally enforceable tax returns on-line. www.revenue.ie
The German government has a programme "BundOnline 2005", for the provision of mostfederal services on-line by 2005. Today, citizens can apply for driving licences and identitycards on-line. Some 130,000 personal income tax declarations have also been made on-line,with eight federal states offering the same possibility for wage and salary tax declarations.www.bund.de
The UK government has launched its citizens' portal for government services. UK citizenscan access a range of information and advice, for example from the Community LegalService, the National Health Service. Citizens can fill in self-assessment tax returns andsubmit them to the Inland Revenue on-line, and can receive most benefit paymentselectronically. A full programme of services is planned for implementation by 2005.www.ukonline.gov.uk
The Estonian government has introduced a "Ministers Session Infosystem", whose objectiveis to provide modern ICT tools for the Estonian Government Cabinet meetings and thus toincrease the quality of Government decisions, improve intra-governmental communication,lower the State Chancellery's costs and develop democracy.
The Latvian government initiated in 1998 an e-government project called Megasistema. Thisaims to create an integrated electronic system of public information linking together thepopulation register, company register, real estate register, vehicle register, state revenueservice information system. It is open to citizens and capable of two-way communication.
Ø Markets are faster, larger, andprovide more information
Ø ICT generates cost savings forfirms of all sizes
Ø Governments have large scopeto lead by example in fosteringand facilitating e-relations. Theintroduction of on-line publicadministration services wouldfacilitate an effective provision ofservices to both businesses andindividuals

THE VOICE OF BUSINESS IN EUROPE
22 The reNewed Economy
Chapter III - Policies to realise the full potential of the new economy
"I think that as structural rigiditiesin the euro area economies arebeing remedied the full benefits ofthe new technological possibilitiescan be reaped over time. Theintroduction of new technologyrequires flexibility of other factors,including labour, if productionprocesses are to be reorganisedmore efficiently."
Professor Otmar Issing, EuropeanCentral Bank, to the CBI NationalConference, 7 November 2000
All innovations pose the same policy challenge for European governments: how to ensure that theireconomies are responsive to change.
Governments must ensure adequate and competitive infrastructure; easy entry and exit in product markets;legal frameworks that facilitate acceptance of changing product markets and changing labour markets; andcapital markets that enable entrepreneurs to invest in risky ventures. While all this was true in the oldeconomy, it applies to an even greater degree in the new economy, because the speed of change is faster,and geographic mobility of people and companies greater.
ICT technologies pose specific policy challenges. Economies of scale, economies of networks, and theimportance of standards all foster natural monopolies, making competition policy key. External economiesmake coordination of public policies and private plans important. Huge costs of research and development,rapid speeds of technical change and shortening product life cycles give the first mover an importantadvantage but increase risk, making tax policies to reward risk and effort critical.
This chapter focuses on six elements of the business environment where government policies can improvethe pre-conditions for commercialising and using new, enabling technologies.
Growth in the scale and efficiency of the specialist ICT sector is one of the principal ways in which newinformation and communication technologies create jobs and wealth in the new economy. Innovation in ICTis, in turn, closely linked to advances in basic science and the capacity of national "innovation systems" tocreate, disseminate, and exploit new knowledge.
The US ICT sector is much larger and more productive than that of the EU because it invests more in thegeneration of new knowledge and it diffuses new knowledge more effectively. In contrast, fewer resources areallocated to developing new ideas in Europe and linkages between companies, the science base, andgovernments are less intense and less effective.
n Stimulate development and diffusion of new ideas

THE VOICE O F BUSINESS IN EUROPE
23The UNICE Benchmarking Report 2001
Indicator 14: Research and Development expenditure per capita, 1998
0 100 200 300 400 500 600 700 800 900 1000
USA
Japan
EU14
Sweden
Finland
Switzerland
Germany
Denmark
Norway
France
Netherlands
Austria
UK
Belgium
Ireland
Italy
Spain
Portugal
Greece
US $ purchasing power parity
Source: OECD, STI, 2000.
Expenditure by governments andcompanies on R&D is the single mostimportant input for the development of newideas. Expenditure on R&D in the USA isconsiderably higher than in Europe. OnlySweden, Finland and Switzerland approachthe level of investment on R&D made in theUSA.
The largest gap between the EU and theUSA is in R&D financed by companies, butmajor differences also exist in the level ofgovernment funding. In the USA almosttwice as many public resources are investedin R&D each year compared to the EU.Expenditure by governments on R&D isimportant for the development of the ICTsector because it influences basic scientificprogress in areas such as computer scienceand mathematics.
Investment in R&D also affects the creation of "spin-off" companies, a critical means for the exploitation of new ICT knowledge. In the USA the rateof formation of such companies is four times higher than in Europe, and many of the world's leading ICT companies began life as spin-offs from USuniversities.
Europe's potential for turning innovative ideas into economic opportunities has not yet been fully realised. To meet this challenge, it is essential thatcooperation between industry and academia on research and development be increased. This should be a specific objective of the EuropeanCommission's 6th Research and Technological Development Framework Programme for 2001-2006.

THE VOICE OF BUSINESS IN EUROPE
24 The reNewed Economy
Indicator 15: Share of ICT patents in total awarded by US Patents and Trademarks Office, 1999
10.417.5
18.5
0 5 10 15 20 25 30 35
SpainNorway
SwitzerlandGermanyDenmark
AustriaItaly
BelgiumFrance
NetherlandsUK
IrelandSweden
Finland
EUUSA
Japan
%
Source: OECD STI 2000.
To create a climate of innovation, governmentsmust ensure that companies can protect theirscientific know-how.
Patenting activity is one important measure ofinventiveness, especially in science-basedindustries. Patents from the public sector alsoenhance the diffusion of new knowledge becausethey provide information about the existence andlocation of commercially relevant researchresults.
Since the 1980s, there has been an explosion inpatenting activity in Europe and the USA, andICT has been one of the fastest growing areas ofactivity.
However, the share of ICT in patenting activity issignificantly lower in EU companies. Forexample, only a tenth of patents awarded to EUorganisations in the USA, in 1999, were for ICT-related activities, compared to almost double thatfor Japanese and American organisations. YetFinnish companies led all others in this field.

THE VOICE O F BUSINESS IN EUROPE
25The UNICE Benchmarking Report 2001
0
50
100
150
200
250
300
350
1980 1985 1990 1995
USA
Europe
Japan
Indicator 16: Number of strategic ICT technological alliances
Source: National Science Board “Science and Engineering Indicators 2000”/Merit.
RECOMMENDATIONS
Ø Facilitate exchanges ofresearchers between Europeancountries, and encourage linksbetween companies andacademia
Ø Increase public researchbudgets, particularly in areas ofstrategic importance forbusiness, and ensure thatprocedures for companyparticipation in Communityresearch programmes are keptsimple
Ø Simplify procedures for businessaccess to the EU Research andTechnological DevelopmentFramework Programme
Ø Ensure rapid adoption of aCommunity patent and aCommunity design
Ø Reflect the needs of newtechnologies, especiallyregarding the patentability ofsoftware-related inventions, inthe European framework forintellectual property protection
Ø Improve the judicial frameworkto ensure adequate enforcementof intellectual property rights
Because of the multi-disciplinary nature of ICT and the increased knowledge-intensity of innovation, technologicalalliances between companies, at a pre-competitive stage, are an important mechanism through which advances inscience are converted into new products and services. Alliances allow companies to gain access to complementaryscientific or technological knowledge, to share development risks, to reduce time-to-market, and to gain access to newmarkets.
Since 1980, the number of new strategic technological alliances in ICT has risen dramatically in absolute terms.European-based companies, however, establish far fewer alliances than their counterparts in the USA. In 1998, the scaleof alliances in Europe was only a third of that in the USA.

THE VOICE OF BUSINESS IN EUROPE
26 The reNewed Economy
There is a strong link between Internet accesscosts and the number of Internet hosts forprivate users. Countries such as the USA,Finland, Iceland and Sweden, with the lowestlevels of access charges, have the highestdensity of Internet hosts. In general, however,Europe lags the United States in Internet hostpenetration because Internet access chargesfor private consumers and small businessesare significantly higher in the EU than in theUSA.
To catch up, Europe must reduce accesscosts. More competition is needed amongtelecoms operators, especially operators oflocal loops. Quick unbundling of local loops,through the full implementation of the ECregulation, will give companies and consumersa real choice for both Internet and telephoneaccess and allow the expansion of high-speedaccess technologies, at internationallycompetitive costs. The development ofbroadband capacity within the local loop willenable companies to transmit electronicinformation more rapidly and efficiently.
n Create a supportive infrastructure
0
50
100
150
200
0 10 20 30 40 50 60 70 80 90 100
Average price for 20 hrs Internet access 1995-2000, in US$ PPP
Internet hosts per 1000, March 2000
Ireland
GreecePortugal
Belgium
Austria
Spain
GermanUK Japan
NetherlandsDenmark
ItalyFrance
Norway
Finland
Sweden
USA
Iceland
Indicator 17: Price of Internet access and Internet host penetration, 1995-2000
Source: OECD, Telecordia Technologies, 2000.
The telecommunications infrastructure is the backbone of the information society.
Governments play a key role in the organisation of the supervision of the market for infrastructure services, through regulators. Moreover,many of the infrastructures are trans-national in scope so that planning and financing on a European scale are important pre-conditions foran effective infrastructure.
However, the slow pace of effective liberalisation of telecommunications in Europe has hindered the development of new services and thenew economy.
THE VOICE O F BUSINESS IN EUROPE
27The UNICE Benchmarking Report 2001
0 1 2 3 4 5
Finland
Denmark
Sweden
Austria
Germany
Ireland
France
UK
Belgium
Luxembourg
Netherlands
Italy
Portugal
Greece
Spain
EU
USA
US $ m
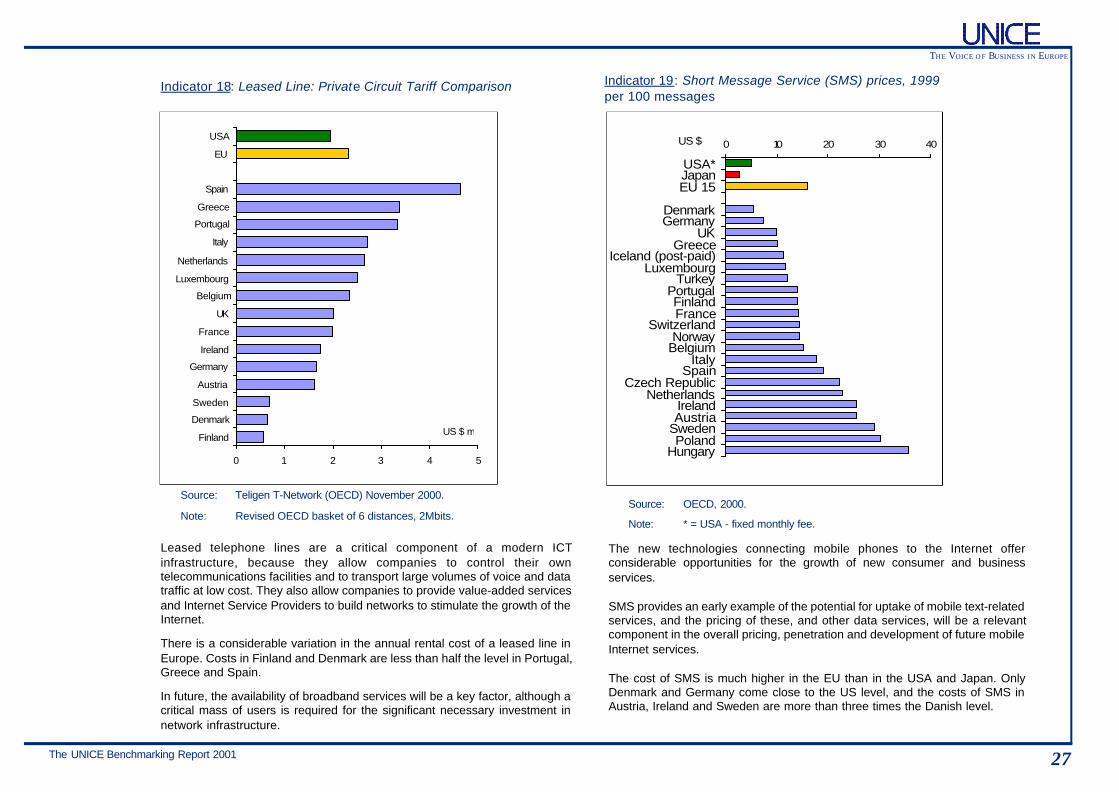
Indicator 18: Leased Line: Private Circuit Tariff Comparison
Source: Teligen T-Network (OECD) November 2000.
Leased telephone lines are a critical component of a modern ICTinfrastructure, because they allow companies to control their owntelecommunications facilities and to transport large volumes of voice and datatraffic at low cost. They also allow companies to provide value-added servicesand Internet Service Providers to build networks to stimulate the growth of theInternet.
There is a considerable variation in the annual rental cost of a leased line inEurope. Costs in Finland and Denmark are less than half the level in Portugal,Greece and Spain.
In future, the availability of broadband services will be a key factor, although acritical mass of users is required for the significant necessary investment innetwork infrastructure.
Note: Revised OECD basket of 6 distances, 2Mbits.
Indicator 19: Short Message Service (SMS) prices, 1999per 100 messages
Source: OECD, 2000.
Note: * = USA - fixed monthly fee.
The new technologies connecting mobile phones to the Internet offerconsiderable opportunities for the growth of new consumer and businessservices.
SMS provides an early example of the potential for uptake of mobile text-relatedservices, and the pricing of these, and other data services, will be a relevantcomponent in the overall pricing, penetration and development of future mobileInternet services.
The cost of SMS is much higher in the EU than in the USA and Japan. OnlyDenmark and Germany come close to the US level, and the costs of SMS inAustria, Ireland and Sweden are more than three times the Danish level.
0 10 20 30 40
USA*JapanEU 15
DenmarkGermany
UKGreece
Iceland (post-paid)Luxembourg
TurkeyPortugalFinlandFrance
SwitzerlandNorway
BelgiumItaly
SpainCzech Republic
NetherlandsIrelandAustria
SwedenPoland
Hungary
US $

THE VOICE OF BUSINESS IN EUROPE
28 The reNewed Economy
RECOMMENDATIONS
Ø Complete the liberalisation of thetelecommunications market:adopt the EUtelecommunications package asquickly as possible, with prioritygiven to the Framework andAccess and InterconnectionDirectives
Ø Ensure independence oftelecommunications regulators
Ø Apply minimum levels ofregulation appropriate totelecoms sectors, necessary toenable Europe to be competitivein the global market
Ø Encourage market-led technicalstandardisation on a global basis
Ø Governments should beencouraged, using best practiceprinciples, to provide anenvironment conducive to theeffective roll-out of broadbandinfrastructure
0 1 2 3 4 5 6 7 8 9 10
Poland
Hungary
UAE
Czech Republic
Greece
Portugal
Spain
Italy
Israel
France
Ireland
Korea
Taiwan
Belgium
New Zealand
Hong Kong
Austria
Germany
Canada
Japan
Netherlands
Singapore
Australia
Switzerland
UK
Denmark
USA
Finland
Norway
Sweden
10 = strongly developed Information Society
0 = poorly developed Information Society
Indicator 20: Information society infrastructure index
Source: IDC, 2000.
This global comparison rankscountries on the basis of how welltheir infrastructure is adapted tothe development of theinformation society. The indicatorsinclude computer and Internetlinked infrastructure, as well associal infrastructure, such aseducation and newspaperreadership. Six EU countries areranked among the World’s top ten.

THE VOICE O F BUSINESS IN EUROPE
29The UNICE Benchmarking Report 2001
The willingness of consumers and producers to adopt new products, new processes and new methods ofbuying and selling, affects the pace of development of new technologies in individual countries.
Factors which cause reluctance to embrace e-business among customers and suppliers include: a generallack of Internet culture or awareness of the potential benefits; lack of skills; fears over security and costs oftechnology.
n Increase customer acceptance
Paul Saffo, Institute for theFuture, California, USA, "Theearly bird may catch the worm,but it is always the second mousethat gets the cheese”.
The Economist, New EconomySurvey, September 2000.
Box 4: Adoption of new technologies
A critical mass of early adopters is essential for the viability of new businesses based on newideas. Consumers must be willing to use new products, technologies and services. Thediffusion of new technologies often follows an "S" curve, rising slowly at first but soon pickingup speed before evening out. Economic, cultural and structural factors determine its startingpoint in individual markets.
An example of this trend is the personal computer (PC), which was introduced into mostEuropean markets at about the same time. Only the Nordic countries have caught up withthe USA. Japan surpassed the EU15 during the late 1990s. The cost of purchasing andusing personal computers is an important factor determining the rate of diffusion. In Sweden,tax credits have been an important factor stimulating the purchase of home computers byemployees.
Households in different countries have adopted the PC at different speeds. At one extreme,diffusion in France has been relatively slow, due perhaps to the early and extensive use ofthe Minitel system which locked households into an older technology. At the other extreme,uptake in Norway has been fast, while Finland followed the classical "S" curve of first gradualthen rapid adoption.
% of households with a personal computer
0
10
20
30
40
50
60
Nordic
USA
EU-15
Japan
19901995 1999
Source: ITU (International Telecommunications Union).
Note: Norway is included in the Nordic average from 1991.
Rate of adoption of the personal computer by households

THE VOICE OF BUSINESS IN EUROPE
30 The reNewed Economy
0 10 20 30 40 50 60 70
USA
Japan
Norway
Denmark
Netherlands
Germany
Iceland
Belgium
France
UK
Italy
Czech Republic
Spain
Poland
Slovakia
Turkey
Portugal
on-line shoppers
Internet users but non shoppers
%
Indicator 21: On-line shopping habits amongst total adult population (%), 2000
Source: Taylor Nelson Sofres, 2000: Iceland; Price Waterhouse Coopers.
Internet shopping habits vary greatly betweenthe USA and the EU. In the USA, nearly 60% ofadults are Internet users and, of these, overtwo-thirds have shopped on-line. Thus, almost40% of all adults have shopped on-line in theUSA. In contrast, Internet use in Europe islower, as is the proportion of Internet users thathave made purchases on-line. Two thirds of on-line shoppers are estimated to abandon theirpurchase before finalising the purchasingprocess, which perhaps indicates a lack ofconfidence in the system. A recentEurobarometer survey (October 2000) foundthat only 4.7% of EU citizens shop regularly on-line, and 13.8% occasionally.
There are significant differences betweenEuropean countries. At one extreme, shoppingon-line is as common in Norway as in the USA;but at the other, fewer than 10% of Spanish andPortuguese citizens have shopped on-line.

THE VOICE O F BUSINESS IN EUROPE
31The UNICE Benchmarking Report 2001
0 10 20 30 40
Switzerland
Greece
Portugal
Ireland
Spain
Italy
UK
Belgium
Netherlands
Germany
Austria
France
Denmark
Norway
Finland
Sweden
Japan
USA
Europe
Indicator 22: On-line banking: % of total accounts
Source: IDC (Bank of International Settlements).
On-line banking is one area where consumeracceptance has been rapid in Europe. Europeanbanks and consumers lead in electronic handling offinancial services. Internet banking cuts the costs andtime of retail banking and, like telephone banking,enables customers to choose the time and place fortransactions.
In Sweden and Finland, almost 35% of total bankaccounts are already on-line, with the other Nordiccountries following close behind. This indicatorincludes Internet, direct-dial, digital television andmobile phone banking.
In some countries, however, the increasing availabilityof an on-line dimension to a traditional high streetbank account means that the distinction between thetwo is becoming blurred. In Belgium, electronictransferring (via self-banking ATMs, the Internet andtelephone) accounted for more than 47% of totaltransfers made, at the beginning of 2000.
A number of factors explain why the EU lags behind the USA. These include a reluctance to shop at a distance, via a computer; concerns oversecurity of payments and of personal details; worries about reliable delivery; and about redress in case of complaint. These factors are especiallysignificant for cross-border transactions, making these issues important for the e-buyer in Europe.
Note: Switzerland shows a low figure due to the exceptionally high numberof total bank accounts. The Japanese figure only includes Internetaccounts.

THE VOICE OF BUSINESS IN EUROPE
32 The reNewed Economy
17015
29
19492
8771
5554
4948
4240
3429
241816
1311
965
3
0 50 100 150 200 250
USAJapanEU15
IcelandSwitzerland
LuxembourgSweden
UKFinlandNorwayIreland
AustriaDenmarkGermany
NetherlandsBelgiumFranceSpain
Czech RepItaly
PortugalGreece
HungaryPoland
Indicator 23: Number of secure servers by million people, March 2000
Source: OECD STI 2000.
Secure servers are an important factor for e-commerce, because they can ensure privacy andconfidentiality and provide security of payments forthe e-customer. They are especially important forInternet banking and trading.
The number of servers per person in the USA istwice that in most leading European countries, withthe notable exception of Iceland, despite the factthat small countries and financial centres can bothbe expected to have a larger number of secureservers.

THE VOICE O F BUSINESS IN EUROPE
33The UNICE Benchmarking Report 2001
Box 5: Experiences of purchasing on-line, EU 15, October 2000
The majority of those in Europe who make use of on-line purchasing are positive about the experience.Their main negative experiences concern slow delivery. This emphasises the importance of both efficientinternal company delivery logistics and national and international postal services.
Lack of consumer confidence in security of payments and privacy, particularly in cross-border transactions,is another factor holding back B2C in Europe compared with the USA.
0
10
20
30
40
50
60
70
80
never had anegative
experience
delivery tooktoo long
the goodsdidn't arrive
goods not asdescribed
other negativeexperience
goodsdamaged on
delivery
credit cardmis-debited
no answer
% answers
Source: Eurobarometer, October 200.
RECOMMENDATIONS
Ø Work to overcome the barriersto consumer acceptance of e-commerce, through cooperationbetween governments,consumer organisations andbusiness
Ø Remove regulations that restrictthe development of new markets
Ø Liberalise postal services
Ø Support use of effectivealternative dispute resolution(ADR) mechanisms in thecontext of e-commerce, todevelop a framework to provideconsumers with low cost andtimely out-of-court settlements incase of problems
Ø Create a level playing field forEU companies in the global on-line marketplace, by establishinga clear legal and fiscalframework for e-deliveries
Ø Use codes of conduct and trust-marks for on-line trade, basedon clear principles underpinnedby all stakeholders
Ø Increase Internet awareness andsupport universal access to theInternet in order to build theculture required.

THE VOICE OF BUSINESS IN EUROPE
34 The reNewed Economy
"An intriguing aspect of the recentwave of productivity acceleration isthat US businesses and workersappear to have benefited morefrom the recent advances ininformation technology than theircounterparts in Europe or Japan. …The relatively inflexible and, hence,more costly labour markets of theseeconomies appear to be asignificant part of the explanation."
Testimony of US Federal ReserveChairman, Alan Greenspan, on"Structural change in the neweconomy", before the NationalGovernors' Association, July 11,2000
The new ICT-based technologies require more flexible labour markets. New companies start up and existingcompanies reorganise or close down. Companies must invest in new working methods, and introduce neworganisational techniques and new forms of remuneration. The new technologies also increase the demandfor skilled labour relative to unskilled labour, which requires appropriate wage structures. Economicincentives for higher education and vocational training must be sufficiently strong to provide updated skills.
Labour markets in the EU are less flexible than in the USA because of outdated labour market regulations,high taxes on labour, insufficient investment in relevant skills, and less geographical mobility.
n Improve labour markets
0 2 4 6 8 10
ItalyFrance
GermanySloveniaBelgium
SwedenAustria
LuxembourgPortugal
SpainGreece
NorwayNetherlands
FinlandCzech Republic
PolandIreland
UKTurkeyIceland
DenmarkSwitzerland
USAJapan
0 = too restrictive 10 = flexible enough
Indicator 24: Labour Market Regulations
Source: IMD, World Competitiveness Report 2000.

THE VOICE O F BUSINESS IN EUROPE
35The UNICE Benchmarking Report 2001
0 20 40 60 80 100
USAEU15
IrelandFinlandAustria
PortugalLuxembourg
FranceSpain
UKSweden
ItalyNetherlands
DenmarkBelgium
GermanyGreece
primary schools
secondary schools
Indicator 25: Education: % of schools with Internet access, 2000 (2nd half)
Source: European Commission, 2001.
The knowledge-based economy requires bothgood basic education opportunities and life-longlearning, so that employees can continuouslydevelop new skills and become more flexible inmeeting changing demands for their skills.Students must be computer-literate whenleaving secondary school.
Availability of Internet access in schools is onebenchmark of how well educational systemsprepare youngsters to benefit from use of ICT.Five EU Member States provide Internet accessin 100% of secondary schools. This is true atprimary school level only for Ireland andFinland. The EU as a whole lags behind theUSA, especially at the primary school level.
Companies require flexible labour markets in order to respond to changing customer needs and changing competitive pressures in the new economy.
The latest survey of company managers, for the IMD World Competitiveness Report, concludes that labour market regulations are restrictive in mostEuropean countries. This confirms an earlier OECD study. However, there are some good examples within Europe, with countries such asSwitzerland, Denmark and Iceland, where markets are deemed more flexible than in the USA.

THE VOICE OF BUSINESS IN EUROPE
36 The reNewed Economy
7.26.1
5.7
7.57.2
6.96.56.56.5
6.46.3
6.16.05.95.8
5.75.65.6
5.35.35.3
0 2 4 6 8 10
USAEU15
Japan
IcelandFranceFinlandAustriaSwedenIreland
UKGreeceNorway
ItalySpain
BelgiumNetherlands
GermanyDenmark
LuxembourgPortugal
Switzerland
Qualified IT employees: based on survey
0 = not fully availablein your country's market
10 = fully available in your country's market
Indicator 26: Availability of Information Technology skills, 1999
Source: IMD, World Competitiveness Report 2000.
New technologies demand new skills. Shortages ofIT-specific labour skills are already being felt incertain EU and global markets. An EuropeanInformation Technology Observatory (EITO, 2000)report estimates that the IT-skills shortage in the EUwas 0.5 million in 1998, and that this will increase to1.6 million by 2003.
IT skills are perceived by businesses as being moreavailable in the USA than in all European countrieswith the exception of Iceland. Lack of skills alsocontributes to a lack of confidence in the newtechnology and a general absence of an Internetculture.

THE VOICE O F BUSINESS IN EUROPE
37The UNICE Benchmarking Report 2001
0
20
40
60
80
100
120
140
160
180
200
US
A
EU
11
Por
tuga
l
Fin
land
Irela
nd
Fra
nce
UK
Ger
man
y
Sw
itzer
land
Spa
in
Italy
Den
mar
k
Nor
way
Net
herla
nds
Sw
eden
Index: upper secondary school level= 100
Indicator 27: Wage dispersion between those with tertiary and secondary school education
Source: OECD, Education at a glance, 2000.
Wage differentials, reflecting different skills levels, are necessary to encourage people to acquire better skills and accept the greater risks andresponsibilities that go with them.
One measure of wage dispersion is the ratio between the average wage levels for people with tertiary education and those with secondaryeducation. The differential is somewhat greater in the USA than in the EU, but within the EU the differential is significant. For example, Nordicneighbours, Finland and Sweden, respectively are high and low in the ranking.

THE VOICE OF BUSINESS IN EUROPE
38 The reNewed Economy
Source: UNICE 2000, based on a survey of member federations.
Indicator 28: Pensions and free movement of employees - a barrier to labour mobility
The mobility of skilled people between regions helps to reduce local imbalances in the demand and supply of labour.Mobility between different firms and sectors helps ensure the rapid spread of new, advanced technologies, providing allcompanies with access to best practice and new ideas.
Geographic mobility is more limited in Europe than in the USA, for a variety of reasons. Among the important factors thatrestrict the mobility of skilled labour are differences in national pension and fiscal legislation, which make it difficult formigrant workers to build up pan-European pension rights in private occupational or supplementary pension schemes.Moreover, legal and fiscal restrictions in most European countries limit the transfer of financial rights betweensupplementary pension schemes and limit contributions to non-resident pension schemes.
Increasing mobility of skilled labour within the EU and into the EU can alleviate the current skills shortages.
ability to transfer pension "rights"
between schemes (non-resident)
ability to re-invest pension "rights" in
new schemes (non-resident)
tax penalties on transfers of pension
"rights" to non-resident schemes
tax penalties on investments in non-resident schemes
USA* USA
Austria Austria
Belgium Belgium
Denmark Denmark
Finland Finland
France France
Germany Germany
Greece Greece
Ireland Ireland
Italy Italy
Netherlands Netherlands
Portugal Portugal
Spain Spain
Sweden Sweden
UK UK
Iceland Iceland
Norway Norway
Switzerland Switzerland
permitted or full limited permission or not permitted or subject tax relief subject to restricted to tax penalties
tax relief
Note:* In USA this refers to inter-state migration.
RECOMMENDATIONS
Ø Meet the Lisbon target of allschools to be on-line by 2002
Ø Ensure that school leavers havethe essential basic IT skills, byproviding the appropriateresources and teacher training
Ø Initiate targeted crash coursesfor IT skills, to alleviate theshortage of these key skills inEurope, within the framework ofa greater emphasis on life-longlearning
Ø Reduce barriers to mobilitybetween EU countries forworkers, including easiertransfer of supplementarypensions and the avoidance ofdouble taxation
Ø Facilitate immigration policies sothe skills gap can be met in theshort term
Ø Modernise labour marketregulations
Ø Adapt social security systems tothe realities of the neweconomy, in such a way thatindividuals are encouraged toadjust to change not to resist it.

THE VOICE O F BUSINESS IN EUROPE
39The UNICE Benchmarking Report 2001
Exploiting the potential of the new economy requires capital. Start-ups need equity-based risk capital, in particular venture capital.Existing companies, with more mature 'physical' assets, require a mix of different forms of capital, including equity and debt. Well-functioning capital markets and stock exchanges are necessary for a dynamic economy.
Although rapid progress has been made in recent years, all European countries are a long way behind the USA in all areas of venturecapital.
Other factors which operate as constraints on the development of genuine pan-European corporate financing strategies are: the delayin creating a European Company Statute, obstacles to cross-border tax consolidation, and the lack of a single prospectus for issuers.
n Integrate capital markets
Indicator 29: Structure of financial markets, 2000
Euro 12 area: total = € 15,363.7 bn
27%
36%
37% Stock market capitalisation
Outstanding domestic debtsecurities
Stock of loans to theprivate sector
USA: total = € 33,173.4 bn
34%
46%
20%
Investing in ICT-related entrepreneurial activities and in new economy businesses are high-risk activities, which need finance via equity capitalmarkets. Hence, well-functioning capital markets and stock exchanges are of decisive importance.
The scale and structure of European capital markets hampers investment in the new economy. The markets for publicly quoted equity and debtare significantly larger in the USA than in the EU. Hence, bank loans account for a larger share of corporate finance in the EU (37% of thetotal), compared to the USA (20%). Bank loans are more expensive and less flexible than money raised through equity markets. They alsorequire adequate collateral. Both these factors work against high-risk ventures based on intangible assets. The euro has helped to increasethe overall liquidity of the EU's capital markets, thus reducing the importance of bank loans, but problems remain.
Source: ECB, 2001.

THE VOICE OF BUSINESS IN EUROPE
40 The reNewed Economy
Indicator 30: The venture capital market in Europe and the USA, 1999
There is a close connection between the size of the national equity market and entrepreneurial investments. New economystart-ups, in particular, are highly dependent on local markets for finance, and therefore developing national venture capitalmarkets is of prime importance.
European countries lag behind the USA, where venture capital markets are larger, more diversified and more efficient.Measured on a per capita basis new investment in 'pure' venture capital in Europe in 1999 was equal to only 15% of thelevel in the USA.
3.21.2
7.511.6
12.7
32.3
0
10
20
30
40
50
60
Europe USAEarly Later Expansion
€ billion
Source: EVCA, NVCA, 2000.
In the absence of fully functioningventure capital markets in the EU, othersources of funding are important. TheEuropean Investment Bank is anexample of strategic funding for thedevelopment of the information society.It makes equity capital available tohigh-tech SMEs, sets up new venturecapital facilities in countries where themarket is less developed, provides astart-up facility for leading-edge sectors,and finances transnational broadbandnetworks.
Other problems in Europe include thecontinuing presence of restrictions onthe types of investments that financialinstitutions in many Europeancountries can make. In most MemberStates there are limits on the ability ofpension funds to invest in differentdomestic and non-domestic assets.These restrictions steer investmentfunds towards government bonds andaway from equity and corporate debt.This puts European companies at adisadvantage compared with theircompetitors in the USA.
THE VOICE O F BUSINESS IN EUROPE
41The UNICE Benchmarking Report 2001
0 0.1 0.2 0.3 0.4 0.5
AustriaItaly
PortugalDenmarkGreece
SpainIrelandFinlandFrance
NorwayGermany
SwitzerlandSweden
UKNetherlands
BelgiumCanadaIceland
EU14USA
%
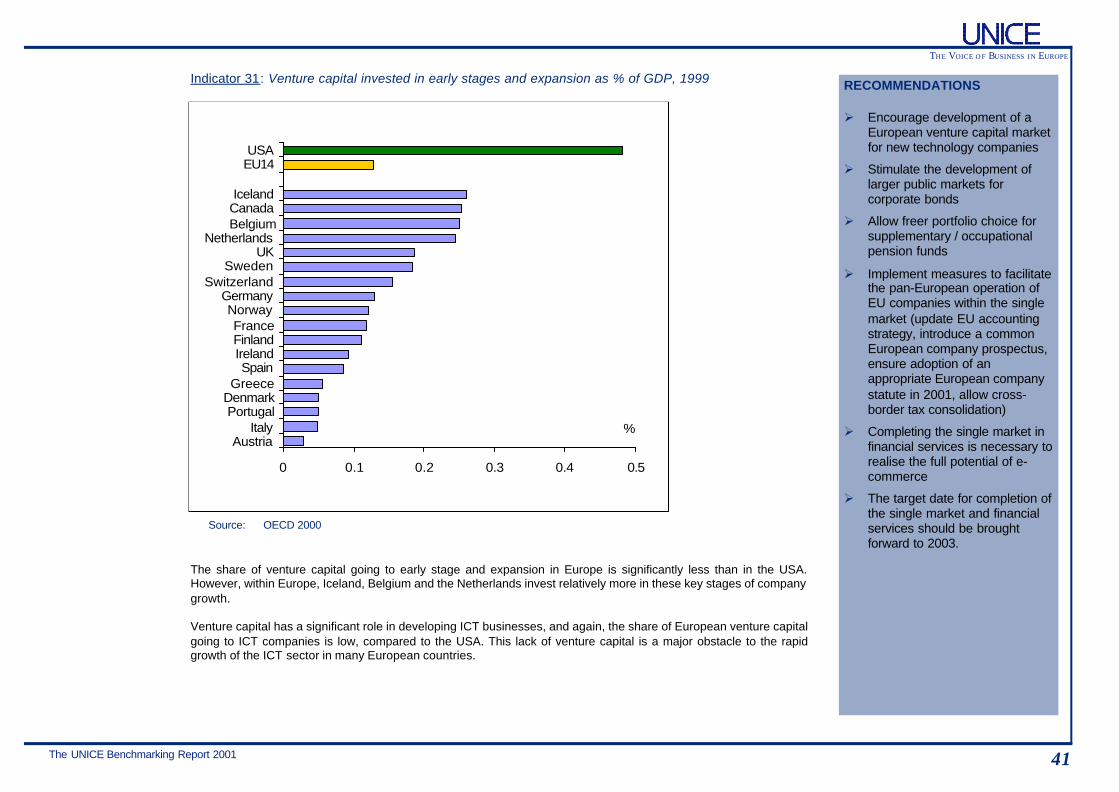
Indicator 31: Venture capital invested in early stages and expansion as % of GDP, 1999 RECOMMENDATIONS
Ø Encourage development of aEuropean venture capital marketfor new technology companies
Ø Stimulate the development oflarger public markets forcorporate bonds
Ø Allow freer portfolio choice forsupplementary / occupationalpension funds
Ø Implement measures to facilitatethe pan-European operation ofEU companies within the singlemarket (update EU accountingstrategy, introduce a commonEuropean company prospectus,ensure adoption of anappropriate European companystatute in 2001, allow cross-border tax consolidation)
Ø Completing the single market infinancial services is necessary torealise the full potential of e-commerce
Ø The target date for completion ofthe single market and financialservices should be broughtforward to 2003.
The share of venture capital going to early stage and expansion in Europe is significantly less than in the USA.However, within Europe, Iceland, Belgium and the Netherlands invest relatively more in these key stages of companygrowth.
Venture capital has a significant role in developing ICT businesses, and again, the share of European venture capitalgoing to ICT companies is low, compared to the USA. This lack of venture capital is a major obstacle to the rapidgrowth of the ICT sector in many European countries.
Source: OECD 2000

THE VOICE OF BUSINESS IN EUROPE
42 The reNewed Economy
n Reward risk and effort
0
5
10
15
20
25
1980 1985 1990 1995 2000
%
USA
Europe
Indicator 32: Reward risk: returns on equity investment
"The race is not to the swift, northe battle to the strong, neitherbread to the wise, nor yet riches tomen of understanding, nor yetfavour to men of skill; but time andchance happen to all.”
Ecclesiastes, Chapter 9, verse 11.
Source: Goldman Sachs, 2000.
Making the most of the opportunities provided by the developing new economy involves risk for entrepreneurs,investors and employees.
The rewards available to companies and to individuals are generally lower in the EU than in the USA. Thismeans that European entrepreneurs and investors are less likely to invest in the new economy; companies areless able to recruit, retain and motivate staff; and employees are less likely to accept new (risky) opportunities.
Returns on equity are a good indicator of the ability of established companies to generate cash flows to fund newinvestments internally. They also send a signal to investors about the profitability of investing in real assets.
For most of the period since 1987, the after tax return on equity for publicly quoted companies has been lower inEurope than in the USA, with the gap increasing over a ten year period. This is the result of a wide range of factors,including high taxation, high labour and utility costs, and less efficient use of capital and labour. Although the gap hasnarrowed in recent years, it remains large, making it more difficult for European than US companies to finance andexploit new, profitable investment opportunities based on new technologies.

THE VOICE O F BUSINESS IN EUROPE
43The UNICE Benchmarking Report 2001
Indicator 33: Reward effort: stock options: % "gain" payable in taxes
New, fast growth companies need to recruit, retain and motivatetheir staff if they are to exploit the potential of moderntechnologies. Stock options are a way of doing this.
In most EU countries fiscal legislation reduces the attraction ofstock option programmes to both employers and employees.Gains are frequently taxed at high marginal rates of income taxand made subject to employers' and employees' social securitycharges, as though they were secure salaries rather than riskyreturns on invested effort.
Only 20% of the gains from a typical stock option programme forsenior managers in small, fast-growth companies are paid as taxin the USA. By comparison, Swedish managers in a similarcompany would pay tax equal to 53% of the gains from the sameprogramme, of which 33% are social charges. Belgium has thelowest tax on options.
High levels of taxation of stock option programmes in Europereduce the incentives for employees in established companiesto take risks and accept major changes in existing operatingprocesses and business models.
0 25 50 75 100
USA
Sweden
France
Norway
Portugal
Finland
Denmark
Iceland
Austria
Netherlands
UK
Germany
Spain
Ireland
Switzerland
Italy
Belgiumemployee tax costs
employer tax costs
Source: UNICE 2000, based on a survey of member federations.
Note: Employee costs are subdivided into income tax, social securitycontributions and other taxes. The base case of this model isspecific.

THE VOICE OF BUSINESS IN EUROPE
44 The reNewed Economy
Indicator 34: First tax-free day, 2000
Taxes on labour are significantly higher in the EU than in the USA, in part because most European countriesprovide retirement benefits through state-run "pay-as-you-go" schemes.
This un-funded pension liability of governments puts an excessive tax burden on individual employees andemployers. In the EU as a whole, for an average production worker, it takes 202 days to pay off the year’s taxeson labour, compared to 133 days in the USA and 125 days in Japan. Although this situation has improved in theEU as a whole since 1998, it has deteriorated in several EU Member States. High taxation reduces the incentivesfor employees to embrace new ways of working.
Source: SAF, 2000, SA (Icelandic Business Federation).
RECOMMENDATIONS
Ø Lower the tax burden on equityinvestment
Ø Reform the system of taxationof stock options
Ø Reduce tax burden on labour,including marginal tax on labour
Ø Strengthen incentives forworkers to embrace change,modernise labour marketregulations and reduce indirectlabour costs
Note: Definition: time needed to pay the year's total taxes (including income taxes, social securitycontributions and tax on goods and services) on labour for an average production worker.
"The challenge is not to dismantlethe European model, but tomodernize it so as to provideEurope's citizens with security insupport of change, instead ofsecurity against change."
Leif Pagrotsky, Sweden's TradeMinister, The Financial Times, 5October 2000
16-May08-May
24-Jul
02-Sep14-Aug13-Aug12-Aug
09-Aug04-Aug03-Aug01-Aug
30-Jul27-Jul
08-Jul08-Jul
02-Jul24-Jun
18-Jun07-Jun
21-May01-May
USAJapanEU15
BelgiumSwedenDenmarkGermany
FinlandItaly
NorwayFranceAustria
NetherlandsLuxembourg
SpainPortugalGreeceIreland
UKIceland
Switzerland

THE VOICE O F BUSINESS IN EUROPE
45The UNICE Benchmarking Report 2001
Chapter IV - Conclusions
"I'm all for progress; it's change Idon't like."
Mark Twain
Technical progress is the major driving force behind economic growth and can change society profoundly.
The USA is the first country to have taken advantage of the opportunities offered by the new information andcommunications technologies. During the 1990s, it grew at a faster rate, for a longer period, than ever before;and it achieved this through rapid productivity growth combined with low levels of inflation.
This report suggests that the new economy has developed fastest in countries that are innovative producersand users of ICT goods and services; where existing "traditional" industries have adopted the newtechnologies, for their own production and distribution activities; and where companies investing in ICT haverestructured their work organisation and developed new business strategies. In short, companies - and thepeople working in them - must have a capacity to innovate, a willingness to invest in new productiontechnologies, and a readiness to implement new organisational change.
The speed of development of the new economy has been slower in Europe as a whole. Yet some Europeancountries have been successful and many European companies provide examples of best practice.
And there could be more European success stories if the overall framework conditions in more Europeancountries were geared towards encouraging change:
• Labour markets must function more smoothly, so that individuals recognise change as an opportunityrather than risk;
• Product markets must be sufficiently competitive, especially telecommunications, so that Europe is ableto exploit fully and rapidly the new technologies;
• European countries must reduce the overall burden of taxation on their citizens and their companies.
These conditions are essential for consumers, investors, employees and companies to become more willingto: adopt new technologies, support new entrepreneurs, develop new skills, invest in ICT, and adopt newforms of work organisation.
The speed of change has increased, placing greater demands on individuals, companies and societies. Forthese to respond positively, governments must act quickly - so that all Europe's citizens can benefit from theopportunities generated by the new, ICT-driven economy.

THE VOICE OF BUSINESS IN EUROPE
46 The reNewed Economy
Indicators
1. Annual growth of real GDP per capita since 19802. Employment growth in the business sector3. The share of knowledge-intensive sectors in total value-added, late 1990s4. Evolution of total factor productivity growth 5. Total ICT expenditure as % GDP, 19996. Share of ICT value-added in total business sector (%) 1997 7. e-commerce in major regions, 19998. Value of business-to-consumer transactions per capita, 19999. Percentage of businesses that allow business-to-customer interaction on-line10. Computers per 100 people, 199911. Mobile phone subscribers (% total population), October 200012. e-Government: electronic capability and cutting red tape13. Citizens’ interaction with public administration on-line14. Research and Development expenditure per capita, 199815. Share of ICT patents in total awarded by US Patents and Trademarks Office,
199916. Number of strategic ICT technological alliances17. Price of Internet access and Internet host penetration, 1995-200018. Leased Line: Private Circuit Tariff Comparison19. Short Message Service (SMS) prices, 199920. Information society infrastructure index21. On-line shopping habits amongst total adult population (%), 200022. On-line banking23. Number of secure servers by million people, March 200024. Labour Market Regulations25. Education: % of schools with Internet access, 2000 (2nd half) 26. Availability of Information Technology skills, 199927. Wage dispersion between those with tertiary and secondary school
education28. Pensions and free movement of employees - a barrier to labour mobility29. Structure of financial markets, 200030. The venture capital market in Europe and the USA, 199931. Venture capital invested in early stages and expansion as % of GDP, 199932. Reward risk: returns on equity investment33. Reward effort: stock options: % "gain" payable in taxes34. First tax-free day
Boxes
1. ICT and new organisational structures2. Supply chain improvements3. Examples of e-Government4. Adoption of new technologies5. Experiences of purchasing on-line, EU 15, October 2000
List of abbreviations
ATM Automatic teller machineB2B Business to business electronic commerceB2C Business to consumer electronic commerceCBI Confederation of British IndustryCEOE Confederation of Spanish Employerse- electronicEITO European Information Technology ObservatoryEVCA European Venture Capital AssociationGDP Gross Domestic ProductGSM Global system for mobile communicationsICT Information and Communications TechnologyIDC Part of International Data Group (IDG)IDW Institut der Deutschen WirtschaftIMD International Institute for Management Development, LausanneITU International Telecommunication UnionNVCA National Venture Capital Association (USA)OECD Organisation for Economic Cooperation and DevelopmentOECD STI Science and Technology IndicatorsPPP Purchasing power paritySAF Swedish Employers' ConfederationSI Federation of Swedish IndustriesSME Small and medium-sized enterprisesUK DTI UK Government's Department of Trade and IndustryUMTS Universal mobile telecommunications system: the third generation
mobile standardUNICE Union of Industrial and Employers' Confederations of EuropeWAP Wireless application protocol
List of indicators, boxes and abbreviations

THE VOICE O F BUSINESS IN EUROPE
47The UNICE Benchmarking Report 2001
Chairman
Per Magnus Wijkman . . . .Federation of Swedish Industries
Members
Julian Azzopardi . . . . . . . . .MFOI . . . . . . . . . . . . . . . .MaltaKate Barker . . . . . . . . . . . . .CBI . . . . . . . . . . . . . . . . . .United KingdomSøren Bjerregaard Neilsen . .DI . . . . . . . . . . . . . . . . . . .DenmarkChristian Braad . . . . . . . . . .DI . . . . . . . . . . . . . . . . . . .DenmarkDiego Cano Soler . . . . . . . . .CEOE . . . . . . . . . . . . . . . .SpainGerard de Lavernée . . . . . . .MEDEF . . . . . . . . . . . . . . .FranceArthur Forbes . . . . . . . . . . . .IBEC . . . . . . . . . . . . . . . . .IrelandGiovanni Foresti . . . . . . . . . .CONFINDUSTRIA . . . . . . .ItalyManuela Gameiro . . . . . . . . .CIP . . . . . . . . . . . . . . . . . .PortugalKinga Garab . . . . . . . . . . . .CEHIC . . . . . . . . . . . . . . .HungaryPatricia Goncalves . . . . . . . .AIP . . . . . . . . . . . . . . . . . .PortugalHans-Joachim Hass . . . . . . .BDI . . . . . . . . . . . . . . . . . .GermanyErkki Hellsten . . . . . . . . . . . .TT . . . . . . . . . . . . . . . . . .FinlandJens Holmboe Bang . . . . . . .DA . . . . . . . . . . . . . . . . . .DenmarkSonja Huerlimann . . . . . . . . .ECONOMIESUISSE . . . . . .SwitzerlandLars Jagrén . . . . . . . . . . . . .SI . . . . . . . . . . . . . . . . . . .SwedenSigurdur Johannesson . . . . .SA . . . . . . . . . . . . . . . . . .IcelandJasper Kat . . . . . . . . . . . . . .VNO-NCW . . . . . . . . . . . .NetherlandsMatthias Krämer . . . . . . . . . .BDI . . . . . . . . . . . . . . . . . .GermanyJeroen Langerock . . . . . . . .VBO-FEB . . . . . . . . . . . . .BelgiumEric Morell . . . . . . . . . . . . . .SI . . . . . . . . . . . . . . . . . . .SwedenAlex Muscatelli . . . . . . . . . . .CBI . . . . . . . . . . . . . . . . . .United KingdomAnders Rydeman . . . . . . . . .SAF . . . . . . . . . . . . . . . . .SwedenKatarina Sataersdal . . . . . . .NHO . . . . . . . . . . . . . . . . .NorwayAntonisTortopidis . . . . . . . . .SEV . . . . . . . . . . . . . . . . .Greece Gündüz Ulusoy . . . . . . . . . .TÜSIAD . . . . . . . . . . . . . .TurkeyCaroline Ven . . . . . . . . . . . .VBO-FEB . . . . . . . . . . . . .BelgiumOtto von Weitershausen . . . .BDA . . . . . . . . . . . . . . . . .GermanyIsabella Waldstein . . . . . . . .VÖI . . . . . . . . . . . . . . . . . .Austria
The UNICE competitiveness group
UNICE staff
Iona Hamilton . . . . . . . . .Project coordinator, Adviser Economic and Financial Affairs
Carlos Almaraz . . . . . . . .Adviser, Company AffairsRachel Bonduau . . . . . . .Graphics and LayoutJérôme Chauvin . . . . . . . .Director, Company AffairsDavid Coleman . . . . . . . .Adviser, Company AffairsThérèse de Liedekerke . .Director, Social AffairsDaniela Israelachwili . . . .Acting Secretary General, Director, Economic and Financial AffairsPhilippe Léonard . . . . . . .Senior Adviser, SME Policy and Innovation
Project Advisers
Bruce Ballantine . . . . . . . .Business Decisions LimitedRichard Meads . . . . . . . . .Business Decisions LimitedBethan Devonald . . . . . . .Business Decisions Limited
The data used in this report are taken from a variety of official sources.UNICE alone is responsible for the use made of this data and the opinions
expressed in the text.
Reproduction is authorised, except for commercial purposes, provided the source is acknowledged.
© UNICE, March 2001

UNICE is
* the official voice ofEuropean Business andIndustry vis-à-vis the EUinstitutions
* composed of 34 centralindustry and employers’federations from 26European countries
Further information about UNICE and its member federations can be found on ourwebsite: www.unice.be
The reNewed EconomyBusiness for a dynamicEuropeThe UNICE Benchmarking Report2001
Union of Industrial and Employers' Confederations of Europerue Joseph II, 40/4B-1000 Brussels
Tel: 32 2 237 65 11Fax: 32 2 231 14 45
E-Mail: [email protected]
THE VOICE OF BUSINESS IN EUROPE