Embed Size (px)
Citation preview
Ben Wilson and Tim Dyson
Democracy and the demographic transition Article (Accepted version) (Refereed)
Original citation: Wilson, Ben and Dyson, Tim (2016) Democracy and the demographic transition. Democratization . ISSN 1351-0347
DOI: 10.1080/13510347.2016.1194396 © 2016 Taylor & Francis This version available at: http://eprints.lse.ac.uk/66620/ Available in LSE Research Online: July 2016 LSE has developed LSE Research Online so that users may access research output of the School. Copyright © and Moral Rights for the papers on this site are retained by the individual authors and/or other copyright owners. Users may download and/or print one copy of any article(s) in LSE Research Online to facilitate their private study or for non-commercial research. You may not engage in further distribution of the material or use it for any profit-making activities or any commercial gain. You may freely distribute the URL (http://eprints.lse.ac.uk) of the LSE Research Online website. This document is the author’s final accepted version of the journal article. There may be differences between this version and the published version. You are advised to consult the publisher’s version if you wish to cite from it.
Democracy and the demographic transition
Ben Wilson*
Fellow, Department of Methodology, London School of Economics, UK
Tim Dyson
Professor, Department of International Development, London School of Economics, UK
Abstract
This paper addresses the role of demographic factors in contributing to the emergence of
democracy. It maintains that, other things equal, progress in the demographic transition
promotes democratization. The argument is developed with reference to the effects of
interrelated changes in mortality, natural increase (i.e. population growth), fertility, and
population age structure. Suggestions are also made with respect to how demographic and
democratic trends should be gauged. An analysis of data for the period 1970-2005 for 77
countries that were initially non-democratic provides substantial support for the argument.
Some implications are discussed, as are future trends in democratization from a
demographer’s perspective.
Keywords: demographic transition; autocracy; destabilization; population growth;
population aging
* Email: [email protected]; Postal address: Department of Methodology, London School
of Economics, Houghton Street, London WC2A 2AE. United Kingdom
Introduction
Perhaps the most common explanation of democratization—in relation to North American
and European populations in the past, and others more recently—is that it is underpinned by
economic advance. Essentially, the argument is that by freeing people from poverty, and
improving the basis for the emergence and dissemination of values of equality and
secularism, the experience of modern economic growth and rising living standards favours a
society’s transition to democratic politics. In short, prosperity encourages democracy. Of
course, the relationship is not inevitable. Other factors are germane and can intervene.1
Nevertheless, it is widely thought that, more than anything else, it is economic development
that underpins democratization.2
It is surprising, however, that little attention has been given to demographic factors in
accounting for democratization in recent decades. Since the events of 9/11, there has been
research on the relationship between young—and therefore rapidly-growing—population age
structures on the one hand, and conditions of conflict and political instability on the other.
The resulting ‘youth bulge’ literature certainly addresses population characteristics that may
be inimical to democracy.3 But that is not the same as addressing how demographic progress
may support a movement from autocracy to democracy. In short, it is not the same as
considering how, in distinctly positive ways, and in combination with other factors such as
education, the ‘demographic transition’ may help to foster a ‘democratic transition’.
With this as background, the present paper argues that the passage of countries from
experiencing high death and birth rates (i.e. high mortality and high fertility) to experiencing
low death and birth rates does indeed have distinctly advantageous implications for
democratization. The argument is made in four parts. First, we introduce the concept of
demographic transition and discuss why its constituent processes are likely to promote a shift
from autocracy to democracy. Second, we consider issues of data and approach—including
how a society’s progressions through both the demographic and the democratic transitions
might best be evaluated. Third, we present an analysis of international data on trends in
democracy over the period 1970-2005. The results support the idea that demographic
progress is an important factor behind democratic advance. Moreover, even if democracy is
established for quite different reasons, demographic progress is likely to be significant in
conditioning whether it survives. Finally, we discuss some of the implications of our
findings—including for future trends in democratization.
Theoretical considerations
The demographic transition has been described as ‘one of the best documented
generalizations in the social sciences’.4 Each country’s experience is distinct. However,
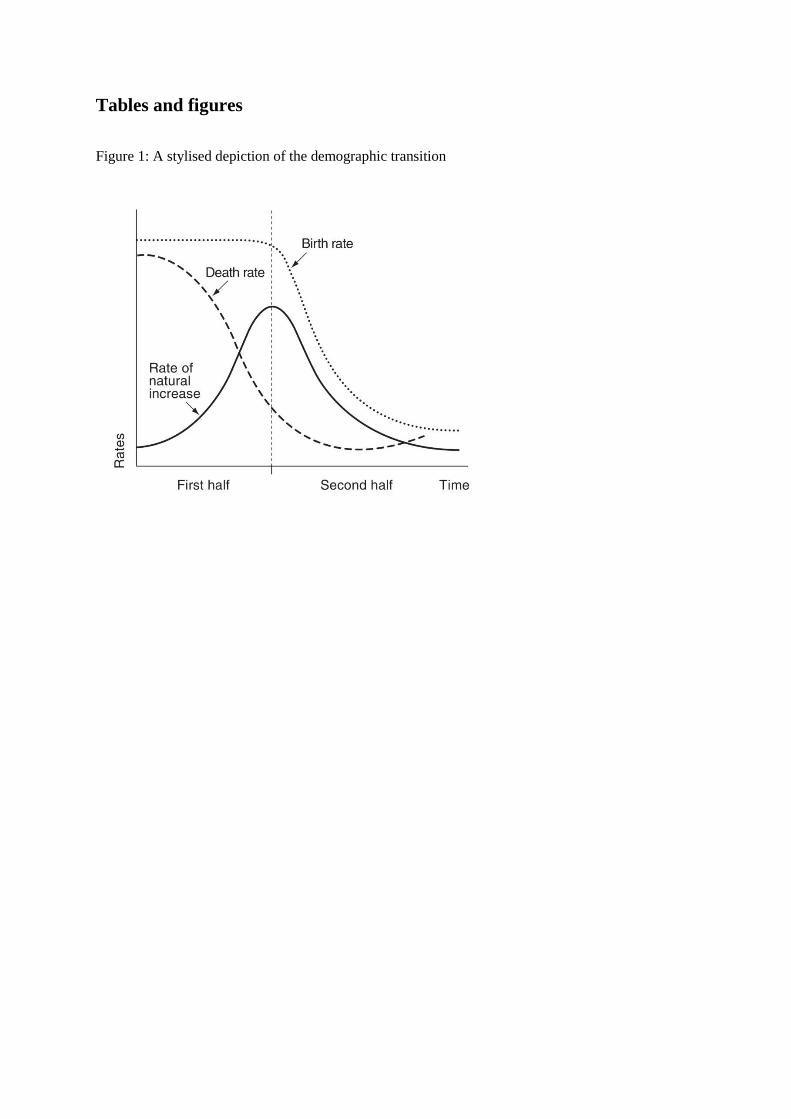
Figure 1 shows the phenomenon’s basic features. As can be seen, the demographic transition
involves a major change from circumstances in which a society’s death rate and birth rate are
high and roughly equal, to circumstances where both rates are low and roughly equal. Pre-
transitional societies varied in terms of their demographic characteristics. Nevertheless, life
expectancy was normally very short by modern standards—usually in the range 20-30
years—and women would experience an average of about 5-7 births during their lives. By the
end of the transition, life expectancy is likely to be at least 65 years, and women will have
about two births each (or less).5
[Figure 1 about here]
As Figure 1 shows, mortality decline—as reflected by the fall in the death rate—is the
first process to begin. It causes a rise in the rate of natural increase, i.e. essentially the rate of
population growth. There is then a delay before the birth rate—mainly reflecting the level of
fertility experienced by women—begins to fall. The fall in the birth rate has two major
effects. First, it causes a reduction in the rate of population growth (i.e. natural increase) back
towards the low (or zero) rate that existed previously. Second, it causes the age structure of
the population to slowly but surely become much older.6 This process of population ageing is
inevitable. While a pre-transitional society might have a median age of about 20 years, by the
end of the transition its median age is likely be close to 40.
It is the ‘second half’ of the demographic transition—i.e. that involving a fall in
fertility, and therefore the birth rate—that is of most concern to us here. This is partly because
almost all countries today have experienced, or begun to experience, a fall in fertility.
However, the main reason why the second-half of the transition is of primary concern is that
theory and experience both suggest that this is the period when the links between
demographic and political progress are likely to be strongest.
Our consideration of theory starts from the position that before the demographic
transition the political systems of all states were fairly authoritarian. That is, autocracy
represents the general position ex ante. Indeed, it is hard to envisage the emergence of
anything resembling a modern democracy in circumstances where disease and illness are rife,
and life expectancy is 20-30 years—circumstances where, to quote Hobbes, life is ‘nasty,
brutish and short’.7 If, as is sometimes said, escape from poverty encourages intelligent
political discourse, then so, most certainly, does escape from sickness and sudden death.
The sustained fall in the death rate that marks the onset of demographic transition
means that people gradually become healthier, fitter, and more assured of their own life
prospects. On these grounds, it is reasonable to suppose that adults become more concerned
with the long-term future—both their own and that of their children. There are reasons to
think that mortality decline raises the propensity to save and invest—not least with respect to
increasing levels of investment in the educational attainment of the next generation.8 People
may also come to give greater consideration to issues of justice and fairness in society. These
various effects are almost certainly diffuse. Nevertheless, as a result, individuals may become
more disposed to questioning autocratic rule. It is true that democracies have occasionally
arisen in circumstances of fairly high mortality. India in the early 1950s is a rare example.
But there had been prior mortality decline in India (by 1950-55 life expectancy was about 36
years) and the instigation of democracy was undoubtedly influenced by external factors.9
Although mortality decline is probably necessary for democracy, the experience of many
countries proves that it is not sufficient to guarantee it. Indeed, it is difficult to show that the
level of mortality has an effect on the level of democracy using contemporary international
data.10
A crucial aspect of mortality decline is that it has several major destabilizing effects on
society. Above all, the population begins to grow—and, significantly, at a faster and faster
rate (Figure 1). This is likely to challenge the capacities of the (autocratic) state—such as
administration, gathering taxes, and dependent upon circumstances, maintaining public
order.11 Moreover, as the population grows, so does that of urban areas—including key sites
of power. Indeed, urban population growth tends to be appreciably faster than overall
population growth.12 As a result, urban growth may be particularly crucial—and difficult—
for the state’s agencies to manage. This issue is likely to be compounded by another
potentially unsettling effect of mortality decline, namely the fact that it tends to stimulate
migration.13 Added to this, is that the population’s already-young age structure becomes
slightly younger still (because the fall in death rates tends to be greatest at young ages).
Indeed, as mortality declines the median age of a country’s population may well fall by two
or three years (essentially it is this development that produces a ‘youth bulge’). All of these
potentially destabilizing effects come on top of the fact that people’s improving health status
may facilitate their greater questioning of autocratic rule.
In sum, then, mortality decline initiates a long period of destabilization—one that is
likely to raise challenges for the situation of an autocratic elite. As a result, those in power
can be expected to initiate new restrictions in order to try to maintain their controlling
position. Other sections of society, such as the commercial classes, are likely to support the
continuation of elite rule provided that they believe that it can ensure public order.14 Below
the surface, however, the possibility of socio-political turmoil may never be far away.
This brings us to the ‘second half’ of the demographic transition—when the decline in
fertility causes population ageing and a fall in the rate of population growth. This is when
demographic destabilization diminishes—before coming to an end (Figure 1). Four lines of
reasoning link this period with increasing pressure for a change from autocracy towards
democracy.
First, albeit in underlying ways, population ageing almost certainly contributes to
democratization, other things equal. In this context, ageing entails a long-term transformation
of a society’s age composition. Children decline greatly as a proportion of the total
population, while the proportion of people in the adult years (e.g. aged 18 years and over)
rises substantially. The view taken here is that, in the long run, the change in population
composition is itself likely to contribute to increased demand for political change. To
illustrate: before the decline in the birth rate, children may well comprise more than half of a
country’s population. However, towards the end of the transition the figure will probably be
close to 20 percent—i.e. about 80 percent of the population will be adults.15 The theoretical
case linking population ageing with democratization is straightforward: compared to children,
adults are more likely to want a ‘voice’ in political affairs, and they have greater capacity to
facilitate societal change. Therefore, other things equal, demographic maturation tends to
foster political engagement.
Second, fertility decline is also likely to promote democratization. Here the basic
reasoning is that as the birth rate falls, the activities related to childbirth and childcare come
to occupy a much smaller proportion of people’s—but especially women’s—lives. There is
very substantial empirical evidence to this effect.16 Indeed, it is estimated that before the
decline in the birth rate women might spend about 70 percent of their adult lives bearing and
rearing children, whereas towards the transition’s end the figure will be closer to 15 percent.17
The fall in fertility allows for the increasing movement of women out of the domestic domain
and into formal employment—albeit at varying speeds in different societies. Today,
democracy is taken as involving equal suffrage for women and men. And in recent decades
the introduction of voting rights for both sexes has almost always been simultaneous.
However, this was not generally the case when modern systems of democracy first emerged.
In the societies that were first to develop representative democracy, it was clearly the case
that voting and related rights were usually extended to women after they were extended to
men.18 The increased participation of women in the formal labour force in these societies is
often thought to have contributed to the gaining of the female franchise. And even today,
alongside men, the greater empowerment of women as a result of fertility decline may still
have a positive, if perhaps latent effect, both in instigating and sustaining democracy.
Third, mortality decline does not stop during the ‘second-half’ of the demographic
transition. Figure 1 shows that the death rate no longer falls at its previous pace, and in some
cases it may even rise slightly. But the trend in the death rate is partly a result of population
ageing. In fact, the rate of improvement in life expectancy during the second half of the
transition is likely to be similar to that experienced during the first half. Therefore, the gains
in health and wellbeing that accompany mortality decline, which we have argued will
enhance the questioning of autocratic rule, continue to occur.19
Finally, the second half of the demographic transition sees a fall in the rate of
population growth (Figure 1). This means that the challenges to the state that arise from
sustained natural increase diminish, and eventually disappear. It is important to note that this
development can work to the advantage of any type of political regime—irrespective of
whether it is autocratic or democratic. Nevertheless, if democratization has the upper hand—
for example, due to the previous lines of reasoning—then the reestablishment of more stable
demographic conditions should work in favour of democracy.
In summary, the forgoing arguments suggest that, especially during its ‘second half’,
the demographic transition raises the likelihood of a movement from autocratic to democratic
politics. As noted, earlier research has focussed mainly on the potentially disruptive effects of
young and rapidly growing populations—in which the rate of job creation may well be lower
than the rate of growth of young adults (especially males) entering the working ages. Such
research is chiefly concerned with societies located roughly halfway in the demographic
transition—where the destabilizing effects of mortality decline may well lead to greater
autocratic suppression. Inasmuch as research has posited a more constructive role for
demographic change in democratization, this has involved the potential economic gains that
can arise during the transition’s second half. These gains in living standards are sometimes
termed a demographic ‘dividend’. Essentially, this dividend—which is far from guaranteed—
can result from the economically advantageous shift in age structure (i.e. fall in the ratio of
children to adults) that results from fertility decline. Cincotta, in particular, has argued that
the higher wages that can arise from this shift in age-structure may enhance the prospect of
progress towards democracy.20 However, in part, the present argument is that the same major
change in age composition has the potential to contribute to progress in the political sphere.
The global demographic context
Having discussed theoretical considerations, it is useful to summarize variation in global
demographic experience—especially with respect to the transition’s second half.21 Countries
in Europe and North America were the first to experience demographic transition. They were
followed by societies in Latin America and Asia, whereas African countries have lagged
behind.
[Table 1 about here]
These different experiences are reflected in Table 1. Except for Africa, life expectancy
during 2005-10 was at least 70 years in all world regions. However, even Africa has
experienced significant mortality decline (life expectancy in 1950-55 was only 36 years).
Global regions vary much more with respect to their fertility—and therefore their birth rates
and rates of natural increase—than with respect to their mortality. Thus women in Africa had
an average of almost five births during 2005-10. In contrast, Latin American and Asian
fertility had fallen greatly—to just over two births per woman. Therefore, compared to
Africa, these regions had much lower birth rates and rates of population growth. Europe and
North America were the most demographically advanced—with very low birth rates and rates
of natural increase. The median age (MA) estimates give a good general indication of how far
each region had progressed. Thus, because fertility had fallen only slightly, Africa’s MA of
19.2 years in 2010 was still very low. Most African populations are still growing rapidly and
have only very recently entered the second half of the demographic transition. Latin America
and Asia are in intermediate positions. Latin America’s MA in 2010 was 27.3 years
(compared to 20.0 in 1950) while Asia’s was 28.8 years (compared to 22.3). Finally, the MAs
for Europe and North America signal that these regions had effectively passed through the
transition by 2005-10.
To conclude this introduction, there are reasons to think that, in combination, the
processes of the demographic transition have a major—if underlying—influence on the
evolution of political systems. In the first half of the transition, mortality decline and
population growth have destabilizing effects on what are essentially autocratic political
regimes. In the second half, mortality decline, fertility decline, and population ageing are all
likely to foster conditions that will widen the basis of political power. Moreover, slowing
natural increase should produce more settled socio-political conditions—quite possibly
benefitting democratization. For expositional reasons, the argument has been framed in
simple temporal terms and, of course, it is made ‘other things equal’. It should require no
emphasis that non-demographic forces can be important both in preventing and in promoting
democracy. In this context, a few countries have gone through the demographic transition
without becoming democracies. Conversely, though almost always short-lived, democratic
institutions have sometimes been set up in young and rapidly-growing populations—for
example, as part of the process of decolonization.22 Such exceptions are discussed below.
However, our aim is to develop an understanding of the general relationship between
demography and democracy. We now turn to the issue of how demographic and political
progress are analysed here, including the data and methods that are used.
Data and analysis
The following analysis uses median age (MA) to represent a country’s overall progress in the
demographic transition. The MA estimates employed are those of the United Nations. They
are very robust compared to all of the other socioeconomic measures that are used.23 We do
not attempt to distinguish the effects of individual demographic processes in what follows
because they are all very closely related. For example, we exclude consideration of mediating
variables, not least because they are highly correlated with the process that is under
investigation, and their inclusion would render the analysis extremely hard to interpret. In this
context, Table 2 gives the correlation coefficients between MA and the other demographic
variables for the 154 countries with more than one million people in 2005 that formed the
starting point for our analysis. Note that MA is strongly and positively associated with life
expectancy, and strongly but negatively associated with population growth and the level of
fertility.24 The average MA of the ten youngest of the 154 countries in 2005 was 16.2 years.
The matching life expectancy, fertility and population growth figures were 50.4 years, 6.7
births per women, and 3.5% per annum. The mean MA of the ten oldest countries in 2005
was 41.0 years. The corresponding life expectancy, fertility and population growth figures
were 78.2 years, 1.43 births per woman, and 0.2% per annum. Essentially, the contrast
between these two groups of countries shows current variation with respect to their place in
the demographic transition.
[Table 2 about here]
Turning to democracy, we began our analysis using Vanhanen’s index of democracy
(ID) and also carried out analysis based on the ‘Democ’ measure produced by the Polity IV
Project.25 Vanhanen’s ID is undeniably a minimal measure—short on institutional content.
That said, it reflects two critical features of democracy as identified for example in the work
of Dahl.26 These features are political participation (P) and political competition (C), both as
revealed in elections. Basically, ID is the product of P and C—where P is gauged mainly by
the proportion of a country’s population that turns out to vote, and C is gauged by the
proportion of votes that are cast for political parties other than the largest one.27 Like all
measures of democracy, ID has been criticized on various grounds.28 For example, it is
almost entirely elections-based, and it can be distorted where party systems are highly
fragmented. That said, ID has some important strengths. For example, it consists of a
continuous, as opposed to an ordinal scale. It reflects the degree to which both men and
women actually engage in voting. And, importantly, it is largely free of subjective evaluation.
In sum, then, ID was used in the first instance here because: it is comparatively
straightforward in terms of its empirical grounding; it is relatively objective (and replicable);
and, it reflects what many see as being critical features of democracy.
In contrast, in our view, the Democ measure is less satisfactory for present purposes.
Thus the Democ values produced for countries derive largely from subjective assessments
and, relatedly, they are expressed as simple integer scores ranging from 0 to 10. Although
they are often used by analysts as indicators of the level of democracy, they are really
intended by the Polity IV Project more as evaluations of the institutional structures of
prevailing political regimes (mainly in relation to the executive branch of government). This
means that Democ measures do not, for example, directly reflect the degree to which people
vote in elections.29 Nevertheless, in what follows results using Democ scores are presented to
show that a society’s progress through the demographic transition appears to be a significant
factor influencing its chances of becoming a democracy largely irrespective of which
indicator is used.
The remaining country-level socioeconomic measures used in the analysis are five-
yearly (i.e. quinquennial) estimates of (i) real per capita GDP (expressed in 1990 Gear-
Khamis US dollars), (ii) the proportion of the population aged 25 years and over with
completed secondary school education, (iii) the proportion of the economically active
population employed in agriculture, and (iv) the proportion of the total population residing in
urban areas. Estimates of the proportion of the population aged 20 years and over are also
used (see below).30 Given the availability of estimates of these different variables—including
the initial dependent measure ID—the analysis is restricted to the period 1970-2005, and to
countries for which there are quinquennial estimates of all of the variables. This reduced the
number of countries from 154 to 101.31 Furthermore, because we are concerned with the
emergence of democracy, populations that had ID values of 15 or more at the start of the
period (i.e. in 1970) were excluded from the analysis. This was because these—mostly very
developed—countries could be taken as already being fairly democratic in 1970.32 This left
77 countries as the basis for most of the analysis. Of these 77 countries, 31 are in Africa, 20
in Asia, 18 in Latin America (and the Caribbean), and 8 are in Europe.33
Our analysis includes several statistical models, each of which use a measure of
democracy as the dependent variable. The first set of models (labelled ‘model 1’) use pooled
multiple regression analysis across quinquennial estimates for the 77 countries in our
analytical sample. Model 2 is the same as model 1, but with standard errors that take account
of clustering by country.34 Model 3 is the same as model 1, but includes a (5-year) lagged
dependent variable. Model 4 includes ‘fixed effects’ at the country-level in order to better
estimate the relationship within countries between democracy and our explanatory variables.
Finally, model 5 uses the same fixed effects specification as model 4, but including time
fixed-effects and panel-corrected standard errors.34
Results
Beginning with ID as the dependent variable, for the 77 initially fairly autocratic countries,
Figure 2 compares the change in ID between 1970 and 2005 with the corresponding change
in MA. The average (un-weighted) value of ID for the countries rose from 2.4 to 12.3 during
1970-2005, while the average MA increased from 19.3 to 23.6 years. Figure 2 shows a
considerable amount of scatter around this general trend. Quite a few countries experienced
little or no change in their median ages (especially in African countries where the value of
MA sometimes fell). It is clear from the data that some countries (e.g. Afghanistan,
Argentina, Burundi) experienced significant increases in ID with only modest rises (or even
small falls) in MA, while other countries (e.g. China, Cuba, Kuwait) experienced large rises
in MA with little change in ID. Nevertheless, the overall relationship between change in ID
and change in MA is positive and statistically significant at the 5 percent level (p=0.046).
Populations that have progressed more in demographic terms have also tended to become
more democratic as gauged by ID.
[Figure 2 about here]
We also analysed the relationship between ID and MA, controlling for a number of other
explanatory variables (using the five models described previously). MA was found to be
strongly associated with ID, even after controlling for lagged ID, per capita income,
agricultural employment, education, and urbanization. Indeed, MA was significant well
within the 0.1 percent level in all models except model 5. The estimated coefficients for MA
in model 4 suggest that an increase of one year in median age is associated with a within
country increase of at least 0.6 in the value of ID—i.e. a sizeable conditional effect. It is
important to record that the only other variable for which the results were statistically
significant in more than one of the models was education, which was significant at the 1
percent level in models 1 and 4.
However, as described previously, one of the ways that the demographic transition will
have an impact on democratization is because it increases the proportion of the population
that is adult i.e. a compositional effect. In relation to the measurement of democracy, at least
in the case of ID, this appears to have been largely unnoticed in previous work.35 Importantly,
in the calculation of ID the value of P (i.e. political participation) is based on the proportion
of the total population that votes. But this proportion is heavily affected by a country’s age
structure—because voting is only undertaken by adults. The importance of this explanation,
especially from a demographer’s perspective, is investigated here by extending the
previously-discussed analysis based on ID.
The age structure of societies varies greatly according to their position in the
demographic transition. Thus a country that is situated around the middle of the transition
will have a much smaller proportion of its population eligible to vote than one that is located
toward the end. For example, if we assume that only people aged 20 years and over can vote,
then a country near the middle of the transition in 2005 would only have around 40 percent of
its population eligible to vote, compared to 80 percent for a country that was near the
transition’s end. Notice that the bias operates systematically—tending to reduce the level of
Vanhanen’s ID in young populations (e.g. in Africa) relative to those that are older (e.g. in
Europe).
To investigate this issue, we have computed a new measure of democracy based on ID,
but standardized for age structure. This has been accomplished simply by dividing all values
of ID by the corresponding estimate (for country and year) of the proportion of the population
aged 20 and over. We call this measure AID—standing for age-adjusted index of democracy.
Essentially, AID means that a country’s level of democracy is being assessed on the basis of
the proportion of the voting-age population that votes (rather than the total population).36
[Figure 3 about here]
[Table 3 about here]
For the 77 initially autocratic countries in our analytical sample, the mean value of AID
increased from 5.2 to 21.3 between 1970 and 2005. As illustrated by Figure 3, the bivariate
relationship between change in AID and change in MA (1970-2005) exhibits considerable
scatter, and unlike the equivalent association between ID and MA (in Figure 2), it is not
significant at any conventional level. This might be expected, given that unlike ID, the
variation in AID accounts for the proportion of the population that is eligible to vote.
Nevertheless, further analysis suggests that median age still explains some of the
variation in levels of democracy, even after making this adjustment. Table 3 presents the
results of our regression models that use AID as the dependent variable (rather than ID). The
magnitude of the estimated associations between MA and AID remain sizeable. Although no
significant relationship is indicated by model 5, the estimates for MA are significant at the 5
percent level in all other models. Note that, again, of the other variables, only education is
statistically significant in more than one model.
[Table 4 about here]
Robustness of the findings
As one means of checking the robustness of our findings, Table 4 presents the results when
‘Democ’ is used as the dependent variable. The pattern of these results are not very different
from those in Table 3, except to note that agricultural employment is significantly associated
with levels of democracy in several of the models (i.e. the more people employed in
agriculture, the lower is the level of Democ).
Here, we have only analysed the countries that are undemocratic at the start of our
study period. This explains why we model the level of democracy, rather than change in
democracy. Nevertheless, it is reasonable to ask whether the results change when directly
analysing five-year change. For this reason, we run the analysis using a lagged dependent
variable (model 3).37 This reduces the size of the MA effect, although it remains similarly
significant. As a further robustness test, model 4 uses country-level fixed effects to examine
the AID/MA relationship within countries. In this case, the effect remains significant (albeit
only at 5% for AID), and similar in size (or larger in the case of Democ). As a final
robustness test, we add time fixed-effects and panel-corrected standard errors to model 4.
This result provides evidence that there is no relationship between median age and the level
of democracy within countries, after controlling for the aggregate trend in democratization.
However, we believe that this result is most likely to be a reflection of the limited power of
our data to identify effects in such a model. We also note that none of the variables in model
5 are significant, except the year dummies, irrespective of whether we are modelling ID,
AID, or Democ.
[Figure 4 about here]
To conclude our analysis, and consider what these results mean for all countries, Figure
4 plots the relationship between AID and MA in 2005 for the 145 countries that had estimates
of both measures, and a population of at least one million in 2005. Reflecting the multiplicity
of factors that can influence the nature of modern political regimes, there is considerable
scatter. Nevertheless, about 26 percent of the variation in AID can be accounted for by
variation in MA. It is notable that some countries with low MA values have high AID values,
for example Ghana (MA=19.8, AID=39.0), Malawi (16.8, 39.7), and Papua New Guinea
(20.0, 63.2). In such cases the adjustment for age structure makes a big difference to a
country’s relative democratic standing. For example, Papua New Guinea (PNG) ranks
twenty-fifth out of the 145 countries in terms of ID, but ranks first in terms of AID—ahead of
the Netherlands (MA=38.8, AID=59.7). Of course, it is important to remember the minimal,
and elections-based, nature of ID—and therefore AID. It may be relatively straightforward to
hold a competitive election in a country—for example to meet the requirements of western
governments that dispense development assistance. That said, the fact that countries like
Ghana, Malawi, and PNG have young populations suggests that their status as democracies is
far from secure. Figure 4 underscores that demographic progress does not ensure democracy.
A small number of countries with high values of MA also have low values of AID. Most
notably, Cuba (MA=35.5, AID=0.0), Georgia (35.8, 9.1) and Singapore (37.5, 5.5). The old
populations of Belarus (37.4, 19.4) and Russia (37.3, 22.6) also have relatively low levels of
AID.
Summary and discussion
As noted at the start of this article, the paucity of research linking demographic change with
democratization is surprising. Both words share the same root, after all. And there are close
connections between the workings of democracy and demographic information. Thus the
principle that political representation should be in proportion to population often requires that
a census is taken—as exemplified, for example, in the constitution of the United States.
Moreover, in the last resort, proof that a person is of voting age usually derives from a birth
certificate generated by a civil registration system.
Inasmuch as previous work has acknowledged a role for demographic forces in
influencing recent trends in democratization it has mostly addressed the disruptive
consequences of young and rapidly-growing populations. Such destabilizing effects are
probably real. But the research that has assessed them has tended to assume that political
progress occurs for other non-demographic reasons—such as changes in society relating to
economic growth.
In contrast, we have presented a theoretical case for the importance of demographic
factors, and argue that a country’s progress through the demographic transition (in particular
its second half) is a key factor influencing its likelihood of becoming a democracy. The
argument is multi-stranded. It involves major and closely-related changes in mortality,
fertility, age structure, and the loss—and subsequent recovery—of relatively stable
demographic conditions. The changes in demographic characteristics are hypothesized to
influence democratization in underlying ways. The argument says little about the details of
the connection, for example whether the potential progression to democracy is gradual or
dramatic.38
It has been argued elsewhere that progress through the demographic transition was a
significant force behind the creation of democracies in European populations between about
1890 and 1930.39 The emergence of these first modern democracies was essentially an
autochthonous process—i.e. it came from within these societies themselves. More recently,
however, progress towards democracy has often been influenced by external factors.
International—especially western—stimuli have been crucial in the advance of democratic
politics in various ways.40 Indeed, the fact that some democracies already existed has
provided a potential role model for other countries to follow. Yet although democratization
may have been influenced by both external and internal considerations during 1970-2005, our
analysis of data for a sizeable number of countries provides substantial support for the present
argument.
That said, if demographic progress contributes to democratic advance, it has not been
the sole factor behind democratization in recent decades. In particular, the present analysis
also suggests that a population’s level of education appears to have a positive effect on
democratization. There are strong reasons to think that more educated people are more
interested in public affairs, and that they are more likely to engage in politics.41 Such people
are also more likely to be aware of the existence of democratic institutions in other lands. The
growth of mass education has therefore been fundamentally important both as a promoter and
a maintainer of democracy. The fact that in recent decades many governments have seen
educational expansion as a key development goal has almost certainly benefitted
democratization.
Increases in education have also promoted demographic progress in the ‘second half’ of
the demographic transition.42 This has happened, in particular, in relation to the effect of
rising levels of education on falling levels of fertility. Of course, education is only one of
several factors contributing to fertility decline.43 And the direction of causation between
education and fertility is two-way. For example, it has been shown that fertility decline leads
to a reduction in youth dependency which in turn leads to increases in educational coverage
and improvements in educational quality.44 Nevertheless, our results do provide support for
the explanation that the spread of mass education has a significant effect on democratization.
It is not the aim of this research to say whether education is a more or less important driver of
democracy than the demographic transition, and it is hard to imagine a methodology that
would allow us to disentangle the causal dependencies between these three processes (while
also maintaining a reasonable degree of external validity). Instead it seems, at least based on
our results, that both education and the demographic transition are likely to have independent
and mutually reinforcing effects on democracy.
We have remarked that a common account of democratization stresses the contribution
of economic development. However, the theoretical basis for this suggestion has been
acknowledged as poorly developed.45 The idea receives little support from several statistical
analyses.46 And we find no real evidence for it here. Indeed, it is striking that the
(conditional) association between democracy and per capita income is not statistically
significant in almost all of our models.
In contrast, there appears to be a persistent association between median age and levels
of democracy. When interpreting this result, it is important to emphasize that a population’s
median age (MA) is much more than a measure of its age composition. Instead, it is better
seen as a reflection of cumulative demographic progress—as regards mortality, fertility,
population growth, and age structure. Given their overlap, these demographic factors are
almost impossible to disentangle in a statistical analysis. However, median age remains an
important explanation for variation in levels of democracy, even after adjusting our initial
measure of democracy (ID) for one aspect of age composition. This age-adjusted measure
(AID) is certainly a minimal index—largely devoid of institutional content. Nevertheless, it is
relatively objective and replicable. And because it incorporates age structure, it may be a
useful measure for future research that wishes to properly account for (at least some)
demographic factors in the analysis of democracy.
Progress through the demographic transition does not guarantee democracy. But most
modern democracies have passed through most of the demographic transition. All the same,
the argument has been made here ‘other things equal’. It is clearly possible for some
countries with young and rapidly-growing populations to hold successful elections—Ghana,
Malawi and PNG are examples. However, in these cases the demographic basis of democracy
remains insecure. Conversely, there are a few countries—e.g. Cuba, Singapore, Russia—that
have gone through the transition and yet remain fairly autocratic. It is notable too that China
and North Korea are both approaching the transition’s end. These examples show that
political currents have their own dynamic—one that can counteract any potential trend
towards democracy. Indeed, we have argued that, in itself, the return of relatively stable
conditions at the end of the demographic transition is likely to favour whatever political
system is dominant, including autocracy. That is not to say, however, that the attainment of
much higher life expectancy, much lower fertility, and a much older age structure will not
continue to influence political events in a progressive direction.
Looking to the future, there is no doubt that every country, if not already at the end of
the demographic transition, will proceed in that direction during the next few decades. By
way of illustration, whereas 76 of the 145 countries in Figure 4 had a median age of less than
25 years in 2005, the United Nations projects that only 24 countries in the world will have

such a low median age in 2050.47 Further, it is highly likely that levels of education will also
increase appreciably in most countries in the coming decades.48 Since progress in the
demographic transition and educational expansion appear to be major drivers of
democratization in the modern world, these developments should benefit the emergence and
consolidation of democracy.
Bibliography
Acemoglu, Daron, Simon Johnson, James A. Robinson, and Pierre Yared. ‘Income and
Democracy’. American Economic Review 98, no. 3 (2008): 808-42.
Barro, Robert J. ‘Determinants of Democracy’. The Journal of Political Economy 107, no. 6,
pt. 2 (1999): 158-83.
Barro, Robert J. and Jong-Wha Lee. ‘A New Data Set of Educational Attainment in the
World, 1950-2010’. Journal of Development Economics 104 (April 2010): 184-98.
Online data available at: http://www.barrolee.com/ (accessed March 2014).
Bloom, David, and David Canning. ‘Cumulative Causality, Economic Growth, and the
Demographic Transition’. In Population Matters: Demographic Change, Economic
Growth, and Poverty in the Developing World. Oxford: Oxford University Press, 2001.
Brunborg, Helge, and Ewa Tabeau. ‘Demography of Conflict and Violence: An Emerging
Field’. European Journal of Population 21, nos. 2/3 (2005): 131-44
Cheng, Benjamin, and Savior L. S. Nwachukwu. ‘The Effects of Education on Fertility in
Taiwan’. Economic Letters 56, no. 1 (1997): 95-99.
Chesnais, Jean-Claude. The Demographic Transition, Stages, Patterns and Economic
Implications. New York: Oxford University Press, 2001.
Cincotta, Richard P. ‘How Democracies Grow Up’. Foreign Policy 165 (2008): 80-82.
Cincotta, Richard P. and John Doces. ‘The Age-Structural Maturity Hypothesis: The Youth
Bulge’s Influence on the Advent and Stability of Liberal Democracy’. In Political
Demography: How Population Changes are Reshaping Security and National Politics,
ed. Jack A. Goldstone, Eric Kaufmann, and Monica D. Toft, 98-116. Basingstoke and
New York: Palgrave-MacMillan, 2012.
Coale, Ansley J. ‘How a Population Ages or Grows Younger’. In Population: The Vital
Revolution, ed. Ronald Freedman, 47-58. New York: Doubleday, 1964.
Collver, Andrew. ‘The Family Life Cycle in India and the United States’. American
Sociological Review 28, no. 1 (1963): 86-96.
Dahl, Robert D. Polyarchy: Participation and Opposition. New Haven: Yale University
Press, 1971.
Davis, Kingsley and Pietronella van den Oever. ‘Demographic Foundations of New Sex
Roles’. Population and Development Review 8, no. 3 (1982): 495-511.
Dyson, Tim. ‘On Demographic and Democratic Transitions’. Population and Development
Review 38, Supp. (2012): 83-102.
Gates, S., Håvard Hegre, Mark P. Jones and Håvard Strand. ‘Institutional Consistence and
Political Instability: Polity Duration, 1800-2000’. American Journal of Political
Science 50, no. 4 (2006): 893-908.
Goldstone, Jack A. ‘National Security and Population’. In Encyclopedia of Population, eds.
Paul Demeny and Geoffrey McNicoll, 685-88. New York: MacMillan Reference, 2003.
Hobbes, Thomas. Leviathan, or, The Matter, Forme and Power of a Commonwealth
Ecclesiastical and Civil. London: Printed for Andrew Crooke, 1651.
Huber, P. J. ‘The behavior of maximum likelihood estimates under nonstandard conditions’.
Proceedings of the Fifth Berkeley Symposium on Mathematical Statistics and
Probability, Vol. 1, 221–233. Berkeley: University of California Press. 1967.
Huntington, Samuel P. Political Order in Changing Societies. New Haven: Yale University
Press, 1968.
Inglehart, Ronald and Christian Welzel. ‘How Development Leads to Democracy’. Foreign
Affairs 88, no. 2 (2009): 33-48.
International Labour Organization. ‘Economically Active Population: Long Term Series
Estimates and Projections from 1980 to 2020’. Online data hosted by the Food and
Agriculture Organization of the United Nations and available at:
http://faostat.fao.org/site/550/default.aspx#ancor (accessed August 2014).
Keele, Luke, and Nathan J. Kelly. ‘Dynamic models for dynamic theories: The ins and outs
of lagged dependent variables’. Political analysis. 2006; 14 (2):186-205.
Kirk, Dudley. ‘Demographic Transition Theory’. Population Studies 50, no. 3 (1996): 361-
87.
Lee, Ronald D. ‘The Demographic Transition: Three Centuries of Fundamental Change’.
Journal of Economic Perspectives 17, no. 4 (2003): 167-90.
Lipset, Seymour M. Political Man. Garden City: Doubleday, 1960.
Livi-Bacci, M. A Concise History of World Population. Blackwell (fourth edition), 2007.
Londregan, John B. and Keith T. Poole. ‘Does High Income Promote Democracy?’ World
Politics 49, no.1 (1996): 1-30.
Lutz, Wolfgang, Jesús C. Cuaresma, and Mohammad J. Abbasi-Shavazi. ‘Demography,
Education and Democracy: Global Trends and the Case of Iran’. Population and
Development Review 36, no. 2 (2010): 253-81.
Lutz, Wolfgang, William P. Butz, and Samir KC. World Population and Human capital in
the Twenty-first Century. Oxford: Oxford University Press, 2014.
Maddison, Angus. Statistics on World Population, GDP and Per capita GDP, 1-2008 AD.
University of Groningen. Online data available at:
http://www.ggdc.net/MADDISON/oriindex.htm (accessed May 2013).
Marshall, Monty G. and Ted Robert Gurr. ‘Polity IV Project: Political Regime Characteristics
and Transitions, 1800-2010’. Online data available at: http://www.systemicpeace.org
(accessed February 2014).
Munck, Gerardo. L. and Jay Verkuilen. ‘Conceptualizing and Measuring Democracy’
Comparative Political Studies 35, no.1 (2002): 5-34.
Paxton, Pamela. ‘Women’s Suffrage in the Measurement of Democracy: Problems of
Operationalization’. Studies in Comparative International Development 35, no. 3
(2000): 92-111.
Preston, Samuel H. ‘Urban Growth in Developing Countries’. Population and Development
Review 5, no.2 (1979): 195-215.
Ramirez, Francisco O., Yasemin Soysal, and Suzanna Shanahan. ‘The Changing Logic of
Political Citizenship: Cross-national Acquisition of Women’s Suffrage Rights’.
American Sociological Review 62, no. 5 (1997): 735-745.
Reher, David S. ‘Economic and Social Implications of the Demographic Transition’.
Population and Development Review 37, Supp. (2011): 11-33.
Rogers, W. H. ‘Regression standard errors in clustered samples’. Stata Technical Bulletin 13:
19–23. Reprinted in Stata Technical Bulletin Reprints, vol. 3, pp. 88–94. College
Station, TX: Stata Press, 1993. sg17
United Nations. World Urbanization Prospects: The 2009 Revision. New York: United
Nations, 2010. Online data available at: http://esa.un.org/unpd/wup/ (accessed May
2013).
United Nations. World Population Prospects: The 2012 Revision. New York: United Nations,
2013. Online data available at: http://esa.un.org/wpp/ (accessed May 2013).
Urdal, Henrik. ‘A Clash of Generations? Youth Bulges and Political Violence’. International
Studies Quarterly 50, no. 3 (2006): 607-29.
Vanhanen, Tatu. ‘A New Dataset for Measuring Democracy, 1810-1998’. Journal of Peace
Research 37, no. 2 (2000): 251-65.
Vanhanen, Tatu. Democratization, A Comparative Analysis of 170 Countries. London:
Routledge, 2003.
Vanhanen, Tatu. Measures of Democracy 1810-2008. FSD1289, Version 4.0 (2009-12-14).
Tampere: Finnish Social Science Data Archive.
http://www.fsd.uta.fi/english/data/catalogue/FSD1289/ (accessed May 2013).
Weber, Hannes. ‘Demography and Democracy: The Impact of Youth Cohort Size on
Democratic Stability in the World’. Democratization 20, no. 2 (2013): 335-57.
Notes
1 Such other factors include cultural orientation, the nature of pre-existing political institutions, the degree of
social homogeneity, and external influences. 2 See, for example, Almond and Coleman, The Politics of Developing Areas; Barro, ‘Determinants of
Democracy’; Inglehart and Welzel, ‘How Development Leads to Democracy’; Lipset, Political Man. 3 See, for example, Brunborg and Tabeau. ‘Demography of Conflict and Violence’; Urdal ‘A Clash of
Generations?’; Weber ‘Demography and Democracy’; Cincotta and Doces. ‘The Age-Structural Maturity
Hypothesis’. 4 Kirk, ‘Demographic Transition Theory’, 361. 5 For more on the demographic transition see, for example, Kirk, ‘Demographic Transition Theory’; Chesnais,
The Demographic Transition. 6 Fertility decline (not mortality decline) is the cause ageing within the demographic transition, see Coale, ‘How
a population ages or grows younger’. It should be noted that the process of ageing is inevitably slow because it
involves a change in the age composition of the whole population. 7 Hobbes, Leviathan, XIII, 9. 8 See Bloom and Williamson ‘Cumulative Causality’, 172-73. 9 For life expectancy in India in 1950-55 see United Nations, World Population Prospects. 10 See Barro, ‘Determinants of Democracy’, S168-70. The difficulty of demonstrating a relationship may partly
be because mortality decline has been so pervasive. It may also be because the effect may be more important at
lower levels of life expectancy than at higher levels. 11 See Goldstone, ‘National Security’, 686. For a study of factors that threaten political stability, but which
neglects population growth, see Huntington, Political Order in Changing Societies. 12 See Preston, ‘Urban Growth’, 204. 13 See Reher, ‘Economic and Social Implications’, 15-17. 14 See Cincotta, ‘Half a Chance’, 11-12. 15 This discussion accepts the general definition of children with respect to age. Note too that by ‘population
aging’ here we are not primarily concerned with a rise in the proportion of people living at higher ages (e.g. 65
years and above). 16 See, for example, Collver ‘The Family Life Cycle’, and Davis and van den Oever ‘Demographic
Foundations’. 17 See Lee, ‘The Demographic Transition’, 167. 18 See, for example, Paxton ‘Women’s Suffrage’, and Ramirez et al., ‘The Changing Logic of Political
Citizenship’. 19 However, as noted in note 10, this effect may be diminished at higher levels of life expectancy. For example,
a rise in life expectancy from, say, 25 to 50 years may have greater influence than a rise from 50 to 75 years. 20 See, Cincotta, ‘Half a Chance’, 11; Cincotta and Doces ‘The Age-Structural Maturity Hypothesis’. 21 With reference, in particular, to when fertility declines were initiated in the period since 1950, this discussion
draws on estimates in United Nations, World Population Prospects. 22 For example, in the early 1960s such a case can be made for countries such as Nigeria, Sierra Leone, and even
Somalia. 23 See United Nations, World Population Prospects. 24 Note that the coefficients involving life expectancy in Table 2 are slightly lower than the others. This is
because demographic progress does not ensure a continuous rise in life expectancy at higher levels as, for
example, the experience of countries in the former Soviet Union attests. 25 See Vanhanen, ‘Measures of Democracy’; Marshall and Gurr, ‘Polity IV Project: Political Regime
Characteristics’. 26 See Dahl, Polyarchy. 27 The product of P and C is usually multiplied by 100. For further details, including the use of data from
referendums in calculating P, see, for example, Vanhanen, ‘Measures of Democracy’, and Vanhanen,
Democratization, 59-63. 28 For assessments of both ID and Polity IV measures see, for example, Munck and Verkuilen ‘Conceptualizing
and Measuring Democracy’, and Gates et al. ‘Institutional Consistence and Political Instability’. 29 This is reflected, for example, in relatively high ‘Democ’ scores being assigned to the United States when
slavery still existed, and to Switzerland many decades before women achieved full voting rights. 30 See, respectively, Maddison, Statistics on World Population, GDP and Per capita GDP; Barro and Lee, ‘A
New Data Set of Educational Attainment’; International Labour Organization, ‘Economically Active
Population: Long Term Series’; United Nations, World Urbanization Prospects; and United Nations, World
Population Prospects. 31 Recall that the figure of 154 related to data for 2005. However, many of the countries dropped at this stage
were either still colonies in 1970 (e.g. Mozambique, Namibia, Zimbabwe) or parts of the former Soviet Union
(e.g. Estonia, Tajikistan, Ukraine). 32 The countries excluded on this basis were: Australia, Austria, Canada, Chile, Costa Rica, Denmark, Finland,
France, India, Ireland, Israel, Italy, Japan, Mauritius, Netherlands, New Zealand, Norway, South Korea, Sri
Lanka, Sweden, United Kingdom, United States, and Uruguay. 33 The 77 countries are: Afghanistan, Albania, Algeria, Argentina, Benin, Bolivia, Botswana, Brazil, Bulgaria,
Burundi, Cambodia, Cameroon, Central African Republic, China, Colombia, Congo, Cuba, Côte d'Ivoire,
Democratic Republic of the Congo, Dominican Republic, Ecuador, Egypt, El Salvador, Gabon, Gambia, Ghana,
Greece, Guatemala, Haiti, Honduras, Hungary, Indonesia, Iran, Iraq, Jamaica, Jordan, Kenya, Kuwait, Laos,
Lesotho, Liberia, Libya, Malawi, Malaysia, Mali, Mauritania, Mexico, Mongolia, Myanmar, Nepal, Nicaragua,
Niger, Pakistan, Panama, Paraguay, Peru, Philippines, Poland, Portugal, Rwanda, Saudi Arabia, Senegal, Sierra
Leone, Singapore, South Africa, Spain, Swaziland, Switzerland, Syria, Tanzania, Thailand, Togo, Trinidad and
Tobago, Tunisia, Turkey, Uganda, and Zambia. The countries used in the Democ analysis differed from this list. 34 This approach goes some way to addressing concerns about heteroscedasticity and autocorrelation. We
estimate standard errors (and hence p-vaues) to allow for intragroup correlation, thereby relaxing the assumption
that the observations are independent. For more information see: Rogers (1993) and Huber (1967). 35 The bias has been noted briefly by Vanhanen, but with no attempt at rectification. See Vanhanen, ‘New
Dataset’, 255. 36 By way of illustration, and given the varying age structures indicated by the MA values in Table 1, in 2005-10
the value of ID is typically doubled to produce the value of AID. 37 To be precise, we added an explanatory variable that was the lag of the dependent variable for the period five
years prior to the measurement of the dependant variable. This approach may also take some account of the non-
stationary properties of the data. Although the extent to which this is true depends on whether the data are
stationary after taking first-differences. For a more detailed discussion, see: Keele and Kelly (2006). 38 Clearly, proximate mechanisms would vary between societies. One might speculate on how the features of
demographic transitions affect the characteristics of movements towards democracy (other things equal).
However, that is not attempted here. 39 See Dyson, ‘On Demographic and Democratic Transitions’. 40 Thus, as noted, democracies were often established at decolonization, and western governments have
sometimes tied development assistance to political reform. That said, democracy has also been exported through
the media and education. 41 See Lutz, Cuaresma, and Abbasi-Shavazi, ‘Demography, Education, and Democracy’. 42 See Lutz, Butz, and KC, World Population and Human Capital. 43 See Livi-Bacci, A Concise History of World Population. 44 For research suggesting that the causal link runs more from fertility to education see, Cheng and Nwachukwu,
‘The Effects of Education’. 45 See Barro, ‘Determinants of Democracy’, S159. 46 See, for example, Acemoglu et al., ‘Income and Democracy’; Londregan and Poole, ‘Does High Income’;
Lutz, Cuaresma, and Abbasi-Shavazi, ‘Demography, Education, and Democracy’. 47 See United Nations, World Population Prospects 48 For the population projections see United Nations, World Population Prospects. For the education projections
see Lutz, Butz, and KC, World Population and Human Capital.
Tables and figures
Figure 1: A stylised depiction of the demographic transition
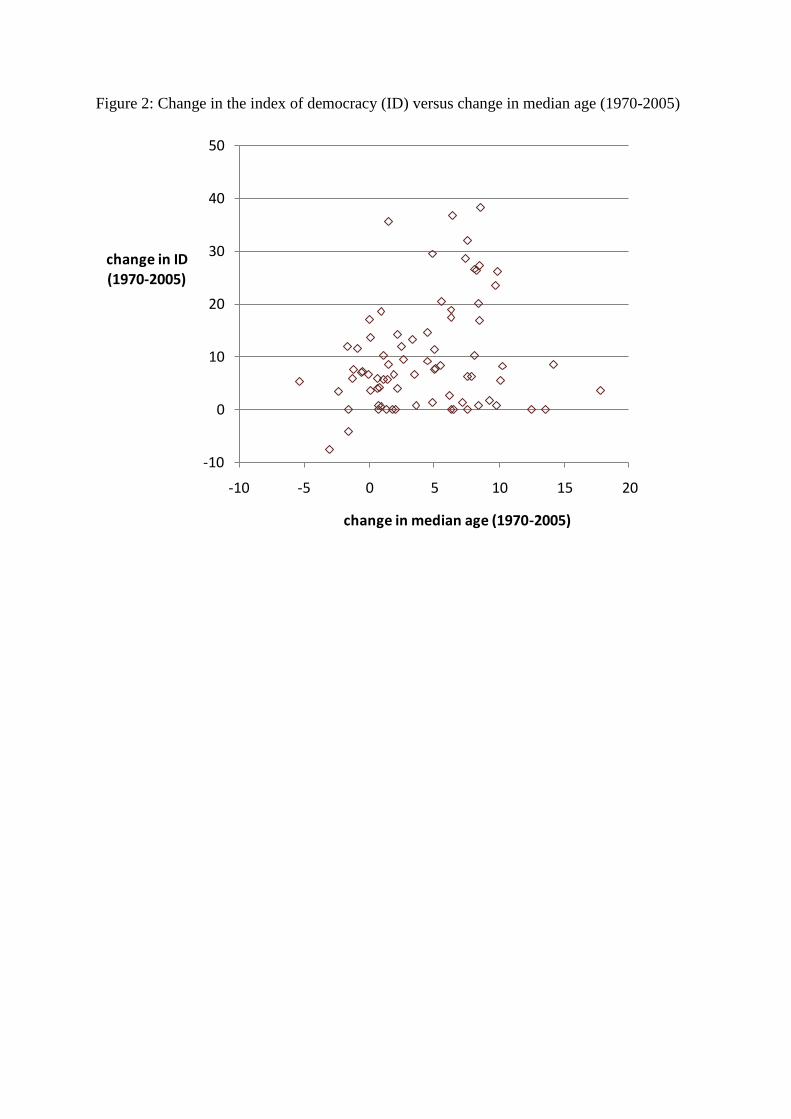
Figure 2: Change in the index of democracy (ID) versus change in median age (1970-2005)
-10
0
10
20
30
40
50
-10 -5 0 5 10 15 20
change in ID
(1970-2005)
change in median age (1970-2005)
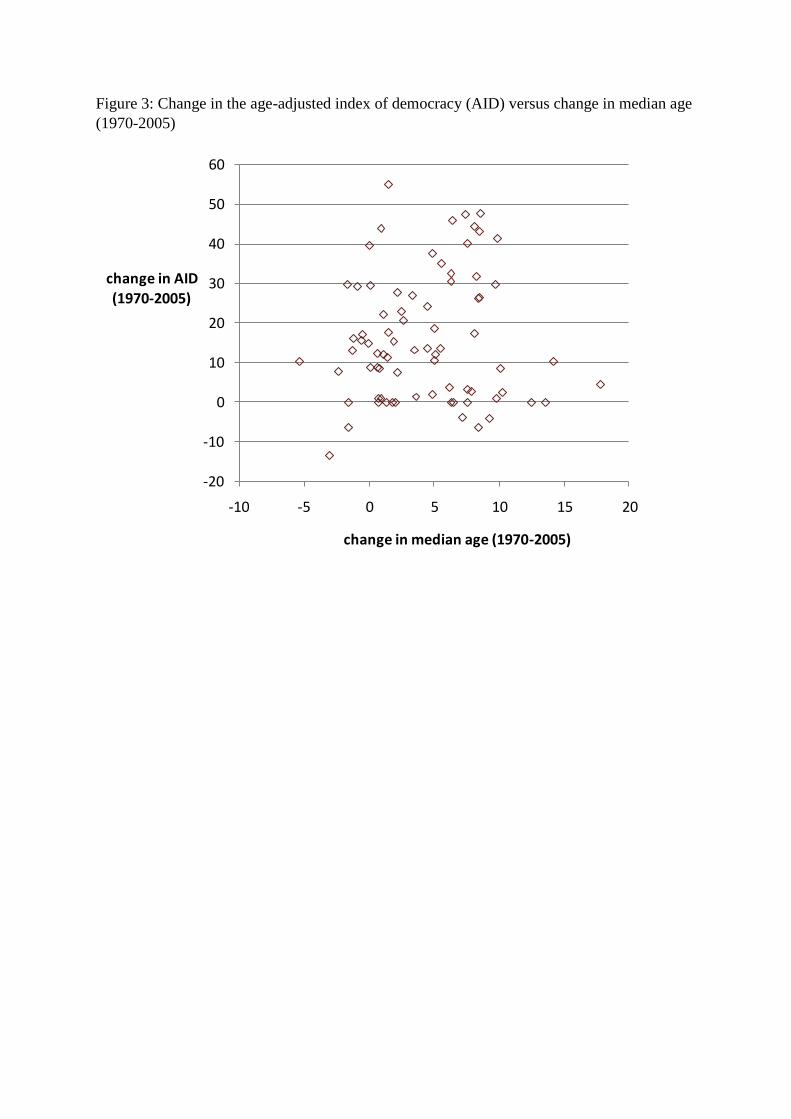
Figure 3: Change in the age-adjusted index of democracy (AID) versus change in median age
(1970-2005)
-20
-10
0
10
20
30
40
50
60
-10 -5 0 5 10 15 20
change in AID
(1970-2005)
change in median age (1970-2005)
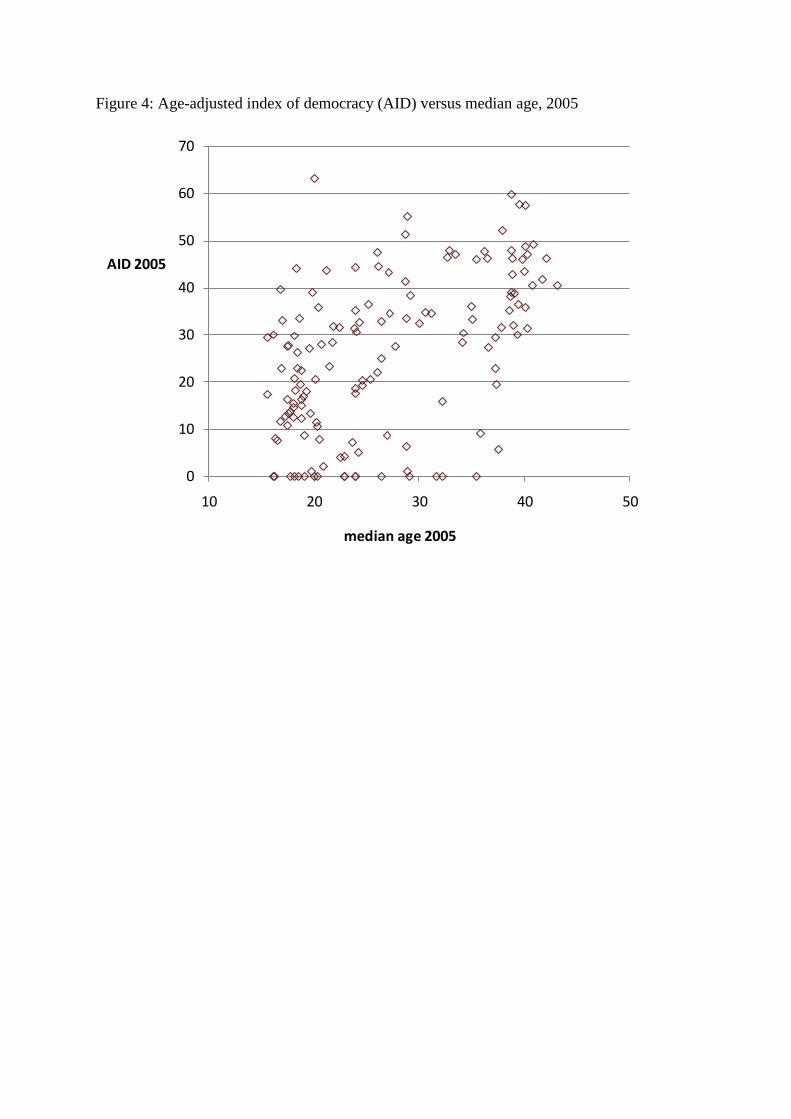
Figure 4: Age-adjusted index of democracy (AID) versus median age, 2005
0
10
20
30
40
50
60
70
10 20 30 40 50
AID 2005
median age 2005
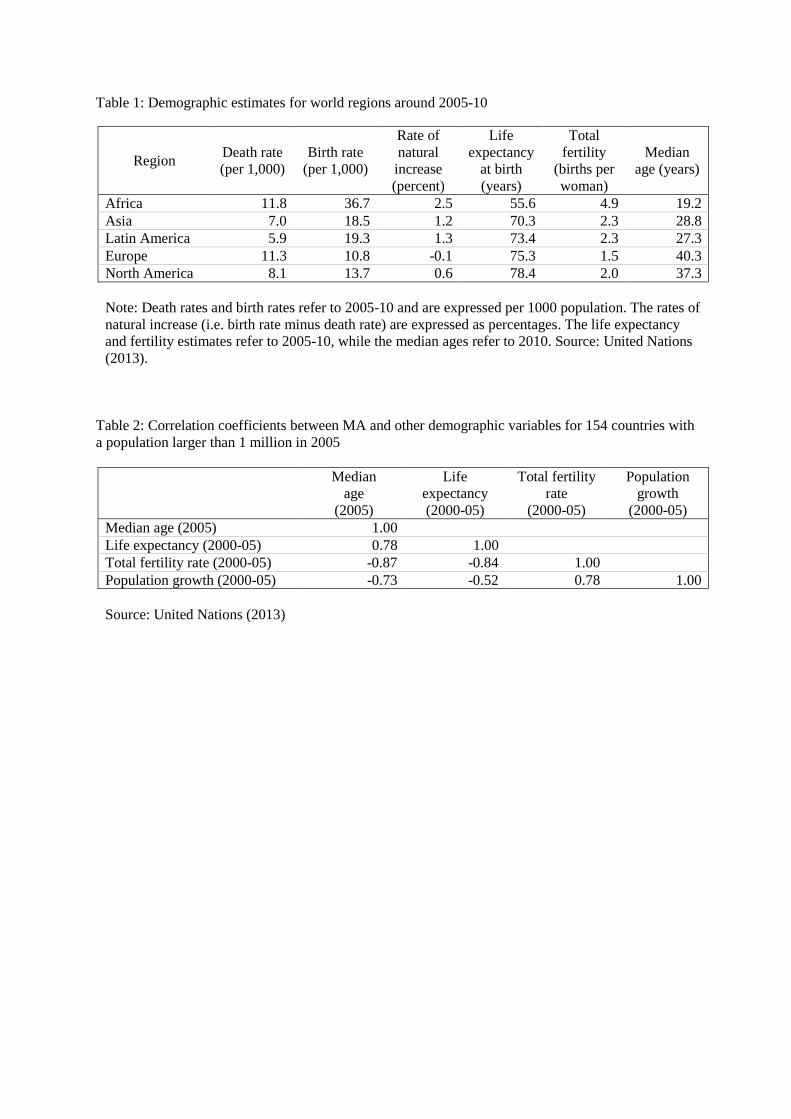
Table 1: Demographic estimates for world regions around 2005-10
Region Death rate
(per 1,000)
Birth rate
(per 1,000)
Rate of
natural
increase
(percent)
Life
expectancy
at birth
(years)
Total
fertility
(births per
woman)
Median
age (years)
Africa 11.8 36.7 2.5 55.6 4.9 19.2
Asia 7.0 18.5 1.2 70.3 2.3 28.8
Latin America 5.9 19.3 1.3 73.4 2.3 27.3
Europe 11.3 10.8 -0.1 75.3 1.5 40.3
North America 8.1 13.7 0.6 78.4 2.0 37.3
Note: Death rates and birth rates refer to 2005-10 and are expressed per 1000 population. The rates of
natural increase (i.e. birth rate minus death rate) are expressed as percentages. The life expectancy
and fertility estimates refer to 2005-10, while the median ages refer to 2010. Source: United Nations
(2013).
Table 2: Correlation coefficients between MA and other demographic variables for 154 countries with
a population larger than 1 million in 2005
Median
age
(2005)
Life
expectancy
(2000-05)
Total fertility
rate
(2000-05)
Population
growth
(2000-05)
Median age (2005) 1.00
Life expectancy (2000-05) 0.78 1.00
Total fertility rate (2000-05) -0.87 -0.84 1.00
Population growth (2000-05) -0.73 -0.52 0.78 1.00
Source: United Nations (2013)
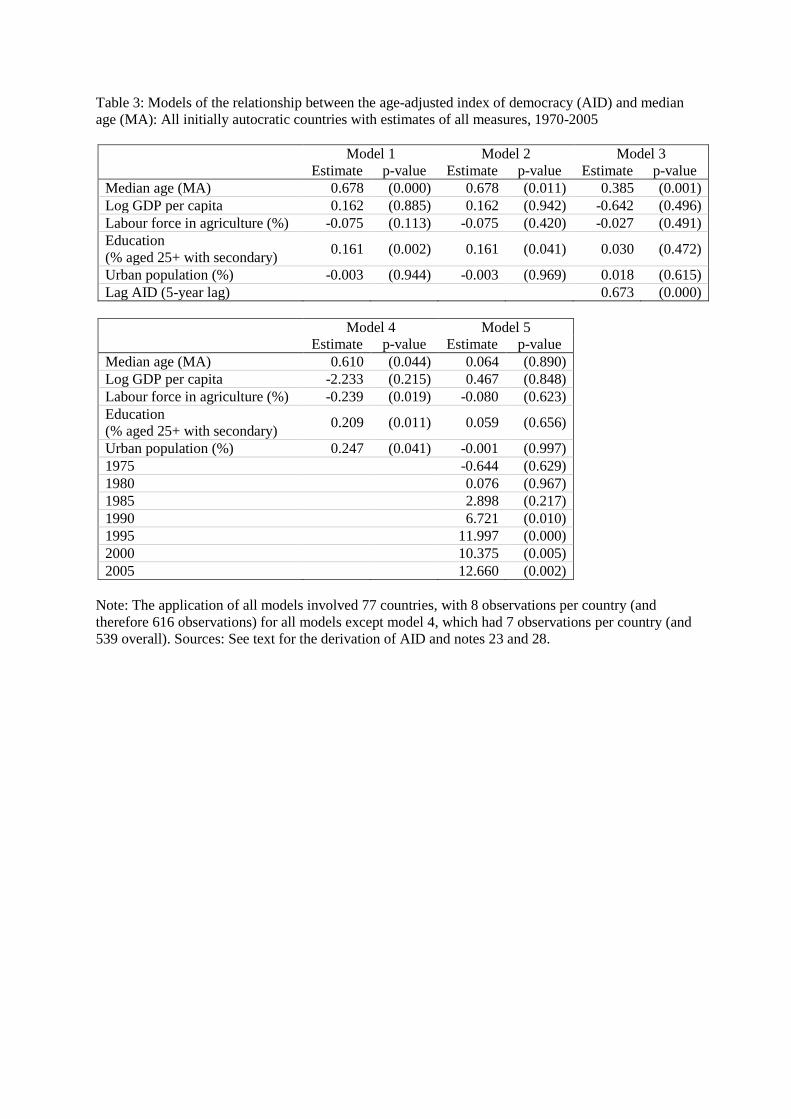
Table 3: Models of the relationship between the age-adjusted index of democracy (AID) and median
age (MA): All initially autocratic countries with estimates of all measures, 1970-2005
Model 1 Model 2 Model 3
Estimate p-value Estimate p-value Estimate p-value
Median age (MA) 0.678 (0.000) 0.678 (0.011) 0.385 (0.001)
Log GDP per capita 0.162 (0.885) 0.162 (0.942) -0.642 (0.496)
Labour force in agriculture (%) -0.075 (0.113) -0.075 (0.420) -0.027 (0.491)
Education
(% aged 25+ with secondary) 0.161 (0.002) 0.161 (0.041) 0.030 (0.472)
Urban population (%) -0.003 (0.944) -0.003 (0.969) 0.018 (0.615)
Lag AID (5-year lag) 0.673 (0.000)
Model 4 Model 5
Estimate p-value Estimate p-value
Median age (MA) 0.610 (0.044) 0.064 (0.890)
Log GDP per capita -2.233 (0.215) 0.467 (0.848)
Labour force in agriculture (%) -0.239 (0.019) -0.080 (0.623)
Education
(% aged 25+ with secondary) 0.209 (0.011) 0.059 (0.656)
Urban population (%) 0.247 (0.041) -0.001 (0.997)
1975 -0.644 (0.629)
1980 0.076 (0.967)
1985 2.898 (0.217)
1990 6.721 (0.010)
1995 11.997 (0.000)
2000 10.375 (0.005)
2005 12.660 (0.002)
Note: The application of all models involved 77 countries, with 8 observations per country (and
therefore 616 observations) for all models except model 4, which had 7 observations per country (and
539 overall). Sources: See text for the derivation of AID and notes 23 and 28.
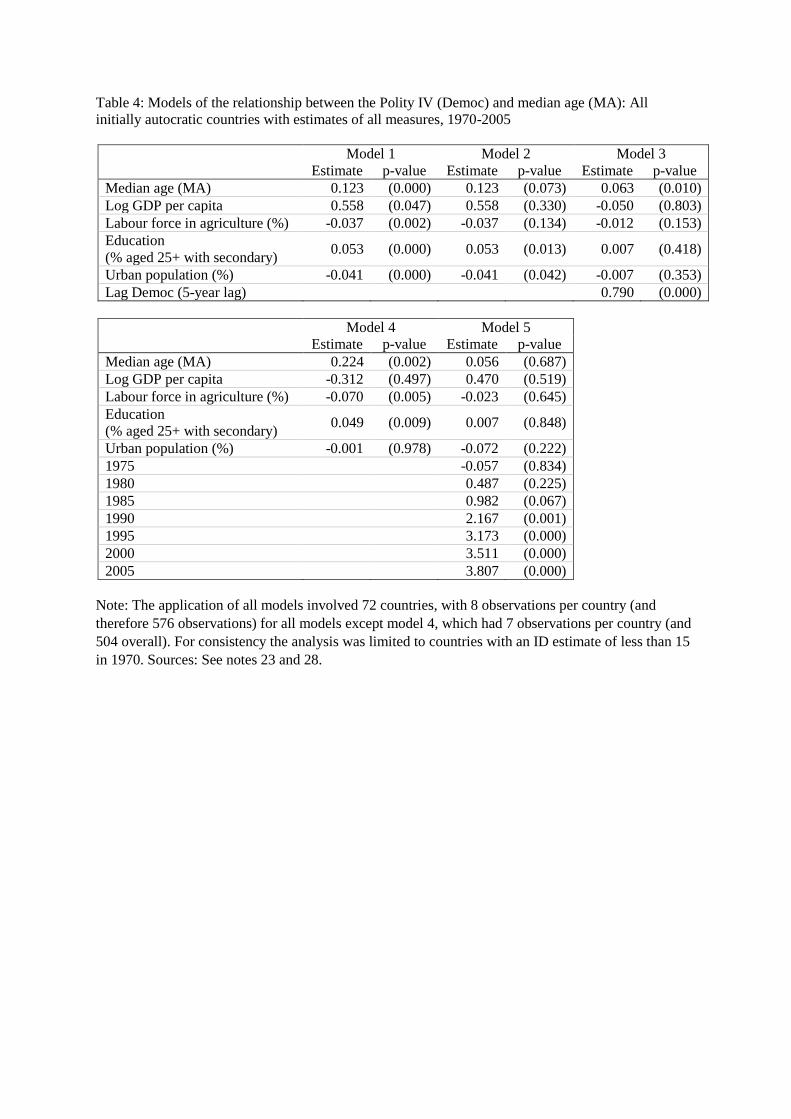
Table 4: Models of the relationship between the Polity IV (Democ) and median age (MA): All
initially autocratic countries with estimates of all measures, 1970-2005
Model 1 Model 2 Model 3
Estimate p-value Estimate p-value Estimate p-value
Median age (MA) 0.123 (0.000) 0.123 (0.073) 0.063 (0.010)
Log GDP per capita 0.558 (0.047) 0.558 (0.330) -0.050 (0.803)
Labour force in agriculture (%) -0.037 (0.002) -0.037 (0.134) -0.012 (0.153)
Education
(% aged 25+ with secondary) 0.053 (0.000) 0.053 (0.013) 0.007 (0.418)
Urban population (%) -0.041 (0.000) -0.041 (0.042) -0.007 (0.353)
Lag Democ (5-year lag) 0.790 (0.000)
Model 4 Model 5
Estimate p-value Estimate p-value
Median age (MA) 0.224 (0.002) 0.056 (0.687)
Log GDP per capita -0.312 (0.497) 0.470 (0.519)
Labour force in agriculture (%) -0.070 (0.005) -0.023 (0.645)
Education
(% aged 25+ with secondary) 0.049 (0.009) 0.007 (0.848)
Urban population (%) -0.001 (0.978) -0.072 (0.222)
1975 -0.057 (0.834)
1980 0.487 (0.225)
1985 0.982 (0.067)
1990 2.167 (0.001)
1995 3.173 (0.000)
2000 3.511 (0.000)
2005 3.807 (0.000)
Note: The application of all models involved 72 countries, with 8 observations per country (and
therefore 576 observations) for all models except model 4, which had 7 observations per country (and
504 overall). For consistency the analysis was limited to countries with an ID estimate of less than 15
in 1970. Sources: See notes 23 and 28.


![Dyson [Markets & Strategy]](https://img.pdfslide.us/doc/110x75/5873e2ba1a28abd72e8b6531/dyson-markets-strategy.jpg)