Embed Size (px)
Citation preview
Beliefs about Climate Science and Concern about Global Warming in the US Public, 2001-2010*
Aaron M. McCright
Lyman Briggs College
Department of Sociology
Environmental Science and Policy Program
Michigan State University
Aaron M. McCright is Associate Professor of Sociology in Lyman Briggs College and the Department
of Sociology at Michigan State University. His research investigates how interrelationships among
scientific developments, political processes, and social dynamics influence society’s capacity for
recognizing and dealing with environmental degradation and technological risks. His recent publications
analyze the political dynamics and public understanding of climate science and policy in the United States
and the roles of public opinion for social movements. He was named a 2007 Kavli Frontiers Fellow in
the National Academy of Sciences, and he received the 2009 Teacher-Scholar Award at MSU.
* Thanks are extended to Riley E. Dunlap and the Gallup Organization for making the data available for
analysis. Direct correspondence to: Aaron M. McCright; E-185 Holmes Hall; Lyman Briggs College;
Michigan State University; East Lansing, MI 48825-1107 ([email protected]).
INTRODUCTION
Since it first emerged on the U.S. national agenda in the late 1980s, climate change has been strongly
contested (Dunlap and McCright 2010), especially when specific policies such as the Kyoto Protocol
were being considered, and increasingly politicized. Scholarship on the politicization of climate change
examines corporate lobbying and marketing activities (e.g., Kolk and Levy 2001; Layzer 2007), the
mobilization of social movement organizations (e.g., Bryner 2008; McCright and Dunlap 2000, 2003), the
political behaviors of scientists (e.g., Lahsen 2005, 2008; McCright 2007; Oreskes and Conway 2010),
and the actions of congressional and administrative actors (Fisher 2006; McCright and Dunlap 2010).
This body of research documents political polarization between elites and organizations expressing
concern about and urging action on climate change (e.g., environmental organizations, science advocacy
organizations, and Democratic policy-makers on the Left) and those challenging such concern and
proposed action (e.g., conservative think tanks, industry associations, and Republican policy-makers on
the Right).
To date, scholars have paid less attention to the politicization of climate change within the American
public. Yet, examining this issue not only allows for an assessment of the degree to which any
observable political schisms within the mass public mirror those documented between elite actors, but
also provides an opportunity to examine the nature and drivers of public positions on climate change—
which may be crucial for developing effective responses to this global environmental problem (Dietz et
al. 2007).
Using Gallup Poll data from 2001 to 2010, I address two related questions: (1) what social, political,
and economic variables relate to individuals’ beliefs and attitudes about climate change? and (2) what are
the social, political, and economic characteristics of climate change deniers? Answering these two
questions will help us better understand the patterns and trends in public opinion on climate change
within the American public. By identifying the characteristics of those individuals more likely to accept
or deny the reality and seriousness of climate change, this paper may help future public education efforts
more effectively frame their messages to key audience segments—or, at least, identify barriers in existing
education efforts. Given the pragmatic focus of this paper and for the sake of space, I abstain from
grounding the results below within existing theoretical and conceptual models. I do, however, provide
interested readers with footnotes that briefly identify the theoretical rationale for each question.
QUESTION ONE
My first guiding question examines key variables that correlate with individuals’ beliefs and
attitudes about climate change. Given the politicization of climate change in the US in the last two
1
decades, I focus primarily on the direct and indirect effects of political orientation (e.g., political ideology
and party identification). Three sub-questions orient my analyses for the first guiding question:
1.1. To what extent do liberals/Democrats and conservatives/Republicans in the American public
differ in their beliefs and concern about global warming?1 Several studies of climate change
public opinion (e.g., Hamilton 2008; Krosnick et al. 1998; McCright 2010; Wood and Vedlitz
2007) find that political orientation influences individuals’ concern about climate change.
1.2. To what extent does political orientation moderate the effects of educational attainment and
perceived understanding on global warming beliefs and concern?2 A few studies find that higher
educational attainment and greater self-reported understanding of global warming have differing
effects on global warming beliefs and concern for conservatives and Republicans than for liberals
and Democrats (Dunlap and McCright 2008; Hamilton 2008, 2010; Hamilton and Keim 2009;
Krosnick et al. 2000; Malka et al. 2009).
1.3. Has the American public become politically polarized over global warming in recent years?3
Dunlap and McCright (2008) provide preliminary evidence of partisan polarization on climate
change from 2001 to 2008. Here I examine both partisan and ideological polarization and include
data from 2009 and 2010. The latter is critical given the recent sharp drop in public concern
about global warming documented by Gallup and other pollsters (Newport 2010).
In addition to answering these three sub-questions, I also examine the relationship between several
key social, demographic, and economic variables and individuals’ beliefs and attitudes about climate
change (1.4): environmental values/identity, gender, race, age, educational attainment, income, and
religiosity.4
1 Four decades of scholarship on the political bases of environmental attitudes, as well as evidence of elite polarization on climate change, informs the investigation of political cleavages on global warming within the general public. Research on both elites and the public finds that Democrats and especially liberals are consistently found to be more pro-environmental than their Republican and conservative counterparts (Dunlap et al. 2001). 2 Insights from two political science perspectives—the elite cues hypothesis (e.g., Krosnick et al. 2000) and information-processing theory (e.g., Wood and Vedlitz 2007)—inform this analysis. 3 Several studies find evidence of political polarization on a range of social, economic, and cultural issues within the American public in recent years (Abramowitz and Saunders 2008; Baldassarri and Gelman 2008; Brewer 2005; Evans 2003; Jacobson 2005; but see Fiorina and Abrams 2008 for a dissenting view). Political science offers the leading theoretical explanation for this recent trend in political polarization: party sorting theory (e.g., Fiorina and Abrams 2008; Layman et al 2006; see also Baldassarri and Gelman 2008), which transfers elite political polarization into the populace. 4 The analyses here build upon existing scholarship on the social bases of environmental concern and, more directly, on prior research on climate change public opinion.
2
QUESTION TWO
My second guiding question examines the social, political, demographic, and economic
characteristics of climate change deniers. Because of the mounting political and economic stakes of
dealing with climate change, proposed mitigation and adaptation efforts have provoked a significant
degree of denial—both of the reality of climate change and of its status as a problem deserving
amelioration (Dunlap and McCright 2010; McCright and Dunlap 2010). A growing body of recent
scholarship has analyzed the strategies, techniques, and effectiveness of fossil fuels (and other) industry
organizations (e.g., Freudenburg et al. 2008; Lahsen 2005; Layzer 2007), conservative think tanks (e.g.,
Lahsen 2005; McCright and Dunlap 2000, 2003; Oreskes and Conway 2010), contrarian scientists (e.g.,
Lahsen 2008; McCright 2007; McCright and Dunlap 2003; Oreskes et al. 2008), and conservative
Republican politicians (e.g., McCright and Dunlap 2003, 2010; Oreskes and Conway 2010) in promoting
climate change denial.
Casual observers of the denialist activities of fossil fuels organizations, conservative think tanks, and
various front groups likely notice an obvious pattern. With rare exceptions (e.g., Sallie Baliunas), the
most prominent denialists are conservative white males (CWMs). This is true for contrarian scientists
(e.g., Patrick Michaels and Fred Singer), media pundits (e.g., Rush Limbaugh and Glenn Beck), think
tank fellows (e.g., Joseph Bast and William O’Keefe), and politicians (e.g., Senator James Inhofe and
Representative Joe Barton). Given these dynamics, I have divided question two into two sub-questions.
2.1. Within the U.S. general public, are conservative white males more likely than other adults to
espouse climate change denial?5 Recent studies find that self-identified liberals6 (Hamilton 2008;
Wood and Vedlitz 2007), non-whites (Malka et al. 2009; Wood and Vedlitz 2007), and females
(Brody et al. 2008; Hamilton 2008; Leiserowitz 2006; Malka et al. 2009; O’Connor et al. 1999)
are more likely to express concern about global warming than are their conservative, white, and
male counterparts, respectively. The analysis presented here is considers the intersection of
political ideology, race, and gender and explicitly examine climate change denial views.
I also examine the relationship between several key social, demographic, and economic variables and
climate change denial (2.2). These analyses draw upon insights from the environmental concern and risk
perception literatures.
5 Theoretical insights from the risk perception literature and from political psychology guide this analysis. Combined insights from Kahan and colleagues’ (2007) identity-protective cognition thesis and Jost and colleagues’ (2008; Feygina et al. 2010) empirical work on the strong system justification tendencies of conservatives provide justification for expecting conservative white males to be more likely than other adults to espouse climate change denial. 6 On a related note, self-identified Democrats are more likely to express concern about global warming than are their Republican counterparts (Dunlap and McCright 2008; Hamilton 2010; Hamilton and Keim 2009; Krosnick et al. 2000; Wood and Vedlitz 2007).
3
DATA AND METHODS
My data come from the Gallup Organization’s annual environment poll, conducted each March in
anticipation of Earth Day. The ten Gallup surveys covering 2001 to 2010 are based on telephone
interviews with nationally representative samples of adults (age 18 years or older), ranging from 1000 to
1060, in the United States. For my multivariate statistical analyses, I combined the available data into
pooled samples.7 The March 2001 survey was the first to include all of the key variables employed in
this study. Also, 2001 saw the publication of the IPCC’s (2001) Third Assessment Report and the
National Research Council’s (2001) Climate Change Science. Both reports establish the current s
consensus that global warming has already begun, that human activities are a significant contributor to
global warming, and that mean global temperature will increase between 1.4 and 5.8ºC by 2100.
cientific
Table 1 provides the description, coding, mean, and standard deviation for each of the variables I
employ in the analyses. To answer my two guiding questions, I code the same global warming survey
items differently. To answer Question One, I utilize four global warming survey items. Two
dichotomous variables measure beliefs about climate science: timing of global warming (coded “1” for
“already begun to happen”) and primary cause of recent global warming (coded “1” for “effects of
pollution from human activities”). This coding distinguishes between beliefs consistent with the
scientific consensus (coded “1”) and those inconsistent with the scientific consensus (coded “0”). Two
dichotomous variables measure personal concern about global warming: worry about global warming
(coded “1” for “a great deal”) and perceived threat from global warming (coded “1” for “global warming
will pose a serious threat to you and your way of life in your lifetime”).8
To answer Question Two, I employ five dichotomous climate change denial indicators. In each case,
a higher value represents a denial belief. Two variables measure beliefs about climate science: timing of
global warming (coded “1” for “will never happen”) and primary cause of global warming (coded “1” for
“not primarily due to human activities”). Another variable measures a belief about the scientific
community: scientific consensus on global warming (coded “1” for “no scientific consensus”). Two more
variables measure personal concern about global warming: seriousness of global warming (coded “1” for
“generally exaggerated in the news”) and worry about global warming (coded “1” for “not at all”).
7 Not all of the global warming items I employ are asked every year, and thus when I used pooled samples in my analyses, the Ns vary across the dependent variables. Also, as typical for most national surveys, the Gallup Organization employs weighting procedures to ensure that its samples are representative of the American adult population. I ran all of my multivariate analyses with both weighted and unweighted data and achieved similar results. I report the results of multivariate models with unweighted data here. 8 Since Gallup poses the perceived threat item as a “yes/no” question, I dichotomized the worry variable so all of my dependent variables for Question One are dichotomous. This allows me to utilize multivariate logistic regression models for all of my analyses and simplify the presentation of results.
4
A simple measure of self-reported global warming understanding asks respondents to assess how well
they understand the issue of global warming (“not at all”=1 to “very well”=4). Also, the survey year is
measured as “2001”=1 to “2010”=10. I measure political ideology (very conservative, conservative,
middle of the road, liberal, very liberal) and party identification (Republican, lean to Republican,
Independent, lean to Democrat, Democrat) using five-point scales, with smaller numerals denoting a
conservative/Republican orientation and larger ones a liberal/Democratic orientation.
I further examine the effects of several relevant social, demographic, and economic variables
sometimes found to correlate with these global warming beliefs and attitudes: environmental movement
identity, gender, age, race, educational attainment, annual income, and religiosity. To answer Question
Two, I include three additional variables: full-time employment, parenthood, and a dummy variable to
identify conservative white males (CWMs) in the sample. These variables are coded as shown in Table 1.
To examine the moderating effect of political orientation on the associations between educational
attainment and self-reported understanding on one side and beliefs and personal concern about global
warming on the other, I created four interaction terms using centered scores9: political ideology X
educational attainment; political ideology X self-reported understanding; party identification X
educational attainment; and party identification X self-reported understanding. Finally, two additional
interaction terms allow me to examine political polarization on global warming beliefs and concern within
the American public from 2001 to 2010: political ideology X year and party identification X year.
QUESTION ONE
My first guiding question examines whether key political, social, demographic, and economic
variables correlate with individuals’ beliefs and attitudes about climate change. Given the politicization
of climate change in the US in the last two decades, I focus primarily on the direct and indirect effects of
political orientation (e.g., political ideology and party identification). The results below provide strong
evidence that the long-term divide over global warming between elites and organizations on the Left and
the Right has in recent years emerged within the general public as well.
1.1. To what extent do liberals/Democrats and conservatives/Republicans in the American public
differ in their beliefs and concern about global warming?
Figure 1 illustrates the ideological and partisan divide on Americans’ beliefs about climate science
(1A and 1B) and concern about global warming (1C and 1D) between 2001 and 2010, using pooled data.
9 Utilizing higher-order (e.g., interaction) terms in regression models often leads to multicollinearity problems. Since interaction terms based on centered scores have a different scale than the original variables, these multicollinearity problems are reduced (e.g., Aiken et al. 1991).
5
For each of the four quadrants of this figure, the solid bars on the left (political ideology) and the dashed
bars on the right (party identification) represent the percentages of Americans reporting beliefs consistent
with the scientific consensus (1A and 1B) and the percentages reporting a high level of concern about
global warming (1C and 1D).
—Figure 1 about here—
Looking at the upper left quadrant (1A), we see that moving from the left to the right of the political
spectrum (for both political ideology and party identification) decreases the likelihood of believing the
effects of global warming have already begun to happen. This clear pattern can also be seen in the other
three quadrants. Generally, moving from the left to the right of the political spectrum decreases the
likelihood of holding a belief consistent with the scientific consensus and of expressing great concern
about global warming.
Tables 2 and 3 report the results of several multivariate logistic regression models explaining beliefs
about climate science (Table 2) and personal concern about global warming (Table 3). Models 1 and 4 in
Table 2 explain Americans’ beliefs about the current existence and the primary human cause of global
warming respectively, and Models 7 and 10 in Table 3 explain Americans’ levels of worry and perceived
threat from global warming respectively. Each of these four models contains political ideology and party
identification as explanatory variables, as well as nine other relevant social, demographic, economic, and
temporal variables.
—Table 2 about here—
The political ideology and party identification coefficients are statistically significant and positive in
each of the four models of interest. Moving from the right to the left along the political spectrum
increases respondents’ likelihood of reporting beliefs consistent with the scientific consensus (Models 1
and 4 in Table 2) and of expressing personal concern about global warming (Models 7 and 10 in Table 3).
These patterns persist even when controlling for a range of relevant variables that are expected to
correlate with global warming beliefs and concern. Indeed, political ideology has the expected effect
even controlling for party identification, and vice versa.
—Table 3 about here—
Before answering question 1.2, I highlight the direct effects of year, educational attainment, and self-
reported understanding since these variables are used below in analyses of interaction effects. Between
2001 and 2010, the percentage of Americans believing that global warming is already happening
generally trended upward from 2001 (54.3%) to 2008 (60.8%), but the recent sharp decline (to 50.1% in
2010) eliminated the monotonic effect of year. The percentage believing that recent warming is primarily
caused by human activities generally decreased over the time period (from 61.0% in 2001 to 49.9% in
2010). The percentage of Americans worrying a great deal about global warming fluctuated over the time
6
period, from a low of 25.8% in 2004 to a high of 41.2% in 2007, with no monotonic effect for year. The
increase in the percentage seeing global warming as a serious threat between 2001 (31.3%) and 2008
(40.3%) was sufficiently strong to produce a statistically significant positive effect for year, even though
the percentage dropped down to 31.6% in 2010.
Like past studies, I find educational attainment to have mixed effects on global warming beliefs and
concern. Greater education increases the likelihood of believing that global warming has already begun
(Model 1 in Table 2), but it has no effect on Americans’ belief about the primary cause of recent warming
(Model 4). Some studies find that education is negatively associated with concern about global warming
(Malka et al. 2009; O’Connor et al. 1999; Wood and Vedlitz 2007), while at least one study finds
education to be positively associated with such concern (Hamilton 2008).10 The statistically significant
negative coefficient for educational attainment in Model 7 validates the results of past studies finding a
negative association between education and concern, while the non-significant coefficient in Model 10
does not. The inconsistent findings for education across studies likely stem from variation in the
measures of global warming beliefs and concern they employ.
Finally, individuals self-reporting greater understanding of global warming are more likely to report
beliefs consistent with the scientific consensus (Models 1 and 4) and express great personal concern about
global warming (Models 7 and 10) than are those reporting lesser understanding. The positive effect of
understanding on concern about global warming supports the results of Wood and Vedlitz (2007) and
challenges those of Kellstedt et al. (2008) and Malka et al. (2009). As with education, these differences
are likely due to variation in the measurement of these concepts across these studies.
1.2. To what extent does political orientation moderate the effects of educational attainment and
perceived understanding on global warming beliefs and concern?
Since the early 1990s a bifurcated flow of information has existed for the issue of global warming.
The scientific community, environmental movement, and Democratic Party leaders present information
that global warming is problematic and already occurring, while climate change contrarians, conservative
think tanks and pundits, and the Republican Party leaders challenge these claims. The cacophony of
competing voices on this issue not only creates the appearance of ambiguity (Boykoff and Boykoff 2004),
but also provides liberals/Democrats and conservatives/Republicans in the general public ample
opportunity to select information primarily from those respective sources they most trust.
New information on climate change (e.g., an IPCC report) is thus unlikely to reduce the political
divide. Instead, citizens’ political orientations filter such learning opportunities in ways that magnify this
10 Hamilton (2008) finds that two test-based measures—a “polar quiz” and a science literacy index—also correlate positively with concern about global warming.
7
divide. Political elites and media outlets selectively interpret or ignore new climate change studies and
news stories to promote their political and economic agendas. Citizens, in turn, listen to their favored
elites and media sources (Iyengar and Hahn 2009), where global warming information is framed in a
manner consistent with their pre-existing beliefs on the issue (Hindman 2009). My results indicate that
this may have occurred within the American public between 2001 and 2010.
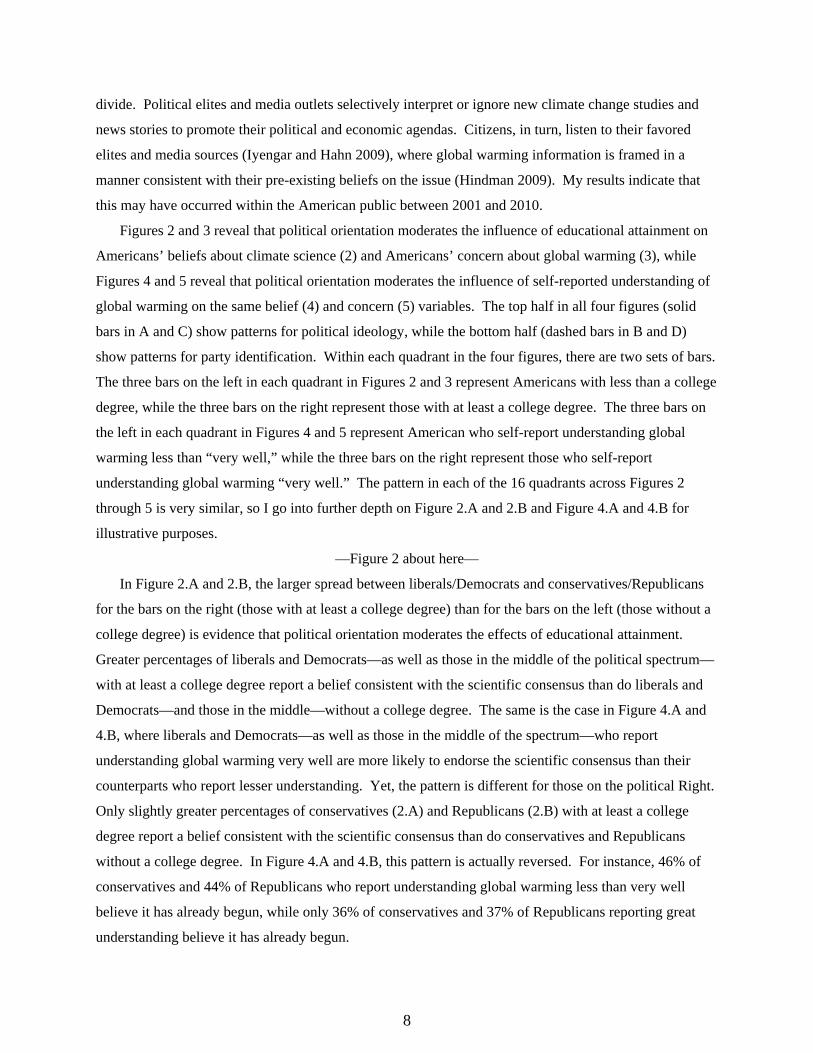
Figures 2 and 3 reveal that political orientation moderates the influence of educational attainment on
Americans’ beliefs about climate science (2) and Americans’ concern about global warming (3), while
Figures 4 and 5 reveal that political orientation moderates the influence of self-reported understanding of
global warming on the same belief (4) and concern (5) variables. The top half in all four figures (solid
bars in A and C) show patterns for political ideology, while the bottom half (dashed bars in B and D)
show patterns for party identification. Within each quadrant in the four figures, there are two sets of bars.
The three bars on the left in each quadrant in Figures 2 and 3 represent Americans with less than a college
degree, while the three bars on the right represent those with at least a college degree. The three bars on
the left in each quadrant in Figures 4 and 5 represent American who self-report understanding global
warming less than “very well,” while the three bars on the right represent those who self-report
understanding global warming “very well.” The pattern in each of the 16 quadrants across Figures 2
through 5 is very similar, so I go into further depth on Figure 2.A and 2.B and Figure 4.A and 4.B for
illustrative purposes.
—Figure 2 about here—
In Figure 2.A and 2.B, the larger spread between liberals/Democrats and conservatives/Republicans
for the bars on the right (those with at least a college degree) than for the bars on the left (those without a
college degree) is evidence that political orientation moderates the effects of educational attainment.
Greater percentages of liberals and Democrats—as well as those in the middle of the political spectrum—
with at least a college degree report a belief consistent with the scientific consensus than do liberals and
Democrats—and those in the middle—without a college degree. The same is the case in Figure 4.A and
4.B, where liberals and Democrats—as well as those in the middle of the spectrum—who report
understanding global warming very well are more likely to endorse the scientific consensus than their
counterparts who report lesser understanding. Yet, the pattern is different for those on the political Right.
Only slightly greater percentages of conservatives (2.A) and Republicans (2.B) with at least a college
degree report a belief consistent with the scientific consensus than do conservatives and Republicans
without a college degree. In Figure 4.A and 4.B, this pattern is actually reversed. For instance, 46% of
conservatives and 44% of Republicans who report understanding global warming less than very well
believe it has already begun, while only 36% of conservatives and 37% of Republicans reporting great
understanding believe it has already begun.
8
—Figure 3 about here—
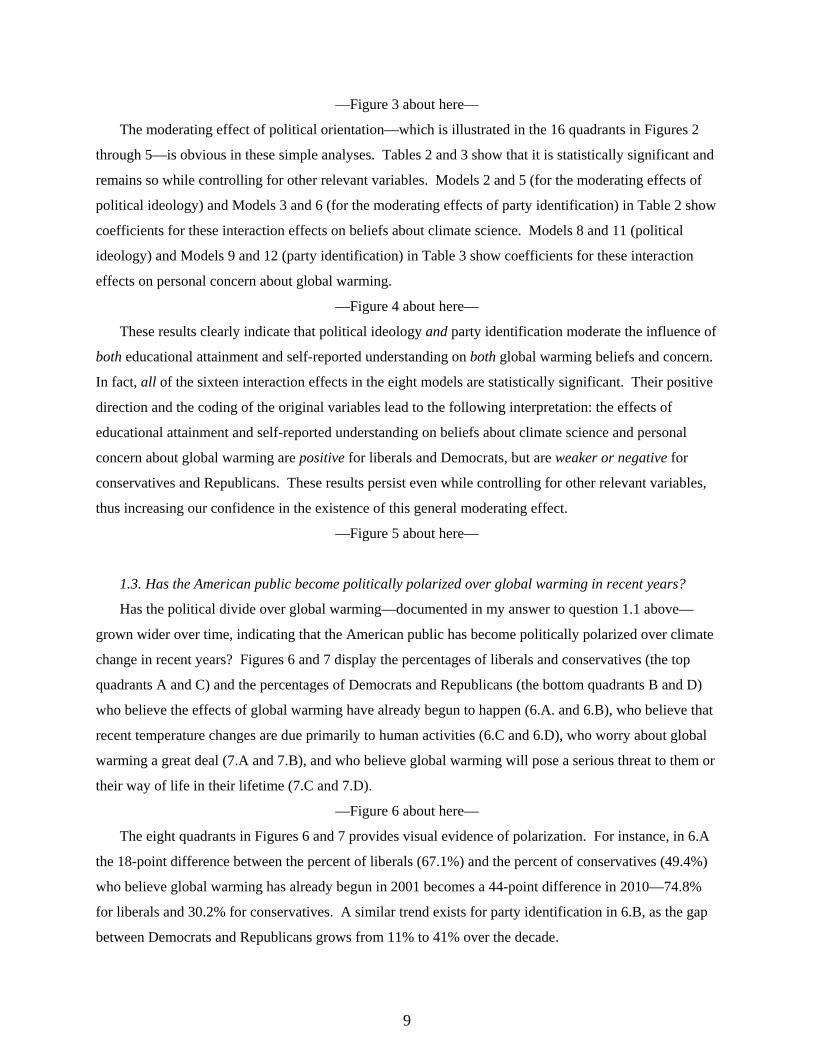
The moderating effect of political orientation—which is illustrated in the 16 quadrants in Figures 2
through 5—is obvious in these simple analyses. Tables 2 and 3 show that it is statistically significant and
remains so while controlling for other relevant variables. Models 2 and 5 (for the moderating effects of
political ideology) and Models 3 and 6 (for the moderating effects of party identification) in Table 2 show
coefficients for these interaction effects on beliefs about climate science. Models 8 and 11 (political
ideology) and Models 9 and 12 (party identification) in Table 3 show coefficients for these interaction
effects on personal concern about global warming.
—Figure 4 about here—
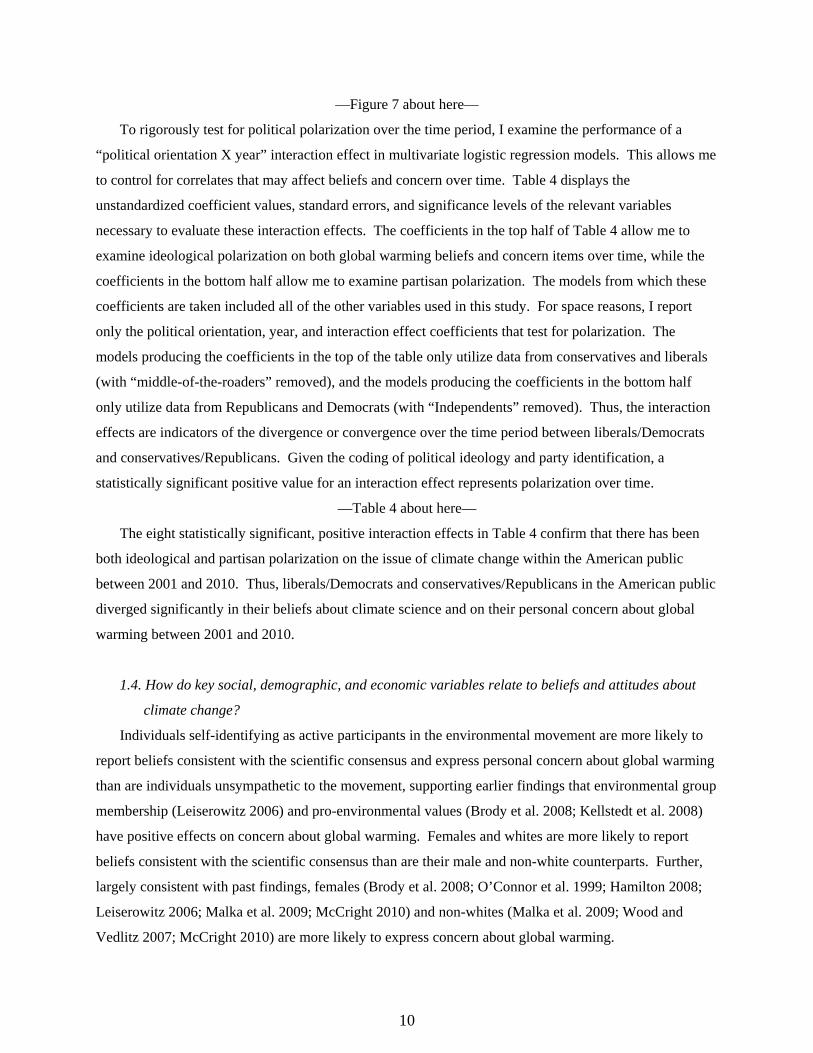
These results clearly indicate that political ideology and party identification moderate the influence of
both educational attainment and self-reported understanding on both global warming beliefs and concern.
In fact, all of the sixteen interaction effects in the eight models are statistically significant. Their positive
direction and the coding of the original variables lead to the following interpretation: the effects of
educational attainment and self-reported understanding on beliefs about climate science and personal
concern about global warming are positive for liberals and Democrats, but are weaker or negative for
conservatives and Republicans. These results persist even while controlling for other relevant variables,
thus increasing our confidence in the existence of this general moderating effect.
—Figure 5 about here—
1.3. Has the American public become politically polarized over global warming in recent years?
Has the political divide over global warming—documented in my answer to question 1.1 above—
grown wider over time, indicating that the American public has become politically polarized over climate
change in recent years? Figures 6 and 7 display the percentages of liberals and conservatives (the top
quadrants A and C) and the percentages of Democrats and Republicans (the bottom quadrants B and D)
who believe the effects of global warming have already begun to happen (6.A. and 6.B), who believe that
recent temperature changes are due primarily to human activities (6.C and 6.D), who worry about global
warming a great deal (7.A and 7.B), and who believe global warming will pose a serious threat to them or
their way of life in their lifetime (7.C and 7.D).
—Figure 6 about here—
The eight quadrants in Figures 6 and 7 provides visual evidence of polarization. For instance, in 6.A
the 18-point difference between the percent of liberals (67.1%) and the percent of conservatives (49.4%)
who believe global warming has already begun in 2001 becomes a 44-point difference in 2010—74.8%
for liberals and 30.2% for conservatives. A similar trend exists for party identification in 6.B, as the gap
between Democrats and Republicans grows from 11% to 41% over the decade.
9
—Figure 7 about here—
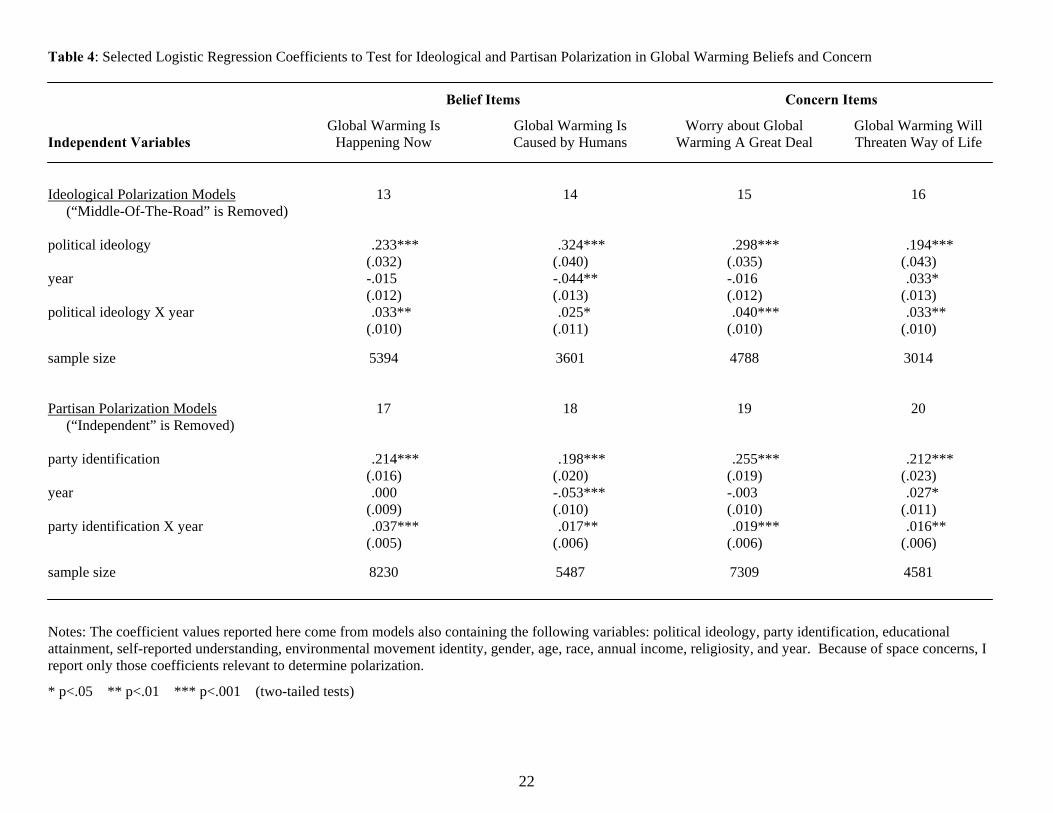
To rigorously test for political polarization over the time period, I examine the performance of a
“political orientation X year” interaction effect in multivariate logistic regression models. This allows me
to control for correlates that may affect beliefs and concern over time. Table 4 displays the
unstandardized coefficient values, standard errors, and significance levels of the relevant variables
necessary to evaluate these interaction effects. The coefficients in the top half of Table 4 allow me to
examine ideological polarization on both global warming beliefs and concern items over time, while the
coefficients in the bottom half allow me to examine partisan polarization. The models from which these
coefficients are taken included all of the other variables used in this study. For space reasons, I report
only the political orientation, year, and interaction effect coefficients that test for polarization. The
models producing the coefficients in the top of the table only utilize data from conservatives and liberals
(with “middle-of-the-roaders” removed), and the models producing the coefficients in the bottom half
only utilize data from Republicans and Democrats (with “Independents” removed). Thus, the interaction
effects are indicators of the divergence or convergence over the time period between liberals/Democrats
and conservatives/Republicans. Given the coding of political ideology and party identification, a
statistically significant positive value for an interaction effect represents polarization over time.
—Table 4 about here—
The eight statistically significant, positive interaction effects in Table 4 confirm that there has been
both ideological and partisan polarization on the issue of climate change within the American public
between 2001 and 2010. Thus, liberals/Democrats and conservatives/Republicans in the American public
diverged significantly in their beliefs about climate science and on their personal concern about global
warming between 2001 and 2010.
1.4. How do key social, demographic, and economic variables relate to beliefs and attitudes about
climate change?
Individuals self-identifying as active participants in the environmental movement are more likely to
report beliefs consistent with the scientific consensus and express personal concern about global warming
than are individuals unsympathetic to the movement, supporting earlier findings that environmental group
membership (Leiserowitz 2006) and pro-environmental values (Brody et al. 2008; Kellstedt et al. 2008)
have positive effects on concern about global warming. Females and whites are more likely to report
beliefs consistent with the scientific consensus than are their male and non-white counterparts. Further,
largely consistent with past findings, females (Brody et al. 2008; O’Connor et al. 1999; Hamilton 2008;
Leiserowitz 2006; Malka et al. 2009; McCright 2010) and non-whites (Malka et al. 2009; Wood and
Vedlitz 2007; McCright 2010) are more likely to express concern about global warming.
10
Younger adults are more likely to report beliefs consistent with the scientific consensus than are older
adults, and they are more likely to perceive global warming to be a threat to them or their way of life than
are older adults. Yet, age has no statistically significant effect on how much people worry about global
warming. Higher income increases the likelihood of believing that global warming is happening now
(though not that it is human caused); yet, income is negatively related to concern, confirming the results
of O’Connor and colleagues (1999). More religious adults are less likely to report beliefs consistent with
the scientific consensus than are their less religious counterparts. Religiosity has no significant effect on
people’s perceived threat of global warming—consistent with Kellstedt et al. (2008)—but it does have a
weak, negative effect on people’s worry about global warming.
QUESTION TWO
My second guiding question examines the political, social, demographic, and economic
characteristics of climate change deniers. The results below provide strong evidence that conservative
white males (and especially those conservative white males who report understanding global warming
very well) are more likely than other adults to express climate change denial. In addition, party
identification, religiosity, and environmental movement identity are consistent correlates with climate
change denial, with Republicans, highly religious adults, and individuals unsympathetic to the
environmental movement more likely to express climate change denial than their Democratic, less
religious, and pro-environmental counterparts respectively.
2.1. Within the U.S. general public, are conservative white males more likely than other adults to
espouse climate change denial?
The top half of Table 5 reports the percents of conservative white males (CWMs) and all other adults
espousing climate change denial beliefs for each of my five denial indicators. Across the five items,
greater percentages of CWMs than of all other adults report denialist views. For instance, while 29.6% of
CWMs believe that the effects of global warming will never happen, only 7.4% of all other adults believe
so. Also, 58.5% of CWMs but only 31.5% of all other adults deny that recent temperature increases are
primarily caused by human activities. The pattern for these first two items demonstrates that CWMs are
more likely than other adults to reject the scientific consensus on climate change. Indeed, the pattern for
the third item indicates that CWMs are more likely than other adults to deny the existence of a scientific
consensus (58.8% and 35.5% respectively). Further, slightly more than twice as many CWMs (65.1%)
than all other adults (29.9%) believe that the seriousness of global warming is exaggerated in the media.
Finally, 39.1% of CWMs but only 14.4% of all other adults do not worry at all about global warming.
The Gamma values for the relationship between the CWM dummy variable and each of the five climate
11
change denial indicators are moderately strong—ranging from .444 to .681. This is initial, but
compelling, evidence that CWMs have an affinity with climate change denial in the American public.
—Table 5 about here—
The bottom row in the top half of Table 5 shows that a greater percentage of CWMs (30.4%) than of
all other adults (18.0%) report they understand global warming very well. The relatively modest Gamma
value (.277) for the relationship between the CWM dummy variable and the full self-reported
understanding variable (“not at all” to “very well”) indicates that CWMs tend to perceive greater
understanding of global warming than do other adults. This, of course, seems an untenable self-
assessment, given that CWMs are more likely than are other adults to reject the current scientific
consensus. Yet, this pattern—where CWMs are more confident in their beliefs about climate change than
are other adults, even as their beliefs conflict with the scientific consensus—is quite clear.
To further explore the association between confidence and denial, I extended my analyses that I
reported in the top part of Table 5. Briefly, I created a new dummy variable—termed “confident
conservative white males”—to identify those CWMs who self-report understanding global warming very
well. The baseline category for this variable includes not only all adults who are not CWMs but also all
CWMs who self-report understanding less than very well. I replicated my comparisons with this new
dummy variable, and the results are reported in the bottom part of Table 5. Compared to their respective
counterparts in the top part of Table 5, each of the Gamma values in the bottom part of the table are
stronger. In other words, the relationship between CWM status and climate change denial is stronger
among those who are most confident in their understanding of global warming.
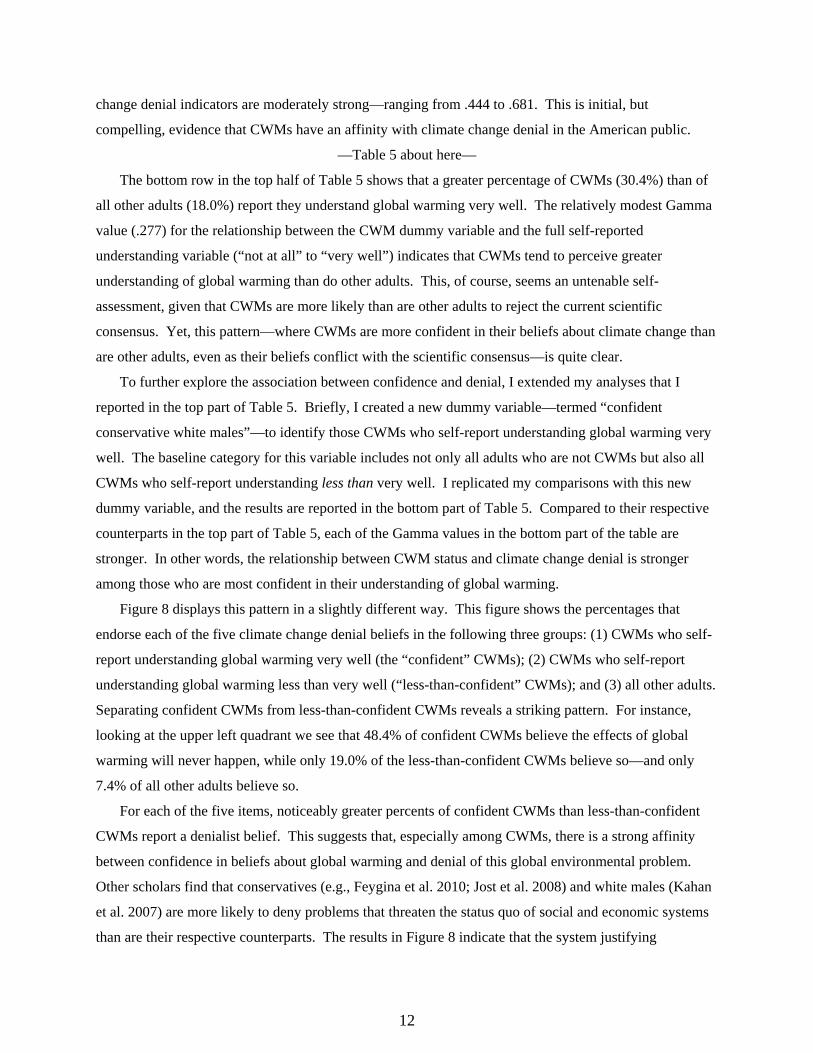
Figure 8 displays this pattern in a slightly different way. This figure shows the percentages that
endorse each of the five climate change denial beliefs in the following three groups: (1) CWMs who self-
report understanding global warming very well (the “confident” CWMs); (2) CWMs who self-report
understanding global warming less than very well (“less-than-confident” CWMs); and (3) all other adults.
Separating confident CWMs from less-than-confident CWMs reveals a striking pattern. For instance,
looking at the upper left quadrant we see that 48.4% of confident CWMs believe the effects of global
warming will never happen, while only 19.0% of the less-than-confident CWMs believe so—and only
7.4% of all other adults believe so.
For each of the five items, noticeably greater percents of confident CWMs than less-than-confident
CWMs report a denialist belief. This suggests that, especially among CWMs, there is a strong affinity
between confidence in beliefs about global warming and denial of this global environmental problem.
Other scholars find that conservatives (e.g., Feygina et al. 2010; Jost et al. 2008) and white males (Kahan
et al. 2007) are more likely to deny problems that threaten the status quo of social and economic systems
than are their respective counterparts. The results in Figure 8 indicate that the system justifying
12
tendencies of some CWMs are especially strong in the face of the threats that global warming poses to our
existing social and economic systems. These CWMs who think they understand global warming very
well are quite likely to deny its reality and seriousness.
—Figure 8 about here—
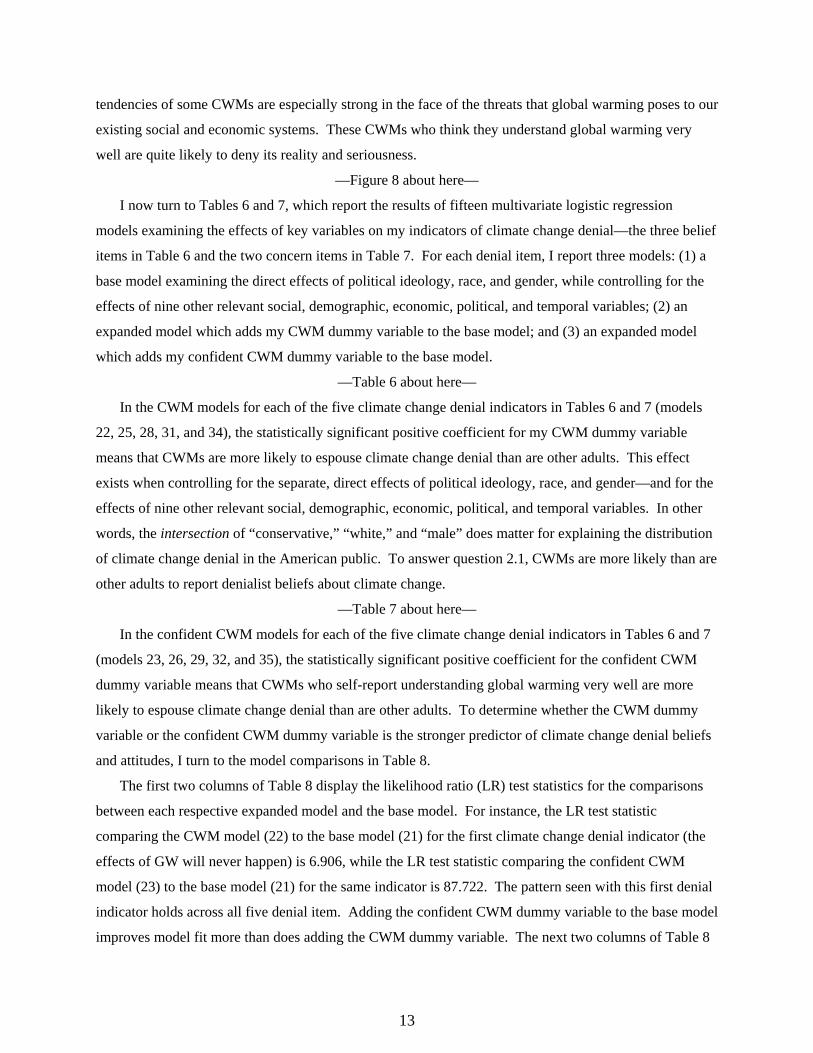
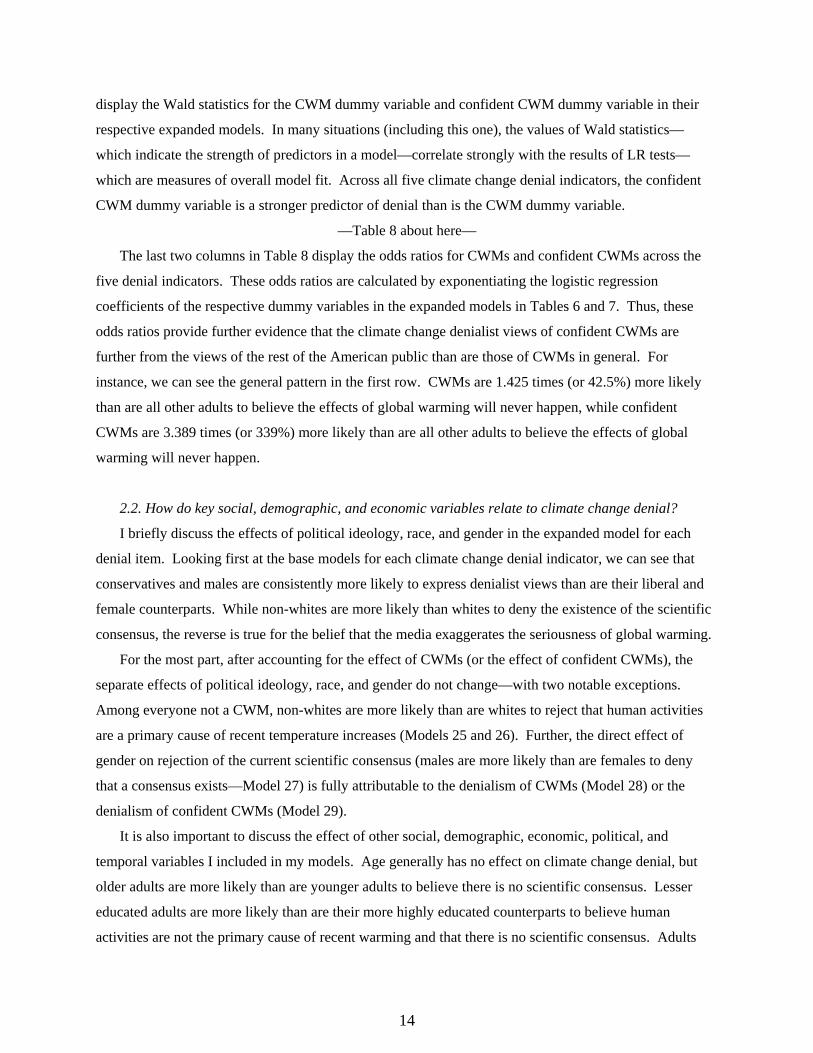
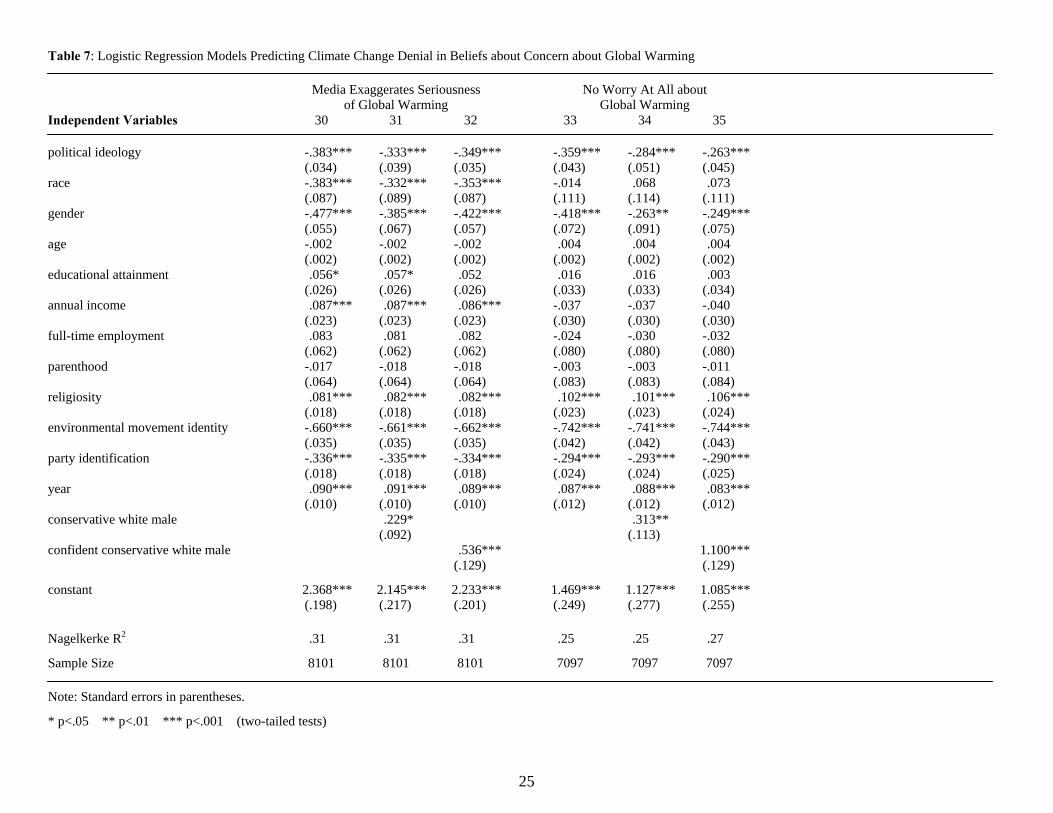
I now turn to Tables 6 and 7, which report the results of fifteen multivariate logistic regression
models examining the effects of key variables on my indicators of climate change denial—the three belief
items in Table 6 and the two concern items in Table 7. For each denial item, I report three models: (1) a
base model examining the direct effects of political ideology, race, and gender, while controlling for the
effects of nine other relevant social, demographic, economic, political, and temporal variables; (2) an
expanded model which adds my CWM dummy variable to the base model; and (3) an expanded model
which adds my confident CWM dummy variable to the base model.
—Table 6 about here—
In the CWM models for each of the five climate change denial indicators in Tables 6 and 7 (models
22, 25, 28, 31, and 34), the statistically significant positive coefficient for my CWM dummy variable
means that CWMs are more likely to espouse climate change denial than are other adults. This effect
exists when controlling for the separate, direct effects of political ideology, race, and gender—and for the
effects of nine other relevant social, demographic, economic, political, and temporal variables. In other
words, the intersection of “conservative,” “white,” and “male” does matter for explaining the distribution
of climate change denial in the American public. To answer question 2.1, CWMs are more likely than are
other adults to report denialist beliefs about climate change.
—Table 7 about here—
In the confident CWM models for each of the five climate change denial indicators in Tables 6 and 7
(models 23, 26, 29, 32, and 35), the statistically significant positive coefficient for the confident CWM
dummy variable means that CWMs who self-report understanding global warming very well are more
likely to espouse climate change denial than are other adults. To determine whether the CWM dummy
variable or the confident CWM dummy variable is the stronger predictor of climate change denial beliefs
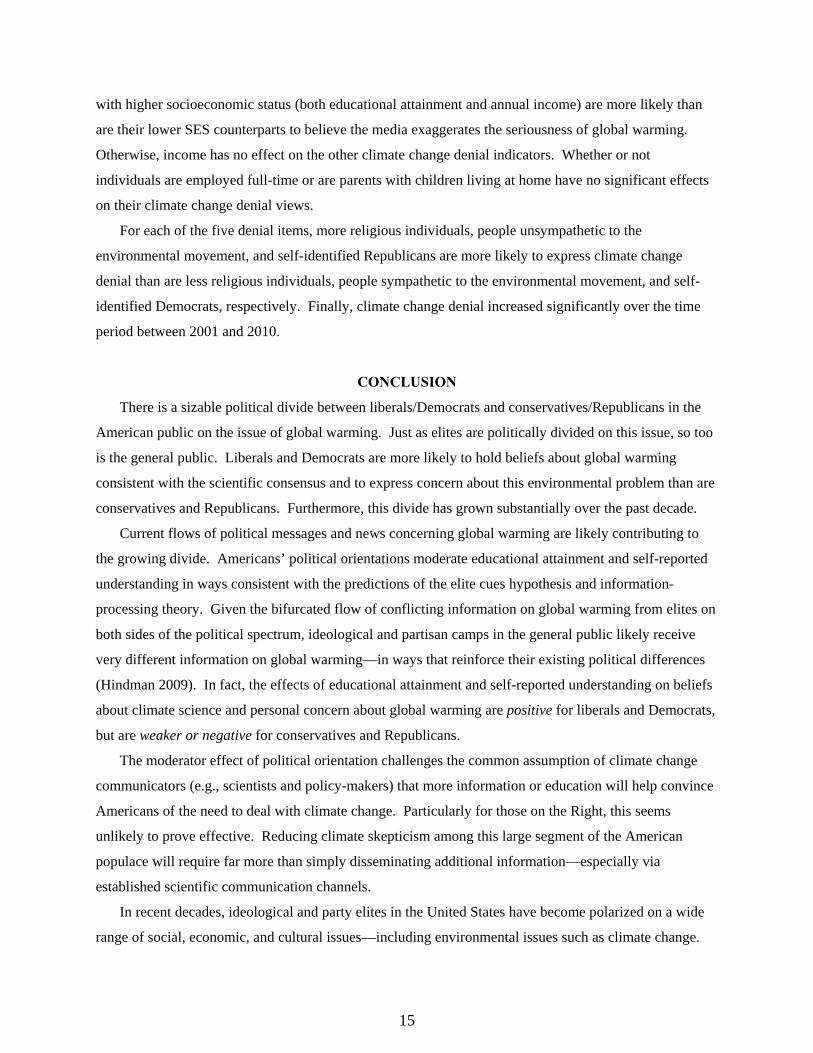
and attitudes, I turn to the model comparisons in Table 8.
The first two columns of Table 8 display the likelihood ratio (LR) test statistics for the comparisons
between each respective expanded model and the base model. For instance, the LR test statistic
comparing the CWM model (22) to the base model (21) for the first climate change denial indicator (the
effects of GW will never happen) is 6.906, while the LR test statistic comparing the confident CWM
model (23) to the base model (21) for the same indicator is 87.722. The pattern seen with this first denial
indicator holds across all five denial item. Adding the confident CWM dummy variable to the base model
improves model fit more than does adding the CWM dummy variable. The next two columns of Table 8
13
display the Wald statistics for the CWM dummy variable and confident CWM dummy variable in their
respective expanded models. In many situations (including this one), the values of Wald statistics—
which indicate the strength of predictors in a model—correlate strongly with the results of LR tests—
which are measures of overall model fit. Across all five climate change denial indicators, the confident
CWM dummy variable is a stronger predictor of denial than is the CWM dummy variable.
—Table 8 about here—
The last two columns in Table 8 display the odds ratios for CWMs and confident CWMs across the
five denial indicators. These odds ratios are calculated by exponentiating the logistic regression
coefficients of the respective dummy variables in the expanded models in Tables 6 and 7. Thus, these
odds ratios provide further evidence that the climate change denialist views of confident CWMs are
further from the views of the rest of the American public than are those of CWMs in general. For
instance, we can see the general pattern in the first row. CWMs are 1.425 times (or 42.5%) more likely
than are all other adults to believe the effects of global warming will never happen, while confident
CWMs are 3.389 times (or 339%) more likely than are all other adults to believe the effects of global
warming will never happen.
2.2. How do key social, demographic, and economic variables relate to climate change denial?
I briefly discuss the effects of political ideology, race, and gender in the expanded model for each
denial item. Looking first at the base models for each climate change denial indicator, we can see that
conservatives and males are consistently more likely to express denialist views than are their liberal and
female counterparts. While non-whites are more likely than whites to deny the existence of the scientific
consensus, the reverse is true for the belief that the media exaggerates the seriousness of global warming.
For the most part, after accounting for the effect of CWMs (or the effect of confident CWMs), the
separate effects of political ideology, race, and gender do not change—with two notable exceptions.
Among everyone not a CWM, non-whites are more likely than are whites to reject that human activities
are a primary cause of recent temperature increases (Models 25 and 26). Further, the direct effect of
gender on rejection of the current scientific consensus (males are more likely than are females to deny
that a consensus exists—Model 27) is fully attributable to the denialism of CWMs (Model 28) or the
denialism of confident CWMs (Model 29).
It is also important to discuss the effect of other social, demographic, economic, political, and
temporal variables I included in my models. Age generally has no effect on climate change denial, but
older adults are more likely than are younger adults to believe there is no scientific consensus. Lesser
educated adults are more likely than are their more highly educated counterparts to believe human
activities are not the primary cause of recent warming and that there is no scientific consensus. Adults
14
with higher socioeconomic status (both educational attainment and annual income) are more likely than
are their lower SES counterparts to believe the media exaggerates the seriousness of global warming.
Otherwise, income has no effect on the other climate change denial indicators. Whether or not
individuals are employed full-time or are parents with children living at home have no significant effects
on their climate change denial views.
For each of the five denial items, more religious individuals, people unsympathetic to the
environmental movement, and self-identified Republicans are more likely to express climate change
denial than are less religious individuals, people sympathetic to the environmental movement, and self-
identified Democrats, respectively. Finally, climate change denial increased significantly over the time
period between 2001 and 2010.
CONCLUSION
There is a sizable political divide between liberals/Democrats and conservatives/Republicans in the
American public on the issue of global warming. Just as elites are politically divided on this issue, so too
is the general public. Liberals and Democrats are more likely to hold beliefs about global warming
consistent with the scientific consensus and to express concern about this environmental problem than are
conservatives and Republicans. Furthermore, this divide has grown substantially over the past decade.
Current flows of political messages and news concerning global warming are likely contributing to
the growing divide. Americans’ political orientations moderate educational attainment and self-reported
understanding in ways consistent with the predictions of the elite cues hypothesis and information-
processing theory. Given the bifurcated flow of conflicting information on global warming from elites on
both sides of the political spectrum, ideological and partisan camps in the general public likely receive
very different information on global warming—in ways that reinforce their existing political differences
(Hindman 2009). In fact, the effects of educational attainment and self-reported understanding on beliefs
about climate science and personal concern about global warming are positive for liberals and Democrats,
but are weaker or negative for conservatives and Republicans.
The moderator effect of political orientation challenges the common assumption of climate change
communicators (e.g., scientists and policy-makers) that more information or education will help convince
Americans of the need to deal with climate change. Particularly for those on the Right, this seems
unlikely to prove effective. Reducing climate skepticism among this large segment of the American
populace will require far more than simply disseminating additional information—especially via
established scientific communication channels.
In recent decades, ideological and party elites in the United States have become polarized on a wide
range of social, economic, and cultural issues—including environmental issues such as climate change.
15
The American public has also experienced political polarization on this global environmental problem.
Specifically, there has been both ideological and partisan polarization on global warming beliefs and
concern over the past decade. Even if this polarization trend slows and perhaps reverses slightly in the
next few years, the remaining political divide within the American public will still be much larger than it
was in 2001—the year that the IPCC’s Third Assessment Report clearly established the current scientific
consensus on climate change.
Over the last twenty years, conservative white male (CWM) elites have challenged the reality of
climate change via conservative talk radio, websites, television news, and newspapers (e.g., Wolcott
2007). There is strong evidence here that CWMs are more likely than are other adults in the general
public to espouse climate change denial. Further, those CWMs who self-report understanding global
warming very well—confident CWMs—express the greatest degree of denial. Yet, even controlling for
the denialism of CWMs, Republicans, more religious individuals, and those unsympathetic to the
environmental movement are still more likely to report denialist beliefs than are their respective
counterparts. Finally, what is most sobering, especially for the scientific community and climate change
communicators, is that climate change denial has actually increased in the U.S. general public between
2001 and 2010 (Newport 2010), although primarily due to a significant increase in the past two years
which may prove abnormal in the long run (Leiserowitz et al. 2010).
These findings have clear policy implications. To be sure, the existing divide on global warming
between political elites poses a serious impediment to creating and implementing an effective federal
climate policy with any potential of significantly reducing our nation’s greenhouse gas emissions.
However, given that public opinion can have a significant impact on policy-making (e.g., Burstein 1998),
the political divide within the general public may further inhibit the creation of effective climate policy.
For instance, Republican politicians are unlikely to support efforts to reduce greenhouse gas emissions
that party activists and members believe to be unnecessary, while individuals who believe that global
warming is not happening or not caused by humans are unlikely to make the behavioral and household
changes necessary for our nation to meet its emissions reduction targets—or to support politicians who
favor such changes.
16
REFERENCES Abramowitz Alan I., and Kyle L. Saunders. 2008. “Is Polarization a Myth?” Journal of Politics 70:542-
555. Aiken, Leona, Stephen West, and Raymond Reno. 1991. Multiple Regression. Thousand Oaks, CA: Sage. Baldassarri, Delia, and Andrew Gelman. 2008. “Partisans without Constraint: Political Polarization and
Trends in American Public Opinion.” American Journal of Sociology 114:408-446. Boykoff, Maxwell T., and Jules M. Boykoff. 2004. “Balance as Bias: Global Warming and the US
Prestige Press.” Global Environmental Change 14:125-136. Brewer Mark D. 2005. “The Rise of Partisanship and the Expansion of Partisan Conflict within the
American Electorate.” Political Research Quarterly 58:219-230. Brody, Samuel D., Sammy Zahran, Arnold Vedlitz, and Himanshu Grover. 2008. “Examining the
Relationship between Physical Vulnerability and Public Perceptions of Global Climate Change in the United States.” Environment and Behavior 41:72-95.
Bryner, Gary. 2008. “Failure and Opportunity.” Environmental Politics 17:319-336. Burstein, Paul. 1998. “Bringing the Public Back In.” Social Forces 77:27-62. Dietz, Thomas, Amy Dan, and Rachel Shwom. 2007. “Support for Climate Change Policy: Some
Psychological and Social Structural Influences.” Rural Sociology 72:185-214. Dunlap, Riley E., and Aaron M. McCright. 2008. “A Widening Gap.” Environment 50(5):26-35. Dunlap, Riley E., and Aaron M. McCright. 2010. “Climate Change Denial: Sources, Actors, and
Strategies.” Pp. 240-259 in The Routledge International Handbook of Climate Change and Society, edited by Constance Lever-Tracy. New York: Routledge Press.
Dunlap, Riley E., Chenyang Xiao, and Aaron M. McCright. 2001. “Politics and Environment in America.” Environmental Politics 10(4):23-48.
Evans, John H. 2002. “Polarization in Abortion Attitudes in U.S. Religions Traditions, 1972-1998.” Sociological Forum 17:397-422.
Evans, John H. 2003. “Have Americans’ Attitudes Become More Polarized?—An Update.” Social Science Quarterly 84:71-90.
Feygina, Irina, John T. Jost, and Rachel E. Goldsmith. 2010. “System Justification, the Denial of Global Warming, and the Possibility of ‘System-Sanctioned Change’.” Personality and Social Psychology Bulletin 36:326-338.
Fiorina, Morris, and Samuel Abrams. 2008. “Political Polarization in the American Public.” Annual Review of Political Science 11:563-588.
Fisher, Dana R. 2006. “Bringing the Material Back In.” Sociological Forum 21:467-494. Freudenburg, William R., Robert Gramling, and Debra J. Davidson. 2008. “Scientific Certainty
Argumentation Methods (SCAMs).” Sociological Inquiry 78:2-38. Hamilton, Lawrence C. 2008. “Who Cares about Polar Regions?” Arctic, Antarctic, and Alpine Research
40:671-678. Hamilton, Lawrence C. 2010. “Education, Politics, and Opinions about Climate Change: Evidence for
Interaction Effects.” Climatic Change In Press. Hamilton, Lawrence C., and Barry D. Keim. 2009. “Regional Variation in Perceptions about Climate
Change.” International Journal of Climatology 29:2348-2352. Hindman, Douglas Blanks. 2009. “Mass Media Flow and Differential Distribution of Politically Disputed
Beliefs: The Belief Gap Hypothesis.” Journalism and Mass Communication Quarterly 86:790-808. Intergovernmental Panel on Climate Change. 2001. IPCC Third Assessment Report. Geneva: IPCC. Iyengar, Shanto, and Kyu Hahn. 2009. “Red Media, Blue Media.” Journal of Communication 59:19-39. Jacobson, Gary C. 2005. “Polarized Politics and the 2004 Congressional and Presidential Elections.”
Political Science Quarterly 120:199-218. Jost, John T., Brian A. Nosek, and Samuel D. Gosling. 2008. “Ideology: Its Resurgence in Social,
Personality, and Political Psychology.” Perspectives on Psychological Science 3(2):126-136.
17
18
Kahan, Dan M., Donald Braman, John Gastil, Paul Slovic, and C. K. Mertz. 2007. “Culture and Identity-Protective Cognition: Explaining the White-Male Effect in Risk Perception.” Journal of Empirical Legal Studies 4:465-505.
Kellstedt, Paul M., Sammy Zahran, and Arnold Vedlitz. 2008. “Personal Efficacy, the Information Environment, and Attitudes toward Global Warming and Climate Change in the USA.” Risk Analysis 28:113-126.
Kolk, Ans, and David Levy. 2001. “Winds of Change: Corporate Strategy, Climate Change, and Oil Multinationals.” European Management Journal 19:501-509.
Krosnick Jon A., Allyson L. Holbrook, and Penny S. Visser. 2000. “The Impact of the Fall 1997 Debate about Global Warming on American Public Opinion.” Public Understanding of Science 9:239-260.
Lahsen, Myanna. 2005. “Technocracy, Democracy, and U. S. Climate Politics.” Science, Technology & Human Values 30:137-169.
Lahsen, Myanna. 2008. “Experiences of Modernity in the Greenhouse: A Cultural Analysis of a Physicist ‘Trio’ Supporting the Backlash against Global Warming.” Global Environmental Change 18:204-219.
Layman, Geoffrey C., Thomas M. Carsey, and Juliana Horowitz. 2006. “Party Polarization in American Politics.” Annual Review of Political Science 9:83-110.
Layzer, Judith. 2007. “Deep Freeze.” Pp. 93-125 in Business and Environmental Policy, edited by M. E. Kraft and S. Kamieniecki. Cambridge, MA: MIT Press.
Leiserowitz, Anthony. 2006. “Climate Change Risk Perception and Policy Preferences.” Climatic Change 77:45-72.
Leiserowitz, Anthony, Edward W. Maibach, Connie Roser-Renouf, Nicholas Smith, and E. Dawson. 2010. “Climategate, Public Opinion, and the Loss of Trust.” Working Paper. New Haven, CT: Yale Project on Climate Change.
Malka, Ariel, Jon A. Krosnick, and Gary Langer. 2009. “The Association of Knowledge with Concern about Global Warming.” Risk Analysis 29:633-647.
McCarty, Nolan, Keith Poole, and Howard Rosenthal. 2006. Polarized America. Cambridge: MIT Press. McCright, Aaron M. 2007. “Dealing With Climate Change Contrarians.” Pp. 200-212 in Creating a
Climate for Change, edited by Susi C. Moser and Lisa Dilling. New York: Cambridge University Press.
McCright, Aaron M. 2010. “The Effects of Gender on Climate Change Knowledge and Concern in the American Public.” Population and Environment 32:66-87.
McCright, Aaron M., and Riley E. Dunlap. 2000. “Challenging Global Warming as a Social Problem.” Social Problems 47:499-522.
McCright, Aaron M., and Riley E. Dunlap. 2003. “Defeating Kyoto: The Conservative Movement’s Impact on U.S. Climate Change Policy.” Social Problems 50(3):348-373.
McCright, Aaron M., and Riley E. Dunlap. 2010. “Anti-Reflexivity: The American Conservative Movement’s Success in Undermining Climate Science and Policy.” Theory, Culture, and Society 27(2-3):1-34.
National Research Council. 2001. Climate Change Science. Washington, DC: National Academy Press. Newport, Frank. 2010. “Americans’ Global Warming Concern Continues to Drop.” Retrieved May 30,
2010 (http://www.gallup.com/poll/126560/Americans-Global-Warming-Concerns-Continue-Drop.aspx).
O’Connor, Robert E., Richard J. Bord, and Ann Fisher. 1999. “Risk Perceptions, General Environmental Beliefs, and Willingness to Address Climate Change.” Risk Analysis 19:461-471.
Oreskes, Naomi, and Erik M. Conway. 2010. Merchants of Doubt. New York: Bloomsbury Press. Oreskes, Naomi, Erik M. Conway, and Matthew Shindell. 2008. “From Chicken Little to Dr. Pangloss.”
Historical Studies in the Natural Sciences 38:109-152. Wolcott, James. 2007. “Rush to Judgment.” Vanity Fair May:100-106. Wood, B. Dan, and Arnold Vedlitz. 2007. “Issue Definition, Information Processing, and the Politics of
Global Warming.” American Journal of Political Science 51:552-568.
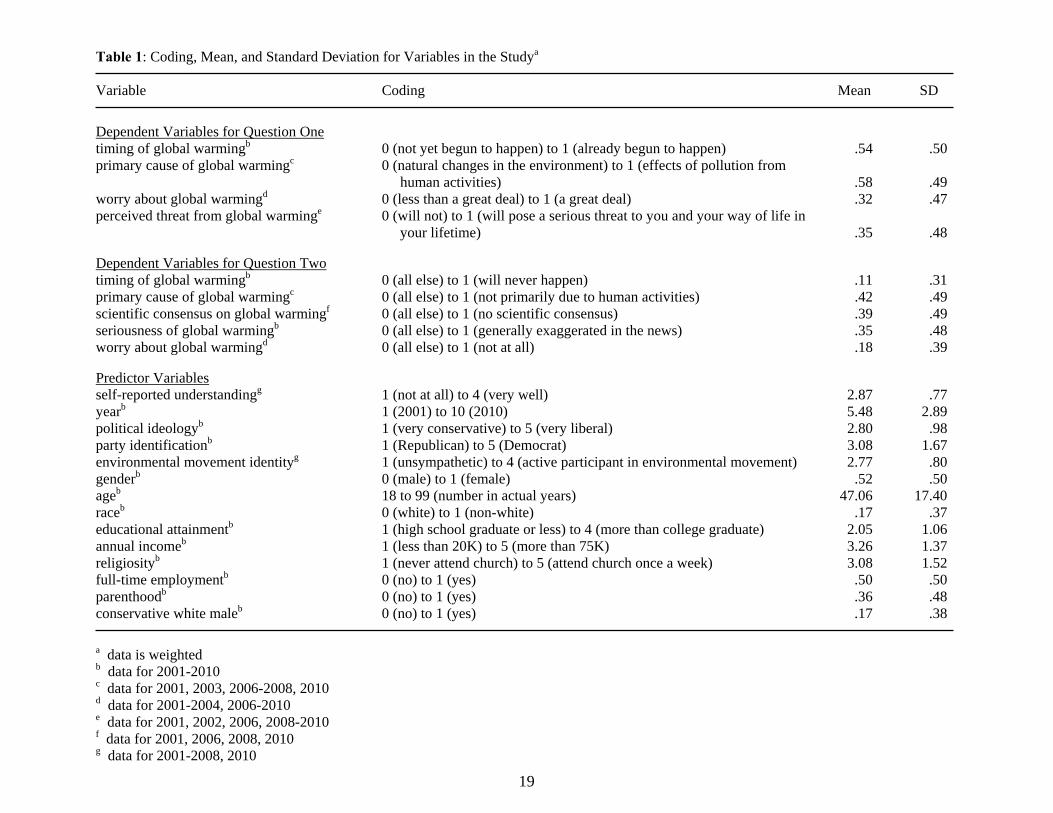
Table 1: Coding, Mean, and Standard Deviation for Variables in the Studya
Variable Coding Mean SD
Dependent Variables for Question One timing of global warmingb 0 (not yet begun to happen) to 1 (already begun to happen) .54 .50 primary cause of global warmingc 0 (natural changes in the environment) to 1 (effects of pollution from human activities) .58 .49 worry about global warmingd 0 (less than a great deal) to 1 (a great deal) .32 .47 perceived threat from global warminge 0 (will not) to 1 (will pose a serious threat to you and your way of life in your lifetime) .35 .48 Dependent Variables for Question Two timing of global warmingb 0 (all else) to 1 (will never happen) .11 .31 primary cause of global warmingc 0 (all else) to 1 (not primarily due to human activities) .42 .49 scientific consensus on global warmingf 0 (all else) to 1 (no scientific consensus) .39 .49 seriousness of global warmingb 0 (all else) to 1 (generally exaggerated in the news) .35 .48 worry about global warmingd 0 (all else) to 1 (not at all) .18 .39 Predictor Variables self-reported understandingg 1 (not at all) to 4 (very well) 2.87 .77 yearb 1 (2001) to 10 (2010) 5.48 2.89 political ideologyb 1 (very conservative) to 5 (very liberal) 2.80 .98 party identificationb 1 (Republican) to 5 (Democrat) 3.08 1.67 environmental movement identityg 1 (unsympathetic) to 4 (active participant in environmental movement) 2.77 .80 genderb 0 (male) to 1 (female) .52 .50 ageb 18 to 99 (number in actual years) 47.06 17.40 raceb 0 (white) to 1 (non-white) .17 .37 educational attainmentb 1 (high school graduate or less) to 4 (more than college graduate) 2.05 1.06 annual incomeb 1 (less than 20K) to 5 (more than 75K) 3.26 1.37 religiosityb 1 (never attend church) to 5 (attend church once a week) 3.08 1.52 full-time employmentb 0 (no) to 1 (yes) .50 .50 parenthoodb 0 (no) to 1 (yes) .36 .48 conservative white maleb 0 (no) to 1 (yes) .17 .38 a data is weighted b data for 2001-2010 c data for 2001, 2003, 2006-2008, 2010 d data for 2001-2004, 2006-2010 e data for 2001, 2002, 2006, 2008-2010 f data for 2001, 2006, 2008, 2010 g data for 2001-2008, 2010
19
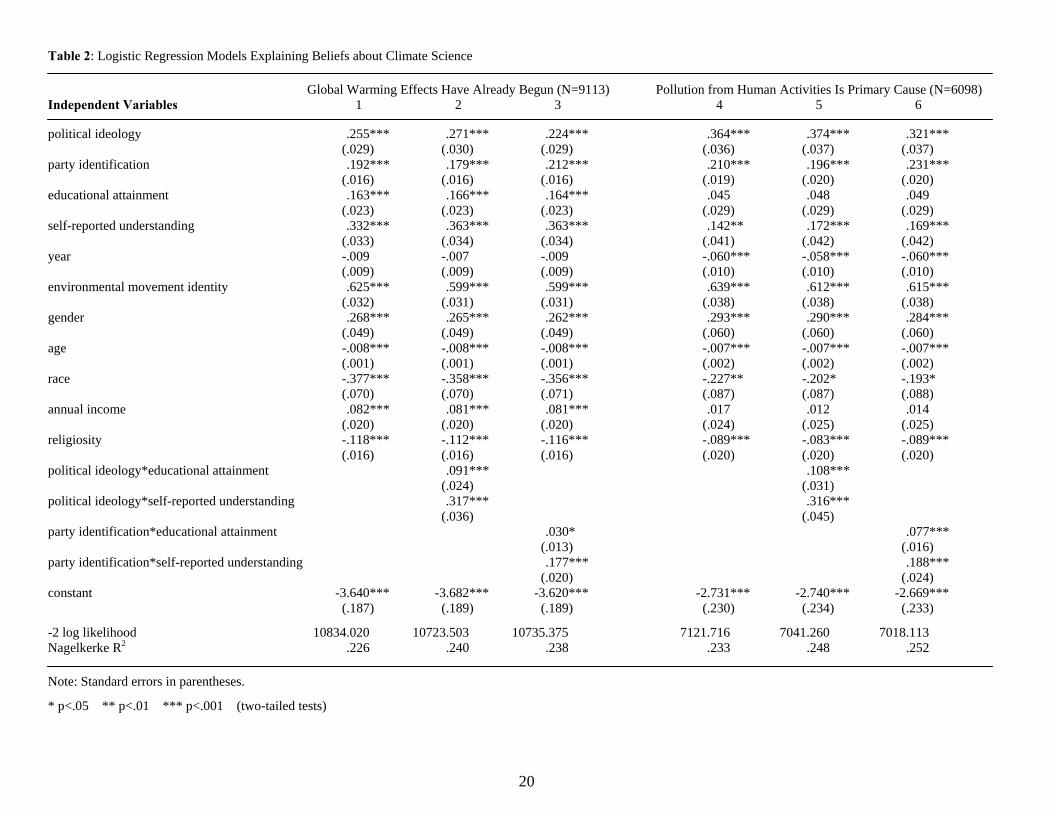
Table 2: Logistic Regression Models Explaining Beliefs about Climate Science
Global Warming Effects Have Already Begun (N=9113) Pollution from Human Activities Is Primary Cause (N=6098) Independent Variables 1 2 3 4 5 6
political ideology .255*** .271*** .224*** .364*** .374*** .321*** (.029) (.030) (.029) (.036) (.037) (.037) party identification .192*** .179*** .212*** .210*** .196*** .231*** (.016) (.016) (.016) (.019) (.020) (.020) educational attainment .163*** .166*** .164*** .045 .048 .049 (.023) (.023) (.023) (.029) (.029) (.029) self-reported understanding .332*** .363*** .363*** .142** .172*** .169*** (.033) (.034) (.034) (.041) (.042) (.042) year -.009 -.007 -.009 -.060*** -.058*** -.060*** (.009) (.009) (.009) (.010) (.010) (.010) environmental movement identity .625*** .599*** .599*** .639*** .612*** .615*** (.032) (.031) (.031) (.038) (.038) (.038) gender .268*** .265*** .262*** .293*** .290*** .284*** (.049) (.049) (.049) (.060) (.060) (.060) age -.008*** -.008*** -.008*** -.007*** -.007*** -.007*** (.001) (.001) (.001) (.002) (.002) (.002) race -.377*** -.358*** -.356*** -.227** -.202* -.193* (.070) (.070) (.071) (.087) (.087) (.088) annual income .082*** .081*** .081*** .017 .012 .014 (.020) (.020) (.020) (.024) (.025) (.025) religiosity -.118*** -.112*** -.116*** -.089*** -.083*** -.089*** (.016) (.016) (.016) (.020) (.020) (.020) political ideology*educational attainment .091*** .108*** (.024) (.031) political ideology*self-reported understanding .317*** .316*** (.036) (.045) party identification*educational attainment .030* .077*** (.013) (.016) party identification*self-reported understanding .177*** .188*** (.020) (.024) constant -3.640*** -3.682*** -3.620*** -2.731*** -2.740*** -2.669*** (.187) (.189) (.189) (.230) (.234) (.233)
-2 log likelihood 10834.020 10723.503 10735.375 7121.716 7041.260 7018.113 Nagelkerke R2 .226 .240 .238 .233 .248 .252
Note: Standard errors in parentheses.
* p<.05 ** p<.01 *** p<.001 (two-tailed tests)
20
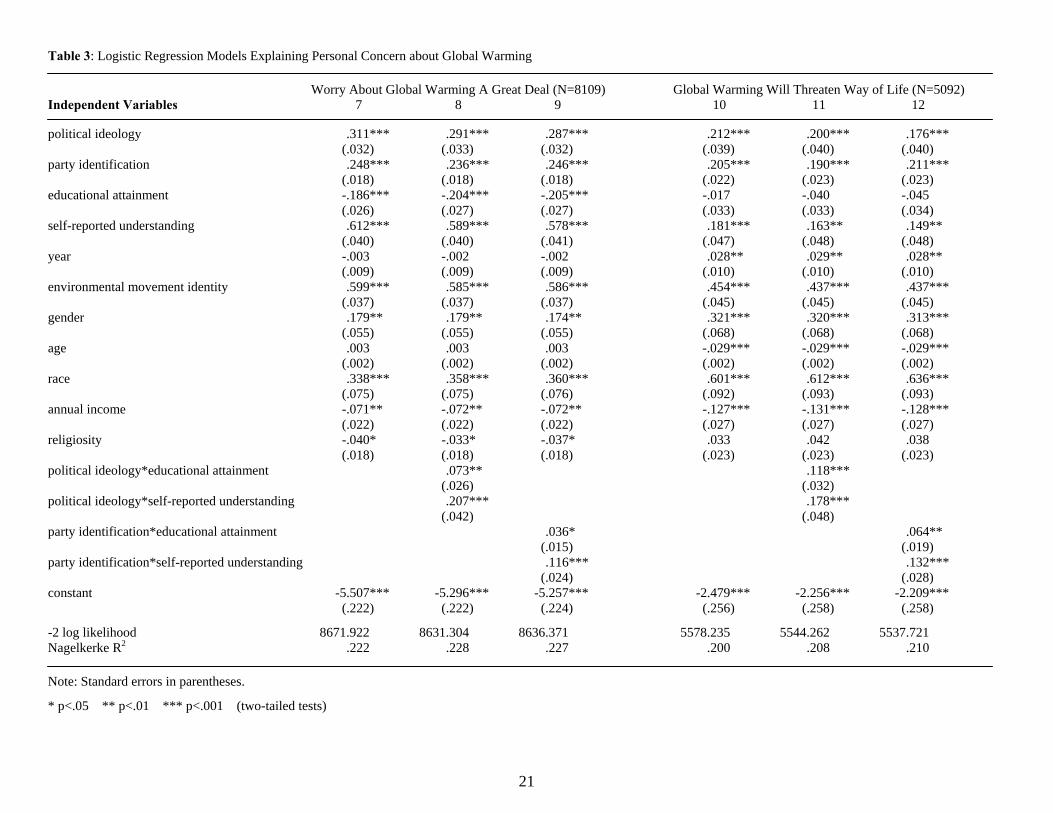
Table 3: Logistic Regression Models Explaining Personal Concern about Global Warming
Worry About Global Warming A Great Deal (N=8109) Global Warming Will Threaten Way of Life (N=5092) Independent Variables 7 8 9 10 11 12
political ideology .311*** .291*** .287*** .212*** .200*** .176*** (.032) (.033) (.032) (.039) (.040) (.040) party identification .248*** .236*** .246*** .205*** .190*** .211*** (.018) (.018) (.018) (.022) (.023) (.023) educational attainment -.186*** -.204*** -.205*** -.017 -.040 -.045 (.026) (.027) (.027) (.033) (.033) (.034) self-reported understanding .612*** .589*** .578*** .181*** .163** .149** (.040) (.040) (.041) (.047) (.048) (.048) year -.003 -.002 -.002 .028** .029** .028** (.009) (.009) (.009) (.010) (.010) (.010) environmental movement identity .599*** .585*** .586*** .454*** .437*** .437*** (.037) (.037) (.037) (.045) (.045) (.045) gender .179** .179** .174** .321*** .320*** .313*** (.055) (.055) (.055) (.068) (.068) (.068) age .003 .003 .003 -.029*** -.029*** -.029*** (.002) (.002) (.002) (.002) (.002) (.002) race .338*** .358*** .360*** .601*** .612*** .636*** (.075) (.075) (.076) (.092) (.093) (.093) annual income -.071** -.072** -.072** -.127*** -.131*** -.128*** (.022) (.022) (.022) (.027) (.027) (.027) religiosity -.040* -.033* -.037* .033 .042 .038 (.018) (.018) (.018) (.023) (.023) (.023) political ideology*educational attainment .073** .118*** (.026) (.032) political ideology*self-reported understanding .207*** .178*** (.042) (.048) party identification*educational attainment .036* .064** (.015) (.019) party identification*self-reported understanding .116*** .132*** (.024) (.028) constant -5.507*** -5.296*** -5.257*** -2.479*** -2.256*** -2.209*** (.222) (.222) (.224) (.256) (.258) (.258)
-2 log likelihood 8671.922 8631.304 8636.371 5578.235 5544.262 5537.721 Nagelkerke R2 .222 .228 .227 .200 .208 .210
Note: Standard errors in parentheses.
* p<.05 ** p<.01 *** p<.001 (two-tailed tests)
21
22
Table 4: Selected Logistic Regression Coefficients to Test for Ideological and Partisan Polarization in Global Warming Beliefs and Concern
Belief Items Concern Items
Global Warming Is Global Warming Is Worry about Global Global Warming Will Independent Variables Happening Now Caused by Humans Warming A Great Deal Threaten Way of Life
Ideological Polarization Models 13 14 15 16 (“Middle-Of-The-Road” is Removed) political ideology .233*** .324*** .298*** .194*** (.032) (.040) (.035) (.043) year -.015 -.044** -.016 .033* (.012) (.013) (.012) (.013) political ideology X year .033** .025* .040*** .033** (.010) (.011) (.010) (.010) sample size 5394 3601 4788 3014 Partisan Polarization Models 17 18 19 20 (“Independent” is Removed) party identification .214*** .198*** .255*** .212*** (.016) (.020) (.019) (.023) year .000 -.053*** -.003 .027* (.009) (.010) (.010) (.011) party identification X year .037*** .017** .019*** .016** (.005) (.006) (.006) (.006) sample size 8230 5487 7309 4581
Notes: The coefficient values reported here come from models also containing the following variables: political ideology, party identification, educational attainment, self-reported understanding, environmental movement identity, gender, age, race, annual income, religiosity, and year. Because of space concerns, I report only those coefficients relevant to determine polarization.
* p<.05 ** p<.01 *** p<.001 (two-tailed tests)
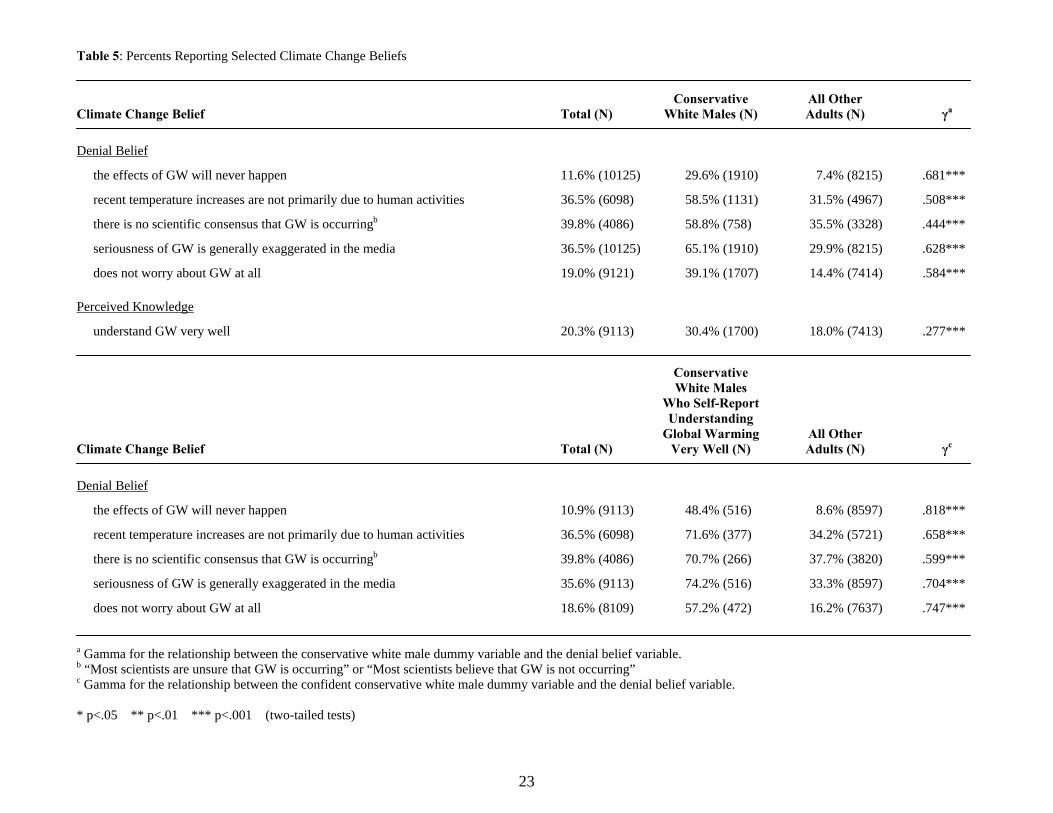
Table 5: Percents Reporting Selected Climate Change Beliefs Conservative All Other Climate Change Belief Total (N) White Males (N) Adults (N) γa
Denial Belief
the effects of GW will never happen 11.6% (10125) 29.6% (1910) 7.4% (8215) .681***
recent temperature increases are not primarily due to human activities 36.5% (6098) 58.5% (1131) 31.5% (4967) .508***
there is no scientific consensus that GW is occurringb 39.8% (4086) 58.8% (758) 35.5% (3328) .444***
seriousness of GW is generally exaggerated in the media 36.5% (10125) 65.1% (1910) 29.9% (8215) .628***
does not worry about GW at all 19.0% (9121) 39.1% (1707) 14.4% (7414) .584***
Perceived Knowledge
understand GW very well 20.3% (9113) 30.4% (1700) 18.0% (7413) .277***
Conservative White Males Who Self-Report Understanding Global Warming All Other Climate Change Belief Total (N) Very Well (N) Adults (N) γc
Denial Belief
the effects of GW will never happen 10.9% (9113) 48.4% (516) 8.6% (8597) .818***
recent temperature increases are not primarily due to human activities 36.5% (6098) 71.6% (377) 34.2% (5721) .658***
there is no scientific consensus that GW is occurringb 39.8% (4086) 70.7% (266) 37.7% (3820) .599***
seriousness of GW is generally exaggerated in the media 35.6% (9113) 74.2% (516) 33.3% (8597) .704***
does not worry about GW at all 18.6% (8109) 57.2% (472) 16.2% (7637) .747*** a Gamma for the relationship between the conservative white male dummy variable and the denial belief variable. b “Most scientists are unsure that GW is occurring” or “Most scientists believe that GW is not occurring” c Gamma for the relationship between the confident conservative white male dummy variable and the denial belief variable. * p<.05 ** p<.01 *** p<.001 (two-tailed tests)
23
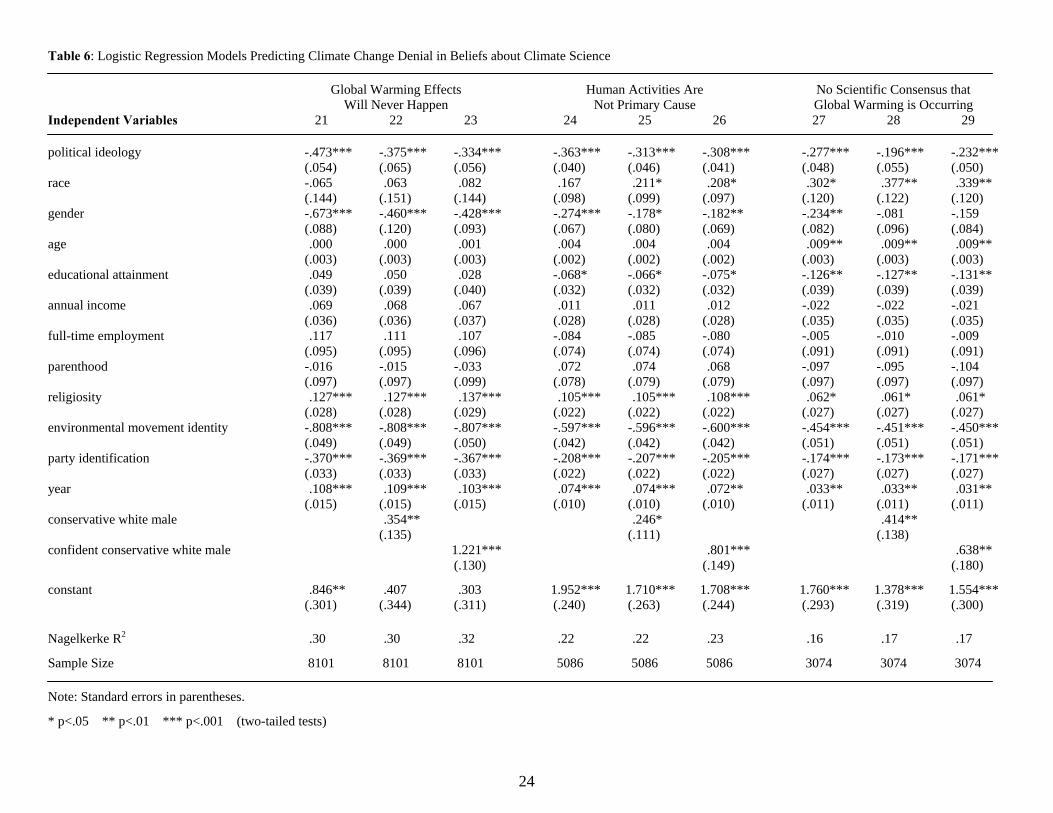
Table 6: Logistic Regression Models Predicting Climate Change Denial in Beliefs about Climate Science
Global Warming Effects Human Activities Are No Scientific Consensus that Will Never Happen Not Primary Cause Global Warming is Occurring Independent Variables 21 22 23 24 25 26 27 28 29
political ideology -.473*** -.375*** -.334*** -.363*** -.313*** -.308*** -.277*** -.196*** -.232*** (.054) (.065) (.056) (.040) (.046) (.041) (.048) (.055) (.050) race -.065 .063 .082 .167 .211* .208* .302* .377** .339** (.144) (.151) (.144) (.098) (.099) (.097) (.120) (.122) (.120) gender -.673*** -.460*** -.428*** -.274*** -.178* -.182** -.234** -.081 -.159 (.088) (.120) (.093) (.067) (.080) (.069) (.082) (.096) (.084) age .000 .000 .001 .004 .004 .004 .009** .009** .009** (.003) (.003) (.003) (.002) (.002) (.002) (.003) (.003) (.003) educational attainment .049 .050 .028 -.068* -.066* -.075* -.126** -.127** -.131** (.039) (.039) (.040) (.032) (.032) (.032) (.039) (.039) (.039) annual income .069 .068 .067 .011 .011 .012 -.022 -.022 -.021 (.036) (.036) (.037) (.028) (.028) (.028) (.035) (.035) (.035) full-time employment .117 .111 .107 -.084 -.085 -.080 -.005 -.010 -.009 (.095) (.095) (.096) (.074) (.074) (.074) (.091) (.091) (.091) parenthood -.016 -.015 -.033 .072 .074 .068 -.097 -.095 -.104 (.097) (.097) (.099) (.078) (.079) (.079) (.097) (.097) (.097) religiosity .127*** .127*** .137*** .105*** .105*** .108*** .062* .061* .061* (.028) (.028) (.029) (.022) (.022) (.022) (.027) (.027) (.027) environmental movement identity -.808*** -.808*** -.807*** -.597*** -.596*** -.600*** -.454*** -.451*** -.450*** (.049) (.049) (.050) (.042) (.042) (.042) (.051) (.051) (.051) party identification -.370*** -.369*** -.367*** -.208*** -.207*** -.205*** -.174*** -.173*** -.171*** (.033) (.033) (.033) (.022) (.022) (.022) (.027) (.027) (.027) year .108*** .109*** .103*** .074*** .074*** .072** .033** .033** .031** (.015) (.015) (.015) (.010) (.010) (.010) (.011) (.011) (.011) conservative white male .354** .246* .414** (.135) (.111) (.138) confident conservative white male 1.221*** .801*** .638** (.130) (.149) (.180)
constant .846** .407 .303 1.952*** 1.710*** 1.708*** 1.760*** 1.378*** 1.554*** (.301) (.344) (.311) (.240) (.263) (.244) (.293) (.319) (.300)
Nagelkerke R2 .30 .30 .32 .22 .22 .23 .16 .17 .17
Sample Size 8101 8101 8101 5086 5086 5086 3074 3074 3074
Note: Standard errors in parentheses.
* p<.05 ** p<.01 *** p<.001 (two-tailed tests)
24
25
Table 7: Logistic Regression Models Predicting Climate Change Denial in Beliefs about Concern about Global Warming
Media Exaggerates Seriousness No Worry At All about of Global Warming Global Warming Independent Variables 30 31 32 33 34 35
political ideology -.383*** -.333*** -.349*** -.359*** -.284*** -.263*** (.034) (.039) (.035) (.043) (.051) (.045) race -.383*** -.332*** -.353*** -.014 .068 .073 (.087) (.089) (.087) (.111) (.114) (.111) gender -.477*** -.385*** -.422*** -.418*** -.263** -.249*** (.055) (.067) (.057) (.072) (.091) (.075) age -.002 -.002 -.002 .004 .004 .004 (.002) (.002) (.002) (.002) (.002) (.002) educational attainment .056* .057* .052 .016 .016 .003 (.026) (.026) (.026) (.033) (.033) (.034) annual income .087*** .087*** .086*** -.037 -.037 -.040 (.023) (.023) (.023) (.030) (.030) (.030) full-time employment .083 .081 .082 -.024 -.030 -.032 (.062) (.062) (.062) (.080) (.080) (.080) parenthood -.017 -.018 -.018 -.003 -.003 -.011 (.064) (.064) (.064) (.083) (.083) (.084) religiosity .081*** .082*** .082*** .102*** .101*** .106*** (.018) (.018) (.018) (.023) (.023) (.024) environmental movement identity -.660*** -.661*** -.662*** -.742*** -.741*** -.744*** (.035) (.035) (.035) (.042) (.042) (.043) party identification -.336*** -.335*** -.334*** -.294*** -.293*** -.290*** (.018) (.018) (.018) (.024) (.024) (.025) year .090*** .091*** .089*** .087*** .088*** .083*** (.010) (.010) (.010) (.012) (.012) (.012) conservative white male .229* .313** (.092) (.113) confident conservative white male .536*** 1.100*** (.129) (.129)
constant 2.368*** 2.145*** 2.233*** 1.469*** 1.127*** 1.085*** (.198) (.217) (.201) (.249) (.277) (.255)
Nagelkerke R2 .31 .31 .31 .25 .25 .27
Sample Size 8101 8101 8101 7097 7097 7097
Note: Standard errors in parentheses.
* p<.05 ** p<.01 *** p<.001 (two-tailed tests)
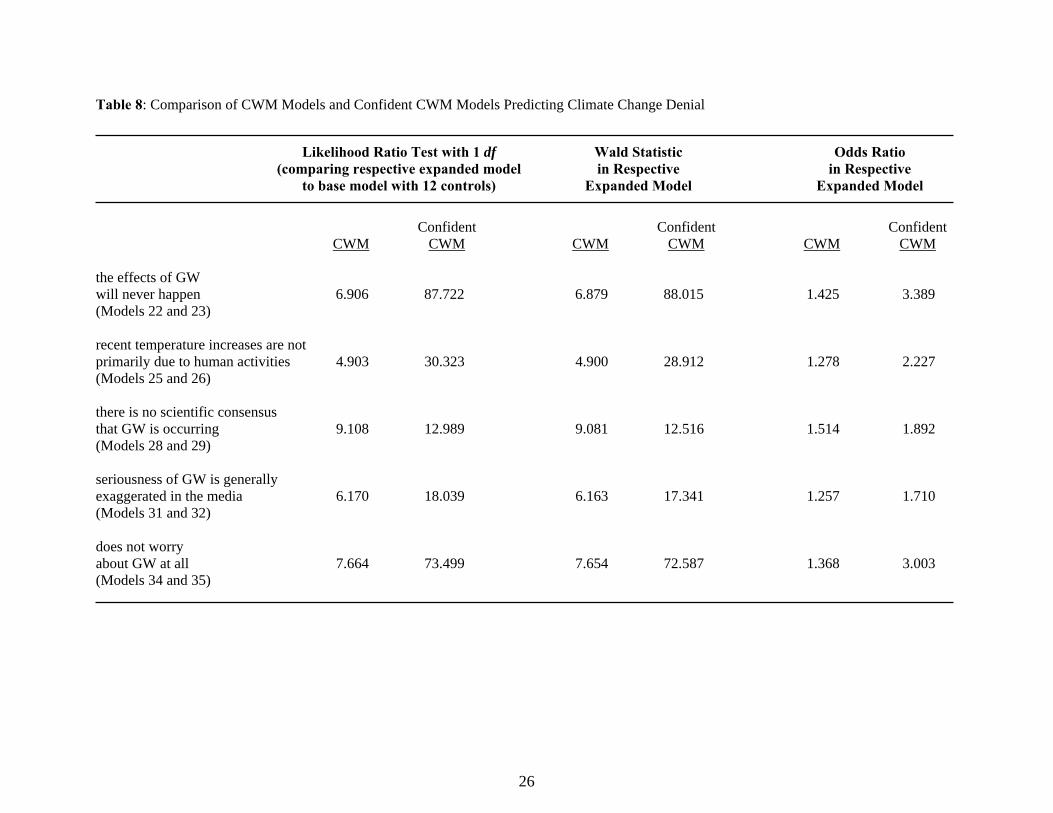
Table 8: Comparison of CWM Models and Confident CWM Models Predicting Climate Change Denial Likelihood Ratio Test with 1 df Wald Statistic Odds Ratio (comparing respective expanded model in Respective in Respective to base model with 12 controls) Expanded Model Expanded Model
Confident Confident Confident CWM CWM CWM CWM CWM CWM the effects of GW will never happen 6.906 87.722 6.879 88.015 1.425 3.389 (Models 22 and 23) recent temperature increases are not primarily due to human activities 4.903 30.323 4.900 28.912 1.278 2.227 (Models 25 and 26) there is no scientific consensus that GW is occurring 9.108 12.989 9.081 12.516 1.514 1.892 (Models 28 and 29) seriousness of GW is generally exaggerated in the media 6.170 18.039 6.163 17.341 1.257 1.710 (Models 31 and 32) does not worry about GW at all 7.664 73.499 7.654 72.587 1.368 3.003 (Models 34 and 35)
26
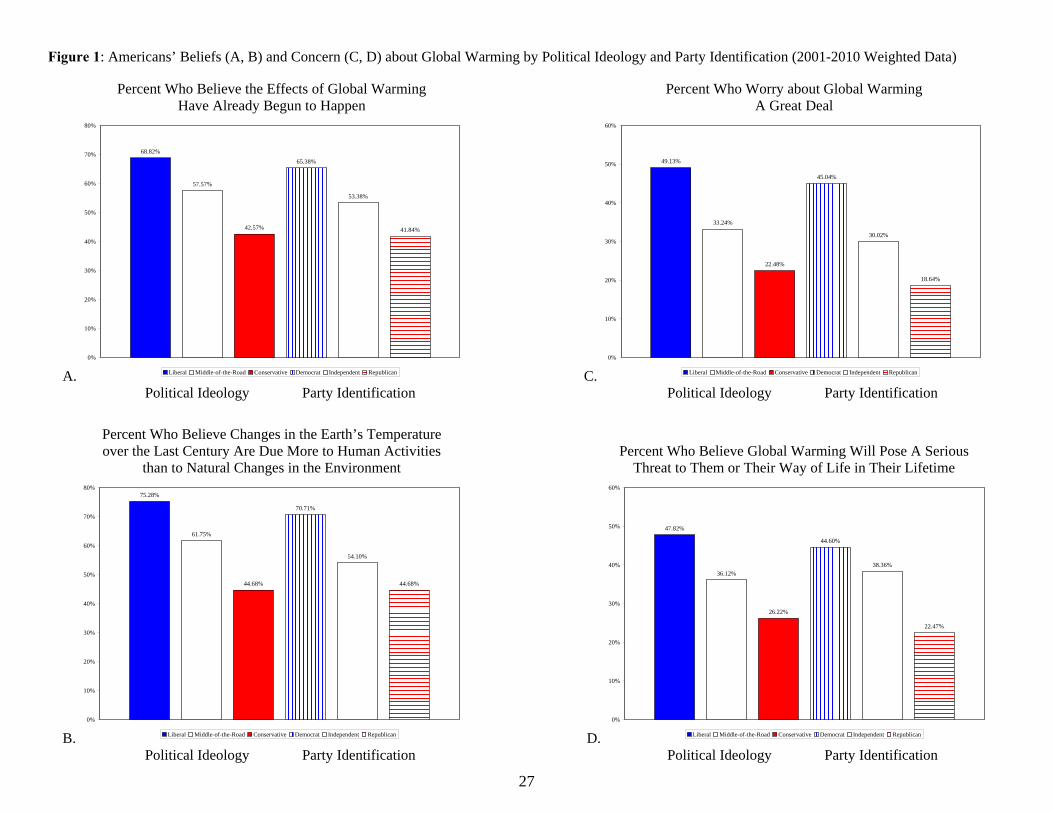
Figure 1: Americans’ Beliefs (A, B) and Concern (C, D) about Global Warming by Political Ideology and Party Identification (2001-2010 Weighted Data) Percent Who Believe the Effects of Global Warming Percent Who Worry about Global Warming Have Already Begun to Happen A Great Deal
A.
68.82%
57.57%
42.57%
65.38%
53.38%
41.84%
0%
10%
20%
30%
40%
50%
60%
70%
80%
Liberal Middle-of-the-Road Conservative Democrat Independent Republican C.
49.13%
33.24%
22.48%
45.04%
30.02%
18.64%
0%
10%
20%
30%
40%
50%
60%
Liberal Middle-of-the-Road Conservative Democrat Independent Republican Political Ideology Party Identification Political Ideology Party Identification Percent Who Believe Changes in the Earth’s Temperature over the Last Century Are Due More to Human Activities Percent Who Believe Global Warming Will Pose A Serious than to Natural Changes in the Environment Threat to Them or Their Way of Life in Their Lifetime
B.
75.28%
61.75%
44.68%
70.71%
54.10%
44.68%
0%
10%
20%
30%
40%
50%
60%
70%
80%
Liberal Middle-of-the-Road Conservative Democrat Independent Republican D.
47.82%
36.12%
26.22%
44.60%
38.36%
22.47%
0%
10%
20%
30%
40%
50%
60%
Liberal Middle-of-the-Road Conservative Democrat Independent Republican Political Ideology Party Identification Political Ideology Party Identification
27
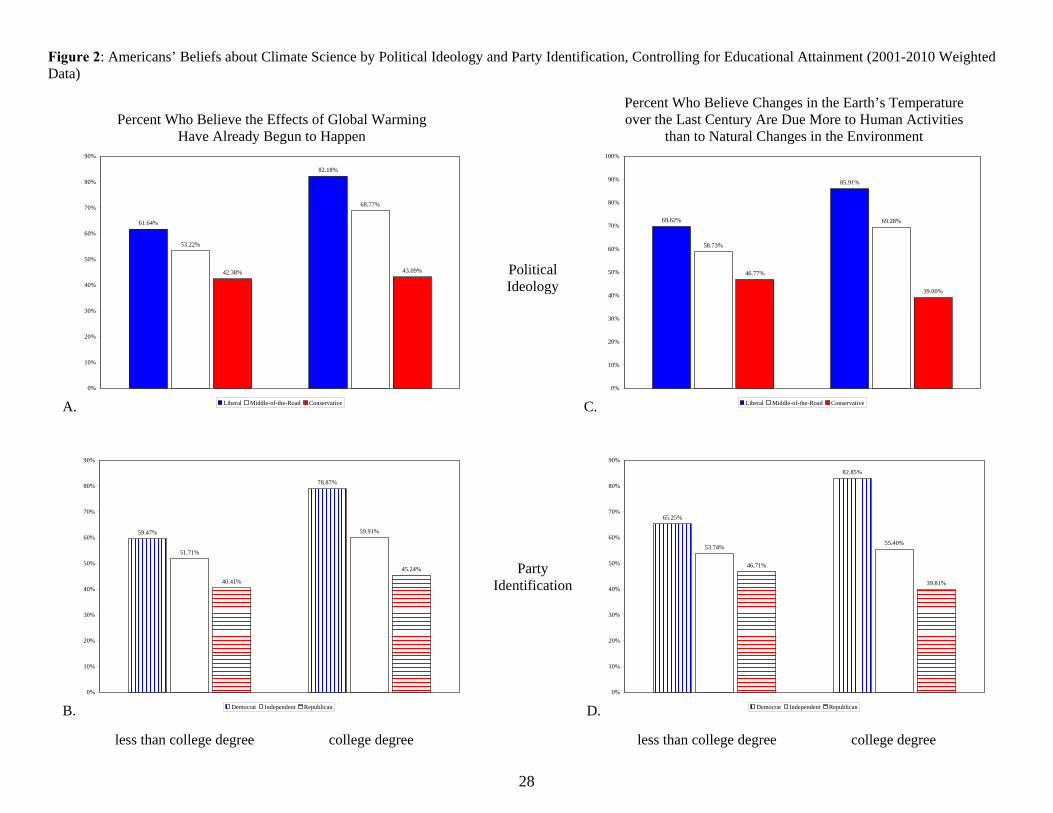
Figure 2: Americans’ Beliefs about Climate Science by Political Ideology and Party Identification, Controlling for Educational Attainment (2001-2010 Weighted Data) Percent Who Believe Changes in the Earth’s Temperature Percent Who Believe the Effects of Global Warming over the Last Century Are Due More to Human Activities Have Already Begun to Happen than to Natural Changes in the Environment
A.
61.64%
82.18%
53.22%
68.77%
42.38% 43.09%
0%
10%
20%
30%
40%
50%
60%
70%
80%
90%
Liberal Middle-of-the-Road Conservative C.
69.62%
85.91%
58.73%
69.28%
46.77%
39.00%
0%
10%
20%
30%
40%
50%
60%
70%
80%
90%
100%
Liberal Middle-of-the-Road Conservative
Political Ideology
B.
59.47%
78.87%
51.71%
59.91%
40.41%
45.24%
0%
10%
20%
30%
40%
50%
60%
70%
80%
90%
Democrat Independent Republican D.
65.25%
82.85%
53.74%55.40%
46.71%
39.81%
0%
10%
20%
30%
40%
50%
60%
70%
80%
90%
Democrat Independent Republican
Party Identification
less than college degree college degree less than college degree college degree
28
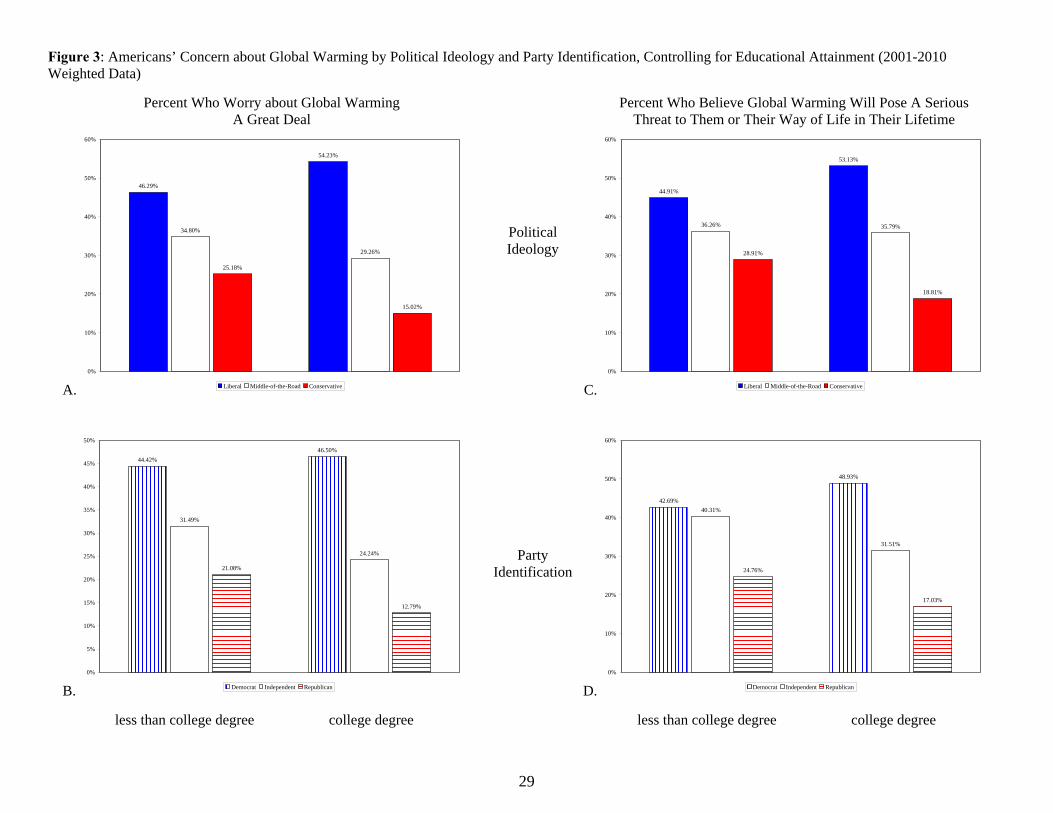
Figure 3: Americans’ Concern about Global Warming by Political Ideology and Party Identification, Controlling for Educational Attainment (2001-2010 Weighted Data) Percent Who Worry about Global Warming Percent Who Believe Global Warming Will Pose A Serious A Great Deal Threat to Them or Their Way of Life in Their Lifetime
A.
46.29%
54.23%
34.80%
29.26%
25.18%
15.02%
0%
10%
20%
30%
40%
50%
60%
Liberal Middle-of-the-Road Conservative C.
44.91%
53.13%
36.26% 35.79%
28.91%
18.81%
0%
10%
20%
30%
40%
50%
60%
Liberal Middle-of-the-Road Conservative
Political Ideology
B.
44.42%46.50%
31.49%
24.24%
21.08%
12.79%
0%
5%
10%
15%
20%
25%
30%
35%
40%
45%
50%
Democrat Independent Republican D.
42.69%
48.93%
40.31%
31.51%
24.76%
17.03%
0%
10%
20%
30%
40%
50%
60%
Democrat Independent Republican
Party Identification
less than college degree college degree less than college degree college degree
29
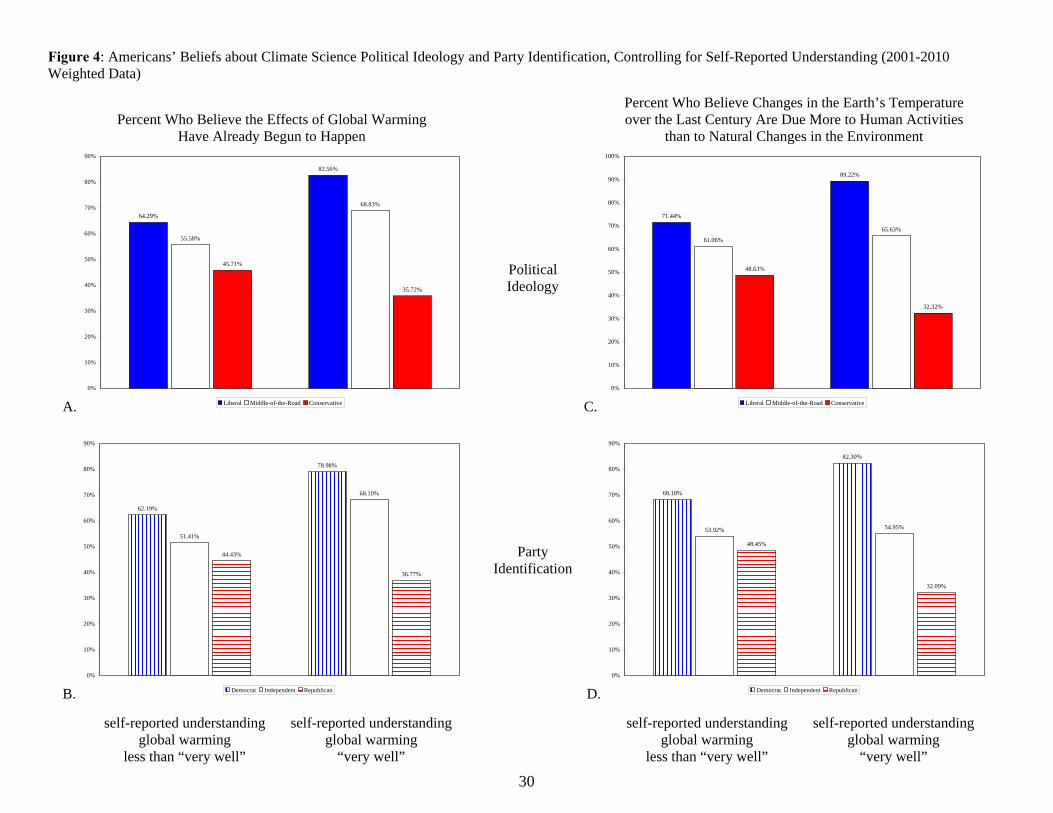
Figure 4: Americans’ Beliefs about Climate Science Political Ideology and Party Identification, Controlling for Self-Reported Understanding (2001-2010 Weighted Data) Percent Who Believe Changes in the Earth’s Temperature Percent Who Believe the Effects of Global Warming over the Last Century Are Due More to Human Activities Have Already Begun to Happen than to Natural Changes in the Environment
A.
64.29%
82.56%
55.58%
68.83%
45.71%
35.72%
0%
10%
20%
30%
40%
50%
60%
70%
80%
90%
Liberal Middle-of-the-Road Conservative C.
71.44%
89.22%
61.06%
65.63%
48.63%
32.32%
0%
10%
20%
30%
40%
50%
60%
70%
80%
90%
100%
Liberal Middle-of-the-Road Conservative
Political Ideology
B.
62.19%
78.98%
51.41%
68.10%
44.43%
36.77%
0%
10%
20%
30%
40%
50%
60%
70%
80%
90%
Democrat Independent Republican D.
68.18%
82.30%
53.92% 54.95%
48.45%
32.09%
0%
10%
20%
30%
40%
50%
60%
70%
80%
90%
Democrat Independent Republican
Party Identification
self-reported understanding self-reported understanding self-reported understanding self-reported understanding global warming global warming global warming global warming less than “very well” “very well” less than “very well” “very well”
30
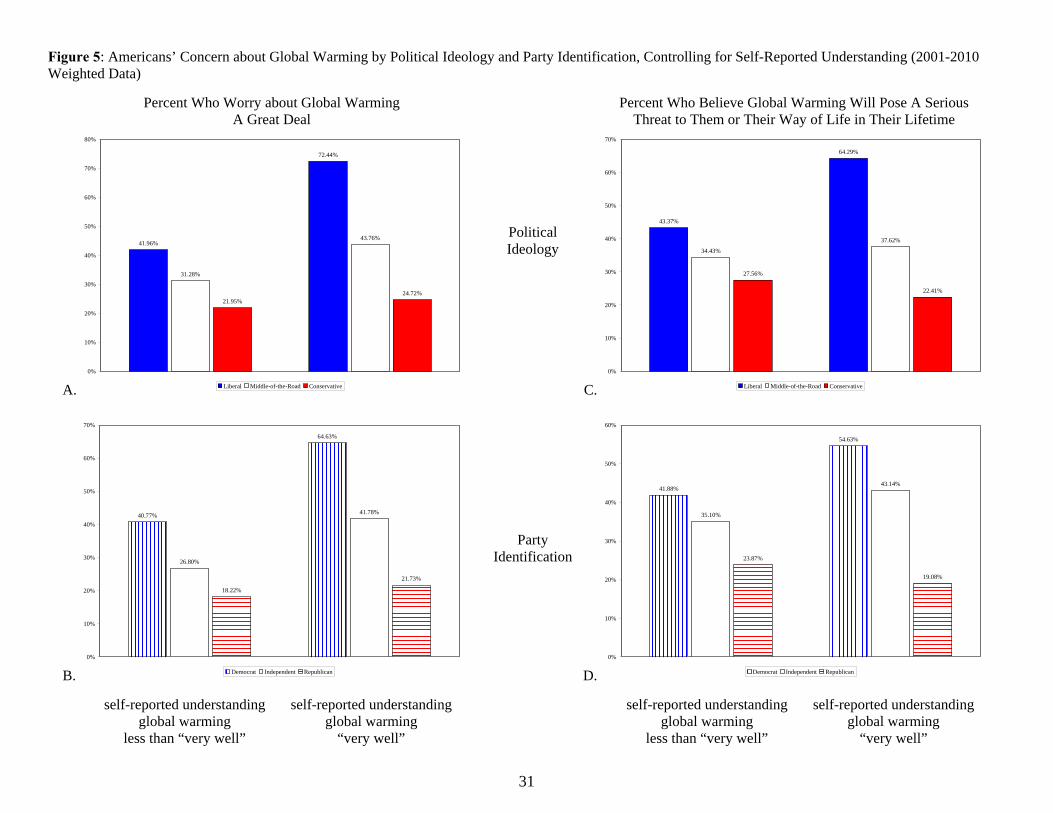
Figure 5: Americans’ Concern about Global Warming by Political Ideology and Party Identification, Controlling for Self-Reported Understanding (2001-2010 Weighted Data) Percent Who Worry about Global Warming Percent Who Believe Global Warming Will Pose A Serious A Great Deal Threat to Them or Their Way of Life in Their Lifetime
A.
41.96%
72.44%
31.28%
43.76%
21.95%24.72%
0%
10%
20%
30%
40%
50%
60%
70%
80%
Liberal Middle-of-the-Road Conservative C.
43.37%
64.29%
34.43%
37.62%
27.56%
22.41%
0%
10%
20%
30%
40%
50%
60%
70%
Liberal Middle-of-the-Road Conservative
Political Ideology
B.
40.77%
64.63%
26.80%
41.78%
18.22%
21.73%
0%
10%
20%
30%
40%
50%
60%
70%
Democrat Independent Republican D.
41.88%
54.63%
35.10%
43.14%
23.87%
19.08%
0%
10%
20%
30%
40%
50%
60%
Democrat Independent Republican
Party Identification
self-reported understanding self-reported understanding self-reported understanding self-reported understanding global warming global warming global warming global warming less than “very well” “very well” less than “very well” “very well”
31
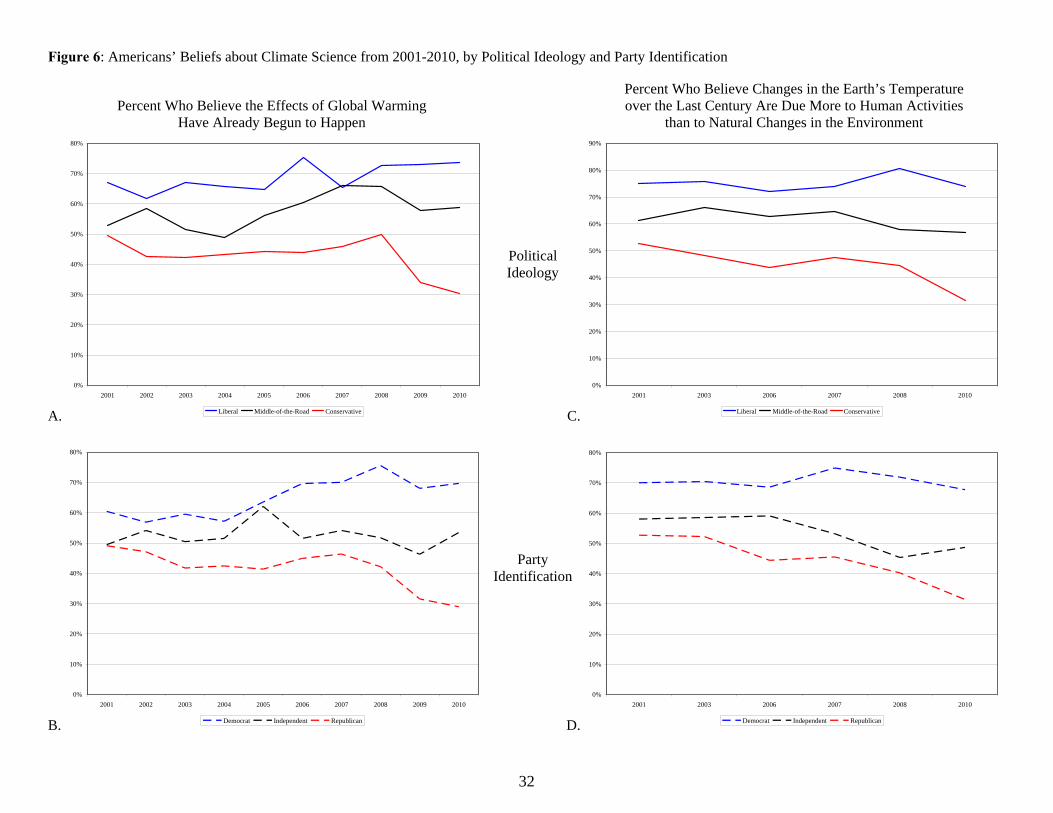
Figure 6: Americans’ Beliefs about Climate Science from 2001-2010, by Political Ideology and Party Identification Percent Who Believe Changes in the Earth’s Temperature Percent Who Believe the Effects of Global Warming over the Last Century Are Due More to Human Activities Have Already Begun to Happen than to Natural Changes in the Environment
A.
0%
10%
20%
30%
40%
50%
60%
70%
80%
2001 2002 2003 2004 2005 2006 2007 2008 2009 2010
Liberal Middle-of-the-Road Conservative C.
0%
10%
20%
30%
40%
50%
60%
70%
80%
90%
2001 2003 2006 2007 2008 2010
Liberal Middle-of-the-Road Conservative
Political Ideology
B.
0%
10%
20%
30%
40%
50%
60%
70%
80%
2001 2002 2003 2004 2005 2006 2007 2008 2009 2010
Democrat Independent Republican D.
0%
10%
20%
30%
40%
50%
60%
70%
80%
2001 2003 2006 2007 2008 2010
Democrat Independent Republican
Party Identification
32
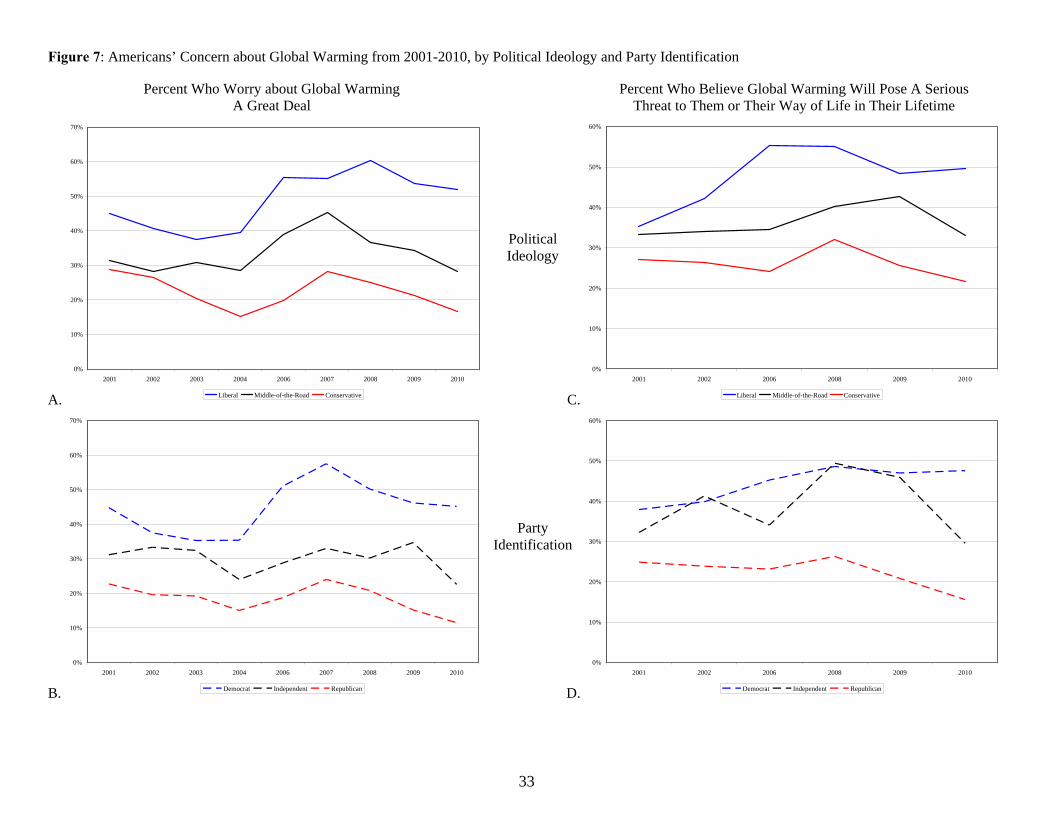
33
B.
0%
10%
20%
30%
40%
50%
60%
70%
2001 2002 2003 2004 2006 2007 2008 2009 2010
Democrat Independent Republican D.
0%
10%
20%
30%
40%
50%
60%
2001 2002 2006 2008 2009 2010
Democrat Independent Republican
A.
0%
10%
20%
30%
40%
50%
60%
70%
2001 2002 2003 2004 2006 2007 2008 2009 2010
Liberal Middle-of-the-Road Conservative C.
0%
10%
20%
30%
40%
50%
60%
2001 2002 2006 2008 2009 2010
Liberal Middle-of-the-Road Conservative
Figure 7: Americans’ Concern about Global Warming from 2001-2010, by Political Ideology and Party Identification Percent Who Worry about Global Warming Percent Who Believe Global Warming Will Pose A Serious A Great Deal Threat to Them or Their Way of Life in Their Lifetime
Party Identification
Political Ideology
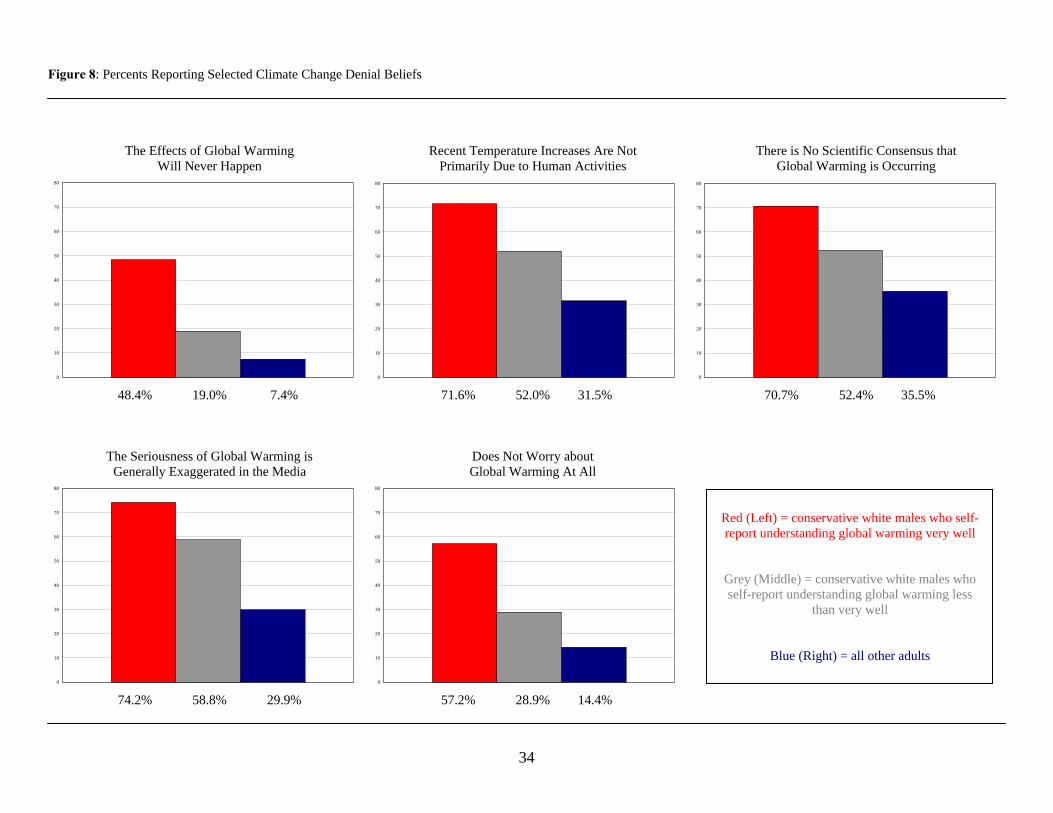
34
Figure 8: Percents Reporting Selected Climate Change Denial Beliefs The Effects of Global Warming Recent Temperature Increases Are Not There is No Scientific Consensus that Will Never Happen Primarily Due to Human Activities Global Warming is Occurring
0
10
20
30
40
50
60
70
80
0
10
20
30
40
50
60
70
80
0
10
20
30
40
50
60
70
80
48.4% 19.0% 7.4% 71.6% 52.0% 31.5% 70.7% 52.4% 35.5% The Seriousness of Global Warming is Does Not Worry about Generally Exaggerated in the Media Global Warming At All
0
10
20
30
40
50
60
70
80
0
10
20
30
40
50
60
70
80
Red (Left) = conservative white males who self-report understanding global warming very well
Grey (Middle) = conservative white males who self-report understanding global warming less
than very well
Blue (Right) = all other adults
74.2% 58.8% 29.9% 57.2% 28.9% 14.4%