Embed Size (px)
Citation preview
Belief in a Favorable Future
1
The Belief in a Favorable Future
Todd Rogers
Harvard Kennedy School
Don A. Moore
Haas School of Business, University of California, Berkeley
Michael I. Norton
Harvard Business School
In Press, Psychological Science
Keywords: Social cognition, judgment, prediction, forecasting, false-consensus, donation
Word count (including figure notes):
1,999
Draft of March 10, 2017
Belief in a Favorable Future
2
ABSTRACT
Word count: 149
People believe that future others’ preferences and beliefs will change to align with their own.
People holding a view (e.g., support President Trump) are more likely than those holding the
opposing view (e.g., oppose President Trump) to believe that future others will share their view.
Six studies show this belief in a favorable future (BFF) for political views, scientific beliefs, and
entertainment and product preferences. BFF is greater in magnitude than the tendency to believe
current others share one’s views (false consensus effect), arises across cultures, is distinct from
general optimism, is strongest when people perceive their views as being objective rather than
subjective, and can affect (but is distinct from) beliefs about favorable future policy changes. A
lab experiment involving monetary bets on the future popularity of politicians and a field
experiment involving political donations (N=660,542) demonstrate that believing in a favorable
future can influence people’s behavior today.
Belief in a Favorable Future
3
The authors of One Party Country: The Republican Plan for Dominance in the 21st Century
imagined that Democrats would “slip into the status of a permanent, carping minority”
(Hamburger & Wallsten, 2006). Meanwhile, the authors of another book, 40 More Years: How
the Democrats Will Rule the Next Generation, imagined the exact opposite future (Carville,
2009). How could these beliefs about the future be so discrepant? The first book was written by
Republicans, the second by Democrats; the authors of these two books differ profoundly in their
partisan current preferences. We argue that this current difference contributes to their divergent
beliefs that the future will unfold in ways that benefit their partisan (and mutually exclusive)
interests.
People believing that others will eventually come to share their views and preferences can
explain a host of phenomena, from the high frequency with which government officials “kick the
can down the road” on important issues (“There will be more legislators in the future who will
agree with my solutions”) to the low frequency of people’s engagement with political advocacy
(“I don’t need to attend that pro [anti] same sex marriage rally; same sex marriage will be legal
[illegal] in 10 years anyway”); from people’s willingness to stay in organizations with which
they disagree (“The Church’s views will evolve to align with my values”) to people’s reluctance
to end troubled relationships (“My partner will agree with me more in the future”).
We propose that people tend to hold a belief in a favorable future (“BFF”) – that future others’
preferences and beliefs will change to align with their own. That is, people who hold a view
(e.g., support President Trump) are more likely than those who hold the opposing view (e.g.,
oppose President Trump) to believe that future others will share their view. Our
conceptualization and hypotheses draw on two bodies of research: forecasting and naïve realism.
First, generally speaking, people tend to be worse at forecasting events than they believe
themselves to be (Tetlock, 2005). In addition, people lean toward optimism about their distant
futures (Gilovich, Kerr, & Medvec, 1993; Krizan & Windschitl, 2009; Simmons & Massey,
2012; but see Harris & Hahn, 2011). We propose – and demonstrate in the studies below – that
the BFF is a psychologically distinct form of optimism about the social world, differing from
dispositional optimism as well as optimism about specific good outcomes happening for oneself.
Second, we draw on three tenets of naïve realism: i) I perceive the world objectively; ii) rational
others must see the world as I do; and iii) those who disagree with me are uninformed, irrational,
or biased (Ross & Ward, 1997). A consequence of naïve realism is that people tend to project
their beliefs, attributes, and preferences onto others (Marks & Miller, 1987; Monin & Norton,
2003; Robbins & Krueger, 2005; Ross, Green, & House, 1977). Such social projection –
sometimes called the false consensus effect (FCE)1 – has been traced to people’s tendency to
anchor on themselves to understand unknown others (Epley et al., 2004; Marks & Miller, 1985).
The FCE can lead people with opposing views to hold diametrically opposed beliefs about the
likely views of others. For example, liberal and conservative Christians both project that Jesus
Christ would hold their (mutually incompatible) political views if he were on earth today (Ross,
Lelkes, & Russell, 2012).
1 Researchers debate whether FCE is “truly false” because it is normatively appropriate for people to incorporate their own views when estimating the views of a population in which they are included (Dawes, 1989; Krueger & Zeiger, 1993).
Belief in a Favorable Future
4
The FCE arises, in part, due to people viewing their own beliefs as the most sensible, therefore
leading them to infer that disagreeing others are uninformed, irrational, or biased (Pronin, Lin, &
Ross, 2002). We predict that the BFF will be larger in magnitude than FCE for two reasons.
First, social projection tends to be larger when others’ beliefs cannot be directly observed
(Vazire, 2010), and future others beliefs are, by definition, not directly observable now. Second,
because people tend to believe that their current views are the most accurate and true, they are
likely to believe that disagreeing others will have opportunities to “discover” the truth between
now and the future. Because people tend to believe that they perceive the world in an unbiased
fashion, we also predict that the BFF will be stronger for beliefs that people view as based on
objective facts relative to beliefs viewed as reflective of subjective taste. Finally, we predict that
holding a BFF – believing that others will eventually “come around” to share one’s current view
– can influence people’s behavior in the present.
Study 1: BFF across Scientific Beliefs, and Political, Entertainment and Product
Preferences
Study 1 examined the existence of the BFF across nine topics.
Method.
Participants. We recruited 254 participants (Mage=35.89, SD=11.82; 43% female) on Amazon’s
Mechanical Turk, restricted to respondents located in the United States. The design and analysis
plan were pre-registered at https://osf.io/e7hvk/. The sample size of 250 was decided ex ante,
informed by a pilot study.
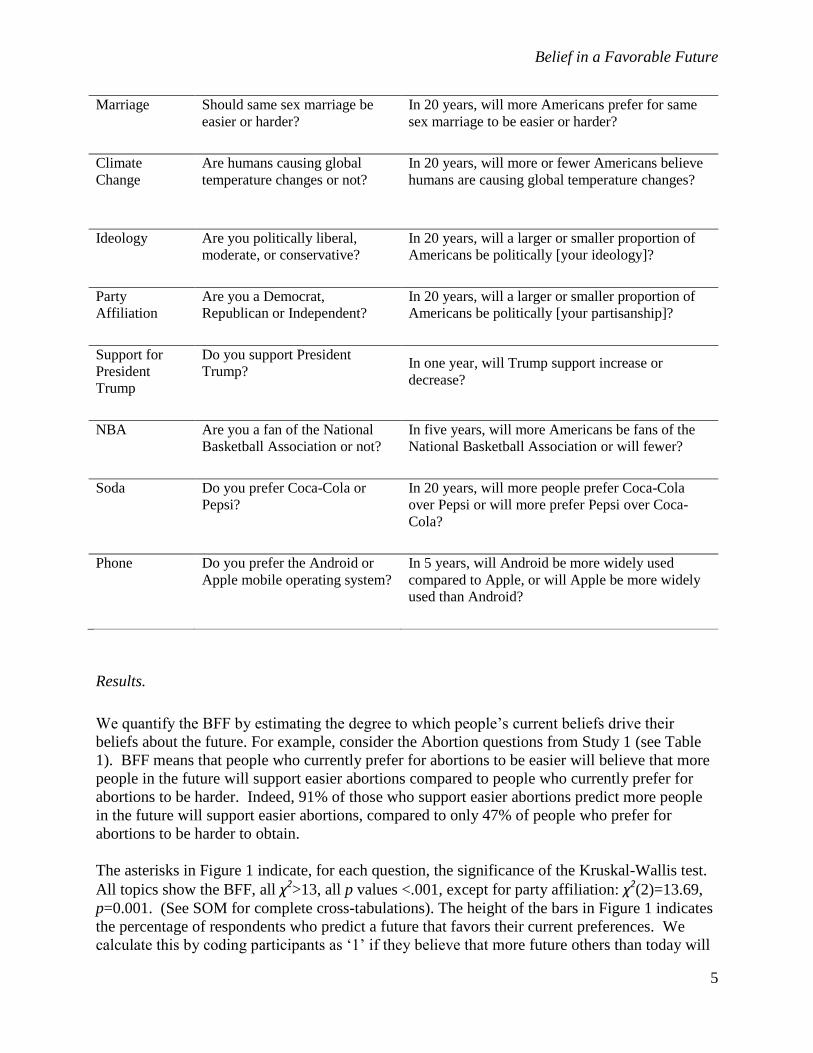
Design. Participants answered two blocks of questions regarding nine topics: abortion, same-sex
marriage, climate change, ideology, party affiliation, support of President Trump, soda, the
National Basketball Association (NBA), and phone preferences. One block of questions asked
participants to report their own views on the six topics. The second block of questions asked
participants to report on the future opinions of others. Table 1 shows abbreviated versions of the
questions and response options. SOM reports exact text of the questions asked and the
distributions across response options for each question pair. Block order was counterbalanced
for all questions except for Ideology and Party Affiliation. The Ideology and Party Affiliation
questions were not counterbalanced because the “current views” question had to be asked first in
order to insert each participant’s individual current view into their respective “Beliefs about the
Future” question.
Table 1. Study 1 BFF Questions (Abbreviated)
Issue Current Views Beliefs about the Future
Abortion Should legal abortions be easier
or harder for a woman to have?
In 20 years, will more Americans prefer for legal
abortions to be easier or harder?
Belief in a Favorable Future
5
Marriage Should same sex marriage be
easier or harder?
In 20 years, will more Americans prefer for same
sex marriage to be easier or harder?
Climate
Change
Are humans causing global
temperature changes or not?
In 20 years, will more or fewer Americans believe
humans are causing global temperature changes?
Ideology Are you politically liberal,
moderate, or conservative?
In 20 years, will a larger or smaller proportion of
Americans be politically [your ideology]?
Party
Affiliation
Are you a Democrat,
Republican or Independent?
In 20 years, will a larger or smaller proportion of
Americans be politically [your partisanship]?
Support for
President
Trump
Do you support President
Trump?
In one year, will Trump support increase or
decrease?
NBA Are you a fan of the National
Basketball Association or not?
In five years, will more Americans be fans of the
National Basketball Association or will fewer?
Soda Do you prefer Coca-Cola or
Pepsi?
In 20 years, will more people prefer Coca-Cola
over Pepsi or will more prefer Pepsi over Coca-
Cola?
Phone Do you prefer the Android or
Apple mobile operating system?
In 5 years, will Android be more widely used
compared to Apple, or will Apple be more widely
used than Android?
Results.
We quantify the BFF by estimating the degree to which people’s current beliefs drive their
beliefs about the future. For example, consider the Abortion questions from Study 1 (see Table
1). BFF means that people who currently prefer for abortions to be easier will believe that more
people in the future will support easier abortions compared to people who currently prefer for
abortions to be harder. Indeed, 91% of those who support easier abortions predict more people
in the future will support easier abortions, compared to only 47% of people who prefer for
abortions to be harder to obtain.
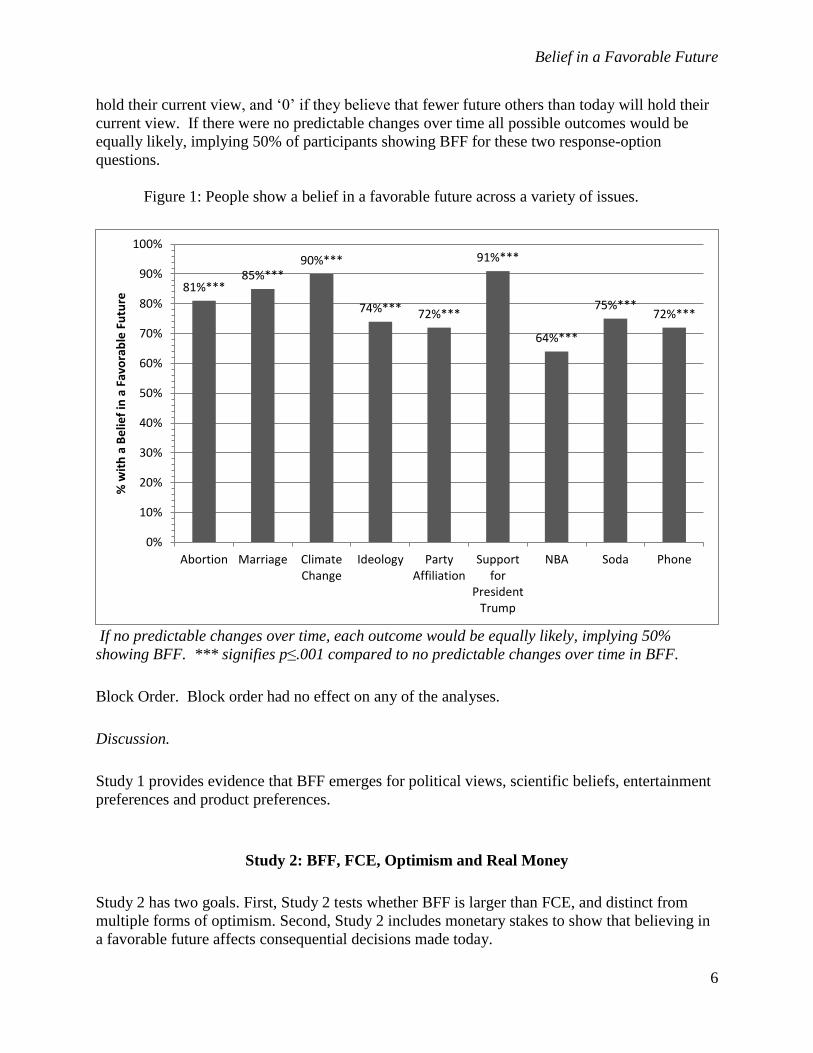
The asterisks in Figure 1 indicate, for each question, the significance of the Kruskal-Wallis test.
All topics show the BFF, all χ2>13, all p values <.001, except for party affiliation: χ2
(2)=13.69,
p=0.001. (See SOM for complete cross-tabulations). The height of the bars in Figure 1 indicates
the percentage of respondents who predict a future that favors their current preferences. We
calculate this by coding participants as ‘1’ if they believe that more future others than today will
Belief in a Favorable Future
6
hold their current view, and ‘0’ if they believe that fewer future others than today will hold their
current view. If there were no predictable changes over time all possible outcomes would be
equally likely, implying 50% of participants showing BFF for these two response-option
questions.
Figure 1: People show a belief in a favorable future across a variety of issues.
If no predictable changes over time, each outcome would be equally likely, implying 50%
showing BFF. *** signifies p≤.001 compared to no predictable changes over time in BFF.
Block Order. Block order had no effect on any of the analyses.
Discussion.
Study 1 provides evidence that BFF emerges for political views, scientific beliefs, entertainment
preferences and product preferences.
Study 2: BFF, FCE, Optimism and Real Money
Study 2 has two goals. First, Study 2 tests whether BFF is larger than FCE, and distinct from
multiple forms of optimism. Second, Study 2 includes monetary stakes to show that believing in
a favorable future affects consequential decisions made today.
81%*** 85%***
90%***
74%*** 72%***
91%***
64%***
75%*** 72%***
0%
10%
20%
30%
40%
50%
60%
70%
80%
90%
100%
Abortion Marriage ClimateChange
Ideology PartyAffiliation
Supportfor
PresidentTrump
NBA Soda Phone
% w
ith
a B
elie
f in
a F
avo
rab
le F
utu
re
Belief in a Favorable Future
7
Method.
Participants. Our pre-registered research plan called for 600 participants recruited via Amazon’s
Mechanical Turk (https://osf.io/xuebw/?view_only=6250096f3b2c4f258936bad738c51689). We
based this number on results from a pilot study. We ultimately recruited 602 participants (46%
female; Mage=36.4, SD=12.0) with an announcement that offered to pay them $.50 and required
that they be located in the United States.
Design. There were two question blocks. The reporting and betting blocks appeared in random
order. The reporting block included four measures:
1. “Do you support Donald Trump?” (Yes or No)
2. “What percent of the MTurkers who complete this survey will respond to the previous
question by saying that they support Trump?” (slider on a 0 to 100 scale)
3. “A YEAR FROM NOW, how will support for Trump among MTurkers change?”
(Greater or Less)
4. “A YEAR FROM NOW, what percentage of MTurkers will support Trump?” (slider on a
0 to 100 scale)
The betting block informed participants that they would receive a future bonus, the value of
which depended on changes in support for Trump among surveyed MTurkers. Our manipulation
of bet direction varied the rewarding direction of changes in Trump support. For half of
participants, this future bonus increased by $.01 for each 1% increase in support for Trump. For
the other half, this future bonus increased by $.01 for each 1% decrease in support for Trump.
Participants estimated the value of this future bonus in a year’s time. In order to motivate
accuracy, participants also learned that estimates within 5 cents of the true value would earn an
additional $1 accuracy bonus.
Finally, participants answered the Life Orientation Test-Revised (LOT-R; Scheier, Carvers, &
Bridges, 1994) and reported age and gender.
Results.
FCE. Consistent with the FCE, Trump supporters believed that there were currently more Trump
supporters (M=49%) than did Trump detractors (M=37%), t(602)=-8.70, p<.001. This replicates
the pattern of typical FCE research: estimates of the beliefs of populations tend to be anchored in
the direction of their own beliefs. Note that this study does not examine whether the consensus
effect we observe is an actual error, or “truly false” (Dawes, 1989).
Optimism. Did optimism that participants’ bets would make money in the future predict
participants’ estimates of their future bonuses? We tested this in two ways. First, we examined
the correlation between trait optimism (LOT-R scores) and estimated Future Bonus among the
subset of participants for whom the bet direction was compatible with their Trump preferences.
The correlation was not significant, r( 352)=.022, p=.68. Second, we tested for the presence of
Belief in a Favorable Future
8
optimism that participants’ bets would make money by examining if our manipulation of bet
direction affected participants’ predictions about future Trump support. Here, optimism that
participants’ bets would make money would be present if participants believed that support for
Trump would change in the next year such that their Future Bonus would be worth more,
regardless of whether their support for Trump was compatible with the Future Bonus incentive.
This means that those assigned to receive a larger Future Bonus if Trump support increases
would estimate its value reflecting the belief that Trump support would increase. Conversely,
those assigned to receive a larger Future Bonus if Trump support decreases would estimate its
value reflecting the belief that Trump support would decrease. We conducted an independent
samples t-test, comparing the two different bonus direction conditions. The dependent variable
was participants’ forecasted change in Trump support implied in their estimate of the value in
one year of their Future Bonus elicited in the incentive-compatible prediction block. Participants
showed optimism that their bets would make money in the future: those rewarded when support
for Trump increased predicted that support would go up more (M=7.76%) than did those
rewarded when support for Trump decreased (M=-10.31%), t(602)=-18.43, p<.001.
BFF. There are two ways to test for the presence of BFF in this study. The first way is akin to
how BFF was analyzed in Study 1: does a greater fraction of current Trump supporters think
more people will support Trump in one year compared to current Trump detractors? Analyzing
question Q3 in the reporting block (which has only two response options) shows that 83% of
Trump supporters predicted that support for Trump would go up in one year whereas 23% of
Trump detractors predicted that support for Trump would go up in one year, Kruskal-Wallis
χ2(1)=200.95, p<.001. The second way to analyze for the presence of BFF involves reported
beliefs about the percent of future Americans who will support Trump in one year. Analyzing
Q4 in the reporting block (which is a continuous measure) BFF would be present if the
percentage of Americans predicted to be supporters of Trump in one year is greater for current
Trump supporters than current Trump detractors. This was supported as Trump supporters
believed that the percentage of Americans supporting Trump in one year would go up to 57%,
whereas detractors believed it would decline to 29%, t(600)=-18.50, p<.001.
BFF v. Optimism. The BFF is distinct from optimism that good outcomes will generally happen;
it is a form of optimism in which people believe that others in the future will change in ways that
align with the current self. Consistent with this, participants bet that their Future Bonuses would
be worth more when their Future Bonuses were compatible with their Trump preference than
when they were incompatible with their Trump preference. We tested this with a 2 (Bet
direction: increased Trump support rewarded, decreased Trump support rewarded) x 2 (Trump
Support: supporter, detractor) between-subjects ANCOVA, controlling for LOT-R scores. The
two-way interaction was significant, F(1, 597)=22.74, p<.001. The means are shown in Figure 2.
Neither the main effect for bet direction, F(1, 597)=2.95, p=.09, nor for Trump supporter, F(1,
597)=.80, p=.38, were significant. The key result, the two-way interaction, remains significant
when a simple 2 X 2 ANOVA is conducted without controlling for LOTR scores: F(1,
598)=22.8, p<.001.
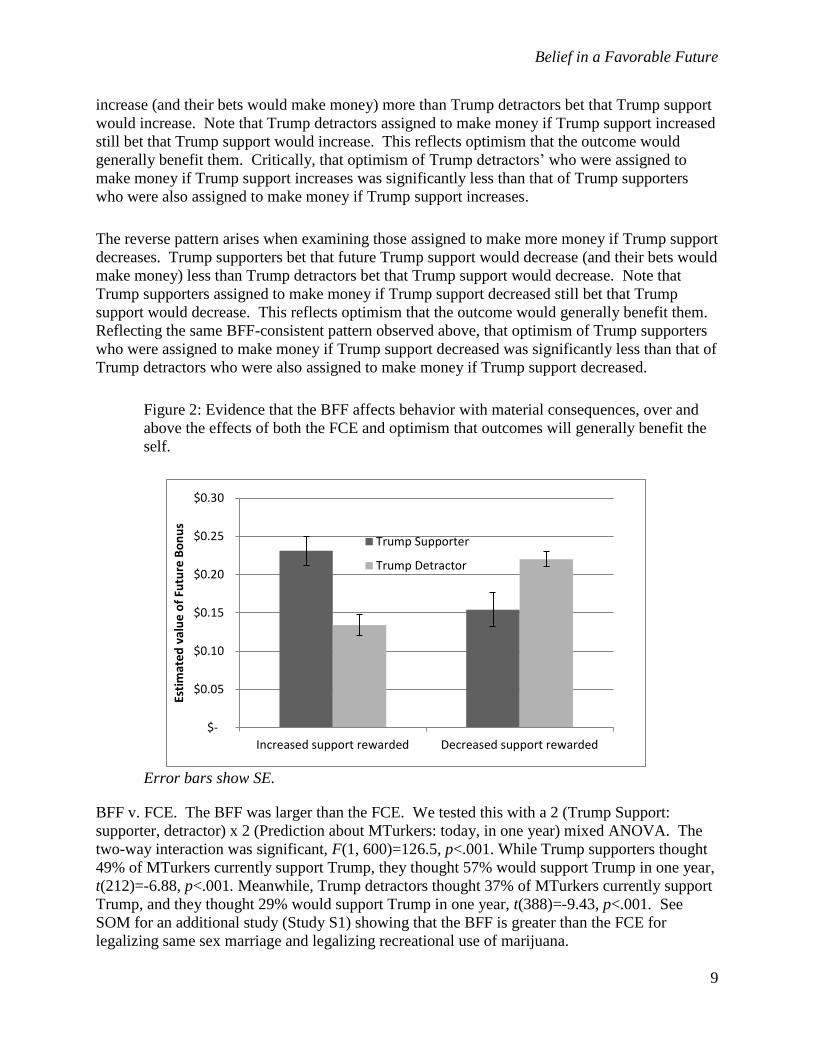
To understand this result, consider the means reflected in Figure 2. When assigned to make
more money if Trump support increases, Trump supporters bet that future Trump support would
Belief in a Favorable Future
9
increase (and their bets would make money) more than Trump detractors bet that Trump support
would increase. Note that Trump detractors assigned to make money if Trump support increased
still bet that Trump support would increase. This reflects optimism that the outcome would
generally benefit them. Critically, that optimism of Trump detractors’ who were assigned to
make money if Trump support increases was significantly less than that of Trump supporters
who were also assigned to make money if Trump support increases.
The reverse pattern arises when examining those assigned to make more money if Trump support
decreases. Trump supporters bet that future Trump support would decrease (and their bets would
make money) less than Trump detractors bet that Trump support would decrease. Note that
Trump supporters assigned to make money if Trump support decreased still bet that Trump
support would decrease. This reflects optimism that the outcome would generally benefit them.
Reflecting the same BFF-consistent pattern observed above, that optimism of Trump supporters
who were assigned to make money if Trump support decreased was significantly less than that of
Trump detractors who were also assigned to make money if Trump support decreased.
Figure 2: Evidence that the BFF affects behavior with material consequences, over and
above the effects of both the FCE and optimism that outcomes will generally benefit the
self.
Error bars show SE.
BFF v. FCE. The BFF was larger than the FCE. We tested this with a 2 (Trump Support:
supporter, detractor) x 2 (Prediction about MTurkers: today, in one year) mixed ANOVA. The
two-way interaction was significant, F(1, 600)=126.5, p<.001. While Trump supporters thought
49% of MTurkers currently support Trump, they thought 57% would support Trump in one year,
t(212)=-6.88, p<.001. Meanwhile, Trump detractors thought 37% of MTurkers currently support
Trump, and they thought 29% would support Trump in one year, t(388)=-9.43, p<.001. See
SOM for an additional study (Study S1) showing that the BFF is greater than the FCE for
legalizing same sex marriage and legalizing recreational use of marijuana.
$-
$0.05
$0.10
$0.15
$0.20
$0.25
$0.30
Increased support rewarded Decreased support rewarded
Esti
mat
ed
val
ue
of
Futu
re B
on
us
Trump Supporter
Trump Detractor
Belief in a Favorable Future
10
Discussion.
Study 2 shows that the BFF is distinct from the FCE, and distinct from both trait optimism and
optimism that outcomes will generally benefit the self. It also shows that the BFF is not just
cheap talk: it emerges even when people have the opportunity for a financial bonus if they
accurately predict the beliefs of others in the future.
Study 3: BFF is Robust across Cultures
Study 3 further assesses the robustness of the BFF (for political ideology) across collectivistic
and individualistic cultures (Triandis, 1995). Many social biases are moderated by
collectivistic/individualistic cultures, including the FCE (Fiske & Taylor, 2013): people from
collectivistic cultures show greater FCE than people from individualistic cultures (Park, 2012).
We explore whether the pattern of collectivistic cultures showing greater social projection also
holds for the BFF.
Method.
Participants. 824 participants (Mage=38.66, SD=14.91; 48% female) were recruited online
through Global Market Research and Qualtrics and paid $4.50 to complete the survey.
Participants were recruited from two collectivistic countries (China (n=204) and Japan (n=200))
and two individualistic countries (Netherlands (n=210) and United Kingdom (n=210)). The
survey was aimed (ex-ante) to collect two hundred interviews per country.
Design. This survey was part of a larger omnibus survey that asked participants several sets of
questions, including an attention check. The attention check told participants, “In order to
demonstrate that you have read the instructions, please ignore the question below, and simply
click on "other" and write "cards" in the space next to it. Thank you very much. What is your
marital status?” Only participants who passed the attention check at the beginning of the
omnibus survey (86% of participants) were included in the analysis. A significantly lower
percentage of participants from the Netherlands passed the attention check (79%) compared to
the other countries, t(822)=3.56, p<.001. (Results are substantively unchanged whether we
include or exclude participants who did not pass the attention check). The last section of the
survey included all questions relating to BFF. In this section, participants answered two
questions. The first is the ideology question used in the World Values Survey: “The terms “left
(reformist)” or “right (conservative)” are often used to explain a person’s political standing.
How about your political stance? Would you describe yourself as left (reformist), right
(conservative), or in the middle?” The second is a version of the World Values Survey question
that we modified to reflect beliefs about the future: “In 20 years (in 2035), which of the
following do you think most [YOUR COUNTRY] citizens will identify as: left (reformist), right
(conservative), or in the middle?”
Results.
Belief in a Favorable Future
11
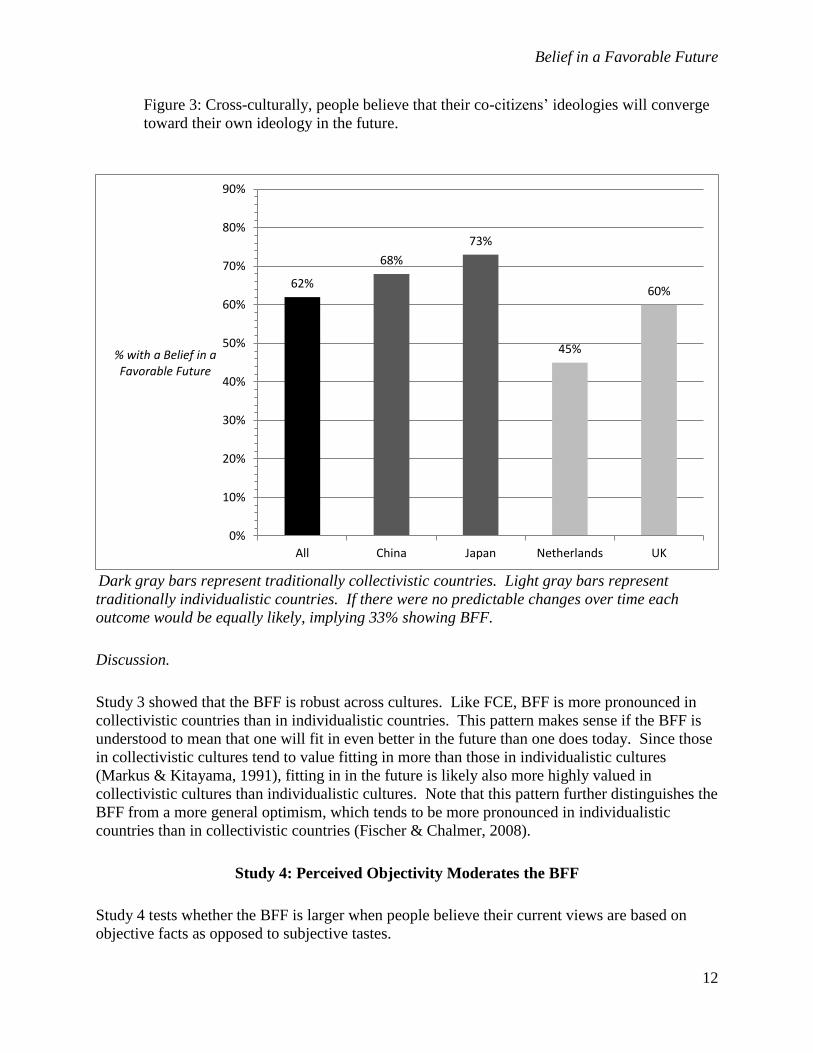
Participants showed a BFF across each of the four countries. The aggregated data reveals
consistent differences between liberals, moderates, and conservatives regarding predictions of
the future, Kruskal-Wallis χ2(2)=92.17, p<.001. Overall, 62% of participants believed that in the
future their country’s citizens would come to share their ideology. This was true across
countries: United Kingdom, χ2(2)=36.9, p<0.001; China, χ
2(2)=36.4, p<0.001; Japan,
χ2(2)=24.5, p<0.001, with the exception of the Netherlands, χ
2(2)=0.74, p=.69.
For all countries, including the Netherlands, the following pattern holds: Left-reformists are
more likely than others to believe that their country will become more Left-reformist in the
future; those “in the middle” are more likely than Left-reformists and Right-conservatives to
believe that their country will become more “in the middle” in the future; and Right-
conservatives are more likely than others to believe that their country will become more Right-
conservative in the future (see SOM).
The BFF, as measured by the percentage of respondents who thought others would change to
favor their own views, was greater among participants from collectivistic countries than
individualistic countries, Log odds=0.77, SE=0.16, p<0.001. The BFF remains significantly
higher among participants from collectivistic countries than individualistic countries when
controlling for country-level variance, either by adding individual countries as covariates, Log
odds=0.96, SE=0.22, p<0.001, or clustering the standard errors by country, Log odds =0.77, SE
=0.26, p=0.003.
Belief in a Favorable Future
12
Figure 3: Cross-culturally, people believe that their co-citizens’ ideologies will converge
toward their own ideology in the future.
Dark gray bars represent traditionally collectivistic countries. Light gray bars represent
traditionally individualistic countries. If there were no predictable changes over time each
outcome would be equally likely, implying 33% showing BFF.
Discussion.
Study 3 showed that the BFF is robust across cultures. Like FCE, BFF is more pronounced in
collectivistic countries than in individualistic countries. This pattern makes sense if the BFF is
understood to mean that one will fit in even better in the future than one does today. Since those
in collectivistic cultures tend to value fitting in more than those in individualistic cultures
(Markus & Kitayama, 1991), fitting in in the future is likely also more highly valued in
collectivistic cultures than individualistic cultures. Note that this pattern further distinguishes the
BFF from a more general optimism, which tends to be more pronounced in individualistic
countries than in collectivistic countries (Fischer & Chalmer, 2008).
Study 4: Perceived Objectivity Moderates the BFF
Study 4 tests whether the BFF is larger when people believe their current views are based on
objective facts as opposed to subjective tastes.
62%
68%
73%
45%
60%
0%
10%
20%
30%
40%
50%
60%
70%
80%
90%
All China Japan Netherlands UK
% with a Belief in a Favorable Future
Belief in a Favorable Future
13
Method.
Participants. Our pre-registered research plan called for 300 participants recruited via Amazon’s
Mechanical Turk (https://osf.io/w38qr/?view_only=0e3b9882980c409fbb489d37b1bc9cf4). We
ultimately recruited 308 participants. Participants received $.40 in compensation. Our plan led
us to exclude 31 participants on suspicion of duplicate participation, leaving data from 277
participants (Mage=31.84, SD=9.67, 39% female). We chose a sample size of 300 participants ex
ante informed by a pilot study.
Design. The experiment manipulated whether participants wrote about their choice of mobile
operating systems as either Subjective or Objective. Participants first indicated which mobile
operating system they preferred: Apple or Android. In the Objective condition, participants
wrote reasons for their favored choice. For example, participants who indicated that they
preferred Apple read:
Please write 2-3 sentences about why a sensible person might prefer the [Apple] mobile
operating system.
The Subjective condition invited participants to consider why another person might prefer the
opposite choice:
Please write 2-3 sentences about why a sensible person might instead prefer the [Android]
mobile operating system.
The manipulation check asked whether operating system preferences are subjective or objective
on a scale from 0 (“Purely subjective. I just like my operating system more, but sensible people
could disagree”) to 100 (“Purely objective. The operating system I prefer is objectively superior
and no sensible person would disagree”).
The key dependent measure then asked participants to forecast which operating system would be
more popular in 5 years. Because we were concerned that the manipulation could have
influenced people’s beliefs about the degree to which others currently shared their preferences,
we also included a measure of the false consensus effect: Participants estimated whether, at
present, more people prefer the Apple or the Android mobile operating system.
Results.
The manipulation check succeeded: Participants in the Objective condition rated the choice as
more objective (M=50.12) than did those in the Subjective condition (M=39.62), t(272)=-3.09,
p=.002. Further, we find no difference of word count across conditions, t(275)=-0.189, p=0.85.
Belief in a Favorable Future
14
The majority of participants (67%) believed that others preferred the same operating system they
did, consistent with FCE. However, an even greater percentage (77%) displayed belief in a
favorable future, t(276)=3.46, p=0.001.
Most importantly, the experimental manipulation had a significant effect on the BFF:
participants in the Objective condition displayed a greater BFF (85%) than those in the
Subjective condition (70%), χ2(1, N=277)=8.87, p=0.003. These results effect hold when
controlling for the false consensus effect; a logistic regression including both the experimental
treatment and our measure of the false consensus effect as predictors shows that the manipulation
remains significant, Log odds=1.01, SE=0.33 p=0.002.
Discussion.
Study 4 showed that when people believe that their views on an issue are objective (as opposed
to subjective) they are more likely to believe that others in the future will share their views.
Study 5: BFF and Beliefs about Future Policy Changes
Incorrectly believing that future others’ policy preferences will change to align with one’s own
could cause people to also believe that future policies will change in ways that align with their
preferences. Study 5 explores whether this belief in a favorable policy change (BFPC) exists,
and if it is moderated by whether people believe a policy is responsive to public opinion.
Method.
Participants. Our pre-registered research plan called for 200 participants recruited via Amazon’s
Mechanical Turk (https://osf.io/eyype/). The sample size was chosen ex ante, informed by a pilot
study. We ultimately recruited 208 participants (Mage=36.19, SD=11.6; 59% male). Participants
received $0.48 in compensation.
Design. Participants answered four blocks of questions each containing four questions about one
policy. The policies were chosen based on a pilot study in which twenty three policies were
rated for how responsive participants believed they were to public opinion (Study S2 in SOM).
We selected for inclusion in the present study the two policies participants believed were the
most responsive to public opinion (the ease or difficulty of legally obtaining marijuana for
recreational use, and the ease or difficulty of two individuals of the same sex getting married)
and the two policies participants believed were the least responsive to public opinion (the
permissibility of the National Security Agency monitoring the communications of American
citizens, and changing the amount of money spent on the military).
In each policy block, participants were asked about their 1) current preferences regarding the
policy; 2) their belief about preferences of others in the future; 3) their belief about how the
policy will change in the future; and 4) their belief about how responsiveness the policy is to
public opinion. For exact questions see SOM. Block order was randomized and question order
within-block was also randomized.
Belief in a Favorable Future
15
Results.
BFF. We test for the presence of BFF using the same method used in the previous studies: by
estimating the degree to which people’s current preferences bias their beliefs about the views of
future others. All four topics show the BFF, all Kruskal-Wallis χ2>19, p<.001. (See SOM for
complete cross tabulations).
Responsiveness to public opinion. Consistent with Study S2, on average 87% of participants
reported that marijuana and same sex marriage policies were responsive to public opinion,
whereas on average 40% reported that NSA and military spending were responsive to public
opinion, χ2(1)=17.4, p<.001
BFPC and policy responsiveness. Participants who believe that a given policy will change in the
future in ways that align with their current policy preferences are coded as showing BFPC. The
pre-registered analysis plan describes two strategies for testing whether participants believe that
policies that are responsive to public opinion will be more likely to show a BFPC than policies
that are not responsive to public opinion. The first involves including all participant responses
for a given policy, regardless of whether or not they show a BFF for the policy. In terms of
marijuana policy, 81% of participants showed both a BFF and a BFPC. Same sex marriage
policy showed the same general pattern, with 83% of participants showing both a BFF and a
BFPC. Only 40% of participants showed both a BFF and BFPC for NSA policy, and only 49%
of participants showed both a BFF and BFPC for military spending policy. The average percent
who showed both a BFF and BFPC for the two policies believed to be highly responsive to
public opinion (marijuana and same sex marriage) was 82%, whereas the average for the two
policies believed to be less responsive to public opinion (NSA and military spending) was 45%,
χ2(1)=10.78, p=.001.
The second analysis strategy entailed examining what percent of participants who showed a BFF
also showed a BFPC. This strategy is motivated by the presumption that BFF is a necessary
precondition for BFF to lead to BFPC. This strategy shows the same pattern as the other
strategy. In terms of recreational marijuana laws, 96% (169/176) of participants who showed a
BFF also showed a BFPC. Same sex marriage policy showed the same general pattern, with
96% (172/179) of participants who showed a BFF also showing a BFPC. Only 54% (84/157) of
participants who showed a BFF for NSA policy also showed a BFPC. And only 60% (101/167)
of participants who showed a BFF for military spending also showed a BFPC. For the two
policies believed to be highly responsive to public opinion (marijuana and same sex marriage),
the average percent of those who showed a BFF who also showed a BFPC was 96% (average
numerator and denominator:170.5/177.5). For the two policies believed to be less responsive to
public opinion (NSA and military spending) the average percent of those who showed a BFF
who also showed a BFPC was 57% (92.5/162), χ2(1)=9.94, p=.002.
Discussion.
Study 5 provides evidence that for policies believed to be responsive to public opinion, BFF may
lead people to believe that the policy will change in favorable ways in the future.
Belief in a Favorable Future
16
Study 6: Can BFF Contribute to Political Inaction?
Study 6b is a large field experiment involving political donations. Participants are led to believe
either that their preferred candidate will win (favorable future) or lose (unfavorable future). If
believing in a favorable future causes inaction, then participants should be less likely to donate
when they believe that their preferred candidate will win, and they should be more likely to
donate when they believe their preferred candidate will lose. That is, we predict that believing in
a favorable future undermines participants’ willingness to take action to make that favorable
future more likely. Study 6a is a manipulation check showing that the treatment in Study 6b
actually alters whether people think the future will be favorable.
Study 6a: Pilot
Method.
Participants. We recruited 352 participants (Mage=33.33, SD=10.59; 44% female) via Amazon’s
Mechanical Turk using an announcement that offered to pay self-identified Democrats $.24 for
completing a short survey. It required that participants be located in the United States. The
sample size was chosen to ensure adequate power based on a guess about the likely effect size.
Design. Participants were randomly assigned to one of three conditions, and all were presented
with the following scenario, based on the specific details and messages of the treatments in Study
6b: “Please imagine that a Democratic candidate is campaigning to be Governor of Florida. The
election is in a few months. The candidate is running against the current Republican Governor;
though the Democratic candidate is a former Governor who had been elected several election
cycles ago.”
Those assigned to the No-BFF condition were then presented with the following information: “A
recent poll came out saying that the election was close and that the Democratic candidate was
LOSING.” Those assigned to the BFF condition were then presented with the following
information: “A recent poll came out saying that the election was close and that the Democratic
candidate was WINNING.” Those assigned to the Control condition were not presented with any
polling information. Following these scenarios participants were asked: “Given this
information, would you say that the Democratic candidate is more likely to win the election or
more likely to lose the election?” Participants could choose from two responses: “More likely to
win the election” or “More likely to lose the election.” Participants then answered demographic
questions before completing the survey.
Results.
Those assigned to the BFF condition were more likely to think that their candidate was more
likely to win the election (95%) than those in the No-BFF condition (13%), Log odds
Belief in a Favorable Future
17
ratio=4.84, SE=.5, p<0.001. Those assigned to the BFF condition were more likely to think that
their candidate was more likely to win the election (95%) than those in the Control condition
(59%), Log odds =2.55, SE=0.46, p<0.001, and those in the Control condition were more likely
to think that their candidate was more likely to win the election (59%) than those in the No-BFF
condition (13%), Log odds =2.29, SE=0.33, p<0.001.
Study 6b: BFF Field Experiment
Method.
Participants. We sent messages to a total of 660,542 emails addresses from the fundraising email
list of the Democratic Governors Association (DGA). Of these, 63,520 had donated to the DGA
in the past and 597,022 had not donated in the past. The data do not include age or gender.
Design. Working with a leading online fundraising consultancy, we developed two emails that
the DGA distributed to its entire fundraising email list. The list contained past donors and
prospective donors who the DGA believed were supporters of Democratic candidates and
potential donors of Democratic gubernatorial candidates. The emails attempted to raise money
on behalf of Charlie Crist, the Democratic candidate for Florida Governor in 2014. Charlie Crist
was running against incumbent Republican Governor of Florida, Rick Scott. The emails were
sent on June 30, 2014. The content for both emails was based on actual recent polling data. Half
of recipients were randomly assigned to receive the BFF condition email (N=330,302), which
read:
BREAKING: A new SurveyUSA poll has Democrats LEADING Rick Scott in
Florida, 44-40!!! Now is THE moment to DETHRONE the king of voter
suppression and his allies in key battlegrounds.”
[NAME],
We have to protect this lead! If we let Scott overtake us, we’ll lose this November
and risk the White House in 2016 – that’s a slippery slope we CAN’T afford.
The ONLY way to protect our lead and win is to get a team on the ground to rally
our Democratic supporters and protect every single vote. Scott cheated his way
into office before – we CAN’T let him do it again.
The other half were randomly assigned to the No-BFF condition (N=330,240), which read:
BREAKING: A new SurveyUSA Poll has Democrats LOSING to Rick Scott in
Florida, 41-42!!! Now is THE moment to DETHRONE the king of voter
suppression and his allies in key battlegrounds.”
Belief in a Favorable Future
18
[NAME],
If we fall further behind in Florida and other key battlegrounds, we’ll lose this
November and risk the White House in 2016 – that’s a slippery slope we CAN’T
afford.
The ONLY way to turn this around is to get a team on the ground to rally our
Democratic supporters and protect every single vote. Scott cheated his way into
office before – we CAN’T let him and other Republicans do it again.
All other content in the two emails was the same. See SOM for reproductions of both emails.
Results
See SOM for details on the data hygiene and data integration strategy.
“Opened” Emails. Some email viewing platforms inform email senders whether emails have
been viewed. Such emails are referred to as having been “opened.” This is considered a loose
proxy for whether recipients read and engage with an email. Participants in the BFF condition
(12.05%) were less likely to open the email than participants in the No-BFF condition (12.33%),
controlling for donor status, Log odds=0.026, SE=.0075, p=0.001. The results for this analysis
and future analyses are not substantively affected by whether or not we control for donor status,
and the pattern is consistent across both donor types (previous and new donors), see SOM. Note
that our low response rates are within the range of industry averages for prospect fundraising
lists (M+R, 2016).
Click-through. Participants in the BFF condition (0.25%) were less likely to click on the link to
donate (embedded within the email) than participants in the No-BFF condition (0.30%),
controlling for donor status, Log odds=0.17, SE=.047, p<0.001. The pattern is consistent across
both types of donors, see SOM.
Donations. Participants in the BFF condition (N=145, 0.04%) were less likely to make a
donation than participants in the No-BFF condition (N=196, 0.06%), controlling for donor status,
Log odds=0.30, SE=.11 p=0.006. The pattern is consistent across both types of donors, see
SOM.
Amount Donated. Participants in the BFF condition donated $2,954.50, averaging $20.38 per
donation. Participants in the No-BFF condition donated $4,413, averaging $22.52 per donation.
This BFF participants gave less money than No-BFF participants, controlling for donor status,
B=0.0044, SE=.0025 p=0.077. The test we report is marginally significant using a conservative
two-tailed test; the test would be statistically significant with a one-tailed test, which is
appropriate given our directional hypothesis. The difference is driven by past donors and not
new donors, see SOM.
Belief in a Favorable Future
19
Discussion
Studies 6a and 6b showed that believing the future will be favorable can discourage people from
taking action that could increase the chance that the favorable future actually will arise.
General Discussion
We demonstrated across six studies that people hold a belief in a favorable future, and that this
belief affects behavior. In Study 1, people believed that their views on politics (abortion, same
sex marriage, ideology, partisanship, Trump support), entertainment (interest in NBA), products
(soda, phone operating system) and science (climate change) would be more widely held in the
future in comparison to the beliefs of those who hold opposing views. Study 2 revealed that the
BFF is larger in magnitude than the FCE, is distinct from two forms of optimism, and affects
financial decisions. Study 3 showed that the BFF emerges across cultures. Study 4 revealed that
the BFF is greatest when people consider their views to be based on objective fact as opposed to
subjective taste. Study 5 showed that believing future others will share one’s policy preferences
can lead to believing one’s policy preferences will be enacted in the future. Finally, Studies 6a
and 6b showed that people’s BFF can reduce their likelihoods of donating money to a campaign
that they would like to win.
What other mechanisms might underlie the BFF? Since the FCE is largest when people consider
the views of others whom they know as opposed to others whom they do not know (Robbins &
Krueger, 2005), the BFF may also be largest for known or similar others, and smallest for
unknown or dissimilar others. If anything, this research suggests that our studies may reflect
relatively small magnitudes of the BFF, since the future others about whom participants
projected were vague and unknown. Another possible driver of the BFF might be threats to the
self, if such threats lead people to defend and bolster their opinions or cultural worldviews;
affirming the self may in turn reduce the BFF (see Schmeichel & Martens, 2005).
One implication of the BFF is that, in addition to believing progress will occur between the
present and the future, people may believe that the progress that has been achieved up until today
will endure into the future (Fukuyama, 2006; Quoidbach, Gilbert, & Wilson, 2013). This “end of
history” belief may reduce people’s vigilance to prevent backsliding and decline. In Study 2,
Trump detractors believe there will be even more Trump detractors in a year, while Trump
supporters believe there will be even more Trump supporters in a year. Indeed, Study 6b shows
that believing the future will unfold in a favorable way can undermine people’s motivation to
take costly action today to bring about the desired state tomorrow. Consistent with this, Bain et
al. (2013) found that changing people’s beliefs about what will occur in the future changes their
likelihoods of taking action today. People in poorly matched relationships (with partners,
religions, or jobs) may be too reluctant to move on because they believe that their counterpart
will eventually change to see their side; people who support (or oppose) a political issue (e.g.,
legalizing recreational marijuana use) might underestimate the strength of opposition to their
views in the future. Ironically, the BFF can undermine people’s likelihoods of actually making
their more favorable futures come to fruition.

Belief in a Favorable Future
20
ACKNOWLEDGEMENTS: We thank HKS, CPL and HBS; Adan Acevedo, Carly Robinson,
Avi Feller, Sam Skowronek, Gonzalo Pons, and Alec Yeh for data assistance; Anne Lewis
Strategies and DGA for Study 6b collaboration.
Belief in a Favorable Future
21
References
Arndt, J., Greenberg, J., Solomon, S., Pyszczynski, T., & Schimel, J. (1999). Creativity and
terror management: Evidence that creative activity increases guilt and social projection
following mortality salience. Journal of Personality and Social Psychology, 77(1), 19-32.
Bain, P. G., Hornsey, M. J., Bongiorno, R., Kashima, Y., & Crimston, D. (2013). Collective
futures how projections about the future of society are related to actions and attitudes
supporting social change. Personality and Social Psychology Bulletin, 39(4), 523-539.
Baron, J. (1997). Confusion of relative and absolute risk in valuation. Journal of Risk and
Uncertainty, 14, 301–309.
Carville, J. (2009). 40 more years: How the Democrats will rule the next generation. New York:
Simon and Schuster.
Epley, N., Morewedge, C. K., & Keysar, B. (2004). Perspective taking in children and adults:
Equivalent egocentrism but differential correction. Journal of Experimental Social
Psychology, 40(6), 760-768.
Fischer, R., & Chalmers, A. (2008). Is optimism universal? A meta-analytical investigation of
optimism levels across 22 nations. Personality and Individual Differences, 45(5), 378-
382.
Fiske, S. T., & Taylor, S. E. (2013). Social cognition: From brains to culture. Sage.
Fukuyama, F. (2006). The end of history and the last man. Simon and Schuster.
Gilovich, T., Kerr, M., & Medvec, V. H. (1993). Effect of temporal perspective on subjective
confidence. Journal of Personality and Social Psychology, 64(4), 552–560.
Hamburger, T., & Wallsten, P. (2006). One party country: The republican plan for dominance in
the 21st century. Wiley.
Harris, A. J. L., & Hahn, U. (2011). Unrealistic optimism about future life events: A cautionary
note. Psychological Review, 118, 135–154. doi: 10.1037/a0020997
Krizan, Z., & Windschitl, P. D. (2009). Wishful Thinking about the Future: Does Desire Impact
Optimism? Social and Personality Psychology Compass, 3(3), 227–243.
Krueger, J. I. (2000). The projective perception of the social world: A building block of social
comparison processes. In J. Suls & L. Wheeler (Eds.), Handbook of social comparison:
Theory and research (pp. 323–351). Dordrecht, Netherlands: Kluwer Academic
Publishers.
Marks, G., & Miller, N. (1985). The effect of certainty on consensus judgments. Personality and
Social Psychology Bulletin, 11(2), 165-177.
Marks, G., & Miller, N. (1987). Ten years of research on the false-consensus effect: An
empirical and theoretical review. Psychological Bulletin, 102(1), 72.
Markus, H. R., & Kitayama, S. (1991). Culture and the self: Implications for cognition, emotion,
and motivation. Psychological review, 98(2), 224.
Monin, B. & Norton, M.I. (2003). Perceptions of a fluid consensus: Uniqueness bias, false
consensus, false polarization and pluralistic ignorance in a water conservation crisis.
Personality and Social Psychology Bulletin, 29, 559–567.
Moore, D. A. (2007). When good=better than average. Judgment and Decision Making, 2(5),
277–291.
Mullen, B., Atkins, J. L., Champions, D. S., Edwards, C., Hardy, D., Story, J. E., et al. (1985).
The False Consensus Effect: A Meta-Analysis of 155 Hypothesis Tests. Journal of
Experimental Social Psychology, 21, 262-283.
Belief in a Favorable Future
22
M+R (2016). M+R Benchmarks, 2016. Downloaded: March 1, 2017: http://mrbenchmarks.com/
Park, H. S. (2012). Culture, need for uniqueness, and the false consensus effect. Journal of
Social, Evolutionary, and Cultural Psychology, 6(1), 82-92.
Pronin, E., Lin, D., & Ross, L. (2002). The Bias Blind Spot: Perceptions of bias in self versus
others. Personality and Social Psychology Bulletin, 28(3), 369-381.
Quoidbach, J., Gilbert, D., & Wilson, T. (2013). The end of history illusion. Science, 339, 96-98.
Rand, D. G., Peysakhovich, A., Kraft-Todd, G. T., Newman, G. E., Wurzbacher, O., Nowak, M.
A., & Greene, J. D. (2014). Social heuristics shape intuitive cooperation. Nature
Communications, 5, 3677.
Robbins, J. M., & Krueger, J. I. (2005). Social projection to ingroups and outgroups: A review
and meta-analysis. Personality and Social Psychology Review, 9(1), 32-47.
Rogers, T., & Bazerman, M. H. (2008). Future lock-in: Future implementation increases
selection of ‘should’ choices. Organizational Behavior and Human Decision
Processes, 106(1), 1-20.
Ross, L., Greene, D., & House, P. (1977). The “false consensus effect”: An egocentric bias in
social perception and attribution processes. Journal of Experimental Social
Psychology, 13(3), 279-301.
Ross, L., & Ward, A. (1996). Naive realism in everyday life: Implications for social conflict and
misunderstanding. In T. Brown, E. S. Reed, & E. Turiel (Eds.), Values and knowledge.
The Jean Piaget Symposium Series (pp. 103–135). Hillsdale, NJ: Erlbaum.
Ross, L. D., Lelkes, Y., & Russell, A. G. (2012). How Christians reconcile their personal
political views and the teachings of their faith: Projection as a means of dissonance
reduction. Proceedings of the National Academy of Sciences, 109(10), 3616-3622.
Scheier, M. F., Carver, C. S., & Bridges, M. W. (1994). Distinguishing optimism from
neuroticism (and trait anxiety, self-mastery, and self-esteem): A reevaluation of the Life
Orientation Test. Journal of Personality and Social Psychology, 67(6), 1063–1078.
Schmeichel, B.J., & Martens, A. (2005). Self-affirmation and mortality salience: Affirming
values reduces worldview defense and death-thought accessibility. Personality and Social
Psychology Bulletin, 31, 658–667.
Simmons, J. P., & Massey, C. (2012). Is optimism real? Journal of Experimental Psychology:
General, 141(4), 630-634.
Tetlock, P. (2005). Expert political judgment: How good is it? How can we know? Princeton, NJ:
Princeton University Press.Vazire, S. (2010). Who Knows What About a Person? The
Self–Other Knowledge Asymmetry (SOKA) Model. Journal of Personality and Social
Psychology, 98(2), 281–300.
Wilson, T. D., & Gilbert, D. T. (2005). Affective forecasting knowing what to want. Current
Directions in Psychological Science, 14(3), 131-134.
Zar, J. H. (1999). Biostatistical analysis. Pearson Education India.