Embed Size (px)
Citation preview
BEHAVIOURS OF SIC FIBERS AND SIC CVI MATRIX
Christian Colin, L. Gélébart
CEA Saclay
DEN/DMN/SRMA/LC2M
91 191 Gif-sur-Yvette Cedex, France
ABSTRACT CEA has developed a specific device for tensile tests on fibers at high temperature, up to 1800°C, under
secondary vacuum. Two different SiC fibers are examined in this study: Hi-NicalonTM S and
TyrannoTM SA3. Microcomposites have been also fabricated to determine SiC CVI matrix elastic
properties. This paper presents the obtained results: the evolution of elastic modulus for fibers in the
range 20-1800°C, and for matrix below 1000°C. The electrical resistivity of specimens is also studied.
1. INTRODUCTION
Owing to progress in the manufacturing of SiC fibers (Hi-NicalonTM
S,
TyrannoTM
SA3), the mechanical and thermal behaviours of SiCf/SiCm composites have
been sharply improved. Besides, regarding their physical and chemical properties and
their stability under irradiation, SiCf/SiC composites are potential candidates for
nuclear applications in advanced fission (Generation IV) and fusion reactors (ITER).
For example, these composites are intended as fuel cladding in Gas cooled Fast Reactor
(GFR). These applications imply a severe environment including high temperature, fast
neutrons spectrum and surrounding coolant and fuels. That is why CEA launched a
specific program to characterize and optimize SiCf/SiC composites before their use in
reactors. Among the numerous investigations aiming to evaluate this material, CEA is
developing a multi-scale approach and modelling to forecast the behaviour of
SiCf/SiCm; this requires very good knowledge of each constituent of the composite
(fiber, interphase, matrix).
The purpose of this work is to determine the behaviours of SiC fibers and SiC matrix
produced by Chemical Vapour Infiltration CVI based technique. More specifically, it
concerns the elastic tensile properties of fibers and matrix and the electric properties of
fibers.
2. EXPERIMENTS AND MATERIALS
2.1 Experimental device
CEA has developed in collaboration with LCTS a specific device for tensile tests at
high temperature on fibers, named MecaSiC. It is described more specifically
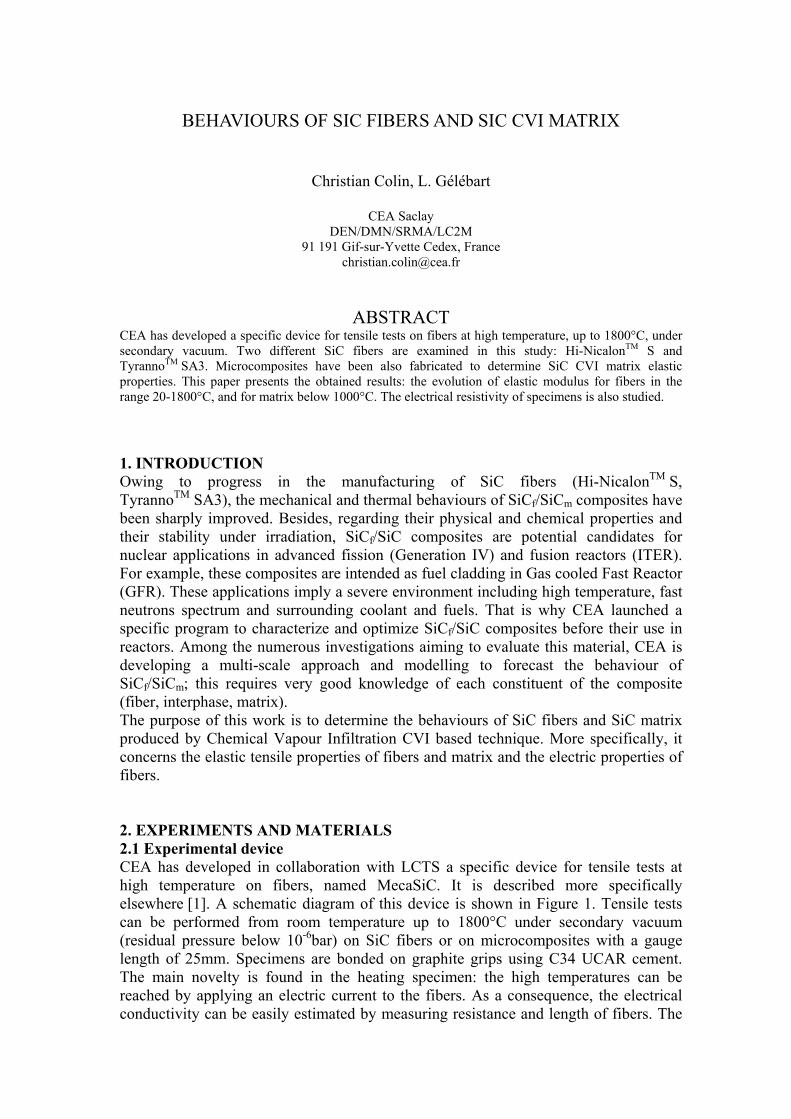
elsewhere [1]. A schematic diagram of this device is shown in Figure 1. Tensile tests
can be performed from room temperature up to 1800°C under secondary vacuum
(residual pressure below 10-6bar) on SiC fibers or on microcomposites with a gauge
length of 25mm. Specimens are bonded on graphite grips using C34 UCAR cement.
The main novelty is found in the heating specimen: the high temperatures can be
reached by applying an electric current to the fibers. As a consequence, the electrical
conductivity can be easily estimated by measuring resistance and length of fibers. The
section of SiC fibers is assumed to be circular and the diameter (average of five
measurements per fiber) is measured, before tests, using laser diffractometry. Sample
strain is derived from grip displacement by using a compliance calibration technique.
The load cell is in the vacuum chamber.
Pyrometer
Load cell
Micrometerdisplacement table
Pump
Vacuum captors
Displacementmeasure
Figure 1: Schematic diagram and view of MecaSiC device.
2.2 Materials
Two different SiC fibers are examined in this study: Hi-NicalonTM
Type-S (HNLS) and
TyrannoTM
SA3 (TSA3). Table 1 lists fibers properties provided by the manufacturers
and various references [2-5].
Microcomposites have been prepared to determine SiC CVI matrix elastic properties. A
microcomposite consists in a single fiber coated with a matrix. In our case, the fiber is a
carbon fiber XN05TM
. There is no compliant coating interposed between the fiber and
the matrix. The mechanical properties of this carbon fiber are resumed in the Table 1.
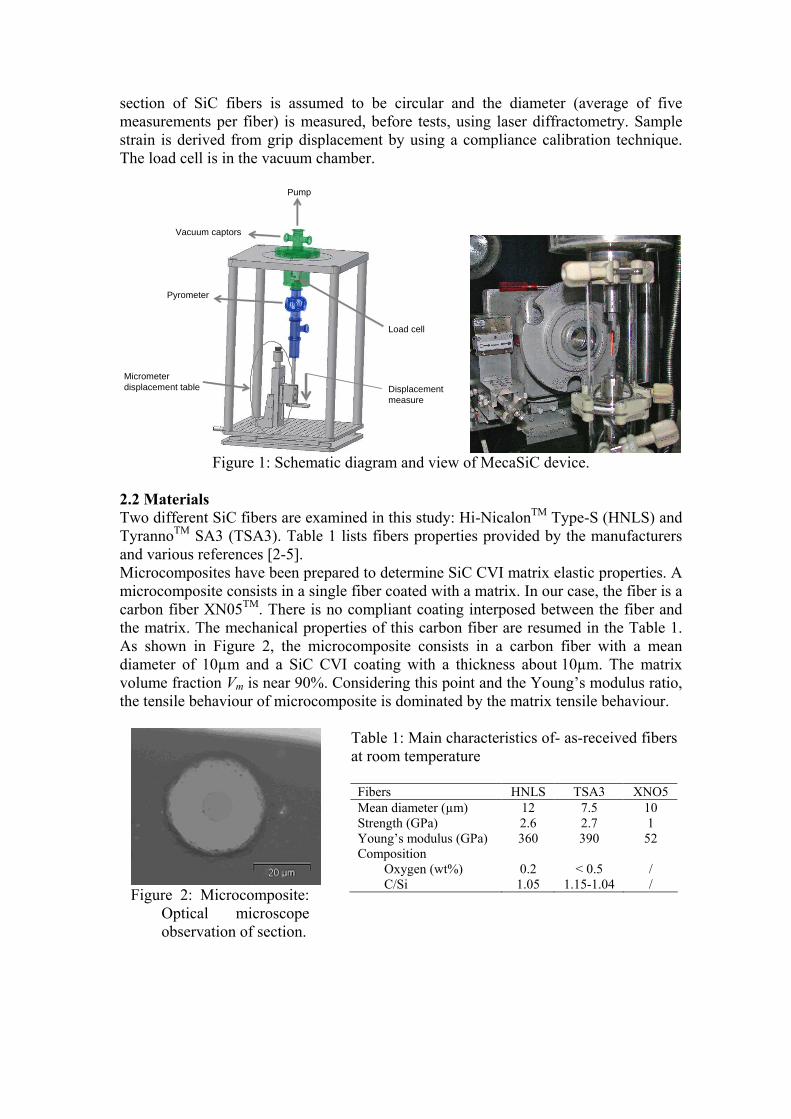
As shown in Figure 2, the microcomposite consists in a carbon fiber with a mean
diameter of 10µm and a SiC CVI coating with a thickness about 10µm. The matrix
volume fraction Vm is near 90%. Considering this point and the Young’s modulus ratio,
the tensile behaviour of microcomposite is dominated by the matrix tensile behaviour.
Figure 2: Microcomposite:
Optical microscope
observation of section.
Table 1: Main characteristics of- as-received fibers
at room temperature
Fibers HNLS TSA3 XNO5
Mean diameter (µm) 12 7.5 10
Strength (GPa) 2.6 2.7 1
Young’s modulus (GPa) 360 390 52
Composition
Oxygen (wt%) 0.2 < 0.5 /
C/Si 1.05 1.15-1.04 /
2.3 Experimental procedure
Fibers temperature measurement and estimation
It is shown that, with this heating method, the fiber temperature can be considered as
uniform along and in the section of the fiber [6]. Temperature at the fiber surface can be
measured by using a bichromatic pyrometer. In practice, using our model, IRCON
Modline 3R pyrometer, only temperatures in the range 1200-2000°C are measured on
smallest fibers (TSA3 is sometimes less than 7µm in diameter). Since tests are
performed under secondary vacuum, it is assumed that heat all the supplied electric
power Pelec is evacuated by the thermal radiation of the fiber. So the specimen
temperature T* can be estimated by the relation:
( )44* Relec TTSFP −= εσ (1)
Where σ is the Stefan’s constant, ε is the fiber emissivity (equal to 1 in our case), F is
the shape factor (equal to 1 in our case), S is the surface of the specimen, TR is the room
temperature. L and D are considered to be constant and equal to their initial values L0
and D0. According to the relation (2), the uncertainty on the estimated temperature,
**T
T∆ , is overestimated to 5%. The largest part is due to the uncertainty on length
and diameter.
∆+∆+∆+∆≈∆D
D
L
L
I
I
U
U
T
T
4
1
*
* (2)
Where U and I are the voltage and the intensity applied to the fiber.
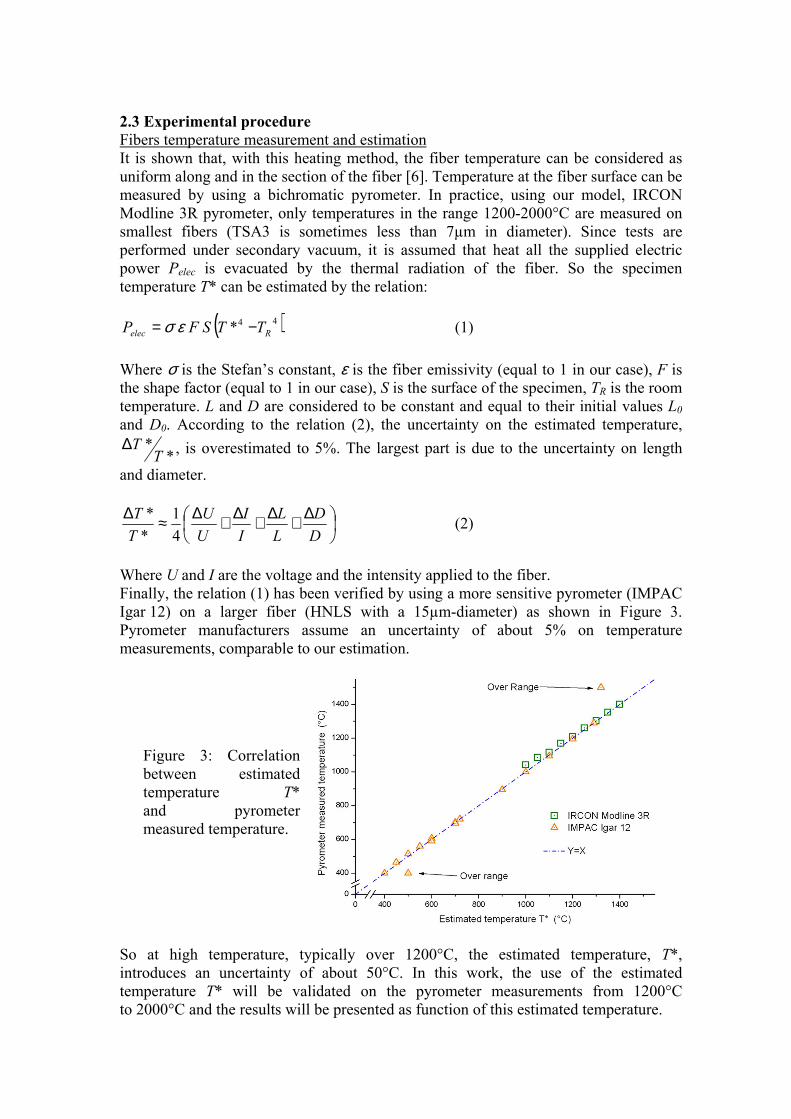
Finally, the relation (1) has been verified by using a more sensitive pyrometer (IMPAC
Igar 12) on a larger fiber (HNLS with a 15µm-diameter) as shown in Figure 3.
Pyrometer manufacturers assume an uncertainty of about 5% on temperature
measurements, comparable to our estimation.
Figure 3: Correlation
between estimated
temperature T*
and pyrometer
measured temperature.
So at high temperature, typically over 1200°C, the estimated temperature, T*,
introduces an uncertainty of about 50°C. In this work, the use of the estimated
temperature T* will be validated on the pyrometer measurements from 1200°C
to 2000°C and the results will be presented as function of this estimated temperature.
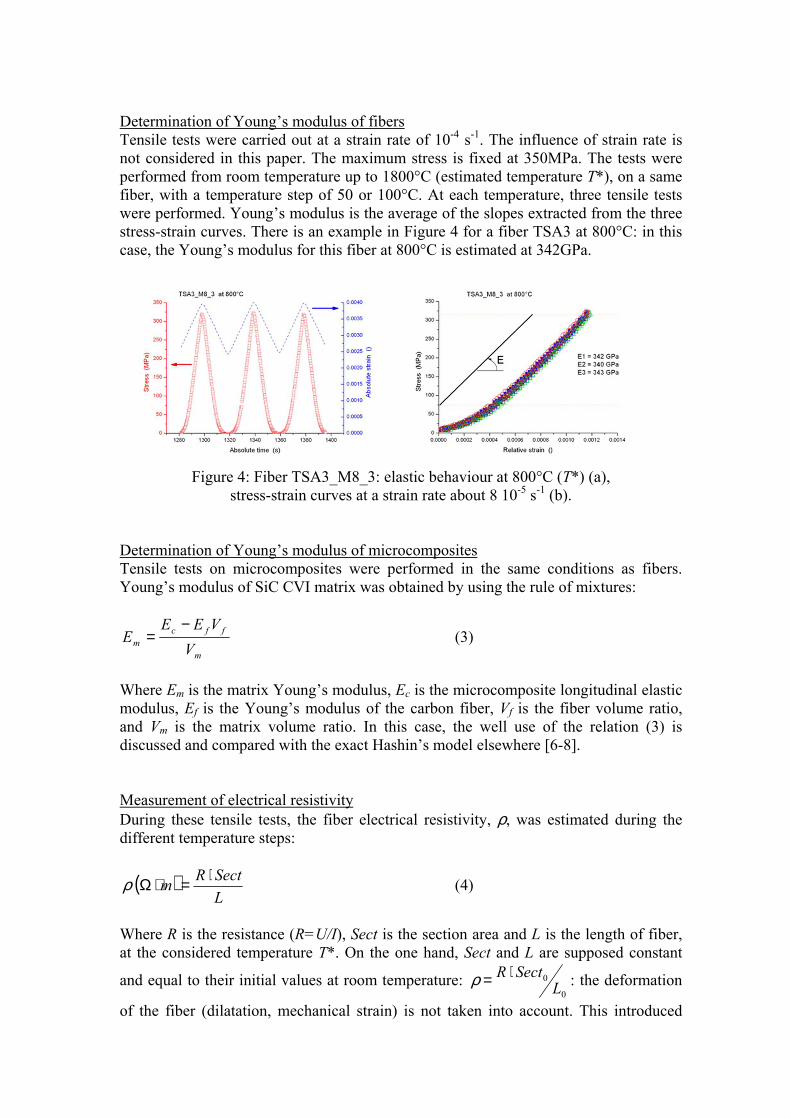
Determination of Young’s modulus of fibers
Tensile tests were carried out at a strain rate of 10-4 s
-1. The influence of strain rate is
not considered in this paper. The maximum stress is fixed at 350MPa. The tests were
performed from room temperature up to 1800°C (estimated temperature T*), on a same
fiber, with a temperature step of 50 or 100°C. At each temperature, three tensile tests
were performed. Young’s modulus is the average of the slopes extracted from the three
stress-strain curves. There is an example in Figure 4 for a fiber TSA3 at 800°C: in this
case, the Young’s modulus for this fiber at 800°C is estimated at 342GPa.
Figure 4: Fiber TSA3_M8_3: elastic behaviour at 800°C (T*) (a),
stress-strain curves at a strain rate about 8 10-5 s
-1 (b).
Determination of Young’s modulus of microcomposites
Tensile tests on microcomposites were performed in the same conditions as fibers.
Young’s modulus of SiC CVI matrix was obtained by using the rule of mixtures:
m
ffc
mV
VEEE
−= (3)
Where Em is the matrix Young’s modulus, Ec is the microcomposite longitudinal elastic
modulus, Ef is the Young’s modulus of the carbon fiber, Vf is the fiber volume ratio,
and Vm is the matrix volume ratio. In this case, the well use of the relation (3) is
discussed and compared with the exact Hashin’s model elsewhere [6-8].
Measurement of electrical resistivity
During these tensile tests, the fiber electrical resistivity, ρ, was estimated during the
different temperature steps:
( )L
SectRm
⋅=⋅Ωρ (4)
Where R is the resistance (R=U/I), Sect is the section area and L is the length of fiber,
at the considered temperature T*. On the one hand, Sect and L are supposed constant
and equal to their initial values at room temperature: 0
0
LSectR ⋅=ρ : the deformation
of the fiber (dilatation, mechanical strain) is not taken into account. This introduced
uncertainly is estimated as: Σ≈∆+∆≈∆ 3LL
SectSect
ρρ
, where Σ is the cumulative
fiber deformation, dilatation plus mechanical strain. The experiments show that Σ is less than 1% at highest temperatures. On the other hand, the voltage U is measured at
the generator terminals. Thus, the resistance R corresponds to the fiber resistance plus
the supplied circuit resistance. In fact, the supplied resistance, near 250Ω, is negligible
compared to the fiber resistance that is over 500kΩ. The measurement uncertainty on R
is about 2%. Finally the uncertainty on fiber resistivity measurement is less than 5%.
3. RESULTS
This part will consist in a brief description of the obtained results. Indeed, a more
detailed paper is in progress and will soon be submitted to publication: it will describe
the results in details and will present an extended discussion. To obtain further details,
the reader will be interested in this article.
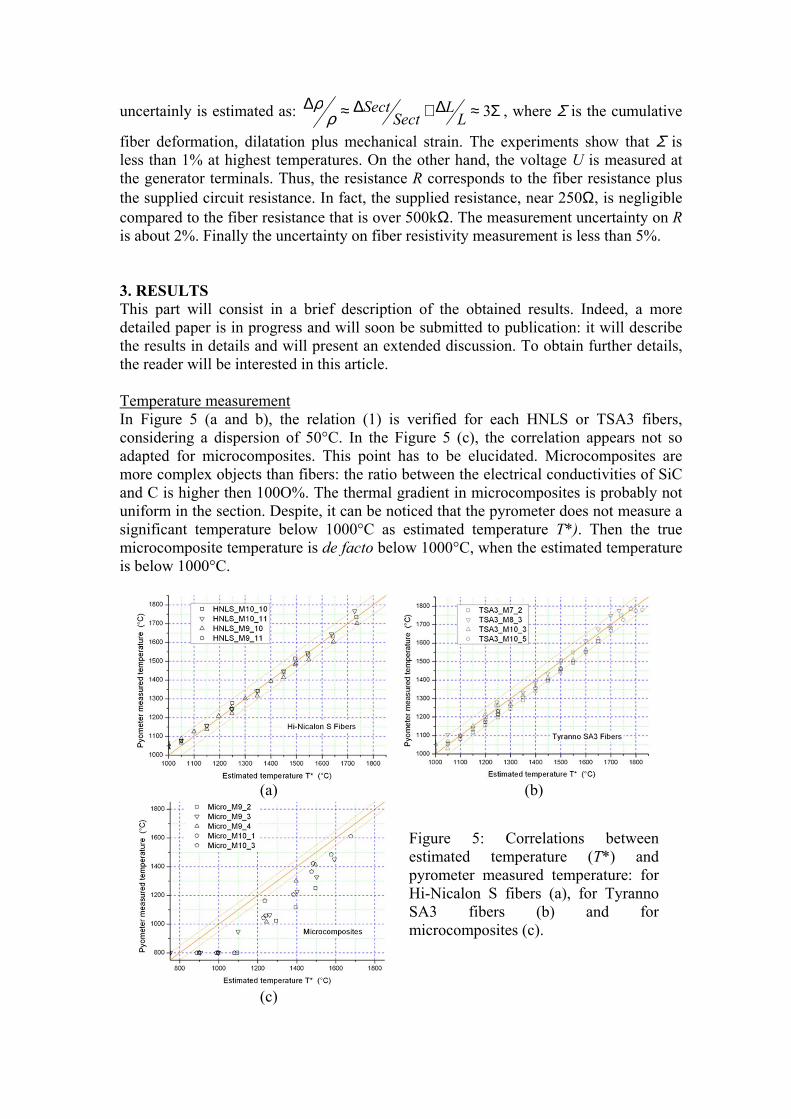
Temperature measurement
In Figure 5 (a and b), the relation (1) is verified for each HNLS or TSA3 fibers,
considering a dispersion of 50°C. In the Figure 5 (c), the correlation appears not so
adapted for microcomposites. This point has to be elucidated. Microcomposites are
more complex objects than fibers: the ratio between the electrical conductivities of SiC
and C is higher then 100O%. The thermal gradient in microcomposites is probably not
uniform in the section. Despite, it can be noticed that the pyrometer does not measure a
significant temperature below 1000°C as estimated temperature T*). Then the true
microcomposite temperature is de facto below 1000°C, when the estimated temperature
is below 1000°C.
(a) (b)
Figure 5: Correlations between
estimated temperature (T*) and
pyrometer measured temperature: for
Hi-Nicalon S fibers (a), for Tyranno
SA3 fibers (b) and for
microcomposites (c).
(c)
So it is assumed that the estimated temperature is a good estimation of the fiber
temperature and the microcomposite temperature is below 1000°C when the estimated
temperature T* is below 1000°C.
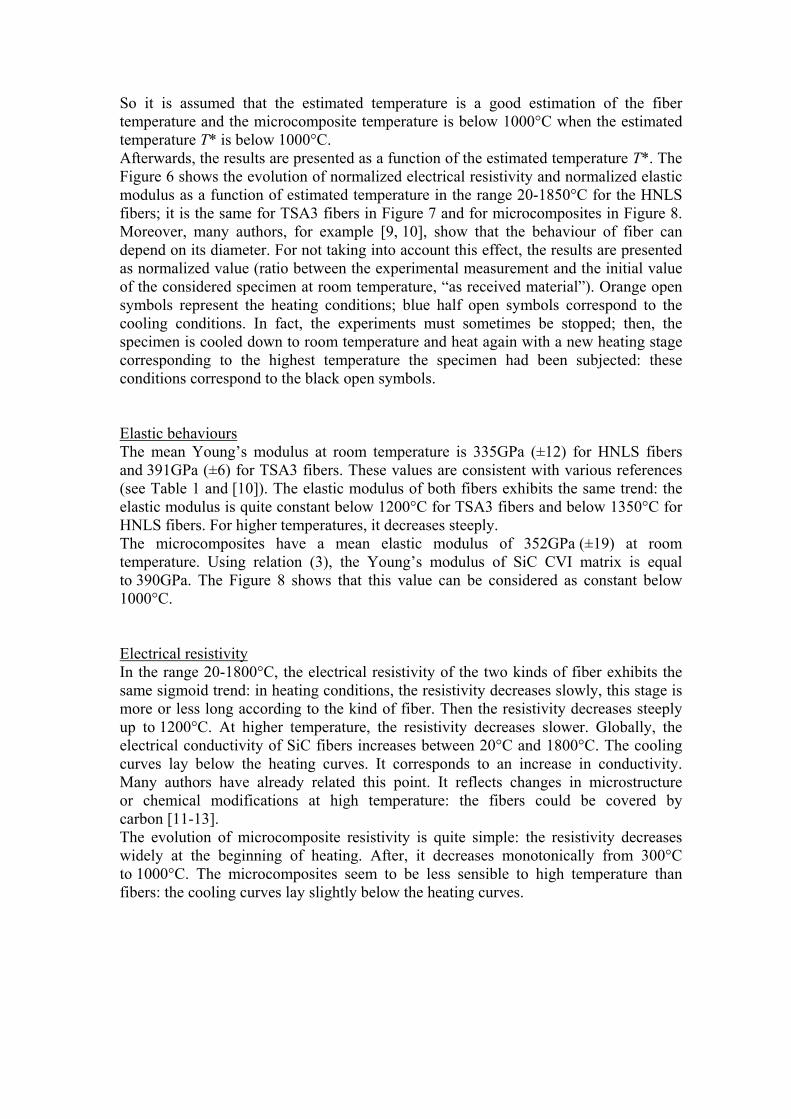
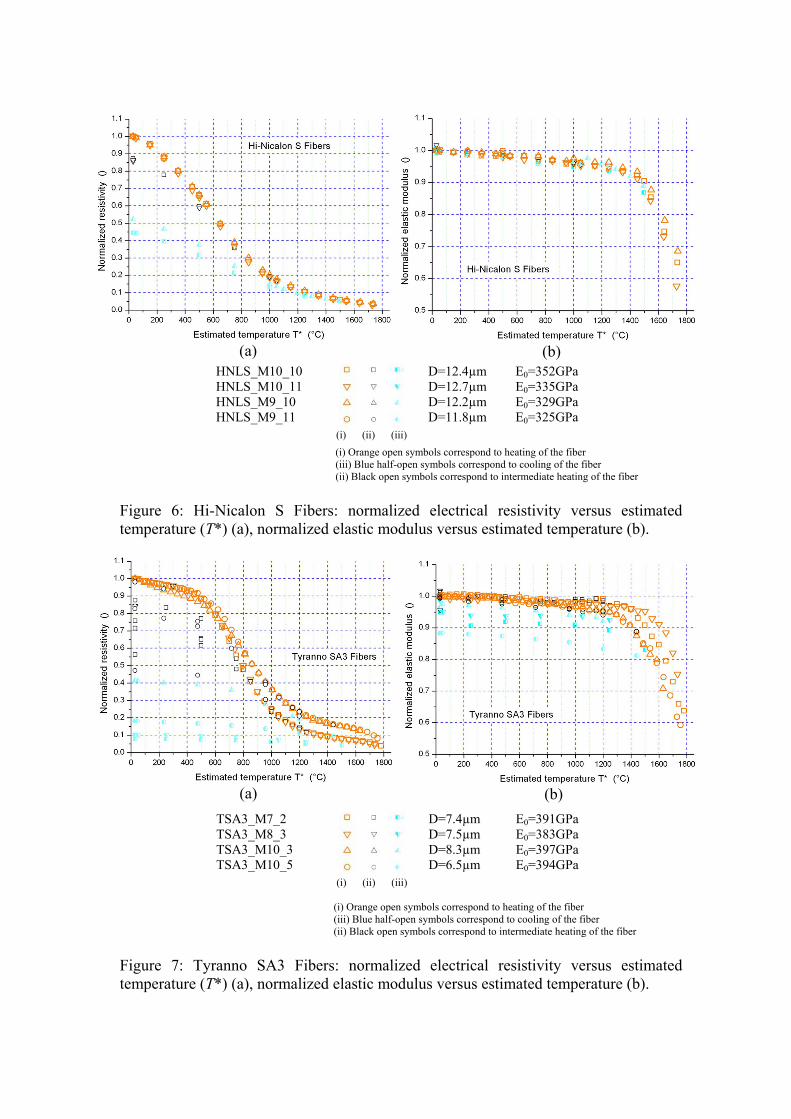
Afterwards, the results are presented as a function of the estimated temperature T*. The
Figure 6 shows the evolution of normalized electrical resistivity and normalized elastic
modulus as a function of estimated temperature in the range 20-1850°C for the HNLS
fibers; it is the same for TSA3 fibers in Figure 7 and for microcomposites in Figure 8.
Moreover, many authors, for example [9, 10], show that the behaviour of fiber can
depend on its diameter. For not taking into account this effect, the results are presented
as normalized value (ratio between the experimental measurement and the initial value
of the considered specimen at room temperature, “as received material”). Orange open
symbols represent the heating conditions; blue half open symbols correspond to the
cooling conditions. In fact, the experiments must sometimes be stopped; then, the
specimen is cooled down to room temperature and heat again with a new heating stage
corresponding to the highest temperature the specimen had been subjected: these
conditions correspond to the black open symbols.
Elastic behaviours
The mean Young’s modulus at room temperature is 335GPa (±12) for HNLS fibers
and 391GPa (±6) for TSA3 fibers. These values are consistent with various references
(see Table 1 and [10]). The elastic modulus of both fibers exhibits the same trend: the
elastic modulus is quite constant below 1200°C for TSA3 fibers and below 1350°C for
HNLS fibers. For higher temperatures, it decreases steeply.
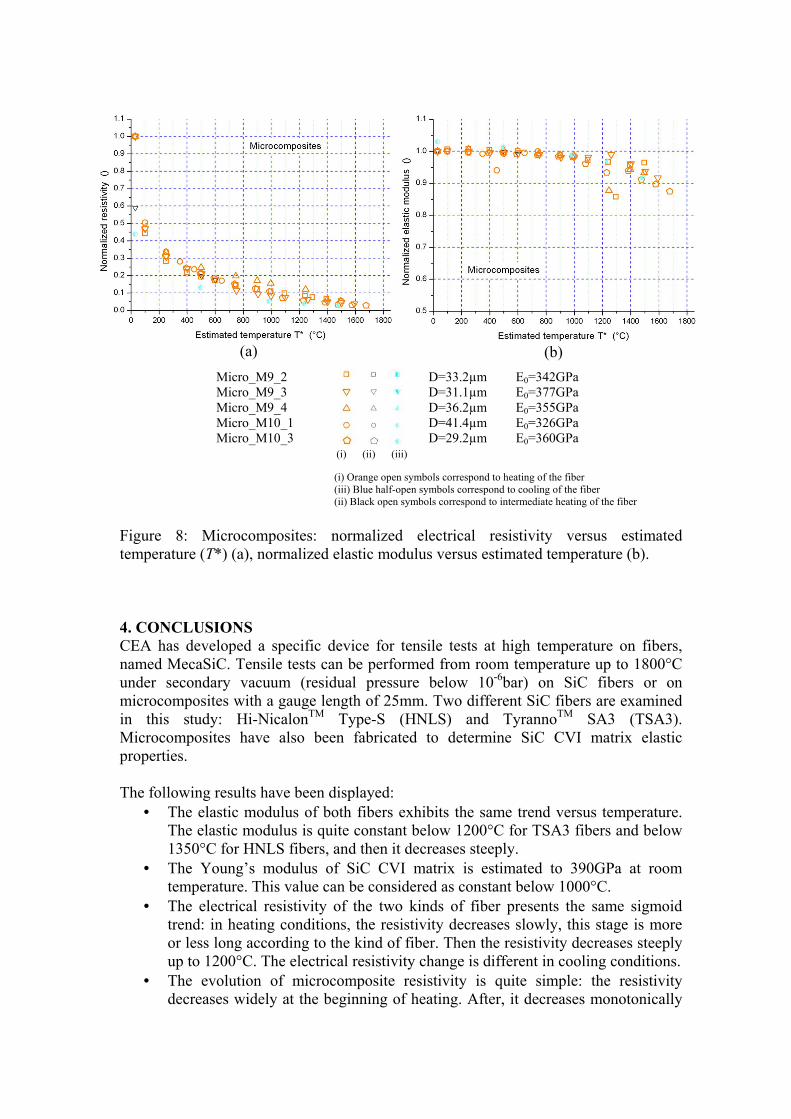
The microcomposites have a mean elastic modulus of 352GPa (±19) at room
temperature. Using relation (3), the Young’s modulus of SiC CVI matrix is equal
to 390GPa. The Figure 8 shows that this value can be considered as constant below
1000°C.
Electrical resistivity
In the range 20-1800°C, the electrical resistivity of the two kinds of fiber exhibits the
same sigmoid trend: in heating conditions, the resistivity decreases slowly, this stage is
more or less long according to the kind of fiber. Then the resistivity decreases steeply
up to 1200°C. At higher temperature, the resistivity decreases slower. Globally, the
electrical conductivity of SiC fibers increases between 20°C and 1800°C. The cooling
curves lay below the heating curves. It corresponds to an increase in conductivity.
Many authors have already related this point. It reflects changes in microstructure
or chemical modifications at high temperature: the fibers could be covered by
carbon [11-13].
The evolution of microcomposite resistivity is quite simple: the resistivity decreases
widely at the beginning of heating. After, it decreases monotonically from 300°C
to 1000°C. The microcomposites seem to be less sensible to high temperature than
fibers: the cooling curves lay slightly below the heating curves.
(a)
(b)
(i) Orange open symbols correspond to heating of the fiber
(iii) Blue half-open symbols correspond to cooling of the fiber
(ii) Black open symbols correspond to intermediate heating of the fiber
HNLS_M10_10
HNLS_M10_11
HNLS_M9_10
HNLS_M9_11
(i) (ii) (iii)
D=12.4µm
D=12.7µm
D=12.2µm
D=11.8µm
E0=352GPa
E0=335GPa
E0=329GPa
E0=325GPa
Figure 6: Hi-Nicalon S Fibers: normalized electrical resistivity versus estimated
temperature (T*) (a), normalized elastic modulus versus estimated temperature (b).
(a)
(b)
(i) Orange open symbols correspond to heating of the fiber
(iii) Blue half-open symbols correspond to cooling of the fiber
(ii) Black open symbols correspond to intermediate heating of the fiber
TSA3_M7_2
TSA3_M8_3
TSA3_M10_3
TSA3_M10_5
(i) (ii) (iii)
D=7.4µm
D=7.5µm
D=8.3µm
D=6.5µm
E0=391GPa
E0=383GPa
E0=397GPa
E0=394GPa
Figure 7: Tyranno SA3 Fibers: normalized electrical resistivity versus estimated
temperature (T*) (a), normalized elastic modulus versus estimated temperature (b).
(a)
(b)
(i) Orange open symbols correspond to heating of the fiber
(iii) Blue half-open symbols correspond to cooling of the fiber
(ii) Black open symbols correspond to intermediate heating of the fiber
Micro_M9_2
Micro_M9_3
Micro_M9_4
Micro_M10_1
Micro_M10_3
(i) (ii) (iii)
D=33.2µm
D=31.1µm
D=36.2µm
D=41.4µm
D=29.2µm
E0=342GPa
E0=377GPa
E0=355GPa
E0=326GPa
E0=360GPa
Figure 8: Microcomposites: normalized electrical resistivity versus estimated
temperature (T*) (a), normalized elastic modulus versus estimated temperature (b).
4. CONCLUSIONS
CEA has developed a specific device for tensile tests at high temperature on fibers,
named MecaSiC. Tensile tests can be performed from room temperature up to 1800°C
under secondary vacuum (residual pressure below 10-6bar) on SiC fibers or on
microcomposites with a gauge length of 25mm. Two different SiC fibers are examined
in this study: Hi-NicalonTM
Type-S (HNLS) and TyrannoTM
SA3 (TSA3).
Microcomposites have also been fabricated to determine SiC CVI matrix elastic
properties.
The following results have been displayed:
• The elastic modulus of both fibers exhibits the same trend versus temperature.
The elastic modulus is quite constant below 1200°C for TSA3 fibers and below
1350°C for HNLS fibers, and then it decreases steeply.
• The Young’s modulus of SiC CVI matrix is estimated to 390GPa at room
temperature. This value can be considered as constant below 1000°C.
• The electrical resistivity of the two kinds of fiber presents the same sigmoid
trend: in heating conditions, the resistivity decreases slowly, this stage is more
or less long according to the kind of fiber. Then the resistivity decreases steeply
up to 1200°C. The electrical resistivity change is different in cooling conditions.
• The evolution of microcomposite resistivity is quite simple: the resistivity
decreases widely at the beginning of heating. After, it decreases monotonically
from 300°C to 1000°C. The microcomposites seem to be less sensible to high
temperature than fibers.
Soon, MecaSiC will be coupled to JANNUS, based in CEA Saclay. JANNUS (Joint
Accelerators for Nano-Science and Nuclear Simulation) is a project designed to study
the modification of materials using multiple ion beams and in-situ TEM observation. In
this configuration, we will be able to study in-situ irradiation effects on fiber
behaviours, as swelling or creep for example.
ACKNOWLEDGEMENTS
The author is grateful to C. Sauder who has produced the microcomposites. Thanks are
also extended to S. Urvoy for the preparation and the observations of microcomposites.
REFERENCES
1 Sauder C., et al., “Thermomechanical properties of carbon fibres at high
temperatures (up to 2000°C)”, Composite Science and Technology, 62, pp 499-
504, 2002
2 Pailler R., et al., “Les fibres céramiques non oxydes. Relations entre
nanostructure ou composition et propriétés”, Ann. Chim. Sci. Mat., 30(6),
pp 565-578, 2005
3 Sha J.J., et al., “Effect of heat treatment on the tensile strength and creep
resistance of advanced SiC fibers”, Journal of Nuclear Materials, 329-333,
pp 592-596, 2004
4 Morimoto T., “Potential strength of NicalonTM
, Hi NicalonTM
, and Hi Nicalon
Type STM
monofilaments of variable diameters”, Composites: Part A, 37,
pp 405-412, 2006
5 Sauder C., et al., “Prediction of elastic properties of carbon fibers and CVI
matrices”, Carbon, 43, pp 2044-2053, 2005
6 Sauder C., “Relation microstructure/propriétés à haute température dans les
fibres et matrices de carbone”, PhD, Université de Bordeaux 1, 2001
7 Michaux A., et al., “Young’s modulus, thermal expansion coefficient and
fracture behavior of selected Si-B-C based carbides in the 20-1200°C
temperature range as derived from the behavior of carbon fiber reinforced
microcomposites”, Journal of the European Ceramic Society, 27, pp 3551-3560,
2007
8 Sauder C., et al., “The tensile properties of carbon matrices at temperatures up
to 2200°C”, Carbon, 43, pp 2054-2065, 2005
9 Youngblood G.E., et al., “Tensile strength and fracture surface characterization
of Hi-NicalonTM
SiC fibers”, Journal of Nuclear Materials, 289, pp 1-9, 2001
10 Pierquet L., et al., “Caractérisation mécaniques et microstructurales de fibres de
SiC pour le développement de nouveaux matériaux des centrales nucléaires de
4ème
génération", Référence Interne CEA, 2006
11 Scholz R, et al., “Electrical conductivity of silicon carbide composites and
fibers", Journal of Nuclear Materials, 307-311, pp 1098-1101, 2002
12 Sauder C., “Effet de l’irradiation sur le comportement des fibres de carbure de
silicium”, Référence Interne CEA-LCTS, 2004
13 Sha J.J., et al., "Effect of heat treatment on the tensile strength and creep
resistance of advanced SiC fibers", Journal of Nuclear Materials, 329-333,
pp 592-596, 2004