Embed Size (px)
Citation preview
Behavioural Risk Factor Survey
(April 2016)
Main Report
Commissioned by
Surveillance and Epidemiology Branch
Centre for Health Protection
Department of Health
May 2017
Copyright of this survey report is held by the Department of Health

Behavioural Risk Factor Survey April 2016
Page 2 of 127
Table of Contents
Executive Summary 4
Chapter 1 Introduction 8
Chapter 2 Research Methodology 9
2.1 Mode of Survey and Sampling Method 9
2.2 Target Respondents 9
2.3 Questionnaire Design 9
2.4 Pilot Study 9
2.5 Fieldwork 10
2.6 Response Rate 10
2.7 Sample Size and Sampling Error 11
2.8 Quality Control 11
2.9 Statistical Analysis and Weighting 12
Chapter 3 Findings of the Survey 16
3.1 Demographics 16
3.2 Weight Status, Control and Perception 19
3.3 Physical Activities and Leisure-time Exercise 24
3.4 Fruit and Vegetable Consumption 34
3.5 Meat Consumption 38
3.6 Smoking Pattern 41
3.7 Pattern of Alcohol Consumption 44
3.8 Cervical Cancer Screening (for female respondents only) 52
3.9 Awareness of Cancer Prevention and Screening 55
3.10 Use of Mobile Phone 58
Chapter 4 Sub-group Analysis by Demographic Information and
Related Questions 60
4.1 Re-grouping of Variables 60
4.2 Weight Status, Control and Perception 65
4.3 Physical Activities and Leisure-time Exercise 68
4.4 Fruit and Vegetable Consumption 76
4.5 Meat Consumption 81

Behavioural Risk Factor Survey April 2016
Page 3 of 127
4.6 Smoking Pattern 86
4.7 Pattern of Alcohol Consumption 88
4.8 Cervical Cancer Screening (for female respondents only) 94
4.9 Awareness of Cancer Prevention and Screening 99
Chapter 5 Conclusion and Recommendations 109
5.1 Conclusion 109
5.2 Recommendations 111
5.3 Limitations 112
Annex Survey Questionnaire 113
Behavioural Risk Factor Survey April 2016
Page 4 of 127
Executive Summary
Introduction
The Department of Health commissioned the Social Sciences Research Centre (SSRC) of
the University of Hong Kong to conduct a survey in April 2016 to collect information on
health-related behaviours and other relevant issues among the adult Hong Kong population.
The scope of this survey covered the following 10 areas:
1. Weight Status, Control and Perception
2. Physical Activity and Leisure-time Exercise
3. Fruit and Vegetable Consumption
4. Meat Consumption
5. Smoking Pattern
6. Pattern of Alcohol Consumption
7. Cervical Cancer Screening (for female respondents only)
8. Awareness of Cancer Prevention and Screening
9. Use of Mobile Phone
10. Demographic Information: gender, age, education level, marital status, occupation,
monthly personal income, monthly household income and type of living quarters
Research Methodology
This survey was conducted through Computer Assisted Telephone Interview (CATI). The
target respondents were Cantonese, Putonghua or English speaking residents in Hong
Kong aged 18-64 (excluding foreign domestic helpers). A bilingual (Chinese and English) th
questionnaire with 60 questions was used. Fieldwork took place between 18 April and th
29 July 2016. A sample size of 4 071 successful interviews was achieved with an overall
response rate of 10.9%. To make the findings more representative of the Hong Kong
general population, weighting was applied to age, gender and type of living quarters.
Behavioural Risk Factor Survey April 2016
Page 5 of 127
Key Findings of the Survey
Weight Status, Control and Perception
According to the locally adapted classification of weight status for Chinese adults in Hong
Kong, about half (51.5%) of the respondents were classified as “normal”, 18.5% as
“overweight” and 21.1% as “obese”, while the remaining 8.8% were classified as
“underweight”.
Regarding respondents‟ self-perceived current weight status, about half (50.3%) of the
respondents perceived themselves as “just right”, 41.9% considered themselves as
“overweight”, and 7.8% considered themselves as “underweight”. Overall, 67.6% of the
respondents perceived their weight status in a way consistent with the locally adapted
classification, while 17.8% of the respondents overestimated and 14.5% underestimated
their weight status.
Physical Activity and Leisure-time Exercise
During the seven days prior to the survey, more than half (55.4%) and over two-fifths
(43.1%) of the respondents had not engaged in any vigorous and moderate physical
activity for at least 10 minutes a day respectively. On the other hand, close to three-
quarters (71.9%) of the respondents had spent at least 10 minutes on walking every day
during the seven days prior to the survey.
Overall, more than two-fifths (43.8%) of the respondents‟ level of physical activity met the
WHO‟s recommended physical activity level for adults. Over one-third (37.7%) of the
respondents reported they exercised one to three times a week in their leisure-time.
Fruit and Vegetable Consumption
While about half (50.2%) of the respondents had eaten fruit every day, about four-fifths of
the respondents (80.3%) had eaten vegetables daily. Regular fruit or vegetable juice
consumption was found to be uncommon amongst respondents - 2.0% of the respondents
drank fruit or vegetable juice daily.
Excluding fruit or vegetable juice, the average (mean) daily intake of fruit and vegetables
by the respondents was 3.4 servings. About one-fifth (20.5%) of the respondents had a
daily intake of 5 or more servings of fruit and vegetables.
Meat Consumption
During the thirty days prior to the survey, respondents on average consumed 2.7 taels of
red meat and 2.1 taels of white meat per day. Overall, about a quarter (25.2%) of
respondents consumed more than 6 taels of meat on average per day and 48.5% of
respondents consumed less than 4 taels of meat per day. It was also found that 10.4% of
respondents had consumed processed meat on four or more days per week on average
during the thirty days prior to the survey.

Behavioural Risk Factor Survey April 2016
Page 6 of 127
Smoking Pattern
About one-tenth (10.9%) of the respondents were current smokers at the time of this
survey. Among the current smokers, the vast majority (95.9%) were daily smokers and
almost half (47.1%) of them reported smoking at least 11 cigarettes a day.
Pattern of Alcohol Consumption
During the past year prior to the survey, about seven-tenths (70.5%) of the respondents
reported having drunk at least one alcoholic drink. While about two-fifths (40.0%) of these
drinkers drank less than monthly, 4.0% drank daily.
Among those who had drunk alcohol during the past year prior to the survey, more than a
quarter (27.4%) reported that they had engaged in binge drinking (drinking 5 or more
glasses/cans of alcohol on one occasion) during the past year prior to the survey.
Cervical Cancer Screening (for female respondents only)
Nearly two-thirds (63.4%) of the female respondents reported that they had a cervical
smear before.
Among those female respondents who had a cervical smear before, about two-thirds
(66.6%) had a cervical smear at a regular interval. Among those who had cervical smears
regularly, 35.7% had the test once a year.
Awareness of Cancer Prevention and Screening
Over 90% of the respondents strongly agreed/agreed to the (correct) statements “Some
cancer cases can be prevented by adopting healthy lifestyle” and “Processed meat can
cause colorectal cancer”. Over 60% of the respondents strongly agreed/agreed to the
(correct) statements “Obesity is a risk factor for cancers” and “Cancer screening is to
conduct test on people who have no symptom”.
However, about two-fifths (41.6%) of them strongly disagreed/disagreed to the (correct)
statement “Alcohol is a human cancer-causing agent (carcinogen)” Furthermore, less than
one-fifth (17.1%) of them strongly disagreed/disagreed to the (correct) statement “Some
cancer screening tests have potential risks”.
Behavioural Risk Factor Survey April 2016
Page 7 of 127
Recommendations
Some recommendations based on the survey findings are suggested below:
1. The benefits of regular physical activity are well-known, such as improving
cardiorespiratory and muscular fitness, bone health and reducing the risk of developing
chronic diseases and depression. However, only about two-fifths of respondents
(43.8%) achieved the recommended amount of physical activities suggested by the
WHO. Thus, education about the health benefits and recommended level of physical
activities would continue be reinforced to facilitate the public to engage in a more
active lifestyle.
2. Diet rich in fruit and vegetables is associated with a reduced risk of developing major
non-communicable diseases, including cardiovascular diseases, type 2 diabetes and
certain cancers. However, the survey found that only about one-fifth (20.5%) of the
respondents had a daily average intake of 5 or more servings of fruit and vegetables.
Health promotion campaigns would continue be strengthened to educate the public
about health benefits of at least 5 servings of fruit and vegetable intake a day and to
encourage the public to consume more fruits or vegetables.
3. More than a quarter (27.4%) of the respondents who had drunk alcohol during the past
year prior to the survey reported that they had engaged in binge drinking (drinking 5 or
more glasses/cans of alcohol on one occasion). However, about two-fifths (41.6%) of
respondents strongly disagreed/disagreed to the (correct) statement “Alcohol is a
human cancer-causing agent (carcinogen)”. Information of the harms of alcohol use,
and in particular those of binge drinking, would continue be publicised and educate the
public to quit drinking or drink less.
4. Regarding the awareness of cancer screening, about two-fifths (44.8%) of the
respondents strongly disagreed/disagreed to the (incorrect) statement “Cancer
screening results are 100% accurate” and less than one-fifth (17.1%) of them strongly
disagreed/disagreed to the (correct) statement “Some cancer screening tests have
potential risks”. More education about cancer screening would continue be introduced
to help the public understand about both strengths and limitations of cancer screening.

Behavioural Risk Factor Survey April 2016
Page 8 of 127
Chapter 1 Introduction
The Department of Health commissioned the Social Sciences Research Centre (SSRC) of
the University of Hong Kong to conduct a survey in April 2016 to collect information on
health-related behaviours and other relevant issues among the adult Hong Kong population.
This will provide information to facilitate the planning, implementation and evaluation of
health promotion programmes on the prevention of diseases related to lifestyle.
The scope of this survey encompasses the following areas:
Weight Status, Control and Perception
Physical Activity and Leisure-time Exercise
Fruit and Vegetable Consumption
Meat Consumption
Smoking Pattern
Pattern of Alcohol Consumption
Cervical Cancer Screening (for female respondents only)
Awareness of Cancer Prevention and Screening
Use of Mobile Phone
Demographic Information: gender, age, education level, marital status, occupation,
monthly personal income, monthly household income and type of living quarters

Behavioural Risk Factor Survey April 2016
Page 9 of 127
Chapter 2 Research Methodology
2.1 Mode of Survey and Sampling Method
The survey was conducted through Computer Assisted Telephone Interview (CATI). A
random sample of telephone numbers was drawn from a sampling frame generated from 1
the 2007 Hong Kong residential telephone directory (English version) by dropping the last
digit of the telephone numbers on the directory, removing the resulting duplicates, and then
adding back all 10 possible final digits. The telephone numbers on the final list were then
randomised and selected as needed. This method provides an equal probability sample that
covers unlisted and new numbers but excludes large businesses that used blocks of at least 2
10 numbers .
For each successfully contacted residential unit, when more than one eligible person
resided in the household and more than one was present at the time of the telephone
contact, the “Next Birthday” rule was applied i.e., the household member who had his/her
birthday the soonest was selected.
2.2 Target Respondents
Eligible respondents were residents in all districts of Hong Kong aged between 18 and 64
who spoke Cantonese, Putonghua or English. Foreign domestic helpers were excluded.
2.3 Questionnaire Design
A bilingual (Chinese and English) questionnaire with 42 pre-coded questions and 18 open-
ended questions (with 8 demographic questions) was used to cover all the areas outlined in
Chapter 1.
A copy of the questionnaire is enclosed in the Annex.
2.4 Pilot Study
thA pilot study comprising 52 successfully completed interviews was conducted on 30 and
st31 March 2016 to test the length, logic, wording and format of the questionnaire. The data
collected from these pilot interviews were not included in this survey report.
1 The Chinese residential telephone directory was not used because the total number of telephone numbers is
smaller than that in the English residential telephone directory. 2 This selection process includes unlisted numbers, new numbers, some business and fax numbers so that the
contact rate is lower than a pure directory sample.

Behavioural Risk Factor Survey April 2016
Page 10 of 127
2.5 Fieldwork
Fieldwork took place in the call-centre of SSRC on all the weekdays and two Saturdays th th th th nd
(11 June 2016 and 18 June 2016) between 18 April and 29 July 2016, except 2 May, th st
9 June and 1 July , which are public holidays (a total of 72 weekdays and 2 Saturdays).
thBecause of the briefing on 18 April 2016, telephone calls were made between 5:30 p.m.
and 10:30 p.m. on that day. On the weekdays, telephone calls were made between 4:00
p.m. and 10:30 p.m. On the Saturdays, telephone calls were made between 2:00 p.m. and
6:00 p.m.
2.6 Response Rate
A total of 89 691 telephone numbers were attempted. The number of successful interviews
was 4 071. Refusal and mid-way termination cases amounted to 2 762. All “not available”
(22 048), and “no answer” (10 854) cases were attempted at least seven times before being 3
classified as non-contact cases. The contact rate was 41.2% and the overall response rate 4
was 10.9% .
Table 2.6: Final status of telephone numbers attempted
Final status of contacts5 Number of cases
(A) No. of telephone numbers sampled 89 691
(B) No. of ineligible cases
49 946
a) Valid working telephone numbers 8 056
i) Claimed wrong number 0
ii) Language problem 222
iii) Non-residential line 4 079
iv) No target respondent 3 755
b) Invalid telephone numbers 41 890
i) Fax / data line 3 784
ii) Non-working / out of service number 38 106
3 Contact rate = the number of answered telephone calls divided by the total number of calls attempted, i.e.
from Table 2.6, Sum of ((B)(a)(ii), (B)(a)(iii), (B)(a)(iv), (C)(a), (C)(b)(i), (C)(b)(ii) and (C)(b)(iii)) / (A) *
100% = (222 + 4 079 + 3 755 + 4 071 + 92 + 22 048 + 2 670) / 89 691 * 100% = 41.2%. 4 Response rate = the number of completed interviews divided by the estimated total number of eligible
cases, i.e. from Table 2.6, C(a) * (1 / (C + D * C / (B(a) + C))) * 100% = 4 071* (1 / (28 881 + 10 864 *
28 881 / (8 056 + 28 881))) * 100% =10.9%. 5 “Language problem”: eligible respondents who were not able to speak clearly in any of the specified
languages such as Cantonese, Putonghua or English. “Non-working / out of service number”: not a valid
telephone line (because we used a random method to generate telephone numbers, see section 2.1). “Mid-
way termination”: eligible respondents who initially accepted the interview but failed to complete the
interview due to some reasons. “Not available”: eligible respondents who were busy at the time of telephone
contact. “Refusal cases”: eligible respondents who refused the interview.

Behavioural Risk Factor Survey April 2016
Page 11 of 127
(C) No. of eligible cases 28 881
a) Successfully completed interviews 4 071
b) Unsuccessful cases 24 810
i) Mid-way termination cases 92
ii) Non-contact cases such as selected eligible person not-at-
home / not available 22 048
iii) Refusal cases 2 670
(D) No. of cases with unknown eligibility status
6 10 864
a) Answering machine 4
b) Busy line 0
c) Call blocking, password needed 0
d) Immediate disconnection
7 6
e) No answer 10 854
2.7 Sample Size and Sampling Error
A sample size of 4 071 successful interviews was achieved (the target sample size was 8
4 000). The width of a 95% confidence interval for this sample size is at most +/− 1.5% .
This means that we can have 95% confidence that the true population proportion falls
within the sample proportion plus or minus 1.5%. For example, 70.5% of the respondents
reported that they had consumed at least one alcoholic drink during the past year prior to
the survey, and then the conservative 95% confidence interval for the true percentage of
the population falls between 70.5% ± 1.5%, i.e. 69.0% and 72.0%.
2.8 Quality Control
All SSRC interviewers were well trained in a standardised approach prior to the
commencement of the survey. All interviews were conducted by experienced interviewers
fluent in Cantonese, Putonghua and English.
The SSRC engaged in quality checks for each stage of the survey to ensure satisfactory
standard of performance. At least 15% of the questionnaires completed by each interviewer
were checked by the SSRC independently.
6 Including only those telephone numbers with unknown eligibility status in all call attempts made so far. The
breakdown of (D) shows only the latest / final call disposition of these cases. 7 Including those cases which the calls disconnected before the cases could be classified as eligible.
8 As the population proportion is unknown, 0.5 is put into the formula of the sampling error to produce the
most conservative estimate of the sampling error. The confidence interval width is then:
%5.1%1004071
5.05.096.1
Behavioural Risk Factor Survey April 2016
Page 12 of 127
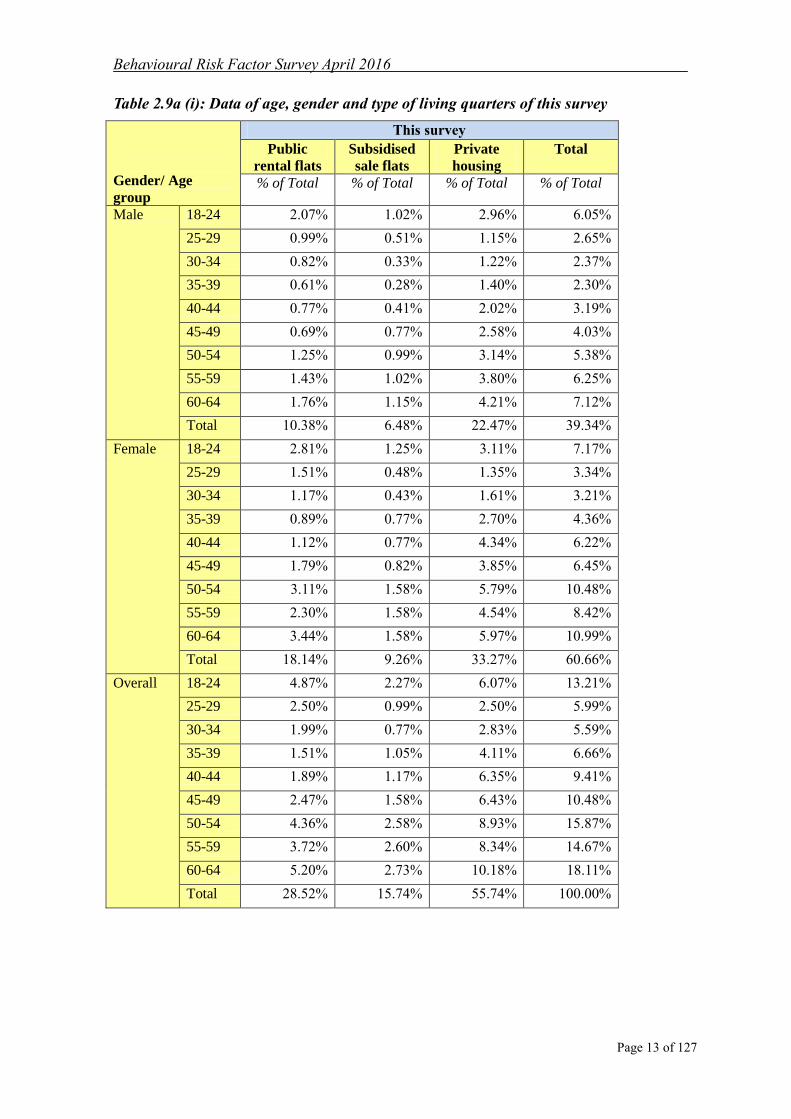
2.9 Statistical Analysis and Weighting
This survey revealed some differences in the proportions of gender, age and type of living
quarters when compared with the Hong Kong population data compiled by the Census and
Statistics Department (C&SD) for the second quarter of 2016. The proportions of
respondents among age groups of 50-64 were much higher than the population while the
proportions of respondents aged 25-39 years old were much lower. Table 2.9a (i) and Table
2.9a (ii) show the differences in terms of age, gender and type of living quarters.
In view of the demographic differences between this sample and the population, weighting
was applied by gender, age and type of living quarters in order to make the results more
representative of the general population. The weights are the ratio of the age, gender and
type of living quarters distribution of the population to that of this sample (Table 2.9b).
Behavioural Risk Factor Survey April 2016
Page 13 of 127
Table 2.9a (i): Data of age, gender and type of living quarters of this survey
Gender/ Age
group
This survey
Public
rental flats
Subsidised
sale flats
Private
housing
Total
% of Total % of Total % of Total % of Total
Male 18-24 2.07% 1.02% 2.96% 6.05%
25-29 0.99% 0.51% 1.15% 2.65%
30-34 0.82% 0.33% 1.22% 2.37%
35-39 0.61% 0.28% 1.40% 2.30%
40-44 0.77% 0.41% 2.02% 3.19%
45-49 0.69% 0.77% 2.58% 4.03%
50-54 1.25% 0.99% 3.14% 5.38%
55-59 1.43% 1.02% 3.80% 6.25%
60-64 1.76% 1.15% 4.21% 7.12%
Total 10.38% 6.48% 22.47% 39.34%
Female 18-24 2.81% 1.25% 3.11% 7.17%
25-29 1.51% 0.48% 1.35% 3.34%
30-34 1.17% 0.43% 1.61% 3.21%
35-39 0.89% 0.77% 2.70% 4.36%
40-44 1.12% 0.77% 4.34% 6.22%
45-49 1.79% 0.82% 3.85% 6.45%
50-54 3.11% 1.58% 5.79% 10.48%
55-59 2.30% 1.58% 4.54% 8.42%
60-64 3.44% 1.58% 5.97% 10.99%
Total 18.14% 9.26% 33.27% 60.66%
Overall 18-24 4.87% 2.27% 6.07% 13.21%
25-29 2.50% 0.99% 2.50% 5.99%
30-34 1.99% 0.77% 2.83% 5.59%
35-39 1.51% 1.05% 4.11% 6.66%
40-44 1.89% 1.17% 6.35% 9.41%
45-49 2.47% 1.58% 6.43% 10.48%
50-54 4.36% 2.58% 8.93% 15.87%
55-59 3.72% 2.60% 8.34% 14.67%
60-64 5.20% 2.73% 10.18% 18.11%
Total 28.52% 15.74% 55.74% 100.00%

Behavioural Risk Factor Survey April 2016
Page 14 of 127
Table 2.9a (ii): Age, gender and type of housing from the Hong Kong land-based non-institutional population data (excluding foreign domestic helpers) compiled by the C&SD for the second quarter of 2016
Gender/ Age
group
Hong Kong population data- from the C&SD
(2nd
quarter of 2016)
Public
rental
housing
Subsidised
home
ownership
housing
Private
housing Total
% of Total % of Total % of Total % of Total
Male 18 - 24 2.25% 1.00% 2.64% 5.89%
25 - 29 1.60% 0.85% 2.23% 4.67%
30 - 34 1.25% 0.88% 2.68% 4.81%
35 - 39 1.10% 0.67% 2.95% 4.71%
40 - 44 1.14% 0.56% 3.21% 4.91%
45 - 49 1.29% 0.79% 2.97% 5.04%
50 - 54 1.62% 0.98% 3.50% 6.10%
55 - 59 1.94% 1.23% 3.18% 6.35%
60 - 64 1.63% 1.08% 2.25% 4.96%
Total 13.82% 8.03% 25.60% 47.45%
Female 18 - 24 2.12% 0.95% 2.69% 5.77%
25 - 29 1.57% 0.83% 2.52% 4.93%
30 - 34 1.39% 0.82% 3.39% 5.60%
35 - 39 1.26% 0.73% 3.55% 5.54%
40 - 44 1.63% 0.78% 3.63% 6.03%
45 - 49 1.78% 1.02% 3.50% 6.29%
50 - 54 2.13% 1.20% 3.61% 6.94%
55 - 59 2.00% 1.43% 2.96% 6.39%
60 - 64 1.68% 1.03% 2.34% 5.06%
Total 15.56% 8.81% 28.18% 52.55%
Overall 18 - 24 4.37% 1.95% 5.34% 11.65%
25 - 29 3.17% 1.68% 4.75% 9.60%
30 - 34 2.64% 1.70% 6.07% 10.41%
35 - 39 2.36% 1.40% 6.50% 10.25%
40 - 44 2.77% 1.34% 6.84% 10.95%
45 - 49 3.06% 1.81% 6.46% 11.34%
50 - 54 3.75% 2.18% 7.11% 13.04%
55 - 59 3.94% 2.67% 6.14% 12.74%
60 - 64 3.32% 2.11% 4.59% 10.02%
Total 29.38% 16.83% 53.78% 100.00%

Behavioural Risk Factor Survey April 2016
Page 15 of 127
Table 2.9b: Weights by age, gender and type of living quarters applied in the analyses
Gender/ Age group
Type of living quarters
Public rental
flats
Subsidised
sale flats
Private
housing
Male 18 - 24 1.089869060 0.976997020 0.892241198
25 - 29 1.603277161 1.657809680 1.941653024
30 - 34 1.534913739 2.651736040 2.187102100
35 - 39 1.792875233 2.378450161 2.100216368
40 - 44 1.491891589 1.372937917 1.592355436
45 - 49 1.870958815 1.028417915 1.151828065
50 - 54 1.296226336 0.985171624 1.115039132
55 - 59 1.358980817 1.209419469 0.835986429
60 - 64 0.928855138 0.937917139 0.535026629
Missing 1.000000000 1.000000000 1.000000000
Female 18 - 24 0.754671765 0.762288545 0.865894166
25 - 29 1.045848728 1.719081737 1.864347044
30 - 34 1.182233465 1.897128578 2.109072931
35 - 39 1.410401713 0.951629378 1.313270274
40 - 44 1.449134335 1.020190572 0.836285251
45 - 49 0.994333207 1.249527767 0.907732051
50 - 54 0.685162362 0.760365762 0.623030977
55 - 59 0.871184243 0.905007766 0.651716522
60 - 64 0.488765137 0.654206493 0.391677798
Missing 1.000000000 1.000000000 1.000000000
Statistical tests were applied to detect any significant differences between sub-groups.
Associations between selected demographic information and responses of selected
questions were also examined. Significance testing was conducted at the 5% level (2-
tailed). The statistical software, IBM SPSS for Windows version 24.0 was used to perform
all statistical analyses.
Behavioural Risk Factor Survey April 2016
Page 16 of 127
Chapter 3 Findings of the Survey
This chapter presents the findings of this survey after weighting for gender, age and type of
living quarters. Some percentages in the figures may not add up to the total or 100%
because of rounding.
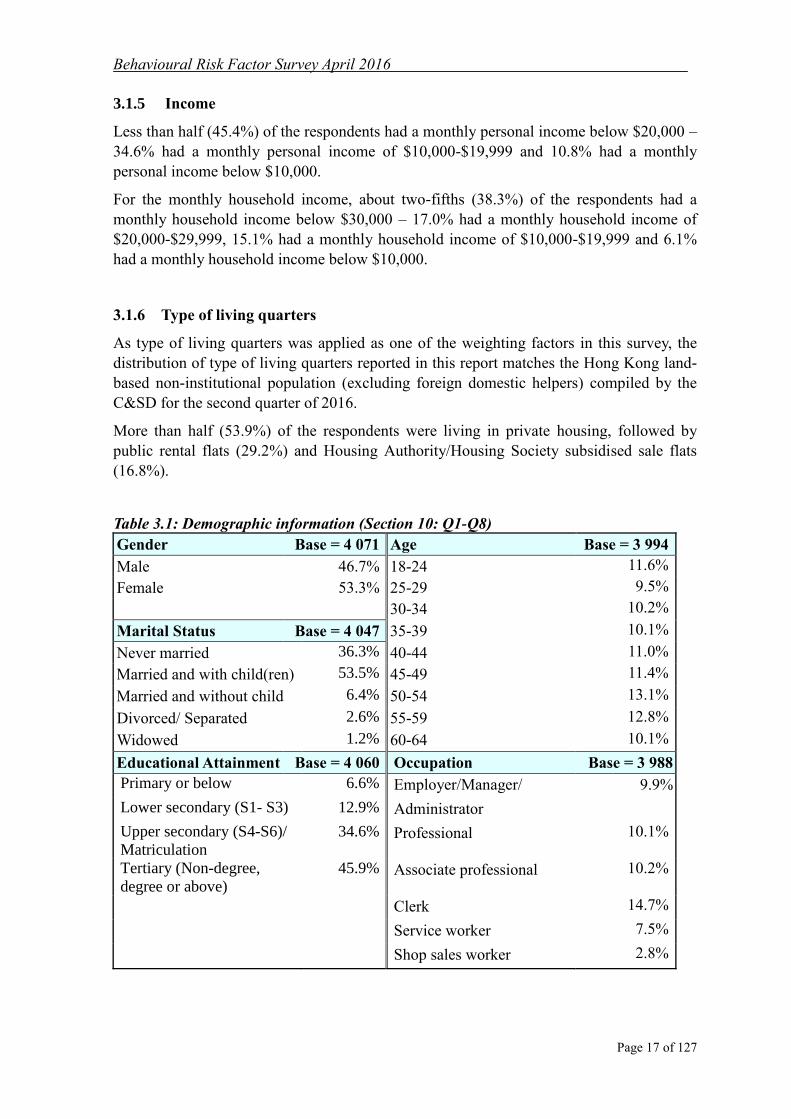
3.1 Demographics
This section briefly describes the characteristics of the respondents in this survey (Table
3.1).
3.1.1 Gender and age
As gender and age were applied to compile weightings in this survey, the distribution of
gender and age reported in this report matches the Hong Kong land-based non-institutional
population (excluding foreign domestic helpers) compiled by the C&SD for the second
quarter of 2016.
Overall, 53.3% of the respondents were females and 42.8% were aged between 30 and 49.
3.1.2 Marital status
About three-fifths (60.0%) of the respondents were married – 53.5% had children and
6.4% did not have a child. Over one-third (36.3%) of the respondents were never married,
2.6% were divorced or separated and 1.2% were widowed.
3.1.3 Educational attainment
The majority (80.5%) of the respondents had upper secondary education or above – 34.6%
had upper secondary (S4-S6)/matriculation and 45.9% attained tertiary education or above.
The rest of the respondents (19.5%) had lower secondary (S1-S3) or primary education or
below.
3.1.4 Occupation
About one-third (33.4%) of the respondents were not working. Of these, 7.3% were
students, 13.6% were homemakers, 4.8% were unemployed persons, 7.2% were retired
persons and 0.6% were other non-working persons.
A relatively higher proportion of the respondents were clerks (14.7%), followed by
associate professionals (10.2%), professionals (10.1%), employers/managers/
administrators (9.9%) and service workers (7.5%).
Behavioural Risk Factor Survey April 2016
Page 17 of 127
3.1.5 Income
Less than half (45.4%) of the respondents had a monthly personal income below $20,000 –
34.6% had a monthly personal income of $10,000-$19,999 and 10.8% had a monthly
personal income below $10,000.
For the monthly household income, about two-fifths (38.3%) of the respondents had a
monthly household income below $30,000 – 17.0% had a monthly household income of
$20,000-$29,999, 15.1% had a monthly household income of $10,000-$19,999 and 6.1%
had a monthly household income below $10,000.
3.1.6 Type of living quarters
As type of living quarters was applied as one of the weighting factors in this survey, the
distribution of type of living quarters reported in this report matches the Hong Kong land-
based non-institutional population (excluding foreign domestic helpers) compiled by the
C&SD for the second quarter of 2016.
More than half (53.9%) of the respondents were living in private housing, followed by
public rental flats (29.2%) and Housing Authority/Housing Society subsidised sale flats
(16.8%).
Table 3.1: Demographic information (Section 10: Q1-Q8)
Gender Base = 4 071 Age Base = 3 994
Male 46.7% 18-24 11.6%
Female 53.3% 25-29 9.5%
30-34 10.2%
Marital Status Base = 4 047 35-39 10.1%
Never married 36.3% 40-44 11.0%
Married and with child(ren) 53.5% 45-49 11.4%
Married and without child 6.4% 50-54 13.1%
Divorced/ Separated 2.6% 55-59 12.8%
Widowed 1.2% 60-64 10.1%
Educational Attainment Base = 4 060 Occupation Base = 3 988
Primary or below 6.6% Employer/Manager/ 9.9%
Lower secondary (S1- S3) 12.9% Administrator
Upper secondary (S4-S6)/
Matriculation
34.6% Professional 10.1%
Tertiary (Non-degree,
degree or above)
45.9% Associate professional 10.2%
Clerk 14.7%
Service worker 7.5%
Shop sales worker 2.8%

Behavioural Risk Factor Survey April 2016
Page 18 of 127
Table 3.1: Demographic information (Section 10: Q1-Q8)9 (Continued)
Type of Living
Quarters Base = 3 988
Skilled agricultural/fishery
worker
0.1%
Craft and related worker 3.2%
Public rental flats 29.2% Plant and machine 3.0%
Housing Authority 15.7% operator and assembler
subsidised sale flats Unskilled worker 5.0%
Housing Society 1.1% Student 7.3%
subsidised sale flats Homemaker 13.6%
Private residential flats 47.6% Unemployed person 4.8%
Villas/Bungalows/Modern
village houses
3.0% Retired person 7.2%
Simple stone structures/
Traditional village houses
2.0% Other non-working person 0.6%
Staff quarters 1.3%
Non-domestic quarters #
Monthly Personal
Income
Base =2 49110
Monthly Household
Income
Base =3 296
Below $10,000 10.8% Below $10,000 6.1%
$10,000-$19,999 34.6% $10,000-$19,999 15.1%
$20,000-$29,999 23.7% $20,000-$29,999 17.0%
$30,000-$49,999 17.7% $30,000-$49,999 28.9%
$50,000 or above 13.1% $50,000 or above 32.9%
# Less than 0.05%
9 Refers to the question number in the survey questionnaire, see the Annex.
10 For non-working respondents, they did not need to answer question Q6 (monthly personal income).
Behavioural Risk Factor Survey April 2016
Page 19 of 127
3.2 Weight Status, Control and Perception
Four questions were asked in this survey to ascertain the respondents‟ height, weight, and
waist circumference and their perception of their current weight. The respondents‟ body
mass index (BMI) was calculated from the reported height and weight.
Those respondents with a body height out of the suggested range 100-190 cm, body weight
out of the suggested range 37-120 kg or who were pregnant were treated as outliers and
excluded from height, weight and BMI analyses (sections 3.2.1, 3.2.2 and 3.2.4).
Subsequently, a total of 26 outlier cases for height or weight (including nine pregnant
women) were excluded from analyses in section 3.2.5. In addition, 90 cases were excluded
from the BMI analyses due to outliers and missing data for height or weight.
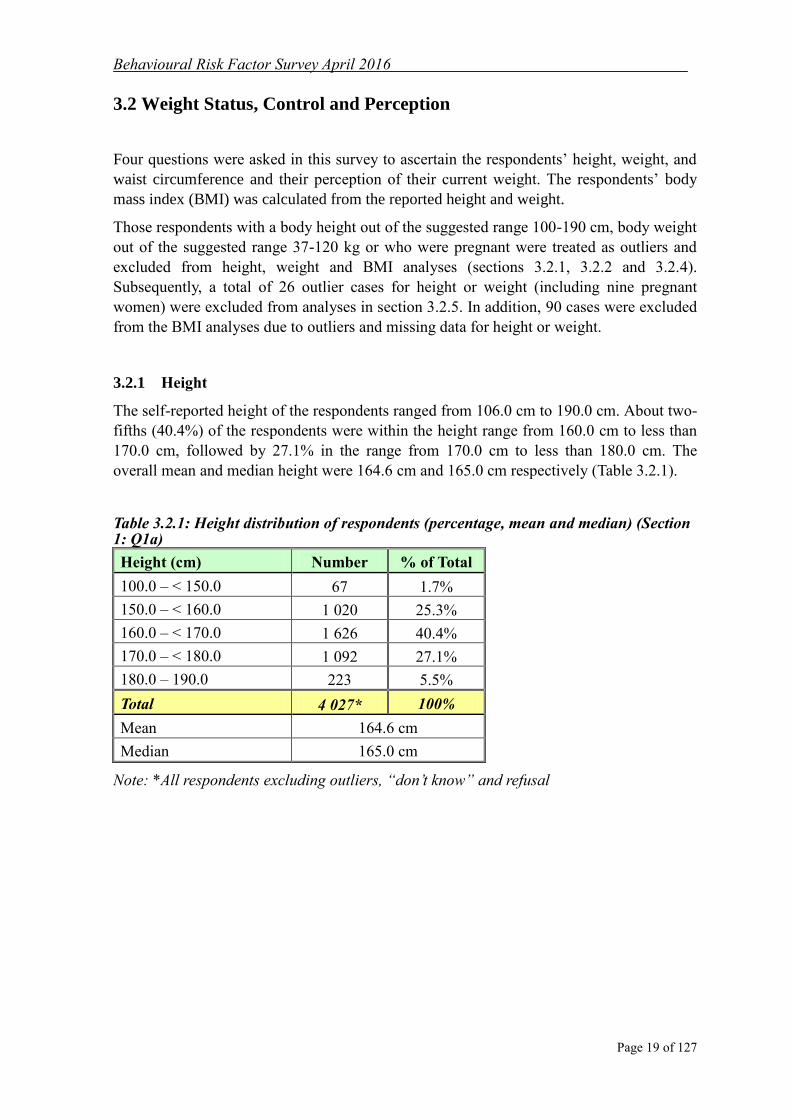
3.2.1 Height
The self-reported height of the respondents ranged from 106.0 cm to 190.0 cm. About two-
fifths (40.4%) of the respondents were within the height range from 160.0 cm to less than
170.0 cm, followed by 27.1% in the range from 170.0 cm to less than 180.0 cm. The
overall mean and median height were 164.6 cm and 165.0 cm respectively (Table 3.2.1).
Table 3.2.1: Height distribution of respondents (percentage, mean and median) (Section 1: Q1a)
Height (cm) Number % of Total
100.0 – < 150.0 67 1.7%
150.0 – < 160.0 1 020 25.3%
160.0 – < 170.0 1 626 40.4%
170.0 – < 180.0 1 092 27.1%
180.0 – 190.0 223 5.5%
Total 4 027* 100%
Mean 164.6 cm
Median 165.0 cm
Note: *All respondents excluding outliers, “don’t know” and refusal

Behavioural Risk Factor Survey April 2016
Page 20 of 127
3.2.2 Weight
The self-reported weight of the respondents ranged from 37.0 kg to 120.0 kg. About one-
third (31.9%) of the respondents fell into the weight range from 50.0 kg to less than 60.0
kg, followed by 27.9% in the range from 60.0 kg to less than 70.0 kg. The overall mean
and median weight were 61.5 kg and 60.0 kg respectively (Table 3.2.2).
Table 3.2.2: Weight distribution of respondents (percentage, mean and median) (Section 1: Q1b)
Weight (kg) Number % of Total
37.0 – < 40.0 11 0.3%
40.0 – < 50.0 664 16.6%
50.0 – < 60.0 1 279 31.9%
60.0 – < 70.0 1 117 27.9%
70.0 – < 80.0 588 14.7%
80.0 – 120.0 351 8.7%
Total 4 008* 100%
Mean 61.5 kg
Median 60.0 kg
Note: *All respondents excluding outliers, “don’t know” and refusal

Behavioural Risk Factor Survey April 2016
Page 21 of 127
3.2.3 Waist circumference
Those respondents with a waist circumference out of the suggested range 50-120 cm
(~19.7-47.2 inches) or who were pregnant were treated as outliers. A total of 20 cases (9 of
them were pregnant women) were treated as outliers.
The self-reported waist circumference of the respondents ranged from 50.0 cm to 116.8
cm. About two-fifths (41.1%) of the respondents had their waist circumference in the range
from 70.0 cm to less than 80.0 cm, followed by 27.9% in the range from 80.0 cm to less
than 90.0 cm. The overall mean and median waist circumference were 76.5 cm and 76.2
cm respectively (Table 3.2.3).
Table 3.2.3: Waist circumference distribution of respondents (percentage, mean and median) (Section 1: Q1c)
Waist circumference (cm) Number % of Total
50.0 – < 60.0 25 0.7%
60.0 – < 70.0 875 23.2%
70.0 – < 80.0 1 553 41.1%
80.0 – < 90.0 1 055 27.9%
90.0 – 120.0 268 7.1%
Total 3 776* 100%
Mean 76.5 cm
Median 76.2 cm
Note: *All respondents excluding outliers, “don’t know” and refusal

Behavioural Risk Factor Survey April 2016
Page 22 of 127
3.2.4 Body Mass Index (BMI)
BMI was derived from weight and height by the following formula:
2 BMI = body weight (kg) / [height (m)]
3.2.4.1 Weight status by the World Health Organization (WHO) classification and
locally adapted classification for Chinese adults in Hong Kong
According to the WHO classification, about seven-tenths (70.1%) of the respondents were
classified as “normal”, 17.4% as “overweight” and 3.8% as “obese”. Less than one-tenth
(8.8%) of the respondents were regarded as “underweight” (Table 3.2.4.1a).
Table 3.2.4.1a: Distribution of weight status by WHO classification (Section 1: Q1a &
Q1b)
Weight status BMI Number % of Total
Underweight BMI < 18.5 350 8.8%
Normal BMI 18.5 – < 25.0 2 790 70.1%
Overweight BMI 25.0 – < 30.0 691 17.4%
Obese BMI 30.0 150 3.8%
Total 3 981* 100%
Note: *All respondents excluding outliers and missing data for height or weight
Based on the locally adapted classification for Chinese adults in Hong Kong, about half
(51.5%) of the respondents were classified as “normal”, 21.1% as “obese” and 18.5% as
“overweight”, while the remaining 8.8% were classified as “underweight” (Table 3.2.4.1b).
Table 3.2.4.1b: Distribution of weight status by the locally adapted classification for
Chinese adults in Hong Kong (Section 1: Q1a & Q1b)
Weight status BMI Number % of Total
Underweight BMI < 18.5 350 8.8%
Normal BMI 18.5 – < 23.0 2 052 51.5%
Overweight BMI 23.0 – < 25.0 738 18.5%
Obese BMI 25.0 841 21.1%
Total 3 981* 100%
Note: *All respondents excluding outliers and missing data for height or weight

Behavioural Risk Factor Survey April 2016
Page 23 of 127
3.2.5 Perception of current weight status
When respondents were asked about their self-perceived current weight status, about half
(50.3%) of the respondents perceived it as “just right”. However, 41.9% considered
themselves as “overweight” while 7.8% considered themselves as “underweight” (Table
3.2.5a).
Table 3.2.5a: Perception of current weight status (Section 1: Q2)
Perception of current weight Number % of Total
Overweight 1 691 41.9%
Just right 2 028 50.3%
Underweight 314 7.8%
Total 4 033* 100%
Note: * All respondents excluding outliers for height, weight or pregnant respondents, “don’t know” and refusal
Table 3.2.5b shows the differences of weight status between the locally adapted
classification and the respondents‟ perception. About half (50.2%) of the respondents
considered their weight status as “just right” while slightly more than half (51.6%) were
classified as “normal”. On the other hand, 42.0% of respondents perceived themselves as
“overweight” while 39.6% were classified as “overweight” or “obese”. Overall, 67.6% of
the respondents perceived their weight status in a way consistent with the adapted criteria,
while 17.8% of the respondents overestimated and 14.5% underestimated their weight
status.
Table 3.2.5b: Comparison of weight status between the locally adapted classification and
respondents’ perception of their current weight (Section 1: Q1a, Q1b & Q2)
Cross-tabulation Weight status by the locally adapted classification
Underweight Normal Overweight Obese Total
Respondents’
perception of
current
weight
Overweight 17 496 449 706 1 669
% of Total 0.4% 12.5% 11.3% 17.8% 42.0%
Just right 194 1 391 278 128 1 992
% of Total 4.9% 35.1% 7.0% 3.2% 50.2%
Underweight 138 160 5 5 308
% of Total 3.5% 4.0% 0.1% 0.1% 7.8%
Total 350 2 048 732 840 3 970
% of Total 8.8% 51.6% 18.4% 21.2% 100.0%
Note: All respondents excluding outliers and missing responses either in the questions of perception about current weight or the weight status by the locally adapted classification. The percentages of respondents’ perception of current weight are slightly different from (Table 3.2.5a) since the bases are different.

Behavioural Risk Factor Survey April 2016
Page 24 of 127
3.3 Physical Activities and Leisure-time Exercise
11Eight questions were asked to assess the frequency and duration of physical activities that
the respondents had engaged in. Seven of the questions were adopted from the
International Physical Activity Questionnaire (IPAQ) short form (see Annex, Section 2:
Q1a-Q4).
3.3.1 Frequency of physical activities per week
On a weekly basis, walking was far more prevalent than vigorous and moderate physical
activities. During the seven days prior to the survey, 71.9% of the respondents spent at
least 10 minutes walking every day. On the other hand, 44.6% and 56.9% of the
respondents reported that they spent at least one day on vigorous and moderate physical
activities in the seven days prior to the survey respectively (Fig. 3.3.1a).
Fig. 3.3.1a: Number of days per week spent on doing each type of physical activities in the seven days prior to the survey (Section 2: Q1a, Q2a & Q3a)
Base: All respondents excluding “don’t know” and refusal (Vigorous physical activities =
4 071; Moderate physical activities = 4 071; Walking = 4 069)
55.4%
13.7% 11.4%
6.9% 3.7%
2.7% 0.9%
5.3%
43.1%
11.5% 12.3%
8.9%
3.8% 5.0% 1.6%
13.9%
2.7% 1.3%
3.1% 4.7% 3.8%
9.1%
3.4%
71.9%
0%
20%
40%
60%
80%
0 day 1 day 2 days 3 days 4 days 5 days 6 days 7 days
Vigorous physical activities
Moderate physical activities
Walking
11
Respondents were informed of the definitions of vigorous physical activities, moderate physical activities
and walking. Vigorous physical activities are defined as those that make people breathe much harder and the
heart beat much faster than normal, for example running, aerobics, football, swimming, heavy physical work
and jogging. Moderate physical activities are defined as those that make people breathe somewhat harder and
the heart beat somewhat faster than normal, for example, cycling, washing or polishing cars, fast walking and
cleaning windows. Walking includes walking to work or school, walking to travel from place to place and
walking for leisure. All the questions about vigorous physical activities, moderate physical activities and
walking only referred to those activities on which the respondents had spent at least 10 minutes at a time.
Behavioural Risk Factor Survey April 2016
Page 25 of 127
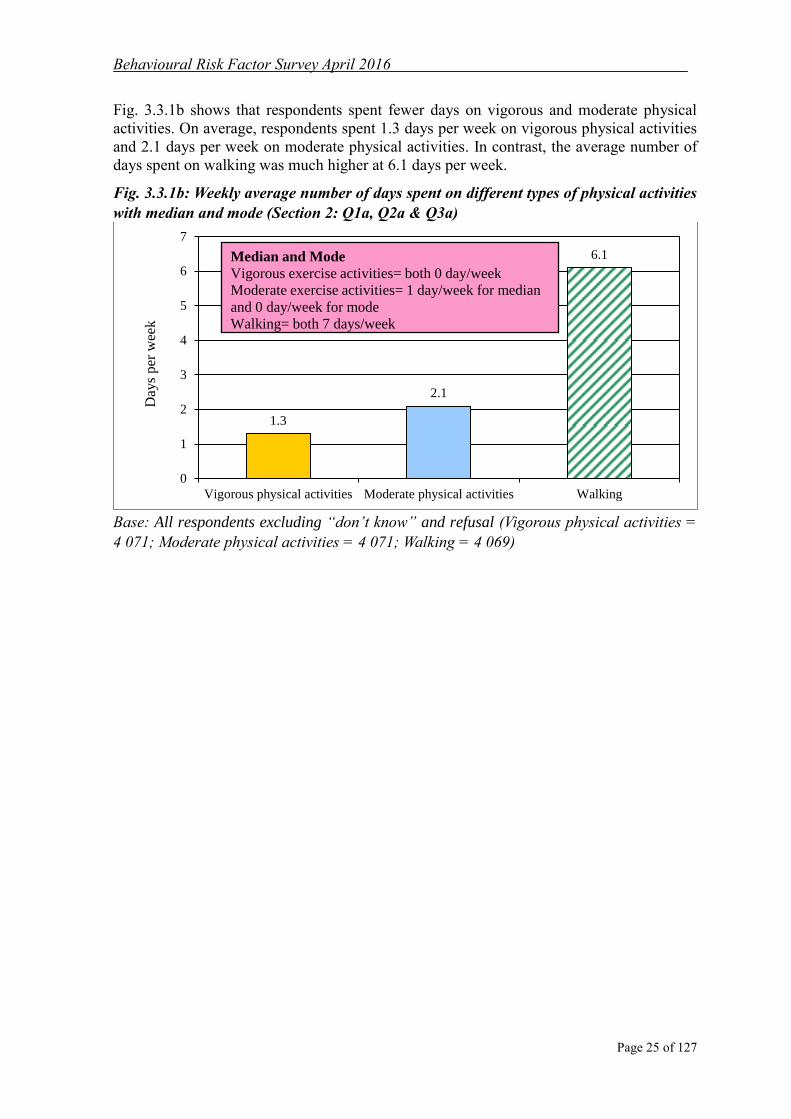
Fig. 3.3.1b shows that respondents spent fewer days on vigorous and moderate physical
activities. On average, respondents spent 1.3 days per week on vigorous physical activities
and 2.1 days per week on moderate physical activities. In contrast, the average number of
days spent on walking was much higher at 6.1 days per week.
Fig. 3.3.1b: Weekly average number of days spent on different types of physical activities
with median and mode (Section 2: Q1a, Q2a & Q3a)
Base: All respondents excluding “don’t know” and refusal (Vigorous physical activities =
4 071; Moderate physical activities = 4 071; Walking = 4 069)
1.3
2.1
6.1
0
1
2
3
4
5
6
7
Vigorous physical activities Moderate physical activities Walking
Day
s p
er w
eek
Median and Mode
Vigorous exercise activities= both 0 day/week
Moderate exercise activities= 1 day/week for median
and 0 day/week for mode
Walking= both 7 days/week
Behavioural Risk Factor Survey April 2016
Page 26 of 127
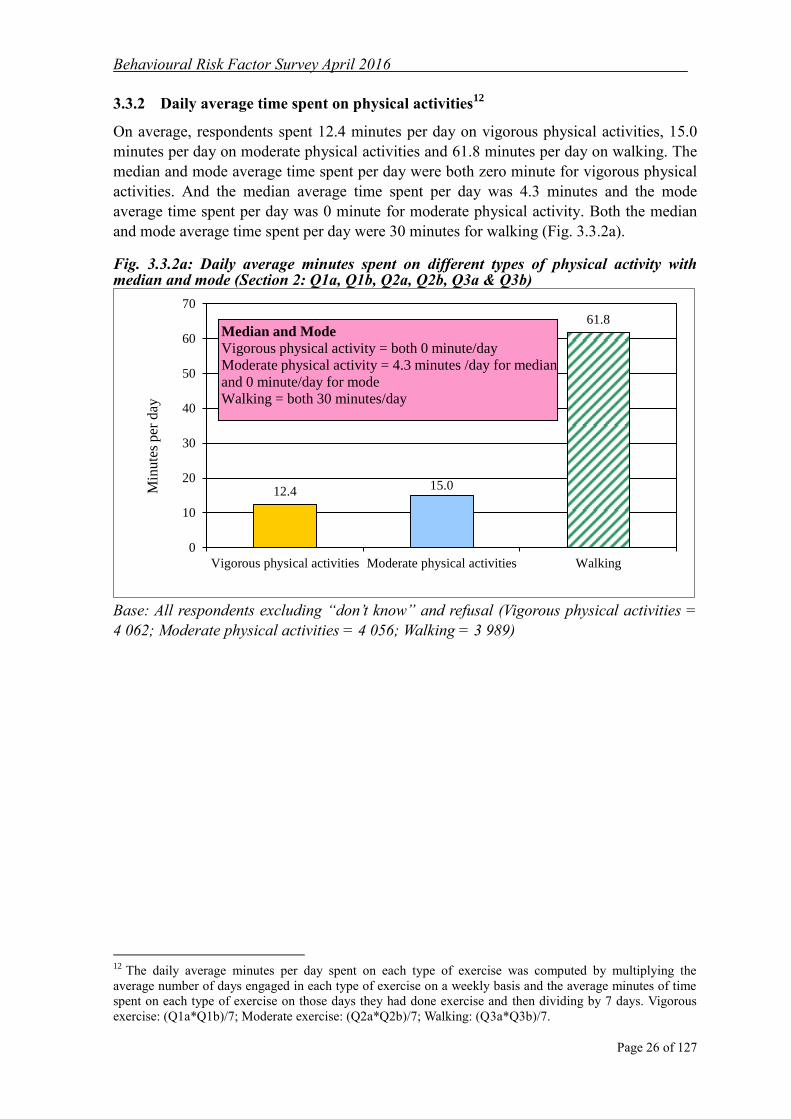
123.3.2 Daily average time spent on physical activities
On average, respondents spent 12.4 minutes per day on vigorous physical activities, 15.0
minutes per day on moderate physical activities and 61.8 minutes per day on walking. The
median and mode average time spent per day were both zero minute for vigorous physical
activities. And the median average time spent per day was 4.3 minutes and the mode
average time spent per day was 0 minute for moderate physical activity. Both the median
and mode average time spent per day were 30 minutes for walking (Fig. 3.3.2a).
Fig. 3.3.2a: Daily average minutes spent on different types of physical activity with median and mode (Section 2: Q1a, Q1b, Q2a, Q2b, Q3a & Q3b)
Base: All respondents excluding “don’t know” and refusal (Vigorous physical activities =
4 062; Moderate physical activities = 4 056; Walking = 3 989)
12.4 15.0
61.8
0
10
20
30
40
50
60
70
Vigorous physical activities Moderate physical activities Walking
Min
ute
s p
er d
ay
Median and Mode
Vigorous physical activity = both 0 minute/day
Moderate physical activity = 4.3 minutes /day for median
and 0 minute/day for mode
Walking = both 30 minutes/day
12
The daily average minutes per day spent on each type of exercise was computed by multiplying the
average number of days engaged in each type of exercise on a weekly basis and the average minutes of time
spent on each type of exercise on those days they had done exercise and then dividing by 7 days. Vigorous
exercise: (Q1a*Q1b)/7; Moderate exercise: (Q2a*Q2b)/7; Walking: (Q3a*Q3b)/7.

Behavioural Risk Factor Survey April 2016
Page 27 of 127
Overall, about one-tenth of the respondents spent a daily average of 31 minutes or more on
vigorous physical activities (10.6%) and moderate physical activities (11.7%), while 45.6%
of the respondents spent a daily average of 31 minutes or more on walking (Table 3.3.2b).
Table 3.3.2b: Daily average time spent on doing different types of physical activity
(Section 2: Q1a, Q1b, Q2a, Q2b, Q3a & Q3b)
Time spent
(minutes)
Vigorous
physical activity
Moderate
physical activity Walking
Number % of Total Number % of Total Number % of Total
Below 10 2 903 71.5% 2 647 65.3% 399 10.0%
10 – < 16 206 5.1% 358 8.8% 392 9.8%
16 – < 31 524 12.9% 575 14.2% 1 378 34.5%
31 – < 61 296 7.3% 321 7.9% 986 24.7%
61 or above 133 3.3% 155 3.8% 834 20.9%
Total 4 062* 100% 4 056* 100% 3 989* 100%
Note: *All respondents excluding “don’t know” and refusal

Behavioural Risk Factor Survey April 2016
Page 28 of 127
133.3.3 Sitting
Respondents were asked how much time per day on average they spent on sitting during
weekdays (Monday to Friday) in the seven days prior to the survey. Table 3.3.3 shows that
more than half (55.0%) of the respondents reported that they sat for at least six hours per
day during weekdays. The mean and median sitting hours were 6.4 and 6.0 respectively
(Table 3.3.3).
Table 3.3.3: Average time spent on sitting per day during weekdays in the seven days
prior to the survey (percentage, mean and median) (Section 2: Q4)
Sitting time Number % of Total
10 mins - < 2 hrs 155 3.9%
2 - < 4 hrs 752 18.8%
4 - < 6 hrs 892 22.3%
6 - < 8 hrs 689 17.2%
8 - < 10 hrs 669 16.7%
10 - 15 hrs 844 21.1%
Total 4 000* 100%
Mean 6.4 hrs
Median 6.0 hrs
Note: *All respondents excluding outliers, “don’t know” and refusal
13
Sitting includes time spent sitting at work, at home or other places, visiting friends, reading, travelling on
public transport and lying down to watch television.

Behavioural Risk Factor Survey April 2016
Page 29 of 127
3.3.4 Analysis of the International Physical Activity Questionnaire
The analysis of the seven questions adopted from IPAQ is based on the guidelines for data14
processing and analysis of the IPAQ – Short Form (revised November 2005) . The age
range of respondents of this survey (18-64) is within the age criteria of the IPAQ analysis,
i.e. 15-69. The analysis of the IPAQ short form provides two indicators of physical activity,
namely categorical and continuous indicators.
According to the IPAQ data processing and cleaning rules, 103 cases which were excluded
from this part of analysis for “don‟t know”, refusal or cases being classified as outliers.
3.3.4.1 Categorical scoring
The categorical score comprises three levels of physical activity, namely “low”, 15
“moderate” and “high” . Table 3.3.4.1a details the criteria of classification.
Table 3.3.4.1a: Categorical scoring classification of the level of physical activity
Level of physical activity Categorical scoring classification criteria
Low No activity is reported OR
Some activity is reported but not enough to meet
categories “Moderate” or “High”
Moderate Any one of the following 3 criteria
3 or more days of vigorous-intensity activity of at
least 20 minutes per day OR
5 or more days of moderate-intensity activity or
walking of at least 30 minutes per day OR
5 or more days of any combination of walking,
moderate-intensity or vigorous-intensity activities
achieving a minimum of at least 600 MET-
min/week
High Any one of the following 2 criteria
Vigorous-intensity activity on at least 3 days and
accumulating at least 1500 MET-minutes/week OR
7 or more days of any combination of walking,
moderate-intensity or vigorous-intensity activities
achieving a minimum of at least 3000 MET-
minutes/week
Note: MET = multiples of resting metabolic rate
Source: Guidelines for data processing and analysis of the IPAQ – short form
14
This document for data processing and analysis of the IPAQ is available on the website:
http://sites.google.com/site/theipaq/scoring-protocol. 15
The current categories of IPAQ classification are “Low”, “Moderate” and “High”. The previous categories
were known as “Inactive”, “Minimally active” and “HEPA active”.

Behavioural Risk Factor Survey April 2016
Page 30 of 127
According to the classification criteria listed in Table 3.3.4.1a, more than half (55.8%) of
the respondents were classified as having “moderate” level of physical activity. The
proportions of respondents having “high” and “low” level of physical activity were 26.8%
and 17.4 % respectively (Fig. 3.3.4.1b).
Fig. 3.3.4.1b: Classification of respondents’ physical activity level (Section 2: Q1a, Q1b,
Q2a, Q2b, Q3a & Q3b)
Base: All respondents excluding “don’t know”, refusal and outliers according to the data
processing rules of the IPAQ analysis guidelines = 3 968
Low
17.4%
Moderate
55.8%
High
26.8%
3.3.4.2 Continuous scoring
Continuous scoring is another measurement of physical activity suggested in the IPAQ -
short form data processing and analysis guidelines. This is achieved by weighting each
type of activity by its energy requirements defined in METs (METs are multiples of the 16
resting metabolic rate) to yield a score in MET-minutes. A MET-minute score is
computed by multiplying the MET by the minutes performed. MET-minute scores are
equivalent to kilocalories expended for a 60 kg person. The selected MET values for
different types of activity were derived from work undertaken during the IPAQ Reliability
Study conducted in 2000-2001. This study yielded MET values for the three types of
activity, namely “walking” = 3.3 METs, “moderate physical activity” = 4.0 METs and
“vigorous physical activity” = 8.0 METs. These MET values are used for the continuous
scoring analysis of IPAQ data in this part.
More specifically, the continuous score for each type of physical activity was computed
according to the formula and examples in Table 3.3.4.2a.
16
Source of information: Guideline for data processing and analysis of the IPAQ
Behavioural Risk Factor Survey April 2016
Page 31 of 127
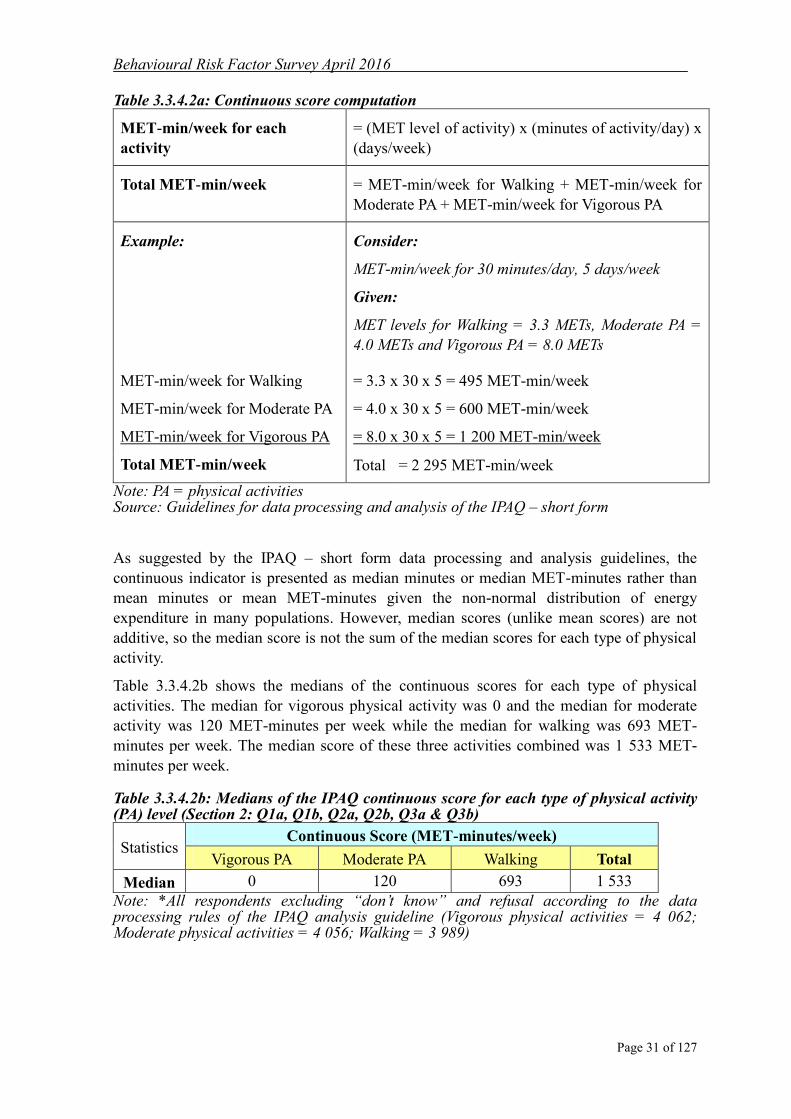
Table 3.3.4.2a: Continuous score computation
MET-min/week for each
activity
= (MET level of activity) x (minutes of activity/day) x
(days/week)
Total MET-min/week = MET-min/week for Walking + MET-min/week for
Moderate PA + MET-min/week for Vigorous PA
Example:
Consider:
MET-min/week for 30 minutes/day, 5 days/week
Given:
MET levels for Walking = 3.3 METs, Moderate PA =
4.0 METs and Vigorous PA = 8.0 METs
MET-min/week for Walking
MET-min/week for Moderate PA
MET-min/week for Vigorous PA
Total MET-min/week
= 3.3 x 30 x 5 = 495 MET-min/week
= 4.0 x 30 x 5 = 600 MET-min/week
= 8.0 x 30 x 5 = 1 200 MET-min/week
Total = 2 295 MET-min/week
Note: PA = physical activities Source: Guidelines for data processing and analysis of the IPAQ – short form
As suggested by the IPAQ – short form data processing and analysis guidelines, the
continuous indicator is presented as median minutes or median MET-minutes rather than
mean minutes or mean MET-minutes given the non-normal distribution of energy
expenditure in many populations. However, median scores (unlike mean scores) are not
additive, so the median score is not the sum of the median scores for each type of physical
activity.
Table 3.3.4.2b shows the medians of the continuous scores for each type of physical
activities. The median for vigorous physical activity was 0 and the median for moderate
activity was 120 MET-minutes per week while the median for walking was 693 MET-
minutes per week. The median score of these three activities combined was 1 533 MET-
minutes per week.
Table 3.3.4.2b: Medians of the IPAQ continuous score for each type of physical activity (PA) level (Section 2: Q1a, Q1b, Q2a, Q2b, Q3a & Q3b)
Statistics Continuous Score (MET-minutes/week)
Vigorous PA Moderate PA Walking Total
Median 0 120 693 1 533
Note: *All respondents excluding “don’t know” and refusal according to the data processing rules of the IPAQ analysis guideline (Vigorous physical activities = 4 062; Moderate physical activities = 4 056; Walking = 3 989)

Behavioural Risk Factor Survey April 2016
Page 32 of 127
3.3.5 Analysis based on WHO’s Global Recommendations on Physical Activity for
Health
The WHO published the Global Recommendations on Physical Activity for Health in 17
August 2010 . Based on the recommendations, adults aged 18-64 should do at least one
of the following amount of physical activities in order to improve body fitness and prevent
diseases:
1. At least 150 minutes of moderate-intensity aerobic physical activity throughout the
week, OR
2. At least 75 minutes of vigorous-intensity aerobic physical activity throughout the
week , OR
3. An equivalent combination of moderate- and vigorous-intensity aerobic physical 18
activity throughout the week .
Overall, more than two-fifths of the respondents (43.8%) attained the recommended
amount physical activity during the seven days prior to the survey (Fig. 3.3.5).
Fig. 3.3.5: Whether the physical activity level recommended by the WHO for adults were
attained (Section 2: Q1a, Q1b, Q2a & Q2b)
Base: All respondents excluding “unknown” physical activity level = 4 052
Yes
43.8%
No
56.2%
17
“Global Recommendations on Physical Activity for Health”, World Health Organization; 2010.
(http://whqlibdoc.who.int/publications/2010/9789241599979_eng.pdf) 18
Amount of equivalent combination of moderate- and vigorous-intensity aerobic physical activities =
duration (in minutes) of moderate-intensity aerobic physical activity in a week + (duration (in minutes) of
vigorous-intensity aerobic physical activity in a week x 2)

Behavioural Risk Factor Survey April 2016
Page 33 of 127
193.3.6 Frequency of having exercise in leisure-time
Respondents were asked how often they exercised in their leisure-time during the thirty
days prior to the survey. Overall, about one-third (30.6%) of the respondents reported that
they exercised less than once a month in their leisure-time. On the other hand, 18.5% of the
respondents reported that they exercised 4 times or more a week and 37.7% exercised one
to three times a week in their leisure-time (Fig. 3.3.6).
Fig. 3.3.6: Frequency of having exercise in leisure-time during the thirty days prior to
the survey (Section 2: Q5)
Base: All respondents excluding “don’t know” and refusal = 4 066
8.9% 9.6%
21.7%
16.0%
8.9%
4.4%
30.6%
0%
10%
20%
30%
40%
Once or more
a day
4-6 times per
week
2-3 times per
week
Once a week 2-3 times a
month
Once a month Less than
once a month
19
Exercise is defined as activities that make people breathe somewhat harder than normal and sweat.

Behavioural Risk Factor Survey April 2016
Page 34 of 127
3.4 Fruit and Vegetable Consumption
Five questions were asked in this survey to gauge respondents‟ fruit and vegetable
consumption.
203.4.1 Frequency of consuming fruit or vegetable juice per week
Overall, only 2.0% of the respondents drank fruit or vegetable juice on a daily basis. The
average number of days per week in which the respondents drank fruit or vegetable juice
was 0.4 day (Fig. 3.4.1).
Fig. 3.4.1: Number of days in the week when respondents drank fruit or vegetable juice (Section 3: Q3)
Base: All respondents excluding “don’t know” and refusal = 4 067
82.4%
7.7% 4.0% 2.3% 0.6% 0.8% 0.2% 2.0%
0%
10%
20%
30%
40%
50%
60%
70%
80%
90%
None 1 day 2 days 3 days 4 days 5 days 6 days 7 days
Mean days of drinking fruit or vegetable
juice per week = 0.4 day
3.4.2 Frequency of consuming fruit and vegetables per week
On a daily basis, more respondents consumed vegetables than fruit. Fig. 3.4.2 shows that
about four-fifths (80.3%) of the respondents had consumed vegetables every day while
about half the respondents (50.2%) had eaten fruit on a daily basis. On average, the
number of days per week that respondents consumed vegetables (6.4 days per week) was
higher than that for consuming fruit (5.0 days per week) (Fig. 3.4.2).
20
Fruit/vegetable juice refers to freshly squeezed juice or those labelled 100% or pure fruit/vegetable juice.

Behavioural Risk Factor Survey April 2016
Page 35 of 127
Fig. 3.4.2: Number of days in the week when respondents ate fruit and vegetables (Section 3: Q1a & Q2a)
Base: All respondents excluding refusal (Eating fruit = 4 070; Eating vegetables = 4 071)
3.7% 5.7%
8.9% 12.3%
8.3% 8.7% 2.1%
50.2%
0.4% 0.7% 1.3% 3.7% 4.3% 5.9% 3.3%
80.3%
0%
10%
20%
30%
40%
50%
60%
70%
80%
90%
None 1 day 2 days 3 days 4 days 5 days 6 days 7 days
Fruit Vegetables
Mean days of eating fruit per week = 5.0 days
Mean days of eating vegetables per week = 6.4 days
213.4.3 Amount of fruit and vegetables eaten per day
On average, 46.9% and 30.9% of the respondents consumed less than one fruit per day and 22
less than one bowl of cooked vegetables per day respectively. In addition, less than half
(48.1%) of the respondents consumed 1-2 fruit per day and less than two-thirds (63.3%) of
the respondents ate 1-2 bowls of cooked vegetables per day on average. Overall, the daily
average amount consumed was 1.0 fruit and 1.2 bowls of cooked vegetables (Table 3.4.3).
Table 3.4.3: Average amount of fruit and vegetables eaten per day (Section 3: Q1a, Q1b,
Q2a & Q2b)
Average no. of fruit/
no. of bowls of
cooked vegetables
eaten per day
Fruit Vegetables
Number % of Total Number % of Total
Less than 1 1 908 46.9% 1 253 30.9%
1 – 2 1 958 48.1% 2 568 63.3%
More than 2 201 4.9% 238 5.9%
Total 4 067* 100% 4 058* 100%
Mean 1.0 fruit 1.2 bowls of cooked vegetables
Note: * All respondents excluding “don’t know” and refusal
21
Respondents were informed that one fruit was a medium-sized apple or orange, one medium-sized banana,
two kiwi fruits or plums, or half bowl of small fruit like grapes or strawberries. For vegetables, it is
calculated in terms of bowl, where one bowl refers to the size of a rice bowl. The average number of fruit
eaten per day is calculated by: (the average number of days eating fruit per week x the average number of
fruit eaten on those days) / 7. Similarly, the average number of bowls of vegetables eaten per day is
calculated by: (the average number of days eating vegetables per week x the average number of bowls of
vegetables eaten on those days) / 7. 22
1 bowl of uncooked vegetable was coded as 0.5 bowl of cooked vegetable.

Behavioural Risk Factor Survey April 2016
Page 36 of 127
3.4.4 The total number of servings of fruit and vegetables consumed per day
The WHO recommends that adults should eat at least five servings of fruit and vegetables 23
per day or a daily intake of at least 400 grams of fruit and vegetables .
Total servings excluding fruit or vegetable juice
The number of servings of fruit and vegetables consumed per day was defined in this
survey as the sum of the average number of fruit eaten per day, and twice the average
number of bowls of cooked vegetables eaten per day (i.e. one fruit equates to 1 serving and
one bowl of cooked vegetables equates to 2 servings).
Overall, about one-fifth (20.5%) of the respondents consumed 5 or more servings of fruit
and vegetables per day. The mean and median numbers of servings per day were 3.4 and
3.0 respectively (Table 3.4.4a).
Table 3.4.4a: Number of servings of fruit and vegetables consumed per day excluding
juice (percentage, mean and median) (Section 3: Q1a, Q1b, Q2a & Q2b)
No. of servings
(excluding juice) Number % of Total
Less than 3 1 834 (0 serving = 7) 45.2% (0 serving = 0.2%)
3 - < 5 1 389 34.2%
5 or above 833 20.5%
Total 4 056* 100%
Mean 3.4 servings per day
Median 3.0 servings per day
Note: *All respondents excluding “don’t know” and refusal
Total servings including fruit or vegetable juice
When fruit or vegetable juice was included, the total number of servings of fruit and
vegetables consumed per day was defined in this survey as the sum of the average number
of fruit eaten per day, and twice the average number of bowls of cooked vegetables eaten
per day (i.e. one fruit equates to 1 serving and 1 bowl of cooked vegetables equates to 2
servings), and the average number of days per week having drunk one cup or more of fruit
or vegetable juice (fruit/vegetable juice only counted as 1 serving, regardless of how many 24
cups of juice were drunk in one day; less than 1 cup a day did not count) .
23
Fruit, vegetables and NCD disease prevention. Geneva: World Health Organization; 2003.
(http://www.who.int/dietphysicalactivity/media/en/gsfs_fv.pdf) 24
Juice (fruit and vegetable) only counted as 1 serving a day, regardless of how much is drunk because it has
very little fibre. It is also likely to lose some vitamins once juiced (particularly vitamin C, which is easily
destroyed by light and air).
Behavioural Risk Factor Survey April 2016
Page 37 of 127
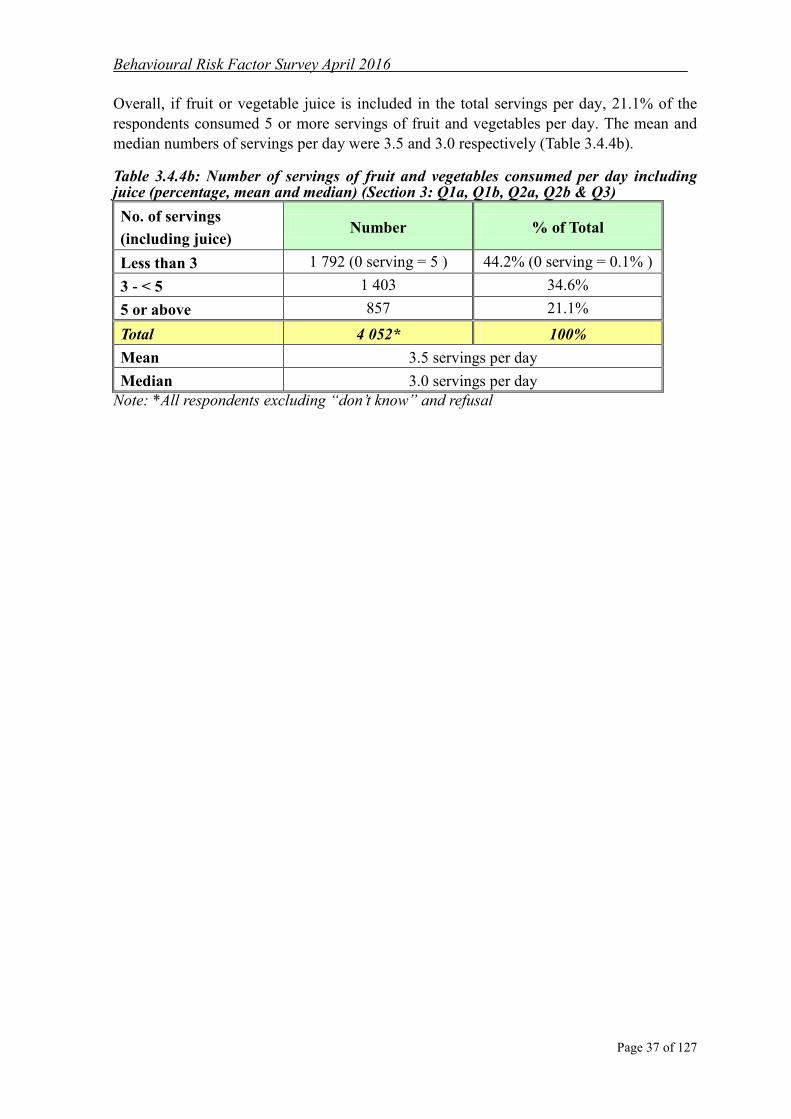
Overall, if fruit or vegetable juice is included in the total servings per day, 21.1% of the
respondents consumed 5 or more servings of fruit and vegetables per day. The mean and
median numbers of servings per day were 3.5 and 3.0 respectively (Table 3.4.4b).
Table 3.4.4b: Number of servings of fruit and vegetables consumed per day including juice (percentage, mean and median) (Section 3: Q1a, Q1b, Q2a, Q2b & Q3)
No. of servings
(including juice) Number % of Total
Less than 3 1 792 (0 serving = 5 ) 44.2% (0 serving = 0.1% )
3 - < 5 1 403 34.6%
5 or above 857 21.1%
Total 4 052* 100%
Mean 3.5 servings per day
Median 3.0 servings per day
Note: *All respondents excluding “don’t know” and refusal

Behavioural Risk Factor Survey April 2016
Page 38 of 127
3.5 Meat Consumption
In this section, 5 questions were asked to understand respondents‟ meat consumption
pattern during the thirty days prior to the survey.
253.5.1 26
Frequency of consuming red and white meat
Overall, more than two-fifths (44.4%) of the respondents had consumed red meat every
day while about a quarter (26.4%) of the respondents had eaten white meat on a daily basis.
The average number of days per week in which the respondents consumed red meat and
white meat were 5.0 days and 4.2 days respectively (Fig. 3.5.1).
Fig. 3.5.1 Number of days in the week when respondents ate red and white meat (Section 4: Q1a & Q2a)
Base: All respondents excluding “don’t know” and refusal (Eating red meat = 4 070; Eating white meat = 4 069)
4.1% 4.0% 7.2%
13.0% 11.8% 11.3%
4.3%
44.4%
3.2% 4.8%
15.2%
21.5%
14.9% 10.8%
3.2%
26.4%
0%
5%
10%
15%
20%
25%
30%
35%
40%
45%
50%
Less than
1 day
1 day 2 days 3 days 4 days 5 days 6 days 7 days
Red meat White meat
Mean days of eating red meat per week = 5.0 days
Mean days of eating white meat per week= 4.2 days
25
Respondents were given example of red meat: pork, beef and lamb. 26
Respondents were given example of white meat: poultry and fish.

Behavioural Risk Factor Survey April 2016
Page 39 of 127
273.5.2 Amount of red meat and white meat consumed per day
Overall, about two-fifths (42.6%) of the respondents ate less than 2 taels of red meat per
day and more than half (57.1%) of the respondents ate less than 2 taels of white meat per
day. On average, respondents consumed 2.7 taels of red meat and 2.1 taels of white meat
per day (Table 3.5.2).
Table 3.5.2: Number of taels of red meat and white meat consumed per day (Percentage,
mean and median) (Section 4: Q1a, Q1b, Q2a & Q2b)
No. of taels Red Meat White Meat
Number % of Total Number % of Total
Less than 2 1 719 42.6% 2 299 57.1%
2-4 1 595 39.5% 1 282 31.8%
More than 4 726 18.0% 448 11.1%
Total 4 040* 100.0% 4 029* 100.0%
Mean 2.7 taels 2.1 taels
Median 2.0 taels 1.7 taels
*All respondent excluding “don’t know” and refusal
3.5.3 Average daily total consumption of red and white meat
In total, about a quarter (25.2%) of the respondents consumed more than 6 taels of red and
white meat on average per day (with a mean of 4.8 taels) during the thirty days prior to the
survey (Table 3.5.3).
Table 3.5.3: Average daily total consumption of red and white meat per day (Percentage,
mean and median) (Section 4: Q1a, Q1b, Q2a & Q2b)
No. of taels Number % of Total
Less than 4 1 948 48.5%
4-6 1 058 26.3%
More than 6 1 013 25.2%
Total 4 018* 100.0%
Mean 4.8 taels
Median 4.0 taels
*All respondent excluding “don’t know” and refusal
27
The average number of taels of red/white meat consumption per day was computed by multiplying the
average number of days consuming red/white meat on a weekly basis and the average number of taels of
red/white meat consumed on the days they had eaten red/white meat and then dividing by 7 days. Red meat:
(Q1a*Q1b)/7; White meat: (Q2a*Q2b)/7.
Behavioural Risk Factor Survey April 2016
Page 40 of 127
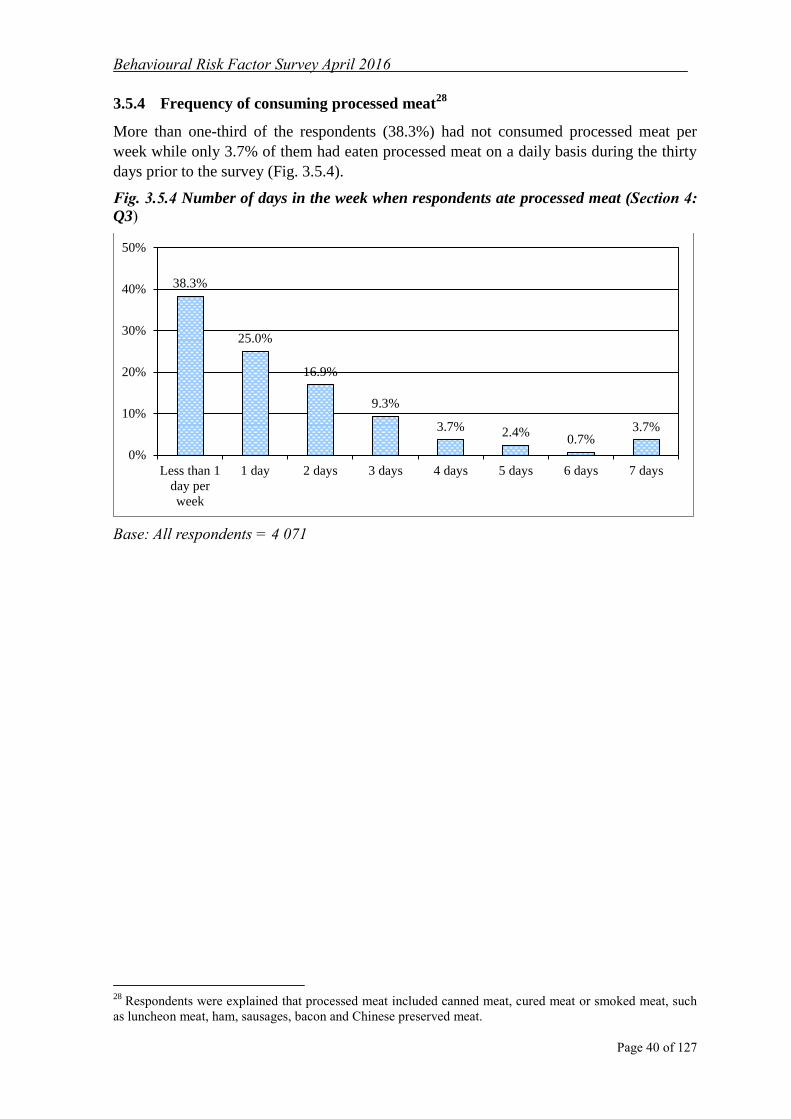
283.5.4 Frequency of consuming processed meat
More than one-third of the respondents (38.3%) had not consumed processed meat per
week while only 3.7% of them had eaten processed meat on a daily basis during the thirty
days prior to the survey (Fig. 3.5.4).
Fig. 3.5.4 Number of days in the week when respondents ate processed meat (Section 4:
Q3)
Base: All respondents = 4 071
38.3%
25.0%
16.9%
9.3%
3.7% 2.4% 0.7%
3.7%
0%
10%
20%
30%
40%
50%
Less than 1
day per
week
1 day 2 days 3 days 4 days 5 days 6 days 7 days
28
Respondents were explained that processed meat included canned meat, cured meat or smoked meat, such
as luncheon meat, ham, sausages, bacon and Chinese preserved meat.

Behavioural Risk Factor Survey April 2016
Page 41 of 127
3.6 Smoking Pattern
In this survey, four questions were asked to assess respondents‟ smoking pattern.
3.6.1 Whether smoked before
About four-fifths (79.8%) of the respondents reported that they had never smoked, 9.4%
smoked in the past but had now abstained and 10.9% of the respondents were current
smokers (Fig. 3.6.1).
Fig. 3.6.1: Breakdown of smoking habits amongst respondents (Section 5: Q1)
Base: All respondents = 4 071
Yes, but not now
9.4%
Yes, and still
smoking
10.9%
Never
79.8%

Behavioural Risk Factor Survey April 2016
Page 42 of 127
3.6.2 Abstaining from smoking
Among those who had smoked before but had now abstained from smoking, most (89.6%)
of them reported that they had abstained for more than one year and 9.4% had given up
smoking for one month to one year. Only 1.0% of them reported that they had given up
smoking for less than one month (Fig. 3.6.2).
Fig. 3.6.2: Length of time abstained from smoking (Section 5: Q2)
Base: All past smokers = 381
Less than 1 month
1.0%
1 month to 1 year
9.4%
More than 1 year
89.6%
3.6.3 Cigarette consumption
Among the current smokers, the vast majority (95.9%) of them were daily smokers.
Almost half (47.1%) of the current smokers reported that they smoked at least 11 cigarettes
a day and nearly half (48.8%) of the current smokers reported that they smoked 1-10
cigarettes per day (Fig. 3.6.3).
Fig. 3.6.3: Number of cigarettes smoked on average per day by current smokers (Section
5: Q3a)
Base: All current smokers excluding refusal = 441
Less than 1 per day
4.1%
1-10 per day
48.8%
11-20 per day
38.1%
More than 20 per
day
9.0%

Behavioural Risk Factor Survey April 2016
Page 43 of 127
3.6.4 Whether respondents were planning to quit smoking or smoke less in the next
6 months
Among the current smokers, more than half (52.6%) of them had no plan to quit smoking
or smoke less in the next 6 months while only about one-fifth (20.7%) of them were
planning to quit smoking (Fig. 3.6.4).
Fig. 3.6.4: Whether respondents were planning to quit smoking or smoke less in the next
6 months (Section 5: Q3b)
Base: All current smokers excluding “not sure/don’t know” and refusal = 432
Yes, plan to quit
smoking
20.7%
Yes, plan to smoke
less
26.7%
No plan to change
52.6%

Behavioural Risk Factor Survey April 2016
Page 44 of 127
3.7 Pattern of Alcohol Consumption
In this survey, seven questions were asked to identify the respondents‟ alcohol drinking
patterns.
3.7.1 Whether had a drink containing alcohol during the past year prior to the
survey
Overall, about seven-tenths (70.5%) of the respondents reported that they had a drink
containing alcohol during the past year prior to the survey. On the other hand, more than a
quarter (29.5%) of the respondents reported that they had never drunk alcohol during the
past year prior to the survey (Fig. 3.7.1).
Fig. 3.7.1: Whether had a drink containing alcohol during the past year prior to the
survey (Section 6: Q1a)
Base: All respondents excluding “don’t know” = 4 070
Yes
70.5%
No
29.5%

Behavioural Risk Factor Survey April 2016
Page 45 of 127
3.7.2 Whether respondents would have a drink containing alcohol in the next 6
months
Among those respondents who had never drunk alcohol during the past year prior to the
survey, most (96.5%) of them would not have a drink containing alcohol in the next 6
months. (Fig. 3.7.2)
Fig. 3.7.2: Whether respondents would have a drink containing alcohol in the next 6
months (Section 6: Q1b)
Base: Respondents who had never drunk alcohol during the past year prior to the survey excluding “not sure/don’t know” =1 146
Yes
3.5%
No
96.5%

Behavioural Risk Factor Survey April 2016
Page 46 of 127
3.7.3 Frequency of alcohol consumption
Among those respondents who had at least one alcoholic drink during the past year prior to
the survey, less than one-tenth (4.0%) reported that they drank daily. On the other hand,
about two-fifths (40.0%) of the drinkers reported that they drank less than monthly (Fig.
3.7.3).
Fig. 3.7.3: Frequency of drinkers consuming at least one alcoholic drink (Section 6: Q2a)
Base: Respondents who had at least one alcoholic drink during the past year prior to the survey excluding outliers and refusal = 2 835
40.0%
19.5%
15.7%
10.9%
4.5% 2.9%
1.3% 0.9% 0.3% 4.0%
0%
10%
20%
30%
40%
50%
60%
Less than
monthly
Once a
month
2 to 3
times a
month
Once a
week
2 times a
week
3 times a
week
4 times a
week
5 times a
week
6 times a
week
Once a
day

Behavioural Risk Factor Survey April 2016
Page 47 of 127
3.7.4 Type of alcoholic drinks consumed by drinkers
Among those respondents who had at least one alcoholic drink during the past year prior to
the survey, nearly half (47.2%) of them reported that they consumed beer and about two-
fifths (40.7%) of them reported that they consumed red/white wine (Fig. 3.7.4).
Fig. 3.7.4: Type of alcoholic drinks consumed by drinkers (Section 6: Q2b)
Base: Respondents who had at least one alcoholic drink during the past year prior to the survey excluding outliers and refusal = 2 832
47.2%
40.7%
3.8% 1.9% 1.9% 1.3% 1.1% 1.0% 0.7% 0.3% 0.2%
0%
10%
20%
30%
40%
50%
60%
Beer Red/ Spirit Sake Umeshu Fruit/ Cocktail Rice Herbal Cider Shorgum
White wine Sweet wine Wine liqueur

Behavioural Risk Factor Survey April 2016
Page 48 of 127
3.7.5 Amount of alcoholic drinks consumed
The respondents who drank at least one alcoholic drink during the past year prior to the 29
survey were further asked about how many standard drinks they would consume on each
drinking day. Over four-fifths (82.3%) of them consumed less than 3 standard drinks on
each drinking day while less than one-tenth (7.6%) consumed 5 or more standard drinks.
On average, they consumed 2.1 standard drinks on each drinking day and the median was
1.3 standard drinks (Table 3.7.5).
Table 3.7.5: Average number of standard drinks consumed on the days respondents drank alcohol (percentage, mean and median) (Section 6: Q2b)
No. of standard drinks Number % of Total
Less than 3 2 291 82.3%
3 – < 5 281 10.1%
5 or above 213 7.6%
Total 2 785* 100%
Mean 2.1 standard drinks
Median 1.3 standard drinks
Note: * Respondents who had at least one alcoholic drink during the past year prior to the survey excluding outliers, “don’t know” and refusal
29
The number of standard drinks consumed was estimated as follows: one can of beer of about 330 ml is
equal to 1.3 standard drinks; one dining glass of wine of 125 ml is approximately equal to 1.2 standard
drinks. For details, please refer to the survey questions (Q2b).
Behavioural Risk Factor Survey April 2016
Page 49 of 127
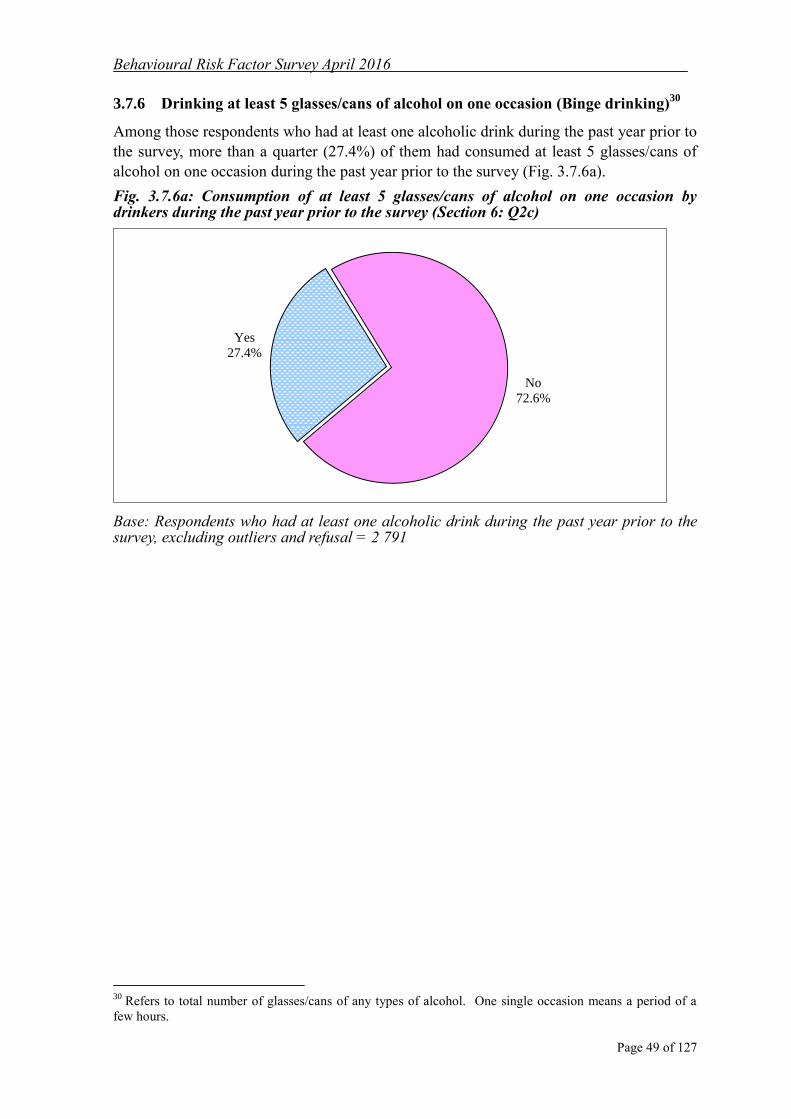
303.7.6 Drinking at least 5 glasses/cans of alcohol on one occasion (Binge drinking)
Among those respondents who had at least one alcoholic drink during the past year prior to
the survey, more than a quarter (27.4%) of them had consumed at least 5 glasses/cans of
alcohol on one occasion during the past year prior to the survey (Fig. 3.7.6a).
Fig. 3.7.6a: Consumption of at least 5 glasses/cans of alcohol on one occasion by drinkers during the past year prior to the survey (Section 6: Q2c)
Base: Respondents who had at least one alcoholic drink during the past year prior to the survey, excluding outliers and refusal = 2 791
Yes
27.4%
No
72.6%
30
Refers to total number of glasses/cans of any types of alcohol. One single occasion means a period of a
few hours.
Behavioural Risk Factor Survey April 2016
Page 50 of 127
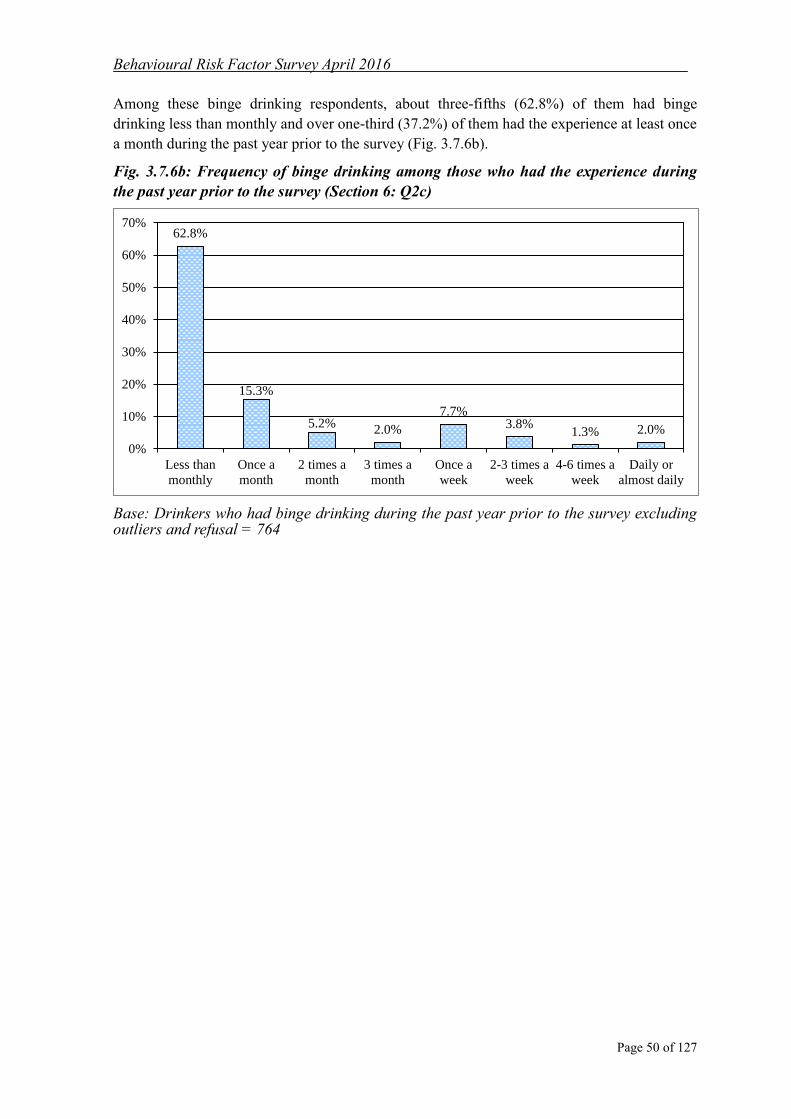
Among these binge drinking respondents, about three-fifths (62.8%) of them had binge
drinking less than monthly and over one-third (37.2%) of them had the experience at least once
a month during the past year prior to the survey (Fig. 3.7.6b).
Fig. 3.7.6b: Frequency of binge drinking among those who had the experience during
the past year prior to the survey (Section 6: Q2c)
Base: Drinkers who had binge drinking during the past year prior to the survey excluding outliers and refusal = 764
62.8%
15.3%
5.2% 2.0%
7.7% 3.8%
1.3% 2.0%
0%
10%
20%
30%
40%
50%
60%
70%
Less than
monthly
Once a
month
2 times a
month
3 times a
month
Once a
week
2-3 times a
week
4-6 times a
week
Daily or
almost daily

Behavioural Risk Factor Survey April 2016
Page 51 of 127
3.7.7 Whether the respondents were planning to change their drinking habit in the
next 6 months
Among those respondents who had at least one alcoholic drink during the past year prior to
the survey, only 6.8% of them were planning to drink less and 2% were planning to stop
drinking completely in the next 6 months (Fig. 3.7.7).
Fig. 3.7.7: Whether the respondents were planning to change their drinking habit in the
next 6 months (Section 6: Q2d)
Base: Respondents who had at least one alcoholic drink during the past year prior to the survey excluding outliers, “not sure/don’t know” and refusal = 2 791
0.6%
6.8%
2.0%
No plan to change
90.7%
Yes, plan to
drink more
Yes, plan to
drink less
Yes, plan to stop
drinking
completelyNo plan to
change

Behavioural Risk Factor Survey April 2016
Page 52 of 127
3.8 Cervical Cancer Screening (for female respondents only)
In this section, five questions were asked to assess female respondents‟ behaviour
regarding cervical screening.
3.8.1 Whether had a cervical smear before
Overall, nearly two-thirds (63.4%) of the female respondents reported that they had a
cervical smear before (Fig. 3.8.1).
Fig. 3.8.1: Whether had a cervical smear before (Section 7: Q1a)
Base: All female respondents excluding “not sure” and refusal = 2 153
Yes
63.4% No
36.6%
3.8.2 Length of time since last cervical smear if ever had a smear
Of those female respondents who had had a cervical smear before, more than two-fifths
(45.0%) had their last cervical smear taken within twelve months prior to the survey.
About one-third (34.5%) of them had the examination within 13-36 months, while 20.4%
had their last cervical smear at least 37 months ago (Fig. 3.8.2).
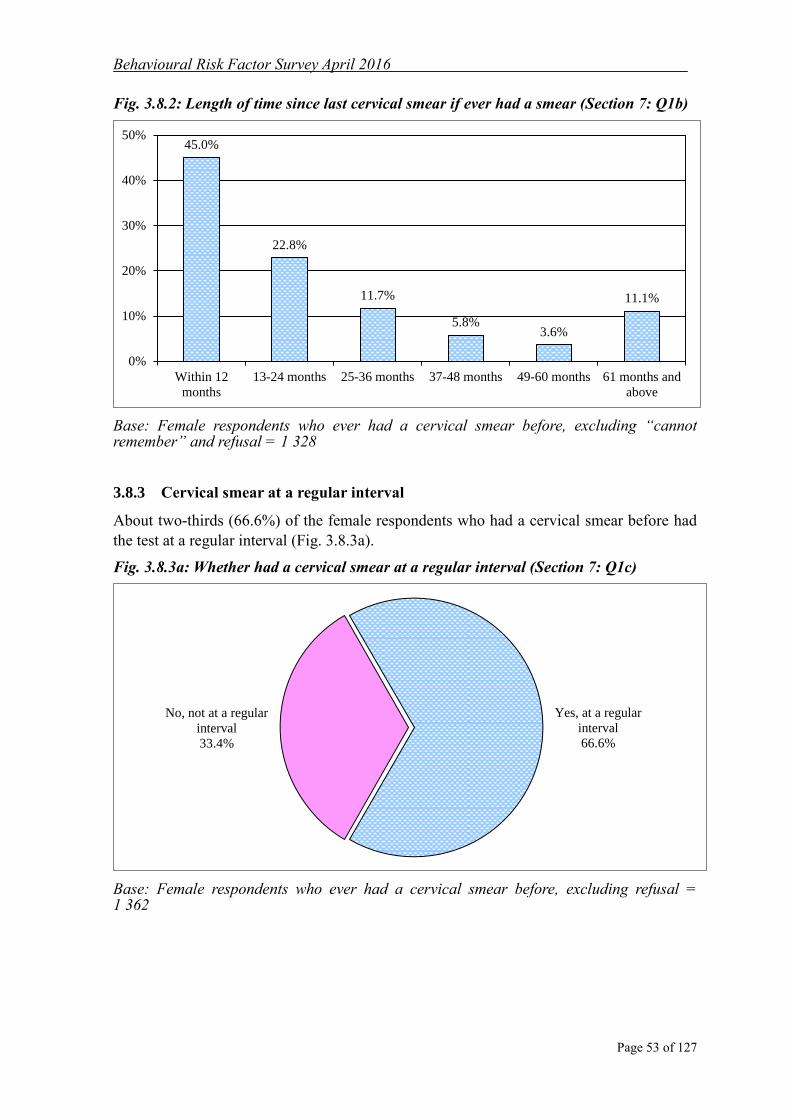
Behavioural Risk Factor Survey April 2016
Page 53 of 127
Fig. 3.8.2: Length of time since last cervical smear if ever had a smear (Section 7: Q1b)
Base: Female respondents who ever had a cervical smear before, excluding “cannot remember” and refusal = 1 328
45.0%
22.8%
11.7%
5.8% 3.6%
11.1%
0%
10%
20%
30%
40%
50%
Within 12
months
13-24 months 25-36 months 37-48 months 49-60 months 61 months and
above
3.8.3 Cervical smear at a regular interval
About two-thirds (66.6%) of the female respondents who had a cervical smear before had
the test at a regular interval (Fig. 3.8.3a).
Fig. 3.8.3a: Whether had a cervical smear at a regular interval (Section 7: Q1c)
Base: Female respondents who ever had a cervical smear before, excluding refusal = 1 362
Yes, at a regular
interval
66.6%
No, not at a regular
interval
33.4%

Behavioural Risk Factor Survey April 2016
Page 54 of 127
Among those female respondents who had a cervical smear at a regular interval, about one-
third (35.7%) of the respondents reported that they had a cervical smear once a year.
Nearly three-fifths (57.4%) of them had it once every two or three years. Another 3.6%
had the test more than once a year (Fig. 3.8.3b).
Fig. 3.8.3b: Frequency of having cervical smear at a regular interval (Section 7: Q1d)
Base: Female respondents who had cervical smear at a regular interval, excluding “cannot say/ remember” and refusal = 853
3.6%
35.7%
32.3%
25.1%
1.9% 1.4%
0%
10%
20%
30%
40%
50%
More than once
a year
Once a year Once every 2
years
Once every 3
years
Once every 4
years
Once every 5
years
3.8.4 Whether had a total hysterectomy
Among all female respondents, 4.2% of them had a total hysterectomy (surgical removal of
the entire uterus) (Fig. 3.8.4).
Fig. 3.8.4: Whether had a total hysterectomy (Section 7: Q2)
Base: All female respondents excluding refusal = 2 161
Yes
4.2%
No
95.8%

Behavioural Risk Factor Survey April 2016
Page 55 of 127
3.9 Awareness of Cancer Prevention and Screening
In this section, nine questions were asked to assess the respondents‟ awareness of cancer
prevention and screening.
3.9.1 Awareness of cancer prevention
Over 90% of the respondents strongly agreed/agreed to the (correct) statements “Some
cancer cases can be prevented by adopting healthy lifestyle” and “Processed meat can
cause colorectal cancer”. Over 60% of the respondents strongly agreed/agreed to the
(correct) statements “Obesity is a risk factor for cancers” and “Cancer screening is to
conduct test on people who have no symptom”. However, about two-fifths (41.6%) of
them strongly disagreed/disagreed to the (correct) statement “Alcohol is a human cancer-
causing agent (carcinogen)” (Fig. 3.9.1).
Fig. 3.9.1: Awareness of cancer prevention (Section 8: Q1a-Q1e)
Base: All respondents
10.2%
10.8%
30.9%
8.3%
42.0%
58.7%
50.3%
60.6%
42.3%
54.7%
20.6%
31.7%
4.9%
40.5%
2.6%
1.6%
1.3%
0.4%
1.1%
0.1%
8.9%
5.9%
3.2%
7.9%
0.5%
0% 20% 40% 60% 80% 100%
Q1e. Cancer screening is to conduct test on
people who have no symptom.
Q1d. Obesity is a risk factor for cancers.
Q1c. Processed meat can cause colorectal
cancer.
Q1b. Alcohol is a human cancer-causing agent
(carcinogen).
Q1a. Some cancer cases can be prevented by
adopting healthy lifestyle.
Strongly agree Agree Disagree Strongly disagree Don't know
(4 071)
(4 071)
(4 071)
(4 071)
Base
(4 071)

Behavioural Risk Factor Survey April 2016
Page 56 of 127
3.9.2 Awareness of cancer screening
The statements “Cancer screening results are 100% accurate” and “Cancer screening may
be done without a doctor's instruction or advice” are incorrect, while “Some cancer
screening tests have potential risks” is a correct statement. However, only about two-fifths
(44.8%) of the respondents strongly disagreed/disagreed to “Cancer screening results are
100% accurate”. While over four-fifths (81.2%) of the respondents strongly
disagreed/disagreed with “Cancer screening may be done without a doctor's instruction or
advice”, 17.1% of them strongly disagreed/disagreed to “Some cancer screening tests have
potential risks”. (Fig. 3.9.2)
Fig. 3.9.2: Awareness of cancer screening (Section 8: Q1f-Q1h)
Base: All respondents excluding refusal
1.4%
4.8%
4.1%
14.1%
66.7%
43.3%
62.7%
16.5%
42.6%
18.5%
0.6%
2.2%
3.3%
11.4%
7.9%
0% 20% 40% 60% 80% 100%
Q1h. Cancer screening may be done
without a doctor's instruction or
advice.
Q1g. Some cancer screening tests
have potential risks.
Q1f. Cancer screening results are
100% accurate.
Strongly agree Agree Disagree Strongly disagree Don't know
Base
(4 070)
(4 070)
(4 070)
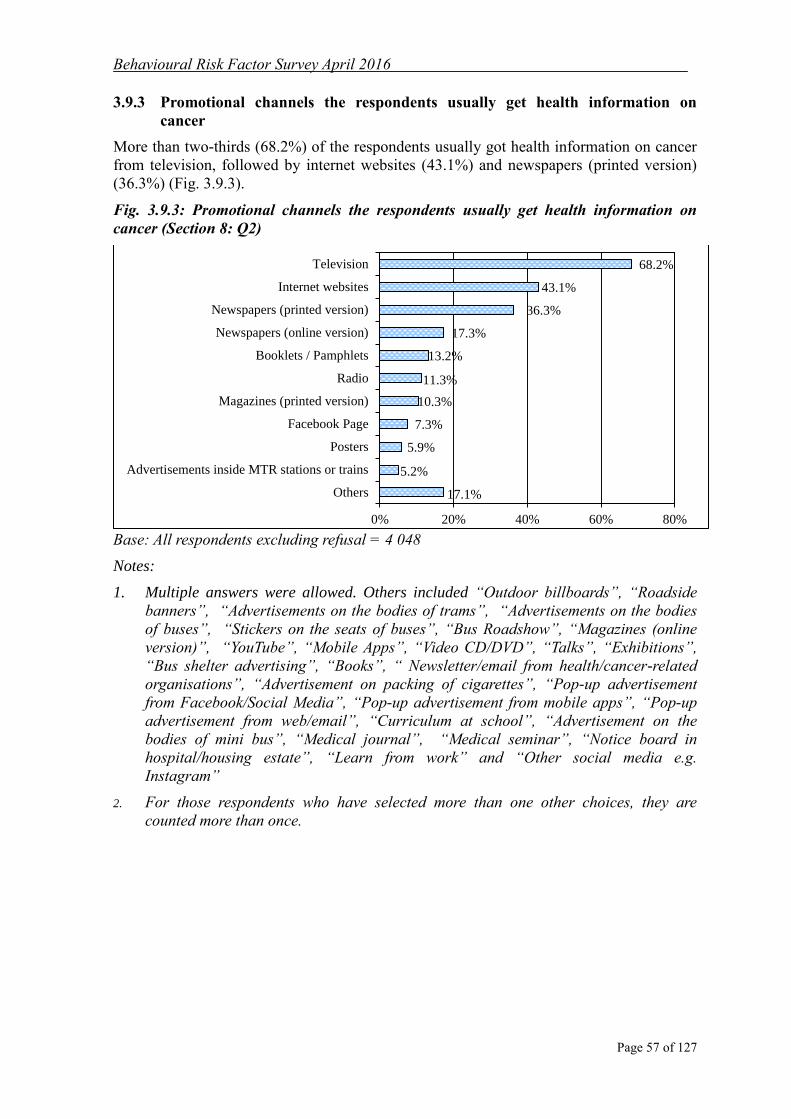
Behavioural Risk Factor Survey April 2016
Page 57 of 127
3.9.3 Promotional channels the respondents usually get health information on
cancer
More than two-thirds (68.2%) of the respondents usually got health information on cancer
from television, followed by internet websites (43.1%) and newspapers (printed version)
(36.3%) (Fig. 3.9.3).
Fig. 3.9.3: Promotional channels the respondents usually get health information on
cancer (Section 8: Q2)
Base: All respondents excluding refusal = 4 048
17.1%
5.2%
5.9%
7.3%
10.3%
11.3%
13.2%
17.3%
36.3%
43.1%
68.2%
0% 20% 40% 60% 80%
Others
Advertisements inside MTR stations or trains
Posters
Facebook Page
Magazines (printed version)
Radio
Booklets / Pamphlets
Newspapers (online version)
Newspapers (printed version)
Internet websites
Television
Notes:
1. Multiple answers were allowed. Others included “Outdoor billboards”, “Roadside
banners”, “Advertisements on the bodies of trams”, “Advertisements on the bodies
of buses”, “Stickers on the seats of buses”, “Bus Roadshow”, “Magazines (online
version)”, “YouTube”, “Mobile Apps”, “Video CD/DVD”, “Talks”, “Exhibitions”,
“Bus shelter advertising”, “Books”, “ Newsletter/email from health/cancer-related
organisations”, “Advertisement on packing of cigarettes”, “Pop-up advertisement
from Facebook/Social Media”, “Pop-up advertisement from mobile apps”, “Pop-up
advertisement from web/email”, “Curriculum at school”, “Advertisement on the
bodies of mini bus”, “Medical journal”, “Medical seminar”, “Notice board in
hospital/housing estate”, “Learn from work” and “Other social media e.g.
Instagram”
2. For those respondents who have selected more than one other choices, they are
counted more than once.

Behavioural Risk Factor Survey April 2016
Page 58 of 127
3.10 Use of Mobile Phone
In this section, three questions were asked to understand the use of mobile phone by
respondents.
3.10.1 Whether currently using a mobile phone
Most respondents (98.9%) reported that they were currently using a mobile phone (Fig.
3.10.1).
Fig. 3.10.1: Whether currently using a mobile phone (Section 9: Q1)
Base: All respondents = 4 071
Yes
98.9%
No
1.1%
3.10.2 Number of mobile phone numbers in total which the respondents were using
personally and would usually answer
Among those respondents who were currently using a mobile phone, the majority (84.3%)
of them had only one mobile phone number which they were using personally and would
usually answer (Fig. 3.10.2).

Behavioural Risk Factor Survey April 2016
Page 59 of 127
Fig. 3.10.2: Number of mobile phone numbers in total which the respondents were using
personally and would usually answer (Section 9: Q2)
Base: Respondents who were currently using a mobile phone excluding outliers and refusal
= 4 015
One
84.3% Two or five
15.7%
3.10.3 Percentage of all the telephone calls that the respondents received on their
mobile phone
Among those respondents who were currently using a mobile phone, about half (51.8%) of
them received 81% or more mobile phone calls out of all the telephone calls as compared
with residential telephone (Table 3.10.3).
Table 3.10.3: Percentage of all the telephone calls that the respondents received on their
mobile phone (Section 9: Q3)
Percentage (%) Number % of Total
1-20 303 7.6%
21-40 198 5.0%
41-60 478 12.0%
61-80 941 23.6%
81-100 2 061 51.8%
Total 3 982* 100%
Note: * Respondents who were currently using a mobile phone excluding “don’t know”
and refusal
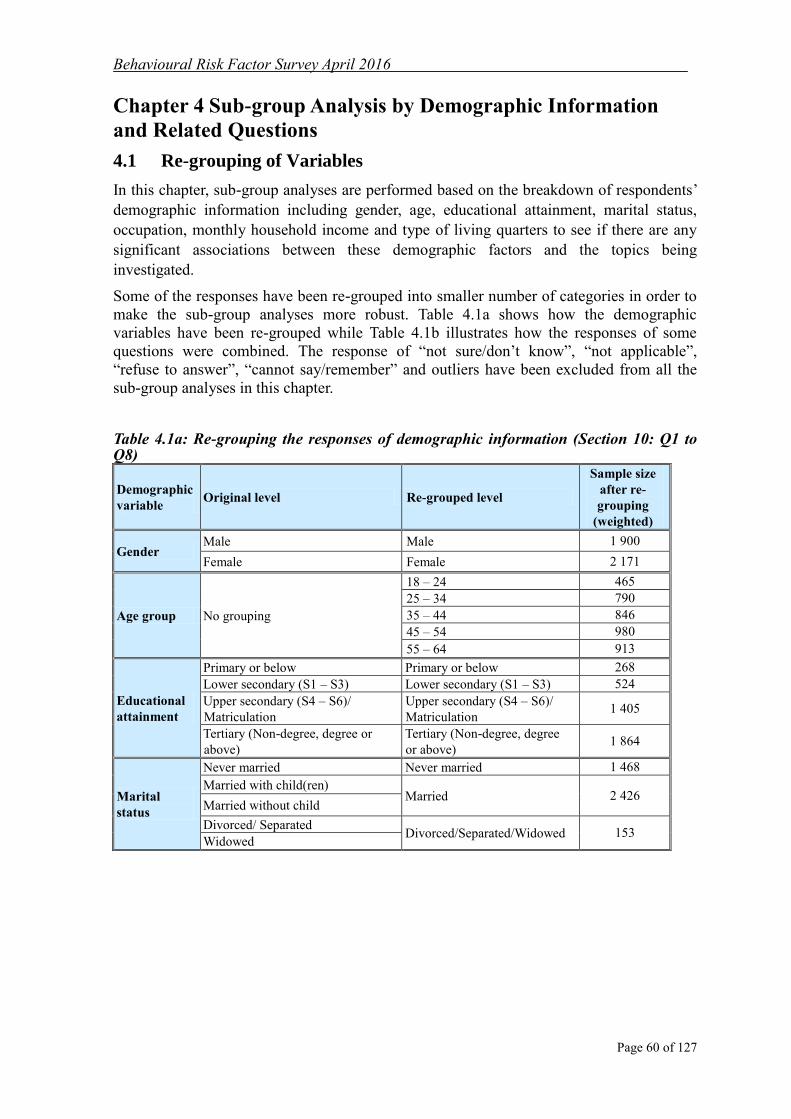
Behavioural Risk Factor Survey April 2016
Page 60 of 127
Chapter 4 Sub-group Analysis by Demographic Information
and Related Questions
4.1 Re-grouping of Variables
In this chapter, sub-group analyses are performed based on the breakdown of respondents‟
demographic information including gender, age, educational attainment, marital status,
occupation, monthly household income and type of living quarters to see if there are any
significant associations between these demographic factors and the topics being
investigated.
Some of the responses have been re-grouped into smaller number of categories in order to
make the sub-group analyses more robust. Table 4.1a shows how the demographic
variables have been re-grouped while Table 4.1b illustrates how the responses of some
questions were combined. The response of “not sure/don‟t know”, “not applicable”,
“refuse to answer”, “cannot say/remember” and outliers have been excluded from all the
sub-group analyses in this chapter.
Table 4.1a: Re-grouping the responses of demographic information (Section 10: Q1 to Q8)
Demographic
variable Original level Re-grouped level
Sample size
after re-
grouping
(weighted)
Gender Male Male 1 900
Female Female 2 171
Age group No grouping
18 – 24 465
25 – 34 790
35 – 44 846
45 – 54 980
55 – 64 913
Educational
attainment
Primary or below Primary or below 268
Lower secondary (S1 – S3) Lower secondary (S1 – S3) 524
Upper secondary (S4 – S6)/
Matriculation
Upper secondary (S4 – S6)/
Matriculation 1 405
Tertiary (Non-degree, degree or
above)
Tertiary (Non-degree, degree
or above) 1 864
Marital
status
Never married Never married 1 468
Married with child(ren) Married 2 426
Married without child
Divorced/ Separated Divorced/Separated/Widowed 153
Widowed
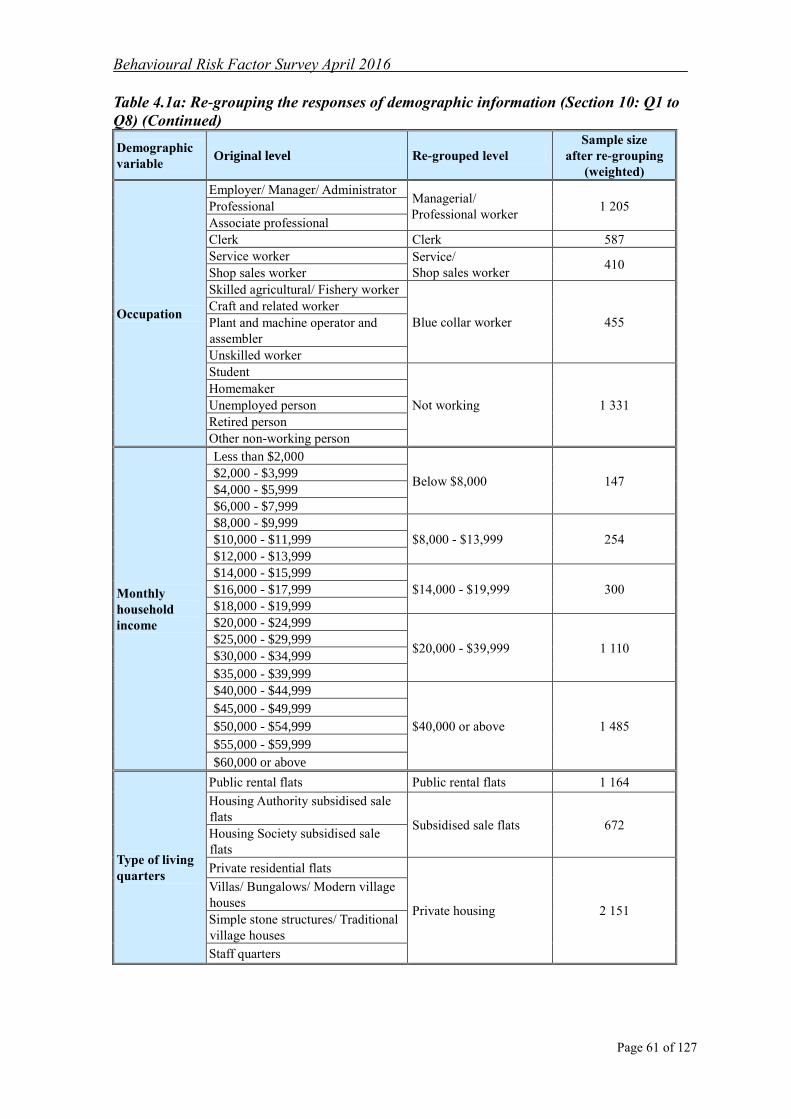
Behavioural Risk Factor Survey April 2016
Page 61 of 127
Table 4.1a: Re-grouping the responses of demographic information (Section 10: Q1 to
Q8) (Continued)
Demographic
variable Original level Re-grouped level
Sample size
after re-grouping
(weighted)
Occupation
Employer/ Manager/ Administrator Managerial/
Professional worker 1 205 Professional
Associate professional
Clerk Clerk 587
Service worker Service/
Shop sales worker 410
Shop sales worker
Skilled agricultural/ Fishery worker
Blue collar worker 455
Craft and related worker
Plant and machine operator and
assembler
Unskilled worker
Student
Not working 1 331
Homemaker
Unemployed person
Retired person
Other non-working person
Monthly
household
income
Less than $2,000
Below $8,000 147 $2,000 - $3,999
$4,000 - $5,999
$6,000 - $7,999
$8,000 - $9,999
$8,000 - $13,999 254 $10,000 - $11,999
$12,000 - $13,999
$14,000 - $15,999
$14,000 - $19,999 300 $16,000 - $17,999
$18,000 - $19,999
$20,000 - $24,999
$20,000 - $39,999 1 110 $25,000 - $29,999
$30,000 - $34,999
$35,000 - $39,999
$40,000 - $44,999
$40,000 or above 1 485
$45,000 - $49,999
$50,000 - $54,999
$55,000 - $59,999
$60,000 or above
Type of living
quarters
Public rental flats Public rental flats 1 164
Housing Authority subsidised sale
flats Subsidised sale flats 672
Housing Society subsidised sale
flats
Private residential flats
Private housing 2 151
Villas/ Bungalows/ Modern village
houses
Simple stone structures/ Traditional
village houses
Staff quarters

Behavioural Risk Factor Survey April 2016
Page 62 of 127
Table 4.1b: Re-grouping the responses of questions
Question No. Question content Original level Re-grouped level
Section 2:
Q1a, Q2a
and Q3a
Section 3:
Q1a, Q2a
and Q3
Section 4:
Q1a, Q2a
and Q3
Average days per week spent on
vigorous/moderate physical
activities and walking
Average days per week consumed
fruit/vegetable and drink
fruit/vegetable juice
Average days per week consumed
red/white/processed meat
0 day/Less than 1 day
per week 0 - 1 day
1 day
2 days 2 - 3 days
3 days
4 days 4 - 5 days
5 days
6 days 6 - 7 days
7 days
Section 2: Q4 Average time spent on sitting on a
weekday
No grouping 10 mins - < 2 hrs
2 - < 4 hrs
4 - < 6 hrs
6 - < 8 hrs
8 - < 10 hrs
10 – 15 hrs
Section 2: Q5 Frequency of doing exercise in the
leisure-time
Once or more a day At least 4 times per
week 4-6 times per week
2-3 times per week 1-3 times per week
Once a week
2-3 times a month 1-3 times per month
Once a month
Less than once a month Less than once a month
Section 3:
Q1a, Q1b,
Q2a and Q2b
Section 3:
Q1a, Q1b,
Q2a, Q2b
and Q3
The total number of servings of
fruit and vegetables consumed per
day excluding fruit or vegetable
juice
The total number of servings of
fruit and vegetables consumed per
day including fruit or vegetable
juice
No grouping
Less than 5 servings
5 servings or more
Section 5:
Q3a
Average number of cigarettes
smoked per day
Less than 1 per day 10 per day or less
1-10 per day
11-20 per day More than 10 per day
More than 20 per day
Section 6:
Q2a
Frequency of having a drink
containing alcohol
Less than monthly Once per week or less Once a month
2 to 3 times a month
Once a week
2 times a week 2-3 times per week 3 times a week
4 times a week 4 times per week or
more 5 times a week
6 times a week
Once a day

Behavioural Risk Factor Survey April 2016
Page 63 of 127
Table 4.1b: Re-grouping the responses of questions (Continued)
Question No. Question content Original level Re-grouped level
Section 6: Q2c Frequency of having at
least 5 or more drinks on
one occasion
Never Never
Less than monthly Less than monthly at least Once a month
2 times a month
3 times a month
Once a week
2-3 times a week
4-6 times a week
Daily or almost daily
Section 6: Q2c Frequency of having at
least 5 or more drinks on
one occasion
Less than monthly Once a month or less Once a month
2 times a month Twice a month or more 3 times a month
Once a week
2-3 times a week
4-6 times a week
Daily or almost daily
Section 7: Q1b Period of time since last
cervical smear Within 12 months Within 12 months
13 - 24 months 13 - 36 months
25 - 36 months
37 - 48 months
37 months or above 49 - 60 months
61 months or above
Section 7: Q1d Frequency of having
cervical smear More than once a year
At least once a year Once a year
Once every 2 years Once every 2 years
Once every 3 years
Less frequent than once
every 2 years
Once every 4 years
Once every 5 years
Once every 6 - 10 years
Less frequent than once
every 10 years
Section 8:
Q1a-Q1h
Awareness of cancer
prevention and screening Strongly agree
Strongly agree/Agree Agree
Disagree Strongly disagree/Disagree
Strongly disagree
Don't know Don't know
Behavioural Risk Factor Survey April 2016
Page 64 of 127
Three types of statistical tests are used for sub-group analysis in this report, namely 31
Pearson‟s chi-square test, Kruskal-Wallis test and Spearman‟s rank correlation .
When both variables are nominal, Pearson‟s chi-square test is used. When one variable is
nominal and the other one is ordinal, the Kruskal-Wallis test is adopted. Spearman‟s rank
correlation is performed when both variables are ordinal. Only statistically significant
results at the 5% level and expected values >5 are presented in this chapter. While the
Pearson‟s chi-square test uses weighted data, the Kruskal-Wallis test and Spearman‟s rank
correlation are carried out without weighting as SPSS is unable to handle non-integer
weights for these two tests. However, all percentages are reported after weighting.
31
The statistical tests have been performed using SPSS. Formulae of the statistical tests are included for
reference.
Pearson’s Chi-square test:
i j ij
ijOij
ee 2
2 )(
where ijO is the observed value corresponding to the i
th column and the j
th row,
ije is the expected value
corresponding to the ith
column and the jth
row. The calculation of ije is as follows: expected value = (i
th
column total x jth
row total) / Overall total.
Kruskal-Wallis test:
)1(3)1(
12
1
2
Nn
R
NNH
k
i i
i
where N is the total number of observations, Ri is the sum of the ranks of the values of the ith
sample, ni is the
number of observations of the ith
sample.
Spearman’s rank correlation coefficient:
N
i
ii
SxSyN
YYXXr
1 )1(
))((
where N is the sample size and Sx and Sy are the standard deviations of the rank of the two variables, Xi and
Yi are the ith
rank of X and Y respectively, and X and Y are the mean rank of X and Y respectively. The
rank order of each data value is used in the above formula (adjustments are made if there are ties). Pairwise
method is used to handle missing data.

Behavioural Risk Factor Survey April 2016
Page 65 of 127
4.2 Weight Status, Control and Perception
4.2.1 Weight status
When the locally adapted classification of weight status for Chinese adults in Hong Kong
is used, weight status is associated significantly with the respondents‟ gender, age,
educational attainment, marital status, occupation and type of living quarters.
More male respondents (28.5%) were classified as “obese” while more female respondents
(11.9%) were classified as “underweight”. Besides, the older the respondents, the more
likely that they were classified as “overweight” or “obese”. In contrast, the younger the
respondents, the more likely that they were classified as “underweight”.
The lower the educational attainment of the respondents, the more likely that they were
classified as “obese”. Besides, a relatively higher proportion of the married respondents
(26.3%) and divorced/separated/widowed respondents (23.1%) than never married
respondents (12.6%) were classified as “obese”.
Regarding the respondents‟ occupation, a relatively higher proportion of blue collar
workers (35.7%) were classified as “obese”. Besides, a relatively higher proportion of
those living in subsidised sale flats (24.5%) were classified as “obese”.
On the contrary, the respondents with upper secondary education/matriculation (10.4%)
were more likely to be “underweight”. Never married respondents (13.5%) were more
likely to be “underweight” than the divorced/separated/widowed respondents (6.5%) and
the married respondents (6.0%). Those living in public rental flats (10.8%) were more
likely to be “underweight” (Table 4.2.1).
Table 4.2.1: Weight status by BMI according to the locally adapted classification for Chinese adults in HK (Section 1: Q1a & Q1b)
Variable Level Base
Under-
weight Normal Overweight Obese
p-value
Kruskal-
Wallis
test
Rank
Correlation
Gender Male 1 867 5.3% 45.6% 20.5% 28.5%
0.000 Female 2 114 11.9% 56.8% 16.7% 14.6%
Age group
18-24 458 21.2% 62.5% 9.3% 7.0%
0.000
25-34 760 11.8% 59.2% 16.6% 12.4%
35-44 832 7.7% 51.2% 18.5% 22.6%
45-54 963 5.0% 47.1% 20.0% 27.9%
55-64 893 5.2% 44.3% 22.9% 27.6%
Educational
attainment
Primary or below 255 5.4% 45.6% 16.9% 32.1%
0.000
Lower secondary
(S1-S3) 514 4.7% 42.3% 22.9% 30.2%
Upper secondary
(S4-S6)/Matriculation 1 371 10.4% 52.1% 18.2% 19.3%
Tertiary (Non-degree,
degree or above) 1 832 9.2% 54.6% 17.7% 18.5%
Marital
status
Never married 1 443 13.5% 59.5% 14.4% 12.6%
0.000 Married 2 365 6.0% 46.8% 20.8% 26.3%
Divorced/Separated/
Widowed 150 6.5% 50.1% 20.2% 23.1%

Behavioural Risk Factor Survey April 2016
Page 66 of 127
Table 4.2.1: Weight status by BMI according to the locally adapted classification for Chinese adults in HK (Section 1: Q1a & Q1b) (Continued)
Variable Level Base
Under-
weight Normal Overweight Obese
p-value
Kruskal-
Wallis
test
Rank
Correlation
Occupation
Managerial/
Professional worker 1 176 6.0% 51.7% 20.2% 22.2%
0.000
Clerk 575 9.6% 58.5% 18.4% 13.5%
Service/Shop sales
worker 402 11.5% 48.0% 17.1% 23.4%
Blue collar worker 448 6.4% 36.7% 21.2% 35.7%
Not working 1 301 11.5% 54.0% 16.6% 17.8%
Type of
living
quarters
Public rental flats 1 135 10.8% 51.6% 17.5% 20.1%
0.005 Subsidised sale flats 657 6.7% 50.2% 18.5% 24.5%
Private housing 2 109 8.5% 51.8% 18.9% 20.8%
4.2.2 Perception about current weight status
Perception about current weight status is associated significantly with the respondents‟
gender, age, educational attainment, marital status and type of living quarters.
A relatively higher proportion of female respondents (45.4%), respondents aged 35-64
(ranging from 46.4% to 48.7%), those with lower secondary education (49.9%) and
married or divorced/separated/widowed respondents (ranging from 46.7% to 48.0%) and
those living in subsidised sale flats (46.5%) considered themselves as “overweight” (Table
4.2.2).
Table 4.2.2: Perception about current weight status (Section 1: Q3)
Variable Level Base Overweight
Just
right Underweight
p-value
Kruskal-
Wallis
test
Rank
Correlation
Gender Male 1 886 38.0% 52.3% 9.7%
0.000 Female 2 147 45.4% 48.5% 6.1%
Age group
18-24 463 24.5% 61.1% 14.4%
0.000
25-34 777 32.5% 59.4% 8.1%
35-44 834 47.2% 46.2% 6.6%
45-54 975 48.7% 45.4% 5.9%
55-64 908 46.4% 46.0% 7.6%
Educational
attainment
Primary or below 263 44.2% 45.2% 10.6%
0.001
Lower secondary (S1-
S3) 519 49.9% 44.7% 5.4%
Upper secondary (S4-
S6)/ Matriculation 1 389 42.7% 48.8% 8.5%
Tertiary (Non-degree,
degree or above) 1 851 38.7% 53.7% 7.6%

Behavioural Risk Factor Survey April 2016
Page 67 of 127
Table 4.2.2: Perception about current weight status (Section 1: Q3) (Continued)
Variable Level Base Overweight
Just
right Underweight
p-value
Kruskal-
Wallis
test
Rank
Correlation
Marital
status
Never married 1 458 33.6% 56.4% 9.9%
0.000 Married 2 399 46.7% 46.8% 6.5%
Divorced/Separated/
Widowed 152 48.0% 45.0% 7.0%
Type of
living
quarters
Public rental flats 1 152 39.5% 49.1% 11.3%
0.001 Subsidised sale flats 669 46.5% 48.3% 5.1%
Private housing 2 129 41.7% 51.5% 6.8%
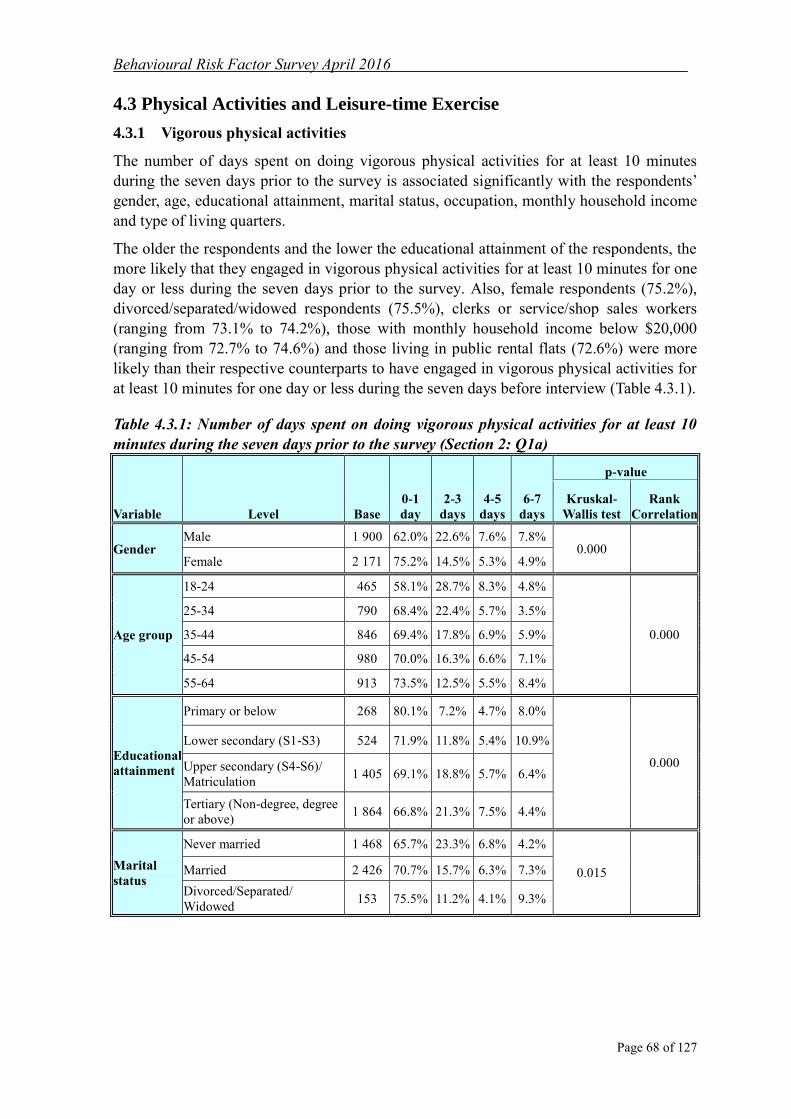
Behavioural Risk Factor Survey April 2016
Page 68 of 127
4.3 Physical Activities and Leisure-time Exercise
4.3.1 Vigorous physical activities
The number of days spent on doing vigorous physical activities for at least 10 minutes
during the seven days prior to the survey is associated significantly with the respondents‟
gender, age, educational attainment, marital status, occupation, monthly household income
and type of living quarters.
The older the respondents and the lower the educational attainment of the respondents, the
more likely that they engaged in vigorous physical activities for at least 10 minutes for one
day or less during the seven days prior to the survey. Also, female respondents (75.2%),
divorced/separated/widowed respondents (75.5%), clerks or service/shop sales workers
(ranging from 73.1% to 74.2%), those with monthly household income below $20,000
(ranging from 72.7% to 74.6%) and those living in public rental flats (72.6%) were more
likely than their respective counterparts to have engaged in vigorous physical activities for
at least 10 minutes for one day or less during the seven days before interview (Table 4.3.1).
Table 4.3.1: Number of days spent on doing vigorous physical activities for at least 10
minutes during the seven days prior to the survey (Section 2: Q1a)
Variable Level Base
0-1
day
2-3
days
4-5
days
6-7
days
p-value
Kruskal-
Wallis test
Rank
Correlation
Gender Male 1 900 62.0% 22.6% 7.6% 7.8%
0.000 Female 2 171 75.2% 14.5% 5.3% 4.9%
Age group
18-24 465 58.1% 28.7% 8.3% 4.8%
0.000
25-34 790 68.4% 22.4% 5.7% 3.5%
35-44 846 69.4% 17.8% 6.9% 5.9%
45-54 980 70.0% 16.3% 6.6% 7.1%
55-64 913 73.5% 12.5% 5.5% 8.4%
Educational
attainment
Primary or below 268 80.1% 7.2% 4.7% 8.0%
0.000
Lower secondary (S1-S3) 524 71.9% 11.8% 5.4% 10.9%
Upper secondary (S4-S6)/
Matriculation 1 405 69.1% 18.8% 5.7% 6.4%
Tertiary (Non-degree, degree
or above) 1 864 66.8% 21.3% 7.5% 4.4%
Marital
status
Never married 1 468 65.7% 23.3% 6.8% 4.2%
0.015 Married 2 426 70.7% 15.7% 6.3% 7.3%
Divorced/Separated/
Widowed 153 75.5% 11.2% 4.1% 9.3%
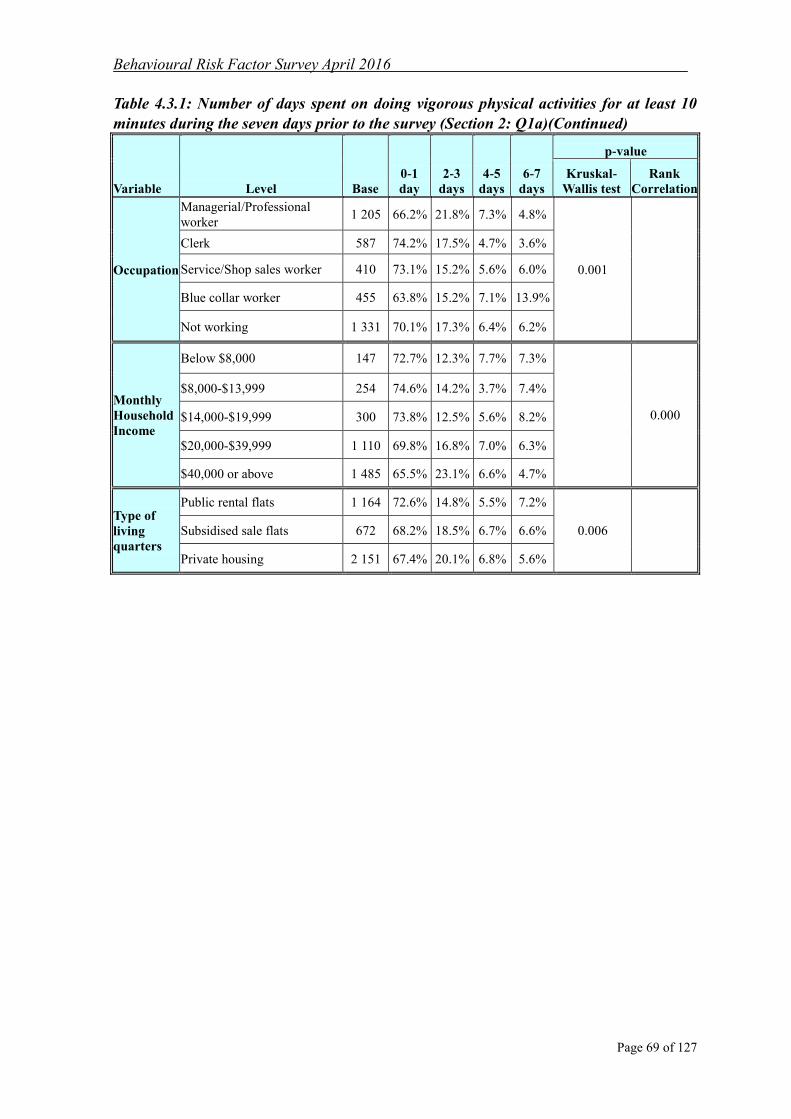
Behavioural Risk Factor Survey April 2016
Page 69 of 127
Table 4.3.1: Number of days spent on doing vigorous physical activities for at least 10
minutes during the seven days prior to the survey (Section 2: Q1a)(Continued)
Variable Level Base
0-1
day
2-3
days
4-5
days
6-7
days
p-value
Kruskal-
Wallis test
Rank
Correlation
Occupation
Managerial/Professional
worker 1 205 66.2% 21.8% 7.3% 4.8%
0.001
Clerk 587 74.2% 17.5% 4.7% 3.6%
Service/Shop sales worker 410 73.1% 15.2% 5.6% 6.0%
Blue collar worker 455 63.8% 15.2% 7.1% 13.9%
Not working 1 331 70.1% 17.3% 6.4% 6.2%
Monthly
Household
Income
Below $8,000 147 72.7% 12.3% 7.7% 7.3%
0.000
$8,000-$13,999 254 74.6% 14.2% 3.7% 7.4%
$14,000-$19,999 300 73.8% 12.5% 5.6% 8.2%
$20,000-$39,999 1 110 69.8% 16.8% 7.0% 6.3%
$40,000 or above 1 485 65.5% 23.1% 6.6% 4.7%
Type of
living
quarters
Public rental flats 1 164 72.6% 14.8% 5.5% 7.2%
0.006 Subsidised sale flats 672 68.2% 18.5% 6.7% 6.6%
Private housing 2 151 67.4% 20.1% 6.8% 5.6%

Behavioural Risk Factor Survey April 2016
Page 70 of 127
4.3.2 Moderate physical activities
The number of days spent on doing moderate physical activities for at least 10 minutes
during the seven days prior to the survey is associated significantly with respondents‟ age,
marital status and occupation.
Those aged 25-44 (ranging from 56.0% to 57.5%), never married or divorced/separated
widowed respondents (ranging from 55.1% to 55.5%) and clerks (60.6%) were more likely
than their respective counterparts to have spent on moderate physical activities for at least
10 minutes for one day or less during the seven days prior to the survey (Table 4.3.2).
Table 4.3.2: Number of days spent on doing moderate physical activities for at least 10
minutes during the seven days prior to the survey (Section 2: Q2a)
Variable Level Base
0-1
day
2-3
days
4-5
days
6-7
days
p-value
Kruskal-
Wallis test
Rank
Correlation
Age group
18-24 465 53.1% 26.8% 11.7% 8.4%
0.001
25-34 790 57.5% 21.1% 8.8% 12.6%
35-44 846 56.0% 21.9% 7.7% 14.5%
45-54 980 53.7% 20.5% 9.1% 16.8%
55-64 913 52.5% 19.0% 8.3% 20.3%
Marital
status
Never married 1 468 55.5% 23.5% 9.9% 11.1%
0.002 Married 2 426 53.9% 20.1% 8.3% 17.7%
Divorced/Separated/
Widowed 153 55.1% 17.6% 5.2% 22.1%
Occupation
Managerial/Professional
worker 1 205 55.6% 20.1% 10.4% 14.0%
0.005
Clerk 587 60.6% 20.5% 6.7% 12.2%
Service/Shop sales worker 410 54.3% 21.2% 9.4% 15.1%
Blue collar worker 455 53.3% 19.1% 8.8% 18.8%
Not working 1 331 51.5% 23.0% 8.4% 17.1%
4.3.3 Walking
Significant associations exist between the number of days on which respondents walked at
least 10 minutes during the seven days prior to the survey and respondents‟ educational
attainment, marital status and occupation.
A relatively higher proportion of those with lower secondary education or below (ranging
from 4.7% to 4.9%), divorced/separated/widowed respondents (6.7%) and non-working
respondents (4.2%) reported that they walked at least 10 minutes for one day or less within
the seven days prior to the survey when compared with their respective counterparts (Table
4.3.3).

Behavioural Risk Factor Survey April 2016
Page 71 of 127
Table 4.3.3: Number of days spent walking for at least 10 minutes during the seven days
prior to the survey (Section 2: Q3a)
Variable Level Base
0-1
day
2-3
days
4-5
days
6-7
days
p-value
Kruskal-
Wallis test
Rank
Correlation
Educational
attainment
Primary or below 266 4.7% 5.2% 11.9% 78.1%
0.005
Lower secondary (S1-S3) 524 4.9% 5.9% 9.3% 79.8%
Upper secondary (S4-S6)/
Matriculation 1 405 4.0% 8.1% 13.1% 74.8%
Tertiary (Non-degree, degree
or above) 1 864 3.5% 8.5% 13.9% 74.1%
Marital
status
Never married 1 467 2.6% 8.3% 15.2% 73.9%
0.023 Married 2 426 4.6% 7.4% 11.4% 76.7%
Divorced/Separated/
Widowed 152 6.7% 10.5% 14.4% 68.4%
Occupation
Managerial/Professional
worker 1 205 3.7% 8.5% 12.9% 74.9%
0.001
Clerk 587 4.0% 9.2% 12.1% 74.6%
Service/ Shop sales worker 409 2.3% 4.5% 9.8% 83.4%
Blue collar worker 455 4.1% 5.2% 12.5% 78.2%
Not working 1 329 4.2% 8.7% 13.9% 73.2%
4.3.4 Whether attained the physical activity level recommended by WHO for adults
Whether respondents had attained the WHO's recommended levels of physical activity for
adults is significantly associated with their gender, age, educational attainment, marital
status, occupation and monthly household income.
A relatively higher proportion of female respondents (62.5%), those aged 35-64 (ranging
from 57.2% to 59.9%), married respondents (58.0%) or divorced/separated/widowed
respondents (58.7%), clerks (64.7%) and respondents with monthly household income of
below $8,000 (64.0%) were found to have not attained the physical activity level
recommended by WHO for adults when compared with their respective counterparts.
Besides, the lower the educational attainment of the respondents, the more likely that they
had not attained the physical activity level recommended by WHO for adults (Table 4.3.4).
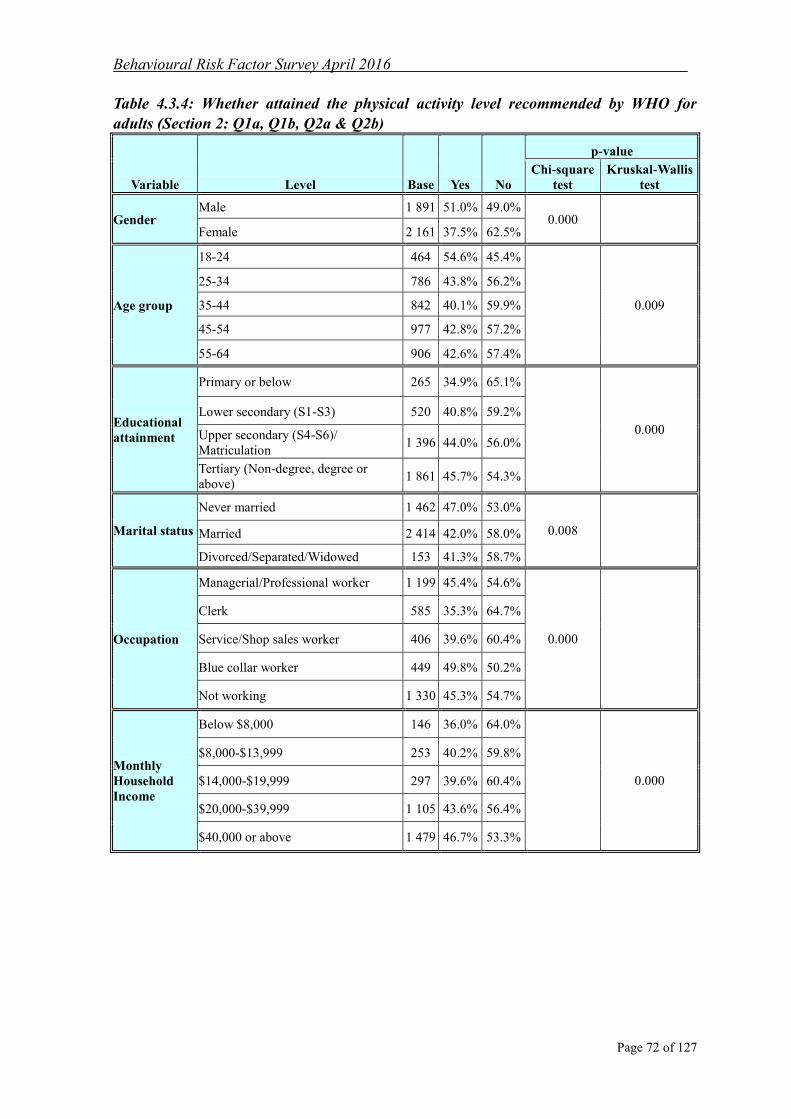
Behavioural Risk Factor Survey April 2016
Page 72 of 127
Table 4.3.4: Whether attained the physical activity level recommended by WHO for
adults (Section 2: Q1a, Q1b, Q2a & Q2b)
Variable Level Base Yes No
p-value
Chi-square
test
Kruskal-Wallis
test
Gender Male 1 891 51.0% 49.0%
0.000 Female 2 161 37.5% 62.5%
Age group
18-24 464 54.6% 45.4%
0.009
25-34 786 43.8% 56.2%
35-44 842 40.1% 59.9%
45-54 977 42.8% 57.2%
55-64 906 42.6% 57.4%
Educational
attainment
Primary or below 265 34.9% 65.1%
0.000
Lower secondary (S1-S3) 520 40.8% 59.2%
Upper secondary (S4-S6)/
Matriculation 1 396 44.0% 56.0%
Tertiary (Non-degree, degree or
above) 1 861 45.7% 54.3%
Marital status
Never married 1 462 47.0% 53.0%
0.008 Married 2 414 42.0% 58.0%
Divorced/Separated/Widowed 153 41.3% 58.7%
Occupation
Managerial/Professional worker 1 199 45.4% 54.6%
0.000
Clerk 585 35.3% 64.7%
Service/Shop sales worker 406 39.6% 60.4%
Blue collar worker 449 49.8% 50.2%
Not working 1 330 45.3% 54.7%
Monthly
Household
Income
Below $8,000 146 36.0% 64.0%
0.000
$8,000-$13,999 253 40.2% 59.8%
$14,000-$19,999 297 39.6% 60.4%
$20,000-$39,999 1 105 43.6% 56.4%
$40,000 or above 1 479 46.7% 53.3%
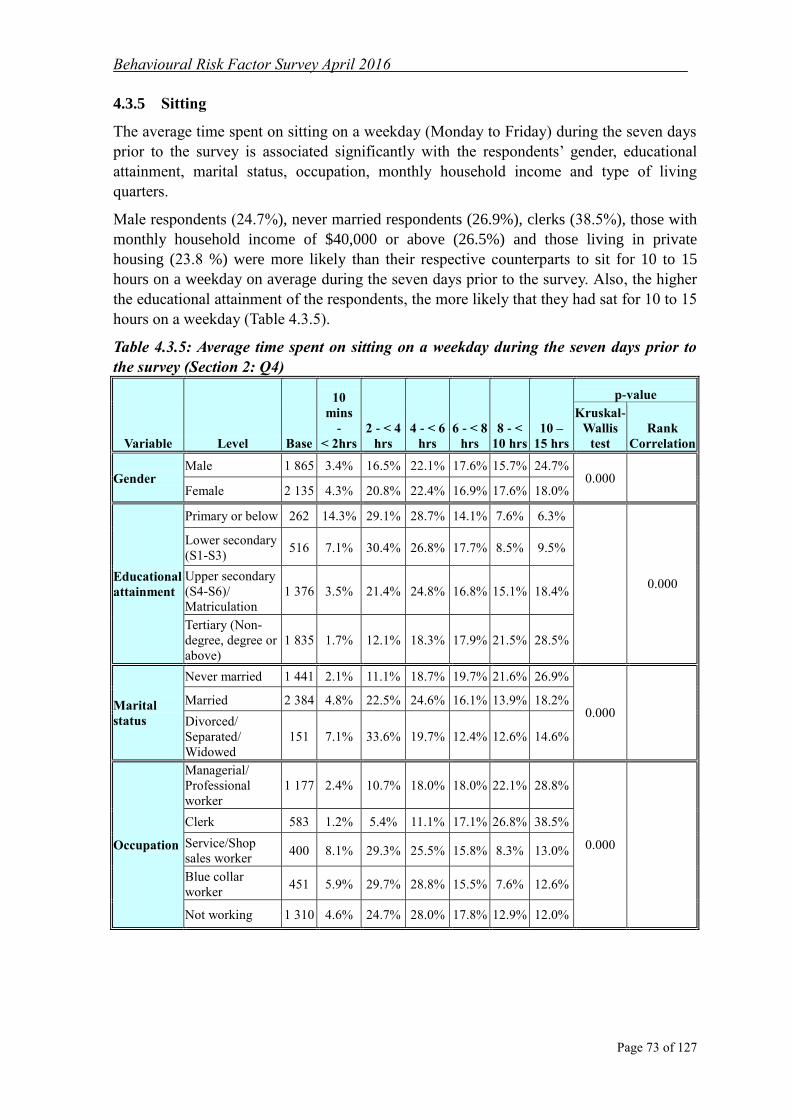
Behavioural Risk Factor Survey April 2016
Page 73 of 127
4.3.5 Sitting
The average time spent on sitting on a weekday (Monday to Friday) during the seven days
prior to the survey is associated significantly with the respondents‟ gender, educational
attainment, marital status, occupation, monthly household income and type of living
quarters.
Male respondents (24.7%), never married respondents (26.9%), clerks (38.5%), those with
monthly household income of $40,000 or above (26.5%) and those living in private
housing (23.8 %) were more likely than their respective counterparts to sit for 10 to 15
hours on a weekday on average during the seven days prior to the survey. Also, the higher
the educational attainment of the respondents, the more likely that they had sat for 10 to 15
hours on a weekday (Table 4.3.5).
Table 4.3.5: Average time spent on sitting on a weekday during the seven days prior to
the survey (Section 2: Q4)
Variable Level Base
10
mins
-
< 2hrs
2 - < 4
hrs
4 - < 6
hrs
6 - < 8
hrs
8 - <
10 hrs
10 –
15 hrs
p-value
Kruskal-
Wallis
test
Rank
Correlation
Gender Male 1 865 3.4% 16.5% 22.1% 17.6% 15.7% 24.7%
0.000 Female 2 135 4.3% 20.8% 22.4% 16.9% 17.6% 18.0%
Educational
attainment
Primary or below 262 14.3% 29.1% 28.7% 14.1% 7.6% 6.3%
0.000
Lower secondary
(S1-S3) 516 7.1% 30.4% 26.8% 17.7% 8.5% 9.5%
Upper secondary
(S4-S6)/
Matriculation
1 376 3.5% 21.4% 24.8% 16.8% 15.1% 18.4%
Tertiary (Non-
degree, degree or
above)
1 835 1.7% 12.1% 18.3% 17.9% 21.5% 28.5%
Marital
status
Never married 1 441 2.1% 11.1% 18.7% 19.7% 21.6% 26.9%
0.000 Married 2 384 4.8% 22.5% 24.6% 16.1% 13.9% 18.2%
Divorced/
Separated/
Widowed
151 7.1% 33.6% 19.7% 12.4% 12.6% 14.6%
Occupation
Managerial/
Professional
worker
1 177 2.4% 10.7% 18.0% 18.0% 22.1% 28.8%
0.000
Clerk 583 1.2% 5.4% 11.1% 17.1% 26.8% 38.5%
Service/Shop
sales worker 400 8.1% 29.3% 25.5% 15.8% 8.3% 13.0%
Blue collar
worker 451 5.9% 29.7% 28.8% 15.5% 7.6% 12.6%
Not working 1 310 4.6% 24.7% 28.0% 17.8% 12.9% 12.0%

Behavioural Risk Factor Survey April 2016
Page 74 of 127
Table 4.3.5: Average time spent on sitting on a weekday during the seven days prior to
the survey (Section 2: Q4) (Continued)
Variable Level Base
10
mins
-
< 2hrs
2 - < 4
hrs
4 - < 6
hrs
6 - < 8
hrs
8 - <
10 hrs
10 –
15
hrs
p-value
Kruskal-
Wallis
test
Rank
Correlation
Monthly
Household
Income
Below $8,000 145 4.9% 26.7% 22.7% 16.9% 15.2% 13.6%
0.000
$8,000-$13,999 249 6.4% 30.1% 25.7% 13.8% 10.4% 13.6%
$14,000-$19,999 299 4.6% 26.0% 23.7% 15.9% 13.4% 16.5%
$20,000-$39,999 1 099 3.8% 19.3% 24.1% 17.5% 16.3% 19.0%
$40,000 or above 1 458 2.1% 14.2% 19.7% 18.0% 19.5% 26.5%
Type of
living
quarters
Public rental flats 1 148 5.6% 21.4% 24.2% 17.3% 14.6% 16.9%
0.000 Subsidised sale
flats 656 2.7% 19.5% 23.5% 17.4% 16.2% 20.7%
Private housing 2 113 3.4% 16.9% 20.9% 17.3% 17.7% 23.8%
4.3.6 Leisure-time exercise
Frequency of doing exercise in leisure-time during the thirty days prior to the survey is
associated significantly with the respondents‟ gender, educational attainment, occupation,
monthly household income and type of living quarters.
Female respondents (34.4%), blue collar workers (39.6%) or service/shop sales workers
(40.4%), those with monthly household income below $8,000 (42.6%) and those living in
public rental flats (36.8%) were more likely than their respective counterparts to have
reported that they had leisure-time exercises less than once a month during the thirty days
prior to the survey. Also, the lower the educational attainment of the respondents, the more
likely that they had had leisure-time exercise less than once a month (Table 4.3.6).
Table 4.3.6: Frequency of doing exercise in leisure-time during the thirty days prior to
the survey (Section 2: Q5)
Variable Level Base
At least 4 times
per week
1 - 3 times per
week
1 - 3 times per
month
Less than once a month
p-value
Kruskal-
Wallis test
Rank
Correlation
Gender Male 1 898 19.9% 41.0% 12.9% 26.2%
0.000 Female 2 168 17.2% 34.8% 13.6% 34.4%
Educational
attainment
Primary or below 267 31.1% 16.9% 4.9% 47.2%
0.000
Lower secondary (S1-S3) 524 22.6% 27.3% 8.1% 42.1%
Upper secondary (S4-S6)/
Matriculation 1 403 18.0% 36.0% 12.1% 33.9%
Tertiary (Non-degree,
degree or above) 1 861 15.7% 45.0% 16.9% 22.5%
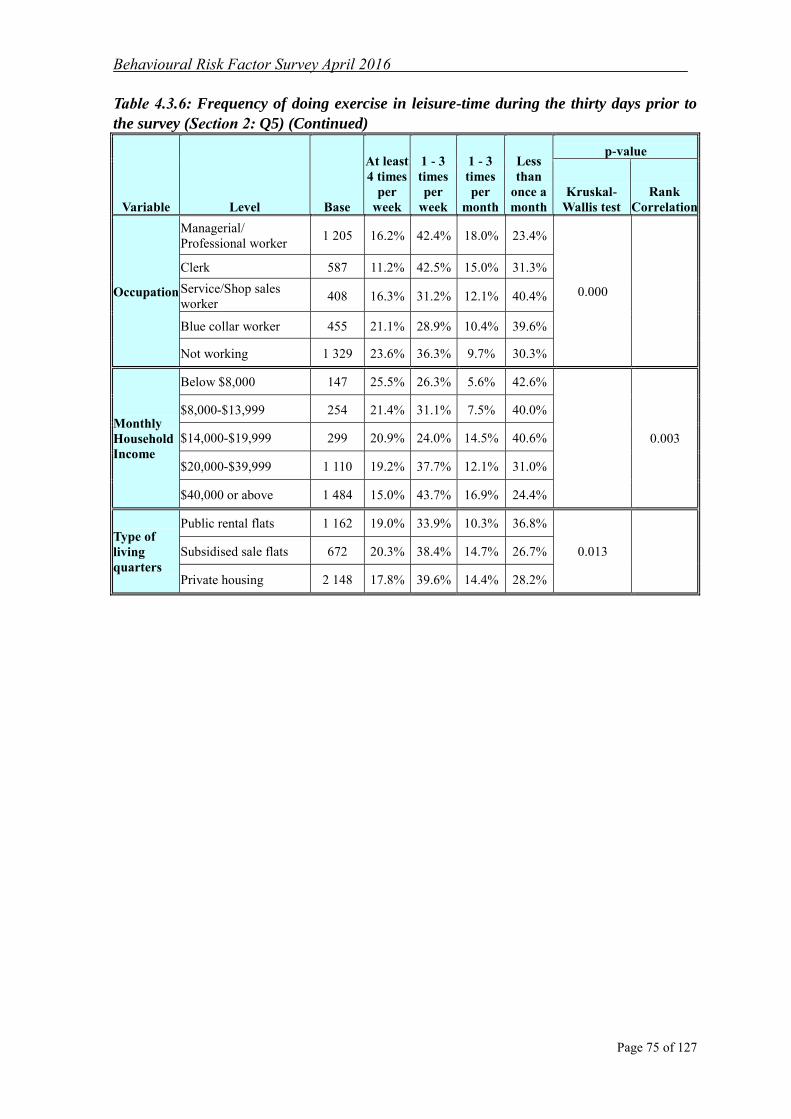
Behavioural Risk Factor Survey April 2016
Page 75 of 127
Table 4.3.6: Frequency of doing exercise in leisure-time during the thirty days prior to
the survey (Section 2: Q5) (Continued)
Variable Level Base
At least
4 times
per
week
1 - 3
times
per
week
1 - 3
times
per
month
Less
than
once a
month
p-value
Kruskal-
Wallis test
Rank
Correlation
Occupation
Managerial/
Professional worker 1 205 16.2% 42.4% 18.0% 23.4%
0.000
Clerk 587 11.2% 42.5% 15.0% 31.3%
Service/Shop sales
worker 408 16.3% 31.2% 12.1% 40.4%
Blue collar worker 455 21.1% 28.9% 10.4% 39.6%
Not working 1 329 23.6% 36.3% 9.7% 30.3%
Monthly
Household
Income
Below $8,000 147 25.5% 26.3% 5.6% 42.6%
0.003
$8,000-$13,999 254 21.4% 31.1% 7.5% 40.0%
$14,000-$19,999 299 20.9% 24.0% 14.5% 40.6%
$20,000-$39,999 1 110 19.2% 37.7% 12.1% 31.0%
$40,000 or above 1 484 15.0% 43.7% 16.9% 24.4%
Type of
living
quarters
Public rental flats 1 162 19.0% 33.9% 10.3% 36.8%
0.013 Subsidised sale flats 672 20.3% 38.4% 14.7% 26.7%
Private housing 2 148 17.8% 39.6% 14.4% 28.2%
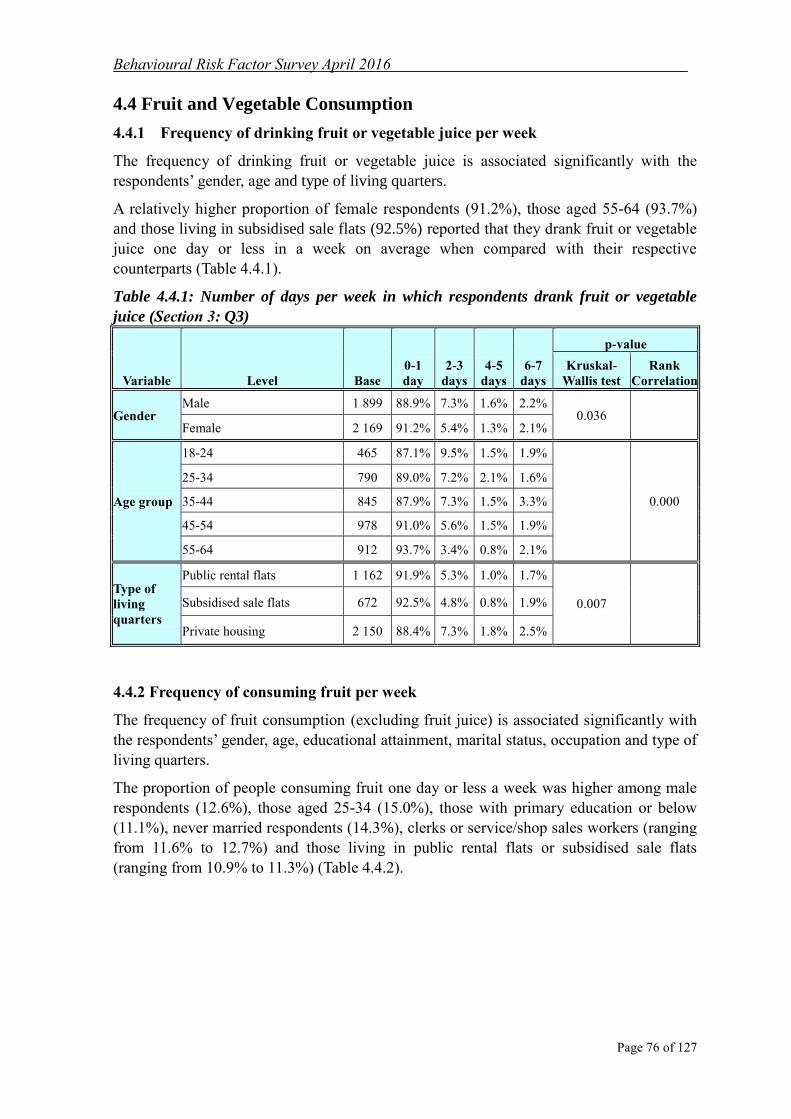
Behavioural Risk Factor Survey April 2016
Page 76 of 127
4.4 Fruit and Vegetable Consumption
4.4.1 Frequency of drinking fruit or vegetable juice per week
The frequency of drinking fruit or vegetable juice is associated significantly with the
respondents‟ gender, age and type of living quarters.
A relatively higher proportion of female respondents (91.2%), those aged 55-64 (93.7%)
and those living in subsidised sale flats (92.5%) reported that they drank fruit or vegetable
juice one day or less in a week on average when compared with their respective
counterparts (Table 4.4.1).
Table 4.4.1: Number of days per week in which respondents drank fruit or vegetable
juice (Section 3: Q3)
Variable Level Base
0-1
day
2-3
days
4-5
days
6-7
days
p-value
Kruskal-
Wallis test
Rank
Correlation
Gender Male 1 899 88.9% 7.3% 1.6% 2.2%
0.036 Female 2 169 91.2% 5.4% 1.3% 2.1%
Age group
18-24 465 87.1% 9.5% 1.5% 1.9%
0.000
25-34 790 89.0% 7.2% 2.1% 1.6%
35-44 845 87.9% 7.3% 1.5% 3.3%
45-54 978 91.0% 5.6% 1.5% 1.9%
55-64 912 93.7% 3.4% 0.8% 2.1%
Type of
living
quarters
Public rental flats 1 162 91.9% 5.3% 1.0% 1.7%
0.007 Subsidised sale flats 672 92.5% 4.8% 0.8% 1.9%
Private housing 2 150 88.4% 7.3% 1.8% 2.5%
4.4.2 Frequency of consuming fruit per week
The frequency of fruit consumption (excluding fruit juice) is associated significantly with
the respondents‟ gender, age, educational attainment, marital status, occupation and type of
living quarters.
The proportion of people consuming fruit one day or less a week was higher among male
respondents (12.6%), those aged 25-34 (15.0%), those with primary education or below
(11.1%), never married respondents (14.3%), clerks or service/shop sales workers (ranging
from 11.6% to 12.7%) and those living in public rental flats or subsidised sale flats
(ranging from 10.9% to 11.3%) (Table 4.4.2).
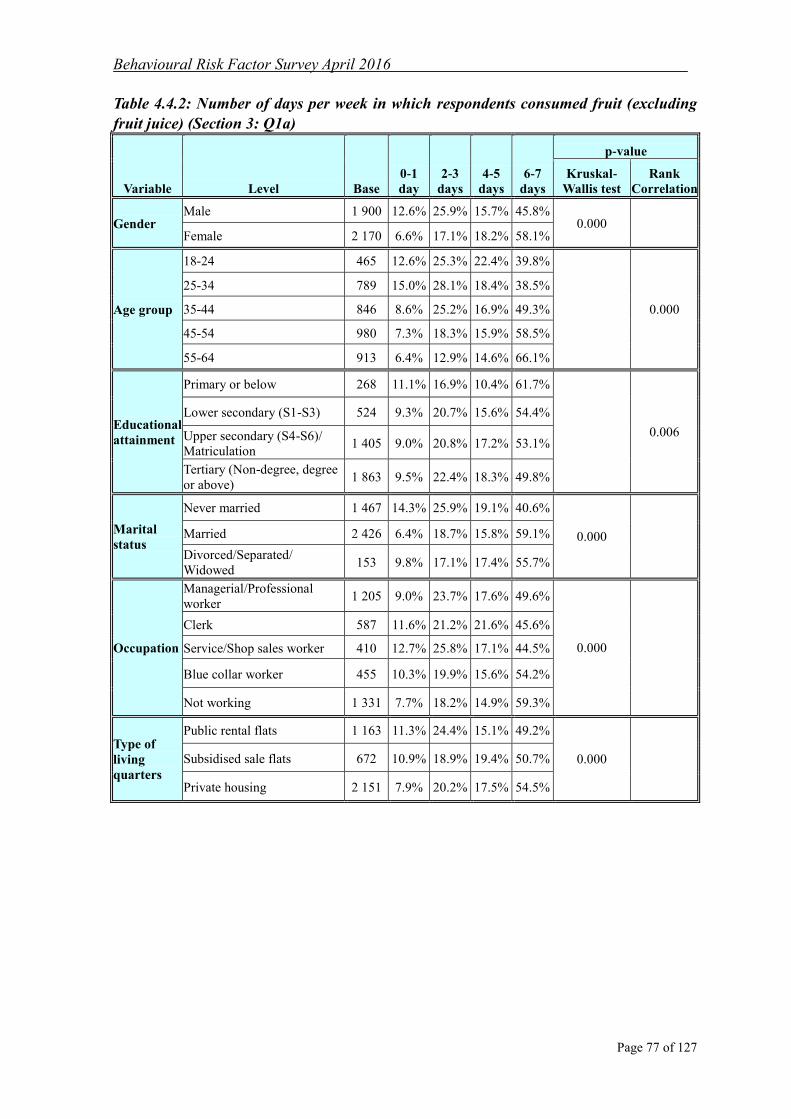
Behavioural Risk Factor Survey April 2016
Page 77 of 127
Table 4.4.2: Number of days per week in which respondents consumed fruit (excluding
fruit juice) (Section 3: Q1a)
Variable Level Base
0-1
day
2-3
days
4-5
days
6-7
days
p-value
Kruskal-
Wallis test
Rank
Correlation
Gender Male 1 900 12.6% 25.9% 15.7% 45.8%
0.000 Female 2 170 6.6% 17.1% 18.2% 58.1%
Age group
18-24 465 12.6% 25.3% 22.4% 39.8%
0.000
25-34 789 15.0% 28.1% 18.4% 38.5%
35-44 846 8.6% 25.2% 16.9% 49.3%
45-54 980 7.3% 18.3% 15.9% 58.5%
55-64 913 6.4% 12.9% 14.6% 66.1%
Educational
attainment
Primary or below 268 11.1% 16.9% 10.4% 61.7%
0.006
Lower secondary (S1-S3) 524 9.3% 20.7% 15.6% 54.4%
Upper secondary (S4-S6)/
Matriculation 1 405 9.0% 20.8% 17.2% 53.1%
Tertiary (Non-degree, degree
or above) 1 863 9.5% 22.4% 18.3% 49.8%
Marital
status
Never married 1 467 14.3% 25.9% 19.1% 40.6%
0.000 Married 2 426 6.4% 18.7% 15.8% 59.1%
Divorced/Separated/
Widowed 153 9.8% 17.1% 17.4% 55.7%
Occupation
Managerial/Professional
worker 1 205 9.0% 23.7% 17.6% 49.6%
0.000
Clerk 587 11.6% 21.2% 21.6% 45.6%
Service/Shop sales worker 410 12.7% 25.8% 17.1% 44.5%
Blue collar worker 455 10.3% 19.9% 15.6% 54.2%
Not working 1 331 7.7% 18.2% 14.9% 59.3%
Type of
living
quarters
Public rental flats 1 163 11.3% 24.4% 15.1% 49.2%
0.000 Subsidised sale flats 672 10.9% 18.9% 19.4% 50.7%
Private housing 2 151 7.9% 20.2% 17.5% 54.5%

Behavioural Risk Factor Survey April 2016
Page 78 of 127
4.4.3 Frequency of consuming vegetables per week
The frequency of vegetable consumption (excluding vegetable juice) is associated
significantly with the respondents‟ gender and age.
The proportion of people consuming vegetables one day or less a week was higher among
male respondents (1.9%) and those aged 18-24 (1.9%) (Table 4.4.3).
Table 4.4.3: Number of days per week in which respondents consumed vegetables
(excluding vegetable juice) (Section 3: Q2a)
Variable Level Base
0-1
day
2-3
days
4-5
days
6-7
days
p-value
Kruskal-
Wallis test
Rank
Correlation
Gender Male 1 900 1.9% 6.3% 13.0% 78.8%
0.000 Female 2 171 0.5% 3.8% 7.8% 87.8%
Age group
18-24 465 1.9% 5.1% 11.7% 81.4%
0.009
25-34 790 0.8% 6.5% 10.9% 81.8%
35-44 846 1.0% 4.5% 10.6% 84.0%
45-54 980 1.0% 4.6% 10.6% 83.9%
55-64 913 1.4% 4.7% 8.6% 85.3%
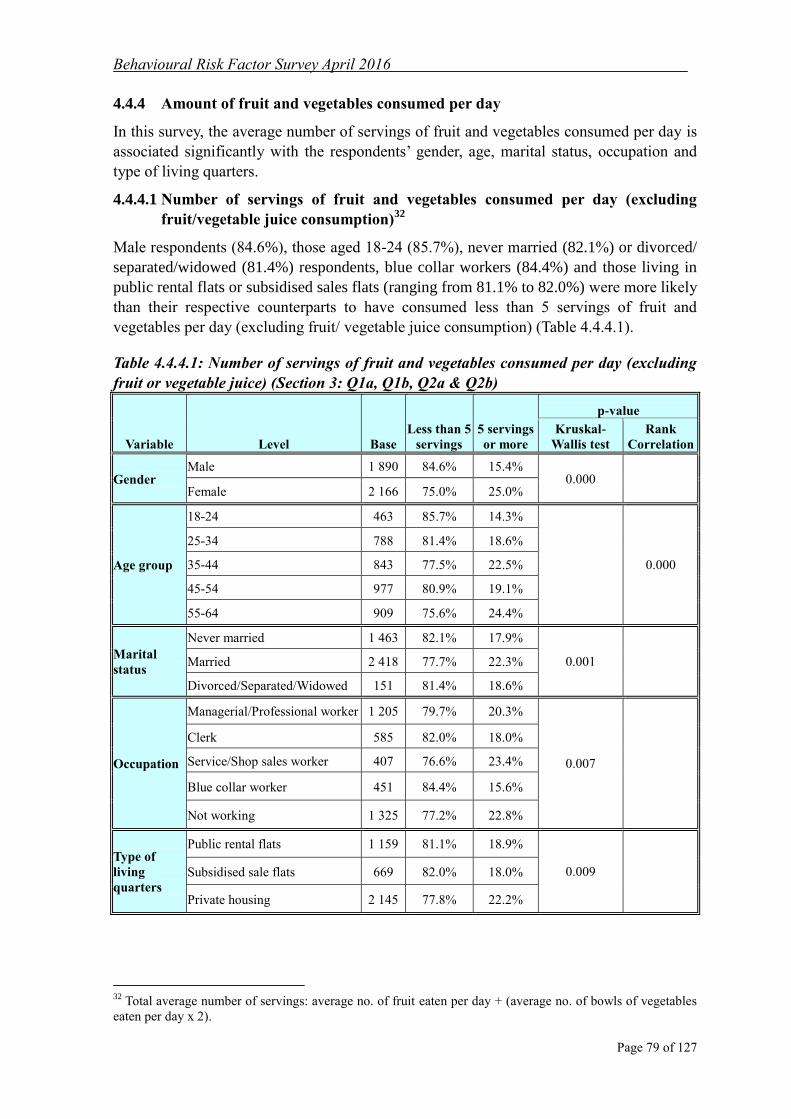
Behavioural Risk Factor Survey April 2016
Page 79 of 127
4.4.4 Amount of fruit and vegetables consumed per day
In this survey, the average number of servings of fruit and vegetables consumed per day is
associated significantly with the respondents‟ gender, age, marital status, occupation and
type of living quarters.
4.4.4.1 Number of servings of fruit and vegetables consumed per day (excluding 32
fruit/vegetable juice consumption)
Male respondents (84.6%), those aged 18-24 (85.7%), never married (82.1%) or divorced/
separated/widowed (81.4%) respondents, blue collar workers (84.4%) and those living in
public rental flats or subsidised sales flats (ranging from 81.1% to 82.0%) were more likely
than their respective counterparts to have consumed less than 5 servings of fruit and
vegetables per day (excluding fruit/ vegetable juice consumption) (Table 4.4.4.1).
Table 4.4.4.1: Number of servings of fruit and vegetables consumed per day (excluding
fruit or vegetable juice) (Section 3: Q1a, Q1b, Q2a & Q2b)
Variable Level Base
Less than 5
servings
5 servings
or more
p-value
Kruskal-
Wallis test
Rank
Correlation
Gender Male 1 890 84.6% 15.4%
0.000 Female 2 166 75.0% 25.0%
Age group
18-24 463 85.7% 14.3%
0.000
25-34 788 81.4% 18.6%
35-44 843 77.5% 22.5%
45-54 977 80.9% 19.1%
55-64 909 75.6% 24.4%
Marital
status
Never married 1 463 82.1% 17.9%
0.001 Married 2 418 77.7% 22.3%
Divorced/Separated/Widowed 151 81.4% 18.6%
Occupation
Managerial/Professional worker 1 205 79.7% 20.3%
0.007
Clerk 585 82.0% 18.0%
Service/Shop sales worker 407 76.6% 23.4%
Blue collar worker 451 84.4% 15.6%
Not working 1 325 77.2% 22.8%
Type of
living
quarters
Public rental flats 1 159 81.1% 18.9%
0.009 Subsidised sale flats 669 82.0% 18.0%
Private housing 2 145 77.8% 22.2%
32
Total average number of servings: average no. of fruit eaten per day + (average no. of bowls of vegetables
eaten per day x 2).

Behavioural Risk Factor Survey April 2016
Page 80 of 127
4.4.4.2 Number of servings of fruit and vegetables consumed per day (including 33
fruit/vegetable juice consumption)
Male respondents (84.1%), those aged 18-24 (85.5%), never married (81.5%) or
divorced/separated/widowed respondents (80.6%), blue collar workers (84.4%) and those
living in public rental flats or subsidised sale flats (ranging from 80.8% to 81.5%) were
more likely than their respective counterparts to have consumed less than 5 servings of
fruit and vegetables per day (including fruit/vegetable juice consumption) (Table 4.4.4.2).
Table 4.4.4.2: Number of servings of fruit and vegetables consumed per day (including
fruit/vegetable juice) (Section 3: Q1a, Q1b, Q2a, Q2b & Q3)
Variable Level Base
Less than 5
servings
5 servings
or more
p-value
Kruskal-
Wallis test
Rank
Correlation
Gender Male 1 888 84.1% 15.9%
0.000 Female 2 164 74.3% 25.7%
Age group
18-24 463 85.5% 14.5%
0.000
25-34 788 80.6% 19.4%
35-44 842 77.0% 23.0%
45-54 975 80.3% 19.7%
55-64 908 74.9% 25.1%
Marital
status
Never married 1 461 81.5% 18.5%
0.000 Married 2 416 77.1% 22.9%
Divorced/Separated/Widowed 151 80.6% 19.4%
Occupation
Managerial/Professional worker 1 202 78.9% 21.1%
0.005
Clerk 585 81.4% 18.6%
Service/Shop sales worker 407 75.2% 24.8%
Blue collar worker 451 84.4% 15.6%
Not working 1 325 76.7% 23.3%
Type of
living
quarters
Public rental flats 1 157 80.8% 19.2%
0.005 Subsidised sale flats 669 81.5% 18.5%
Private housing 2 143 77.0% 23.0%
33
Total average number of servings: average no. of fruit eaten per day + (average no. of bowls of vegetables
eaten per day x 2) + (average no. of days per week having drunk one cups or more of fruit or vegetable juice
divided by 7).

Behavioural Risk Factor Survey April 2016
Page 81 of 127
4.5 Meat Consumption
4.5.1 Frequency of consuming red meat
Frequency of consuming red meat is associated significantly with the respondents‟ gender,
age, educational attainment, marital status, occupation and monthly household income.
A relatively higher proportion of female respondents (10.4%), those aged 45-54 (10.5%),
those with primary education or below (12.1%), married respondents (8.6%), non-working
respondents (9.9%) and those with monthly household income below $8,000 (16.8%)
consumed red meat 1 day or less per week on average during the thirty days prior to the
survey when compared with their respective counterparts (Table 4.5.1).
Table 4.5.1: Average number of days per week of consuming red meat (Section 4: Q1a)
Variable Level Base
0-1
day
2-3
days
4-5
days
6-7
days
p-value
Kruskal-
Wallis test
Rank
Correlation
Gender Male 1 900 5.4% 17.3% 23.7% 53.6%
0.000 Female 2 170 10.4% 22.8% 22.5% 44.4%
Age group
18-24 465 5.2% 17.9% 28.0% 48.9%
0.000
25-34 790 6.7% 13.5% 22.2% 57.6%
35-44 845 6.6% 19.6% 22.5% 51.3%
45-54 980 10.5% 22.8% 22.6% 44.2%
55-64 913 9.1% 24.9% 22.1% 43.8%
Educational
attainment
Primary or below 268 12.1% 26.9% 15.6% 45.3%
0.028
Lower secondary (S1-S3) 524 8.4% 20.3% 20.7% 50.7%
Upper secondary (S4-S6)/
Matriculation 1 404 8.6% 22.1% 23.1% 46.2%
Tertiary (Non-degree, degree
or above) 1 864 6.9% 18.0% 24.6% 50.5%
Marital
status
Never married 1 468 7.1% 18.3% 24.6% 50.0%
0.012 Married 2 426 8.6% 21.1% 22.1% 48.3%
Divorced/Separated/
Widowed 153 7.0% 28.3% 23.5% 41.2%
Occupation
Managerial/Professional
worker 1 205 6.7% 16.8% 24.5% 52.0%
0.000 Clerk 587 7.5% 21.1% 22.2% 49.1%
Service/Shop sales worker 410 7.8% 20.9% 20.3% 51.1%
Blue collar worker 455 6.3% 20.2% 20.4% 53.1%
Not working 1 331 9.9% 22.9% 23.9% 43.2%
Monthly
Household
Income
Below $8,000 147 16.8% 26.6% 21.5% 35.1%
0.000
$8,000-$13,999 254 10.5% 23.7% 19.2% 46.6%
$14,000-$19,999 300 8.0% 25.5% 18.6% 48.0%
$20,000-$39,999 1 110 6.8% 20.7% 24.9% 47.7%
$40,000 or above 1 485 7.1% 16.8% 25.2% 50.9%

Behavioural Risk Factor Survey April 2016
Page 82 of 127
4.5.2 Frequency of consuming white meat
Frequency of consuming white meat is associated significantly with the respondents‟
marital status, occupation and monthly household income.
A relatively higher proportion of divorced/separated/widowed respondents (11.9%), clerks,
blue collar workers or non-working respondents (ranging from 9.0% to 9.5%) and those
with monthly household income of below $8,000 (16.6%) consumed white meat 1 day or
less per week on average during the thirty days prior to the survey when compared with
their counterparts (Table 4.5.2).
Table 4.5.2: Average number of days per week of consuming white meat (Section 4: Q2a)
Variable Level Base
0-1
day
2-3
days
4-5
days
6-7
days
p-value
Kruskal-
Wallis test
Rank
Correlation
Marital
status
Never married 1 467 7.9% 33.9% 28.9% 29.4%
0.025 Married 2 425 7.8% 38.3% 24.1% 29.8%
Divorced/Separated/
Widowed 153 11.9% 38.7% 23.3% 26.2%
Occupation
Managerial/Professional
worker 1 205 5.5% 34.8% 28.5% 31.2%
0.037
Clerk 587 9.5% 39.0% 24.8% 26.7%
Service/Shop sales worker 410 7.3% 34.8% 26.5% 31.4%
Blue collar worker 455 9.0% 37.4% 24.1% 29.5%
Not working 1 330 9.5% 38.3% 23.9% 28.3%
Monthly
Household
Income
Below $8,000 147 16.6% 41.1% 17.9% 24.3%
0.005
$8,000-$13,999 254 12.0% 38.3% 20.7% 29.0%
$14,000-$19,999 300 7.5% 35.7% 25.1% 31.7%
$20,000-$39,999 1 109 8.8% 38.6% 25.2% 27.4%
$40,000 or above 1 485 5.7% 35.4% 28.7% 30.2%

Behavioural Risk Factor Survey April 2016
Page 83 of 127
4.5.3 Daily average amount of red meat consumed
Daily average amount of red meat consumed is associated significantly with the
respondents‟ gender, age, educational attainment, marital status, occupation and monthly
household income.
Female respondents (50.6%), those aged 55-64 (54.2%), divorced/separated/widowed
respondents (50.6%) and not working respondents (49.4%) were more likely to have
consumed less than 2 taels of red meat per day on average during the thirty days prior to
the survey when compared with their respective counterparts. Also, the lower the
educational attainment and the monthly household income of the respondents, the more
likely that they had consumed less than 2 taels of red meat per day on average when
compared with their counterparts (Table 4.5.3).
Table 4.5.3: Daily average amount of red meat consumed (Section 4: Q1a & Q1b)
Variable Level Base
Less
than 2
taels
2-4
taels
More
than 4
taels
p-value
Kruskal-
Wallis test
Rank
Correlation
Gender Male 1 885 33.3% 41.9% 24.8%
0.000 Female 2 155 50.6% 37.3% 12.0%
Age group
18-24 463 31.9% 38.8% 29.3%
0.000
25-34 782 31.2% 41.0% 27.8%
35-44 840 37.9% 43.5% 18.6%
45-54 975 49.2% 38.1% 12.7%
55-64 905 54.2% 36.9% 8.9%
Educational
attainment
Primary or below 261 55.0% 36.3% 8.7%
0.000
Lower secondary (S1-S3) 522 47.9% 37.5% 14.6%
Upper secondary (S4-S6)/
Matriculation 1 392 45.8% 38.5% 15.6%
Tertiary (Non-degree, degree or
above) 1 855 36.8% 41.3% 21.9%
Marital
status
Never married 1 458 36.6% 38.9% 24.5%
0.000 Married 2 408 45.6% 40.2% 14.2%
Divorced/Separated/Widowed 152 50.6% 35.0% 14.3%
Occupation
Managerial/Professional worker 1 199 35.8% 44.0% 20.2%
0.000
Clerk 587 42.0% 37.7% 20.3%
Service/Shop sales worker 407 43.2% 34.1% 22.7%
Blue collar worker 448 41.3% 39.9% 18.8%
Not working 1 320 49.4% 37.8% 12.8%
Monthly
Household
Income
Below $8,000 147 62.3% 26.4% 11.4%
0.000
$8,000-$13,999 254 51.0% 37.2% 11.8%
$14,000-$19,999 300 44.7% 45.1% 10.2%
$20,000-$39,999 1 105 43.4% 40.3% 16.3%
$40,000 or above 1 480 37.4% 40.4% 22.2%

Behavioural Risk Factor Survey April 2016
Page 84 of 127
4.5.4 Daily average amount of white meat consumed
Daily average amount of white meat consumed is associated significantly with the
respondents‟ gender, age, marital status, occupation and monthly household income.
Female respondents (60.7%), those aged 45-54 (62.2%), married respondents (59.3%) and
clerks (62.1%) were more likely to have consumed less than 2 taels of white meat per day
on average during the thirty days prior to the survey when compared with their respective
counterparts. The lower the monthly household income of the respondents, the more likely
that they consumed less than 2 taels of white meat per day on average during the thirty
days prior to the survey (Table 4.5.4).
Table 4.5.4: Daily average amount of white meat consumed (Section 4: Q2a & Q2b)
Variable Level Base
Less
than 2
taels
2-4
taels
More
than 4
taels
p-value
Kruskal-
Wallis test
Rank
Correlation
Gender Male 1 881 52.9% 33.6% 13.6%
0.000 Female 2 148 60.7% 30.3% 9.0%
Age group
18-24 462 53.0% 32.6% 14.4%
0.000
25-34 782 50.3% 33.5% 16.2%
35-44 837 56.8% 32.3% 11.0%
45-54 971 62.2% 28.3% 9.4%
55-64 902 59.6% 33.4% 7.0%
Marital
status
Never married 1 458 53.4% 32.3% 14.3%
0.000 Married 2 398 59.3% 31.3% 9.4%
Divorced/Separated/Widowed 152 58.1% 35.1% 6.8%
Occupation
Managerial/Professional worker 1 197 53.0% 34.6% 12.3%
0.018
Clerk 585 62.1% 27.7% 10.2%
Service/Shop sales worker 403 53.9% 33.8% 12.3%
Blue collar worker 447 58.3% 28.4% 13.3%
Not working 1 315 59.9% 31.3% 8.8%
Monthly
Household
Income
Below $8,000 147 64.8% 29.0% 6.2%
0.008
$8,000-$13,999 253 61.5% 28.5% 10.0%
$14,000-$19,999 299 59.5% 30.6% 9.9%
$20,000-$39,999 1 105 58.4% 32.2% 9.3%
$40,000 or above 1 472 54.5% 32.7% 12.9%

Behavioural Risk Factor Survey April 2016
Page 85 of 127
4.5.5 Average daily total consumption of red and white meat
Average daily total consumption of red and white meat is associated significantly with the
respondents‟ gender, age, educational attainment, marital status, occupation and monthly
household income.
Female respondents (56.0%), those aged 55-64 (58.3%), those having lower secondary
education (54.0%) or upper secondary education/ matriculation (54.2%), married or
divorced/separated/widowed respondents (ranging from 53.1% to 53.4%) and non-working
respondents (54.3%) were more likely to have consumed less than 4 taels of red and white
meat per day on average during the thirty days prior to the survey when compared with
their respective counterparts. The lower the monthly household income of the respondents,
the more likely that they consumed less than 4 taels of red and white meat per day on
average during the thirty days prior to the survey (Table 4.5.5).
Table 4.5.5: Average daily total consumption of red and white meat (Section 4: Q1a, Q1b, Q2a &Q2b)
Variable Level Base
Less
than 4
taels
4-6
taels
More
than 6
taels
p-value
Kruskal-
Wallis test
Rank
Correlation
Gender Male 1 874 39.8% 26.8% 33.3%
0.000 Female 2 144 56.0% 25.9% 18.1%
Age group
18-24 461 37.0% 25.9% 37.1%
0.000
25-34 781 36.9% 26.7% 36.4%
35-44 836 47.1% 27.6% 25.3%
45-54 969 54.8% 25.4% 19.8%
55-64 896 58.3% 26.5% 15.2%
Educational
attainment
Primary or below 256 51.6% 31.9% 16.5%
0.000
Lower secondary (S1-S3) 522 54.0% 21.4% 24.6%
Upper secondary (S4-S6)/
Matriculation 1 386 54.2% 24.7% 21.1%
Tertiary (Non-degree, degree or
above) 1 846 42.3% 28.1% 29.6%
Marital
status
Never married 1 454 40.4% 26.8% 32.8%
0.000 Married 2 391 53.1% 26.3% 20.6%
Divorced/Separated/Widowed 152 53.4% 23.5% 23.1%
Occupation
Managerial/Professional worker 1 194 42.0% 28.9% 29.1%
0.000
Clerk 585 50.6% 25.0% 24.4%
Service/Shop sales worker 403 47.4% 21.8% 30.8%
Blue collar worker 446 47.6% 25.3% 27.1%
Not working 1 311 54.3% 26.5% 19.2%
Monthly
Household
Income
Below $8,000 146 61.8% 23.1% 15.1%
0.000
$8,000-$13,999 253 59.5% 19.3% 21.2%
$14,000-$19,999 299 54.1% 26.1% 19.8%
$20,000-$39,999 1 101 49.6% 26.3% 24.1%
$40,000 or above 1 472 42.4% 29.1% 28.5%
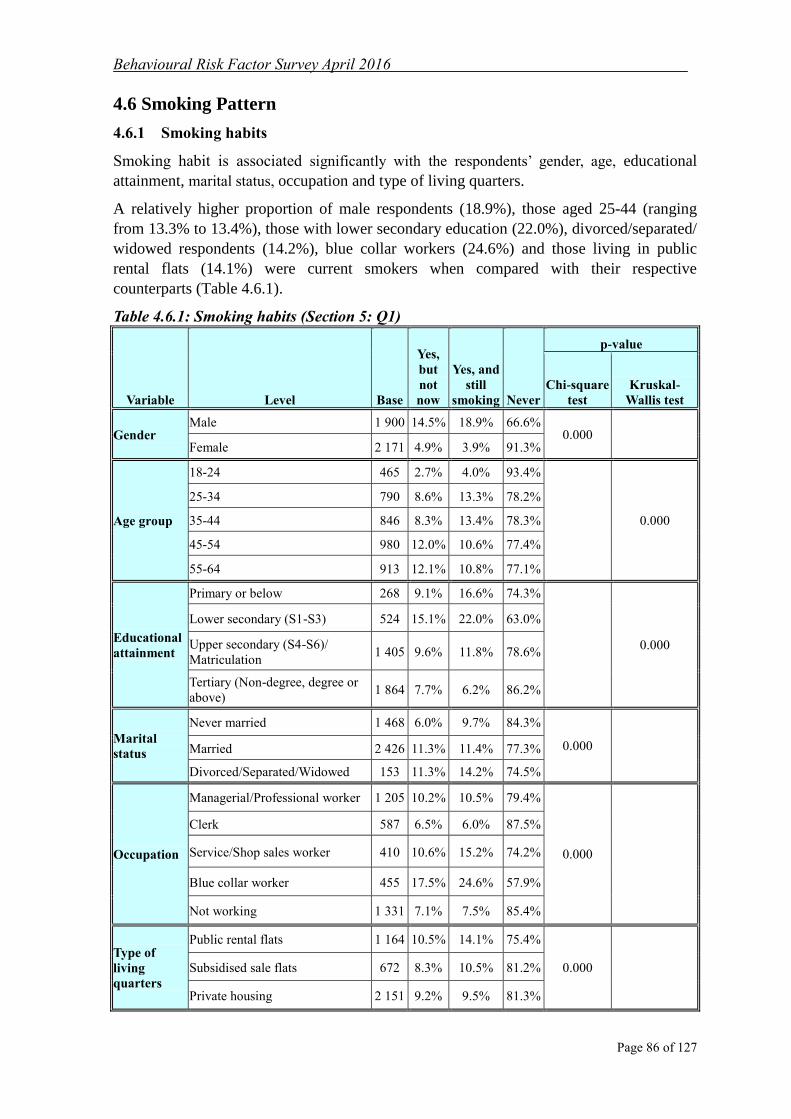
Behavioural Risk Factor Survey April 2016
Page 86 of 127
4.6 Smoking Pattern
4.6.1 Smoking habits
Smoking habit is associated significantly with the respondents‟ gender, age, educational
attainment, marital status, occupation and type of living quarters.
A relatively higher proportion of male respondents (18.9%), those aged 25-44 (ranging
from 13.3% to 13.4%), those with lower secondary education (22.0%), divorced/separated/
widowed respondents (14.2%), blue collar workers (24.6%) and those living in public
rental flats (14.1%) were current smokers when compared with their respective
counterparts (Table 4.6.1).
Table 4.6.1: Smoking habits (Section 5: Q1)
Variable Level Base
Yes,
but
not
now
Yes, and
still
smoking Never
p-value
Chi-square
test
Kruskal-
Wallis test
Gender Male 1 900 14.5% 18.9% 66.6%
0.000 Female 2 171 4.9% 3.9% 91.3%
Age group
18-24 465 2.7% 4.0% 93.4%
0.000
25-34 790 8.6% 13.3% 78.2%
35-44 846 8.3% 13.4% 78.3%
45-54 980 12.0% 10.6% 77.4%
55-64 913 12.1% 10.8% 77.1%
Educational
attainment
Primary or below 268 9.1% 16.6% 74.3%
0.000
Lower secondary (S1-S3) 524 15.1% 22.0% 63.0%
Upper secondary (S4-S6)/
Matriculation 1 405 9.6% 11.8% 78.6%
Tertiary (Non-degree, degree or
above) 1 864 7.7% 6.2% 86.2%
Marital
status
Never married 1 468 6.0% 9.7% 84.3%
0.000 Married 2 426 11.3% 11.4% 77.3%
Divorced/Separated/Widowed 153 11.3% 14.2% 74.5%
Occupation
Managerial/Professional worker 1 205 10.2% 10.5% 79.4%
0.000
Clerk 587 6.5% 6.0% 87.5%
Service/Shop sales worker 410 10.6% 15.2% 74.2%
Blue collar worker 455 17.5% 24.6% 57.9%
Not working 1 331 7.1% 7.5% 85.4%
Type of
living
quarters
Public rental flats 1 164 10.5% 14.1% 75.4%
0.000 Subsidised sale flats 672 8.3% 10.5% 81.2%
Private housing 2 151 9.2% 9.5% 81.3%

Behavioural Risk Factor Survey April 2016
Page 87 of 127
4.6.2 Number of cigarettes consumed
The number of cigarettes consumed is associated significantly with current smokers‟
gender, educational attainment, occupation, monthly household income and type of living
quarters.
A relatively higher proportion of male smokers (52.9%), blue collar workers (71.0%),
those with monthly household income of below $8,000 (64.6%) and those living in
subsidised sale flats (61.2%) reported that they smoked more than 10 cigarettes per day
when compared with their respective counterparts. The lower the educational attainment of
the current smoking respondents, the more likely that they smoked more than 10 cigarettes
per day (Table 4.6.2).
Table 4.6.2: Average number of cigarettes smokers smoked per day (Section 5: Q3a)
Variable Level Base
10 per
day or
less
More
than 10
per day
p-value
Kruskal-Wallis
test
Rank
Correlation
Gender Male 357 47.1% 52.9%
0.000 Female 84 77.6% 22.4%
Educational
attainment
Primary or below 44 32.7% 67.3%
0.000
Lower secondary (S1-S3) 114 34.2% 65.8%
Upper secondary (S4-S6)/
Matriculation 165 57.1% 42.9%
Tertiary (Non-degree, degree
or above) 115 72.1% 27.9%
Occupation
Managerial/Professional
worker 126 66.2% 33.8%
0.000
Clerk 35 70.9% 29.1%
Service/Shop sales worker 62 53.5% 46.5%
Blue collar worker 112 29.0% 71.0%
Not working 99 55.9% 44.1%
Monthly
Household
Income
Below $8,000 16 35.4% 64.6%
0.008
$8,000-$13,999 31 44.3% 55.7%
$14,000-$19,999 41 43.6% 56.4%
$20,000-$39,999 105 48.5% 51.5%
$40,000 or above 157 65.8% 34.2%
Type of living
quarters
Public rental flats 164 46.9% 53.1%
0.002 Subsidised sale flats 70 38.8% 61.2%
Private housing 202 62.2% 37.8%
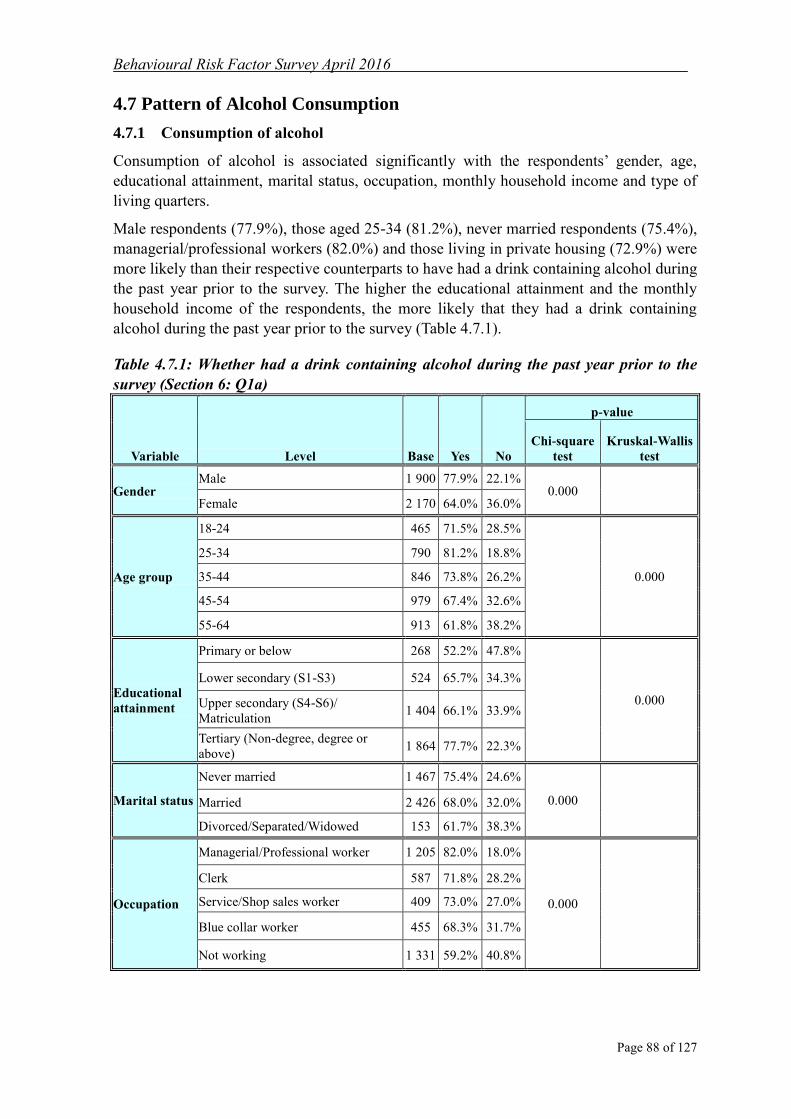
Behavioural Risk Factor Survey April 2016
Page 88 of 127
4.7 Pattern of Alcohol Consumption
4.7.1 Consumption of alcohol
Consumption of alcohol is associated significantly with the respondents‟ gender, age,
educational attainment, marital status, occupation, monthly household income and type of
living quarters.
Male respondents (77.9%), those aged 25-34 (81.2%), never married respondents (75.4%),
managerial/professional workers (82.0%) and those living in private housing (72.9%) were
more likely than their respective counterparts to have had a drink containing alcohol during
the past year prior to the survey. The higher the educational attainment and the monthly
household income of the respondents, the more likely that they had a drink containing
alcohol during the past year prior to the survey (Table 4.7.1).
Table 4.7.1: Whether had a drink containing alcohol during the past year prior to the
survey (Section 6: Q1a)
Variable Level Base Yes No
p-value
Chi-square
test
Kruskal-Wallis
test
Gender Male 1 900 77.9% 22.1%
0.000 Female 2 170 64.0% 36.0%
Age group
18-24 465 71.5% 28.5%
0.000
25-34 790 81.2% 18.8%
35-44 846 73.8% 26.2%
45-54 979 67.4% 32.6%
55-64 913 61.8% 38.2%
Educational
attainment
Primary or below 268 52.2% 47.8%
0.000
Lower secondary (S1-S3) 524 65.7% 34.3%
Upper secondary (S4-S6)/
Matriculation 1 404 66.1% 33.9%
Tertiary (Non-degree, degree or
above) 1 864 77.7% 22.3%
Marital status
Never married 1 467 75.4% 24.6%
0.000 Married 2 426 68.0% 32.0%
Divorced/Separated/Widowed 153 61.7% 38.3%
Occupation
Managerial/Professional worker 1 205 82.0% 18.0%
0.000
Clerk 587 71.8% 28.2%
Service/Shop sales worker 409 73.0% 27.0%
Blue collar worker 455 68.3% 31.7%
Not working 1 331 59.2% 40.8%
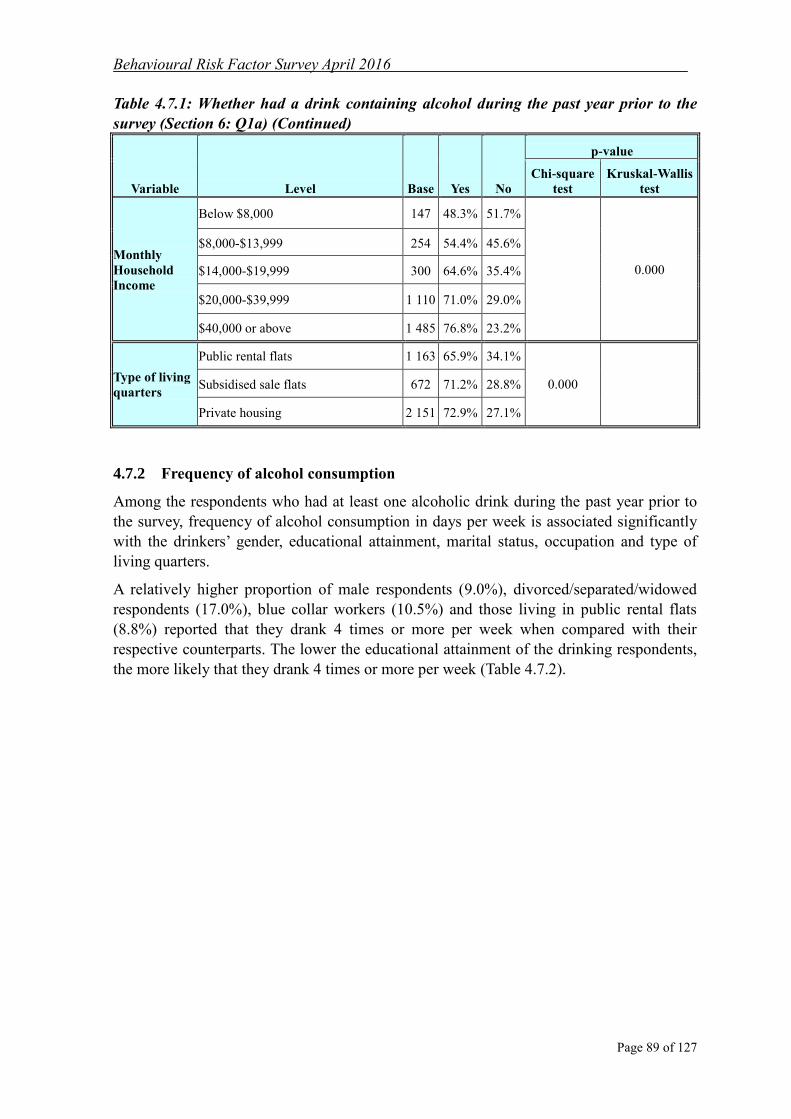
Behavioural Risk Factor Survey April 2016
Page 89 of 127
Table 4.7.1: Whether had a drink containing alcohol during the past year prior to the
survey (Section 6: Q1a) (Continued)
Variable Level Base Yes No
p-value
Chi-square
test
Kruskal-Wallis
test
Monthly
Household
Income
Below $8,000 147 48.3% 51.7%
0.000
$8,000-$13,999 254 54.4% 45.6%
$14,000-$19,999 300 64.6% 35.4%
$20,000-$39,999 1 110 71.0% 29.0%
$40,000 or above 1 485 76.8% 23.2%
Type of living
quarters
Public rental flats 1 163 65.9% 34.1%
0.000 Subsidised sale flats 672 71.2% 28.8%
Private housing 2 151 72.9% 27.1%
4.7.2 Frequency of alcohol consumption
Among the respondents who had at least one alcoholic drink during the past year prior to
the survey, frequency of alcohol consumption in days per week is associated significantly
with the drinkers‟ gender, educational attainment, marital status, occupation and type of
living quarters.
A relatively higher proportion of male respondents (9.0%), divorced/separated/widowed
respondents (17.0%), blue collar workers (10.5%) and those living in public rental flats
(8.8%) reported that they drank 4 times or more per week when compared with their
respective counterparts. The lower the educational attainment of the drinking respondents,
the more likely that they drank 4 times or more per week (Table 4.7.2).
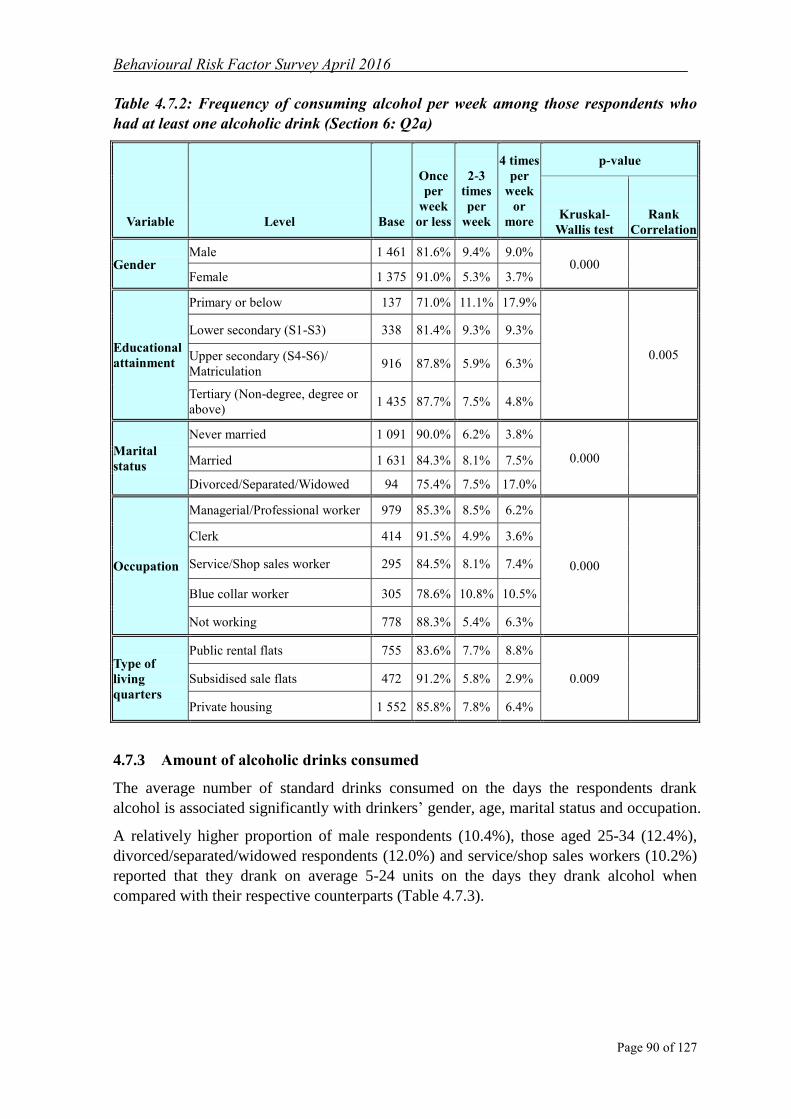
Behavioural Risk Factor Survey April 2016
Page 90 of 127
Table 4.7.2: Frequency of consuming alcohol per week among those respondents who
had at least one alcoholic drink (Section 6: Q2a)
Variable Level Base
Once
per
week
or less
2-3
times
per
week
4 times
per
week
or
more
p-value
Kruskal-
Wallis test
Rank
Correlation
Gender Male 1 461 81.6% 9.4% 9.0%
0.000 Female 1 375 91.0% 5.3% 3.7%
Educational
attainment
Primary or below 137 71.0% 11.1% 17.9%
0.005
Lower secondary (S1-S3) 338 81.4% 9.3% 9.3%
Upper secondary (S4-S6)/
Matriculation 916 87.8% 5.9% 6.3%
Tertiary (Non-degree, degree or
above) 1 435 87.7% 7.5% 4.8%
Marital
status
Never married 1 091 90.0% 6.2% 3.8%
0.000 Married 1 631 84.3% 8.1% 7.5%
Divorced/Separated/Widowed 94 75.4% 7.5% 17.0%
Occupation
Managerial/Professional worker 979 85.3% 8.5% 6.2%
0.000
Clerk 414 91.5% 4.9% 3.6%
Service/Shop sales worker 295 84.5% 8.1% 7.4%
Blue collar worker 305 78.6% 10.8% 10.5%
Not working 778 88.3% 5.4% 6.3%
Type of
living
quarters
Public rental flats 755 83.6% 7.7% 8.8%
0.009 Subsidised sale flats 472 91.2% 5.8% 2.9%
Private housing 1 552 85.8% 7.8% 6.4%
4.7.3 Amount of alcoholic drinks consumed
The average number of standard drinks consumed on the days the respondents drank
alcohol is associated significantly with drinkers‟ gender, age, marital status and occupation.
A relatively higher proportion of male respondents (10.4%), those aged 25-34 (12.4%),
divorced/separated/widowed respondents (12.0%) and service/shop sales workers (10.2%)
reported that they drank on average 5-24 units on the days they drank alcohol when
compared with their respective counterparts (Table 4.7.3).
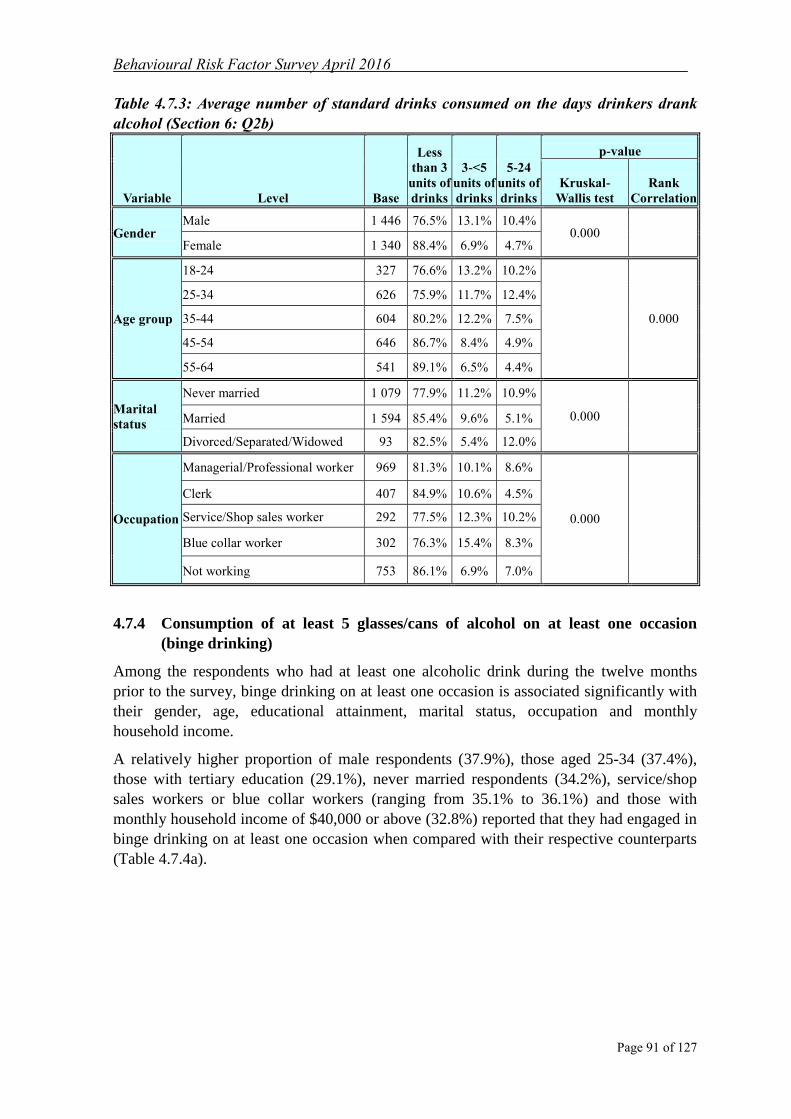
Behavioural Risk Factor Survey April 2016
Page 91 of 127
Table 4.7.3: Average number of standard drinks consumed on the days drinkers drank
alcohol (Section 6: Q2b)
Variable Level Base
Less
than 3
units of
drinks
3-<5
units of
drinks
5-24
units of
drinks
p-value
Kruskal-
Wallis test
Rank
Correlation
Gender Male 1 446 76.5% 13.1% 10.4%
0.000 Female 1 340 88.4% 6.9% 4.7%
Age group
18-24 327 76.6% 13.2% 10.2%
0.000
25-34 626 75.9% 11.7% 12.4%
35-44 604 80.2% 12.2% 7.5%
45-54 646 86.7% 8.4% 4.9%
55-64 541 89.1% 6.5% 4.4%
Marital
status
Never married 1 079 77.9% 11.2% 10.9%
0.000 Married 1 594 85.4% 9.6% 5.1%
Divorced/Separated/Widowed 93 82.5% 5.4% 12.0%
Occupation
Managerial/Professional worker 969 81.3% 10.1% 8.6%
0.000
Clerk 407 84.9% 10.6% 4.5%
Service/Shop sales worker 292 77.5% 12.3% 10.2%
Blue collar worker 302 76.3% 15.4% 8.3%
Not working 753 86.1% 6.9% 7.0%
4.7.4 Consumption of at least 5 glasses/cans of alcohol on at least one occasion
(binge drinking)
Among the respondents who had at least one alcoholic drink during the twelve months
prior to the survey, binge drinking on at least one occasion is associated significantly with
their gender, age, educational attainment, marital status, occupation and monthly
household income.
A relatively higher proportion of male respondents (37.9%), those aged 25-34 (37.4%),
those with tertiary education (29.1%), never married respondents (34.2%), service/shop
sales workers or blue collar workers (ranging from 35.1% to 36.1%) and those with
monthly household income of $40,000 or above (32.8%) reported that they had engaged in
binge drinking on at least one occasion when compared with their respective counterparts
(Table 4.7.4a).

Behavioural Risk Factor Survey April 2016
Page 92 of 127
Table 4.7.4a: Consumption of at least 5 glasses/cans of alcohol on at least one occasion
by drinkers (Section 6: Q2c)
Variable Level Base Yes No
p-value
Chi-
square test
Kruskal-Wallis
test
Gender Male 1 428 37.9% 62.1%
0.000 Female 1 363 16.3% 83.7%
Age group
18-24 321 31.2% 68.8%
0.000
25-34 618 37.4% 62.6%
35-44 599 32.6% 67.4%
45-54 647 21.2% 78.8%
55-64 560 16.3% 83.7%
Educational
attainment
Primary or below 138 17.1% 82.9%
0.002
Lower secondary (S1-S3) 336 26.8% 73.2%
Upper secondary (S4-S6)/
Matriculation 892 26.4% 73.6%
Tertiary (Non-degree, degree or
above) 1 416 29.1% 70.9%
Marital status
Never married 1 066 34.2% 65.8%
0.000 Married 1 614 22.9% 77.1%
Divorced/Separated/Widowed 92 27.0% 73.0%
Occupation
Managerial/Professional worker 948 28.7% 71.3%
0.000
Clerk 415 27.8% 72.2%
Service/Shop sales worker 288 36.1% 63.9%
Blue collar worker 303 35.1% 64.9%
Not working 774 18.9% 81.1%
Monthly
household
income
Below $8,000 71 20.6% 79.4%
0.000
$8,000-$13,999 136 23.4% 76.6%
$14,000-$19,999 189 28.5% 71.5%
$20,000-$39,999 767 20.3% 79.7%
$40,000 or above 1 105 32.8% 67.2%

Behavioural Risk Factor Survey April 2016
Page 93 of 127
The frequency of binge drinking is associated significantly with binge drinkers‟ gender,
age, educational attainment, marital status and type of living quarters.
Male binge drinkers (23.6%), those aged 55-64 (28.5%), divorced/separated/widowed
respondents (39.9%) and those living in public rental flats (24.9%) or private housing
(24.2%) were more likely to have engaged in binge drinking twice a month or more when
compared with their respective binging counterparts. The lower the educational attainment
of the binge drinkers, the more likely that they had engaged in binge drinking twice a
month or more (Table 4.7.4b).
Table 4.7.4b: Frequency of binge drinking among the binge drinkers (Section 6: Q2c)
Variable Level Base
Once a
month
or less
Twice a
month
or
more
p-value
Kruskal-Wallis
test
Rank
Correlation
Gender Male 541 76.4% 23.6%
0.018 Female 223 82.0% 18.0%
Age group
18-24 100 88.6% 11.4%
0.018
25-34 231 75.3% 24.7%
35-44 195 80.6% 19.4%
45-54 137 76.5% 23.5%
55-64 92 71.5% 28.5%
Educational
attainment
Primary or below 24 48.3% 51.7%
0.003
Lower secondary (S1-S3) 90 69.6% 30.4%
Upper secondary (S4-S6)/
Matriculation 235 79.4% 20.6%
Tertiary (Non-degree, degree or
above) 412 81.3% 18.7%
Marital status
Never married 365 78.5% 21.5%
0.049 Married 369 79.3% 20.7%
Divorced/Separated/Widowed 25 60.1% 39.9%
Type of living
quarters
Public rental flats 203 75.1% 24.9%
0.001 Subsidised sale flats 118 92.6% 7.4%
Private housing 427 75.8% 24.2%
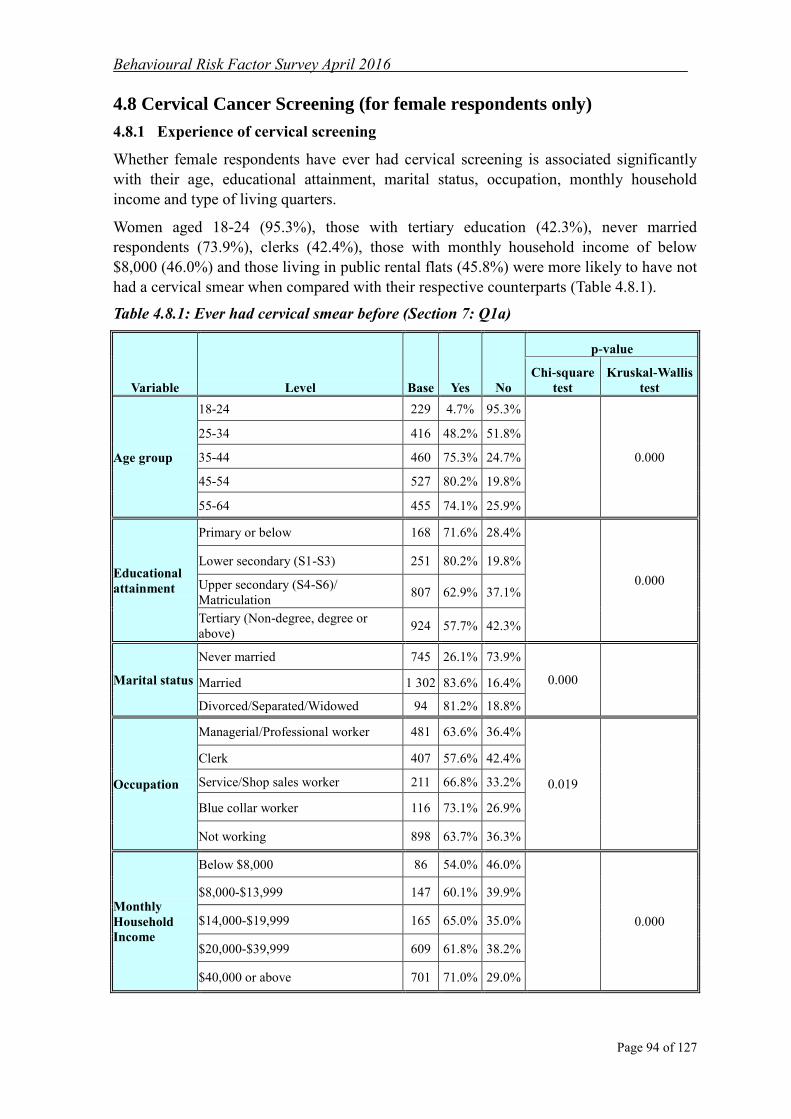
Behavioural Risk Factor Survey April 2016
Page 94 of 127
4.8 Cervical Cancer Screening (for female respondents only)
4.8.1 Experience of cervical screening
Whether female respondents have ever had cervical screening is associated significantly
with their age, educational attainment, marital status, occupation, monthly household
income and type of living quarters.
Women aged 18-24 (95.3%), those with tertiary education (42.3%), never married
respondents (73.9%), clerks (42.4%), those with monthly household income of below
$8,000 (46.0%) and those living in public rental flats (45.8%) were more likely to have not
had a cervical smear when compared with their respective counterparts (Table 4.8.1).
Table 4.8.1: Ever had cervical smear before (Section 7: Q1a)
Variable Level Base Yes No
p-value
Chi-square
test
Kruskal-Wallis
test
Age group
18-24 229 4.7% 95.3%
0.000
25-34 416 48.2% 51.8%
35-44 460 75.3% 24.7%
45-54 527 80.2% 19.8%
55-64 455 74.1% 25.9%
Educational
attainment
Primary or below 168 71.6% 28.4%
0.000
Lower secondary (S1-S3) 251 80.2% 19.8%
Upper secondary (S4-S6)/
Matriculation 807 62.9% 37.1%
Tertiary (Non-degree, degree or
above) 924 57.7% 42.3%
Marital status
Never married 745 26.1% 73.9%
0.000 Married 1 302 83.6% 16.4%
Divorced/Separated/Widowed 94 81.2% 18.8%
Occupation
Managerial/Professional worker 481 63.6% 36.4%
0.019
Clerk 407 57.6% 42.4%
Service/Shop sales worker 211 66.8% 33.2%
Blue collar worker 116 73.1% 26.9%
Not working 898 63.7% 36.3%
Monthly
Household
Income
Below $8,000 86 54.0% 46.0%
0.000
$8,000-$13,999 147 60.1% 39.9%
$14,000-$19,999 165 65.0% 35.0%
$20,000-$39,999 609 61.8% 38.2%
$40,000 or above 701 71.0% 29.0%
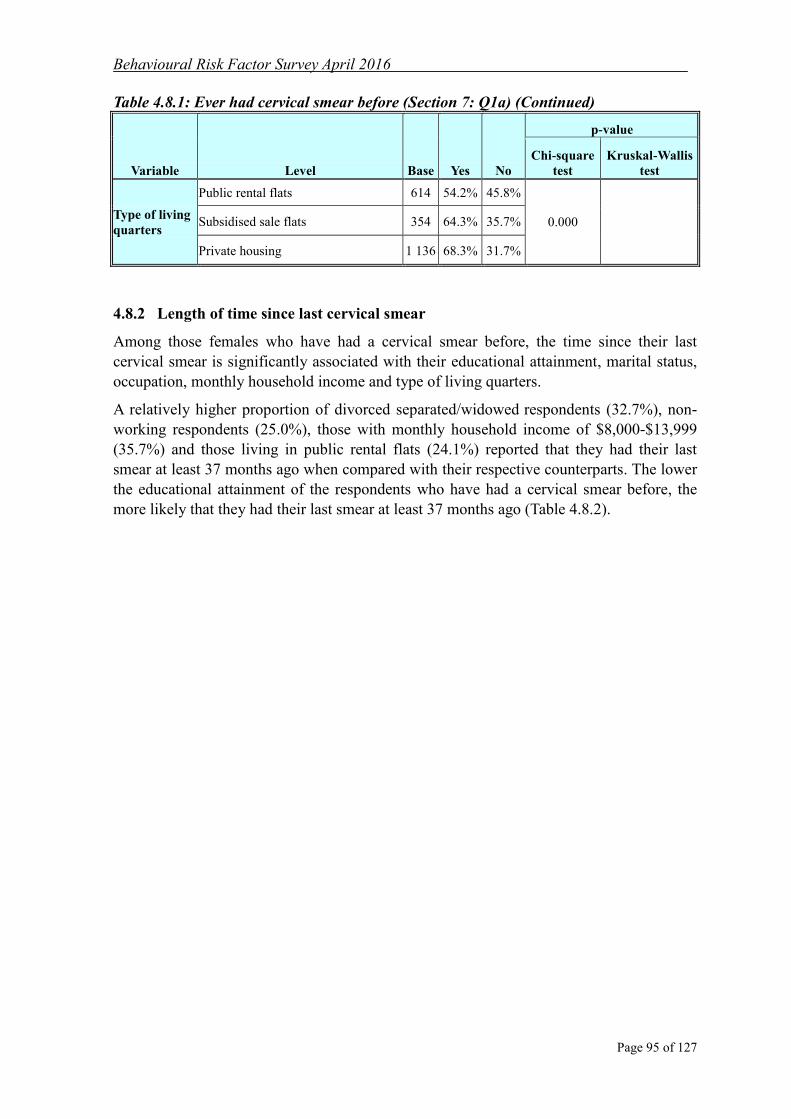
Behavioural Risk Factor Survey April 2016
Page 95 of 127
Table 4.8.1: Ever had cervical smear before (Section 7: Q1a) (Continued)
Variable Level Base Yes No
p-value
Chi-square
test
Kruskal-Wallis
test
Type of living
quarters
Public rental flats 614 54.2% 45.8%
0.000 Subsidised sale flats 354 64.3% 35.7%
Private housing 1 136 68.3% 31.7%
4.8.2 Length of time since last cervical smear
Among those females who have had a cervical smear before, the time since their last
cervical smear is significantly associated with their educational attainment, marital status,
occupation, monthly household income and type of living quarters.
A relatively higher proportion of divorced separated/widowed respondents (32.7%), non-
working respondents (25.0%), those with monthly household income of $8,000-$13,999
(35.7%) and those living in public rental flats (24.1%) reported that they had their last
smear at least 37 months ago when compared with their respective counterparts. The lower
the educational attainment of the respondents who have had a cervical smear before, the
more likely that they had their last smear at least 37 months ago (Table 4.8.2).

Behavioural Risk Factor Survey April 2016
Page 96 of 127
Table 4.8.2: Length of time since last cervical smear (Section 7: Q1b)
Variable Level Base
Within
12
months
13-36
months
37 months
or above
p-value
Kruskal-
Wallis test
Rank
Correlation
Educational
attainment
Primary or below 114 36.8% 31.3% 31.9%
0.000
Lower secondary (S1-S3) 191 37.9% 38.6% 23.5%
Upper secondary (S4-S6)/
Matriculation 496 42.9% 34.6% 22.4%
Tertiary (Non-degree, degree
or above) 526 51.3% 33.7% 15.0%
Marital
status
Never married 189 57.8% 27.5% 14.7%
0.000 Married 1 062 43.8% 35.6% 20.7%
Divorced/Separated/
Widowed 73 32.2% 35.1% 32.7%
Occupation
Managerial/Professional
worker 305 50.5% 34.6% 14.9%
0.000
Clerk 231 53.5% 30.2% 16.3%
Service/Shop sales worker 137 42.0% 35.6% 22.4%
Blue collar worker 82 40.2% 41.1% 18.7%
Not working 549 40.3% 34.7% 25.0%
Monthly
Household
Income
Below $8,000 46 32.5% 36.3% 31.2%
0.000
$8,000-$13,999 87 29.8% 34.4% 35.7%
$14,000-$19,999 102 42.3% 30.0% 27.6%
$20,000-$39,999 362 41.9% 38.3% 19.8%
$40,000 or above 494 49.4% 33.8% 16.7%
Type of
living
quarters
Public rental flats 324 38.7% 37.3% 24.1%
0.005 Subsidised sale flats 221 38.8% 43.1% 18.1%
Private housing 758 49.6% 31.1% 19.2%

Behavioural Risk Factor Survey April 2016
Page 97 of 127
4.8.3 Regular cervical smear test
Among those females who have had a cervical smear before, whether they had the cervical
smear at a regular interval is associated significantly with their educational attainment,
marital status, occupation, monthly household income and type of living quarters.
Never married respondents (43.1%), service/shop sales workers (37.3%) or non-working
respondents (36.6%), those with monthly household income of below $8,000 (44.8%) and
those living in public rental flats (38.7%) were more likely to report that they did not have
the smear at a regular interval when compared with their respective counterparts. Also, the
lower the educational attainment of respondents who have had a cervical smear before, the
more likely that they did not have cervical smear at a regular interval (Table 4.8.3).
Table 4.8.3: Whether had had cervical smear at a regular interval (Section 7: Q1c)
Variable Level Base
Yes, at a
regular
interval
No, not at
a regular
interval
p-value
Chi-square
test
Kruskal-Wallis
test
Educational
attainment
Primary or below 120 60.4% 39.6%
0.008
Lower secondary (S1-S3) 201 65.1% 34.9%
Upper secondary (S4-S6)/
Matriculation 506 67.3% 32.7%
Tertiary
(Non-degree, degree or above) 533 68.2% 31.8%
Marital status
Never married 195 56.9% 43.1%
0.004 Married 1 086 68.7% 31.3%
Divorced/Separated/Widowed 77 62.8% 37.2%
Occupation
Managerial/Professional worker 306 73.5% 26.5%
0.029
Clerk 233 68.9% 31.1%
Service/Shop sales worker 141 62.7% 37.3%
Blue collar worker 85 66.8% 33.2%
Not working 571 63.4% 36.6%
Monthly
Household
Income
Below $8,000 47 55.2% 44.8%
0.000
$8,000-$13,999 88 59.1% 40.9%
$14,000-$19,999 107 56.8% 43.2%
$20,000-$39,999 376 66.6% 33.4%
$40,000 or above 497 70.1% 29.9%
Type of living
quarters
Public rental flats 333 61.3% 38.7%
0.037 Subsidised sale flats 227 71.0% 29.0%
Private housing 774 67.6% 32.4%

Behavioural Risk Factor Survey April 2016
Page 98 of 127
4.8.4 Frequency of having cervical smear
Among those females who have had a cervical smear at a regular interval, the frequency of
having a cervical smear is associated significantly with their educational attainment,
marital status, occupation and type of living quarters.
Divorced/separated/widowed respondents (35.7%), blue collar workers (51.2%) and those
living in public rental flats (45.2%) were more likely to report that they had cervical smear
less frequent than once every 2 years when compared with their respective counterparts.
Also, the lower the educational attainment of the respondents who have had a cervical
smear at a regular interval, the more likely that they had the cervical smear test less
frequent than once every 2 years (Table 4.8.4).
Table 4.8.4: Frequency of having cervical smear (Section 7: Q1d)
Variable Level Base
At
least
once a
year
Once
every
2
years
Less
frequent
than
once
every 2
years
p-value
Kruskal-
Wallis test
Rank
Correlation
Educational
attainment
Primary or below 68 24.7% 22.0% 53.3%
0.000
Lower secondary (S1-S3) 120 26.3% 29.2% 44.5%
Upper secondary (S4-S6)/
Matriculation 313 38.8% 30.4% 30.8%
Tertiary (Non-degree, degree or
above) 351 46.8% 37.2% 16.0%
Marital
status
Never married 106 59.4% 26.2% 14.4%
0.000 Married 704 36.8% 33.3% 29.9%
Divorced/Separated/Widowed 41 30.6% 33.8% 35.7%
Occupation
Managerial/Professional worker 213 47.8% 32.3% 19.9%
0.000
Clerk 154 44.5% 35.2% 20.3%
Service/Shop sales worker 84 37.0% 28.2% 34.8%
Blue collar worker 53 23.3% 25.5% 51.2%
Not working 335 34.7% 32.9% 32.3%
Type of
living
quarters
Public rental flats 189 28.3% 26.5% 45.2%
0.000 Subsidised sale flats 146 28.7% 39.4% 32.0%
Private housing 500 46.8% 33.2% 20.0%

Behavioural Risk Factor Survey April 2016
Page 99 of 127
4.9 Awareness of Cancer Prevention and Screening
4.9.1 Level of agreement to “Alcohol is a human cancer-causing agent (carcinogen)”
(Correct statement)
Level of agreement to “Alcohol is a human cancer-causing agent” is associated
significantly with the respondents‟ gender, age, educational attainment, marital status,
occupation, monthly household income and type of living quarters.
Male respondents (44.4%), those aged 25-34 (48.3%), married respondents (42.2%),
managerial/professional workers (47.8%), those with monthly household income of
$40,000 or above (47.0%) and those living in private housing (43.7%) were more likely to
strongly disagree/disagree to the statement that “Alcohol is a human cancer-causing agent
(carcinogen)”. The higher the educational attainment of the respondents, the more likely
that they strongly disagreed/disagreed to the statement (Table 4.9.1).
Table 4.9.1 Level of agreement to “Alcohol is a human cancer-causing agent
(carcinogen)” (Section 8: Q1b)
Variable Level Base
Strongly
agree/
Agree
Strongly
disagree/
Disagree
Don't
know
p-value
Chi-square
test
Kruskal-
Wallis test
Gender Male 1 900 48.9% 44.4% 6.8%
0.001 Female 2 171 52.0% 39.1% 8.8%
Age group
18-24 465 63.4% 32.7% 3.9%
0.000
25-34 790 47.5% 48.3% 4.2%
35-44 846 49.5% 43.1% 7.4%
45-54 980 48.3% 42.4% 9.2%
55-64 913 50.9% 37.5% 11.7%
Educational
attainment
Primary or below 268 56.4% 31.2% 12.5%
0.000
Lower secondary (S1-S3) 524 51.4% 39.1% 9.5%
Upper secondary (S4-S6)/
Matriculation 1 405 51.2% 41.7% 7.1%
Tertiary (Non-degree, degree or
above) 1 864 49.0% 43.7% 7.3%
Marital
status
Never married 1 468 54.2% 40.7% 5.1%
0.000 Married 2 426 48.3% 42.2% 9.4%
Divorced/Separated/Widowed 153 51.4% 40.8% 7.8%
Occupation
Managerial/Professional worker 1 205 45.4% 47.8% 6.8%
0.000
Clerk 587 46.3% 45.8% 7.9%
Service/Shop sales worker 410 47.1% 46.2% 6.7%
Blue collar worker 455 50.1% 41.7% 8.1%
Not working 1 331 58.5% 32.6% 8.9%

Behavioural Risk Factor Survey April 2016
Page 100 of 127
Table 4.9.1: Level of agreement to “Alcohol is a human cancer-causing agent
(carcinogen)” (Section 8: Q1b) (Continued)
Variable Level Base
Strongly
agree/
Agree
Strongly
disagree/
Disagree
Don't
know
p-value
Chi-square
test
Kruskal-
Wallis test
Monthly
household
income
Below $8,000 147 61.6% 28.9% 9.5%
0.000
$8,000-$13,999 254 59.9% 28.9% 11.2%
$14,000-$19,999 300 52.1% 39.2% 8.7%
$20,000-$39,999 1 110 53.7% 39.3% 7.0%
$40,000 or above 1 485 47.7% 47.0% 5.3%
Type of
living
quarters
Public rental flats 1 164 54.7% 37.9% 7.4%
0.009 Subsidised sale flats 672 49.4% 41.4% 9.2%
Private housing 2 151 48.9% 43.7% 7.4%

Behavioural Risk Factor Survey April 2016
Page 101 of 127
4.9.2 Level of agreement to “Processed meat can cause colorectal cancer” (Correct
statement)
Level of agreement to “Processed meat can cause colorectal cancer” is associated
significantly with the respondents‟ age, educational attainment, marital status, occupation
and monthly household income.
Those aged 55-64 (8.1%), those with primary education or below (8.7%), divorced/
separated/widowed respondents (7.2%), blue collar workers (8.1%) and those with
monthly household income of $14,000-$19,999 (8.7%) were more likely to strongly
disagree/disagree to the statement that “Processed meat can cause colorectal cancer”
(Table 4.9.2).
Table 4.9.2: Level of agreement to “Processed meat can cause colorectal cancer”
(Section 8: Q1c)
Variable Level Base
Strongly
agree/
Agree
Strongly
disagree/
Disagree
Don't
know
p-value
Chi-square
test
Kruskal-
Wallis test
Age group
18-24 465 94.3% 2.7% 3.0%
0.000
25-34 790 93.5% 4.8% 1.6%
35-44 846 93.6% 4.7% 1.7%
45-54 980 91.7% 5.0% 3.3%
55-64 913 86.3% 8.1% 5.6%
Educational
attainment
Primary or below 268 82.7% 8.7% 8.6%
0.000
Lower secondary (S1-S3) 524 89.7% 6.3% 4.0%
Upper secondary (S4-S6)/
Matriculation 1 405 91.9% 4.7% 3.4%
Tertiary (Non-degree, degree
or above) 1 864 92.8% 5.0% 2.2%
Marital
status
Never married 1 468 94.0% 3.8% 2.2%
0.000 Married 2 426 90.4% 6.0% 3.5%
Divorced/Separated/Widowed 153 85.0% 7.2% 7.8%
Occupation
Managerial/Professional
worker 1 205 92.3% 5.4% 2.3%
0.007
Clerk 587 94.0% 4.0% 2.0%
Service/Shop sales worker 410 91.0% 4.9% 4.1%
Blue collar worker 455 87.8% 8.1% 4.1%
Not working 1 331 90.8% 5.1% 4.1%

Behavioural Risk Factor Survey April 2016
Page 102 of 127
Table 4.9.2: Level of agreement to “Processed meat can cause colorectal cancer”
(Section 8: Q1c) (Continued)
Variable Level Base
Strongly
agree/
Agree
Strongly
disagree/
Disagree
Don't
know
p-value
Chi-square
test
Kruskal-
Wallis test
Monthly
household
income
Below $8,000 147 88.8% 6.9% 4.3%
0.013
$8,000-$13,999 254 89.0% 6.5% 4.5%
$14,000-$19,999 300 88.3% 8.7% 3.0%
$20,000-$39,999 1 110 93.7% 3.7% 2.7%
$40,000 or above 1 485 93.2% 4.7% 2.1%

Behavioural Risk Factor Survey April 2016
Page 103 of 127
4.9.3 Level of agreement to “Obesity is a risk factor for cancers” (Correct
statement)
Level of agreement to “Obesity is a risk factor for cancers” is associated significantly with
the respondents‟ age, educational attainment, marital status and monthly household
income.
Those aged 45-64 (ranging from 35.6% to 36.2%), those with lower secondary education
(35.4%) or upper secondary education/matriculation (34.9%), married (34.8%) or
divorced/separated/widowed respondents (34.8%) and those with monthly household
income of $14,000-$19,999 (37.7%) were more likely to strongly disagree/disagree to the
statement that “Obesity is a risk factor for cancers” (Table 4.9.3).
Table 4.9.3: Level of agreement to “Obesity is a risk factor for cancers” (Section 8: Q1d)
Variable Level Base
Strongly
agree/
Agree
Strongly
disagree/
Disagree
Don't
know
p-value
Chi-square
test
Kruskal-
Wallis test
Age group
18-24 465 72.5% 25.8% 1.6%
0.000
25-34 790 65.7% 31.7% 2.6%
35-44 846 63.8% 30.7% 5.5%
45-54 980 56.4% 36.2% 7.3%
55-64 913 55.0% 35.6% 9.4%
Educational
attainment
Primary or below 268 57.7% 32.0% 10.3%
0.000
Lower secondary (S1-S3) 524 57.3% 35.4% 7.2%
Upper secondary (S4-S6)/
Matriculation 1 405 59.5% 34.9% 5.6%
Tertiary (Non-degree, degree
or above) 1 864 64.0% 31.0% 5.0%
Marital
status
Never married 1 468 66.8% 29.5% 3.6%
0.000 Married 2 426 58.2% 34.8% 7.1%
Divorced/Separated/
Widowed 153 58.8% 34.8% 6.4%
Monthly
household
income
Below $8,000 147 56.2% 32.5% 11.3%
0.028
$8,000-$13,999 254 61.6% 30.3% 8.1%
$14,000-$19,999 300 58.2% 37.7% 4.1%
$20,000-$39,999 1 110 64.6% 30.8% 4.6%
$40,000 or above 1 485 62.6% 32.7% 4.7%

Behavioural Risk Factor Survey April 2016
Page 104 of 127
4.9.4 Level of agreement to “Cancer screening is to conduct test on people who have
no symptom” (Correct statement)
Level of agreement to “Cancer screening is to conduct test on people who have no
symptom” is associated significantly with the respondents‟ age, educational attainment,
marital status and types of living quarters.
Never married (25.3%) or divorced/separated/widowed respondents (25.4%) and those
living in private housing (23.8%) were more likely to strongly disagree/disagree to the
statement that “Cancer screening is to conduct test on people who have no symptom”. The
younger and the higher the educational attainment of the respondents, the more likely that
they strongly disagreed/disagreed to the statement (Table 4.9.4).
Table 4.9.4: Level of agreement to “Cancer screening is to conduct test on people who
have no symptom” (Section 8: Q1e)
Variable Level Base
Strongly
agree/
Agree
Strongly
disagree/
Disagree
Don't
know
p-value
Chi-square
test
Kruskal-
Wallis test
Age group
18-24 465 64.4% 28.5% 7.1%
0.000
25-34 790 66.2% 24.4% 9.4%
35-44 846 68.3% 23.5% 8.2%
45-54 980 70.3% 20.7% 9.1%
55-64 913 72.6% 18.1% 9.3%
Educational
attainment
Primary or below 268 72.1% 16.0% 11.9%
0.000
Lower secondary (S1-S3) 524 70.6% 19.3% 10.2%
Upper secondary (S4-S6)/
Matriculation 1 405 68.3% 22.5% 9.2%
Tertiary (Non-degree, degree
or above) 1 864 68.4% 23.8% 7.8%
Marital
status
Never married 1 468 66.9% 25.3% 7.8%
0.000 Married 2 426 70.8% 20.1% 9.2%
Divorced/Separated/
Widowed 153 61.0% 25.4% 13.6%
Type of
living
quarters
Public rental flats 1 164 71.8% 19.5% 8.6%
0.023 Subsidised sale flats 672 71.0% 21.8% 7.2%
Private housing 2 151 67.1% 23.8% 9.1%

Behavioural Risk Factor Survey April 2016
Page 105 of 127
4.9.5 Level of agreement to “Cancer screening results are 100% accurate” (Incorrect
statement)
Level of agreement to “Cancer screening results are not 100% accurate” is associated
significantly with the respondents‟ gender, age, educational attainment, marital status,
occupation, monthly household income and types of living quarters.
Male respondents (48.9%), those aged 55-64 (52.9%), married respondents (50.0%), blue
collar workers (61.8%), those with monthly household income of $8,000-$13,999 (59.8%)
and those living in public rental flats (54.1%) were more likely to strongly agree/agree to
the statement that “Cancer screening results are 100% accurate”. The lower the educational
attainment of the respondents, the more likely that they strongly agreed/agreed to the
statement (Table 4.9.5).
Table 4.9.5: Level of agreement to “Cancer screening results are 100% accurate”
(Section 8: Q1f)
Variable Level Base
Strongly
agree/
Agree
Strongly
disagree/
Disagree
Don't
know
p-value
Chi-square
test
Kruskal-
Wallis test
Gender Male 1 900 48.9% 44.1% 6.9%
0.047 Female 2 170 45.9% 45.4% 8.7%
Age group
18-24 465 40.0% 56.4% 3.7%
0.000
25-34 790 43.7% 49.4% 6.8%
35-44 846 50.2% 42.1% 7.7%
45-54 980 47.0% 44.1% 8.9%
55-64 913 52.9% 37.5% 9.6%
Educational
attainment
Primary or below 268 64.8% 24.8% 10.4%
0.000
Lower secondary (S1-S3) 524 63.3% 26.3% 10.4%
Upper secondary (S4-S6)/
Matriculation 1 404 49.0% 43.5% 7.5%
Tertiary (Non-degree, degree or
above) 1 864 39.2% 53.8% 7.0%
Marital
status
Never married 1 468 43.7% 51.0% 5.3%
0.000 Married 2 426 50.0% 40.9% 9.1%
Divorced/Separated/Widowed 153 43.1% 44.4% 12.4%
Occupation
Managerial/Professional worker 1 205 41.3% 51.7% 6.9%
0.000
Clerk 587 43.8% 46.4% 9.8%
Service/Shop sales worker 410 52.1% 41.6% 6.3%
Blue collar worker 455 61.8% 30.6% 7.6%
Not working 1 330 48.5% 43.2% 8.3%

Behavioural Risk Factor Survey April 2016
Page 106 of 127
Table 4.9.5: Level of agreement to “Cancer screening results are 100% accurate”
(Section 8: Q1f) (Continued)
Variable Level Base
Strongly
agree/
Agree
Strongly
disagree/
Disagree
Don't
know
p-value
Chi-square
test
Kruskal-
Wallis test
Monthly
household
income
Below $8,000 147 49.9% 35.5% 14.6%
0.000
$8,000-$13,999 254 59.8% 34.4% 5.9%
$14,000-$19,999 300 57.6% 34.7% 7.8%
$20,000-$39,999 1 110 50.3% 43.8% 5.9%
$40,000 or above 1 485 43.9% 49.4% 6.7%
Type of
living
quarters
Public rental flats 1 164 54.1% 36.8% 9.1%
0.000 Subsidised sale flats 671 50.4% 42.9% 6.6%
Private housing 2 151 43.1% 49.4% 7.5%

Behavioural Risk Factor Survey April 2016
Page 107 of 127
4.9.6 Level of agreement to “Some cancer screening tests have potential risks”
(Correct statement)
Level of agreement to “Some cancer screening tests have potential risks” is associated
significantly with the respondents‟ gender, age and monthly household income.
Male respondents (72.8%), those aged 18-24 (72.3%) or 35-44 (73.3%) and those with
monthly household income of $40,000 or above (73.7%) were more likely to strongly
agree/agree to the statement “Some cancer screening tests have potential risks” (Table
4.9.6).
Table 4.9.6: Level of agreement to “Some cancer screening tests have potential risks”
(Section 8: Q1g)
Variable Level Base
Strongly
agree/
Agree
Strongly
disagree/
Disagree
Don't
know
p-value
Chi-square
test
Kruskal-
Wallis test
Gender Male 1 900 72.8% 17.3% 9.9%
0.022 Female 2 170 70.3% 17.0% 12.7%
Age group
18-24 465 72.3% 21.4% 6.3%
0.009
25-34 790 70.1% 17.4% 12.5%
35-44 845 73.3% 16.1% 10.6%
45-54 980 70.7% 16.9% 12.4%
55-64 913 71.9% 16.0% 12.1%
Monthly
household
income
Below $8,000 147 66.9% 18.1% 15.0%
0.006
$8,000-$13,999 254 71.8% 14.8% 13.4%
$14,000-$19,999 300 69.0% 16.7% 14.3%
$20,000-$39,999 1 110 71.8% 18.7% 9.5%
$40,000 or above 1 485 73.7% 16.4% 9.8%

Behavioural Risk Factor Survey April 2016
Page 108 of 127
4.9.7 Level of agreement to “Cancer screening may be done without a doctor's
instruction or advice” (Incorrect statement)
Level of agreement to “Cancer screening may be done without a doctor‟s instruction or
advice” is associated significantly with the respondents‟ gender, educational attainment and
occupation.
Male respondents (17.3%) and service/shop sales workers (19.2%) or blue collar workers
(20.0%) were more likely to strongly agree/agree to the statement that “Cancer screening
may be done without a doctor's instruction or advice”. The lower the educational
attainment of the respondents, the more likely that they strongly agreed/agreed to the
statement (Table 4.9.7).
Table 4.9.7: Level of agreement to “Cancer screening may be done without a doctor's
instruction or advice” (Section 8: Q1h)
Variable Level Base
Strongly
agree/
Agree
Strongly
disagree/
Disagree
Don't
know
p-value
Chi-square
test
Kruskal-
Wallis test
Gender Male 1 899 17.3% 79.2% 3.5%
0.009 Female 2 171 13.9% 82.9% 3.2%
Educational
attainment
Primary or below 268 20.4% 75.4% 4.2%
0.025
Lower secondary (S1-S3) 524 18.5% 78.0% 3.5%
Upper secondary (S4-S6)/
Matriculation 1 405 15.4% 82.0% 2.6%
Tertiary (Non-degree,
degree or above) 1 863 14.1% 82.3% 3.6%
Occupation
Managerial/Professional
worker 1 204 13.9% 82.5% 3.6%
0.011
Clerk 587 12.9% 83.5% 3.6%
Service/Shop sales worker 410 19.2% 78.5% 2.3%
Blue collar worker 455 20.0% 76.1% 3.9%
Not working 1 331 15.8% 81.3% 2.8%

Behavioural Risk Factor Survey April 2016
Page 109 of 127
Chapter 5 Conclusion and Recommendations
5.1 Conclusion
5.1.1 Weight Status, Control and Perception
According to the locally adapted classification of weight status for Chinese adults in Hong
Kong, about half (51.5%) of the respondents were classified as “normal”, 18.5% as
“overweight” and 21.1% as “obese”, while the remaining 8.8% were classified as
“underweight”.
Regarding respondents‟ self-perceived current weight status, about half (50.3%) of the
respondents perceived themselves as “just right”, 41.9% considered themselves as
“overweight”, and 7.8% considered themselves as “underweight”. Overall, 67.6% of the
respondents perceived their weight status in a way consistent with the locally adapted
classification, while 17.8% of the respondents overestimated and 14.5% underestimated
their weight status.
5.1.2 Physical Activity and Leisure-time Exercise
During the seven days prior to the survey, more than half (55.4%) and over two-fifths
(43.1%) of the respondents had not engaged in any vigorous and moderate physical
activity for at least 10 minutes a day respectively. On the other hand, close to three-
quarters (71.9%) of the respondents had spent at least 10 minutes on walking every day
during the seven days prior to the survey.
Overall, more than two-fifths (43.8%) of the respondents‟ level of physical activity met the
WHO‟s recommended physical activity level for adults. Over one-third (37.7%) of the
respondents reported they exercised one to three times a week in their leisure-time.
5.1.3 Fruit and Vegetable Consumption
While about half (50.2%) of the respondents had eaten fruit every day, about four-fifths of
the respondents (80.3%) had eaten vegetables daily. Regular fruit or vegetable juice
consumption was found to be uncommon amongst respondents - 2.0% of the respondents
drank fruit or vegetable juice daily.
Excluding fruit or vegetable juice, the average (mean) daily intake of fruit and vegetables
by the respondents was 3.4 servings. About one-fifth (20.5%) of the respondents had a
daily intake of 5 or more servings of fruit and vegetables.

Behavioural Risk Factor Survey April 2016
Page 110 of 127
5.1.4 Meat Consumption
During the thirty days prior to the survey, respondents on average consumed 2.7 taels of
red meat and 2.1 taels of white meat per day. Overall, about a quarter (25.2%) of
respondents consumed more than 6 taels of meat on average per day and 48.5% of
respondents consumed less than 4 taels of meat per day. It was also found that 10.4% of
respondents had consumed processed meat on four or more days per week on average
during the thirty days prior to the survey.
5.1.5 Smoking Pattern
About one-tenth (10.9%) of the respondents were current smokers at the time of this
survey. Among the current smokers, the vast majority (95.9%) were daily smokers and
almost half (47.1%) of them reported smoking at least 11 cigarettes a day.
5.1.6 Pattern of Alcohol Consumption
During the past year prior to the survey, about seven-tenths (70.5%) of the respondents
reported having drunk at least one alcoholic drink. While about two-fifths (40.0%) of these
drinkers drank less than monthly, 4.0% drank daily.
Among those who had drunk alcohol during the past year prior to the survey, more than a
quarter (27.4%) reported that they had engaged in binge drinking (drinking 5 or more
glasses/cans of alcohol on one occasion) during the past year prior to the survey.
5.1.7 Cervical Cancer Screening (for female respondents only)
Nearly two-thirds (63.4%) of the female respondents reported that they had a cervical
smear before.
Among those female respondents who had a cervical smear before, about two-thirds
(66.6%) had a cervical smear at a regular interval. Among those who had cervical smears
regularly, 35.7% had the test once a year.
5.1.8 Awareness of Cancer Prevention and Screening
Over 90% of the respondents strongly agreed/agreed to the (correct) statements “Some
cancer cases can be prevented by adopting healthy lifestyle” and “Processed meat can
cause colorectal cancer”. Over 60% of the respondents strongly agreed/agreed to the
(correct) statements “Obesity is a risk factor for cancers” and “Cancer screening is to
conduct test on people who have no symptom”.
However, about two-fifths (41.6%) of them strongly disagreed/disagreed to the (correct)
statement “Alcohol is a human cancer-causing agent (carcinogen)” Furthermore, less than
one-fifth (17.1%) of them strongly disagreed/disagreed to the (correct) statement “Some
cancer screening tests have potential risks”.

Behavioural Risk Factor Survey April 2016
Page 111 of 127
5.2 Recommendations
Some recommendations based on the survey findings are suggested below:
1. The benefits of regular physical activity are well-known, such as improving
cardiorespiratory and muscular fitness, bone health and reducing the risk of
developing chronic diseases and depression. However, only about two-fifths of
respondents (43.8%) achieved the recommended amount of physical activities
suggested by the WHO. Thus, education about the health benefits and recommended
level of physical activities would continue be reinforced to facilitate the public to
engage in a more active lifestyle.
2. Diet rich in fruit and vegetables is associated with a reduced risk of developing major
non-communicable diseases, including cardiovascular diseases, type 2 diabetes and
certain cancers. However, the survey found that only about one-fifth (20.5%) of the
respondents had a daily average intake of 5 or more servings of fruit and vegetables.
Health promotion campaigns would continue be strengthened to educate the public
about health benefits of at least 5 servings of fruit and vegetable intake a day and to
encourage the public to consume more fruits or vegetables.
3. More than a quarter (27.4%) of the respondents who had drunk alcohol during the
past year prior to the survey reported that they had engaged in binge drinking
(drinking 5 or more glasses/cans of alcohol on one occasion). However, about two-
fifths (41.6%) of respondents strongly disagreed/disagreed to the (correct) statement
“Alcohol is a human cancer-causing agent (carcinogen)”. Information of the harms of
alcohol use, and in particular those of binge drinking, would continue be publicised
and educate the public to quit drinking or drink less.
4. Regarding the awareness of cancer screening, about two-fifths (44.8%) of the
respondents strongly disagreed/disagreed to the (incorrect) statement “Cancer
screening results are 100% accurate” and less than one-fifth (17.1%) of them strongly
disagreed/disagreed to the (correct) statement “Some cancer screening tests have
potential risks”. More education about cancer screening would continue be introduced
to help the public understand about both strengths and limitations of cancer screening.

Behavioural Risk Factor Survey April 2016
Page 112 of 127
5.3 Limitations
1. Although the data were weighted by the distribution of age, gender and type of
living quarters in order to correct for over- or under-representation of all groups in
the population, the data were not weighted for the number of eligible respondents in
a household and the number of phones in a household, or to account directly for
non-response.
2. The use of the „Next Birthday‟ rule to select respondent when there is more than one
eligible respondent resided in a household by the time of the telephone contact
cannot cover people who are always not at home in the evening and weekends.
3. A household telephone survey, by definition, excludes the institutionalised
population and households without fixed line telephones, so the findings cannot be
generalised to these sub-populations. However, as the fixed line telephone coverage
in households is still around 80%, a household telephone survey should only exclude
a small proportion of households.
4. The response rate is unsatisfactory. The possible reason was that there was still
under the impact of telephone deceptions that reduced people‟s willingness in taking
part in this telephone survey.
5. The survey relied on self-reported data and had certain limitations.
i. Respondents might not be willing to disclose to interviewers and
deliberately under-report those behaviours that are socially undesirable or
considered as unhealthy (such as binge drinking). Conversely, respondents
might over-report those behaviours that are considered desirable.
ii. Self-reporting behaviour or practices are also subject to recall bias and
recall error. However, the recall period was kept quite short in this survey
which should reduce such bias.
6. Finally, this was a cross-sectional study. The causal or time relationship between
various factors could not be identified.

Behavioural Risk Factor Survey April 2016
Page 113 of 127
Annex Survey Questionnaire
Behavioural Risk Factor Survey 2016
Introduction
Hello! My name is __________, an interviewer from the Social Sciences Research Centre
of the University of Hong Kong (SSRC). We are commissioned by the Department of
Health to conduct a questionnaire survey to assess the public‟s awareness of healthy living.
Questions related to your personal health and the risks of diseases will be asked. All the
information provided by you will be kept strictly confidential and for collective analysis
only. This survey will take approximately 15 minutes to complete. You can choose to
terminate the interview at any time without negative consequences. If you have any queries
on this survey, you can call the (SSRC) at phone number: 3917-1600 during office hours
between 9 am and 6 pm. If you have questions about your rights as a research participant,
please contact the Human Research Ethics Committee for Non-Clinical Faculties of the
University of Hong Kong at 2241-5267.
Respondent selection
[S1] Telephone No.: __________________
[S2] Interviewer No.: __________________
Because we are choosing a respondent randomly, please tell me how many household
members aged 18-64 years are there at home right now? (Members not at home and
foreign domestic helpers were excluded)
[S3]_______ Persons
Who is the one who will next have a birthday?
Could you pass the phone to him or her?
(Interviewer: if respondent questions, explain the “Next Birthday” rule: a method to select
respondent)

Behavioural Risk Factor Survey April 2016
Page 114 of 127
Section 1: Weight Status, Control and Perception
Q1a. Your height is?
______cm /or ______ ft ______ in
Q1b. Your weight is?
______ kg /or ______ lb
Q1c. Your waist circumference is?
______ cm /or ______ in
Q2. What do you think about your current weight; is it overweight, just right, or
underweight?
1. Overweight
2. Just right
3. Underweight

Behavioural Risk Factor Survey April 2016
Page 115 of 127
Section 2: Physical Activity and Leisure-time Exercise
Q1a. During the last 7 days, on how many days did you do vigorous physical activities?
Vigorous physical activities are those that make you breathe much harder and your
heart beat much faster than normal, e.g., running, aerobics, football, swimming,
heavy physical work, jogging, etc., and you did these activities for at least 10 minutes
at a time.
__________ Days
Q1b. [Only ask those whose answers in Q1a are greater than or equal to “1”]
On those days that you have performed vigorous physical activities for at least 10
minutes, how much time on average per day did you usually spend doing vigorous
physical activities?
_________ Minutes
Q2a. During the last 7 days, on how many days did you do moderate physical activities?
Moderate physical activities are those that make you breathe somewhat harder and
your heart beat somewhat faster than normal, e.g., bicycling, washing cars/polishing,
fast walking, cleaning windows, etc. and you did these activities for at least 10
minutes at a time.
__________ Days
Q2b. [Only ask those whose answers in Q2a are greater than or equal to “1”]
On those days that you have performed moderate physical activities for at least 10
minutes, how much time on average per day did you usually spend doing moderate
physical activities?
___________ Minutes
Q3a. During the last 7 days, on how many days did you walk for at least 10 minutes at a
time? This includes walking to offices/schools, walking to travel from place to place,
and walking for leisure.
_____________ Days
Q3b. [Only ask those whose answers in Q3a are greater than or equal to “1”]
On those days that you have walked for at least 10 minutes at a time, how much time
on average did you usually spend walking in one of those days?
__________ Hours ___________ Minutes

Behavioural Risk Factor Survey April 2016
Page 116 of 127
Q4. During the last 7 days, how much time on average did you usually spend sitting on a
weekday? This includes time spent sitting at work, at home or other places, visiting
friends, traveling on public transport, reading and lying down to watch television.
(Interviewer‟s prompts: If the respondent cannot answer the daily average time, then
say: Please try to make an estimate as accurate as possible.)
_________Hours __________ Minutes
Q5. During the past 30 days, how often did you exercise in your leisure time, which at
least made you breathe somewhat harder than normal and sweat?
1. Once or more a day
2. 4-6 times/week
3. 2-3 times/week
4. Once a week
5. 2-3 times a month
6. Once a month
7. Less than once a month
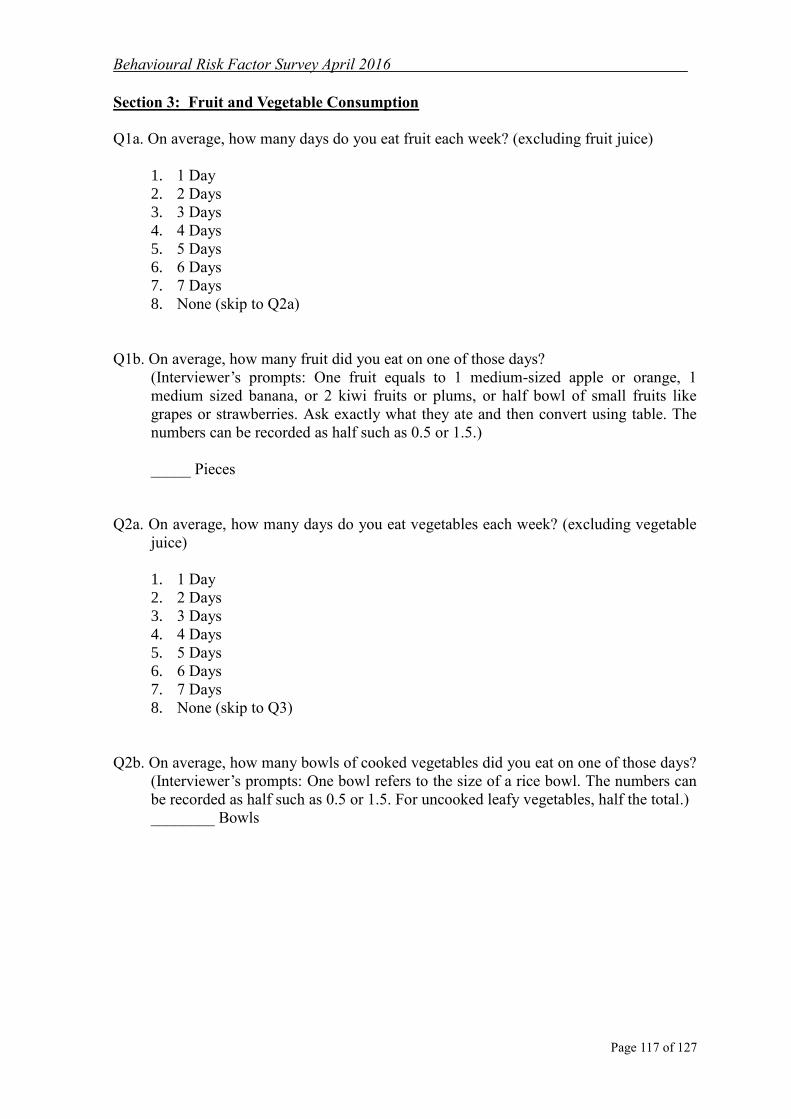
Behavioural Risk Factor Survey April 2016
Page 117 of 127
Section 3: Fruit and Vegetable Consumption
Q1a. On average, how many days do you eat fruit each week? (excluding fruit juice)
1. 1 Day
2. 2 Days
3. 3 Days
4. 4 Days
5. 5 Days
6. 6 Days
7. 7 Days
8. None (skip to Q2a)
Q1b. On average, how many fruit did you eat on one of those days?
(Interviewer‟s prompts: One fruit equals to 1 medium-sized apple or orange, 1
medium sized banana, or 2 kiwi fruits or plums, or half bowl of small fruits like
grapes or strawberries. Ask exactly what they ate and then convert using table. The
numbers can be recorded as half such as 0.5 or 1.5.)
_____ Pieces
Q2a. On average, how many days do you eat vegetables each week? (excluding vegetable
juice)
1. 1 Day
2. 2 Days
3. 3 Days
4. 4 Days
5. 5 Days
6. 6 Days
7. 7 Days
8. None (skip to Q3)
Q2b. On average, how many bowls of cooked vegetables did you eat on one of those days?
(Interviewer‟s prompts: One bowl refers to the size of a rice bowl. The numbers can
be recorded as half such as 0.5 or 1.5. For uncooked leafy vegetables, half the total.)
________ Bowls

Behavioural Risk Factor Survey April 2016
Page 118 of 127
Q3. On average, how many days in the week do you drink at least one cup of fruit or
vegetable juice? “Juice” refers to freshly squeezed juice or those that are labelled
100% or pure fruit/vegetable juice. A cup means 250 ml in volume or a standard-sized
tetra pack of juice drink.
1. 1 Day
2. 2 Days
3. 3 Days
4. 4 Days
5. 5 Days
6. 6 Days
7. 7 Days
8. None

Behavioural Risk Factor Survey April 2016
Page 119 of 127
Section 4: Meat Consumption
Q1a. In the past 30 days, how many days on average did you eat red meat each week?
Common examples of red meat include pork, beef, and lamb.
1. Daily
2. 6 days per week
3. 5 days per week
4. 4 days per week
5. 3 days per week
6. 2 days per week
7. 1 day per week
8. Less than 1 day per week
Q1b. [Only ask those who answers “1” to “7” in Q1a]
Taking only the days you had eaten red meat into account, on average, how many
taels / slices of red meat about the size of a mah-jong tile did you eat in one day?
(Interviewer‟s prompts: A tael of meat also equates to 40 grams, 1.33 ounces or 4
slices, and 1 pound is equivalent to 12 taels. The numbers can be recorded as half
such as 0.5 or 1.5 taels.)
_______ Taels
Q2a. In the past 30 days, how many days on average did you eat white meat each week?
Common examples of white meat include poultry and fish.
1. Daily
2. 6 days per week
3. 5 days per week
4. 4 days per week
5. 3 days per week
6. 2 days per week
7. 1 day per week
8. Less than 1 day per week
Q2b. [Ask those who answers “1” to “7” in Q2a]
Taking only the days you had eaten white meat into account, on average, how many
taels / slices of white meat about the size of a mahjong tile did you eat in one day?
(Interviewer‟s prompts: A tael of meat also equates to 40 grams, 1.33 ounces or 4
slices, and 1 pound is equivalent to 12 taels. The numbers can be recorded as half
such as 0.5 or 1.5 taels.)
_______ Taels

Behavioural Risk Factor Survey April 2016
Page 120 of 127
Q3. In the past 30 days, how many days on average did you eat processed meat each
week? They include canned meat, cured meat or smoked meat, such as luncheon
meat, ham, sausages, bacon and Chinese preserved meat.
1. Daily
2. 6 days per week
3. 5 days per week
4. 4 days per week
5. 3 days per week
6. 2 days per week
7. 1 day per week
8. Less than 1 day per week

Behavioural Risk Factor Survey April 2016
Page 121 of 127
Section 5: Smoking Pattern
Q1. Have you ever smoked before? (Interviewer: read out the answers one by one)
1. Yes, but not now
2. Yes, and still smoking (skip to Q3a)
3. Never (skip to next section)
Q2. How long have you stopped smoking? (Interviewer: read out the answers one by one)
1. Less than 1 month (skip to next section)
2. 1 month to 1 year (skip to next section)
3. More than 1 year (skip to next section)
Q3a. How many cigarettes do you smoke on average per day? (Interviewer: Do not read
out the answers)
1. Less than 1 per day
2. 1-10 per day
3. 11-20 per day
4. More than 20 per day
Q3b. In the next 6 months, are you planning to quit smoking or smoke less?
1. Yes, plan to quit smoking
2. Yes, plan to smoke less
3. No plan to change
4. Not sure/Don‟t know

Behavioural Risk Factor Survey April 2016
Page 122 of 127
Section 6: Pattern of Alcohol Consumption
Q1a. During the past year, did you have a drink containing alcohol?
1. Yes (skip to Q2a)
2. No
Q1b. In the next 6 months, will you have a drink containing alcohol?
1. Yes (skip to next section)
2. No (skip to next section)
3. Not sure/Don‟t know (skip to next section)
Q2a. How often do you have a drink containing alcohol?
1. Less than monthly
2. Once a month
3. 2 to 3 times a month
4. Once a week
5. 2 times a week
6. 3 times a week
7. 4 times a week
8. 5 times a week
9. 6 times a week
10. Once a day
Q2b. On a typical day when you are drinking, what type of drinks containing alcohol and
how much do you have?
(Interviewer: please make reference of the following pictures for calculating the
number of drinks appropriately. One unit equals to 10 grams of ethanol.)

Behavioural Risk Factor Survey April 2016
Page 123 of 127
Beer
Red/White
wine
Spirit Rice wine Shorgum Sake
1 can
~330 ml
1 pint
~568 ml
Half pint
~284 ml
1 glass
~180 ml
1 glass
~125 ml
1 peg
~40-50
ml
1shot
~22 ml
1 glass
~180 ml
1 small
glass
~ 20 ml
1 small
glass
~20 ml
1 small
glass
~20ml
( ) can/
( ) glass
( ) glass
( ) glass
( ) glass
( ) glass
( ) glass
( ) glass
( ) glass
( ) glass
( ) glass
1.3
units
2.2
units
1.1
units
0.7
units
1.2
units
1.3
units
0.7
units
5.7
units
0.6
units
0.8
units
0.3
units
_______ Units of drinks
Q2c. How often do you have at least 5 or more drinks on one occasion? That means the
total number of glasses and cans of any type of alcohol, and one occasion means
period of a few hours.
1. Never
2. Less than monthly
3. Once a month
4. 2 times a month
5. 3 times a month
6. Once a week
7. 2-3 times a week
8. 4-6 times a week
9. Daily or almost daily
Q2d. In the next 6 months, are you planning to change your drinking habit?
1. Yes, plan to drink more
2. Yes, plan to drink less
3. Yes, plan to stop drinking completely
4. No plan to change
5. Not sure/Don‟t know
Behavioural Risk Factor Survey April 2016
Page 124 of 127
Section 7: Cervical Cancer Screening (for female respondents only)
Q1a. Have you ever had a cervical smear before?
1. Yes
2. No (skip to Q2)
3. Not sure (skip to Q2)
Q1b. About how long ago did you have the last cervical smear? (Interviewer: Do not read
out the answers)
1. Within 12 months
2. 13-24 months
3. 25-36 months
4. 37-48 months
5. 49-60 months
6. 61 months or above
7. Cannot remember
Q1c. Do you have your cervical smear at a regular interval?
1. Yes, at a regular interval
2. No, not at a regular interval (skip to Q2)
Q1d. If regular, how often do you have cervical smear?
1. More than once a year
2. Once a year
3. Once every 2 years
4. Once every 3 years
5. Once every 4 years
6. Once every 5 years
7. Once every 6-10 years
8. Less frequent than once every 10 years
9. Cannot say/remember
Q2. Have you had a total hysterectomy (surgical removal of the entire uterus) before?
1. Yes
2. No

Behavioural Risk Factor Survey April 2016
Page 121 of 127
Section 8: Awareness of Cancer Prevention and Screening
Q1.The following statements are related to cancer prevention and screening. Please state
how much you agree or disagree with each one.
(Interviewer: Please offer the first four options of “Strongly agree”, “Agree”,
“Disagree” and “Strongly disagree”, and then read out the statements one by one. Do
not prompt the option of “Don‟t Know”.)
a. Some cancer cases can be
prevented by adopting
healthy lifestyle.
Strongly
agree
Agree
Disagree
Strongly
disagree
Don‟t
Know
b. Alcohol is a human cancer-
causing agent (carcinogen).
Strongly
agree
Agree
Disagree
Strongly
disagree
Don‟t
Know
c. Processed meat can cause
colorectal cancer.
Strongly
agree
Agree
Disagree
Strongly
disagree
Don‟t
Know
d. Obesity is a risk factor for
cancers.
Strongly
agree
Agree
Disagree
Strongly
disagree
Don‟t
Know
e. Cancer screening is to
conduct test on people who
have no symptom.
Strongly
agree
Agree
Disagree
Strongly
disagree
*Don‟t
Know*
* After Q1e, Interviewer explains the meaning of cancer screening: Cancer screening
means offering test for those without symptoms to detect cancer or to find people at
increased risk of developing cancer, for early treatment and hence better treatment
outcome.
f. Cancer screening results are
100% accurate.
Strongly
agree
Agree
Disagree
Strongly
disagree
Don‟t
Know
g. Some cancer screening tests
have potential risks.
Strongly
agree
Agree
Disagree
Strongly
disagree
Don‟t
Know
h. Cancer screening may be done
without a doctor's instruction
or advice.
Strongly
agree
Agree
Disagree
Strongly
disagree
Don‟t
Know
Behavioural Risk Factor Survey April 2016
Page 122 of 127
Q2. Through what promotional channels (e.g. media channel, advertisement location,
internet site or physical media) do you usually get health information on cancer?
(Interviewer: Do not read out answers. A maximum of three answers are allowed.)
(Please note that health professionals or relatives and friends are not considered as
promotional channels.)
1. Television Yes No
2. Outdoor billboards Yes No
3. Roadside banners Yes No
4. Advertisements inside MTR stations or trains Yes No
5. Advertisements on the bodies of trams Yes No
6. Advertisements on the bodies of buses Yes No
7. Stickers on the seats of buses Yes No
8. Radio Yes No
9. Bus Roadshow Yes No
10. Newspapers (printed version) Yes No
11. Newspapers (online version) Yes No
12. Magazines (printed version) Yes No
13. Magazines (online version) Yes No
14. Posters Yes No
15. Internet websites Yes No
16. You Tube Yes No
17. Facebook Page Yes No
18. Mobile Apps Yes No
19. Booklets / Pamphlets Yes No
20. Video CD / DVD Yes No
21. Talks Yes No
22. Exhibitions Yes No
23. Other channels
(a) __________________
(b) __________________
(c) __________________
Yes No

Behavioural Risk Factor Survey April 2016
Page 123 of 127
Section 9: Use of Mobile Phone
Q1. Do you currently use a mobile phone?
1. Yes
2. No (skip to Next Section)
Q2. How many mobile phone numbers in total which you are using personally and would
usually answer?
_________
Q3. Of all the telephone calls that you received on your residential telephone and mobile
phone, what percentage, between 1 and 100 are received on your mobile phone?
_________

Behavioural Risk Factor Survey April 2016
Page 124 of 127
Section 10: Demographic Characteristics
Q1. Record the gender
1. Male
2. Female
Q2. What is your age?
________ Years
Q3. What is your highest educational attainment? (Interviewer: read out the answers one
by one)
1. Primary or below
2. Lower secondary (S1-S3)
3. Upper secondary (S4-S6) / Matriculation
4. Tertiary (Non-degree, degree or above)
5. Refuse to answer
Q4. What is your marital status? (Interviewer: read out the answers one by one)
1. Never married
2. Married and with child(ren)
3. Married and without child
4. Divorced or Separated
5. Widowed
6. Refuse to answer
Q5a. Are you currently engaged in a job?
1. Yes
2. No (skip to Q5c)

Behavioural Risk Factor Survey April 2016
Page 125 of 127
Q5b. What is your occupation? (Interviewer: record the details of occupation)
1. Employer/Manager/Administrator
2. Professional
3. Associate Professional
4. Clerk
5. Service worker
6. Shop sales worker
7. Skilled agricultural/fishery worker
8. Craft and related worker
9. Plant and machine operator and assembler
10. Un-skilled worker
11. Other (Please specify : __________ )
Q5c. You are a … (Interviewer: read out the answers one by one)
1. Student
2. Homemaker
3. Unemployed person
4. Retired person
5. Others (Please specify________)
Q6. How much is your monthly personal income, including all sources of income?
1. None
2. $1-1,999
3. $2,000-3,999
4. $4,000-5,999
5. $6,000-7,999
6. $8,000-9,999
7. $10,000-11,999
8. $12,000-13,999
9. $14,000-15,999
10. $16,000-17,999
11. $18,000-19,999
12. $20,000-24,999
13. $25,000-29,999
(skip to Q7)
(skip to Q6)
Behavioural Risk Factor Survey April 2016
Page 126 of 127
14. $30,000-34,999
15. $35,000-39,999
16. $40,000-44,999
17. $45,000-49,999
18. $50,000 or above
19. Refuse to answer
Q7. How much is your monthly household income, including all sources of income?
1. Less than $2,000
2. $2,000-3,999
3. $4,000-5,999
4. $6,000-7,999
5. $8,000-9,999
6. $10,000-11,999
7. $12,000-13,999
8. $14,000-15,999
9. $16,000-17,999
10. $18,000-19,999
11. $20,000-24,999
12. $25,000-29,999
13. $30,000-34,999
14. $35,000-39,999
15. $40,000-44,999
16. $45,000-49,999
17. $50,000-54,999
18. $55,000-59,999
19. $60,000 or above
20. Don‟t know
21. Refuse to answer
Behavioural Risk Factor Survey April 2016
Page 127 of 127
Q8. What is the type of your living quarter?
1. Public rental flats
2. Housing Authority subsidised sale flats
3. Housing Society subsidised sale flats
4. Private residential flats
5. Villas/Bungalows/Modern village houses
6. Simple stone structures/Traditional village houses
7. Staff quarters
8. Non-domestic quarters
9. Refuse to answer
END


![WELCOME [redchairnetworking.com] · The (apparent) importance of STP ... This tells us that 47% of respondents who drank Pepsi, also drank Coke. Luxury Fashion Brands % who also bought](https://img.pdfslide.us/doc/110x75/5af8c37a7f8b9aac248d8f57/welcome-apparent-importance-of-stp-this-tells-us-that-47-of-respondents.jpg)