Embed Size (px)
Citation preview
Flexural Behaviour of Stay-in-Place PVC Encased
Reinforced Concrete Walls with Various Panel Types
by
Benjamin Donald Scott
A thesis
presented to the University of Waterloo
in fulfillment of the
thesis requirement for the degree of
Masters of Applied Science
in
Civil Engineering
Waterloo, Ontario, Canada, 2014
©Benjamin Donald Scott 2014

ii
AUTHOR'S DECLARATION
I hereby declare that I am the sole author of this thesis. This is a true copy of the thesis, including any
required final revisions, as accepted by my examiners.
I understand that my thesis may be made electronically available to the public.
iii
Abstract
The use of stay-in-place (SIP) formwork has become an increasingly popular tool for
concrete structures, providing advantages in construction scheduling and labour reduction.
Stay-in-place formwork made of strong materials such as fibre reinforced polymer (FRP) and
steel have proven to supplement and even replace reinforcement in concrete elements. The
use of polyvinyl chloride (PVC) SIP formwork has also been explored. Current research
suggests that PVC provides an enhancement to reinforced concrete strength and ductility.
The research herein outlines tests on reinforced concrete walls with a compressive strength
25MPa, utilizing two types of PVC panels; flat or hollow, in order to further understand the
polymer’s contribution to flexural resistance. The PVC forming system consisted of panels
on the tension and compression faces with evenly spaced connectors securing the faces of the
wall. Variables studied included concrete core thickness (152 mm, 178 mm, and 203 mm),
reinforcing ratio (3-10M bars or 3-15M bars), and panel type (hollow or flat). The walls
were tested in four point bending. The concrete control walls failed due to steel yielding
followed by concrete crushing. The failure of the flat panel encased walls was dependent on
the reinforcing ratio. Wall reinforced with 10M bars and encased with flat panels failed due
to steel yielding followed by concrete crushing, PVC buckling, and PVC rupture while walls
with 15M bars did not experience PVC rupture. Finally the failure for walls encased in
hollow panels was due to steel yielding, followed by concrete crushing and PVC buckling.
The hollow panel encased specimens also experienced slip of the panels on the tensile face.
iv
The PVC encasement enhanced the yield load, ultimate load, ductility, and toughness of
the concrete walls. For flat panel encased walls, the average improvement at yield and
ultimate loads were 21% and 27% respectively. Hollow panel encased walls recorded
average yield and ultimate load improvements of 8% and 27% respectively. Flat panel
encased walls improved ductility by an average of 71% and toughness by 122%. Hollow
panel encased walls improved ductility by an average of 29% and toughness by 70%.
Concrete cores were taken from the tested PVC encased specimens and compressive strength
was found to be the same as the control walls.
An analytical model was developed to estimate the yield and ultimate load of PVC encased
concrete walls. Calculated yield loads were in good agreement with the experimental data,
with an average error of 8% for the control walls and 6% for the PVC encased walls. In
addition, calculated ultimate (peak) loads showed good correlation with the experimental
data. The average error for the control, flat panel and hollow panel encased walls were 3%,
3% and 8% respectively. Calculated and experimental PVC tensile strain values were in
good correlation at ultimate load conditions. The average error for the calculated PVC
tensile strain was 21%. With the proposed model providing results in good agreement with
the test data, other PVC encased wall cross-sections were explored. An “optimized” panel
layout was proposed that utilized flat panels on the compression side of the wall and hollow
panels on the tension side. This configuration of panels resulted in the greatest estimated
improvement at both yield and ultimate load levels.

v
Acknowledgements
First my deepest thanks to my late supervisor Dr. Khaled Soudki. His guidance, support,
care, and experience provide a foundation on which I have learned much. I am honored to
have known and worked with him and consider it a true honor to have been one of his
students. It is a blessing to carry on his legacy.
My deepest gratitude to Dr. Noran Abdel Wahab, a constant ally both in my lab work and
writing process. Her steadfast support, advice, and encouragement was a huge reason why
the work came to completion. My thanks as well to Dr. Adil Al-Mayah, who graciously
‘adopted’ me as a student during my time at Waterloo. His enthusiasm towards my research
and frequent availability made this unforeseen transition a smooth one. I am grateful for
each of the three supervisors I was able to work with.
My thanks to the Civil and Environmental Engineering structures lab technicians; Michael
Burgetz, Doug Hirst, Rob Sublan and Richard Morrison. Each of these men contributed to
my time in the lab, and I would not have had the success there without their support and
expertise.
To my peers in the department, thank you for friendship and support these past two (and in
some cases seven) years. My time at the University would have been a shadow of what I had
without your presence.
To my family, whose prayers and support in word and deed buoyed my spirit at all times.
And lastly, to God, the Author and creator of all things. I am continually left in awe of His
daily grace and love, may He receive glory in the work enclosed here.

vi
Dedication
To: Dad, Mom, Thomas, Jessica, and Erin
vii
Table of Contents
AUTHOR'S DECLARATION ............................................................................................................... ii
Abstract ................................................................................................................................................. iii
Acknowledgements ................................................................................................................................ v
Dedication ............................................................................................................................................. vi
Table of Contents ................................................................................................................................. vii
List of Figures ........................................................................................................................................ x
List of Tables ....................................................................................................................................... xiii
Chapter 1 : Introduction.......................................................................................................................... 1
1.1 Objectives and Scope ................................................................................................................... 2
1.2 Thesis Outline ............................................................................................................................... 3
Chapter 2 : Background and Literature Review ..................................................................................... 4
2.1 FRP Stay-in-Place Formwork....................................................................................................... 4
2.1.1 FRP Material ......................................................................................................................... 4
2.1.2 Behaviour of FRP-Formed Concrete Elements ..................................................................... 5
2.2 PVC Stay-in-Place Formwork ...................................................................................................... 9
2.3 Analytical Modelling of PVC SIP Formwork ............................................................................ 15
2.4 Research Needs .......................................................................................................................... 18
Chapter 3 : Experimental Program ....................................................................................................... 20
3.1 Test Program .............................................................................................................................. 20
3.2 PVC Stay-in-Place components and wall ................................................................................... 22
3.3 Specimen Fabrication ................................................................................................................. 24
3.3.1 Control Specimens ............................................................................................................... 24
3.3.2 PVC Encased Walls ............................................................................................................. 25
3.3.3 Casting and Curing .............................................................................................................. 28
3.4 Material Properties ..................................................................................................................... 29
3.4.1 Concrete ............................................................................................................................... 29
3.4.2 Steel ..................................................................................................................................... 32
3.4.3 Polyvinyl Chloride (PVC) ................................................................................................... 32
3.5 Instrumentation and Test Set-up ................................................................................................. 33
Chapter 4 : Experimental Test Results ................................................................................................. 36
4.1 Introduction ................................................................................................................................ 36
viii
4.2 Behaviour of the Control Specimens ......................................................................................... 36
4.2.1 Modes of Failure ................................................................................................................. 36
4.2.2 General Behaviour .............................................................................................................. 37
4.2.3 Flexural Behaviour .............................................................................................................. 37
4.3 Behaviour of PVC Encased Specimens with Flat Panels ........................................................... 45
4.3.1 Modes of Failure ................................................................................................................. 45
4.3.2 General Behaviour .............................................................................................................. 45
4.3.3 Flexural Behaviour .............................................................................................................. 46
4.4 Behaviour of PVC Encased Specimens with Hollow Panels ..................................................... 59
4.4.1 Modes of Failure ................................................................................................................. 59
4.4.2 General Behaviour .............................................................................................................. 59
4.4.3 Flexural Behaviour .............................................................................................................. 62
4.5 Effect of Panel Type (Hollow versus Flat) ................................................................................ 73
4.5.1 Wall Cross-Section Comparison ......................................................................................... 73
4.5.2 Flexural Behaviour .............................................................................................................. 75
4.5.3 Reduction of Wall Thickness .............................................................................................. 78
4.5.4 Hollow Panel Slip ............................................................................................................... 79
4.5.5 Damage Investigation of PVC Encased Walls .................................................................... 81
4.6 Effect of PVC Encasement on Concrete Strength...................................................................... 85
4.7 Summary from Experimental Test Program .............................................................................. 86
4.7.1 Modes of Failure ................................................................................................................. 86
4.7.2 Loads and Deflections ......................................................................................................... 87
4.7.3 Strains in the PVC Panel ..................................................................................................... 88
4.7.4 Effect of PVC Encasing on Concrete Strength ................................................................... 89
Chapter 5 : Analytical Investigation .................................................................................................... 90
5.1 Introduction ................................................................................................................................ 90
5.2 Assumptions of the Model ......................................................................................................... 90
5.3 Material Properties ..................................................................................................................... 91
5.3.1 Concrete .............................................................................................................................. 91
5.3.2 Steel..................................................................................................................................... 93
5.3.3 PVC ..................................................................................................................................... 94
5.4 Yield Load Analysis .................................................................................................................. 96
ix
5.4.1 Control Specimens ............................................................................................................... 96
5.4.2 PVC SIP Formed RC Specimens......................................................................................... 98
5.4.3 Comparison between Calculated and Experimental Yield Loads ..................................... 101
5.5 Ultimate Load Analysis ............................................................................................................ 103
5.5.1 Control Specimens ............................................................................................................. 103
5.5.2 PVC SIP Formed RC Specimens....................................................................................... 105
5.5.3 Comparison between Calculated and Experimental Ultimate Loads ................................ 107
5.6 Model Results with Modifications to Wall Cross-sections ...................................................... 114
5.6.1 Effect of the steel reinforcing depth on yield and ultimate loads for hollow panel walls . 114
5.6.2 Yield and Ultimate Load prediction with Optimized Panel Layout .................................. 117
5.7 Summary of Analytical Model Development ........................................................................... 120
Chapter 6 : Conclusions and Recommendations ................................................................................ 122
6.1 Experimental Work .................................................................................................................. 122
6.2 Analytical Work ....................................................................................................................... 124
6.3 Recommendations and Proposed Future Work ........................................................................ 125
References .......................................................................................................................................... 127
Appendix A Test Results .................................................................................................................... 129
x
List of Figures
Figure 1.1 Example of tank construction using SIP formwork .............................................................. 1
Figure 2.1: Element used in PVC SIP Formwork ................................................................................ 10
Figure 2.2: Load-deflection of PVC-encased plain concrete. (Chahrour et al. 2005) .......................... 11
Figure 2.3: Load-deflection of steel reinforced PVC-encased concrete. (Chahrour et al. 2005) ......... 12
Figure 2.4: PVC connector arrangements (Kuder et al. 2009) ............................................................. 14
Figure 2.5: Stress and strain distribution of PVC SIP cross-section. (Source: Wahab and Soudki
(2013)) ................................................................................................................................................. 18
Figure 3.1: Cross-sections and dimensions for the (a) control, (b) flat panel encased, and (c) hollow
panel encased wall specimens .............................................................................................................. 23
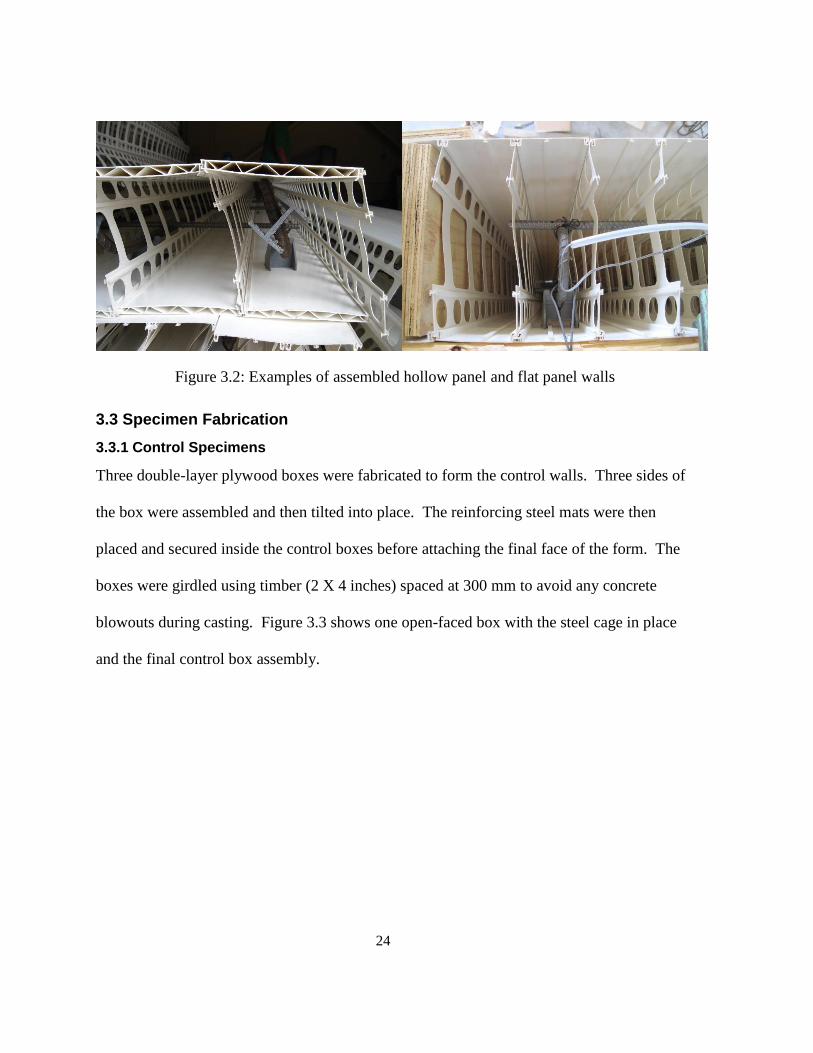
Figure 3.2: Examples of assembled hollow panel and flat panel walls................................................ 24
Figure 3.3: Placing the reinforcing steel inside control box; final assembly of the three control boxes
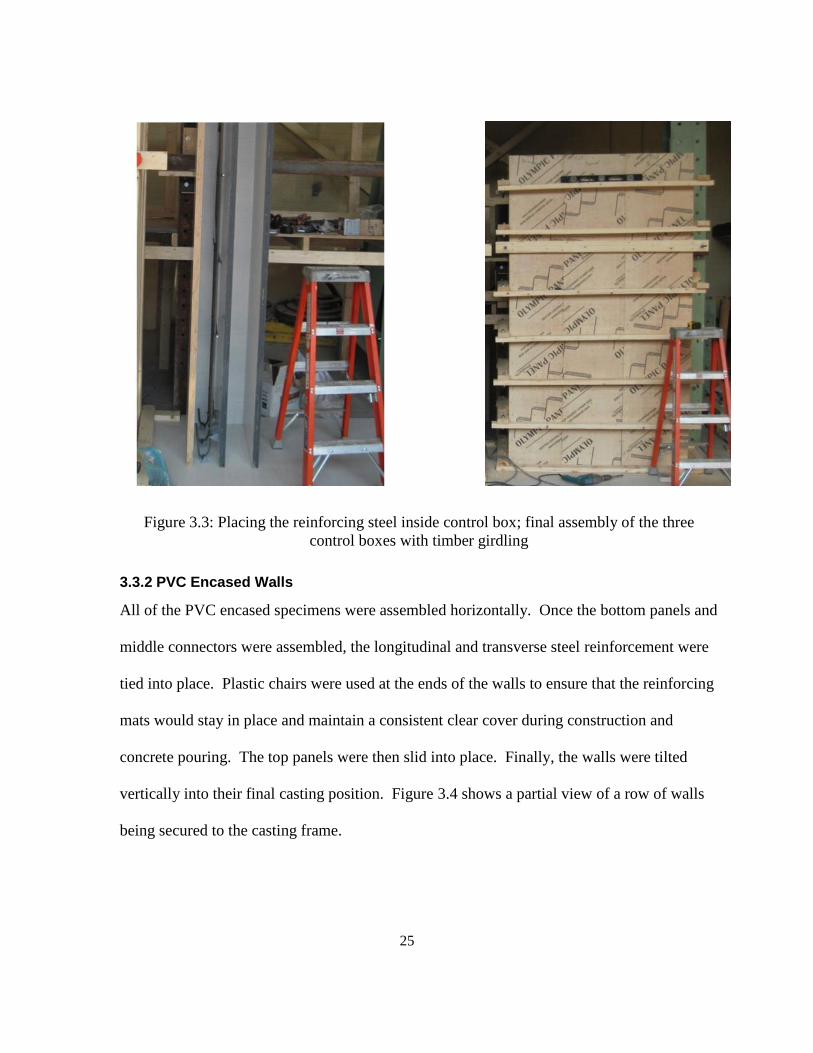
with timber girdling ............................................................................................................................. 25
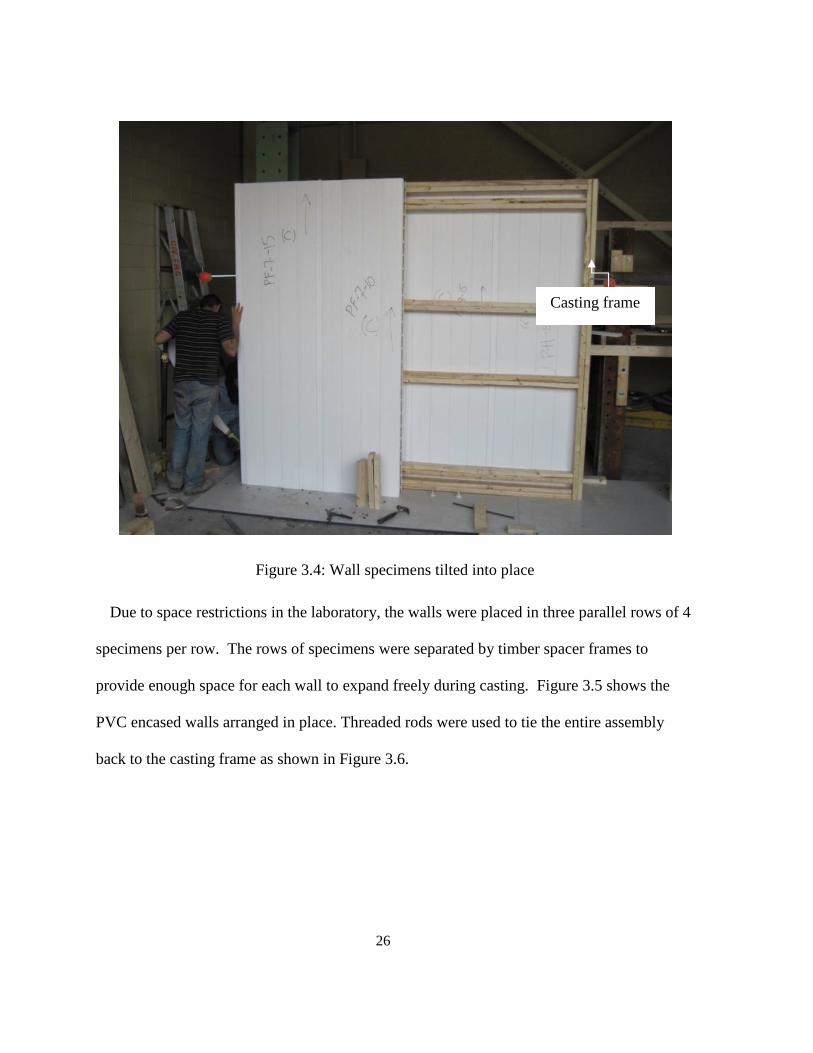
Figure 3.4: Wall specimens tilted into place ........................................................................................ 26
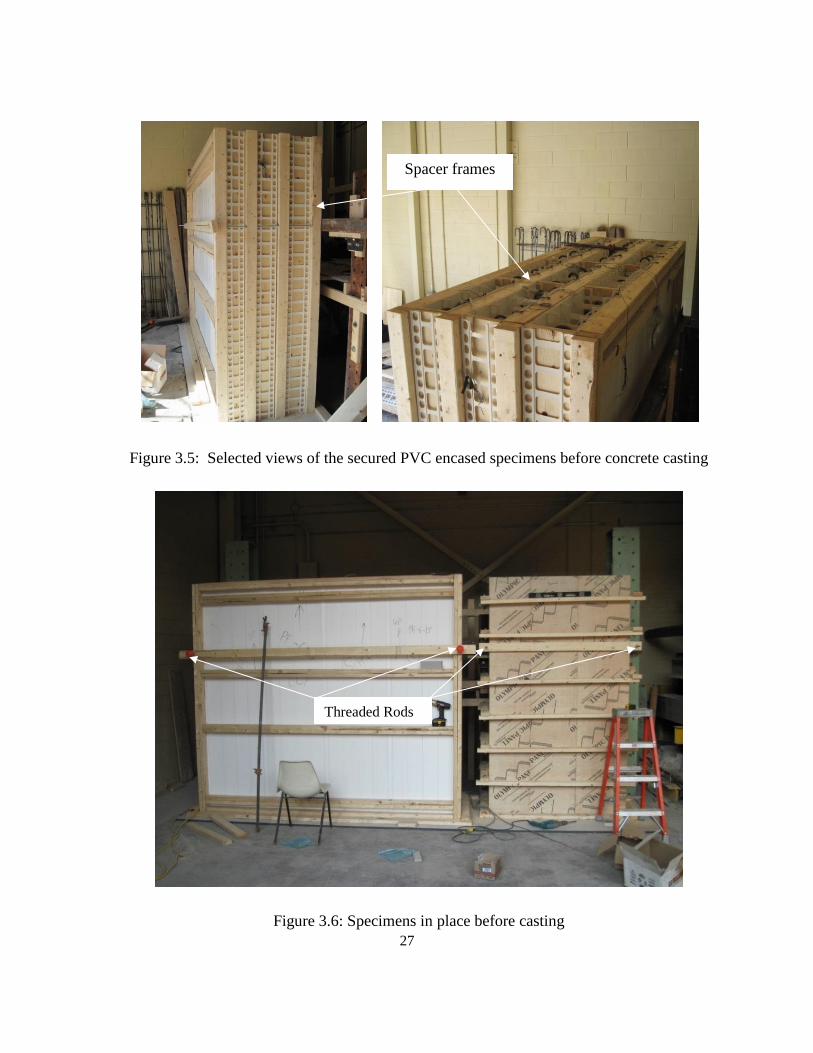
Figure 3.5: Selected views of the secured PVC encased specimens before concrete casting ............. 27
Figure 3.6: Specimens in place before casting ..................................................................................... 27
Figure 3.7: Casting using a chute and a conveyor belt ........................................................................ 28
Figure 3.8: Segregation present on control wall specimens ................................................................. 31
Figure 3.9: Example of patch material applied to concrete wall with segregation. ............................. 31
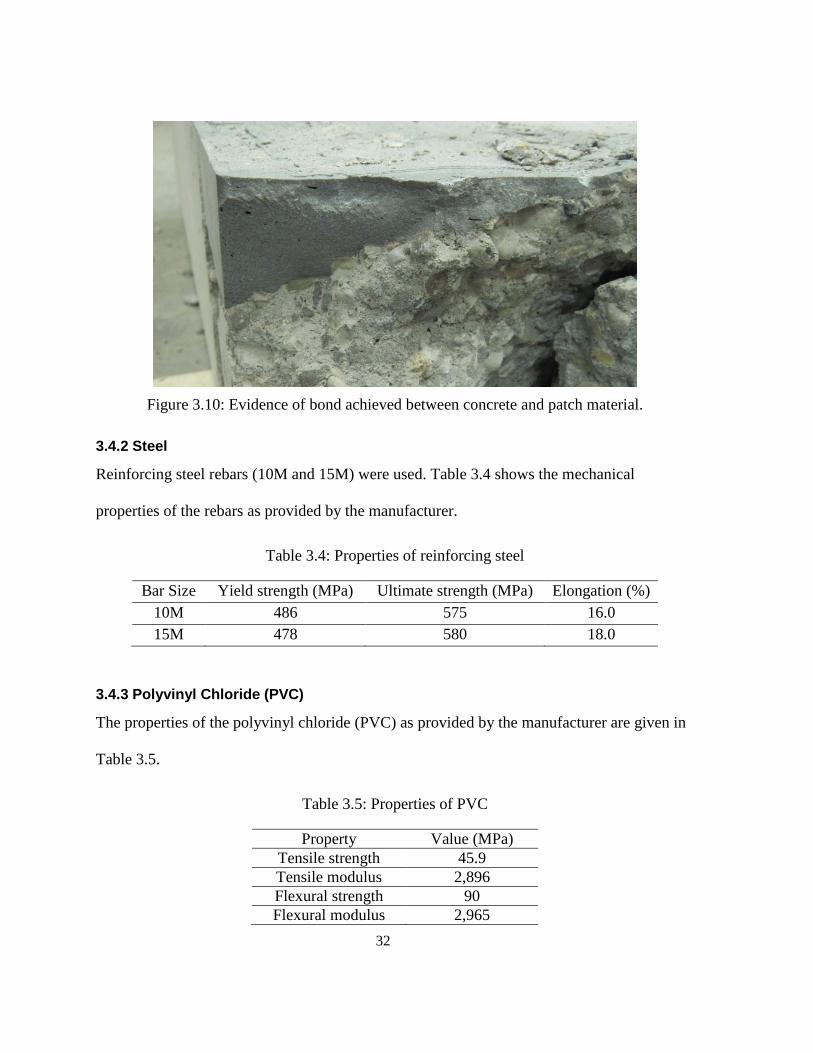
Figure 3.10: Evidence of bond achieved between concrete and patch material................................... 32
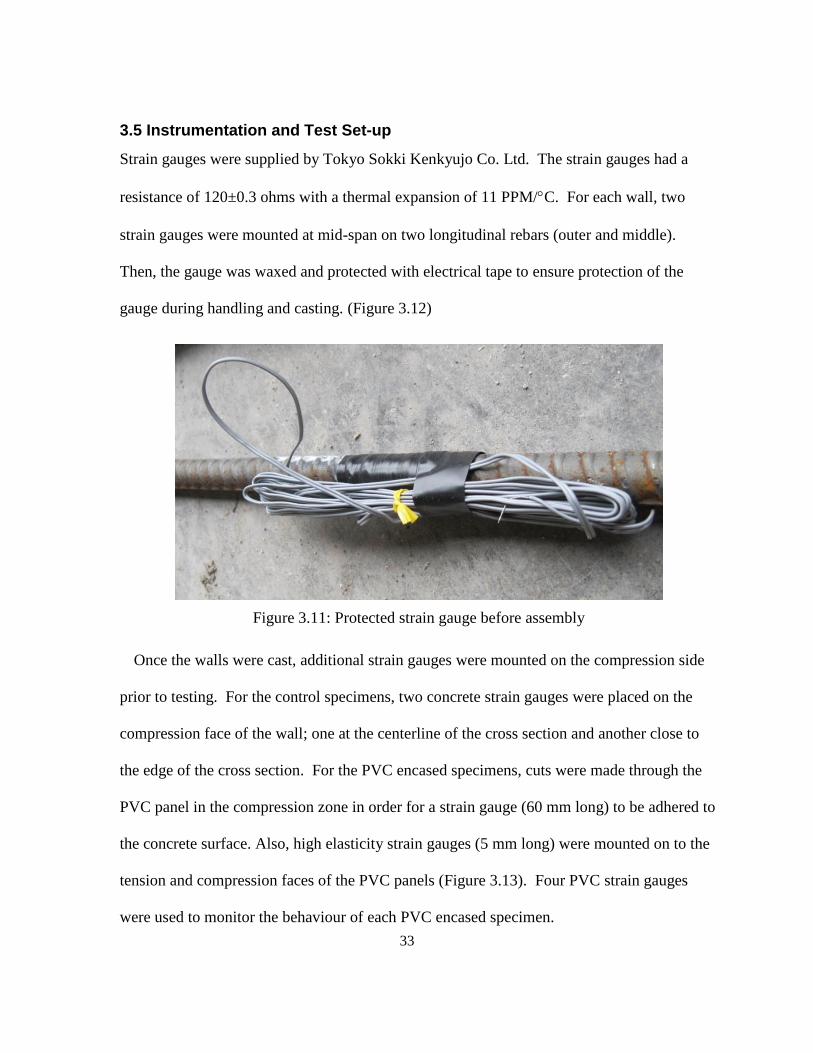
Figure 3.11: Protected strain gauge before assembly........................................................................... 33
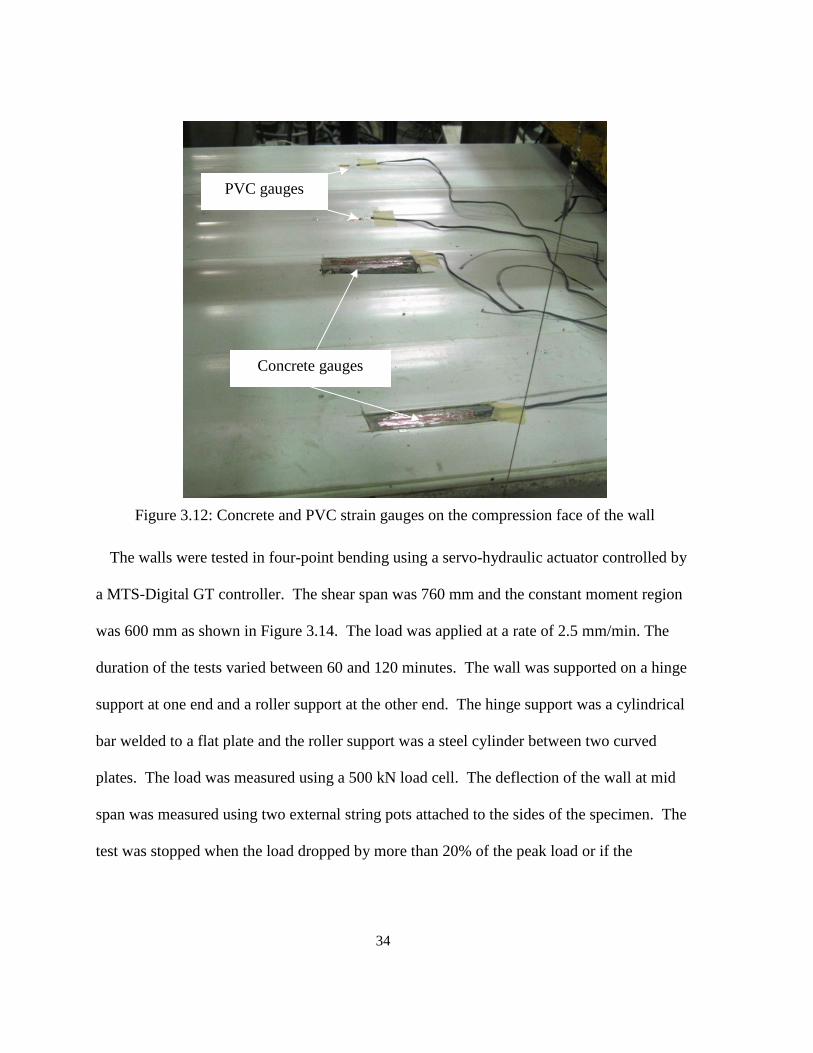
Figure 3.12: Concrete and PVC strain gauges on the compression face of the wall ........................... 34
Figure 3.13: Test set-up ....................................................................................................................... 35
Figure 4.1: Failure modes for control walls ......................................................................................... 36
Figure 4.2: Typical Load versus deflection for control specimens ...................................................... 38
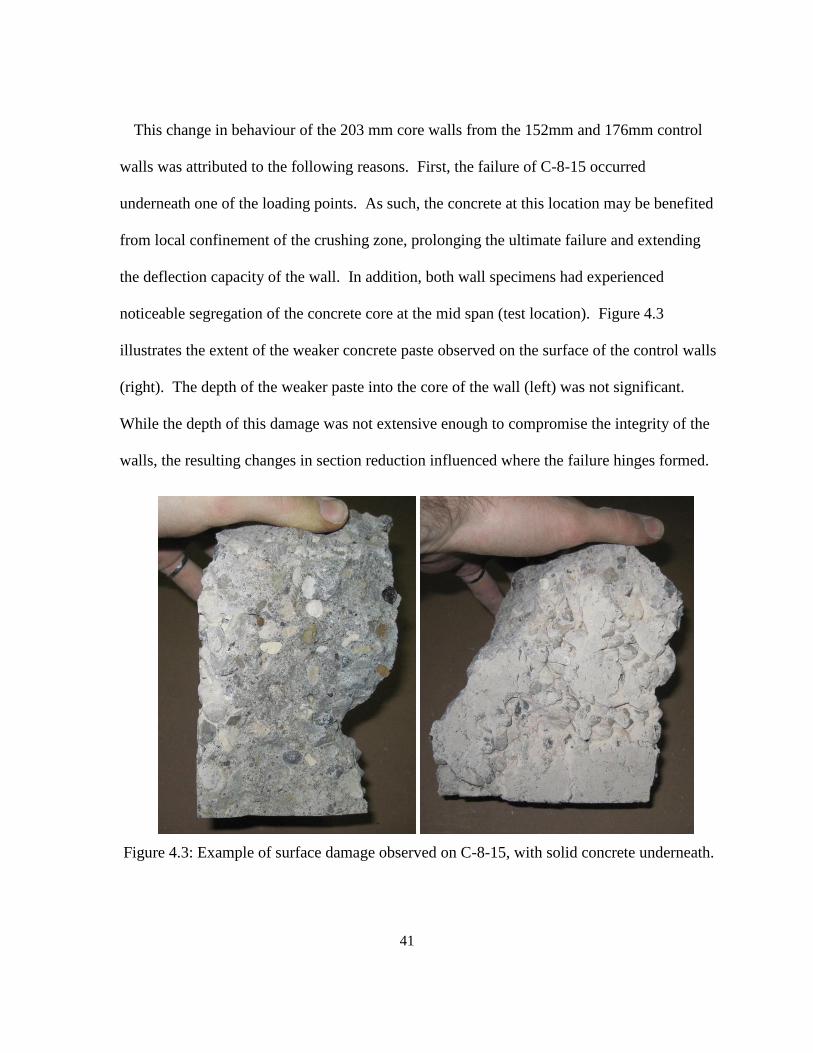
Figure 4.3: Example of surface damage observed on C-8-15, with solid concrete underneath. .......... 41
Figure 4.4: Load vs strain for C-6-10 and C-6-15 ............................................................................... 43
Figure 4.5: Strain profile for specimen C-6-15 .................................................................................... 44
Figure 4.6: Modes of failure for PVC encased walls with flat panels (PF) ......................................... 46
Figure 4.7: Load versus deflection curve for PF-6-10 and PF-6-15 .................................................... 47
xi
Figure 4.8: Load versus deflection curves for PVC encased walls with flat panels and their equivalent
control walls (C-6-10 & C-6-15) .......................................................................................................... 48
Figure 4.9: Load versus tensile strain for flat panel wall (PF-7-10) ..................................................... 55
Figure 4.10: Strain versus mid span deflection (PF-7-10) .................................................................... 55
Figure 4.11: Load versus compressive strain () (PF-7-10) ............................................................... 57
Figure 4.12: Load versus deflection behaviour (PF-7-10).................................................................... 57
Figure 4.13: Strain profile for wall PF-7-10 ......................................................................................... 58
Figure 4.14: Failure mode for PVC encased specimens with hollow panels ....................................... 59
Figure 4.15: Bubbling on PVC surface and buckling of compression panel (PH-8-10) ...................... 60
Figure 4.16: Tested specimen showing tension panel slip (PH-6-10) .................................................. 61
Figure 4.17: Load versus deflection for PVC encased walls with hollow panels (PH) ........................ 62
Figure 4.18: Load versus deflection for PVC encased walls with hollow panels and their equivalent
control walls (C-6-10 & C-6-15) .......................................................................................................... 63
Figure 4.19: Load versus tensile strain for hollow panel wall (PH-8-10) ............................................ 70
Figure 4.20: Strain versus mid span deflection (PH-8-10) ................................................................... 70
Figure 4.21: Load versus compressive strain for hollow panel encased wall (PH-6-15) ..................... 71
Figure 4.22: Strain profile for hollow panel encased wall PH-6-15 ..................................................... 73
Figure 4.23: Tested cross-sections: control, flat panel, and hollow panel ............................................ 74
Figure 4.24: Load vs deflection behaviour for equivalent walls with flat and hollow panels. ............. 75
Figure 4.25: Load vs. deflection for C-7-15 and PF-6-15 .................................................................... 78
Figure 4.26: Panel slips observed on wall PH-6-10 ............................................................................. 80
Figure 4.27: Load versus deflection illustrating panel slips ................................................................. 80
Figure 4.28: Control wall at failure with crushed concrete lifting at surface. ...................................... 82
Figure 4.29: Concrete compression block removed from control wall. ............................................... 82
Figure 4.30: Bubbled surface of flat panel encased wall. ..................................................................... 83
Figure 4.31: Pulverized concrete under bubbled location. ................................................................... 83
Figure 4.32: Concrete paste attached to PVC ‘nubs’. ........................................................................... 84
Figure 4.33: Failure location and smooth surface of hollow panel formed concrete. .......................... 85
Figure 5.1: Idealized concrete stress-strain relationship. ..................................................................... 92
Figure 5.2: Stress versus strain relationship for reinforcing steel. ....................................................... 94
xii
Figure 5.3: Stress-strain curve for PVC panels and connectors. .......................................................... 95
Figure 5.4: PVC connector .................................................................................................................. 96
Figure 5.5: Sectional analysis at yield load. ......................................................................................... 97
Figure 5.6: Section analysis of PVC encased concrete walls at yield load. ......................................... 98
Figure 5.7: Experimental versus calculated yield loads for tested walls ........................................... 103
Figure 5.8: Stress and strain distributions for reinforced concrete walls at ultimate limit state ........ 104
Figure 5.9: Stress-strain diagrams for single cell PVC encased wall with hollow panels at ultimate
limit state ............................................................................................................................................ 105
Figure 5.10: Experimental versus calculated ultimate load ............................................................... 109
Figure 5.11: Failure at right loading point for wall PH-6-15. ............................................................ 110
Figure 5.12: Summary of tested (a-c) and modified (d, e) wall cross-sections. ................................. 114
Figure 5.13: Effect of the steel reinforcement depth on the yield load .............................................. 115
Figure 5.14: Ultimate load for wall sections with equivalent depth of steel reinforcement .............. 116
Figure 5.15: Yield load calculated for optimized PVC encasement .................................................. 118
Figure 5.16: Ultimate load prediction for optimized PVC encased wall. .......................................... 119
xiii
List of Tables
Table 3.1: Test matrix .......................................................................................................................... 20
Table 3.2: Concrete mix ....................................................................................................................... 28
Table 3.3: Average concrete strength ................................................................................................... 30
Table 3.4: Properties of reinforcing steel ............................................................................................. 32
Table 3.5: Properties of PVC................................................................................................................ 32
Table 4.1: Test results for control walls ............................................................................................... 40
Table 4.2: Test results for PVC encased walls with flat panels............................................................ 49
Table 4.3: Test results for PVC encased walls with hollow panels ...................................................... 64
Table 4.4: Test results for all specimens .............................................................................................. 76
Table 4.5: Comparison of for PVC encased walls with 25 mm thicker control walls.......................... 79
Table 4.6: Cores drilled from tested specimens ................................................................................... 86
Table 5.1: Summary of Experimental vs Calculated Yield load for test program ............................. 101
Table 5.2: Summary of experimental versus calculated ultimate load ............................................... 107
Table 5.3: Comparison of ultimate tensile strain values for flat panels ............................................. 111
Table 5.4: Comparison of ultimate tensile strain values for hollow panels ........................................ 111
Table 5.5: Comparison of Experimental and Ultimate Curvatures .................................................... 113

1
Chapter 1: Introduction
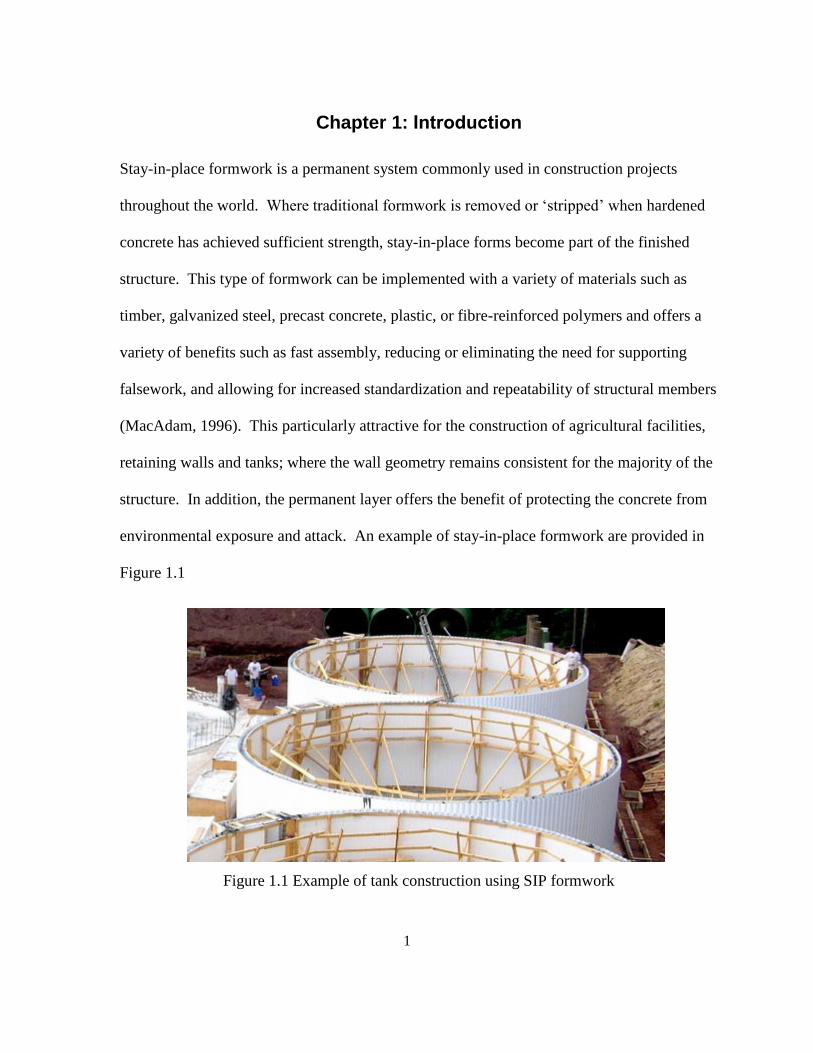
Stay-in-place formwork is a permanent system commonly used in construction projects
throughout the world. Where traditional formwork is removed or ‘stripped’ when hardened
concrete has achieved sufficient strength, stay-in-place forms become part of the finished
structure. This type of formwork can be implemented with a variety of materials such as
timber, galvanized steel, precast concrete, plastic, or fibre-reinforced polymers and offers a
variety of benefits such as fast assembly, reducing or eliminating the need for supporting
falsework, and allowing for increased standardization and repeatability of structural members
(MacAdam, 1996). This particularly attractive for the construction of agricultural facilities,
retaining walls and tanks; where the wall geometry remains consistent for the majority of the
structure. In addition, the permanent layer offers the benefit of protecting the concrete from
environmental exposure and attack. An example of stay-in-place formwork are provided in
Figure 1.1
Figure 1.1 Example of tank construction using SIP formwork
2
Stay-in-place formwork can also play a role in providing additional structural capacity to
an element. FRP and steel forms in particular are implemented as additional or even
replacement reinforcement for concrete piles, slabs, and walls. In recent years, polyvinyl
chloride (PVC) stay-in-place formwork has been developed as a solution for fast, secure and
reliable concrete construction. It is proven to be an effective system to quickly erect walls
for single and two storey structures. Tests on PVC encased concrete walls reveal an
improvement in structural resistance to flexural forces and significant improvements to the
ductility of the walls. Research is required to further investigate the flexural behaviour of the
PVC encased wall system and develop an analytical model to estimate the ultimate capacity
of these composite members. Depending on the amount of improvement, a reinforced
concrete wall that is traditionally formed could have the same performance as a PVC encased
wall with a thinner cross-section. This change in thickness, however small, applied to an
entire structural system would have significant benefit for materials and cost savings.
1.1 Objectives and Scope
The purpose of this research is to determine the flexural behaviour of reinforced concrete
(RC) walls that are encased in a PVC stay-in-place (SIP) forming system. Two types of PVC
panels will be compared, as well as the effects of the concrete core thickness, and steel
reinforcing ratio of the walls. An analytical model will be developed to estimate the yield
and ultimate load capacities of the PVC encased concrete walls. Finally, experimental test
results will be compared to the analytical model to verify the accuracy of the model results.
The greatest motivation is to determine the contribution of the PVC to flexural stiffness, and
strength, and if it is significant enough to allow for more slender walls. The slender wall is
3
of interest due to the potential materials savings if equivalent structural behaviour is achieved
with the thinner PVC encased walls. This scenario has up to now been unexplored in this
research area.
1.2 Thesis Outline
This thesis is organized into six chapters and an appendix as follows:
Chapter 1: Introduction – This chapter describes the research motivation, the
objectives of the research program, the scope of work, and the thesis outline.
Chapter 2: Background and Literature Review – This chapter provides a summary
of previous research work pertaining to permanent formwork and encased PVC
walls.
Chapter 3: Experimental Program – This chapter presents the test program, material
properties, specimen fabrication, instrumentation, and testing set up.
Chapter 4: Experimental Results – This chapter describes the failure modes of the
test specimens. In addition, the experimental cracking, yield, and ultimate loads
and deflections are presented. Finally, strain response to loading is discussed.
Chapter 5: Analytical Model – This chapter discusses the development and validity
of the analytical model for predicting yield and ultimate load levels for PVC
encased walls.
Chapter 6: Conclusions and Recommendations – This chapter presents the main
conclusions from the study. Recommendations for future work are also provided.
Appendix A: Experimental Results
4
Chapter 2: Background and Literature Review
In this chapter, a literature review of previous research on stay-in-place (SIP) structural
formwork is conducted, with particular interest on FRP and PVC based systems. The
behaviour of the FRP stay-in-place (SIP) formwork is presented, highlighting its effects on
reinforced concrete’s strength, stiffness, and ductility. Then, research investigating the
influence of PVC SIP formwork on concrete behaviour is discussed. Finally, the
development of analytical models to calculate the capacity of the PVC encased systems is
reviewed.
2.1 FRP Stay-in-Place Formwork
2.1.1 FRP Material
Fibre-Reinforced Polymer (FRP) has recently emerged as a viable material in the
construction industry. FRP is a composite material of fibres in a polymeric resin and can be
manufactured into various shapes such as bars, sheets, or laminates. FRP material have high
tensile strength, flexibility for application, light weight (compared to steel), and high
corrosion resistance (ACI 440.R1-06, 2006).
Reinforced concrete structures exposed to severe environments can experience corrosion of
reinforcing steel, leading to deterioration of the structure and loss of serviceability. Fibre-
reinforced polymers have significantly better corrosion resistance compared to steel
reinforcement, making FRP’s an increasingly utilized structural material where moisture,
chlorides, and temperature pose a threat to a reinforced concrete’s durability (ACI 440.R1-
06, 2006).
5
FRP has various applications for concrete structures in addition to acting as primary
reinforcement. External application of FRP laminates or sheets to the surface of concrete
members have proven to be an effective method of strengthening in service and deteriorated
elements (Ritchie et al, 1991; Soudki et al, 2007). Other applications for the FRP’s include
the provision of confining effects for compression elements, and more recently stay in place
formwork, primarily for walls and columns.
2.1.2 Behaviour of FRP-Formed Concrete Elements
One of the most popular applications of SIP FRP formwork has been in the construction of
highway composite bridge decks. Two types of permanent formwork have been defined;
structurally participating and structurally non-participating. Structural participating
formwork is designed to resist both construction and in-service loads, while structurally non-
participating forms are strictly intended for carrying construction loads (McClelland, 2007).
In addition to providing structural support, permanent forms offer other benefits such as
reducing or removing the need for falsework and stripping, while providing opportunity for
standardization of construction and reduced labour. Finally, the intrinsic corrosion resistance
and high tensile strength of FRP’s effectively negate the effect of environmental exposure on
bridge decks.
A variety of formwork geometries have been investigated, including concrete filled FRP
tubes (CFFT). Rizkalla and Fam (2002) tested 20 CFFTs under four point bending to
observe how these members would behave in flexure. The FRP tubes were filled with plain
concrete within the tubes, providing both the flexural and shear reinforcement. Some tubes
were cast with an inner longitudinal hole creating a wall thickness equal to the theoretical
6
compression block of a solid concrete cylinder. Different parameters were investigated
including the specimen length, diameter, cross-section geometry, reinforcing ratio, and
concrete strength. Tubes cast with an internal hole showed an increase in strength-to-weight
ratio of 35% while reducing ultimate load capacity by 9%. In general, increasing the
thickness (or cross-sectional area) of the FRP tube improved the moment capacity and the
stiffness of the tubes.
It was concluded that as the FRP tube increased in stiffness, the benefit of filling the tube
with concrete in order to further increase the stiffness was lessened. In other words, concrete
contributes more to structures with weaker shells. In addition, placing fibers in the
longitudinal direction to resist flexural forces caused a compression failure of the fibers and
shear failure of the specimen.
Mohamed and Masmoudi (2012) continued exploring the use of FRP stay-in-place
structural formwork for concrete beams. Seven cylindrical beams, 213 mm in diameter and
2000 mm long were tested in four-point bending. They were reinforced with either 6 steel
bars 15 mm in diameter or 6 GFRP bars 16 mm in diameter. Test variables included concrete
compressive strength (30 MPa and 45 MPa), FRP tube thickness (2.9 mm or 6.4 mm),
internal reinforcement (FRP or steel), and fiber orientation. The fibers were oriented 60 and
90 to the longitudinal direction. The concrete filled GFRP tubes (CFFT’s) all failed in
shear. They failed at a higher deflection with increased stiffness and strength over the
control beams. The combination of steel reinforcing bars and GFRP tube allowed for a
higher ductility (86% average increase) and an increase in cracking loads ranging from 31%
to 84% while improving the ultimate load of the element from 130% to 200% over the
7
control beams. Conversely, the CFFT specimens reinforced with GFRP bars were weaker
than the equivalent specimens with steel internal reinforcing and failed suddenly due to
rupture of the glass reinforcing bars. Finally, varying the concrete strength and FRP tube
thickness did not significantly change the flexural performance of the specimens.
Dieter et al (2006) investigated the failure mechanisms and performance of a FRP formed
bridge deck system by separately testing FRP reinforced slabs and beams. The slab
specimens were 2745 mm square with a 200 mm thickness while the beams were 200 mm
deep, 914 mm wide, and 2650 mm long. The FRP reinforced concrete specimens were
composed of a FRP deck planks to resist positive bending and a top grid or mesh of FRP bars
to resist negative bending. The FRP plank was a flat panel stiffened with corrugated box
sections. The deck slab failed in punching shear. Ultimate strength results were significantly
lower than predicted. They concluded that this reduction was due to the corrugation of the
FRP plank, reducing the effective shear depth from 200mm to 127mm. In addition, the tests
revealed that the FRP plank was not acting as a fully composite section with the concrete as
the specimens held load through a higher than anticipated displacement. Further tests
confirmed that the FRP formed concrete did not achieve full composite action.
An investigation of the flexural capacity of the pultruded FRP planks was completed by
Bank et al. (2007). The planks were 305 mm wide. They formed the spans between the
primary bridge girders, and acted as secondary reinforcement. Seven specimens were tested
to compare the behaviour to the traditionally formed reinforced concrete beams and to
examine the effect of the type of grit coating on the plank to achieve composite behaviour.
Two planks, sand-coated and gravel-coated were tested in comparison to a control plank
8
without grit. The control specimen (smooth plank) failed in flexure and a slip was observed
between the FRP and concrete. Specimens with coatings did not experience any slip and
showed an increase in the ultimate capacity of the beams by 50% to 56%.
The control FRP planks were also compared with a steel reinforced concrete beam. The
quantity of steel reinforcing reflected the AASHTO requirement for transverse
reinforcement. At ultimate load the FRP specimens achieved 58% to 64% higher capacity
than the steel reinforced concrete control specimen. It was concluded that the plank could
effectively replace the steel as primary tensile reinforcement. The plank had to be coated
with epoxy-adhered sand or gravel in order to develop composite action with the concrete.
The smooth plank showed significant slip between the concrete and FRP, with a decreased
load carrying capacity. (Bank & Oliva, 2007)
Other FRP stay-in-place structural forms have been investigated in recent years. Nelson
and Fam (2014) concluded that structural response of the FRP SIP form system in terms of
strength and flexural stiffness is similar to conventionally RC bridge decks. However, FRP’s
differ from steel in several aspects, most noteworthy is their stress-strain behaviour. The
steel fails in a ductile manner, but the FRP’s remain linear elastic until sudden failure at a
decreased strain compared to the rupture strain of steel rebars (Fam & Nelson, 2014). This
reduction in ductility is reflected in FRP formed elements where load capacity meets or
exceeds RC elements but is less resilient.
A number of attempts have been made to improve the ductility of the FRP SIP systems.
Gai et al(2013) developed an FRP stay-in-place formwork that confined concrete using
9
FRP’s in order to increase the ductility of the concrete. Six slab specimens were tested in
five-point bending and consisted of two 3000 mm long GFRP box sections (100 mm x 100
mm x 8 mm thick) adhered to a 300 mm wide, 3000 mm long moulded FRP grating. The
box sections provided the tension flexural resistance while the concrete filled grating acted in
compression. Transverse GFRP dowels between the concrete and GFRP box sections
prevented brittle failure of the composite section, increasing the ductility of the system. The
FRP grating confined the concrete, increasing the strain capacity and ductility of the concrete
in the compression zone. Despite these improvements, the modified formwork required an
increased amount of FRP to establish ductility, which is a costly solution. The use of other
materials such as PVC for stay-in-place formwork, could increase ductility at a much lower
cost.
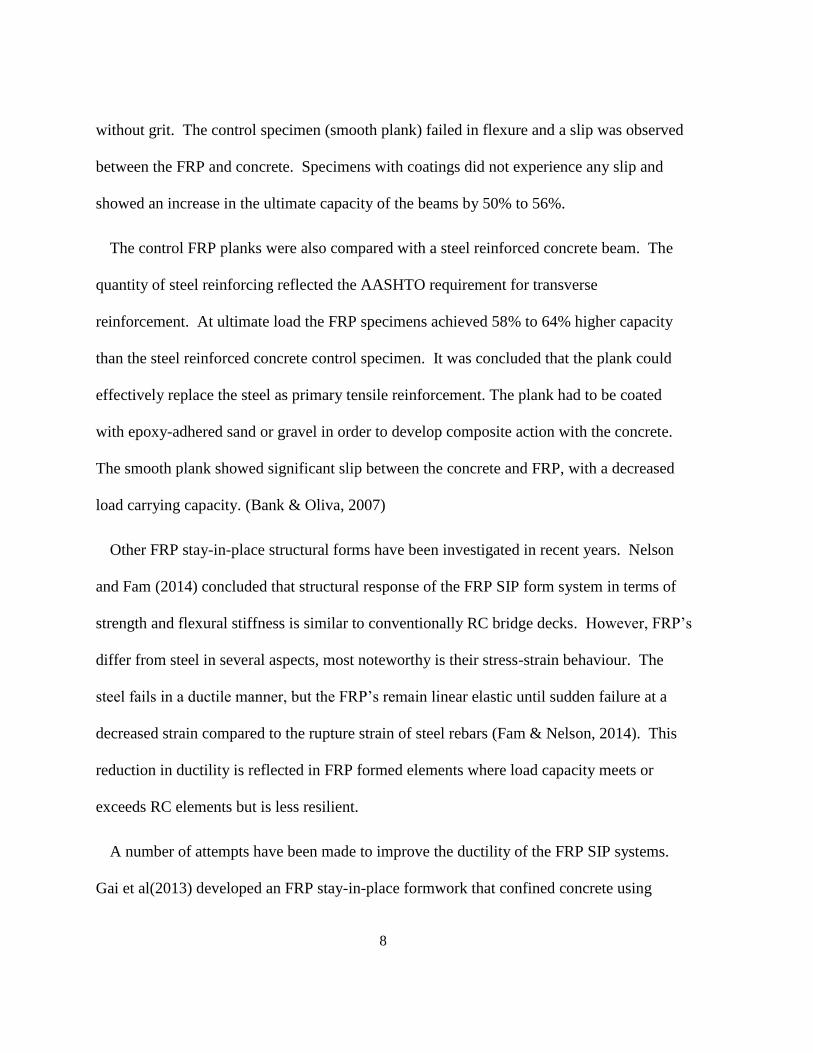
2.2 PVC Stay-in-Place Formwork
Polyvinyl chloride (PVC) differs from fiber-reinforced polymers in several ways. The
material is weaker than FRPs but offers distinct benefits such as lower cost and increased
rupture strain when loaded. PVC stay-in-place formwork consists of a system of panels and
connectors. The panels form the concrete wall faces, while the connectors secure the faces of
the wall together. The connectors have hollow cells to allow for transverse reinforcement to
be placed through the forms and for fresh concrete to flow into the entire wall (Figure 2.1).
10
a - Connector
b – Side view of the wall cell
c – Top view of the wall cell
Figure 2.1: Element used in PVC SIP Formwork
The forms offer the advantage of a simplified construction process, especially in the
construction of buildings with consistent and continuous geometries (i.e., retaining walls).
While strength improvements have been most apparent in the use of fiber-reinforced
polymers, the structural benefits of using PVC based formwork have not been explored in
great detail.
Panel
11
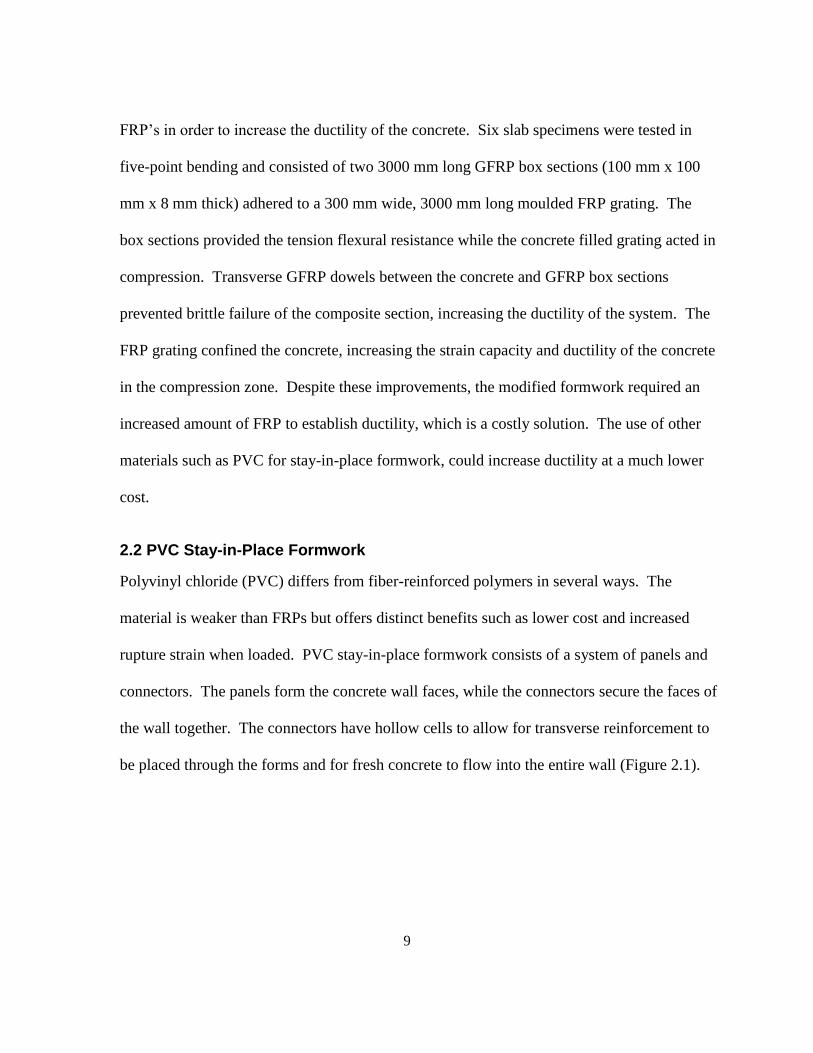
Chahrour et al. (2005) investigated the flexural behavior of PVC stay-in-place formwork
(Royal Building Systems) with and without steel reinforcement. They tested fifteen walls in
four point bending. The specimens were 2000 mm long and 233 mm wide. Test variables
included the thickness of the concrete core (100, 150 or 200 mm) and reinforcement ratio
(un-reinforced, 1-10M rebar). Four PVC encased specimens (150 mm thick) without internal
reinforcement developed ‘saw tooth’ load-deflection curves as shown in Figure 2.2. The
load dropped at concrete cracking points and then increased or rebounded as the PVC panels
resisted the tensile stresses at the cracked location. The specimens experienced several of
these drops and rebounds as cracking continued and deflection increased until the load level
began to drop. The specimen failed by rupture of the PVC on the tension side of the wall.
The addition of steel reinforcement reduced the severity of the ‘saw-tooth’ jumps as shown in
Figure 2.3.
Figure 2.2: Load-deflection of PVC-encased plain concrete. (Chahrour et al. 2005)
12
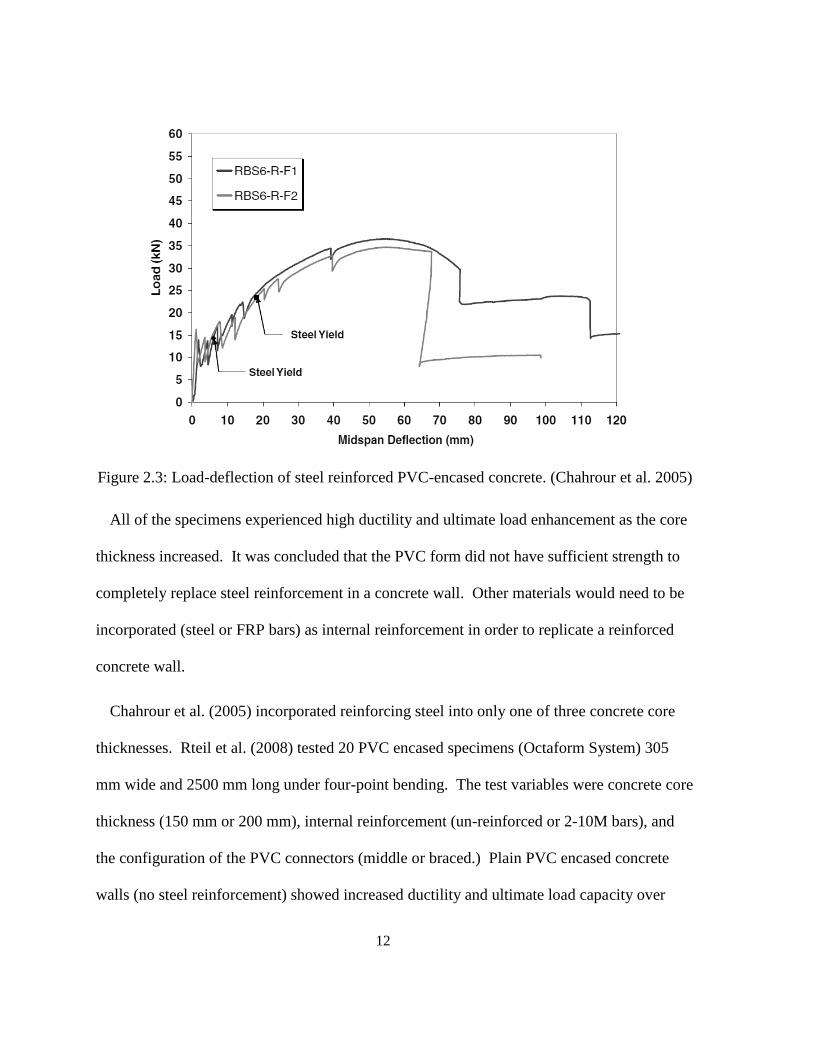
Figure 2.3: Load-deflection of steel reinforced PVC-encased concrete. (Chahrour et al. 2005)
All of the specimens experienced high ductility and ultimate load enhancement as the core
thickness increased. It was concluded that the PVC form did not have sufficient strength to
completely replace steel reinforcement in a concrete wall. Other materials would need to be
incorporated (steel or FRP bars) as internal reinforcement in order to replicate a reinforced
concrete wall.
Chahrour et al. (2005) incorporated reinforcing steel into only one of three concrete core
thicknesses. Rteil et al. (2008) tested 20 PVC encased specimens (Octaform System) 305
mm wide and 2500 mm long under four-point bending. The test variables were concrete core
thickness (150 mm or 200 mm), internal reinforcement (un-reinforced or 2-10M bars), and
the configuration of the PVC connectors (middle or braced.) Plain PVC encased concrete
walls (no steel reinforcement) showed increased ductility and ultimate load capacity over
13
plain concrete sections. This increase became more pronounced as the core thickness
decreased. The PVC enhanced the ultimate load by 36% for 150 mm thick walls and 18%
for 200 mm thick walls. They concluded that adding PVC SIP forms increased the cracking
load and yield load of the reinforced specimens by 36% and 65% over their respective
control walls. As reported earlier by Chahrour et al. (2005), they observed a change from the
‘saw-tooth’ behaviour load deflection curves in the unreinforced specimens to a continuous
increase in load with deflection for the steel reinforced specimens. The forms increased the
maximum deflection of the walls by 24% and 55% for 150 mm and 200 mm thick walls,
respectively. The configuration of PVC connectors did not have a significant impact on steel
reinforced specimens.
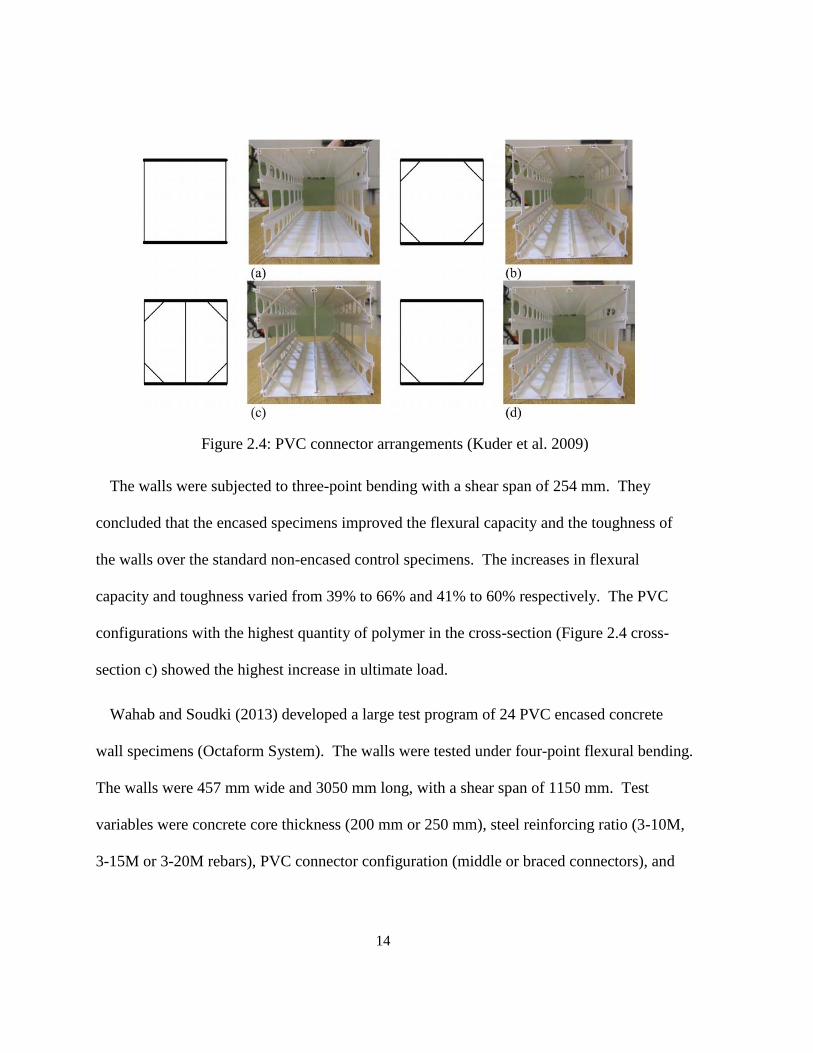
The effect of connector configuration on the mechanical performance of concrete was
explored further by Kuder et al. (2009). Four 610 mm long PVC SIP concrete walls, using
the Octaform system were cast. A square cross-section of 152.4 mm by 152.4 mm was
reinforced with one 10M steel rebar. Each of the specimens was assembled with a different
configuration of PVC connectors as shown in Figure 2.4.
14
Figure 2.4: PVC connector arrangements (Kuder et al. 2009)
The walls were subjected to three-point bending with a shear span of 254 mm. They
concluded that the encased specimens improved the flexural capacity and the toughness of
the walls over the standard non-encased control specimens. The increases in flexural
capacity and toughness varied from 39% to 66% and 41% to 60% respectively. The PVC
configurations with the highest quantity of polymer in the cross-section (Figure 2.4 cross-
section c) showed the highest increase in ultimate load.
Wahab and Soudki (2013) developed a large test program of 24 PVC encased concrete
wall specimens (Octaform System). The walls were tested under four-point flexural bending.
The walls were 457 mm wide and 3050 mm long, with a shear span of 1150 mm. Test
variables were concrete core thickness (200 mm or 250 mm), steel reinforcing ratio (3-10M,
3-15M or 3-20M rebars), PVC connector configuration (middle or braced connectors), and
15
including insulating foam on the tension side of the walls. The test program was cast in two
batches, with concrete strengths of 53 MPa and 43 MPa, respectively.
The PVC encased specimens showed an increase in cracking, yielding, and ultimate loads
over the control wall specimens. Cracking load was the most significantly influenced, with a
load increase of over 200% for both core depths. For yield and ultimate loads, lightly
reinforced sections (10M) showed an average load increase in load of 22% versus 15% for
heavily reinforced sections (15M and 20M). From the test data, it was concluded that the
PVC contribution to flexural strength depended on the reinforcing ratio and section
thickness. The configuration of the PVC connectors did not have any apparent effect on the
resistance and thus could be ignored. The insulation did not have any effect on the
contribution to flexural strength and was ignored. As the concrete core thickness and/or the
internal reinforcement decreased, the enhancement of the PVC encasement to the wall’s
behaviour increased.
2.3 Analytical Modelling of PVC SIP Formwork
Several of the experimental programs completed on PVC SIP formwork were modeled
through the development of an analytical model. These models were used to predict the
ultimate load capacity of the PVC formed concrete elements. This section will examine four
models in closer detail.
Chahrour et al. (2005) developed a strain compatibility model using linear strain analysis.
Concrete in tension below the neutral axis was neglected in the analysis, with all tensile
forces being resisted by the steel reinforcement (if present) and the polymer. The portion of
16
the polymer in compression was also neglected, with the concrete resisting all compressive
forces. An equivalent rectangular concrete compression stress block and polymer tension
block (acting on the polymer flanges and webs) were used to estimate the actual stresses
within the cross-section. Finally, a summation of forces was used to determine the depth of
the neutral axis ‘c’ to calculate the moment or flexural resistance of the wall (Equation 2-1)
[2-1]
Where Apt was the cross-sectional area of the polymer in tension, fpu was the ultimate
tensile stress of the polymer, As was the area of reinforcing steel in tension, fy was the
nominal yield stress of the reinforcement, α1 is the stress factor for the concrete compression
block, f’c was the compression strength of concrete, and bc is the width of the concrete
compression block. Results from the model were within ±7% of the test results.
Kuder et al. (2009) identified that Chahrour did not examine the influence of various PVC
SIP connectors’ configurations. A model was developed following Euler-Bernoulli beam
theory and linear strain distributions. Some assumptions from the previous model were
adapted such as; ignoring the tensile strength of concrete, and using a rectangular concrete
compressive stress block. Further modifications were made to modelling the PVC. Perfect
composite action between the concrete and PVC was assumed, and the confining action of
the PVC in the compression zone was neglected (Kuder et al., 2009). Finally, the PVC
connector and panel were separated into individual forces, as seen in Equation [2-2].
17
( )
[2-2]
Where Ac is the PVC connector area in tension, Ap is the PVC panel area in tension, and fpu
is the ultimate stress in the PVC. The model results were conservative or underestimated by
an average of 27% when compared to the experimental results. Despite this discrepancy, the
results from the model indicated that the PVC forms increased the flexural capacity of the
concrete wall due to an increased tensile capacity of the cross-section.
Rteil et al. (2008) developed a similar model to the one developed by Kuder et al. (2009).
They assumed the wall failed when the concrete in compression crushed after the steel had
yielded. However, the portions of the PVC connector acting in tension were ignored in the
stress profile. In addition, the stress block factors α1 and β1, were calculated from linear
strain distribution using the equations presented by Collins and Mitchell (Equations [2-3] and
[2-4]).
[2-3]
(
)
[2-4]
Where; t is the concrete strain at the top compression fibre and ’c is the concrete strain
corresponding to the concrete compressive strength (f’c) (Collins & Mitchell, 1997). Results
from the model averaged 12% less than the experimental data. The authors suggested this
was due to the effect of steel strain hardening not factored into the equation.
18
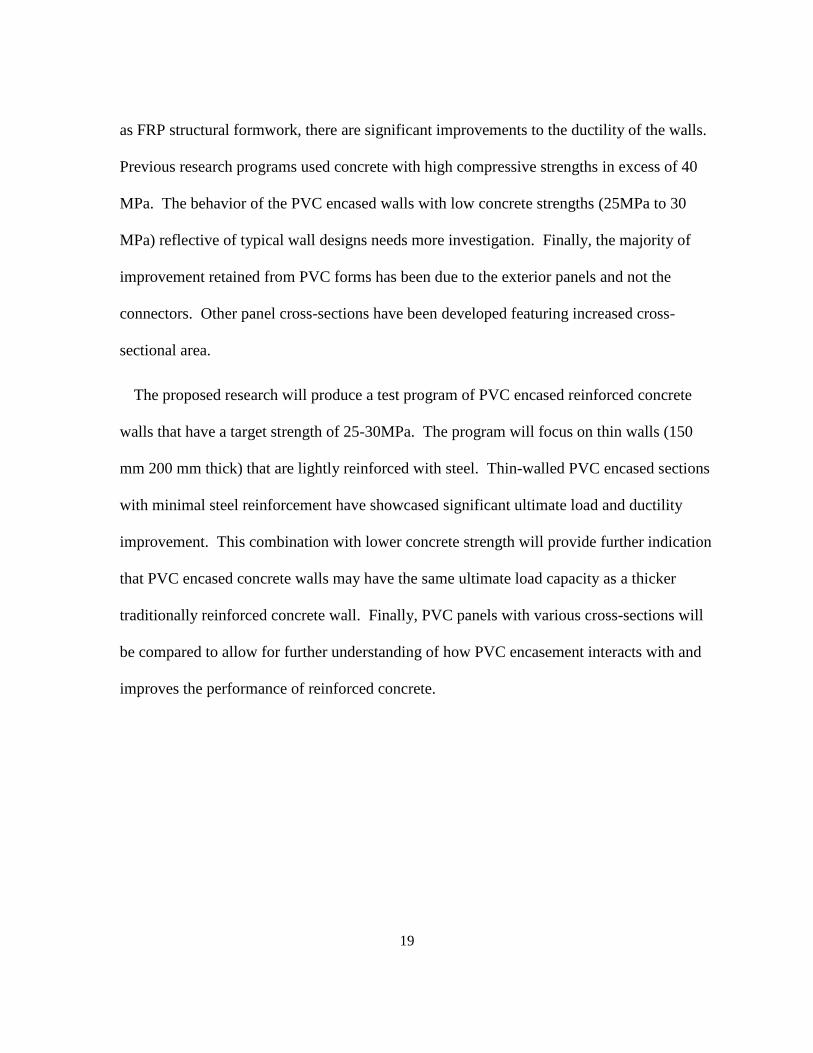
Wahab and Soudki (2013) used linear strain distribution in a model that accounted for the
strain hardening of reinforcing steel in the walls. In addition, unlike previous models that
had neglected the contribution of the compression panel, continuous portions of the PVC
connectors acting in tension and the PVC panel acting in compression were considered in the
analysis. Perfect bond or composite action was assumed between the concrete and PVC.
Finally, the non-linear stress strain behaviour of the PVC was accounted for using Equation
[2-5] as provided by the PVC manufacturer.
[2-5]
Where; pvc is the strain in the PVC, and pvc is the corresponding stress at that strain level.
Figure 2.5 shows the strain profile and stress distribution. Results from the analytical model
showed good agreement with the test results, with an average error of 5%.
Figure 2.5: Stress and strain distribution of PVC SIP cross-section. (Wahab and Soudki
2013)
2.4 Research Needs
From the research presented, PVC SIP formwork does provide limited flexural strength
enhancement to the reinforced concrete walls. While this enhancement is not as pronounced
19
as FRP structural formwork, there are significant improvements to the ductility of the walls.
Previous research programs used concrete with high compressive strengths in excess of 40
MPa. The behavior of the PVC encased walls with low concrete strengths (25MPa to 30
MPa) reflective of typical wall designs needs more investigation. Finally, the majority of
improvement retained from PVC forms has been due to the exterior panels and not the
connectors. Other panel cross-sections have been developed featuring increased cross-
sectional area.
The proposed research will produce a test program of PVC encased reinforced concrete
walls that have a target strength of 25-30MPa. The program will focus on thin walls (150
mm 200 mm thick) that are lightly reinforced with steel. Thin-walled PVC encased sections
with minimal steel reinforcement have showcased significant ultimate load and ductility
improvement. This combination with lower concrete strength will provide further indication
that PVC encased concrete walls may have the same ultimate load capacity as a thicker
traditionally reinforced concrete wall. Finally, PVC panels with various cross-sections will
be compared to allow for further understanding of how PVC encasement interacts with and
improves the performance of reinforced concrete.
20
Chapter 3: Experimental Program
3.1 Test Program
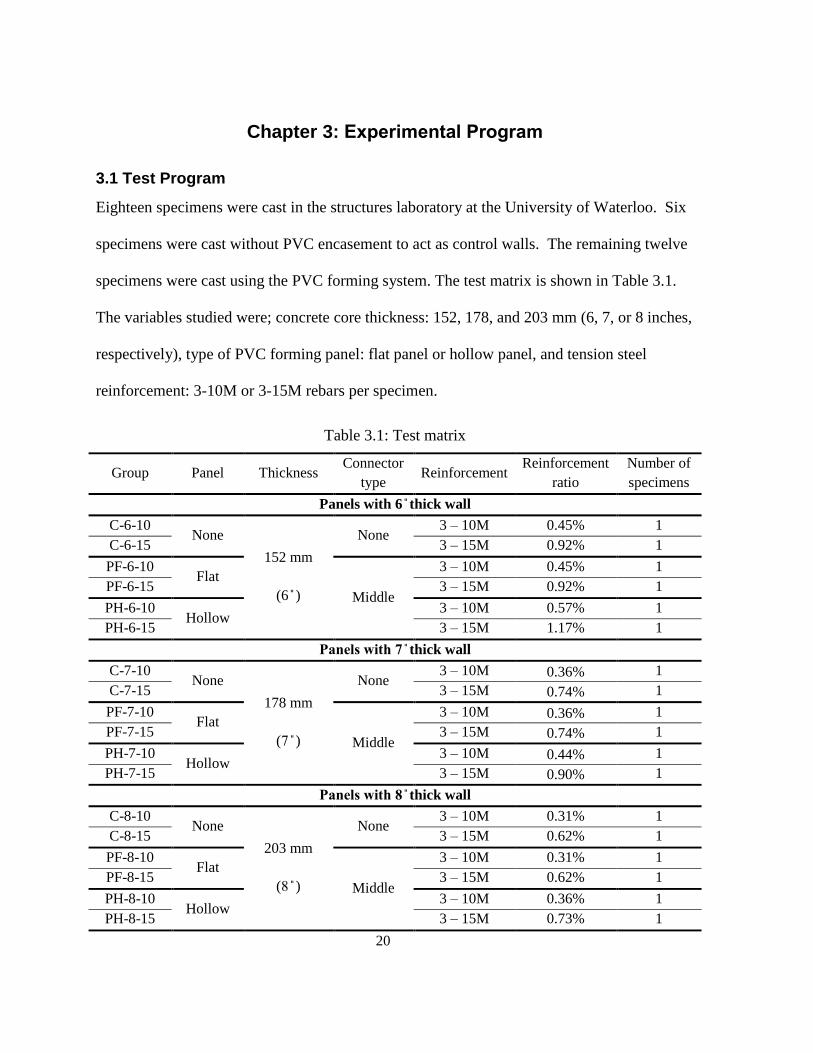
Eighteen specimens were cast in the structures laboratory at the University of Waterloo. Six
specimens were cast without PVC encasement to act as control walls. The remaining twelve
specimens were cast using the PVC forming system. The test matrix is shown in Table 3.1.
The variables studied were; concrete core thickness: 152, 178, and 203 mm (6, 7, or 8 inches,
respectively), type of PVC forming panel: flat panel or hollow panel, and tension steel
reinforcement: 3-10M or 3-15M rebars per specimen.
Table 3.1: Test matrix
Group Panel Thickness Connector
type Reinforcement
Reinforcement
ratio
Number of
specimens
Panels with 6 thick wall
C-6-10 None
152 mm
(6 )
None 3 – 10M 0.45% 1
C-6-15 3 – 15M 0.92% 1
PF-6-10 Flat
Middle
3 – 10M 0.45% 1
PF-6-15 3 – 15M 0.92% 1
PH-6-10 Hollow
3 – 10M 0.57% 1
PH-6-15 3 – 15M 1.17% 1
thick wall
C-7-10 None
178 mm
( )
None 3 – 10M 0.36% 1
C-7-15 3 – 15M 0.74% 1
PF-7-10 Flat
Middle
3 – 10M 0.36% 1
PF-7-15 3 – 15M 0.74% 1
PH-7-10 Hollow
3 – 10M 0.44% 1
PH-7-15 3 – 15M 0.90% 1
thick wall
C-8-10 None
203 mm
( )
None 3 – 10M 0.31% 1
C-8-15 3 – 15M 0.62% 1
PF-8-10 Flat
Middle
3 – 10M 0.31% 1
PF-8-15 3 – 15M 0.62% 1
PH-8-10 Hollow
3 – 10M 0.36% 1
PH-8-15 3 – 15M 0.73% 1
21
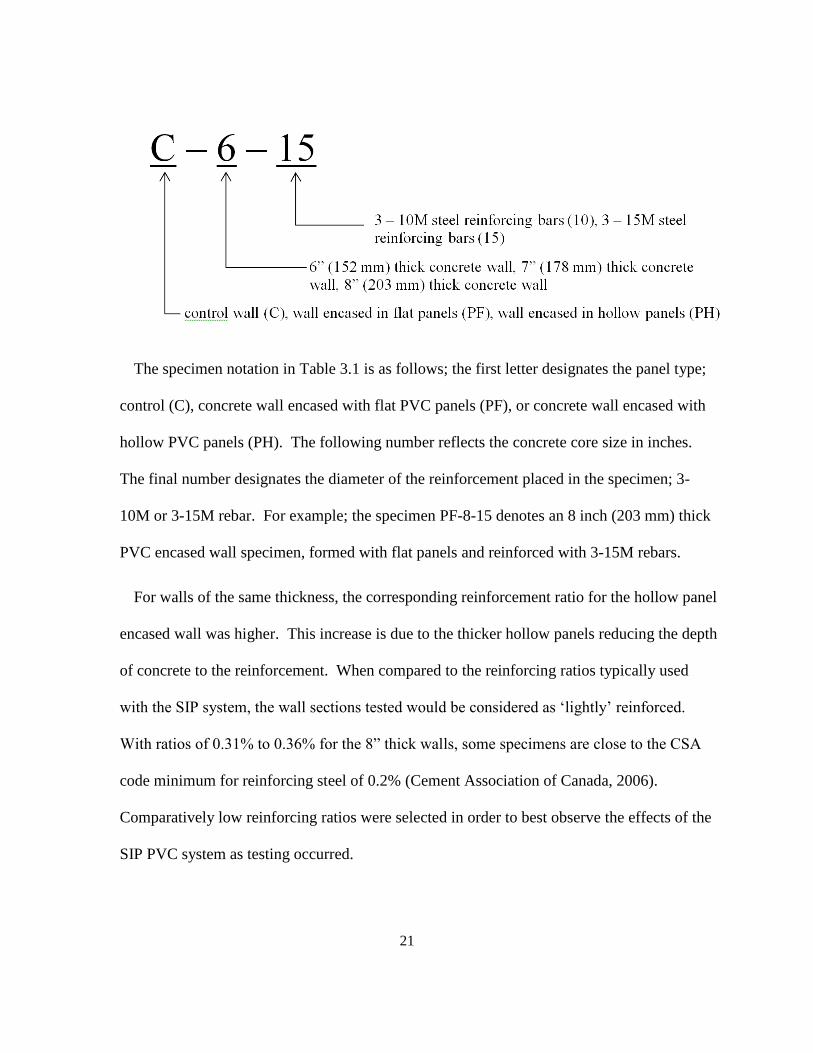
The specimen notation in Table 3.1 is as follows; the first letter designates the panel type;
control (C), concrete wall encased with flat PVC panels (PF), or concrete wall encased with
hollow PVC panels (PH). The following number reflects the concrete core size in inches.
The final number designates the diameter of the reinforcement placed in the specimen; 3-
10M or 3-15M rebar. For example; the specimen PF-8-15 denotes an 8 inch (203 mm) thick
PVC encased wall specimen, formed with flat panels and reinforced with 3-15M rebars.
For walls of the same thickness, the corresponding reinforcement ratio for the hollow panel
encased wall was higher. This increase is due to the thicker hollow panels reducing the depth
of concrete to the reinforcement. When compared to the reinforcing ratios typically used
with the SIP system, the wall sections tested would be considered as ‘lightly’ reinforced.
With ratios of 0.31% to 0.36% for the ” thick walls, some specimens are close to the CSA
code minimum for reinforcing steel of 0.2% (Cement Association of Canada, 2006).
Comparatively low reinforcing ratios were selected in order to best observe the effects of the
SIP PVC system as testing occurred.
22
3.2 PVC Stay-in-Place components and wall
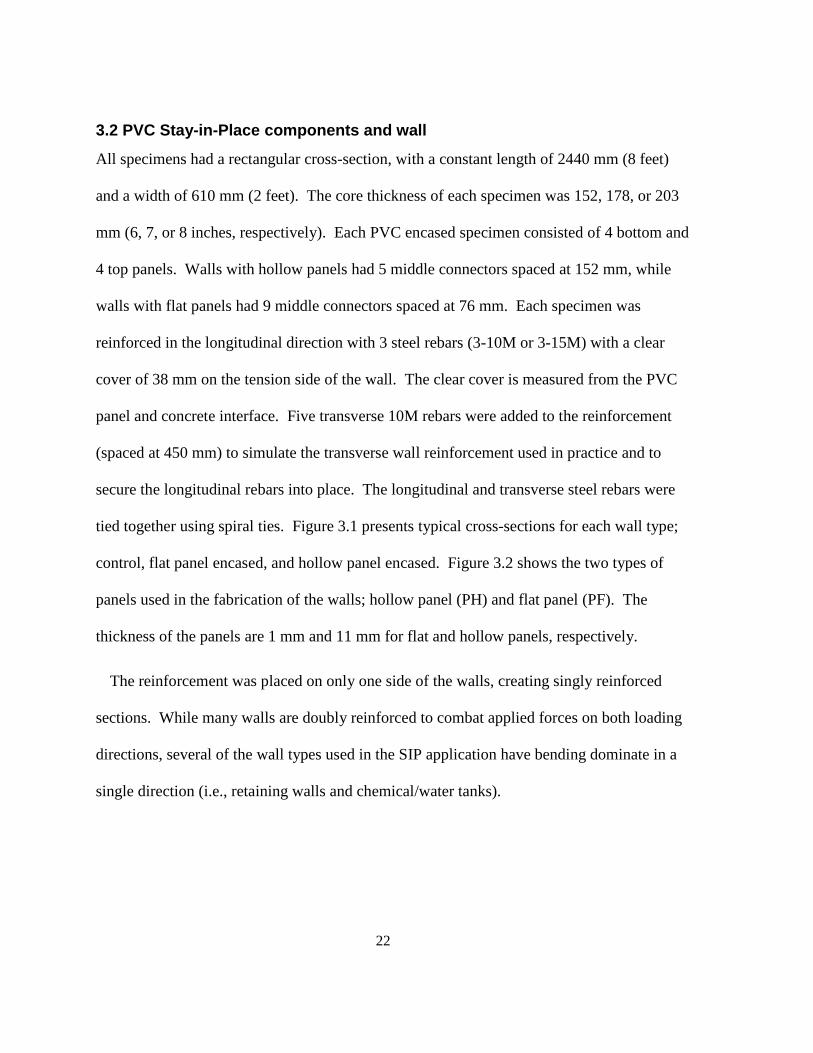
All specimens had a rectangular cross-section, with a constant length of 2440 mm (8 feet)
and a width of 610 mm (2 feet). The core thickness of each specimen was 152, 178, or 203
mm (6, 7, or 8 inches, respectively). Each PVC encased specimen consisted of 4 bottom and
4 top panels. Walls with hollow panels had 5 middle connectors spaced at 152 mm, while
walls with flat panels had 9 middle connectors spaced at 76 mm. Each specimen was
reinforced in the longitudinal direction with 3 steel rebars (3-10M or 3-15M) with a clear
cover of 38 mm on the tension side of the wall. The clear cover is measured from the PVC
panel and concrete interface. Five transverse 10M rebars were added to the reinforcement
(spaced at 450 mm) to simulate the transverse wall reinforcement used in practice and to
secure the longitudinal rebars into place. The longitudinal and transverse steel rebars were
tied together using spiral ties. Figure 3.1 presents typical cross-sections for each wall type;
control, flat panel encased, and hollow panel encased. Figure 3.2 shows the two types of
panels used in the fabrication of the walls; hollow panel (PH) and flat panel (PF). The
thickness of the panels are 1 mm and 11 mm for flat and hollow panels, respectively.
The reinforcement was placed on only one side of the walls, creating singly reinforced
sections. While many walls are doubly reinforced to combat applied forces on both loading
directions, several of the wall types used in the SIP application have bending dominate in a
single direction (i.e., retaining walls and chemical/water tanks).
23
Figure 3.1: Cross-sections and dimensions for the (a) control, (b) flat panel encased, and (c)
hollow panel encased wall specimens
24
Figure 3.2: Examples of assembled hollow panel and flat panel walls
3.3 Specimen Fabrication
3.3.1 Control Specimens
Three double-layer plywood boxes were fabricated to form the control walls. Three sides of
the box were assembled and then tilted into place. The reinforcing steel mats were then
placed and secured inside the control boxes before attaching the final face of the form. The
boxes were girdled using timber (2 X 4 inches) spaced at 300 mm to avoid any concrete
blowouts during casting. Figure 3.3 shows one open-faced box with the steel cage in place
and the final control box assembly.
25
Figure 3.3: Placing the reinforcing steel inside control box; final assembly of the three
control boxes with timber girdling
3.3.2 PVC Encased Walls
All of the PVC encased specimens were assembled horizontally. Once the bottom panels and
middle connectors were assembled, the longitudinal and transverse steel reinforcement were
tied into place. Plastic chairs were used at the ends of the walls to ensure that the reinforcing
mats would stay in place and maintain a consistent clear cover during construction and
concrete pouring. The top panels were then slid into place. Finally, the walls were tilted
vertically into their final casting position. Figure 3.4 shows a partial view of a row of walls
being secured to the casting frame.
26
Figure 3.4: Wall specimens tilted into place
Due to space restrictions in the laboratory, the walls were placed in three parallel rows of 4
specimens per row. The rows of specimens were separated by timber spacer frames to
provide enough space for each wall to expand freely during casting. Figure 3.5 shows the
PVC encased walls arranged in place. Threaded rods were used to tie the entire assembly
back to the casting frame as shown in Figure 3.6.
Casting frame
27
Figure 3.5: Selected views of the secured PVC encased specimens before concrete casting
Figure 3.6: Specimens in place before casting
Threaded Rods
Spacer frames
28
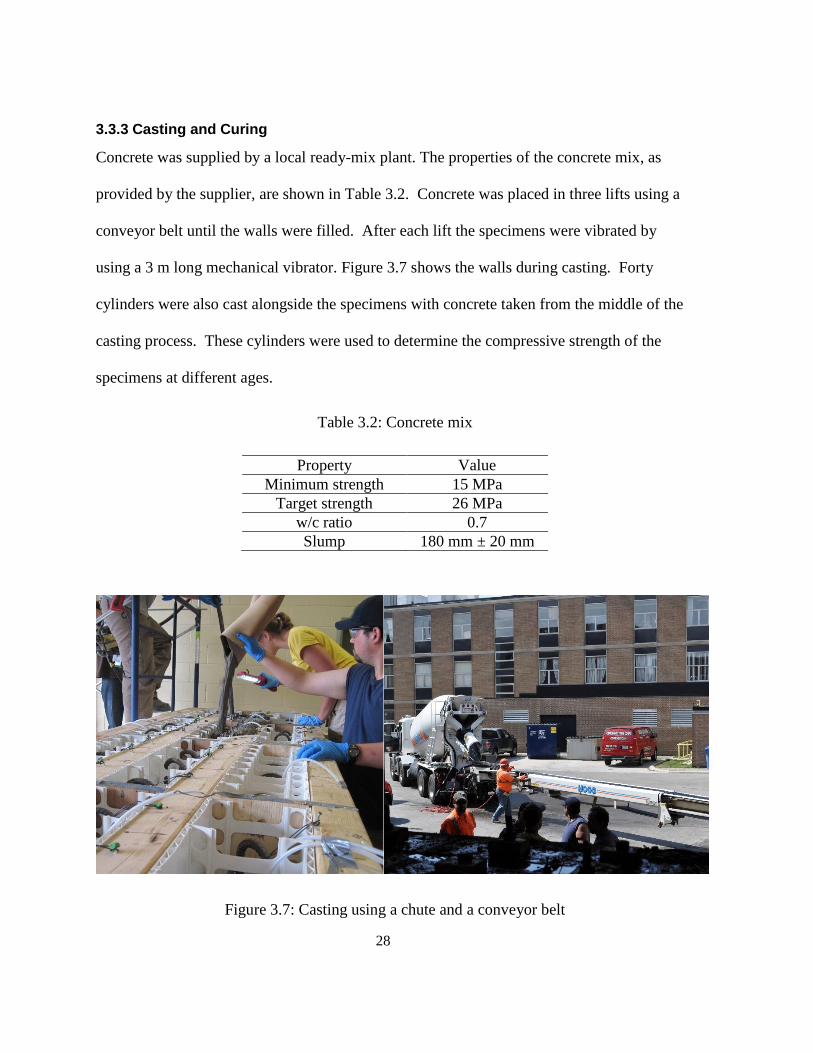
3.3.3 Casting and Curing
Concrete was supplied by a local ready-mix plant. The properties of the concrete mix, as
provided by the supplier, are shown in Table 3.2. Concrete was placed in three lifts using a
conveyor belt until the walls were filled. After each lift the specimens were vibrated by
using a 3 m long mechanical vibrator. Figure 3.7 shows the walls during casting. Forty
cylinders were also cast alongside the specimens with concrete taken from the middle of the
casting process. These cylinders were used to determine the compressive strength of the
specimens at different ages.
Table 3.2: Concrete mix
Property Value
Minimum strength 15 MPa
Target strength 26 MPa
w/c ratio 0.7
Slump 180 mm ± 20 mm
Figure 3.7: Casting using a chute and a conveyor belt
29
The walls were covered with wet burlap and plastic a few hours after casting. A wet
curing routine was followed for 5 days, where the concrete was wetted with water daily and
covered with wet burlap and plastic. Compressive strength tests on the cylinders were
conducted at 4, 7, and 12 days. Upon achieving a concrete strength equal to 18 MPa, the
wall specimens were stripped, rotated, and stacked horizontally in preparation for testing.
3.4 Material Properties
3.4.1 Concrete
The typical concrete strengths used in the PVC encased walls varied between 20 and 32 MPa.
A mix was selected with a nominal compressive strength of 26 MPa. The concrete mix had a
maximum aggregate size of 10 mm. Super plasticizers and retarders were used to provide a
workable concrete. The actual slump for the mix was 210 mm.
Compressive strength tests were conducted on concrete cylinders cast from the mix. Table
3.3 shows the average compressive strength at different ages. The average compressive
strength represents the average strength of 6 tested cylinders. The concrete strength was 21.8
MPa and 24.0 MPa at 28 and 56 days, respectively. The testing of the walls began at 56 days.
Cylinders were tested after the wall testing was completed (116 days). The average strength
of the concrete at this time was 27.6 ± 0.7 MPa.
30
Table 3.3: Average concrete strength
Day Concrete compressive strength
(MPa)
4 10.8 ± 0.2
7 14.3 ± 0.5
12 18.1 ± 0.6
21 20.7 ± 0.5
28 21.8 ± 0.7
56 24.0 ± 0.3
116 27.6 ± 0.7
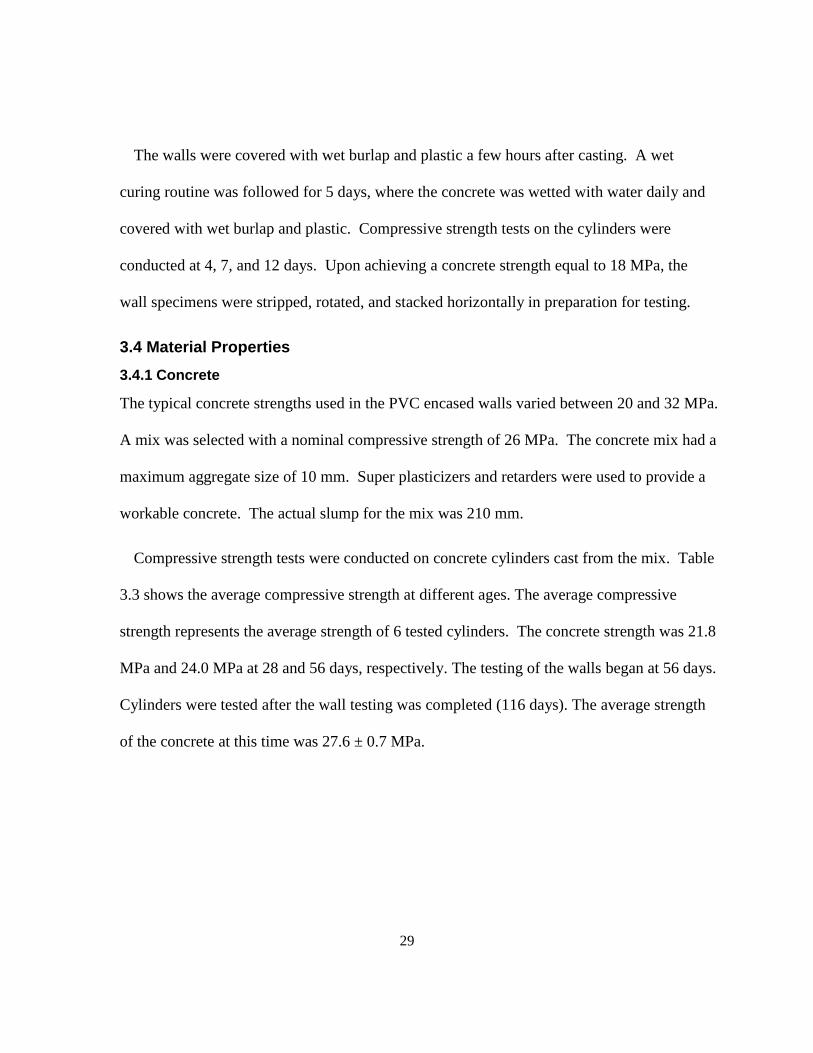
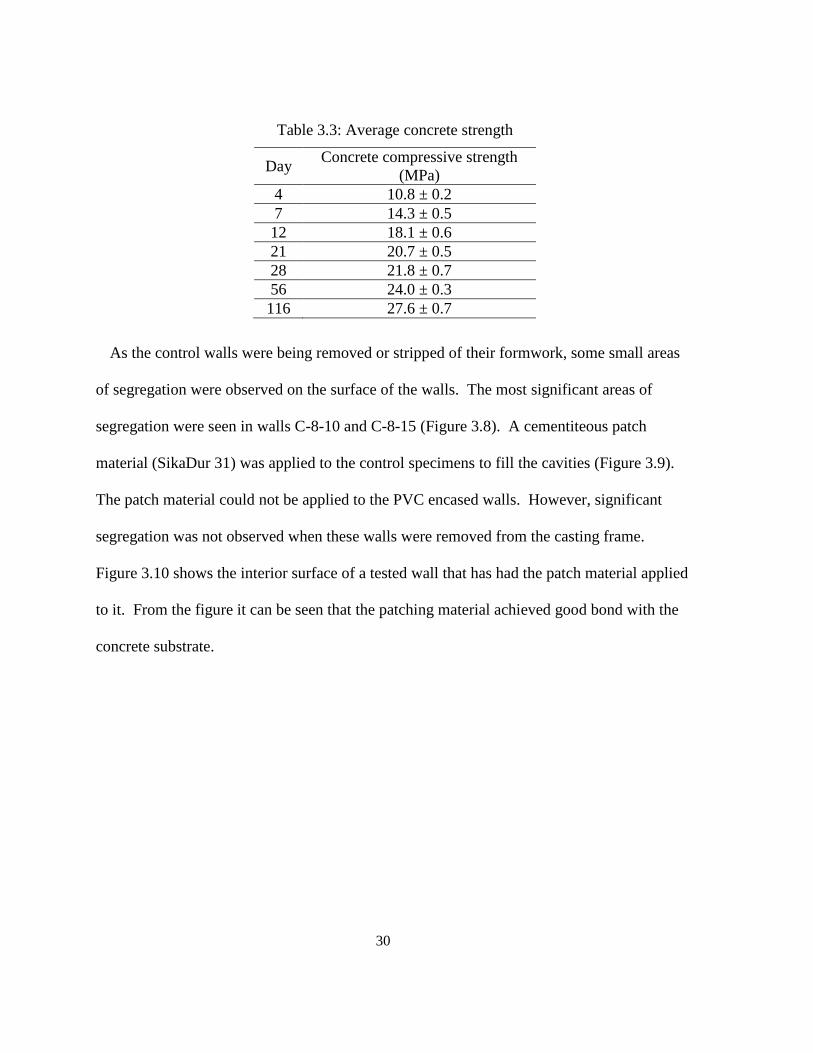
As the control walls were being removed or stripped of their formwork, some small areas
of segregation were observed on the surface of the walls. The most significant areas of
segregation were seen in walls C-8-10 and C-8-15 (Figure 3.8). A cementiteous patch
material (SikaDur 31) was applied to the control specimens to fill the cavities (Figure 3.9).
The patch material could not be applied to the PVC encased walls. However, significant
segregation was not observed when these walls were removed from the casting frame.
Figure 3.10 shows the interior surface of a tested wall that has had the patch material applied
to it. From the figure it can be seen that the patching material achieved good bond with the
concrete substrate.
31
Figure 3.8: Segregation present on control wall specimens
Figure 3.9: Example of patch material applied to concrete wall with segregation.
32
Figure 3.10: Evidence of bond achieved between concrete and patch material.
3.4.2 Steel
Reinforcing steel rebars (10M and 15M) were used. Table 3.4 shows the mechanical
properties of the rebars as provided by the manufacturer.
Table 3.4: Properties of reinforcing steel
Bar Size Yield strength (MPa) Ultimate strength (MPa) Elongation (%)
10M 486 575 16.0
15M 478 580 18.0
3.4.3 Polyvinyl Chloride (PVC)
The properties of the polyvinyl chloride (PVC) as provided by the manufacturer are given in
Table 3.5.
Table 3.5: Properties of PVC
Property Value (MPa)
Tensile strength 45.9
Tensile modulus 2,896
Flexural strength 90
Flexural modulus 2,965
33
3.5 Instrumentation and Test Set-up
Strain gauges were supplied by Tokyo Sokki Kenkyujo Co. Ltd. The strain gauges had a
resistance of 120±0.3 ohms with a thermal expansion of 11 PPM/C. For each wall, two
strain gauges were mounted at mid-span on two longitudinal rebars (outer and middle).
Then, the gauge was waxed and protected with electrical tape to ensure protection of the
gauge during handling and casting. (Figure 3.12)
Figure 3.11: Protected strain gauge before assembly
Once the walls were cast, additional strain gauges were mounted on the compression side
prior to testing. For the control specimens, two concrete strain gauges were placed on the
compression face of the wall; one at the centerline of the cross section and another close to
the edge of the cross section. For the PVC encased specimens, cuts were made through the
PVC panel in the compression zone in order for a strain gauge (60 mm long) to be adhered to
the concrete surface. Also, high elasticity strain gauges (5 mm long) were mounted on to the
tension and compression faces of the PVC panels (Figure 3.13). Four PVC strain gauges
were used to monitor the behaviour of each PVC encased specimen.
34
Figure 3.12: Concrete and PVC strain gauges on the compression face of the wall
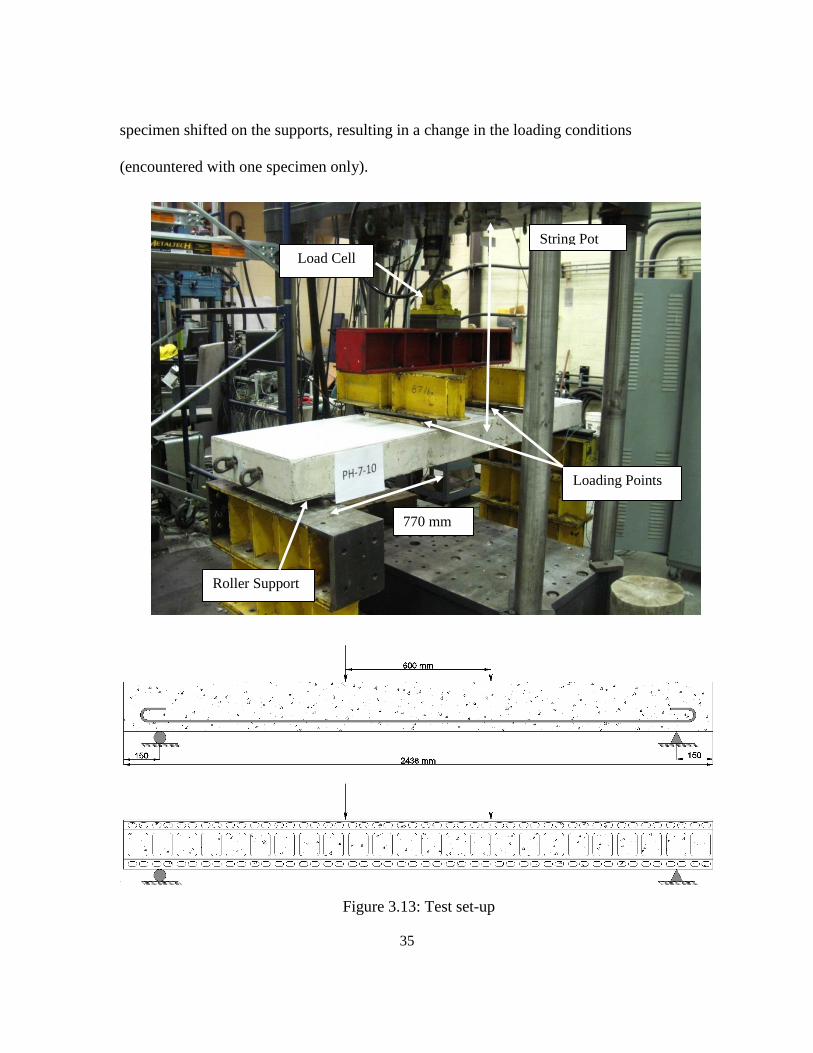
The walls were tested in four-point bending using a servo-hydraulic actuator controlled by
a MTS-Digital GT controller. The shear span was 760 mm and the constant moment region
was 600 mm as shown in Figure 3.14. The load was applied at a rate of 2.5 mm/min. The
duration of the tests varied between 60 and 120 minutes. The wall was supported on a hinge
support at one end and a roller support at the other end. The hinge support was a cylindrical
bar welded to a flat plate and the roller support was a steel cylinder between two curved
plates. The load was measured using a 500 kN load cell. The deflection of the wall at mid
span was measured using two external string pots attached to the sides of the specimen. The
test was stopped when the load dropped by more than 20% of the peak load or if the
Concrete gauges
PVC gauges
35
specimen shifted on the supports, resulting in a change in the loading conditions
(encountered with one specimen only).
Figure 3.13: Test set-up
Load Cell
Loading Points
String Pot
770 mm
Roller Support
36
Chapter 4: Experimental Test Results
4.1 Introduction
In this chapter, the test results from the control specimens and PVC encased specimens are
presented and compared. The results include the modes of failure observed, the load versus
deflection behaviour, and the load versus strain behaviour of the different components of the
walls.
4.2 Behaviour of the Control Specimens
4.2.1 Modes of Failure
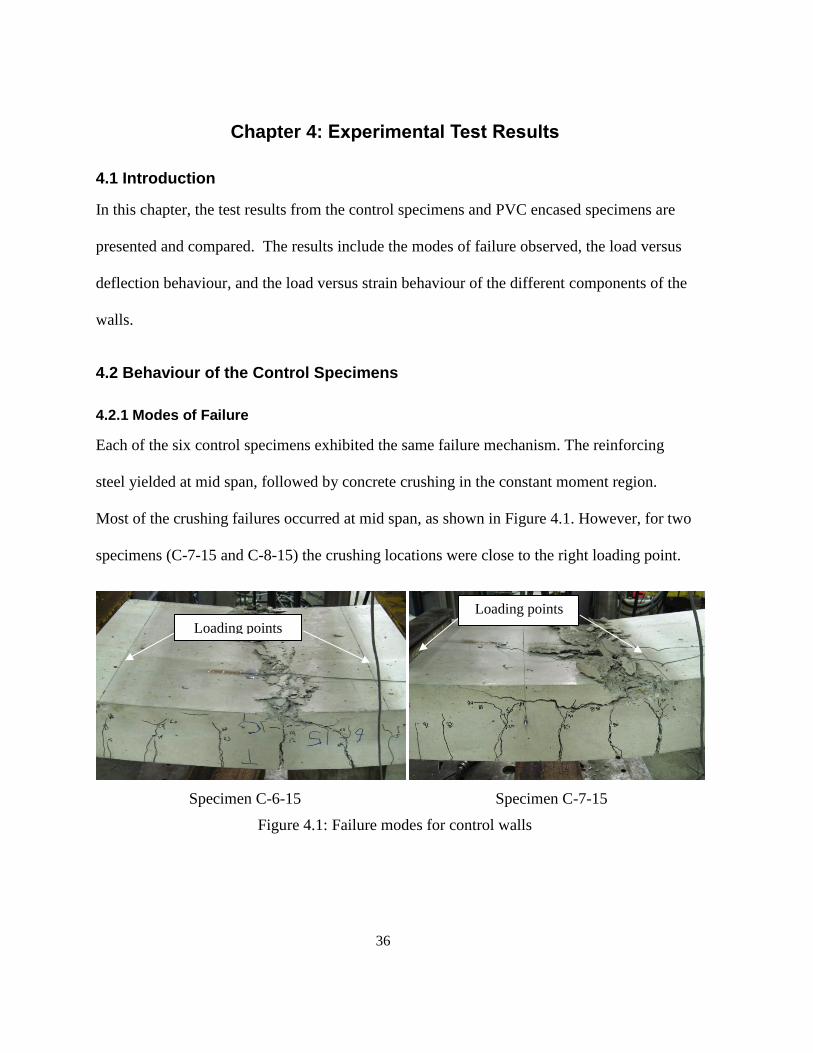
Each of the six control specimens exhibited the same failure mechanism. The reinforcing
steel yielded at mid span, followed by concrete crushing in the constant moment region.
Most of the crushing failures occurred at mid span, as shown in Figure 4.1. However, for two
specimens (C-7-15 and C-8-15) the crushing locations were close to the right loading point.
Specimen C-6-15
Specimen C-7-15
Figure 4.1: Failure modes for control walls
Loading points
Loading points
37
4.2.2 General Behaviour
Cracks first appeared at mid span in the constant moment region. As the load increased,
cracks continued to form at a relatively even spacing between and just beyond the loading
points. As the load increased further, the cracks propagated towards the compression face of
the specimen. Once the steel yielded, the cracks in the constant moment region widened
significantly as the curvature of the wall increased. At failure, the widest tension cracks were
at the sections where the concrete crushed on the compression face.
4.2.3 Flexural Behaviour
4.2.3.1 Load-Deflection
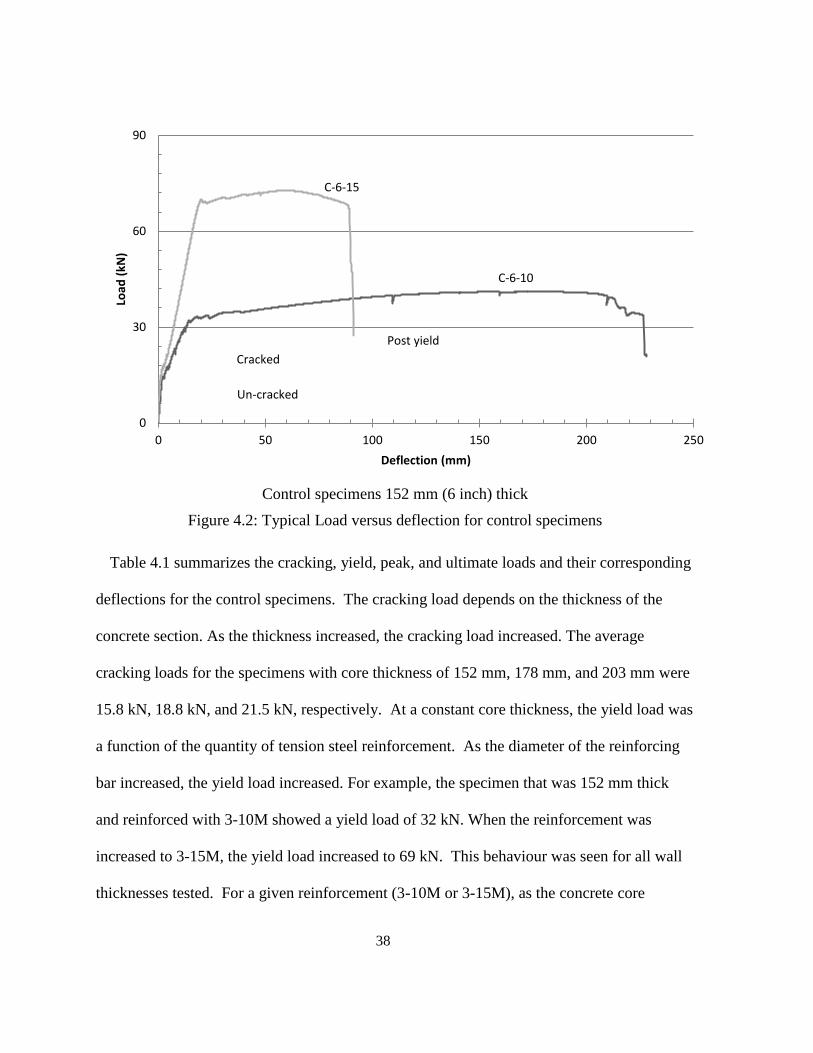
The typical load versus deflection behaviour is presented in Figure 4.2. The vertical axis
represents the applied load (kN) and the horizontal axis represents the mid span deflection
(mm). The specimens showed the same load versus deflection behaviour, which can be
described in three distinct phases; un-cracked, cracked, and post yield. The un-cracked phase
refers to the rapid rise in load with minimal deflection (< 2 mm) until the cracking load is
reached. The cracked phase occurs between the cracking and yield loads, where the load
increases linearly with deflection. The stiffness in this phase is reduced compared to the un-
cracked phase. At the yield load, the post yield phase starts where the deflection of the
specimen increases rapidly in comparison to the load.
38
Control specimens 152 mm (6 inch) thick
Figure 4.2: Typical Load versus deflection for control specimens
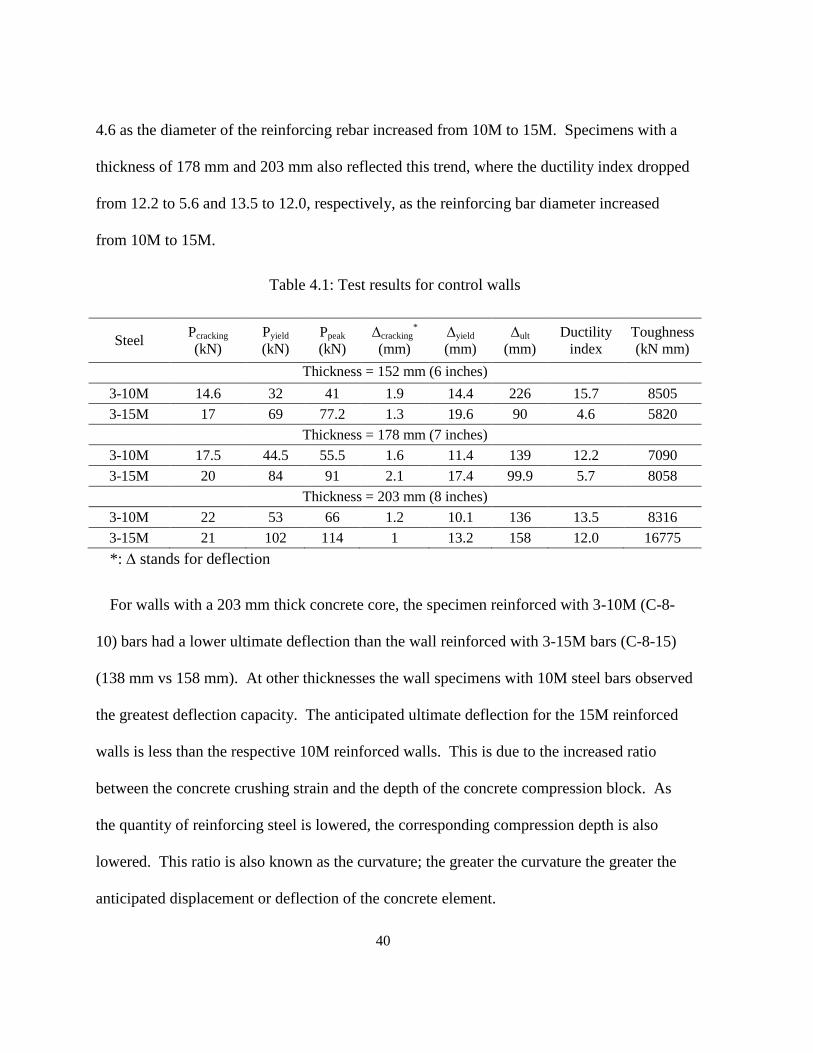
Table 4.1 summarizes the cracking, yield, peak, and ultimate loads and their corresponding
deflections for the control specimens. The cracking load depends on the thickness of the
concrete section. As the thickness increased, the cracking load increased. The average
cracking loads for the specimens with core thickness of 152 mm, 178 mm, and 203 mm were
15.8 kN, 18.8 kN, and 21.5 kN, respectively. At a constant core thickness, the yield load was
a function of the quantity of tension steel reinforcement. As the diameter of the reinforcing
bar increased, the yield load increased. For example, the specimen that was 152 mm thick
and reinforced with 3-10M showed a yield load of 32 kN. When the reinforcement was
increased to 3-15M, the yield load increased to 69 kN. This behaviour was seen for all wall
thicknesses tested. For a given reinforcement (3-10M or 3-15M), as the concrete core
Cracked
Post yield
C-6-10
Un-cracked
C-6-15
0
30
60
90
0 50 100 150 200 250
Load
(kN
)
Deflection (mm)
39
thickness increased the yield load increased. This is mainly due to the increased depth of the
reinforcing steel in relation to the concrete compression block increased, thus improving the
load resistance at yielding. For example, a 152 mm thick wall reinforced with 3-10M
reinforcement yielded at 32 kN, while the equivalent beam with a 178 mm thickness yielded
at 44.5 kN.
Similar to the yield loads, the peak loads of the specimens increased as the concrete core
thickness and reinforcing steel increased. Specimens with a core thickness of 152 mm (6
inches) showed peak loads of 41 kN and 77.2 kN when reinforced with 3-10M and 3-15M
rebars, respectively. When the concrete core thickness was increased to 178 mm (7 inches),
the peak loads increased to 55.5 kN and 91 kN at a reinforcement equal to 3-10M and 3-15M
rebars, respectively. The walls with a core thickness of 203 mm (8 inches) showed peak
loads of 66 kN and 114 kN when reinforced with 3-10M and 3-15M, respectively.
The deflection at cracking load was less than 2 mm for each of the control specimens. For
a given concrete core thickness, the deflection at the yield load increased as the
reinforcement increased. For a given reinforcement, the deflection at the yield load decreased
as the concrete core thickness increased. The ultimate deflections ranged from 90 mm to 226
mm for the 152 mm thick walls, 100 mm to 139 mm for the 178 mm thick specimens, and
136 mm to 158 mm for the 203 mm thick specimens, depending on the reinforcement. The
ductility index is a ratio between the maximum (ultimate) deflection and yield deflection. A
low ductility index indicates a brittle specimen while higher values indicate a more ductile
wall. For a given core thickness, as the amount of reinforcing steel increased, the ductility
index decreased. The ductility index of the 152 mm (6 inch) walls decreased from 15.7 to
40
4.6 as the diameter of the reinforcing rebar increased from 10M to 15M. Specimens with a
thickness of 178 mm and 203 mm also reflected this trend, where the ductility index dropped
from 12.2 to 5.6 and 13.5 to 12.0, respectively, as the reinforcing bar diameter increased
from 10M to 15M.
Table 4.1: Test results for control walls
Steel Pcracking
(kN)
Pyield
(kN)
Ppeak
(kN)
Δcracking*
(mm)
Δyield
(mm)
Δult
(mm)
Ductility
index
Toughness
(kN mm)
Thickness = 152 mm (6 inches)
3-10M 14.6 32 41 1.9 14.4 226 15.7 8505
3-15M 17 69 77.2 1.3 19.6 90 4.6 5820
Thickness = 178 mm (7 inches)
3-10M 17.5 44.5 55.5 1.6 11.4 139 12.2 7090
3-15M 20 84 91 2.1 17.4 99.9 5.7 8058
Thickness = 203 mm (8 inches)
3-10M 22 53 66 1.2 10.1 136 13.5 8316
3-15M 21 102 114 1 13.2 158 12.0 16775
*: stands for deflection
For walls with a 203 mm thick concrete core, the specimen reinforced with 3-10M (C-8-
10) bars had a lower ultimate deflection than the wall reinforced with 3-15M bars (C-8-15)
(138 mm vs 158 mm). At other thicknesses the wall specimens with 10M steel bars observed
the greatest deflection capacity. The anticipated ultimate deflection for the 15M reinforced
walls is less than the respective 10M reinforced walls. This is due to the increased ratio
between the concrete crushing strain and the depth of the concrete compression block. As
the quantity of reinforcing steel is lowered, the corresponding compression depth is also
lowered. This ratio is also known as the curvature; the greater the curvature the greater the
anticipated displacement or deflection of the concrete element.
41
This change in behaviour of the 203 mm core walls from the 152mm and 176mm control
walls was attributed to the following reasons. First, the failure of C-8-15 occurred
underneath one of the loading points. As such, the concrete at this location may be benefited
from local confinement of the crushing zone, prolonging the ultimate failure and extending
the deflection capacity of the wall. In addition, both wall specimens had experienced
noticeable segregation of the concrete core at the mid span (test location). Figure 4.3
illustrates the extent of the weaker concrete paste observed on the surface of the control walls
(right). The depth of the weaker paste into the core of the wall (left) was not significant.
While the depth of this damage was not extensive enough to compromise the integrity of the
walls, the resulting changes in section reduction influenced where the failure hinges formed.
Figure 4.3: Example of surface damage observed on C-8-15, with solid concrete underneath.
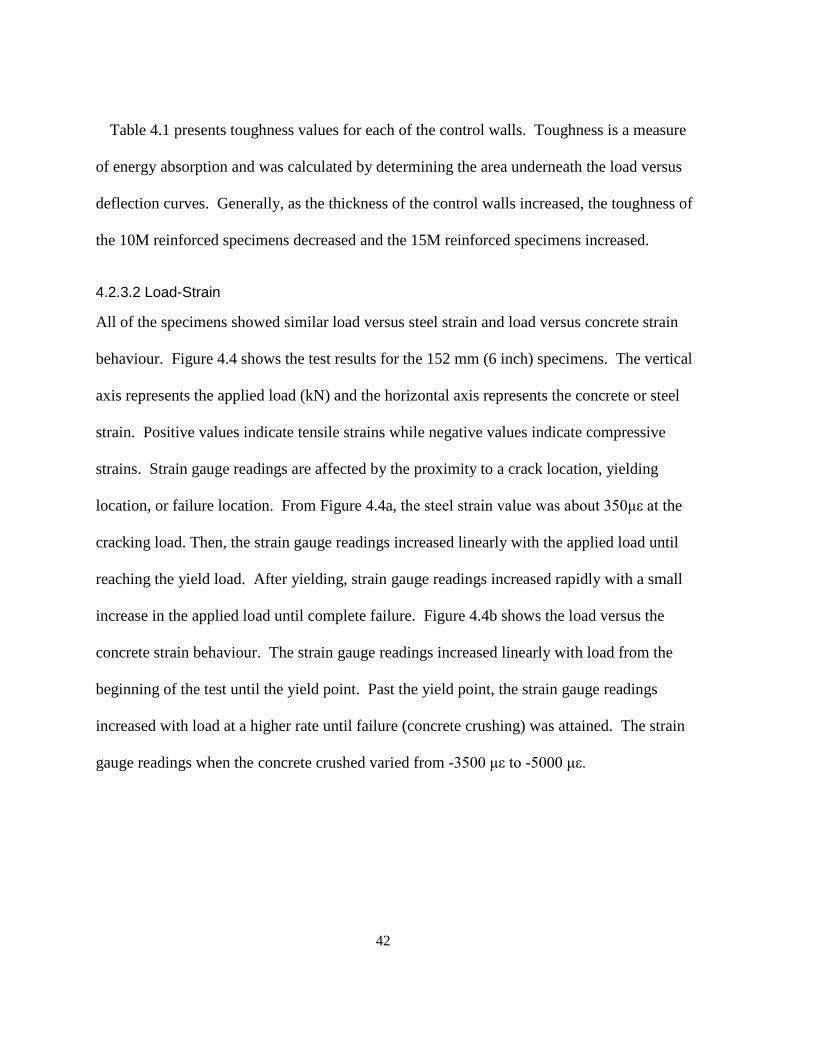
42
Table 4.1 presents toughness values for each of the control walls. Toughness is a measure
of energy absorption and was calculated by determining the area underneath the load versus
deflection curves. Generally, as the thickness of the control walls increased, the toughness of
the 10M reinforced specimens decreased and the 15M reinforced specimens increased.
4.2.3.2 Load-Strain
All of the specimens showed similar load versus steel strain and load versus concrete strain
behaviour. Figure 4.4 shows the test results for the 152 mm (6 inch) specimens. The vertical
axis represents the applied load (kN) and the horizontal axis represents the concrete or steel
strain. Positive values indicate tensile strains while negative values indicate compressive
strains. Strain gauge readings are affected by the proximity to a crack location, yielding
location, or failure location. From Figure 4.4a, the steel strain value was about 350με at the
cracking load. Then, the strain gauge readings increased linearly with the applied load until
reaching the yield load. After yielding, strain gauge readings increased rapidly with a small
increase in the applied load until complete failure. Figure 4.4b shows the load versus the
concrete strain behaviour. The strain gauge readings increased linearly with load from the
beginning of the test until the yield point. Past the yield point, the strain gauge readings
increased with load at a higher rate until failure (concrete crushing) was attained. The strain
gauge readings when the concrete crushed varied from -3500 με to -5000 με.
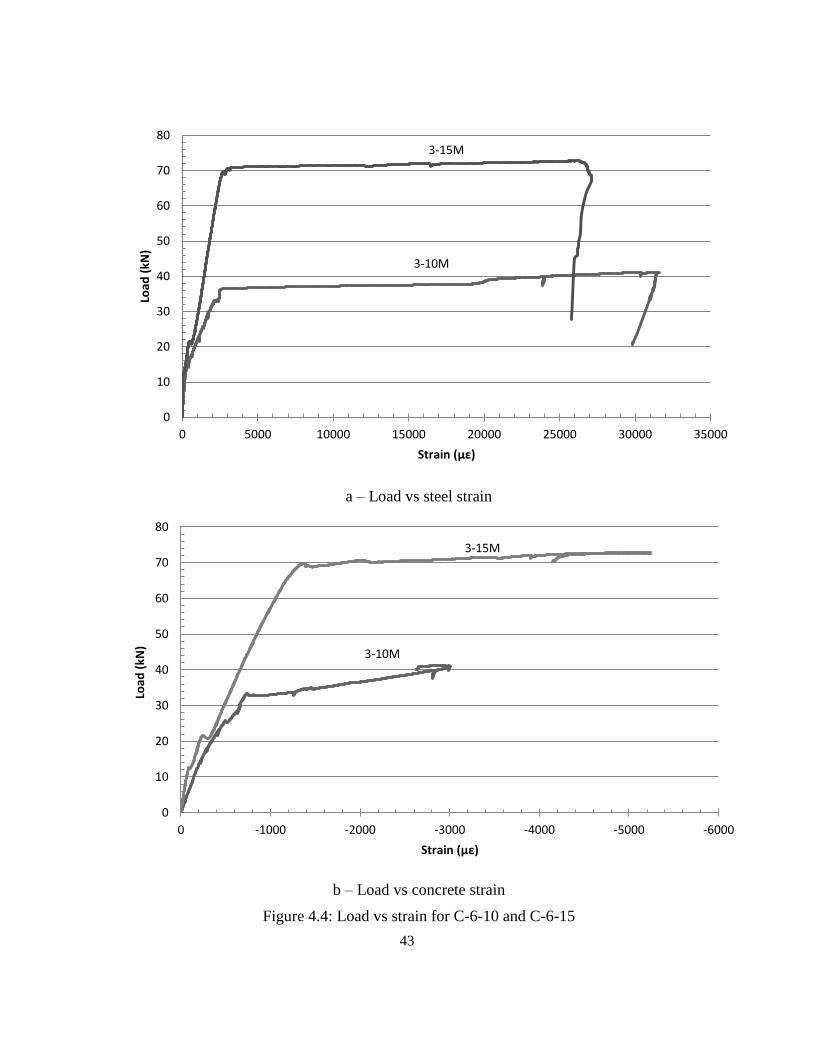
43
a – Load vs steel strain
b – Load vs concrete strain
Figure 4.4: Load vs strain for C-6-10 and C-6-15
3-10M
3-15M
0
10
20
30
40
50
60
70
80
0 5000 10000 15000 20000 25000 30000 35000
Load
(kN
)
Strain (µε)
3-10M
3-15M
0
10
20
30
40
50
60
70
80
-6000-5000-4000-3000-2000-10000
Load
(kN
)
Strain (µε)
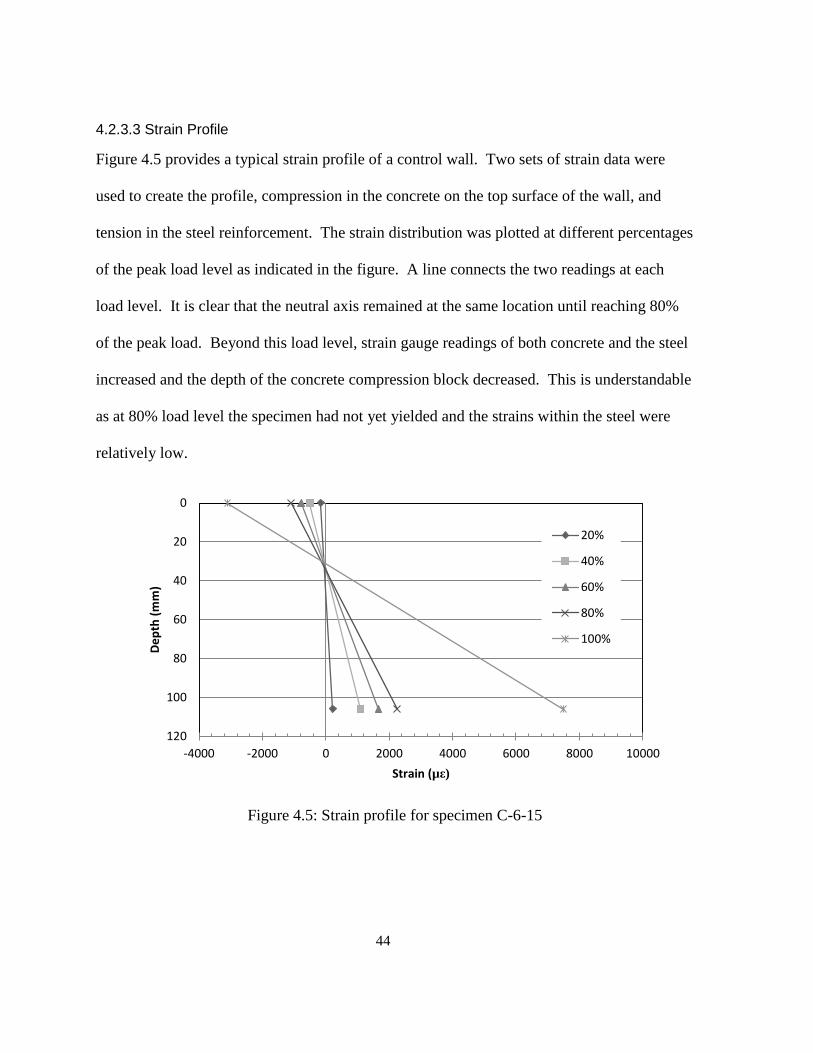
44
4.2.3.3 Strain Profile
Figure 4.5 provides a typical strain profile of a control wall. Two sets of strain data were
used to create the profile, compression in the concrete on the top surface of the wall, and
tension in the steel reinforcement. The strain distribution was plotted at different percentages
of the peak load level as indicated in the figure. A line connects the two readings at each
load level. It is clear that the neutral axis remained at the same location until reaching 80%
of the peak load. Beyond this load level, strain gauge readings of both concrete and the steel
increased and the depth of the concrete compression block decreased. This is understandable
as at 80% load level the specimen had not yet yielded and the strains within the steel were
relatively low.
Figure 4.5: Strain profile for specimen C-6-15
0
20
40
60
80
100
120
-4000 -2000 0 2000 4000 6000 8000 10000
De
pth
(m
m)
Strain (µε)
20%
40%
60%
80%
100%
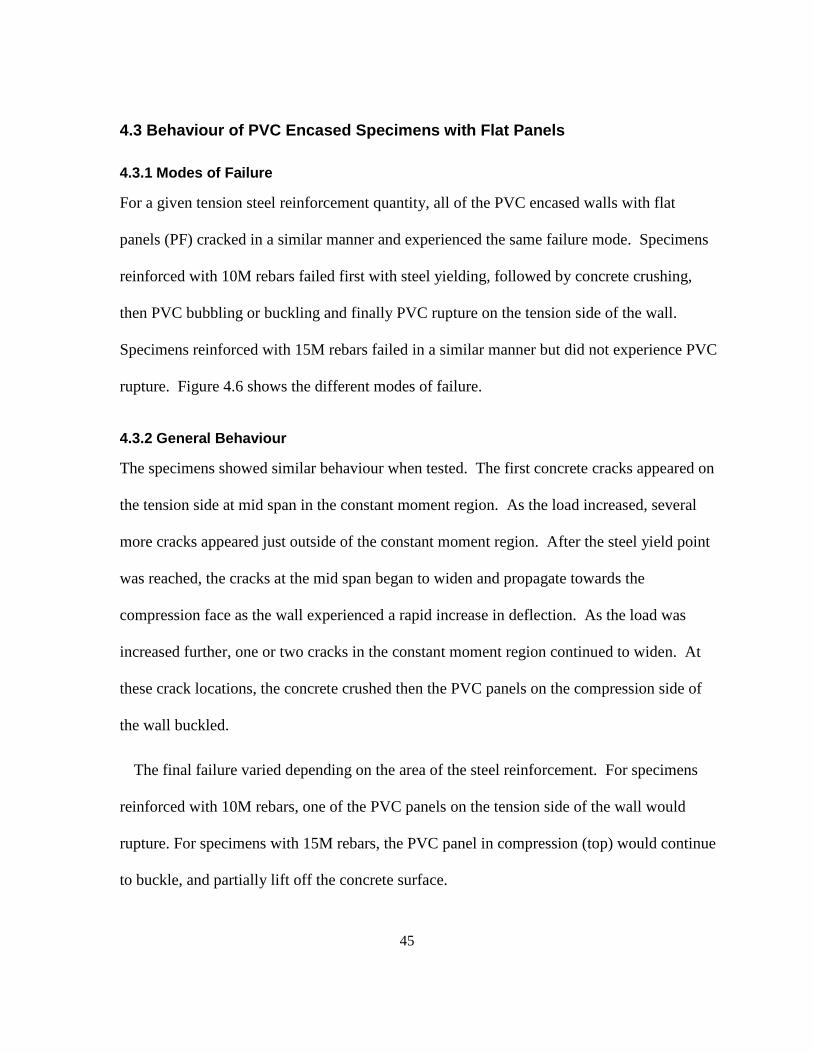
45
4.3 Behaviour of PVC Encased Specimens with Flat Panels
4.3.1 Modes of Failure
For a given tension steel reinforcement quantity, all of the PVC encased walls with flat
panels (PF) cracked in a similar manner and experienced the same failure mode. Specimens
reinforced with 10M rebars failed first with steel yielding, followed by concrete crushing,
then PVC bubbling or buckling and finally PVC rupture on the tension side of the wall.
Specimens reinforced with 15M rebars failed in a similar manner but did not experience PVC
rupture. Figure 4.6 shows the different modes of failure.
4.3.2 General Behaviour
The specimens showed similar behaviour when tested. The first concrete cracks appeared on
the tension side at mid span in the constant moment region. As the load increased, several
more cracks appeared just outside of the constant moment region. After the steel yield point
was reached, the cracks at the mid span began to widen and propagate towards the
compression face as the wall experienced a rapid increase in deflection. As the load was
increased further, one or two cracks in the constant moment region continued to widen. At
these crack locations, the concrete crushed then the PVC panels on the compression side of
the wall buckled.
The final failure varied depending on the area of the steel reinforcement. For specimens
reinforced with 10M rebars, one of the PVC panels on the tension side of the wall would
rupture. For specimens with 15M rebars, the PVC panel in compression (top) would continue
to buckle, and partially lift off the concrete surface.
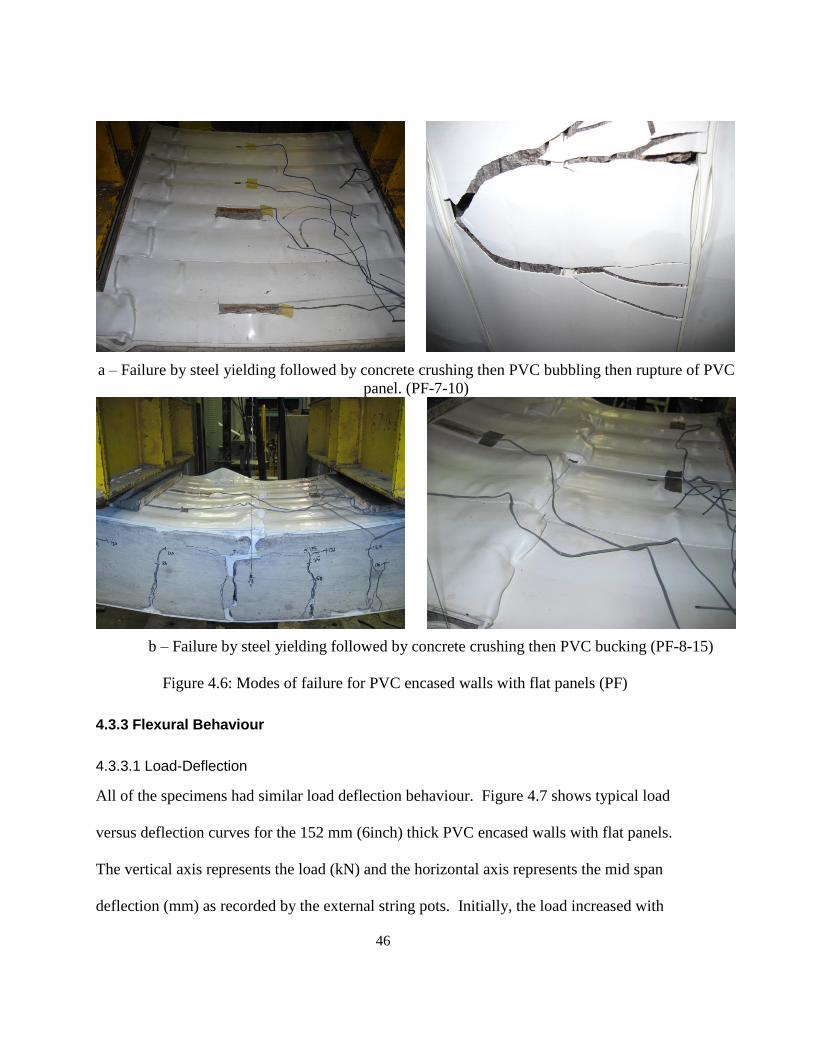
46
a – Failure by steel yielding followed by concrete crushing then PVC bubbling then rupture of PVC
panel. (PF-7-10)
b – Failure by steel yielding followed by concrete crushing then PVC bucking (PF-8-15)
Figure 4.6: Modes of failure for PVC encased walls with flat panels (PF)
4.3.3 Flexural Behaviour
4.3.3.1 Load-Deflection
All of the specimens had similar load deflection behaviour. Figure 4.7 shows typical load
versus deflection curves for the 152 mm (6inch) thick PVC encased walls with flat panels.
The vertical axis represents the load (kN) and the horizontal axis represents the mid span
deflection (mm) as recorded by the external string pots. Initially, the load increased with
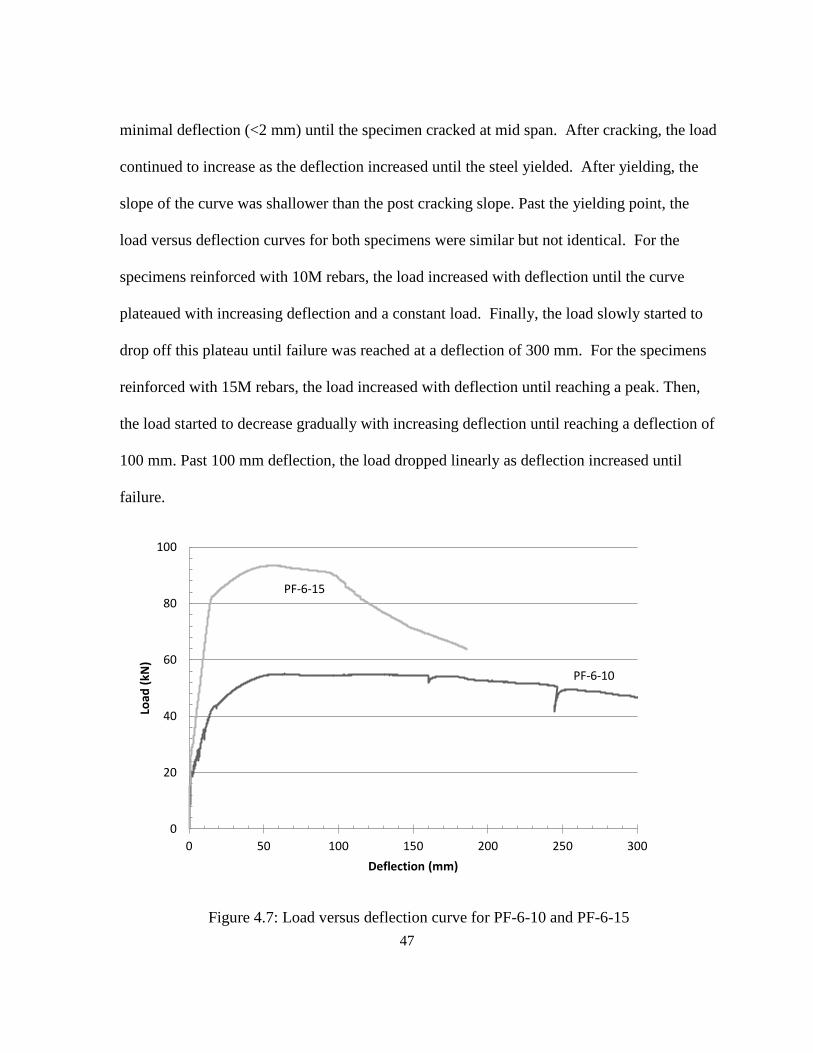
47
minimal deflection (<2 mm) until the specimen cracked at mid span. After cracking, the load
continued to increase as the deflection increased until the steel yielded. After yielding, the
slope of the curve was shallower than the post cracking slope. Past the yielding point, the
load versus deflection curves for both specimens were similar but not identical. For the
specimens reinforced with 10M rebars, the load increased with deflection until the curve
plateaued with increasing deflection and a constant load. Finally, the load slowly started to
drop off this plateau until failure was reached at a deflection of 300 mm. For the specimens
reinforced with 15M rebars, the load increased with deflection until reaching a peak. Then,
the load started to decrease gradually with increasing deflection until reaching a deflection of
100 mm. Past 100 mm deflection, the load dropped linearly as deflection increased until
failure.
Figure 4.7: Load versus deflection curve for PF-6-10 and PF-6-15
PF-6-10
PF-6-15
0
20
40
60
80
100
0 50 100 150 200 250 300
Load
(kN
)
Deflection (mm)
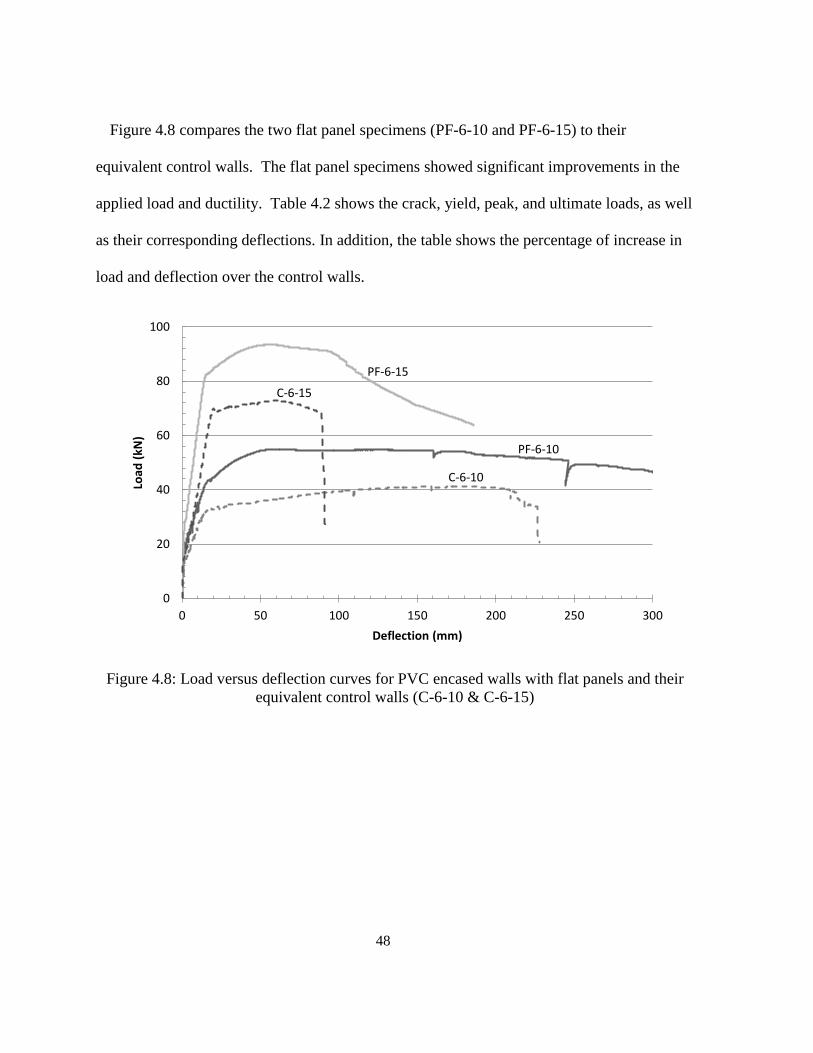
48
Figure 4.8 compares the two flat panel specimens (PF-6-10 and PF-6-15) to their
equivalent control walls. The flat panel specimens showed significant improvements in the
applied load and ductility. Table 4.2 shows the crack, yield, peak, and ultimate loads, as well
as their corresponding deflections. In addition, the table shows the percentage of increase in
load and deflection over the control walls.
Figure 4.8: Load versus deflection curves for PVC encased walls with flat panels and their
equivalent control walls (C-6-10 & C-6-15)
PF-6-10
PF-6-15
C-6-10
C-6-15
0
20
40
60
80
100
0 50 100 150 200 250 300
Load
(kN
)
Deflection (mm)
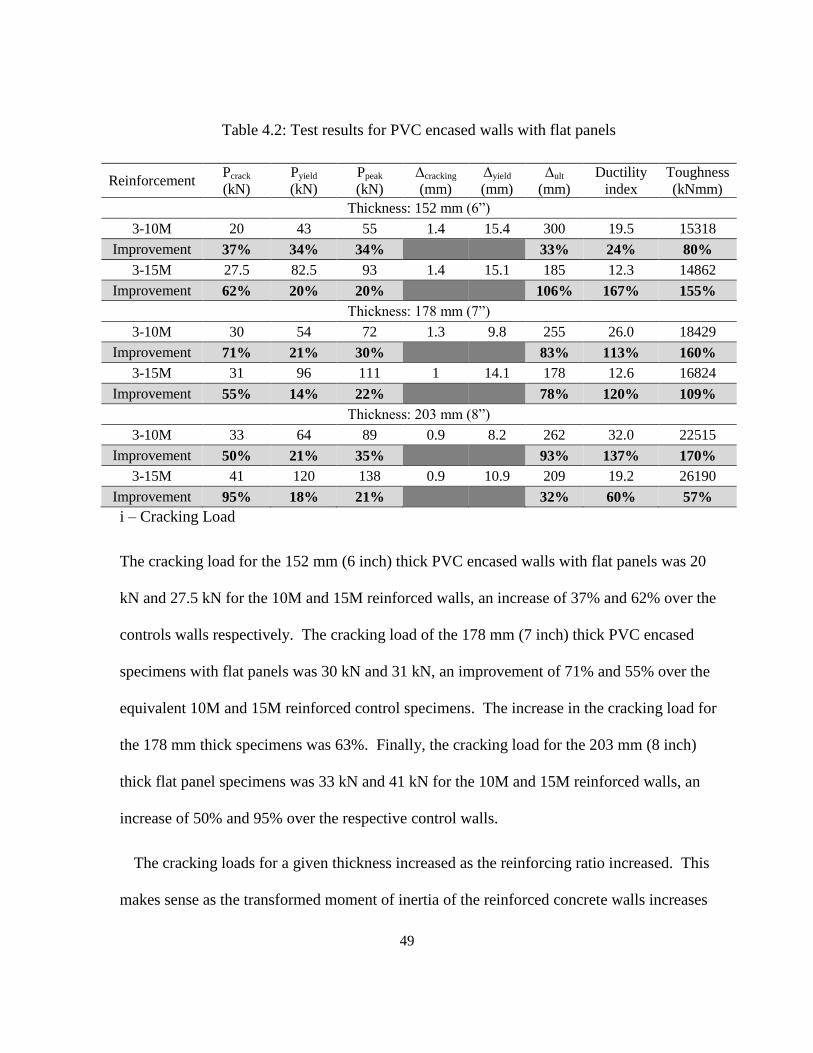
49
Table 4.2: Test results for PVC encased walls with flat panels
Reinforcement Pcrack
(kN)
Pyield
(kN)
Ppeak
(kN)
Δcracking
(mm)
Δyield
(mm)
Δult
(mm)
Ductility
index
Toughness
(kNmm)
Thickness: 152 mm (6”)
3-10M 20 43 55 1.4 15.4 300 19.5 15318
Improvement 37% 34% 34%
33% 24% 80%
3-15M 27.5 82.5 93 1.4 15.1 185 12.3 14862
Improvement 62% 20% 20%
106% 167% 155%
Thickness: 1 mm ( ”)
3-10M 30 54 72 1.3 9.8 255 26.0 18429
Improvement 71% 21% 30%
83% 113% 160%
3-15M 31 96 111 1 14.1 178 12.6 16824
Improvement 55% 14% 22%
78% 120% 109%
Thickness: 203 mm ( ”)
3-10M 33 64 89 0.9 8.2 262 32.0 22515
Improvement 50% 21% 35%
93% 137% 170%
3-15M 41 120 138 0.9 10.9 209 19.2 26190
Improvement 95% 18% 21%
32% 60% 57%
i – Cracking Load
The cracking load for the 152 mm (6 inch) thick PVC encased walls with flat panels was 20
kN and 27.5 kN for the 10M and 15M reinforced walls, an increase of 37% and 62% over the
controls walls respectively. The cracking load of the 178 mm (7 inch) thick PVC encased
specimens with flat panels was 30 kN and 31 kN, an improvement of 71% and 55% over the
equivalent 10M and 15M reinforced control specimens. The increase in the cracking load for
the 178 mm thick specimens was 63%. Finally, the cracking load for the 203 mm (8 inch)
thick flat panel specimens was 33 kN and 41 kN for the 10M and 15M reinforced walls, an
increase of 50% and 95% over the respective control walls.
The cracking loads for a given thickness increased as the reinforcing ratio increased. This
makes sense as the transformed moment of inertia of the reinforced concrete walls increases
50
as the quantity of steel increases. There was no distinct correlation between the test variables
and the observed improvement in the cracking load. As the concrete in the control specimens
was subject to local areas of honeycombing, effectively reducing the effective wall cross-
section, any further observations outside of the recorded improvement is difficult.
The deflection at cracking for the PVC encased specimens with flat panels varied between
1 mm and 1.5 mm. On average, they were close to the deflections of the equivalent control
walls at cracking.
ii – Yield Load
PVC encased walls with flat panels showed a higher yield load than the equivalent control
specimens. The enhancement was influenced by the quantity of reinforcing steel, with
specimens reinforced with 3-10M rebars showing greater improvement than specimens with
3-15M rebars. The yield loads for the PVC encased walls reinforced with 10M rebars were
43 kN, 54 kN, and 64 kN for the 152 mm, 178 mm, and 203 mm thick walls, respectively.
The equivalent control specimens showed yield loads of 32 kN, 44.5 kN, and 53 kN,
respectively. Therefore, the increase in the yield load was 34%, 21%, and 21% for the 152
mm, 178 mm, and 203 mm thick walls, respectively.
The yield load for the flat panel encased walls reinforced with 3-15M rebars was 82.5 kN,
96 kN, and 120 kN for the 152 mm, 178 mm, and 203 mm thick walls, respectively. The
equivalent control walls showed yield loads of 69 kN, 89 kN, and 102 kN for the 152 mm,
178 mm, and 203 mm thick walls, respectively. Therefore, the increase in the yield load for
51
the walls reinforced with 3-15M rebars was 20%, 14%, and 18% for the 152 mm, 178 mm,
and 203 mm thick walls, respectively.
The observed improvement in the yield load can be attributed to the PVC panel on the
tension side of the wall providing a supplementary tensile force within the cross-section. The
improvement in yield load was most significant for the 10M reinforced walls as the tensile
force in the PVC was the largest relative to the force in the yielding steel bars.
The yield deflection for the PVC encased walls with flat panels and the control walls was
similar. Hence, the presence of the PVC panels did not have a significant influence on the
yield deflection.
iii – Peak Load
The PVC encased walls with flat panels showed an increase in the peak load over the control
specimens. Similar to the yield load results, specimens reinforced with 3-10M rebars showed
a greater improvement than specimens reinforced with 3-15M rebars. The peak loads for the
flat panel encased specimens with 3-10M bars were 55 kN, 72 kN, and 89 kN for 152 mm,
178 mm, and 203 mm thick walls, respectively. The peak loads for the equivalent control
specimens were 41 kN, 55.5 kN and 66 kN for 152 mm, 178 mm, and 203 mm thick walls,
respectively. Therefore, the increase in peak load for the walls reinforced with 3-10M rebars
was 34%, 30%, and 35% for the 152 mm, 178 mm, and 203 mm thick walls, respectively.
The peak loads for flat panel encased walls reinforced with 3-15M rebars were 93 kN, 111
kN, and 138 kN for 152 mm, 178 mm, and 203 mm walls, respectively. The equivalent
control specimens showed peak loads of 77.2 kN, 91 kN and 114 kN, respectively. Hence,
52
the PVC encasement increased the peak loads by 20%, 22%, and 21% for the 152 mm, 178
mm, and 203 mm thick walls, respectively.
As was discussed with the yield load, 10M reinforced walls showed the most significant
improvement as the PVC was able to contribute a more significant portion of the tensile force
within the cross-section. In addition, the high strain values observed in the PVC (>15000 με)
indicate that the PVC was at or approaching the maximum stress value, further increasing the
polymer’s contribution to the cross-section.
The ultimate deflection for the walls with flat panels was significantly higher than the
ultimate deflection for the control walls. The increase in ultimate deflection varied between
32% and 106% as shown in Table 4.2. In addition, the walls were more ductile than their
equivalent control walls, with the ductility index of the specimens varying between 19.2 and
32. For a given wall thickness, the ductility index decreased, as the rebar diameter increased
from 10M to 15M. However, for a given rebar diameter, the ductility index increased, as the
concrete core thickness increased. The presence of the PVC panels increased the ductility
index by a minimum of 24% and a maximum of 167%.
This increased ductility was also reflected in the toughness of the flat panel encased walls.
Improvement in toughness varied from 57% to 170%. For walls reinforced with 3-10M steel
bars, the amount of improvement increased as the wall thickness increased. Conversely, for
walls with 3-15M steel bars, the amount of improvement decreased as the wall thickness
increased. Overall, the presence of the PVC panels significantly improved the energy
53
absorption of the walls. This was due to the PVC containing the crushed concrete surfaces
on the compression side of the walls, prolonging the ultimate failure.
4.3.3.2 Summary of key findings
The following points can be concluded from the load versus deflection behaviour of the PVC
encased walls with flat panels;
1. Cracking load: the flat panels increased the cracking load by an average of 70% but
the cracking deflection remained almost the same.
2. Yield load: the PVC encasement with flat panels increased the yield load of the
concrete walls. The increase depended on the rebar diameter and the concrete core
thickness.
a) The average yield load increase for walls with 3-10M rebars was 25%. For walls
with 3-15M rebars, the average yield load increased 17%. These results indicated
that as the reinforcing ratio increased, the enhancement of the flat panels to the
yield load decreased.
b) the yield deflections were not influenced by the PVC encasement.
3. Peak load: The contribution of the flat panels to the peak load decreased as the
reinforcing ratio increased.
a) PVC encased specimens reinforced with 3-10M rebars showed an average
increase in the peak load of 33% over the control walls. For walls with higher
reinforcement ratios (3-15M bars), the load enhancement dropped to 21% on
average.
54
b) From the literature, in previous similar tests, the increase in peak load was
influenced by the wall thickness. As the wall thickness increased, the effect of the
PVC system on the peak load decreased. This trend was not apparent in the
results reported here. The average increase in peak load for the 152 mm, 178 mm,
and 203 mm thick walls was 27%, 26%, and 28%, respectively.
c) The encasement increased the ultimate deflection and ductility. The increase in
ultimate deflection varied between 32% and 106%. The ductility index for the
walls with flat panels was also improved over the control specimens. The
improvement of ductility index varied from 24% to 167%.
d) The toughness of the PVC encased walls increased significantly for all wall
specimens. The improvement to toughness ranged from 57% to 170% over the
equivalent control walls.
4.3.3.3 Load-Tensile Strain
Tensile forces within the wall specimens were resisted by the steel rebar, PVC panels, and
portions of the PVC connector that were continuous through the wall. Figure 4.9 shows a
typical load versus tensile strain behaviour of the steel and PVC panel. The vertical axis
represents the load (kN) and the horizontal axis represents the strain gauge readings ().
From Figure 4.9, the strains in the PVC and steel were small until the cracking load was
reached (30 kN). After the concrete cracked, the strains in the steel and PVC panels
increased linearly with the load until the steel yielded at 56 kN. Past yielding, the steel strain
gauge failed while the PVC gauge continued to read steadily increasing strain while the load
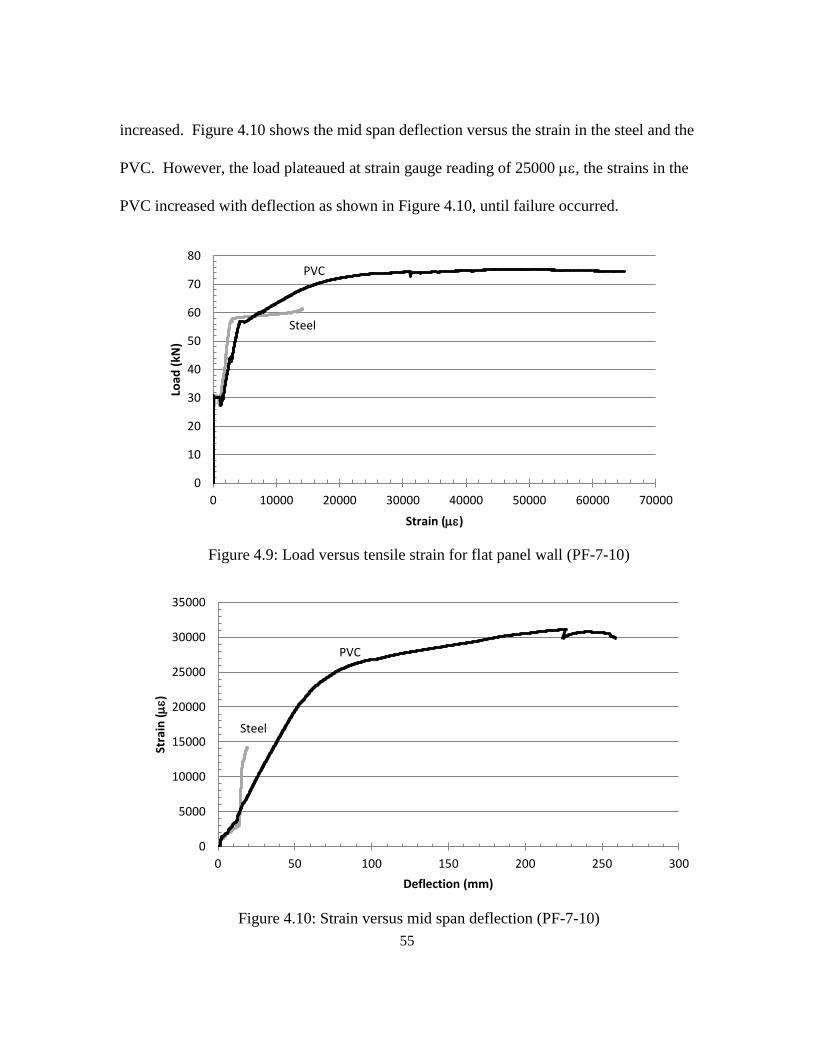
55
increased. Figure 4.10 shows the mid span deflection versus the strain in the steel and the
PVC. However, the load plateaued at strain gauge reading of 25000 , the strains in the
PVC increased with deflection as shown in Figure 4.10, until failure occurred.
Figure 4.9: Load versus tensile strain for flat panel wall (PF-7-10)
Figure 4.10: Strain versus mid span deflection (PF-7-10)
Steel
PVC
0
10
20
30
40
50
60
70
80
0 10000 20000 30000 40000 50000 60000 70000
Load
(kN
)
Strain ()
Steel
PVC
0
5000
10000
15000
20000
25000
30000
35000
0 50 100 150 200 250 300
Stra
in (
)
Deflection (mm)
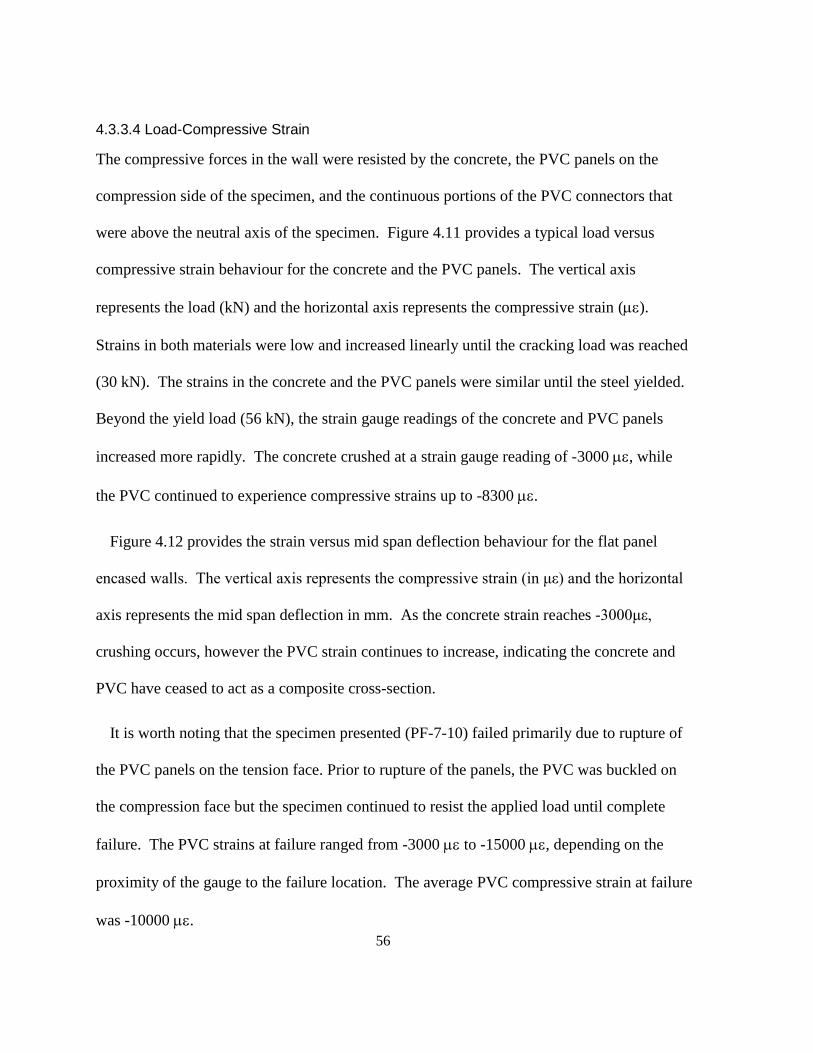
56
4.3.3.4 Load-Compressive Strain
The compressive forces in the wall were resisted by the concrete, the PVC panels on the
compression side of the specimen, and the continuous portions of the PVC connectors that
were above the neutral axis of the specimen. Figure 4.11 provides a typical load versus
compressive strain behaviour for the concrete and the PVC panels. The vertical axis
represents the load (kN) and the horizontal axis represents the compressive strain ().
Strains in both materials were low and increased linearly until the cracking load was reached
(30 kN). The strains in the concrete and the PVC panels were similar until the steel yielded.
Beyond the yield load (56 kN), the strain gauge readings of the concrete and PVC panels
increased more rapidly. The concrete crushed at a strain gauge reading of -3000 , while
the PVC continued to experience compressive strains up to -8300 .
Figure 4.12 provides the strain versus mid span deflection behaviour for the flat panel
encased walls. The vertical axis represents the compressive strain (in με) and the horizontal
axis represents the mid span deflection in mm. As the concrete strain reaches -3000με,
crushing occurs, however the PVC strain continues to increase, indicating the concrete and
PVC have ceased to act as a composite cross-section.
It is worth noting that the specimen presented (PF-7-10) failed primarily due to rupture of
the PVC panels on the tension face. Prior to rupture of the panels, the PVC was buckled on
the compression face but the specimen continued to resist the applied load until complete
failure. The PVC strains at failure ranged from -3000 to -15000 , depending on the
proximity of the gauge to the failure location. The average PVC compressive strain at failure
was -10000 .
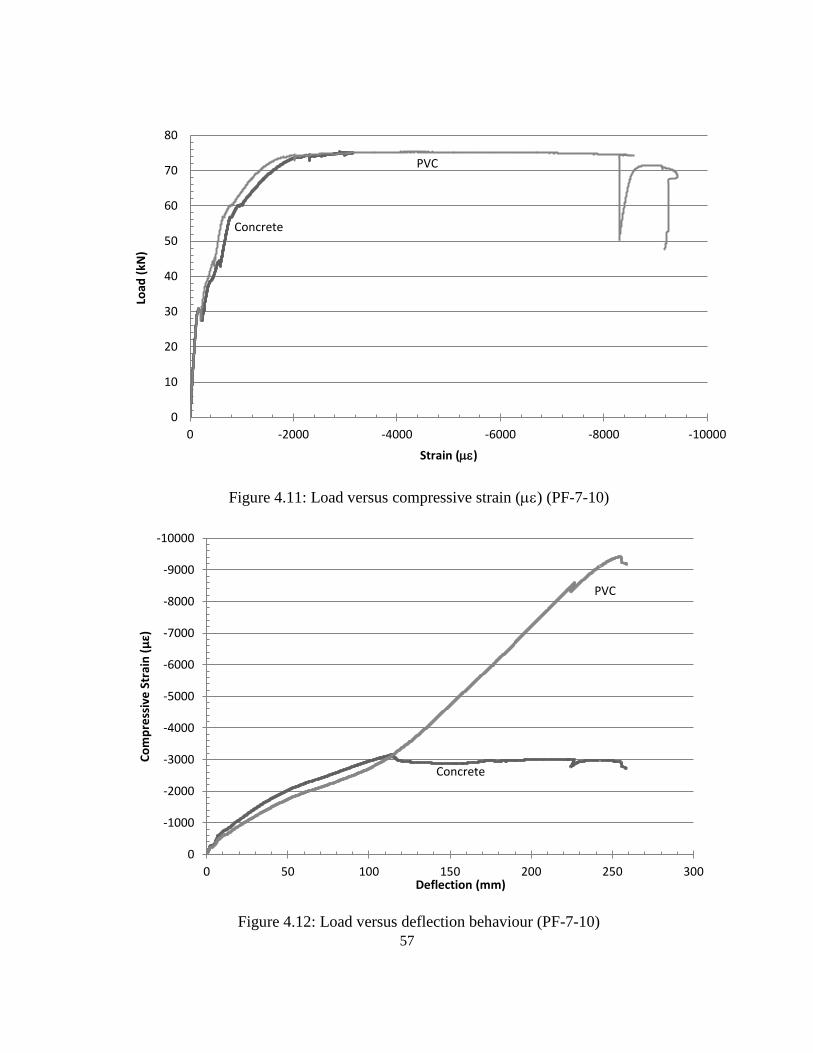
57
Figure 4.11: Load versus compressive strain () (PF-7-10)
Figure 4.12: Load versus deflection behaviour (PF-7-10)
Concrete
PVC
0
10
20
30
40
50
60
70
80
-10000-8000-6000-4000-20000
Load
(kN
)
Strain ()
Concrete
PVC
-10000
-9000
-8000
-7000
-6000
-5000
-4000
-3000
-2000
-1000
0
0 50 100 150 200 250 300
Co
mp
ress
ive
Str
ain
(με)
Deflection (mm)
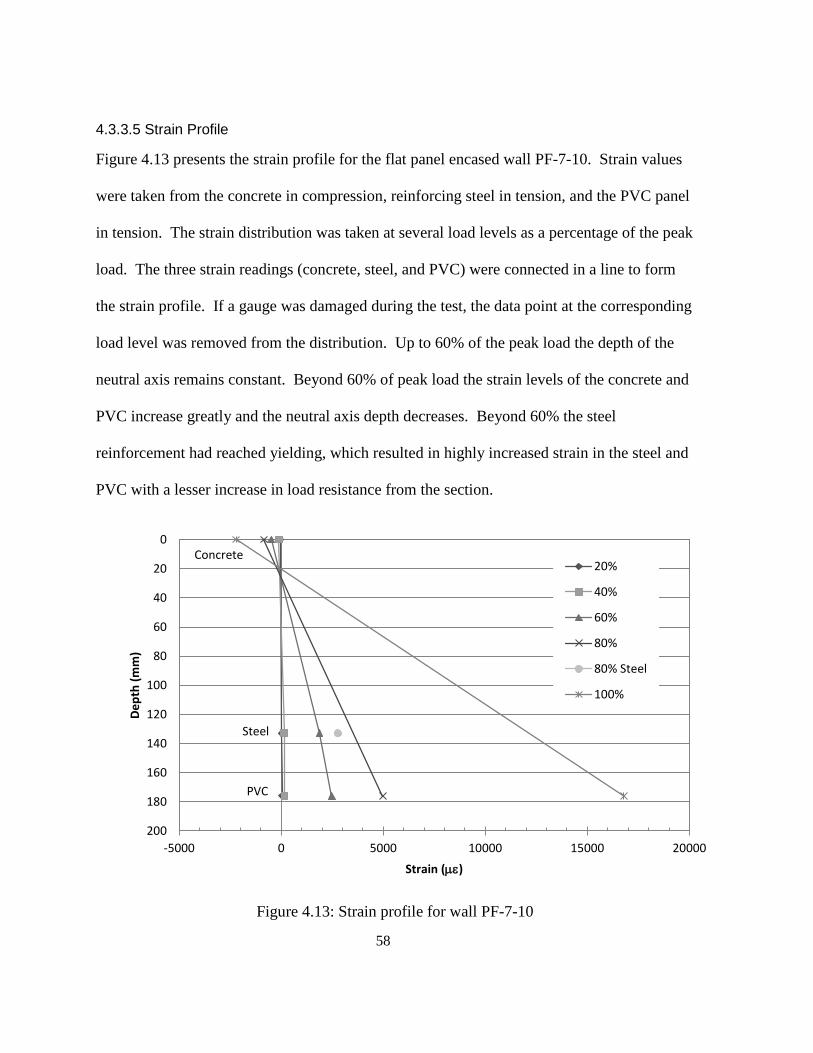
58
4.3.3.5 Strain Profile
Figure 4.13 presents the strain profile for the flat panel encased wall PF-7-10. Strain values
were taken from the concrete in compression, reinforcing steel in tension, and the PVC panel
in tension. The strain distribution was taken at several load levels as a percentage of the peak
load. The three strain readings (concrete, steel, and PVC) were connected in a line to form
the strain profile. If a gauge was damaged during the test, the data point at the corresponding
load level was removed from the distribution. Up to 60% of the peak load the depth of the
neutral axis remains constant. Beyond 60% of peak load the strain levels of the concrete and
PVC increase greatly and the neutral axis depth decreases. Beyond 60% the steel
reinforcement had reached yielding, which resulted in highly increased strain in the steel and
PVC with a lesser increase in load resistance from the section.
Figure 4.13: Strain profile for wall PF-7-10
Steel
PVC
Concrete 0
20
40
60
80
100
120
140
160
180
200
-5000 0 5000 10000 15000 20000
De
pth
(m
m)
Strain ()
20%
40%
60%
80%
80% Steel
100%
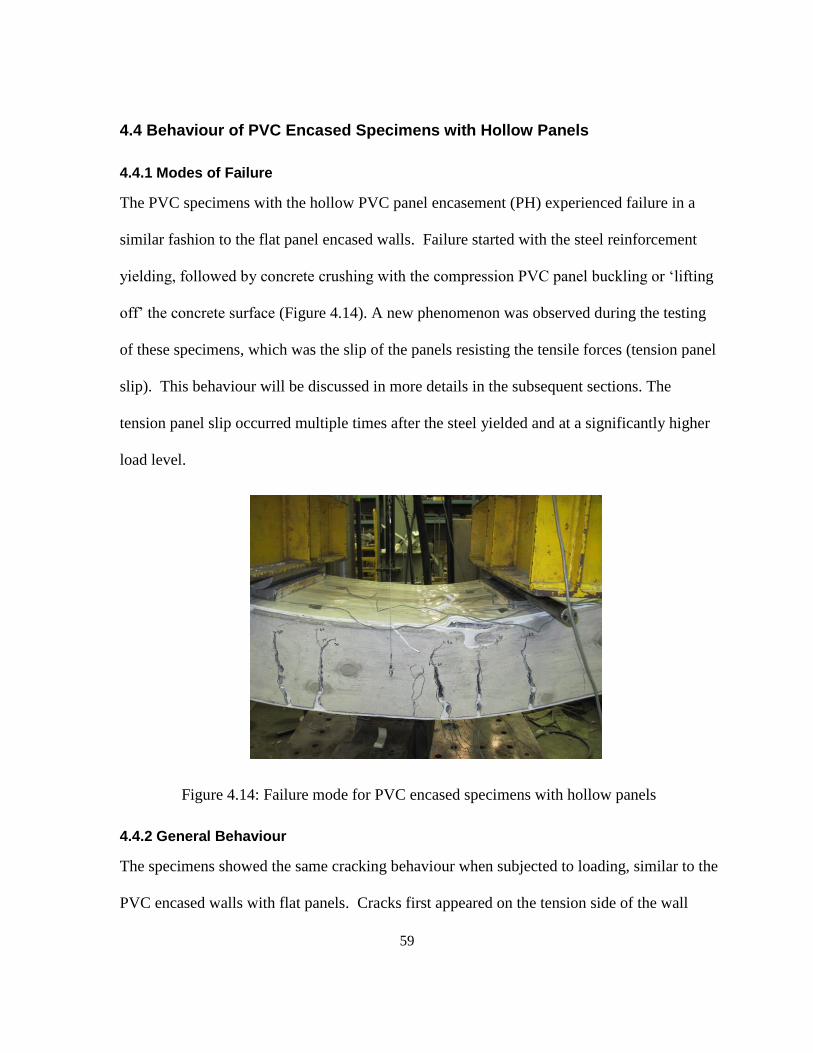
59
4.4 Behaviour of PVC Encased Specimens with Hollow Panels
4.4.1 Modes of Failure
The PVC specimens with the hollow PVC panel encasement (PH) experienced failure in a
similar fashion to the flat panel encased walls. Failure started with the steel reinforcement
yielding, followed by concrete crushing with the compression PVC panel buckling or ‘lifting
off’ the concrete surface (Figure 4.14). A new phenomenon was observed during the testing
of these specimens, which was the slip of the panels resisting the tensile forces (tension panel
slip). This behaviour will be discussed in more details in the subsequent sections. The
tension panel slip occurred multiple times after the steel yielded and at a significantly higher
load level.
Figure 4.14: Failure mode for PVC encased specimens with hollow panels
4.4.2 General Behaviour
The specimens showed the same cracking behaviour when subjected to loading, similar to the
PVC encased walls with flat panels. Cracks first appeared on the tension side of the wall
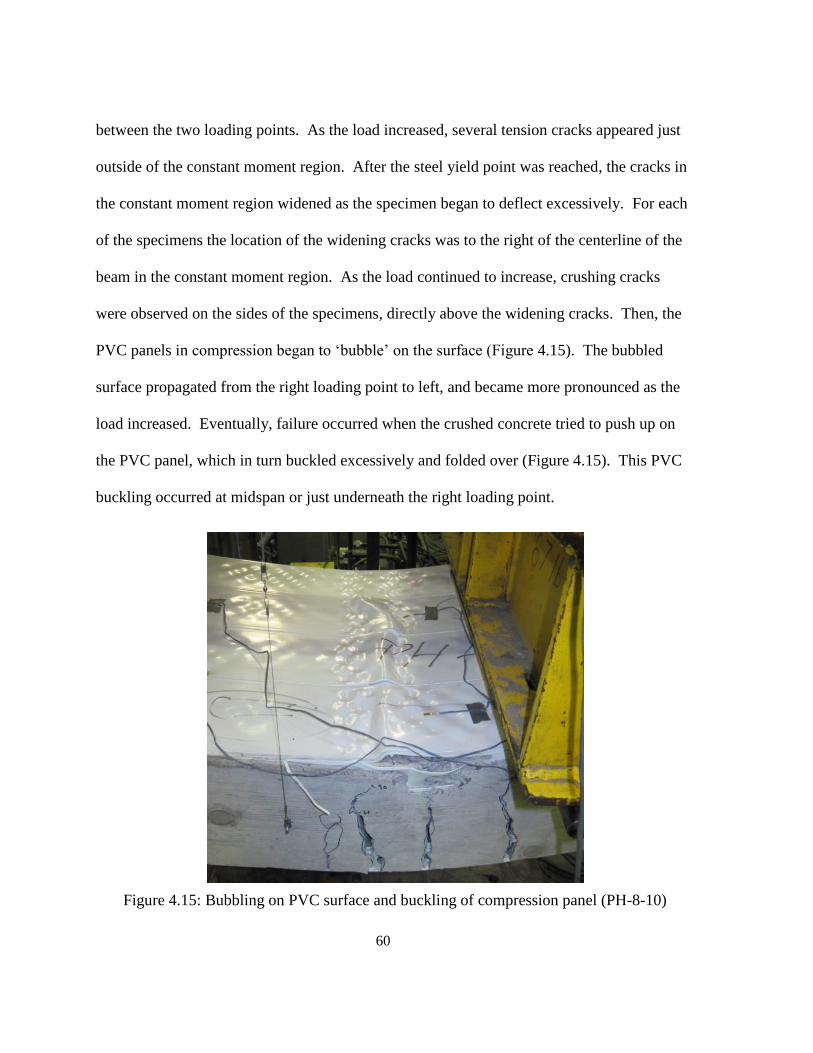
60
between the two loading points. As the load increased, several tension cracks appeared just
outside of the constant moment region. After the steel yield point was reached, the cracks in
the constant moment region widened as the specimen began to deflect excessively. For each
of the specimens the location of the widening cracks was to the right of the centerline of the
beam in the constant moment region. As the load continued to increase, crushing cracks
were observed on the sides of the specimens, directly above the widening cracks. Then, the
PVC panels in compression began to ‘bubble’ on the surface (Figure 4.15). The bubbled
surface propagated from the right loading point to left, and became more pronounced as the
load increased. Eventually, failure occurred when the crushed concrete tried to push up on
the PVC panel, which in turn buckled excessively and folded over (Figure 4.15). This PVC
buckling occurred at midspan or just underneath the right loading point.
Figure 4.15: Bubbling on PVC surface and buckling of compression panel (PH-8-10)
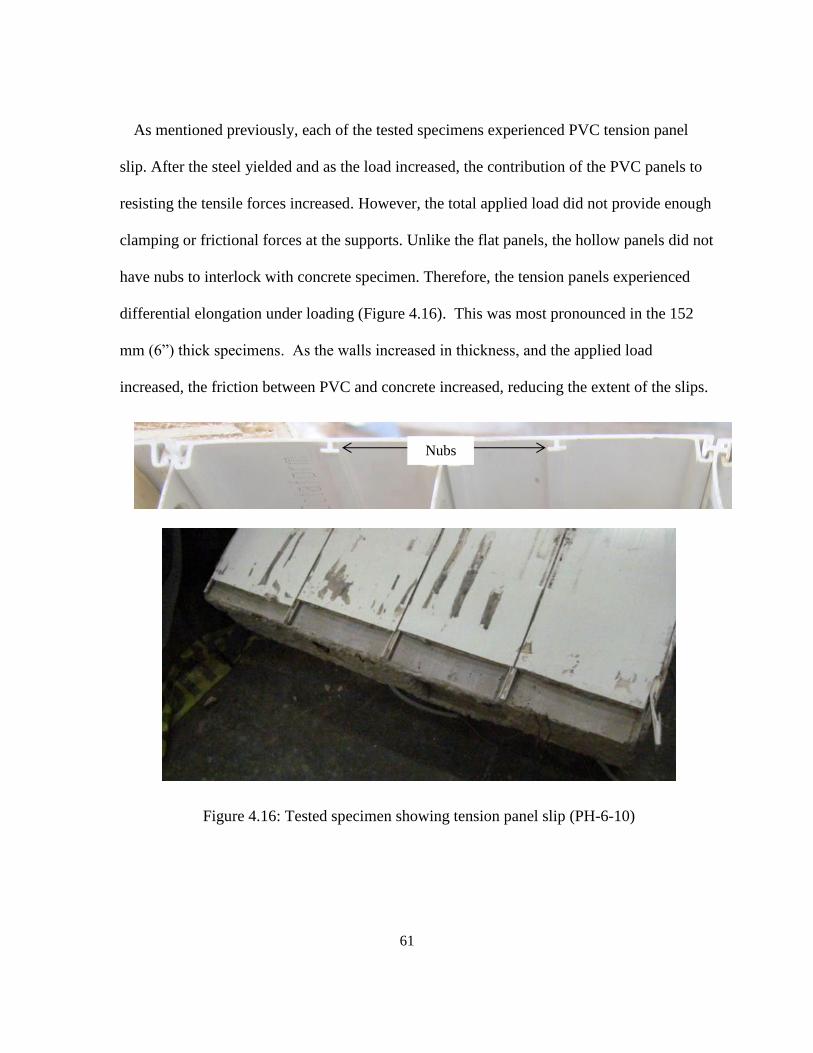
61
As mentioned previously, each of the tested specimens experienced PVC tension panel
slip. After the steel yielded and as the load increased, the contribution of the PVC panels to
resisting the tensile forces increased. However, the total applied load did not provide enough
clamping or frictional forces at the supports. Unlike the flat panels, the hollow panels did not
have nubs to interlock with concrete specimen. Therefore, the tension panels experienced
differential elongation under loading (Figure 4.16). This was most pronounced in the 152
mm (6”) thick specimens. As the walls increased in thickness, and the applied load
increased, the friction between PVC and concrete increased, reducing the extent of the slips.
Figure 4.16: Tested specimen showing tension panel slip (PH-6-10)
Nubs
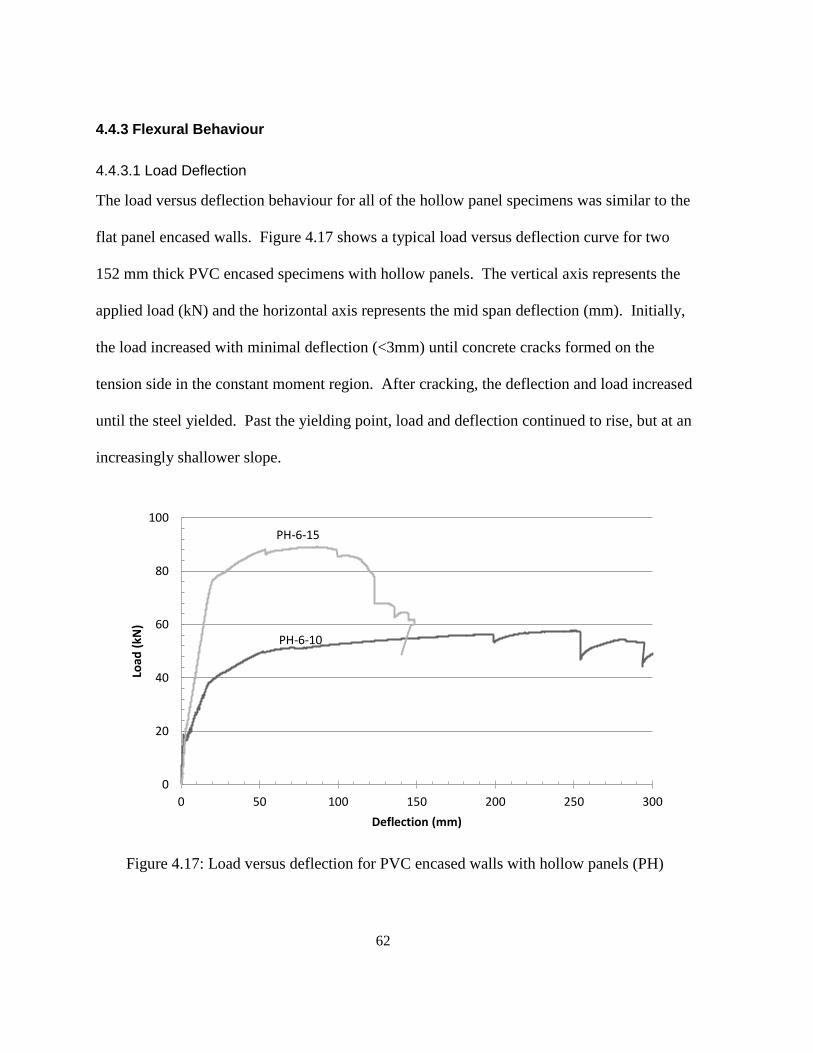
62
4.4.3 Flexural Behaviour
4.4.3.1 Load Deflection
The load versus deflection behaviour for all of the hollow panel specimens was similar to the
flat panel encased walls. Figure 4.17 shows a typical load versus deflection curve for two
152 mm thick PVC encased specimens with hollow panels. The vertical axis represents the
applied load (kN) and the horizontal axis represents the mid span deflection (mm). Initially,
the load increased with minimal deflection (<3mm) until concrete cracks formed on the
tension side in the constant moment region. After cracking, the deflection and load increased
until the steel yielded. Past the yielding point, load and deflection continued to rise, but at an
increasingly shallower slope.
Figure 4.17: Load versus deflection for PVC encased walls with hollow panels (PH)
PH-6-10
PH-6-15
0
20
40
60
80
100
0 50 100 150 200 250 300
Load
(kN
)
Deflection (mm)
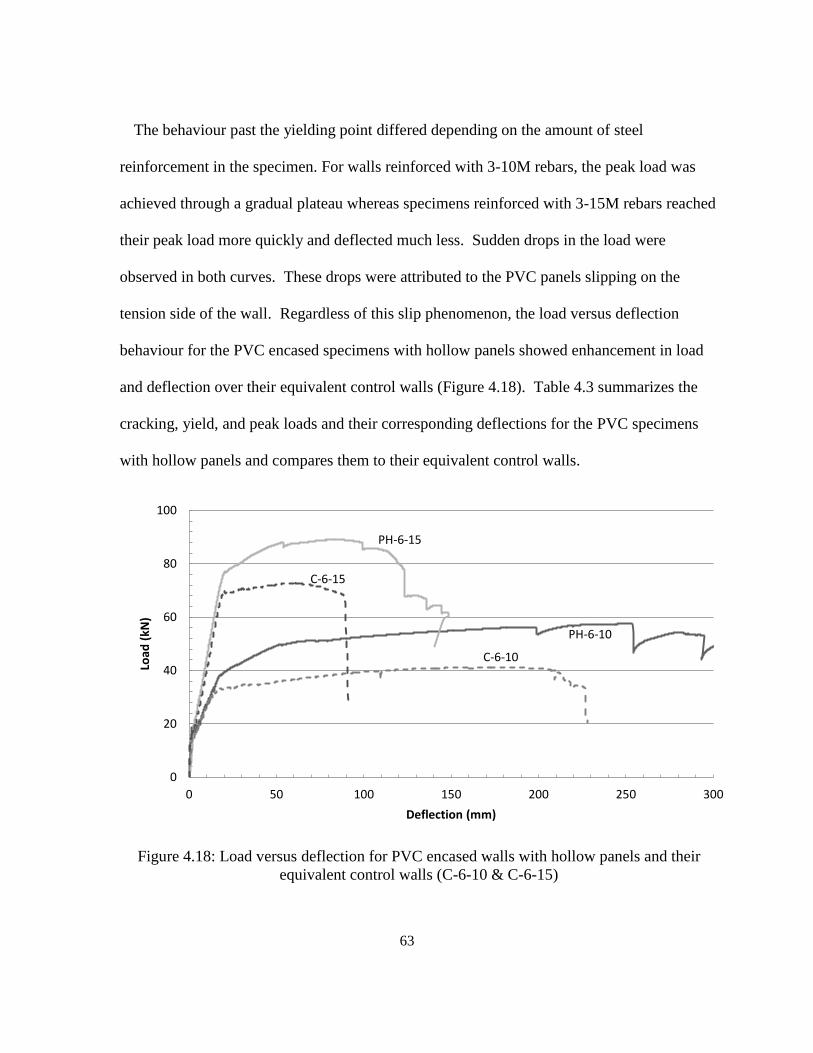
63
The behaviour past the yielding point differed depending on the amount of steel
reinforcement in the specimen. For walls reinforced with 3-10M rebars, the peak load was
achieved through a gradual plateau whereas specimens reinforced with 3-15M rebars reached
their peak load more quickly and deflected much less. Sudden drops in the load were
observed in both curves. These drops were attributed to the PVC panels slipping on the
tension side of the wall. Regardless of this slip phenomenon, the load versus deflection
behaviour for the PVC encased specimens with hollow panels showed enhancement in load
and deflection over their equivalent control walls (Figure 4.18). Table 4.3 summarizes the
cracking, yield, and peak loads and their corresponding deflections for the PVC specimens
with hollow panels and compares them to their equivalent control walls.
Figure 4.18: Load versus deflection for PVC encased walls with hollow panels and their
equivalent control walls (C-6-10 & C-6-15)
PH-6-10
PH-6-15
C-6-10
C-6-15
0
20
40
60
80
100
0 50 100 150 200 250 300
Load
(kN
)
Deflection (mm)
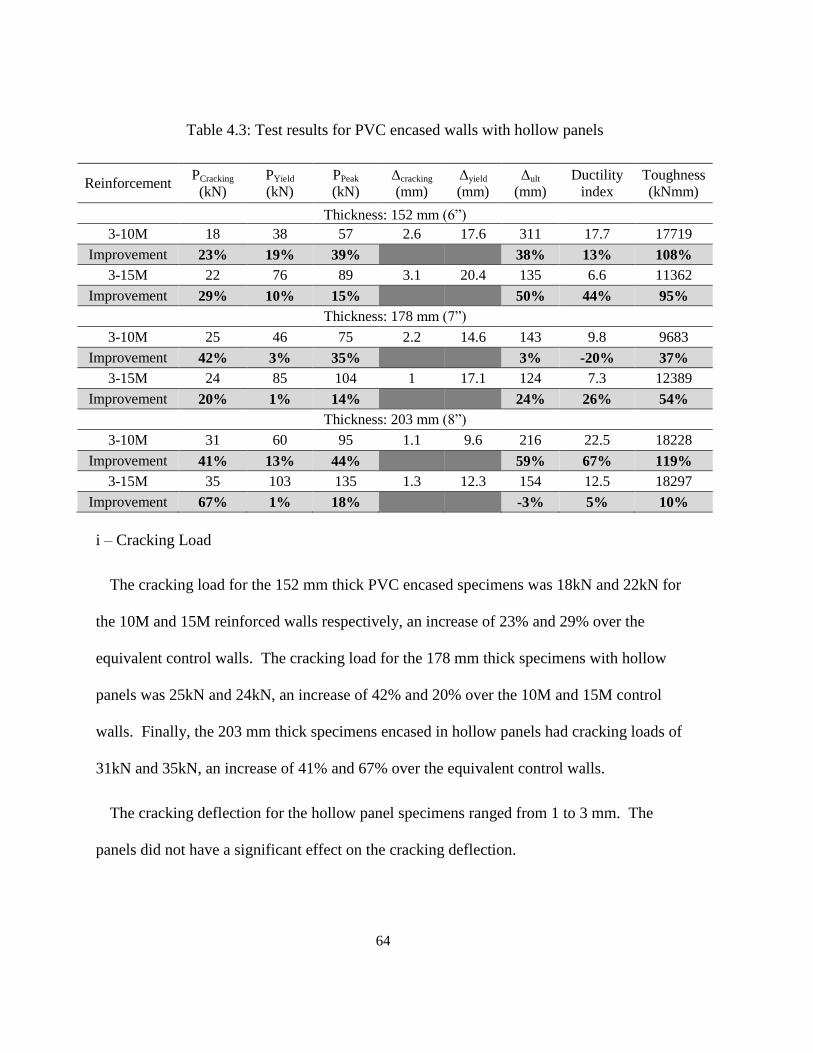
64
Table 4.3: Test results for PVC encased walls with hollow panels
Reinforcement PCracking
(kN)
PYield
(kN)
PPeak
(kN)
Δcracking
(mm)
Δyield
(mm)
Δult
(mm)
Ductility
index
Toughness
(kNmm)
Thickness: 152 mm (6”)
3-10M 18 38 57 2.6 17.6 311 17.7 17719
Improvement 23% 19% 39%
38% 13% 108%
3-15M 22 76 89 3.1 20.4 135 6.6 11362
Improvement 29% 10% 15%
50% 44% 95%
Thickness: 178 mm ( ”)
3-10M 25 46 75 2.2 14.6 143 9.8 9683
Improvement 42% 3% 35%
3% -20% 37%
3-15M 24 85 104 1 17.1 124 7.3 12389
Improvement 20% 1% 14%
24% 26% 54%
Thickness: 203 mm ( ”)
3-10M 31 60 95 1.1 9.6 216 22.5 18228
Improvement 41% 13% 44%
59% 67% 119%
3-15M 35 103 135 1.3 12.3 154 12.5 18297
Improvement 67% 1% 18%
-3% 5% 10%
i – Cracking Load
The cracking load for the 152 mm thick PVC encased specimens was 18kN and 22kN for
the 10M and 15M reinforced walls respectively, an increase of 23% and 29% over the
equivalent control walls. The cracking load for the 178 mm thick specimens with hollow
panels was 25kN and 24kN, an increase of 42% and 20% over the 10M and 15M control
walls. Finally, the 203 mm thick specimens encased in hollow panels had cracking loads of
31kN and 35kN, an increase of 41% and 67% over the equivalent control walls.
The cracking deflection for the hollow panel specimens ranged from 1 to 3 mm. The
panels did not have a significant effect on the cracking deflection.
65
ii – Yield Load
As discussed earlier, the yield load is a function of the amount of steel reinforcement and
the wall thickness. The yield load increased as the reinforcing bar diameter increased and/or
the concrete core thickness increased. PVC encased walls with hollow panels showed a
higher yield load than the equivalent control specimens. Similar to the walls with flat panels,
the specimens reinforced with 3-10M rebars showed greater enhancement to the yield load
than specimens with 3-15M rebars. For hollow panel encased specimens with 3-10M rebars,
the yield loads were 38 kN, 46 kN, and 60 kN for wall thicknesses of 152 mm, 178 mm, and
203 mm, respectively. The yield loads for the equivalent control walls were 32 kN, 44.5 kN,
and 53 kN, respectively. Therefore, the increase in the yield load for the PVC encased walls
with hollow panels reinforced with 3-10M rebars was 19%, 3%, and 13% for wall
thicknesses of 152 mm, 178 mm, and 203 mm, respectively.
The yield load for hollow panel encased walls reinforced with 3-15M rebars was 76 kN, 85
kN, and 103 kN for 152 mm, 178 mm, and 203 mm thick walls, respectively. The equivalent
control walls had yield loads of 69 kN, 84 kN, and 103 kN, respectively. Therefore, the
increase in yield load for the specimens reinforced with 3-15M bars was 10%, 1%, and 1%
for 152 mm, 178 mm, and 203 mm thick walls, respectively.
The increase in yield load for all specimens was due to the PVC panel in tension providing
an additional tensile force to the wall cross-section, improving the resistance. The
improvements were minimal; due to the steel reinforcement being placed at a shallower
depth as a result of hollow panel’s thickness, thus negating some of the benefit from the
66
additional material in the hollow panels. This observation is further discussed in Section
4.5.1 – Wall Cross-section Comparison. In addition, the strain levels observed in the PVC at
yielding resulted in a material stress significantly lower than the potential peak stress. The
PVC was not fully engaged and therefore only provided a mild enhancement to the cross-
section.
The yield deflection for the encased walls with hollow panels and the control walls were
similar. The presence of the hollow panels did not have an influence on the yield deflection.
iii – Peak load
The PVC encased walls with hollow panels showed an increase in the peak load over the
control specimens. Similar to the yield load results, specimens reinforced with 3-10M rebars
experienced a greater improvement than the walls reinforced with 3-15M rebars. The peak
loads for hollow panel encased specimens reinforced with 3-10M bars were 57 kN, 75 kN,
and 95 kN for 152 mm, 178 mm, and 203 mm thick walls, respectively. The peak loads for
the equivalent controls walls were 41 kN, 55.5 kN and 66 kN, respectively. Therefore, the
increase in peak load for the hollow panel encased specimens was 39%, 35%, and 39% for
152 mm, 178 mm, and 203 mm thick walls, respectively.
The peak loads for PVC encased walls reinforced with 3-15M rebars were 89 kN, 104 kN,
and 135 kN for 152 mm, 178 mm, and 203 mm thick walls, respectively. The equivalent
control specimens had peak loads of 77.2 kN, 91 kN and 114 kN, respectively. The
specimens with hollow panels reinforced with 3-15M showed an increase in the peak load of
15%, 14%, and 18%, respectively.
67
As was seen in the flat panel encased walls, the improvement to load resistance was higher
at the peak load level than at yield load level. The high strains associated with the peak load
indicated that the PVC was approaching or was at peak tensile stress, offering substantially
more improvement than at the yield load level. In addition, the observed improvements for
the 10M walls were higher than the respective flat panel walls. The enhancement was
achieved despite the shallower steel depth, indicating the benefit of effectively doubling the
PVC cross-sectional area within the cross-section.
The ultimate deflection for the PVC encased walls with hollow panels was higher than the
ultimate deflection for the control walls for most of the specimens. The increase in ultimate
deflection varied between 3% and 59% as shown in Table 4.3. The ductility index of the
hollow panel encased specimens varied between 6.6 and 22.5. For a given wall thickness, the
ductility index decreased, as the rebar diameter increased from 10M to 15M. The presence of
the PVC panels increased the ductility index by a minimum of 5% and a maximum of 67%.
The toughness of each hollow panel encased wall was higher than the equivalent control
wall. The improvement in toughness ranged from 10% to 119%. For the walls reinforced
with 3-15M steel bars, the effect of the panels decreased as the thickness of the wall
increased. No trend was apparent for wall reinforced with 3-10M steel bars.
4.4.3.2 Summary of key findings
1. Cracking load: the walls encased with hollow panels increased the cracking load by
an average of 45%. The deflection at cracking remained the same as the deflection for
the control walls.
68
2. Yield load: the walls with hollow panels provided a minimal increase in the yield load
of the control walls
a) The average yield load increase for walls with 3-10M rebars was 12%. For walls
with higher reinforcement ratios (3-15M rebars), the average yield load increase
was 4%. Similar to the previous findings by Wahab et al (2013), these results
indicate that as the reinforcing ratio increases, the effect of the PVC encasement
with hollow panels on the yield load decreases.
b) The yield deflection was not influenced by the PVC system.
3. Peak load: Similar to the yield load, the effect of the PVC encasing system on the
peak load decreases as the reinforcing ratio increases.
a) PVC encased specimens with hollow panels and reinforced with 3-10M rebars
showed an average increase in the peak load of 39% over the control specimens.
For walls with higher reinforcement ratios (3-15M bars), the increase in peak load
dropped to 16% on average.
b) In previous tests of PVC encasing, the increase in the peak load was influenced by
the wall thickness. As the thickness of the specimens increased, the effect of the
PVC encasement decreased. This trend was not apparent in the results as the
average increase in the peak load for 152 mm, 178 mm, and 203 mm thick walls
was 27%, 25%, and 31%, respectively.
4. Deflection: The encasement with hollow panels provided an increase in ultimate
deflection and ductility. The increase in ultimate deflection varied between 3% and
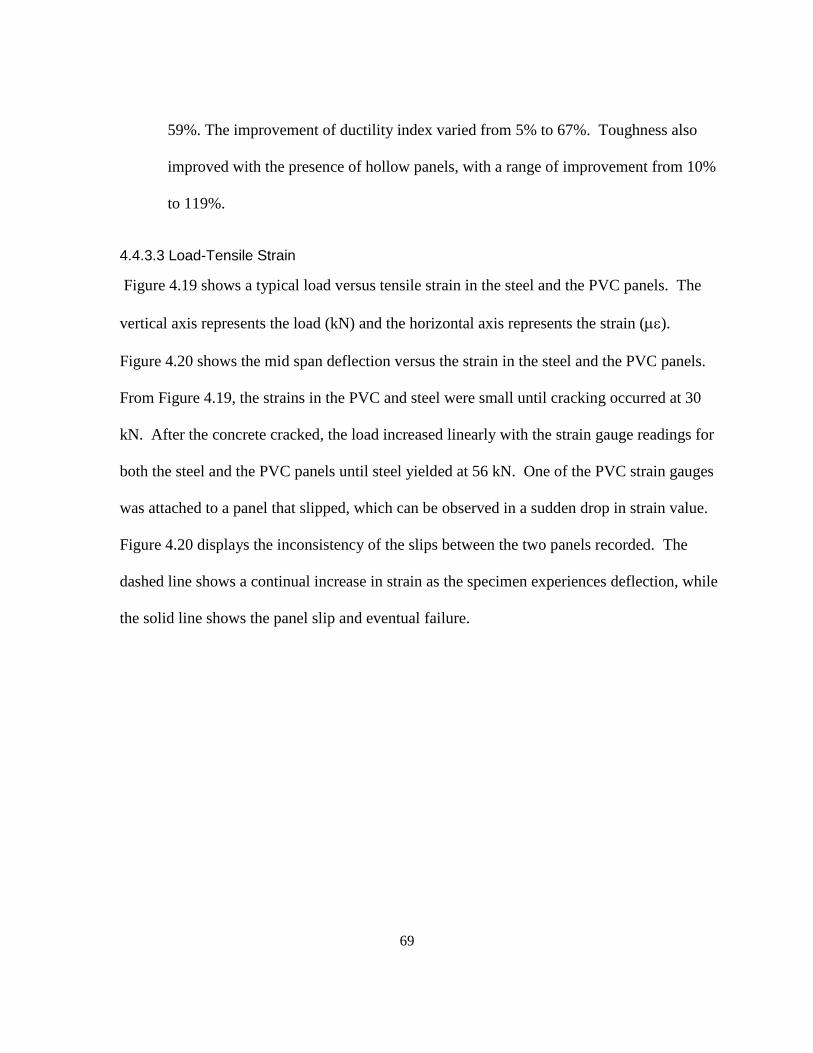
69
59%. The improvement of ductility index varied from 5% to 67%. Toughness also
improved with the presence of hollow panels, with a range of improvement from 10%
to 119%.
4.4.3.3 Load-Tensile Strain
Figure 4.19 shows a typical load versus tensile strain in the steel and the PVC panels. The
vertical axis represents the load (kN) and the horizontal axis represents the strain ().
Figure 4.20 shows the mid span deflection versus the strain in the steel and the PVC panels.
From Figure 4.19, the strains in the PVC and steel were small until cracking occurred at 30
kN. After the concrete cracked, the load increased linearly with the strain gauge readings for
both the steel and the PVC panels until steel yielded at 56 kN. One of the PVC strain gauges
was attached to a panel that slipped, which can be observed in a sudden drop in strain value.
Figure 4.20 displays the inconsistency of the slips between the two panels recorded. The
dashed line shows a continual increase in strain as the specimen experiences deflection, while
the solid line shows the panel slip and eventual failure.
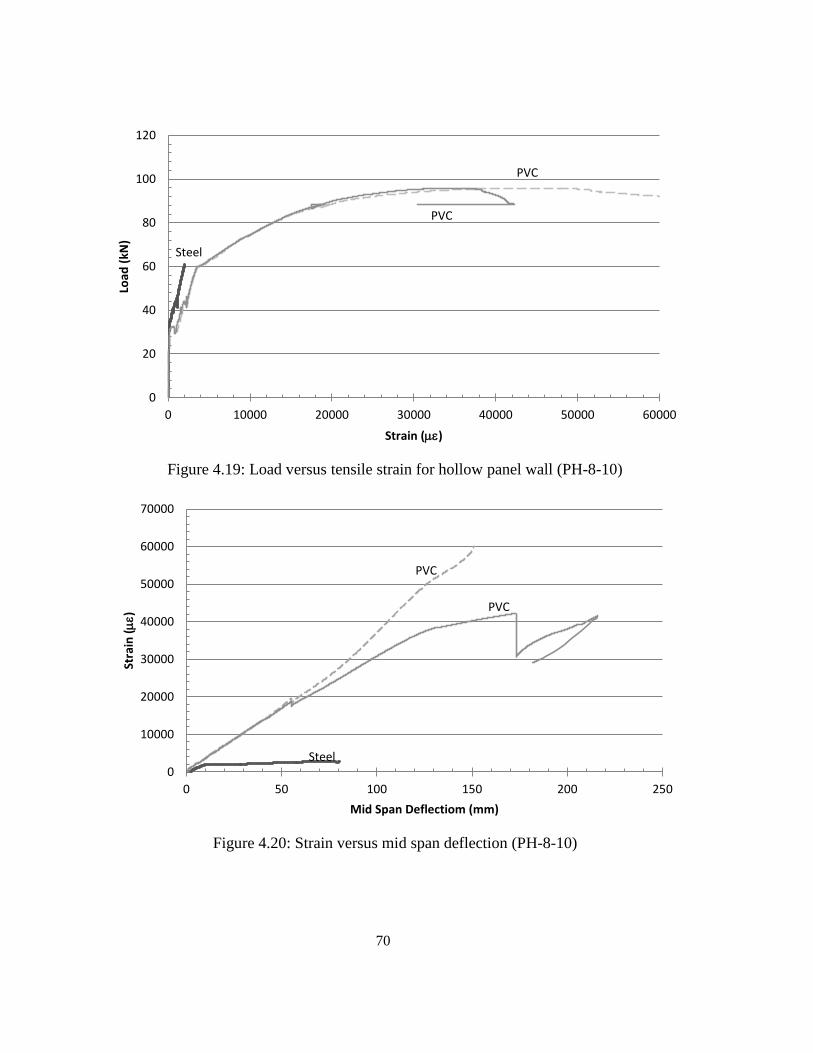
70
Figure 4.19: Load versus tensile strain for hollow panel wall (PH-8-10)
Figure 4.20: Strain versus mid span deflection (PH-8-10)
Steel
PVC
PVC
0
20
40
60
80
100
120
0 10000 20000 30000 40000 50000 60000
Load
(kN
)
Strain ()
Steel
PVC
PVC
0
10000
20000
30000
40000
50000
60000
70000
0 50 100 150 200 250
Stra
in (
)
Mid Span Deflectiom (mm)
71
4.4.3.4 Load-Compressive Strain
Figure 4.21 provides a typical load versus compressive strain behaviour for the concrete and
PVC panels. The vertical axis represents the load (kN) and the horizontal axis represents the
compressive strain (µε). The readings of three strain gauges are presented on the figure, a
gauge attached to the concrete surface (grey), a gauge attached to the inner face of the PVC
panel (dashed), and a gauge attached to the outside face of the PVC panel (solid). Strains in
both materials were low and increased linearly until the concrete cracked at 20 kN. At the
cracking load, the strains in the concrete and inner panel of PVC remained similar but the
strain in the PVC on the outside panel increased more rapidly, due to the increase in
deflection of the wall. This difference in strains remained through the specimen yielding
(76kN) and eventual failure. Concrete crushed at -3000, while the PVC continued to
experience compressive strains beyond -8000.
Figure 4.21: Load versus compressive strain for hollow panel encased wall (PH-6-15)
Concrete
PVC Inner Panel
PVC Outer Panel
0
20
40
60
80
100
-10000-8000-6000-4000-20000
Load
(kN
)
Strain (µε)
Slip on tension side
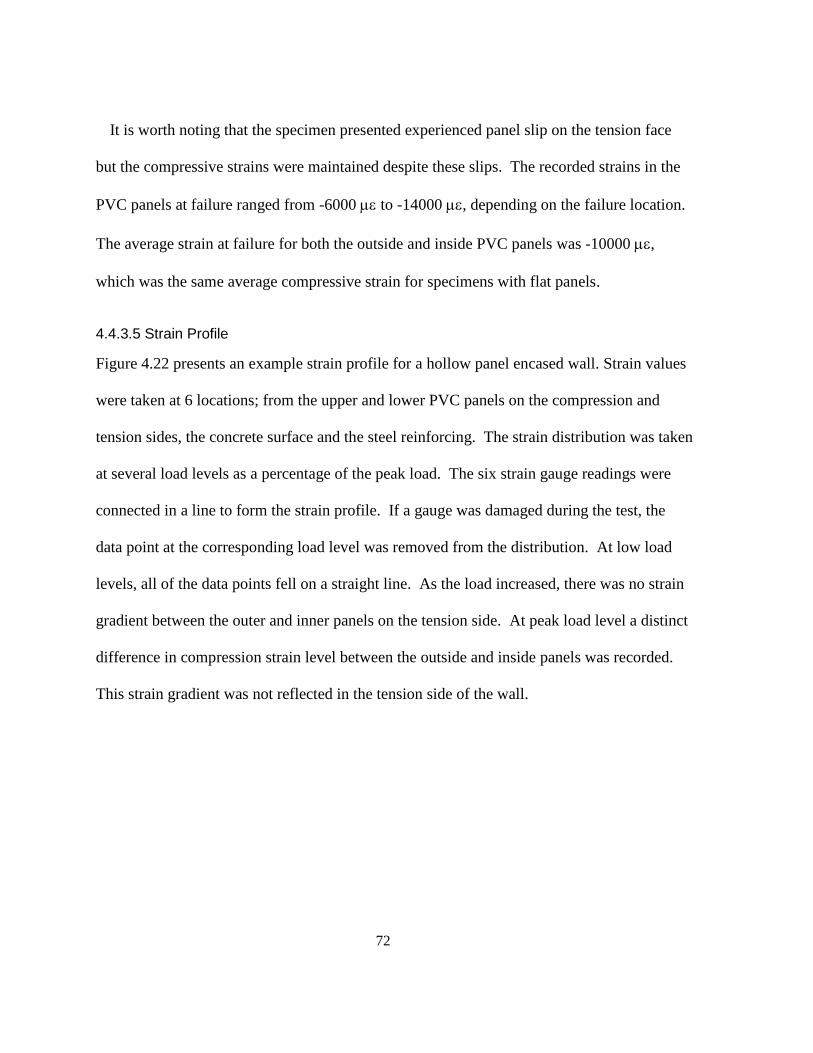
72
It is worth noting that the specimen presented experienced panel slip on the tension face
but the compressive strains were maintained despite these slips. The recorded strains in the
PVC panels at failure ranged from -6000 to -14000 , depending on the failure location.
The average strain at failure for both the outside and inside PVC panels was -10000 ,
which was the same average compressive strain for specimens with flat panels.
4.4.3.5 Strain Profile
Figure 4.22 presents an example strain profile for a hollow panel encased wall. Strain values
were taken at 6 locations; from the upper and lower PVC panels on the compression and
tension sides, the concrete surface and the steel reinforcing. The strain distribution was taken
at several load levels as a percentage of the peak load. The six strain gauge readings were
connected in a line to form the strain profile. If a gauge was damaged during the test, the
data point at the corresponding load level was removed from the distribution. At low load
levels, all of the data points fell on a straight line. As the load increased, there was no strain
gradient between the outer and inner panels on the tension side. At peak load level a distinct
difference in compression strain level between the outside and inside panels was recorded.
This strain gradient was not reflected in the tension side of the wall.
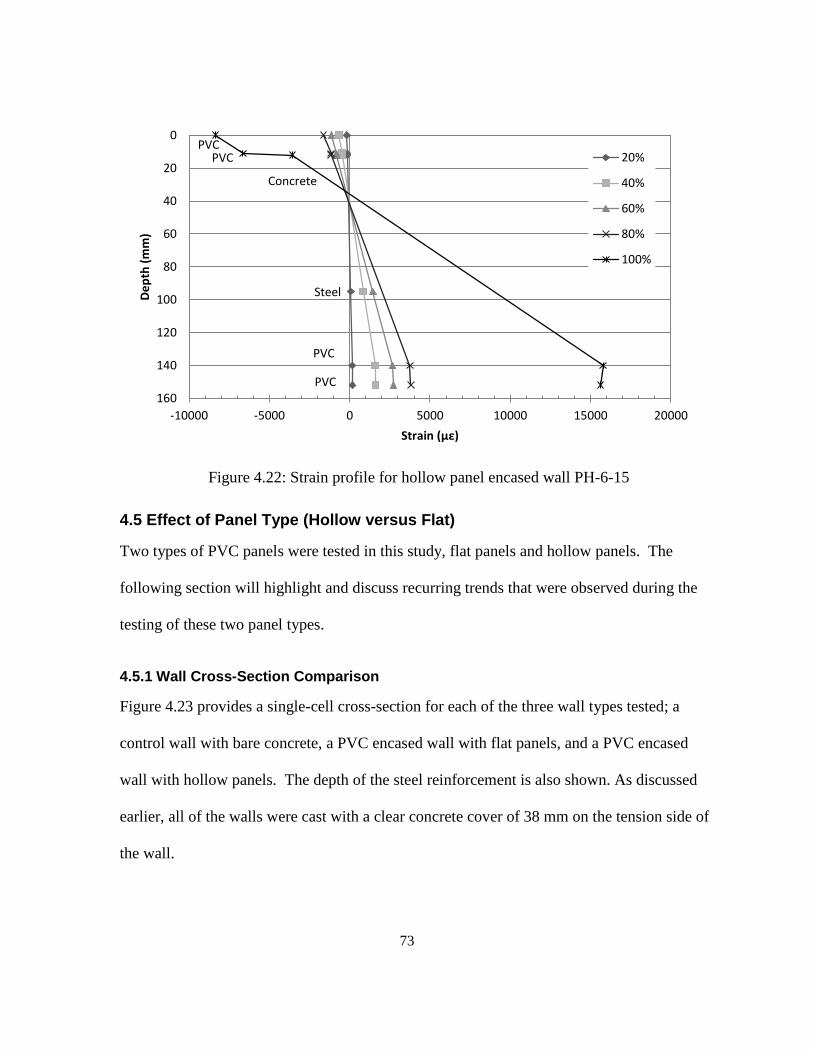
73
Figure 4.22: Strain profile for hollow panel encased wall PH-6-15
4.5 Effect of Panel Type (Hollow versus Flat)
Two types of PVC panels were tested in this study, flat panels and hollow panels. The
following section will highlight and discuss recurring trends that were observed during the
testing of these two panel types.
4.5.1 Wall Cross-Section Comparison
Figure 4.23 provides a single-cell cross-section for each of the three wall types tested; a
control wall with bare concrete, a PVC encased wall with flat panels, and a PVC encased
wall with hollow panels. The depth of the steel reinforcement is also shown. As discussed
earlier, all of the walls were cast with a clear concrete cover of 38 mm on the tension side of
the wall.
Steel
PVC
PVC
PVC PVC
Concrete
0
20
40
60
80
100
120
140
160
-10000 -5000 0 5000 10000 15000 20000
De
pth
(m
m)
Strain (µε)
20%
40%
60%
80%
100%
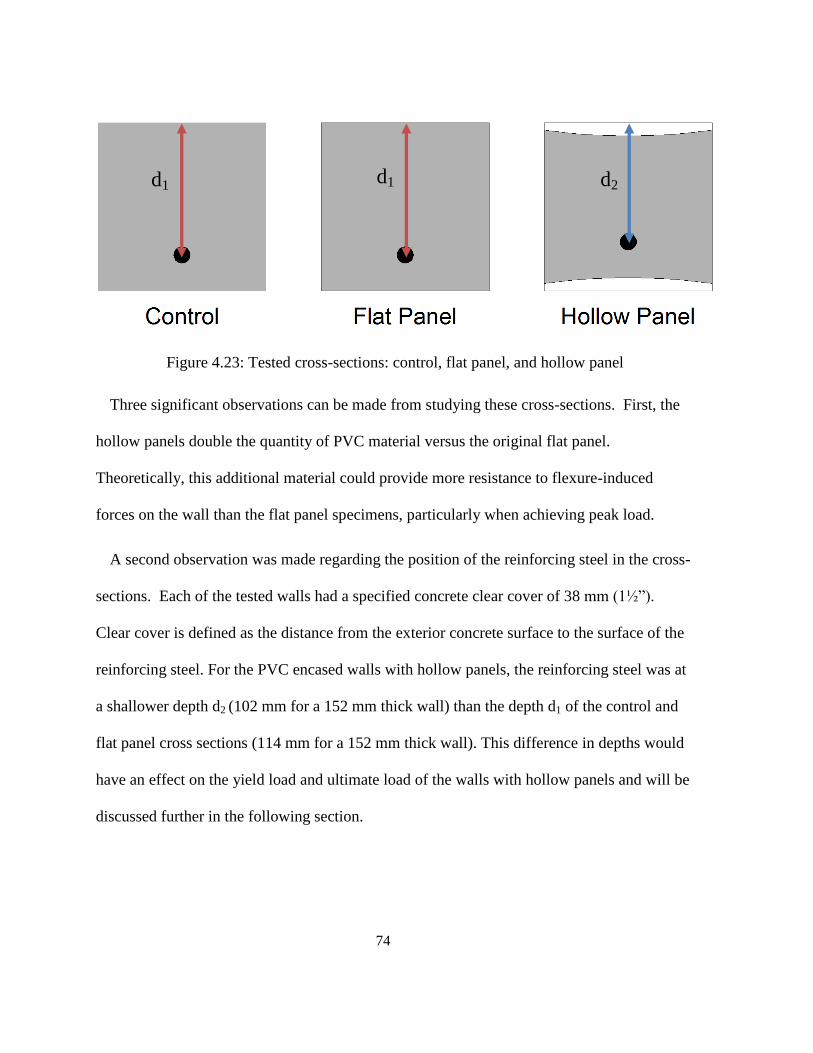
74
Figure 4.23: Tested cross-sections: control, flat panel, and hollow panel
Three significant observations can be made from studying these cross-sections. First, the
hollow panels double the quantity of PVC material versus the original flat panel.
Theoretically, this additional material could provide more resistance to flexure-induced
forces on the wall than the flat panel specimens, particularly when achieving peak load.
A second observation was made regarding the position of the reinforcing steel in the cross-
sections. Each of the tested walls had a specified concrete clear cover of 38 mm (1½”).
Clear cover is defined as the distance from the exterior concrete surface to the surface of the
reinforcing steel. For the PVC encased walls with hollow panels, the reinforcing steel was at
a shallower depth d2 (102 mm for a 152 mm thick wall) than the depth d1 of the control and
flat panel cross sections (114 mm for a 152 mm thick wall). This difference in depths would
have an effect on the yield load and ultimate load of the walls with hollow panels and will be
discussed further in the following section.
d1 d1 d2
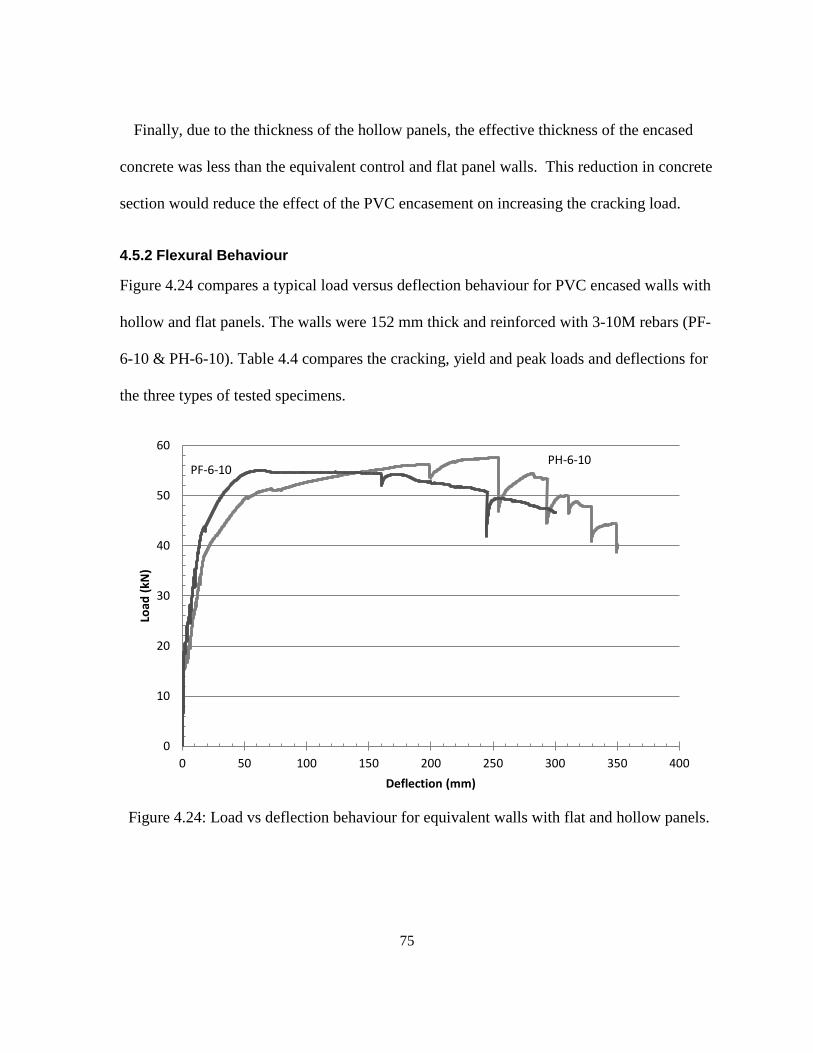
75
Finally, due to the thickness of the hollow panels, the effective thickness of the encased
concrete was less than the equivalent control and flat panel walls. This reduction in concrete
section would reduce the effect of the PVC encasement on increasing the cracking load.
4.5.2 Flexural Behaviour
Figure 4.24 compares a typical load versus deflection behaviour for PVC encased walls with
hollow and flat panels. The walls were 152 mm thick and reinforced with 3-10M rebars (PF-
6-10 & PH-6-10). Table 4.4 compares the cracking, yield and peak loads and deflections for
the three types of tested specimens.
Figure 4.24: Load vs deflection behaviour for equivalent walls with flat and hollow panels.
PH-6-10 PF-6-10
0
10
20
30
40
50
60
0 50 100 150 200 250 300 350 400
Load
(kN
)
Deflection (mm)
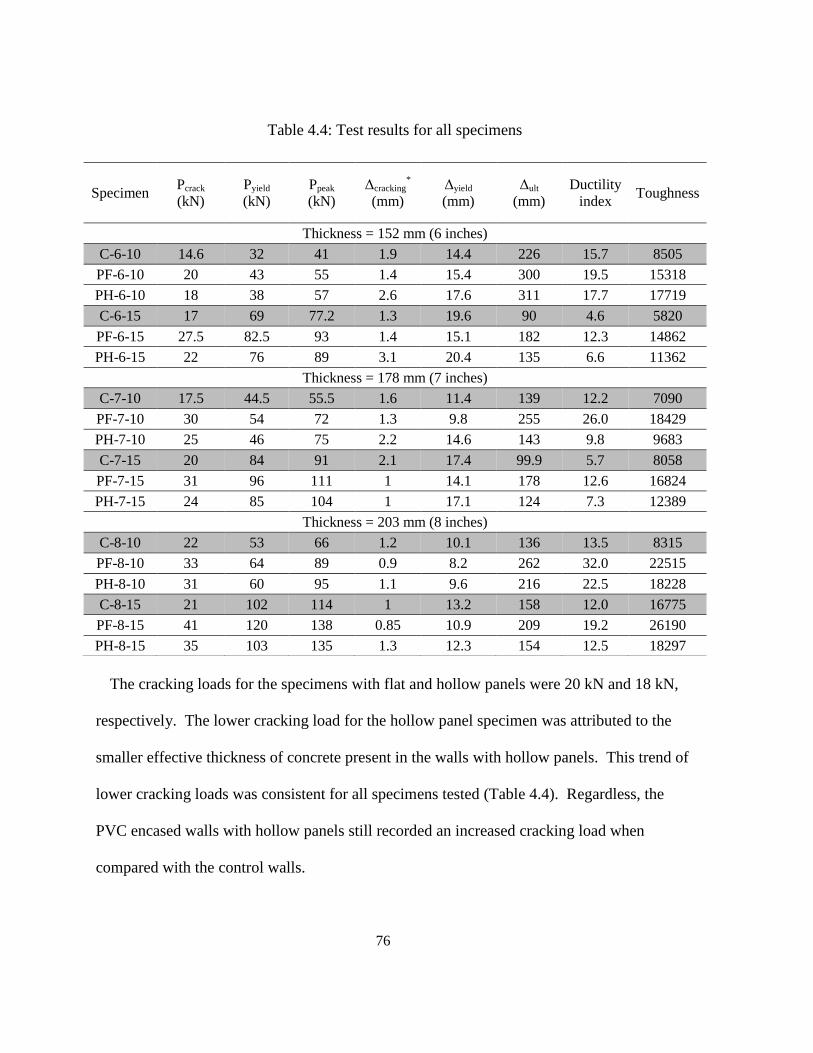
76
Table 4.4: Test results for all specimens
The cracking loads for the specimens with flat and hollow panels were 20 kN and 18 kN,
respectively. The lower cracking load for the hollow panel specimen was attributed to the
smaller effective thickness of concrete present in the walls with hollow panels. This trend of
lower cracking loads was consistent for all specimens tested (Table 4.4). Regardless, the
PVC encased walls with hollow panels still recorded an increased cracking load when
compared with the control walls.
Specimen Pcrack
(kN)
Pyield
(kN)
Ppeak
(kN)
Δcracking*
(mm)
Δyield
(mm)
Δult
(mm)
Ductility
index Toughness
Thickness = 152 mm (6 inches)
C-6-10 14.6 32 41 1.9 14.4 226 15.7 8505
PF-6-10 20 43 55 1.4 15.4 300 19.5 15318
PH-6-10 18 38 57 2.6 17.6 311 17.7 17719
C-6-15 17 69 77.2 1.3 19.6 90 4.6 5820
PF-6-15 27.5 82.5 93 1.4 15.1 182 12.3 14862
PH-6-15 22 76 89 3.1 20.4 135 6.6 11362
Thickness = 178 mm (7 inches)
C-7-10 17.5 44.5 55.5 1.6 11.4 139 12.2 7090
PF-7-10 30 54 72 1.3 9.8 255 26.0 18429
PH-7-10 25 46 75 2.2 14.6 143 9.8 9683
C-7-15 20 84 91 2.1 17.4 99.9 5.7 8058
PF-7-15 31 96 111 1 14.1 178 12.6 16824
PH-7-15 24 85 104 1 17.1 124 7.3 12389
Thickness = 203 mm (8 inches)
C-8-10 22 53 66 1.2 10.1 136 13.5 8315
PF-8-10 33 64 89 0.9 8.2 262 32.0 22515
PH-8-10 31 60 95 1.1 9.6 216 22.5 18228
C-8-15 21 102 114 1 13.2 158 12.0 16775
PF-8-15 41 120 138 0.85 10.9 209 19.2 26190
PH-8-15 35 103 135 1.3 12.3 154 12.5 18297
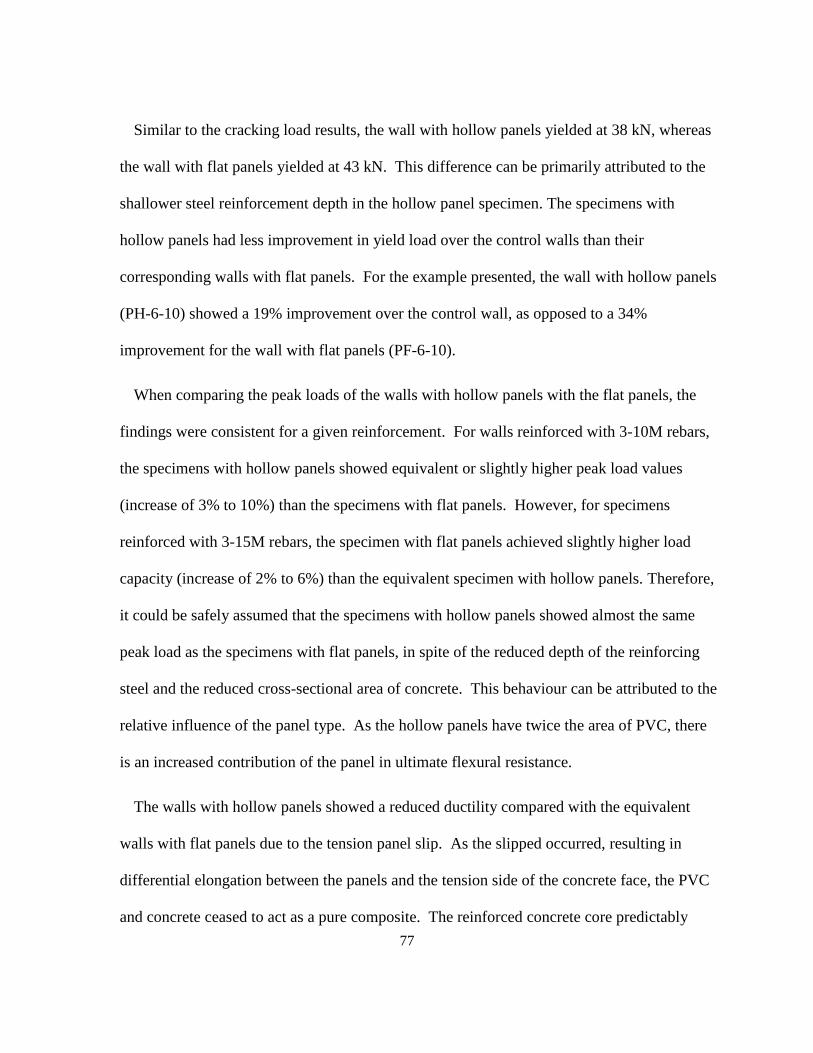
77
Similar to the cracking load results, the wall with hollow panels yielded at 38 kN, whereas
the wall with flat panels yielded at 43 kN. This difference can be primarily attributed to the
shallower steel reinforcement depth in the hollow panel specimen. The specimens with
hollow panels had less improvement in yield load over the control walls than their
corresponding walls with flat panels. For the example presented, the wall with hollow panels
(PH-6-10) showed a 19% improvement over the control wall, as opposed to a 34%
improvement for the wall with flat panels (PF-6-10).
When comparing the peak loads of the walls with hollow panels with the flat panels, the
findings were consistent for a given reinforcement. For walls reinforced with 3-10M rebars,
the specimens with hollow panels showed equivalent or slightly higher peak load values
(increase of 3% to 10%) than the specimens with flat panels. However, for specimens
reinforced with 3-15M rebars, the specimen with flat panels achieved slightly higher load
capacity (increase of 2% to 6%) than the equivalent specimen with hollow panels. Therefore,
it could be safely assumed that the specimens with hollow panels showed almost the same
peak load as the specimens with flat panels, in spite of the reduced depth of the reinforcing
steel and the reduced cross-sectional area of concrete. This behaviour can be attributed to the
relative influence of the panel type. As the hollow panels have twice the area of PVC, there
is an increased contribution of the panel in ultimate flexural resistance.
The walls with hollow panels showed a reduced ductility compared with the equivalent
walls with flat panels due to the tension panel slip. As the slipped occurred, resulting in
differential elongation between the panels and the tension side of the concrete face, the PVC
and concrete ceased to act as a pure composite. The reinforced concrete core predictably
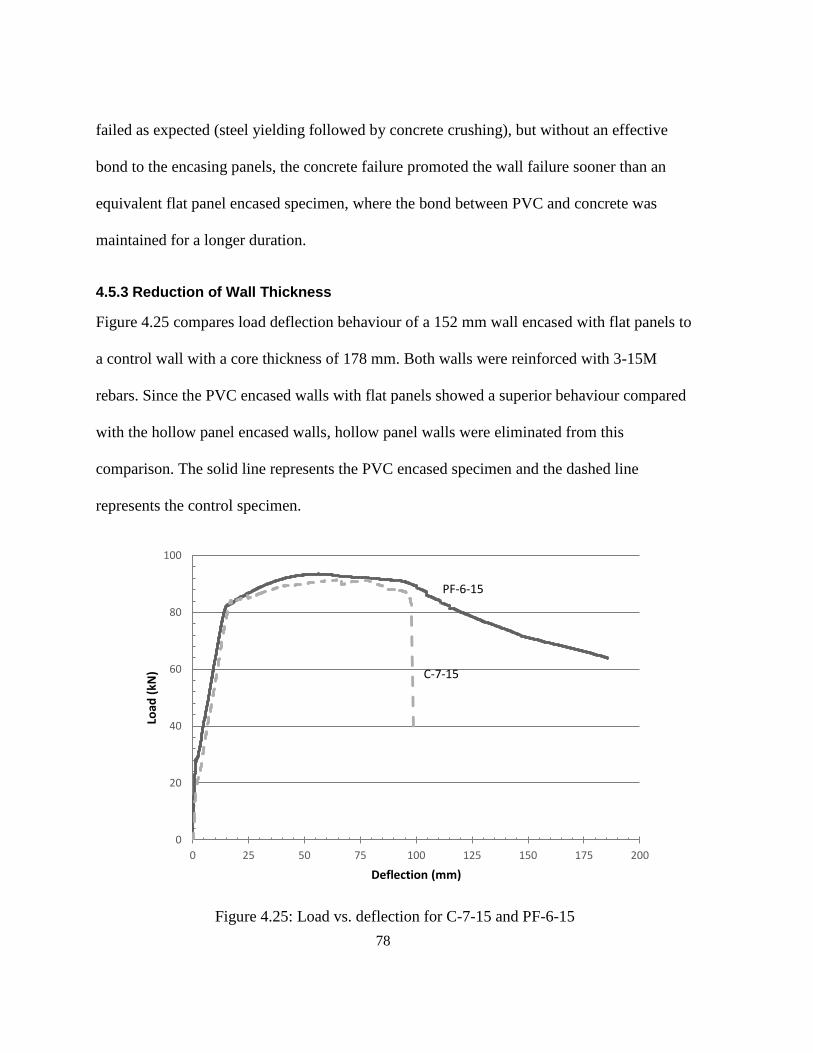
78
failed as expected (steel yielding followed by concrete crushing), but without an effective
bond to the encasing panels, the concrete failure promoted the wall failure sooner than an
equivalent flat panel encased specimen, where the bond between PVC and concrete was
maintained for a longer duration.
4.5.3 Reduction of Wall Thickness
Figure 4.25 compares load deflection behaviour of a 152 mm wall encased with flat panels to
a control wall with a core thickness of 178 mm. Both walls were reinforced with 3-15M
rebars. Since the PVC encased walls with flat panels showed a superior behaviour compared
with the hollow panel encased walls, hollow panel walls were eliminated from this
comparison. The solid line represents the PVC encased specimen and the dashed line
represents the control specimen.
Figure 4.25: Load vs. deflection for C-7-15 and PF-6-15
PF-6-15
C-7-15
0
20
40
60
80
100
0 25 50 75 100 125 150 175 200
Load
(kN
)
Deflection (mm)
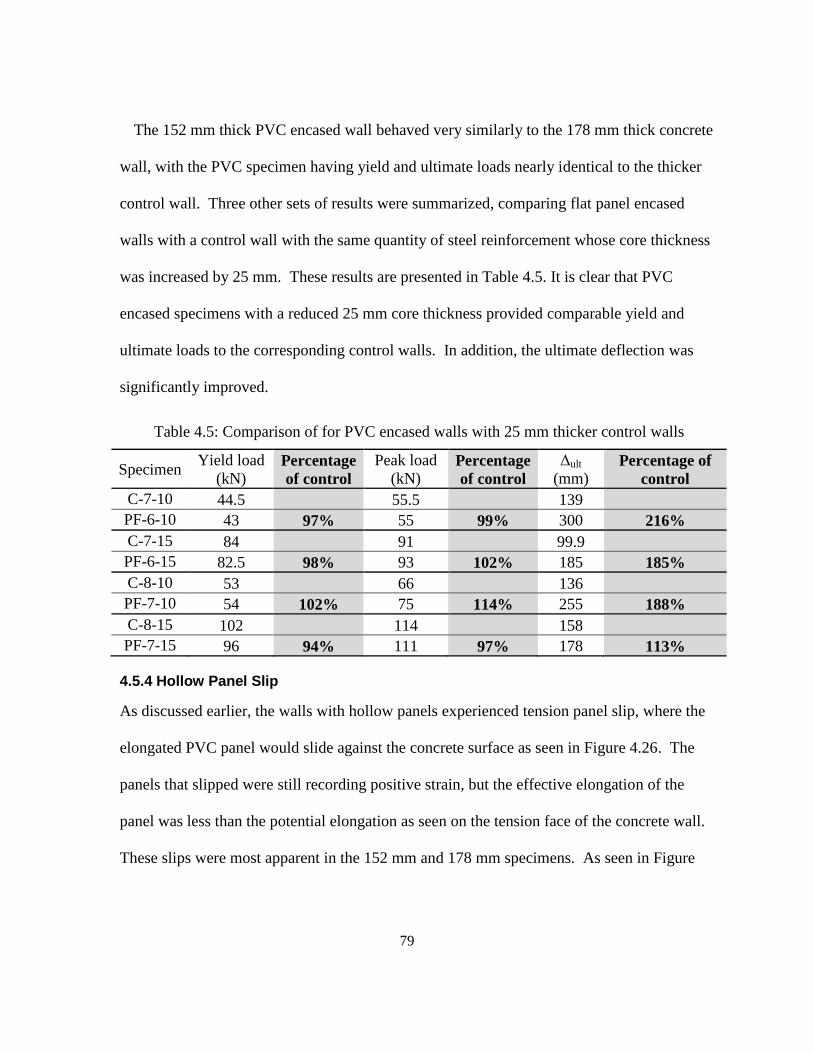
79
The 152 mm thick PVC encased wall behaved very similarly to the 178 mm thick concrete
wall, with the PVC specimen having yield and ultimate loads nearly identical to the thicker
control wall. Three other sets of results were summarized, comparing flat panel encased
walls with a control wall with the same quantity of steel reinforcement whose core thickness
was increased by 25 mm. These results are presented in Table 4.5. It is clear that PVC
encased specimens with a reduced 25 mm core thickness provided comparable yield and
ultimate loads to the corresponding control walls. In addition, the ultimate deflection was
significantly improved.
Table 4.5: Comparison of for PVC encased walls with 25 mm thicker control walls
Specimen Yield load
(kN) Percentage
of control
Peak load
(kN) Percentage
of control
Δult
(mm) Percentage of
control
C-7-10 44.5
55.5
139
PF-6-10 43 97% 55 99% 300 216%
C-7-15 84
91
99.9
PF-6-15 82.5 98% 93 102% 185 185%
C-8-10 53
66
136
PF-7-10 54 102% 75 114% 255 188%
C-8-15 102
114
158
PF-7-15 96 94% 111 97% 178 113%
4.5.4 Hollow Panel Slip
As discussed earlier, the walls with hollow panels experienced tension panel slip, where the
elongated PVC panel would slide against the concrete surface as seen in Figure 4.26. The
panels that slipped were still recording positive strain, but the effective elongation of the
panel was less than the potential elongation as seen on the tension face of the concrete wall.
These slips were most apparent in the 152 mm and 178 mm specimens. As seen in Figure
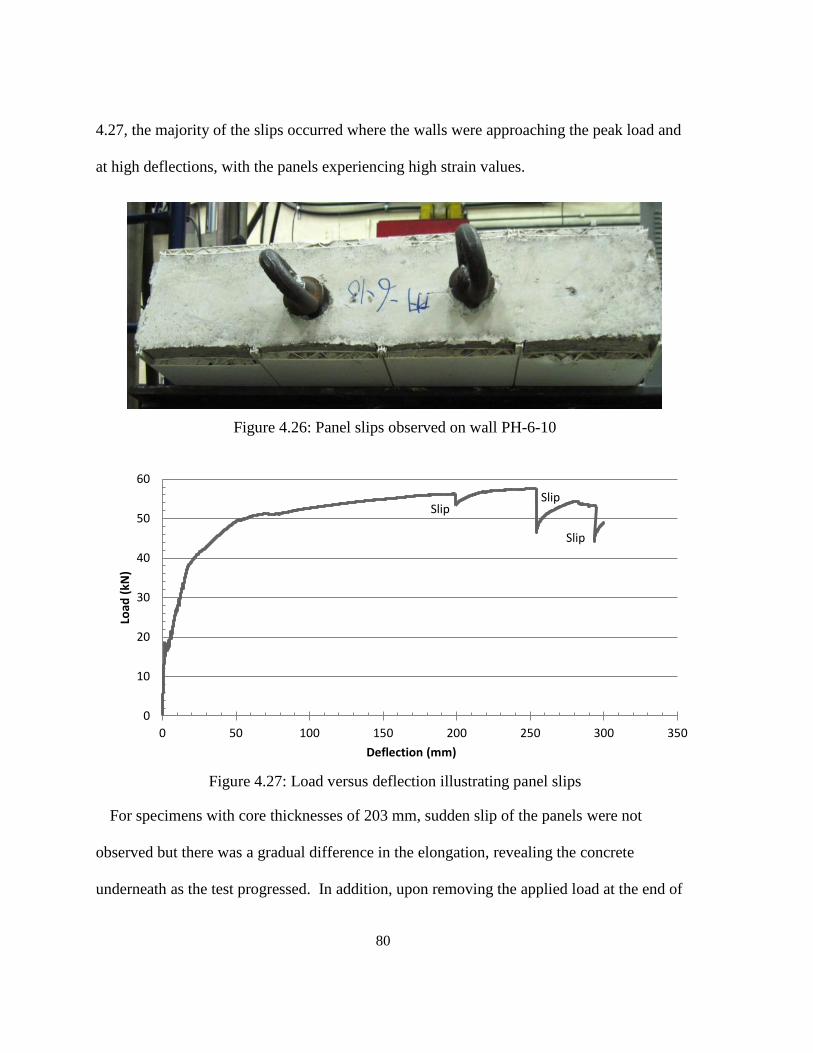
80
4.27, the majority of the slips occurred where the walls were approaching the peak load and
at high deflections, with the panels experiencing high strain values.
Figure 4.26: Panel slips observed on wall PH-6-10
Figure 4.27: Load versus deflection illustrating panel slips
For specimens with core thicknesses of 203 mm, sudden slip of the panels were not
observed but there was a gradual difference in the elongation, revealing the concrete
underneath as the test progressed. In addition, upon removing the applied load at the end of
Slip Slip
Slip
0
10
20
30
40
50
60
0 50 100 150 200 250 300 350
Load
(kN
)
Deflection (mm)
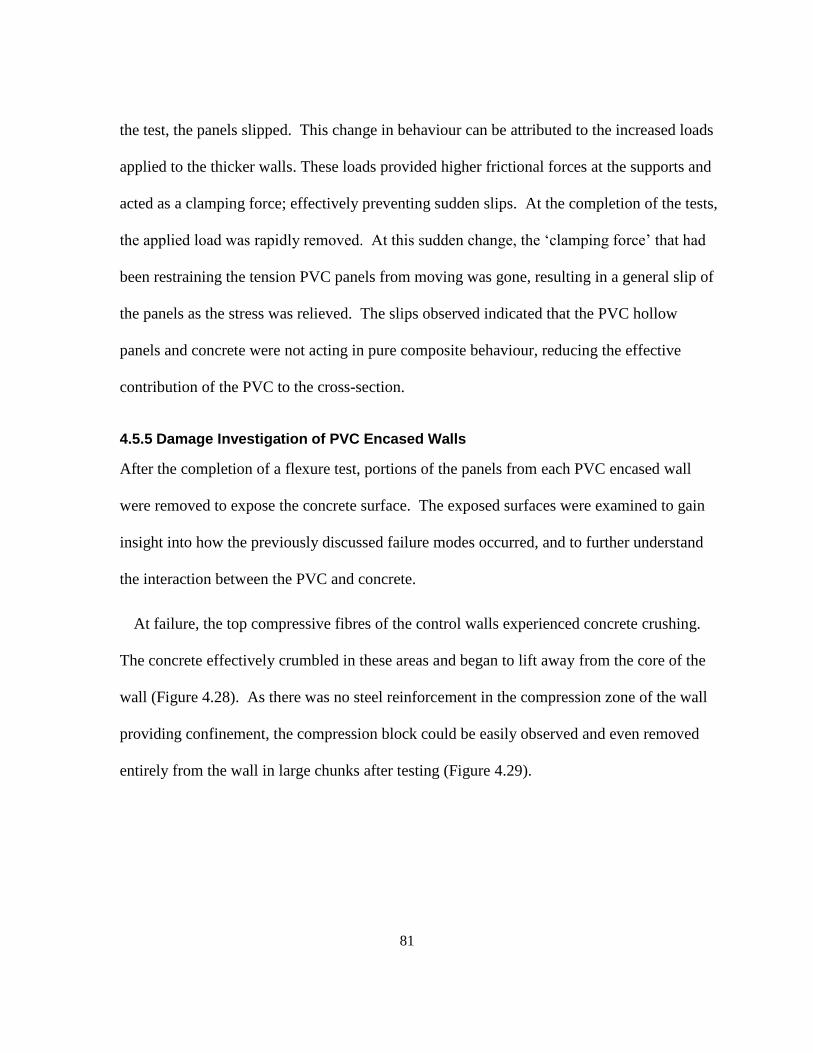
81
the test, the panels slipped. This change in behaviour can be attributed to the increased loads
applied to the thicker walls. These loads provided higher frictional forces at the supports and
acted as a clamping force; effectively preventing sudden slips. At the completion of the tests,
the applied load was rapidly removed. At this sudden change, the ‘clamping force’ that had
been restraining the tension PVC panels from moving was gone, resulting in a general slip of
the panels as the stress was relieved. The slips observed indicated that the PVC hollow
panels and concrete were not acting in pure composite behaviour, reducing the effective
contribution of the PVC to the cross-section.
4.5.5 Damage Investigation of PVC Encased Walls
After the completion of a flexure test, portions of the panels from each PVC encased wall
were removed to expose the concrete surface. The exposed surfaces were examined to gain
insight into how the previously discussed failure modes occurred, and to further understand
the interaction between the PVC and concrete.
At failure, the top compressive fibres of the control walls experienced concrete crushing.
The concrete effectively crumbled in these areas and began to lift away from the core of the
wall (Figure 4.28). As there was no steel reinforcement in the compression zone of the wall
providing confinement, the compression block could be easily observed and even removed
entirely from the wall in large chunks after testing (Figure 4.29).
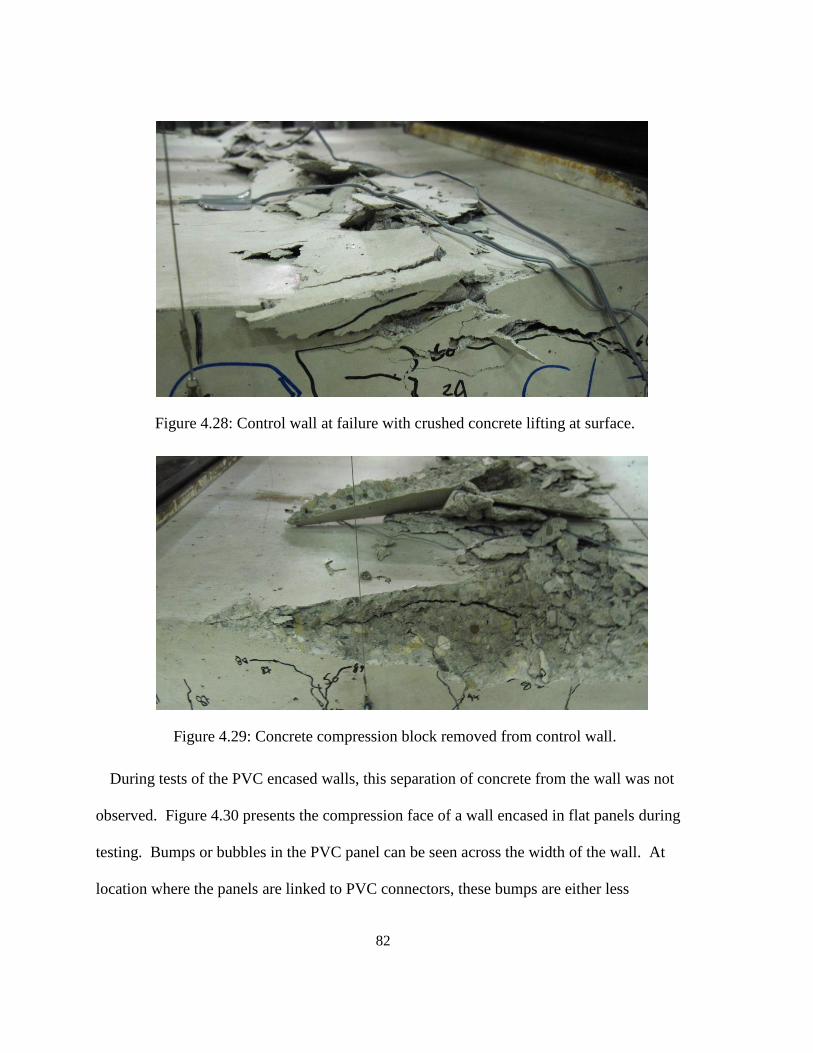
82
Figure 4.28: Control wall at failure with crushed concrete lifting at surface.
Figure 4.29: Concrete compression block removed from control wall.
During tests of the PVC encased walls, this separation of concrete from the wall was not
observed. Figure 4.30 presents the compression face of a wall encased in flat panels during
testing. Bumps or bubbles in the PVC panel can be seen across the width of the wall. At
location where the panels are linked to PVC connectors, these bumps are either less
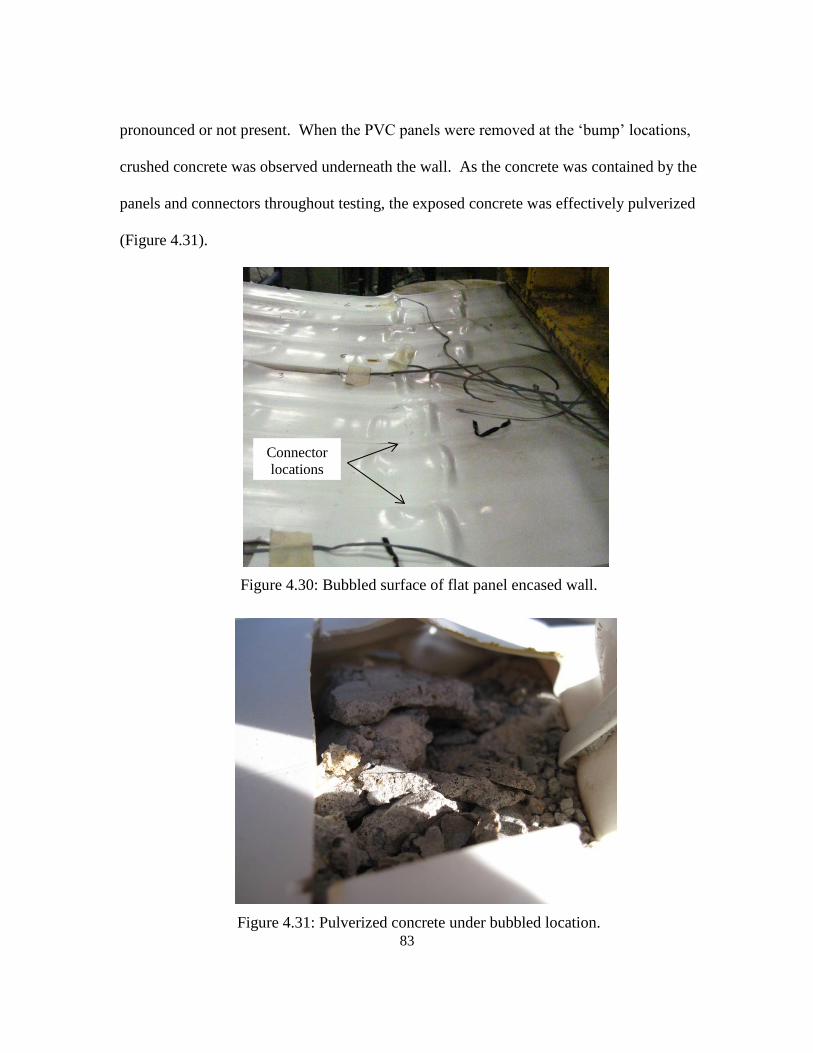
83
pronounced or not present. When the PVC panels were removed at the ‘bump’ locations,
crushed concrete was observed underneath the wall. As the concrete was contained by the
panels and connectors throughout testing, the exposed concrete was effectively pulverized
(Figure 4.31).
Figure 4.30: Bubbled surface of flat panel encased wall.
Figure 4.31: Pulverized concrete under bubbled location.
Connector
locations
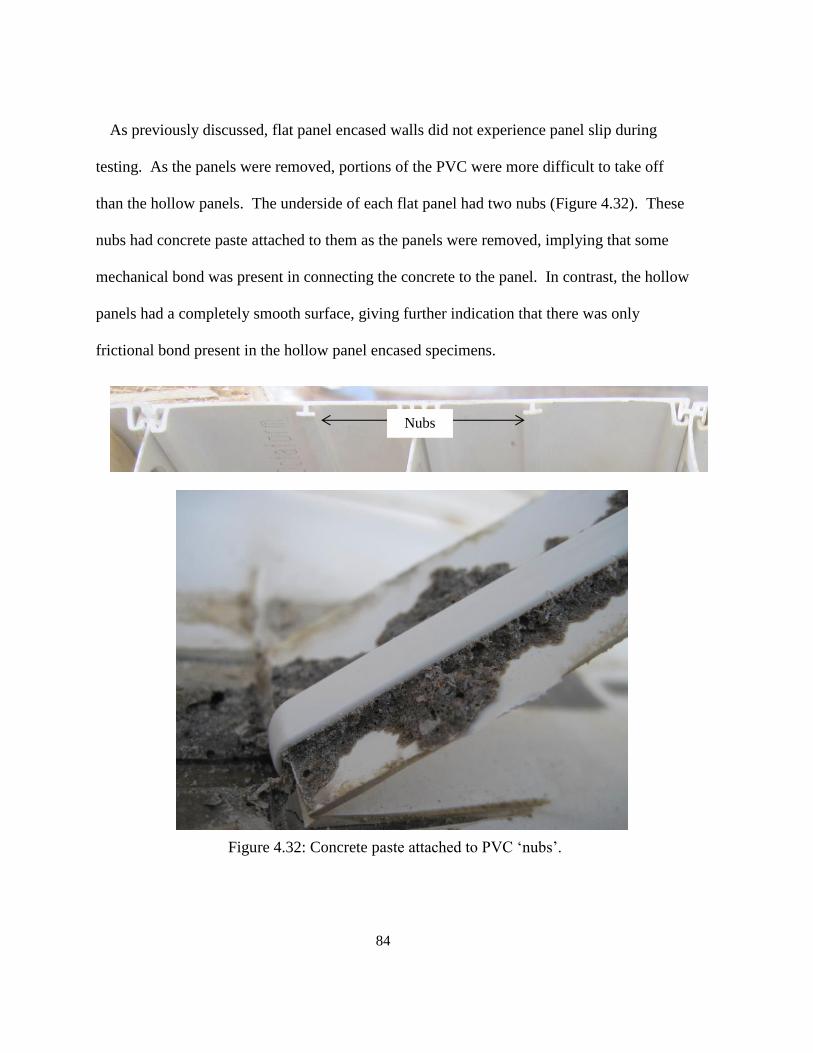
84
As previously discussed, flat panel encased walls did not experience panel slip during
testing. As the panels were removed, portions of the PVC were more difficult to take off
than the hollow panels. The underside of each flat panel had two nubs (Figure 4.32). These
nubs had concrete paste attached to them as the panels were removed, implying that some
mechanical bond was present in connecting the concrete to the panel. In contrast, the hollow
panels had a completely smooth surface, giving further indication that there was only
frictional bond present in the hollow panel encased specimens.
Figure 4.32: Concrete paste attached to PVC ‘nubs’.
Nubs
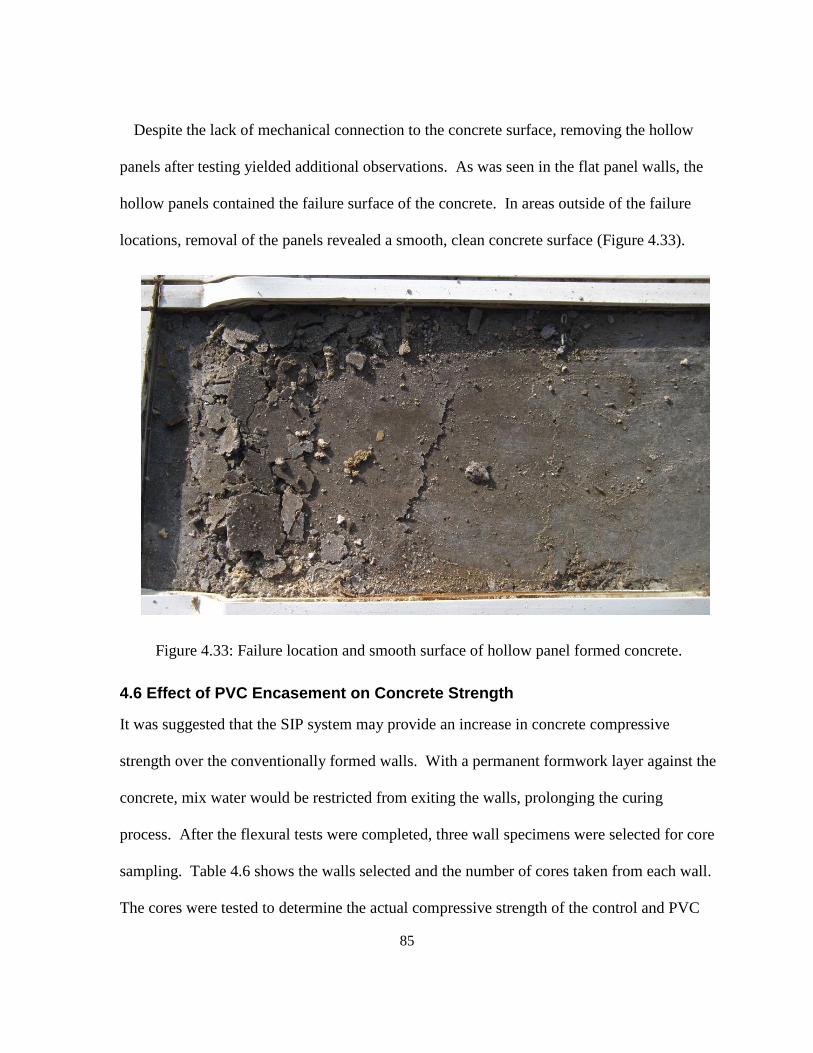
85
Despite the lack of mechanical connection to the concrete surface, removing the hollow
panels after testing yielded additional observations. As was seen in the flat panel walls, the
hollow panels contained the failure surface of the concrete. In areas outside of the failure
locations, removal of the panels revealed a smooth, clean concrete surface (Figure 4.33).
Figure 4.33: Failure location and smooth surface of hollow panel formed concrete.
4.6 Effect of PVC Encasement on Concrete Strength
It was suggested that the SIP system may provide an increase in concrete compressive
strength over the conventionally formed walls. With a permanent formwork layer against the
concrete, mix water would be restricted from exiting the walls, prolonging the curing
process. After the flexural tests were completed, three wall specimens were selected for core
sampling. Table 4.6 shows the walls selected and the number of cores taken from each wall.
The cores were tested to determine the actual compressive strength of the control and PVC
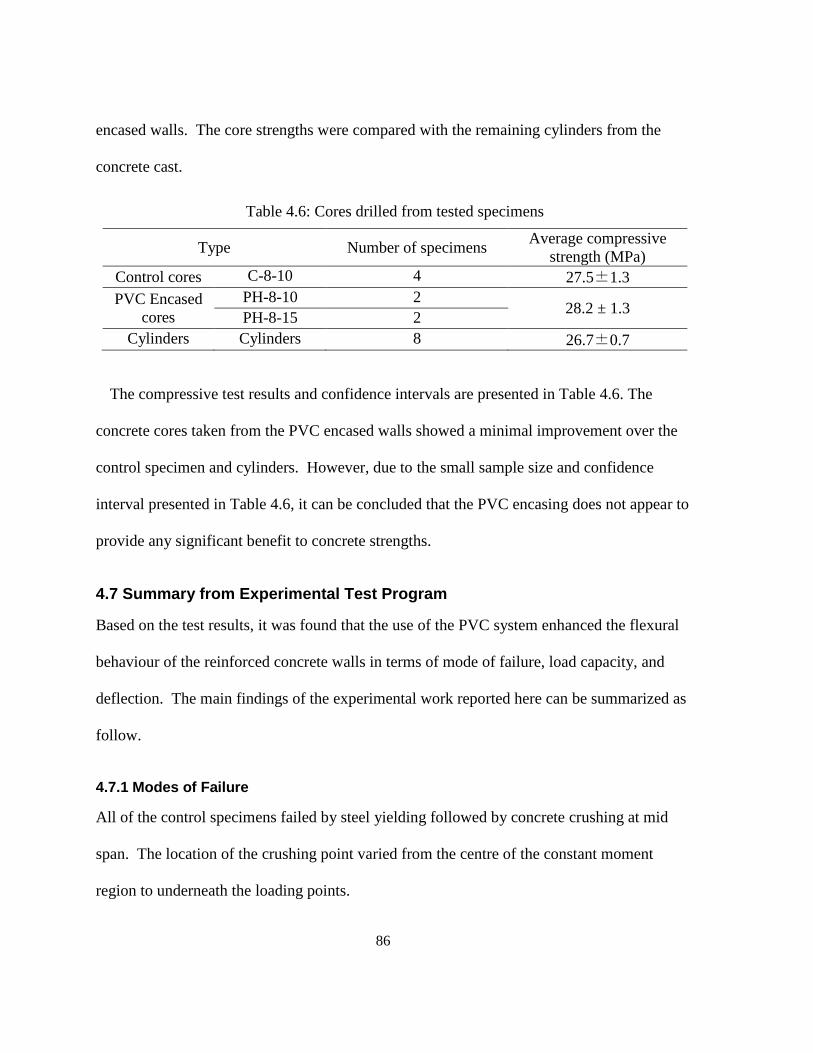
86
encased walls. The core strengths were compared with the remaining cylinders from the
concrete cast.
Table 4.6: Cores drilled from tested specimens
Type Number of specimens Average compressive
strength (MPa)
Control cores C-8-10 4 27.5±1.3
PVC Encased
cores
PH-8-10 2 28.2 ± 1.3
PH-8-15 2
Cylinders Cylinders 8 26.7±0.7
The compressive test results and confidence intervals are presented in Table 4.6. The
concrete cores taken from the PVC encased walls showed a minimal improvement over the
control specimen and cylinders. However, due to the small sample size and confidence
interval presented in Table 4.6, it can be concluded that the PVC encasing does not appear to
provide any significant benefit to concrete strengths.
4.7 Summary from Experimental Test Program
Based on the test results, it was found that the use of the PVC system enhanced the flexural
behaviour of the reinforced concrete walls in terms of mode of failure, load capacity, and
deflection. The main findings of the experimental work reported here can be summarized as
follow.
4.7.1 Modes of Failure
All of the control specimens failed by steel yielding followed by concrete crushing at mid
span. The location of the crushing point varied from the centre of the constant moment
region to underneath the loading points.
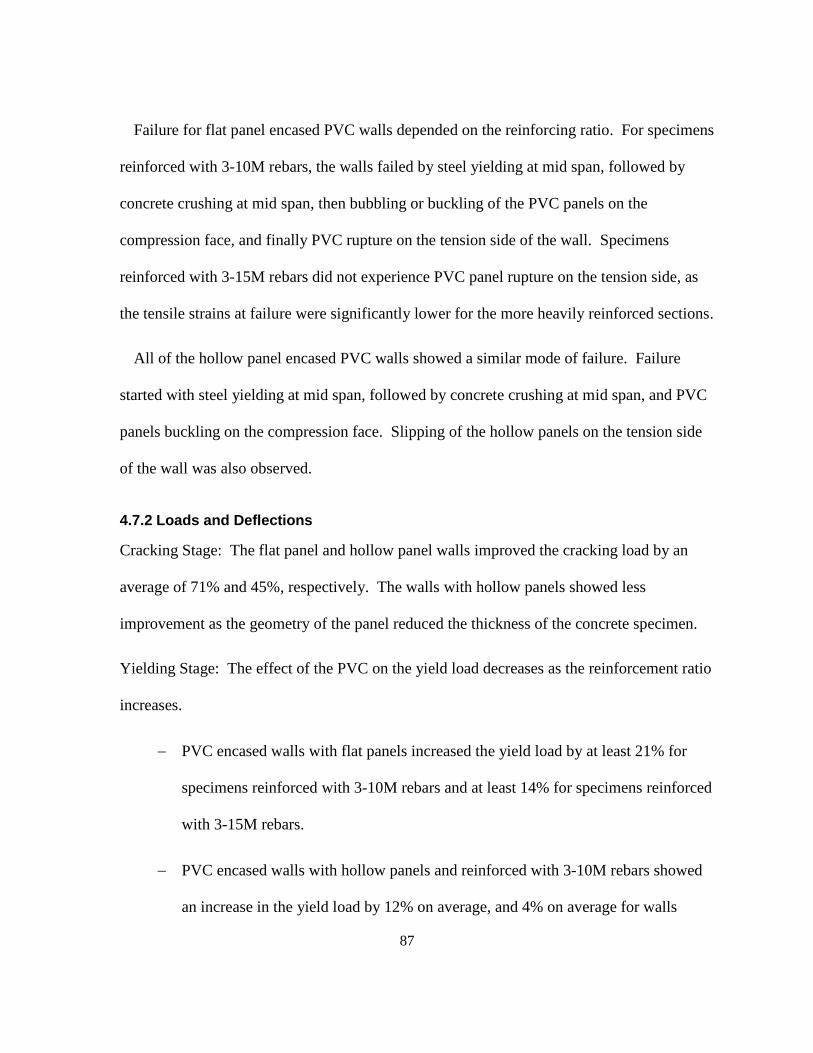
87
Failure for flat panel encased PVC walls depended on the reinforcing ratio. For specimens
reinforced with 3-10M rebars, the walls failed by steel yielding at mid span, followed by
concrete crushing at mid span, then bubbling or buckling of the PVC panels on the
compression face, and finally PVC rupture on the tension side of the wall. Specimens
reinforced with 3-15M rebars did not experience PVC panel rupture on the tension side, as
the tensile strains at failure were significantly lower for the more heavily reinforced sections.
All of the hollow panel encased PVC walls showed a similar mode of failure. Failure
started with steel yielding at mid span, followed by concrete crushing at mid span, and PVC
panels buckling on the compression face. Slipping of the hollow panels on the tension side
of the wall was also observed.
4.7.2 Loads and Deflections
Cracking Stage: The flat panel and hollow panel walls improved the cracking load by an
average of 71% and 45%, respectively. The walls with hollow panels showed less
improvement as the geometry of the panel reduced the thickness of the concrete specimen.
Yielding Stage: The effect of the PVC on the yield load decreases as the reinforcement ratio
increases.
PVC encased walls with flat panels increased the yield load by at least 21% for
specimens reinforced with 3-10M rebars and at least 14% for specimens reinforced
with 3-15M rebars.
PVC encased walls with hollow panels and reinforced with 3-10M rebars showed
an increase in the yield load by 12% on average, and 4% on average for walls
88
reinforced with 3-15M rebars. It is worth mentioning that the depth of the steel
reinforcement for the walls with hollow panels was less than the walls with flat
panels, which reduced the potential increase in the yield load.
The yield deflection was not affected by the presence of the PVC panels.
Peak Stage: The contribution of the PVC system to the peak load decreases as the
reinforcement ratio increases.
PVC encased walls with flat panels showed an increased peak load by at least 30%
for specimens reinforced with 3-10M rebars and at least 20% for specimens with 3-
15M rebars, when compared with the equivalent control walls.
PVC encased walls with hollow panels and reinforced with 3-10M rebars showed
an increased peak load by 38% on average, and 16% on average for walls
reinforced with 3-15M rebars. The greatest improvement was observed in the 203
mm thick specimens due to the high clamping force that prevented sudden slips in
the PVC tension panels.
Ultimate deflection: The increase in ultimate deflection for the flat and hollow paneled PVC
encased walls varied from 3% to 106%.
4.7.3 Strains in the PVC Panel
Compressive strains: Strain values for concrete and PVC remained consistent until
concrete crushing. The PVC strain gauge readings continued to increase until
buckling of the PVC. The average strain in the PVC at failure was -10000µε and -
4000 µε for concrete.
89
Tensile strains: The strain gauges readings of both the PVC and steel were
consistent. Very high strain values were recorded on the PVC tension panels in
multiple tests at failure (>50000µε).
4.7.4 Effect of PVC Encasing on Concrete Strength
Concrete cores were taken from control and hollow panel specimens. When compared with
the cast cylinders, there was no significant difference found in the compressive strength.
Therefore, the PVC encasement does not have a significant impact on the compressive
strength of concrete over bare reinforced concrete.
90
Chapter 5: Analytical Investigation
5.1 Introduction
The following section will outline the model developed for calculating the flexural resistance
of PVC SIP formed concrete walls at yield and ultimate load levels. Results from the model
will be compared with the experimental data.
5.2 Assumptions of the Model
Strain compatibility analysis has been used to determine the flexural resistance of various
reinforced concrete elements. In this method a force balance of concrete acting in
compression and reinforcing steel in tension is determined from a linear strain distribution
through the element. The following assumptions are made to validate the analysis:
plane sections remain plane after bending,
a perfect bond exists between the reinforcing steel and concrete,
the concrete provides zero tension resistance, and;
concrete crushes when reaching the crushing strain cu = 0.0035
The mode of failure of the element depends on the strains in the concrete and the steel. If
steel yields before concrete crushes, the flexural element fails in a ductile manner and is
classified as under-reinforced (CSA A23.3-04). In this situation, additional load applied
beyond the yield point results in significant deflection and eventual crushing of the concrete
in compression. If the concrete crushes before the steel yields, the flexural element fails in a
more brittle manner and is classified as over-reinforced.
91
The model presented here calculates the capacity of PVC encased walls. Therefore, a third
material, PVC, is included in the strain compatibility analysis and equilibrium. In addition to
the previous assumptions, the following assumptions are made.
perfect bond exists between the PVC and concrete,
both the PVC panels on the tension and compression face contribute to the
resistance of the wall,
continuous portions of the PVC connectors contribute to resisting tensile forces
and,
continuous portions of the PVC connectors in the compression zone are neglected
due to small strain values.
Further details of the material properties are discussed in the next section.
5.3 Material Properties
5.3.1 Concrete
For compressive strengths less than 41 MPa, concrete is assumed to follow a parabolic stress
strain relationship as seen in Figure 5.1. The stress in the concrete versus the corresponding
strain can be expressed using Equation 5-1 (Collins and Mitchell 1987). CSA A23.3-04
recommends a strain value of 0.0025 corresponding to the 25MPa concrete compressive
strength and a crushing strain , of 0.0035 and.
(
(
)
) [5-1]

92
√
Where,
: the concrete stress corresponding to a given concrete strain ( ) (MPa),
: the concrete compressive strength (MPa),
: the concrete strain corresponding to a given concrete stress ( ),
: the concrete strain corresponding to the concrete compressive strength ( , and
: the Young’s modulus of concrete (MPa).
Figure 5.1: Idealized concrete stress-strain relationship.
The use of an equivalent rectangular concrete stress block has been adopted for design in
multiple codes (CSA A23.3-04, ACI 318) and in previous models developed for PVC
0
5
10
15
20
25
30
-0.004-0.0035-0.003-0.0025-0.002-0.0015-0.001-0.00050
Co
mp
ress
ive
Str
en
gth
(M
Pa)
Compressive Strain
fc
Linear
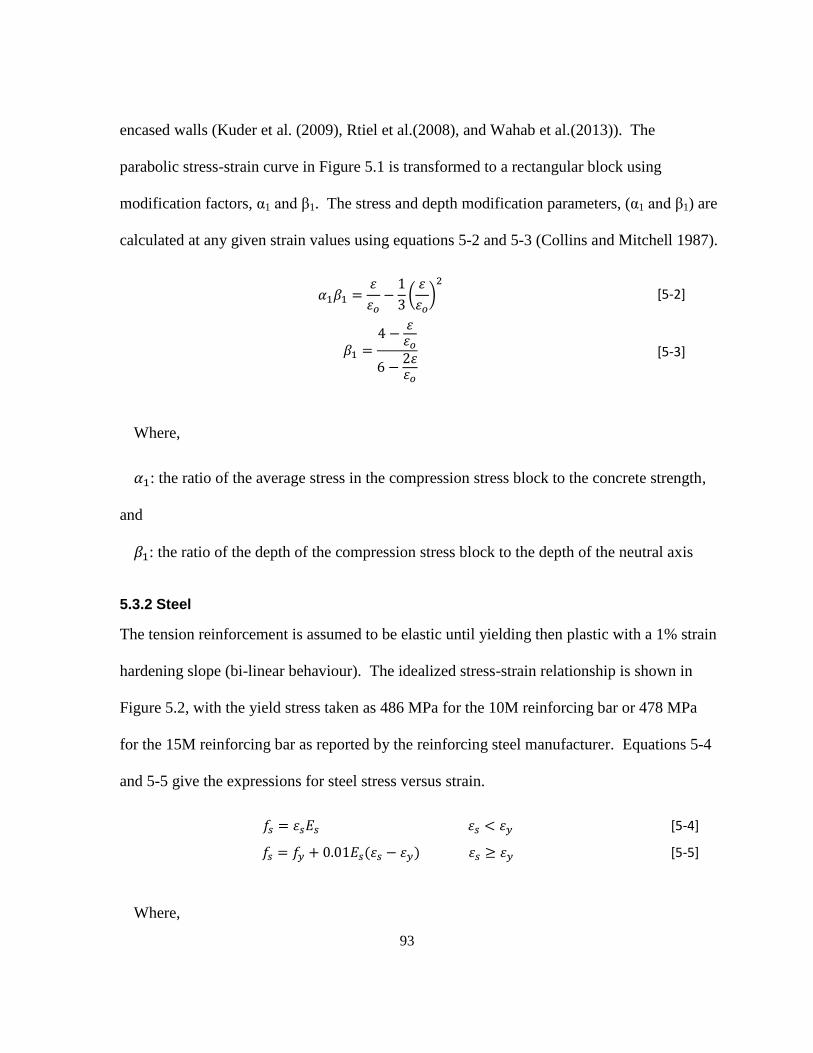
93
encased walls (Kuder et al. (2009), Rtiel et al.(2008), and Wahab et al.(2013)). The
parabolic stress-strain curve in Figure 5.1 is transformed to a rectangular block using
modification factors, α1 and β1. The stress and depth modification parameters, (α1 and β1) are
calculated at any given strain values using equations 5-2 and 5-3 (Collins and Mitchell 1987).
(
)
[5-2]
[5-3]
Where,
: the ratio of the average stress in the compression stress block to the concrete strength,
and
: the ratio of the depth of the compression stress block to the depth of the neutral axis
5.3.2 Steel
The tension reinforcement is assumed to be elastic until yielding then plastic with a 1% strain
hardening slope (bi-linear behaviour). The idealized stress-strain relationship is shown in
Figure 5.2, with the yield stress taken as 486 MPa for the 10M reinforcing bar or 478 MPa
for the 15M reinforcing bar as reported by the reinforcing steel manufacturer. Equations 5-4
and 5-5 give the expressions for steel stress versus strain.
[5-4]
[5-5]
Where,
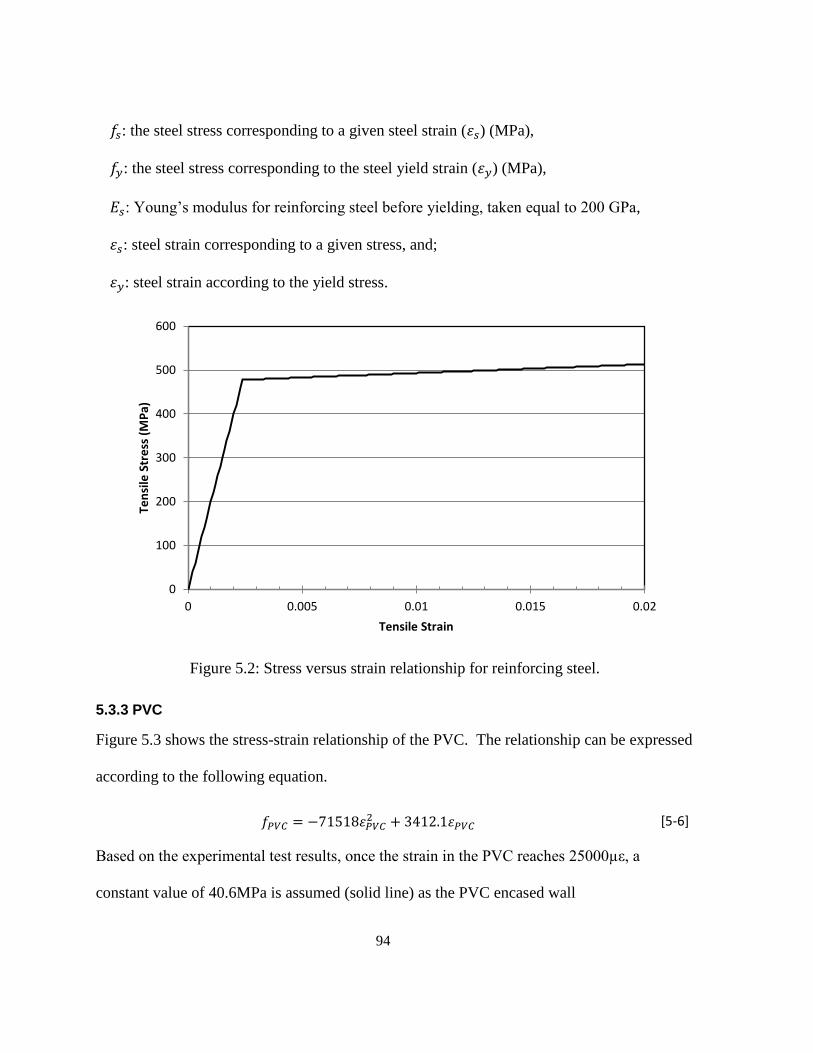
94
: the steel stress corresponding to a given steel strain ( ) (MPa),
: the steel stress corresponding to the steel yield strain ( ) (MPa),
: Young’s modulus for reinforcing steel before yielding, taken equal to 200 GPa,
: steel strain corresponding to a given stress, and;
: steel strain according to the yield stress.
Figure 5.2: Stress versus strain relationship for reinforcing steel.
5.3.3 PVC
Figure 5.3 shows the stress-strain relationship of the PVC. The relationship can be expressed
according to the following equation.
[5-6]
Based on the experimental test results, once the strain in the PVC reaches 25000µε, a
constant value of 40.6MPa is assumed (solid line) as the PVC encased wall
0
100
200
300
400
500
600
0 0.005 0.01 0.015 0.02
Ten
sile
Str
ess
(M
Pa)
Tensile Strain
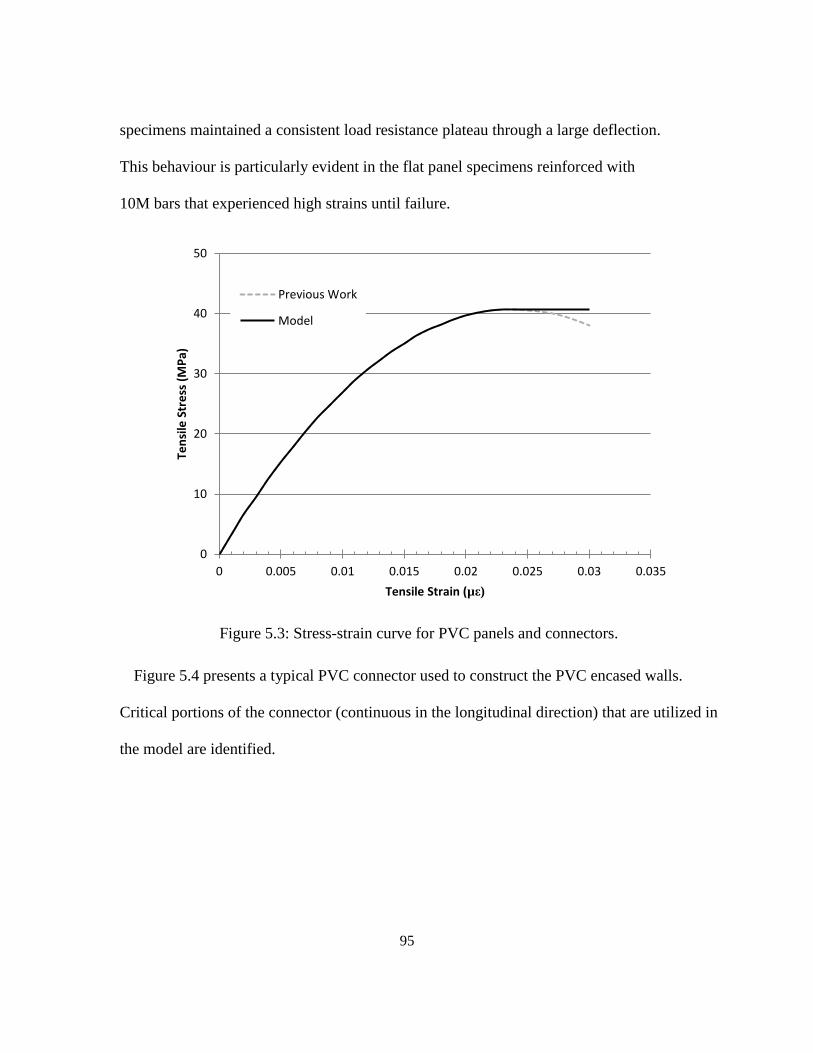
95
specimens maintained a consistent load resistance plateau through a large deflection.
This behaviour is particularly evident in the flat panel specimens reinforced with
10M bars that experienced high strains until failure.
Figure 5.3: Stress-strain curve for PVC panels and connectors.
Figure 5.4 presents a typical PVC connector used to construct the PVC encased walls.
Critical portions of the connector (continuous in the longitudinal direction) that are utilized in
the model are identified.
0
10
20
30
40
50
0 0.005 0.01 0.015 0.02 0.025 0.03 0.035
Ten
sile
Str
ess
(M
Pa)
Tensile Strain (µε)
Previous Work
Model
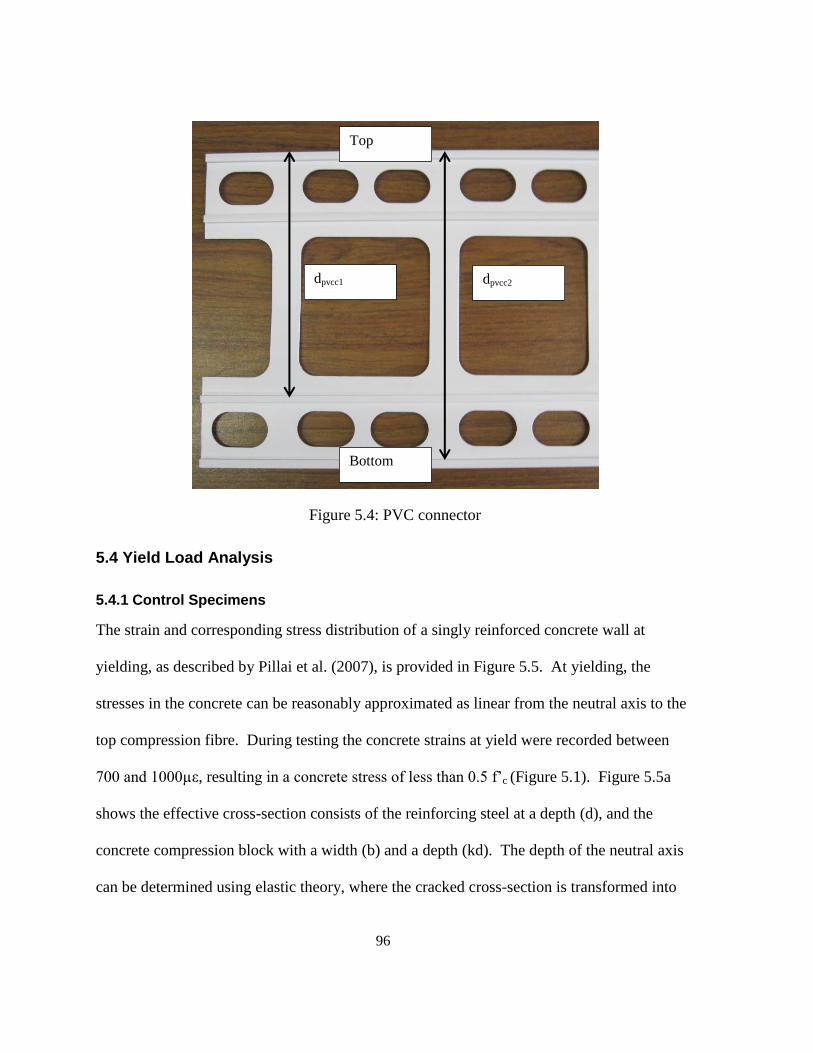
96
Figure 5.4: PVC connector
5.4 Yield Load Analysis
5.4.1 Control Specimens
The strain and corresponding stress distribution of a singly reinforced concrete wall at
yielding, as described by Pillai et al. (2007), is provided in Figure 5.5. At yielding, the
stresses in the concrete can be reasonably approximated as linear from the neutral axis to the
top compression fibre. During testing the concrete strains at yield were recorded between
00 and 1000µε, resulting in a concrete stress of less than 0.5 f’c (Figure 5.1). Figure 5.5a
shows the effective cross-section consists of the reinforcing steel at a depth (d), and the
concrete compression block with a width (b) and a depth (kd). The depth of the neutral axis
can be determined using elastic theory, where the cracked cross-section is transformed into
Top
Bottom
dpvcc1 dpvcc2
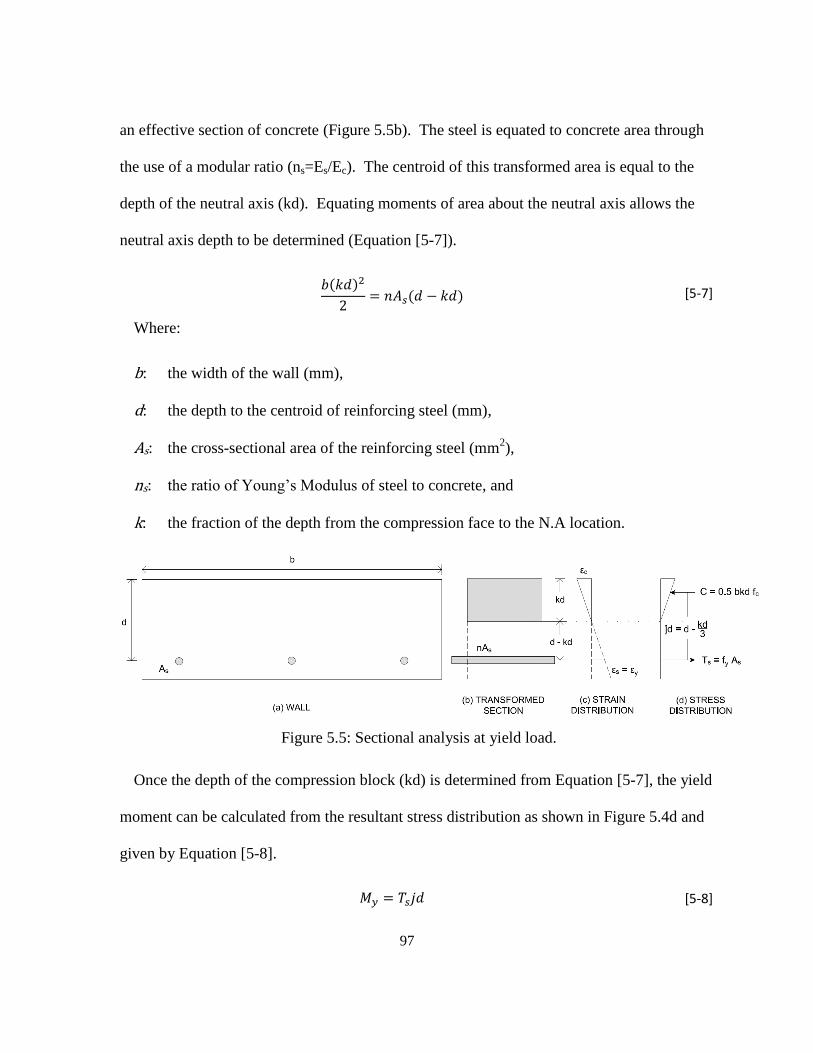
97
an effective section of concrete (Figure 5.5b). The steel is equated to concrete area through
the use of a modular ratio (ns=Es/Ec). The centroid of this transformed area is equal to the
depth of the neutral axis (kd). Equating moments of area about the neutral axis allows the
neutral axis depth to be determined (Equation [5-7]).
[5-7]
Where:
b: the width of the wall (mm),
d: the depth to the centroid of reinforcing steel (mm),
As: the cross-sectional area of the reinforcing steel (mm2),
ns: the ratio of Young’s Modulus of steel to concrete, and
k: the fraction of the depth from the compression face to the N.A location.
Figure 5.5: Sectional analysis at yield load.
Once the depth of the compression block (kd) is determined from Equation [5-7], the yield
moment can be calculated from the resultant stress distribution as shown in Figure 5.4d and
given by Equation [5-8].
[5-8]
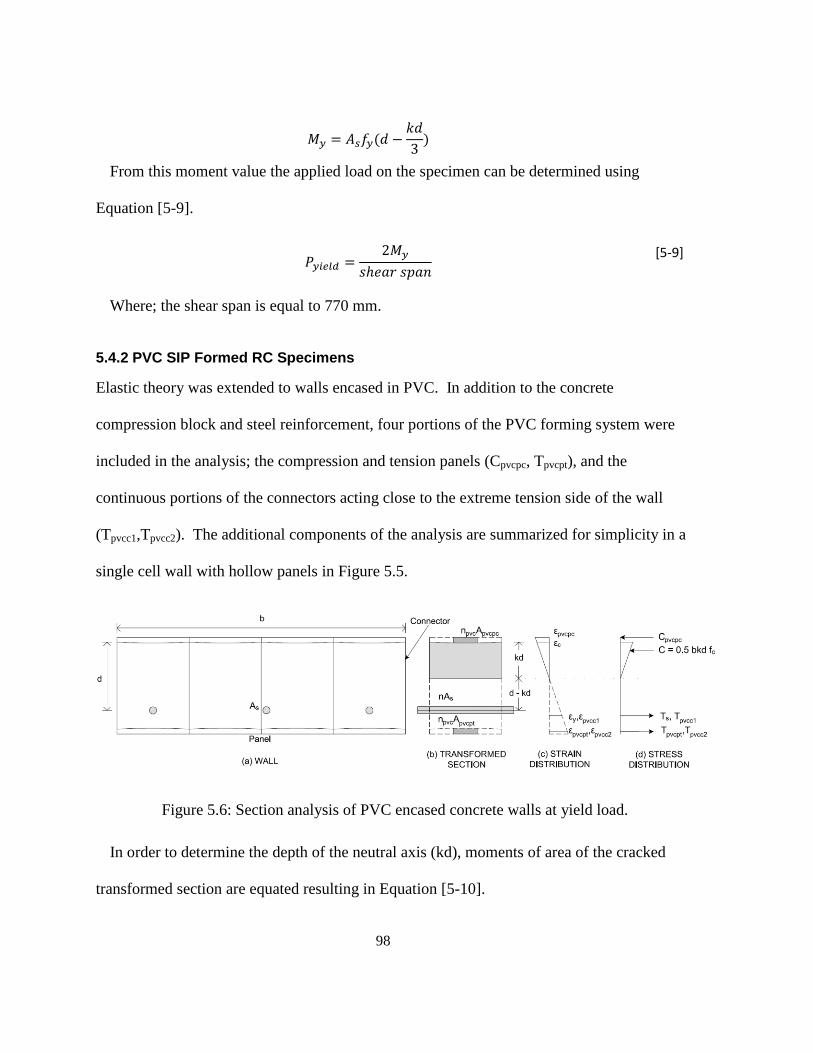
98
From this moment value the applied load on the specimen can be determined using
Equation [5-9].
[5-9]
Where; the shear span is equal to 770 mm.
5.4.2 PVC SIP Formed RC Specimens
Elastic theory was extended to walls encased in PVC. In addition to the concrete
compression block and steel reinforcement, four portions of the PVC forming system were
included in the analysis; the compression and tension panels (Cpvcpc, Tpvcpt), and the
continuous portions of the connectors acting close to the extreme tension side of the wall
(Tpvcc1,Tpvcc2). The additional components of the analysis are summarized for simplicity in a
single cell wall with hollow panels in Figure 5.5.
Figure 5.6: Section analysis of PVC encased concrete walls at yield load.
In order to determine the depth of the neutral axis (kd), moments of area of the cracked
transformed section are equated resulting in Equation [5-10].
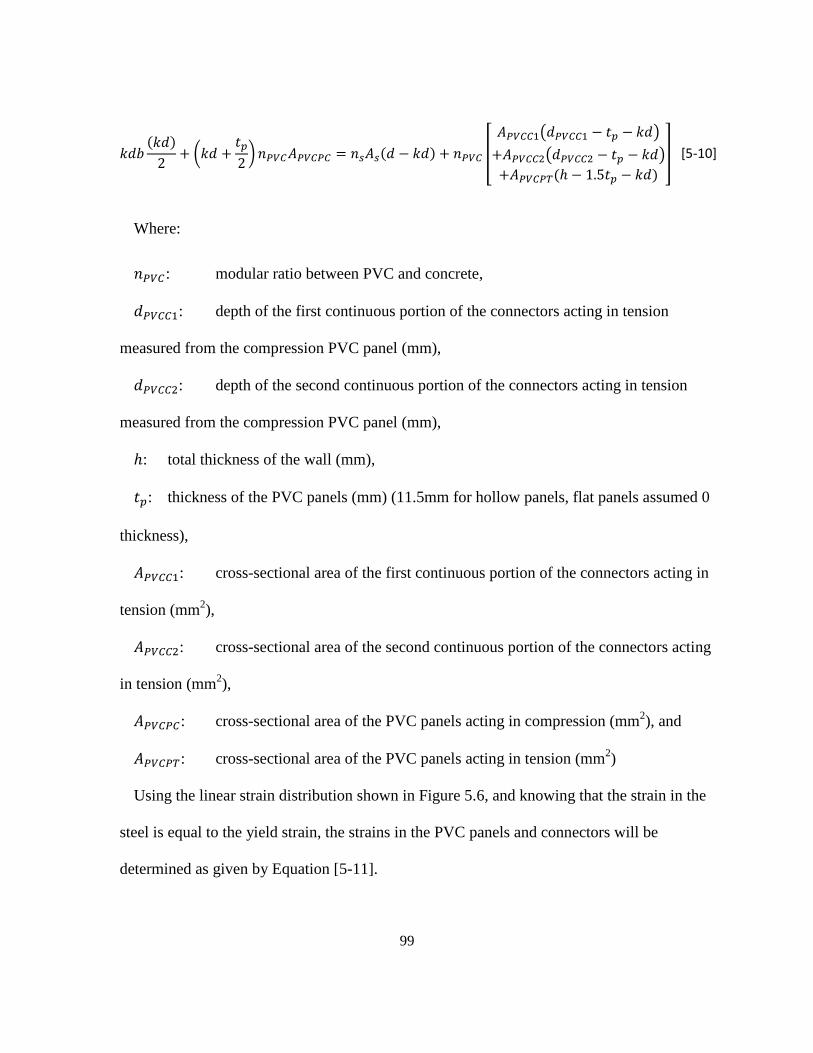
99
(
) [
( )
( )
] [5-10]
Where:
: modular ratio between PVC and concrete,
: depth of the first continuous portion of the connectors acting in tension
measured from the compression PVC panel (mm),
: depth of the second continuous portion of the connectors acting in tension
measured from the compression PVC panel (mm),
: total thickness of the wall (mm),
: thickness of the PVC panels (mm) (11.5mm for hollow panels, flat panels assumed 0
thickness),
: cross-sectional area of the first continuous portion of the connectors acting in
tension (mm2),
: cross-sectional area of the second continuous portion of the connectors acting
in tension (mm2),
: cross-sectional area of the PVC panels acting in compression (mm2), and
: cross-sectional area of the PVC panels acting in tension (mm2)
Using the linear strain distribution shown in Figure 5.6, and knowing that the strain in the
steel is equal to the yield strain, the strains in the PVC panels and connectors will be
determined as given by Equation [5-11].
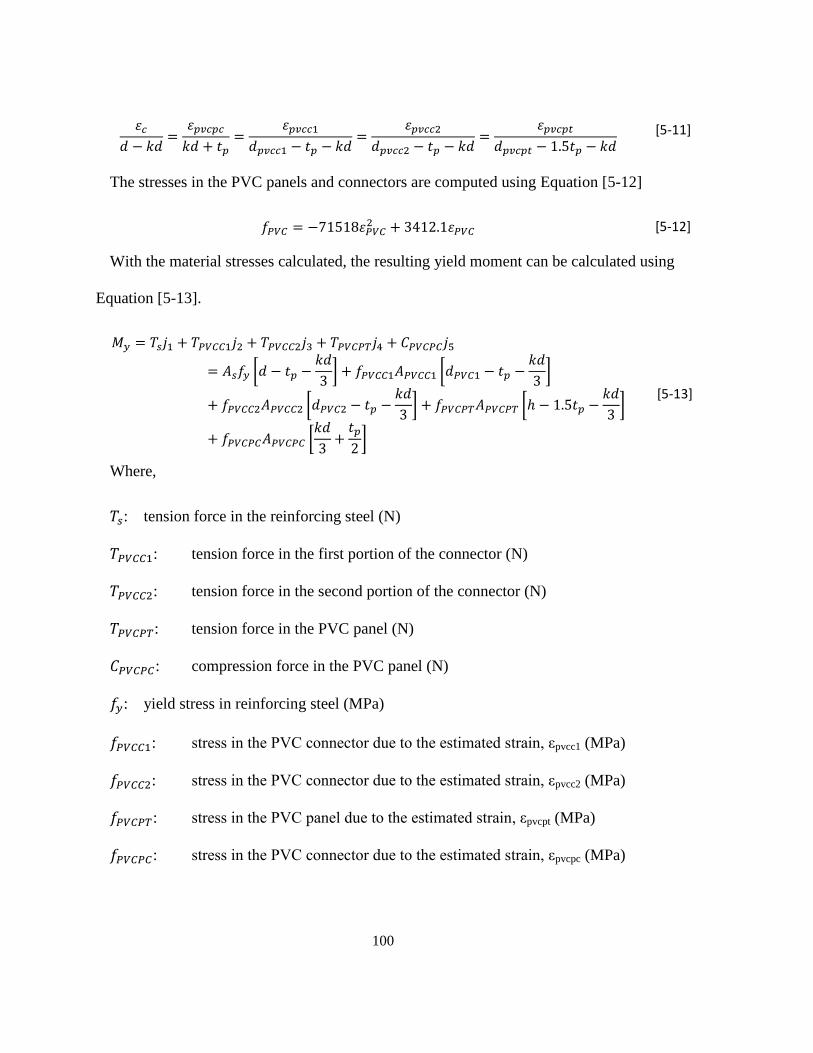
100
[5-11]
The stresses in the PVC panels and connectors are computed using Equation [5-12]
[5-12]
With the material stresses calculated, the resulting yield moment can be calculated using
Equation [5-13].
[
] [
]
[
] [
]
[
]
[5-13]
Where,
: tension force in the reinforcing steel (N)
: tension force in the first portion of the connector (N)
: tension force in the second portion of the connector (N)
: tension force in the PVC panel (N)
: compression force in the PVC panel (N)
: yield stress in reinforcing steel (MPa)
: stress in the PVC connector due to the estimated strain, εpvcc1 (MPa)
: stress in the PVC connector due to the estimated strain, εpvcc2 (MPa)
: stress in the PVC panel due to the estimated strain, εpvcpt (MPa)
: stress in the PVC connector due to the estimated strain, εpvcpc (MPa)
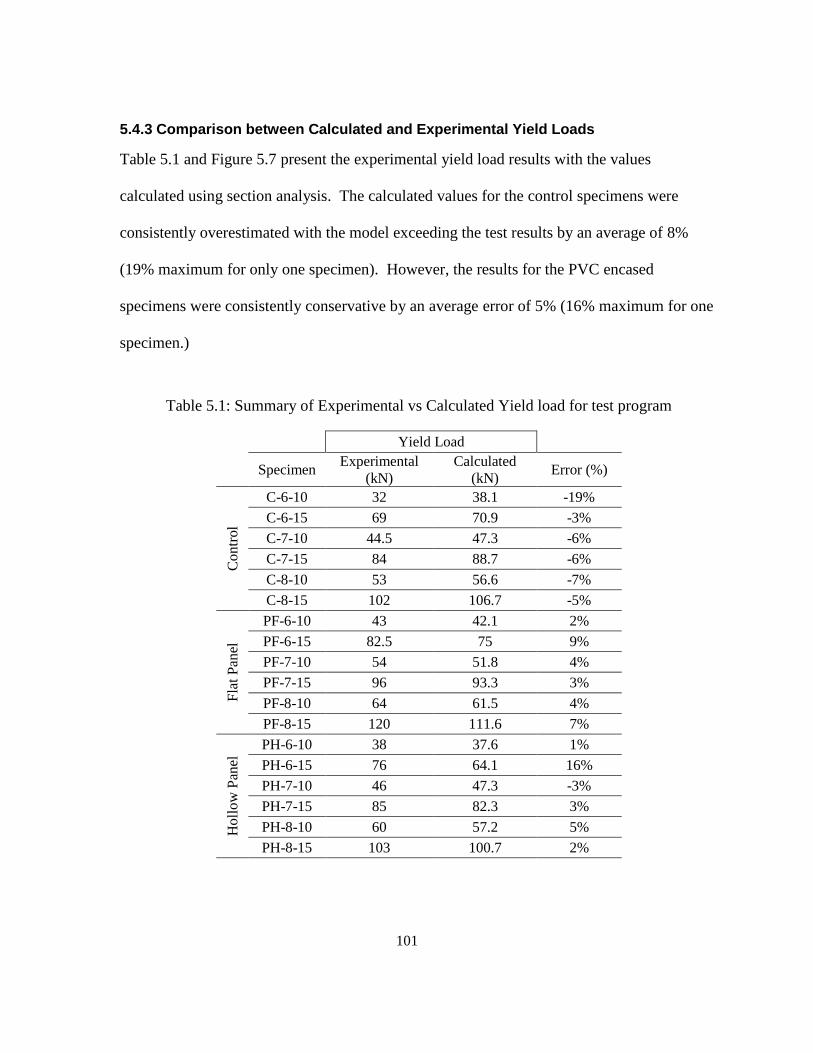
101
5.4.3 Comparison between Calculated and Experimental Yield Loads
Table 5.1 and Figure 5.7 present the experimental yield load results with the values
calculated using section analysis. The calculated values for the control specimens were
consistently overestimated with the model exceeding the test results by an average of 8%
(19% maximum for only one specimen). However, the results for the PVC encased
specimens were consistently conservative by an average error of 5% (16% maximum for one
specimen.)
Table 5.1: Summary of Experimental vs Calculated Yield load for test program
Yield Load
Specimen Experimental
(kN)
Calculated
(kN) Error (%)
Contr
ol
C-6-10 32 38.1 -19%
C-6-15 69 70.9 -3%
C-7-10 44.5 47.3 -6%
C-7-15 84 88.7 -6%
C-8-10 53 56.6 -7%
C-8-15 102 106.7 -5%
Fla
t P
anel
PF-6-10 43 42.1 2%
PF-6-15 82.5 75 9%
PF-7-10 54 51.8 4%
PF-7-15 96 93.3 3%
PF-8-10 64 61.5 4%
PF-8-15 120 111.6 7%
Ho
llo
w P
anel
PH-6-10 38 37.6 1%
PH-6-15 76 64.1 16%
PH-7-10 46 47.3 -3%
PH-7-15 85 82.3 3%
PH-8-10 60 57.2 5%
PH-8-15 103 100.7 2%
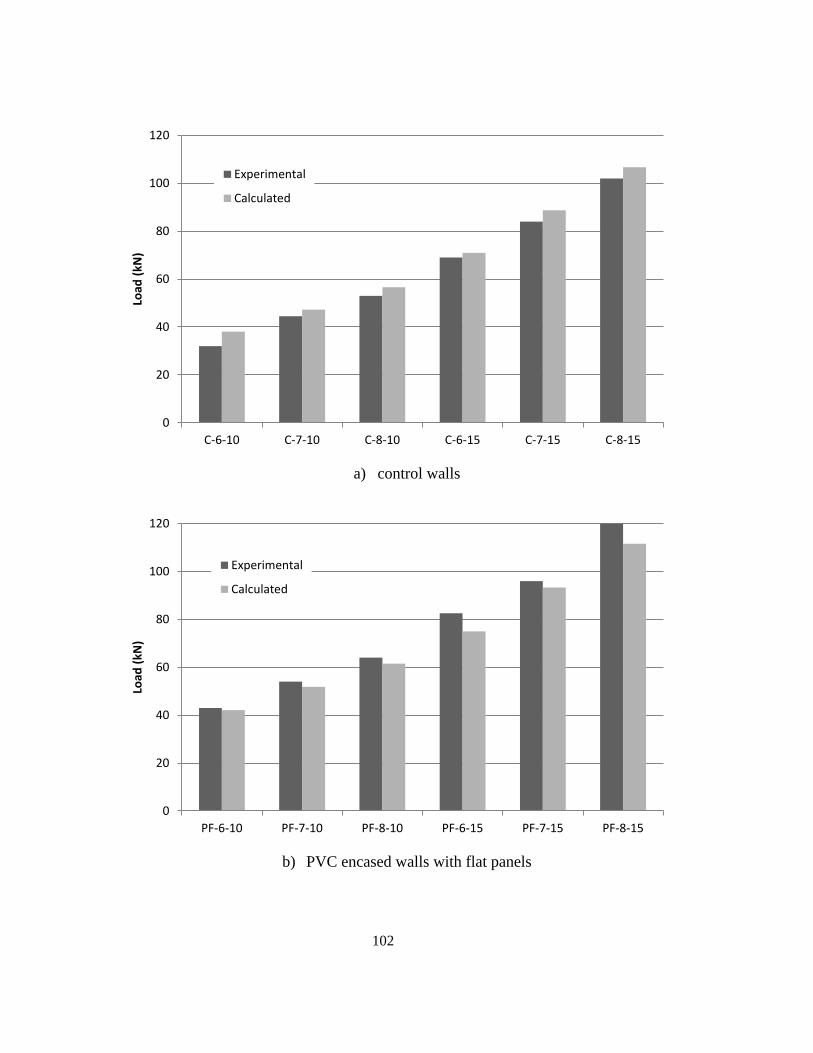
102
a) control walls
b) PVC encased walls with flat panels
0
20
40
60
80
100
120
C-6-10 C-7-10 C-8-10 C-6-15 C-7-15 C-8-15
Load
(kN
)
Experimental
Calculated
0
20
40
60
80
100
120
PF-6-10 PF-7-10 PF-8-10 PF-6-15 PF-7-15 PF-8-15
Load
(kN
)
Experimental
Calculated
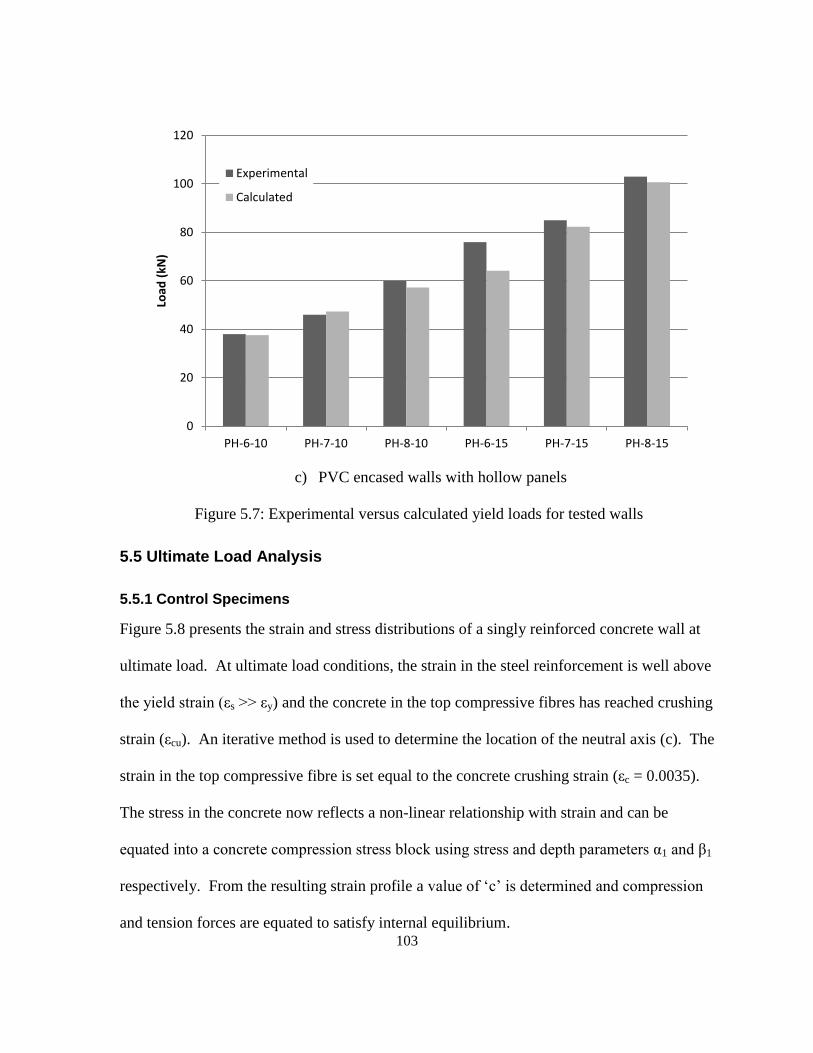
103
c) PVC encased walls with hollow panels
Figure 5.7: Experimental versus calculated yield loads for tested walls
5.5 Ultimate Load Analysis
5.5.1 Control Specimens
Figure 5.8 presents the strain and stress distributions of a singly reinforced concrete wall at
ultimate load. At ultimate load conditions, the strain in the steel reinforcement is well above
the yield strain (εs >> εy) and the concrete in the top compressive fibres has reached crushing
strain (εcu). An iterative method is used to determine the location of the neutral axis (c). The
strain in the top compressive fibre is set equal to the concrete crushing strain (εc = 0.0035).
The stress in the concrete now reflects a non-linear relationship with strain and can be
equated into a concrete compression stress block using stress and depth parameters α1 and β1
respectively. From the resulting strain profile a value of ‘c’ is determined and compression
and tension forces are equated to satisfy internal equilibrium.
0
20
40
60
80
100
120
PH-6-10 PH-7-10 PH-8-10 PH-6-15 PH-7-15 PH-8-15
Load
(kN
) Experimental
Calculated
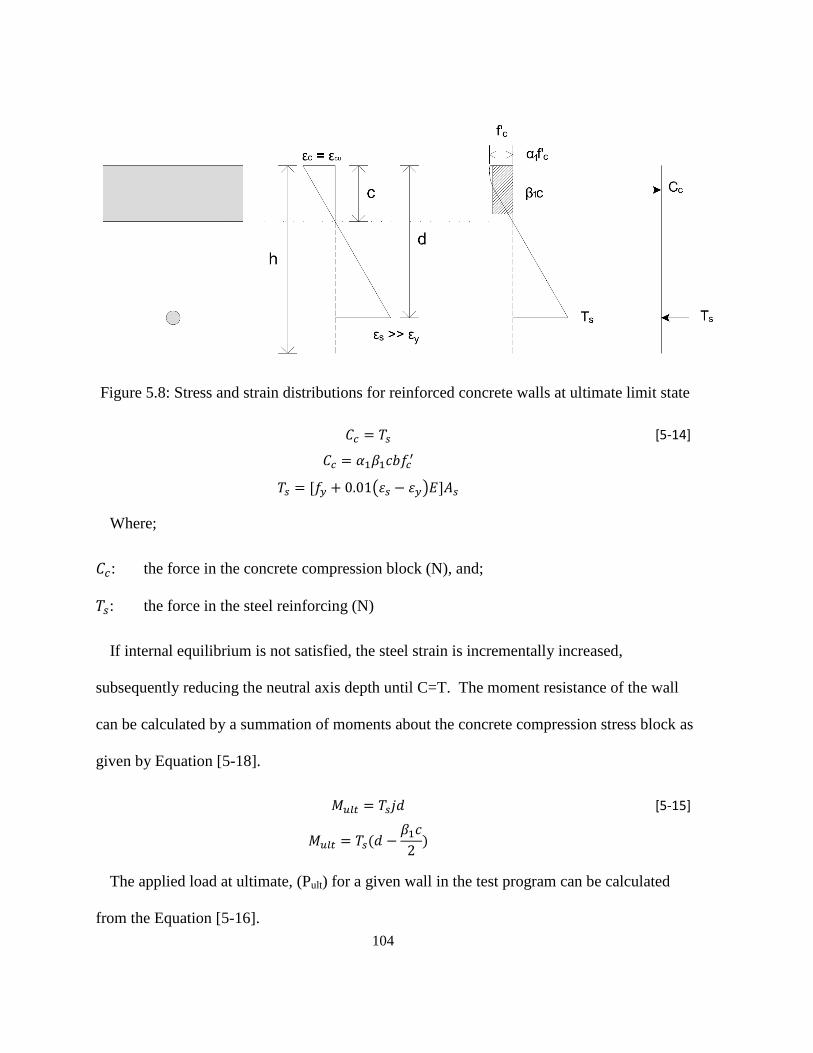
104
Figure 5.8: Stress and strain distributions for reinforced concrete walls at ultimate limit state
[5-14]
( )
Where;
: the force in the concrete compression block (N), and;
: the force in the steel reinforcing (N)
If internal equilibrium is not satisfied, the steel strain is incrementally increased,
subsequently reducing the neutral axis depth until C=T. The moment resistance of the wall
can be calculated by a summation of moments about the concrete compression stress block as
given by Equation [5-18].
[5-15]
The applied load at ultimate, (Pult) for a given wall in the test program can be calculated
from the Equation [5-16].
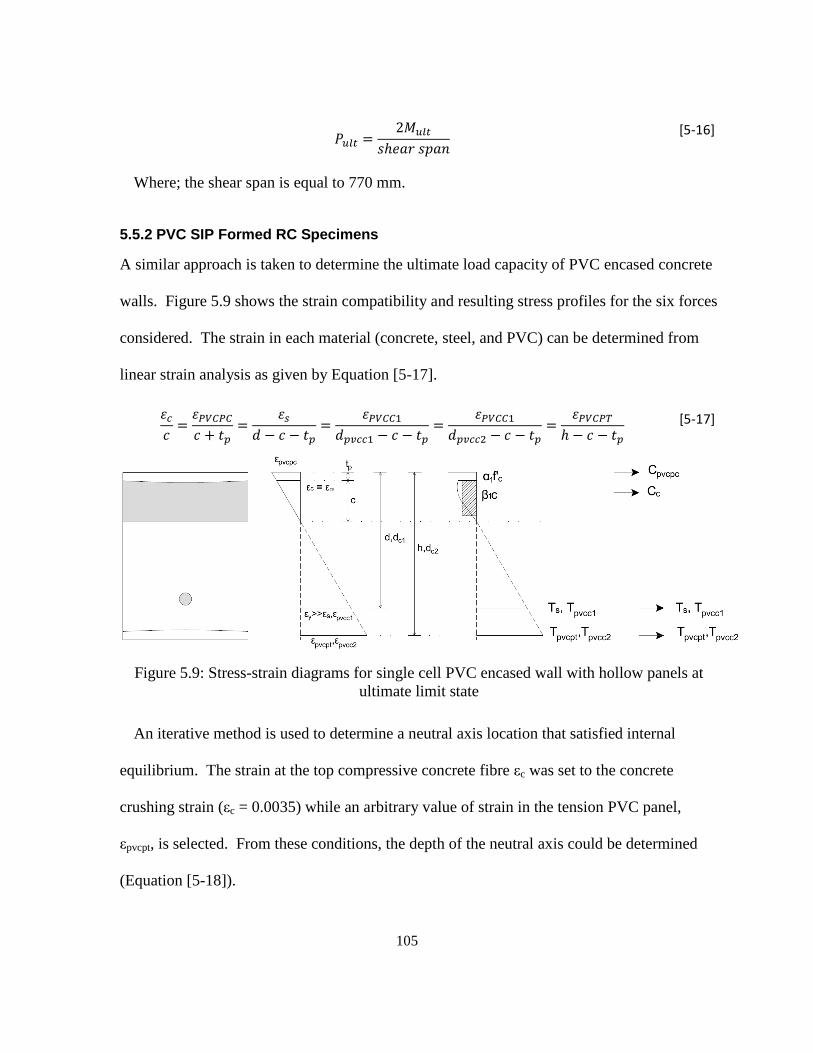
105
[5-16]
Where; the shear span is equal to 770 mm.
5.5.2 PVC SIP Formed RC Specimens
A similar approach is taken to determine the ultimate load capacity of PVC encased concrete
walls. Figure 5.9 shows the strain compatibility and resulting stress profiles for the six forces
considered. The strain in each material (concrete, steel, and PVC) can be determined from
linear strain analysis as given by Equation [5-17].
[5-17]
Figure 5.9: Stress-strain diagrams for single cell PVC encased wall with hollow panels at
ultimate limit state
An iterative method is used to determine a neutral axis location that satisfied internal
equilibrium. The strain at the top compressive concrete fibre εc was set to the concrete
crushing strain (εc = 0.0035) while an arbitrary value of strain in the tension PVC panel,
εpvcpt, is selected. From these conditions, the depth of the neutral axis could be determined
(Equation [5-18]).
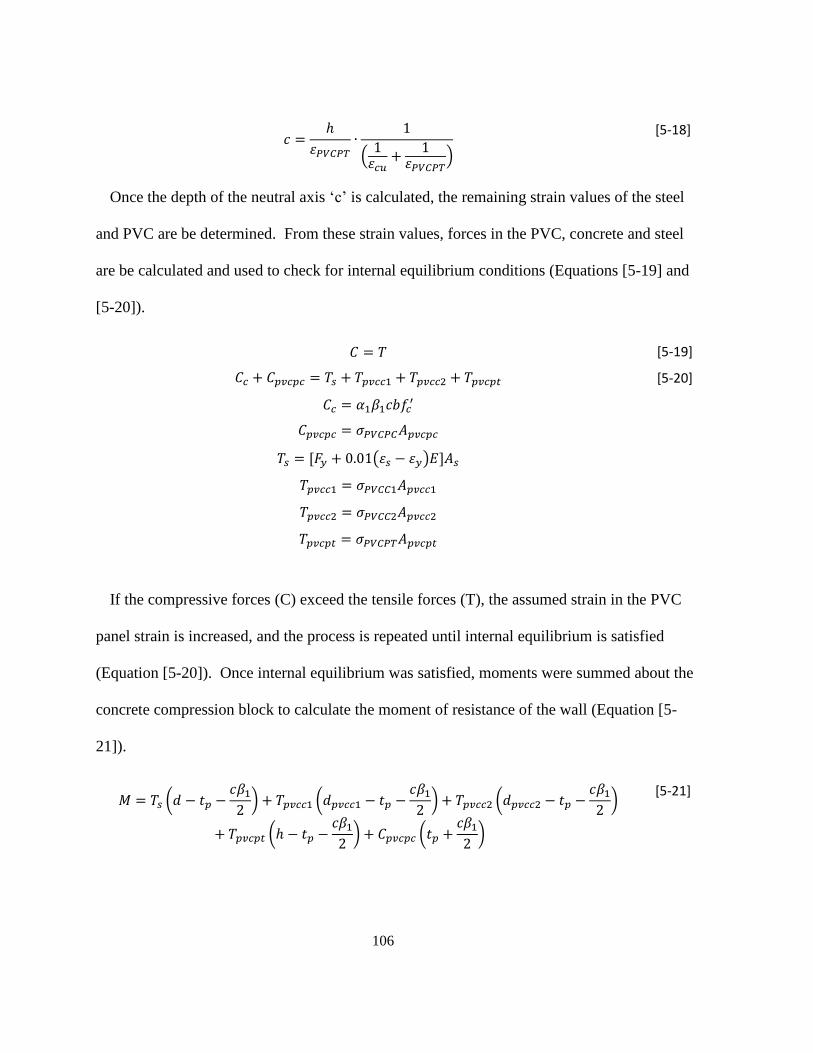
106
(
)
[5-18]
Once the depth of the neutral axis ‘c’ is calculated, the remaining strain values of the steel
and PVC are be determined. From these strain values, forces in the PVC, concrete and steel
are be calculated and used to check for internal equilibrium conditions (Equations [5-19] and
[5-20]).
[5-19]
[5-20]
( )
If the compressive forces (C) exceed the tensile forces (T), the assumed strain in the PVC
panel strain is increased, and the process is repeated until internal equilibrium is satisfied
(Equation [5-20]). Once internal equilibrium was satisfied, moments were summed about the
concrete compression block to calculate the moment of resistance of the wall (Equation [5-
21]).
(
) (
) (
)
(
) (
)
[5-21]
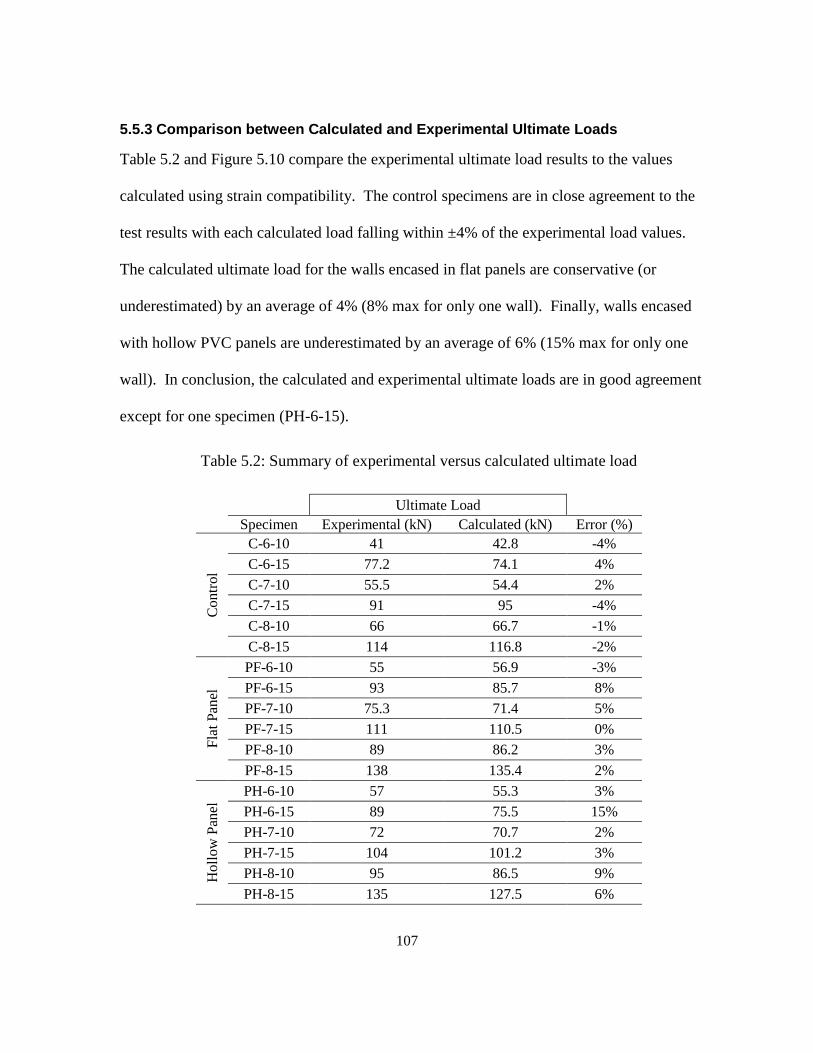
107
5.5.3 Comparison between Calculated and Experimental Ultimate Loads
Table 5.2 and Figure 5.10 compare the experimental ultimate load results to the values
calculated using strain compatibility. The control specimens are in close agreement to the
test results with each calculated load falling within ±4% of the experimental load values.
The calculated ultimate load for the walls encased in flat panels are conservative (or
underestimated) by an average of 4% (8% max for only one wall). Finally, walls encased
with hollow PVC panels are underestimated by an average of 6% (15% max for only one
wall). In conclusion, the calculated and experimental ultimate loads are in good agreement
except for one specimen (PH-6-15).
Table 5.2: Summary of experimental versus calculated ultimate load
Ultimate Load
Specimen Experimental (kN) Calculated (kN) Error (%)
Contr
ol
C-6-10 41 42.8 -4%
C-6-15 77.2 74.1 4%
C-7-10 55.5 54.4 2%
C-7-15 91 95 -4%
C-8-10 66 66.7 -1%
C-8-15 114 116.8 -2%
Fla
t P
anel
PF-6-10 55 56.9 -3%
PF-6-15 93 85.7 8%
PF-7-10 75.3 71.4 5%
PF-7-15 111 110.5 0%
PF-8-10 89 86.2 3%
PF-8-15 138 135.4 2%
Ho
llo
w P
anel
PH-6-10 57 55.3 3%
PH-6-15 89 75.5 15%
PH-7-10 72 70.7 2%
PH-7-15 104 101.2 3%
PH-8-10 95 86.5 9%
PH-8-15 135 127.5 6%
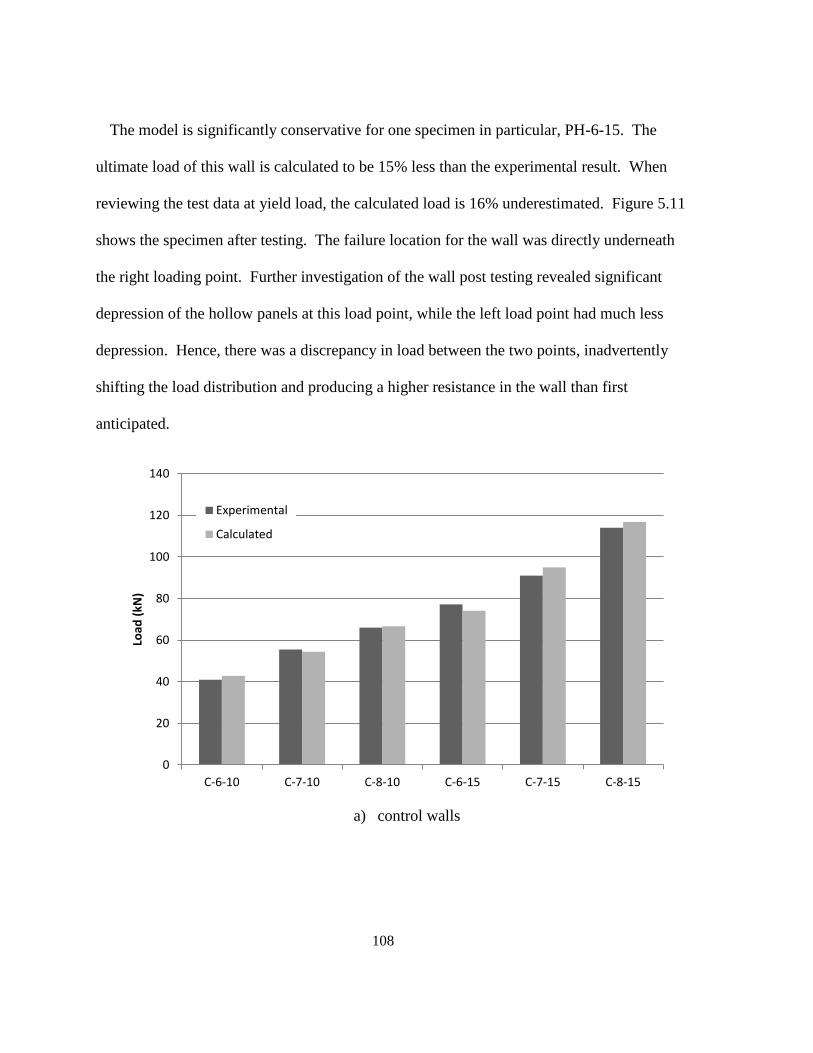
108
The model is significantly conservative for one specimen in particular, PH-6-15. The
ultimate load of this wall is calculated to be 15% less than the experimental result. When
reviewing the test data at yield load, the calculated load is 16% underestimated. Figure 5.11
shows the specimen after testing. The failure location for the wall was directly underneath
the right loading point. Further investigation of the wall post testing revealed significant
depression of the hollow panels at this load point, while the left load point had much less
depression. Hence, there was a discrepancy in load between the two points, inadvertently
shifting the load distribution and producing a higher resistance in the wall than first
anticipated.
a) control walls
0
20
40
60
80
100
120
140
C-6-10 C-7-10 C-8-10 C-6-15 C-7-15 C-8-15
Load
(kN
)
Experimental
Calculated
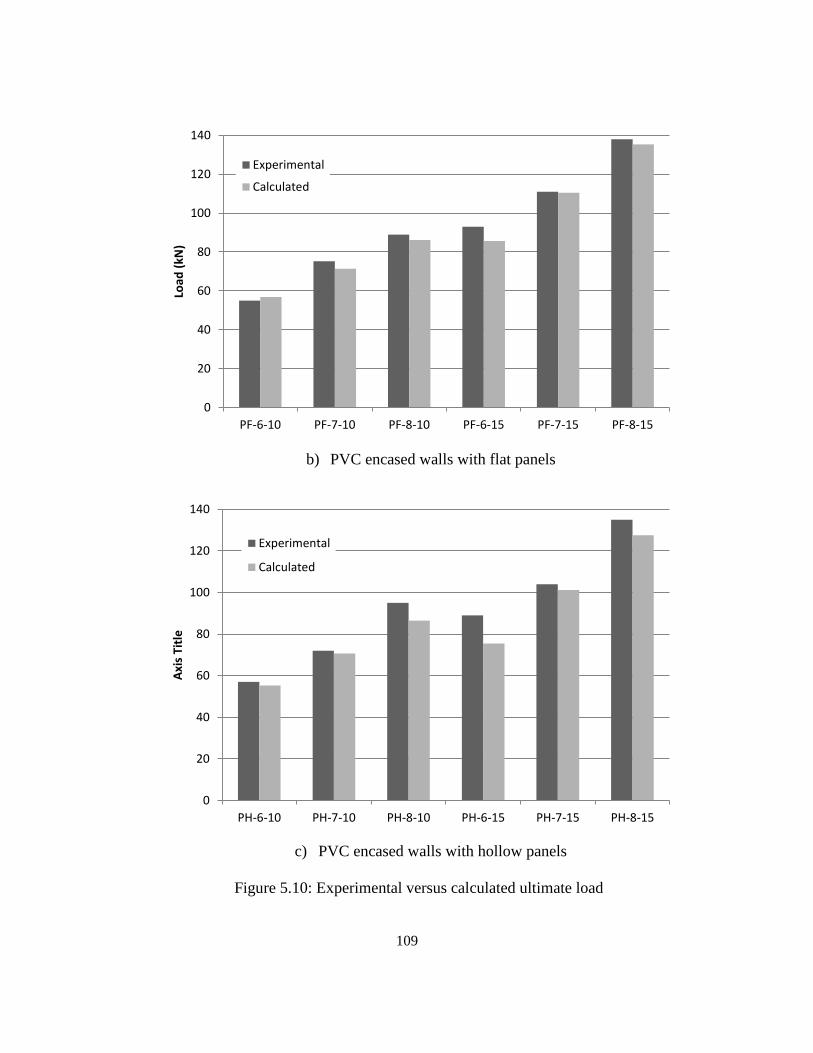
109
b) PVC encased walls with flat panels
c) PVC encased walls with hollow panels
Figure 5.10: Experimental versus calculated ultimate load
0
20
40
60
80
100
120
140
PF-6-10 PF-7-10 PF-8-10 PF-6-15 PF-7-15 PF-8-15
Load
(kN
) Experimental
Calculated
0
20
40
60
80
100
120
140
PH-6-10 PH-7-10 PH-8-10 PH-6-15 PH-7-15 PH-8-15
Axi
s Ti
tle
Experimental
Calculated
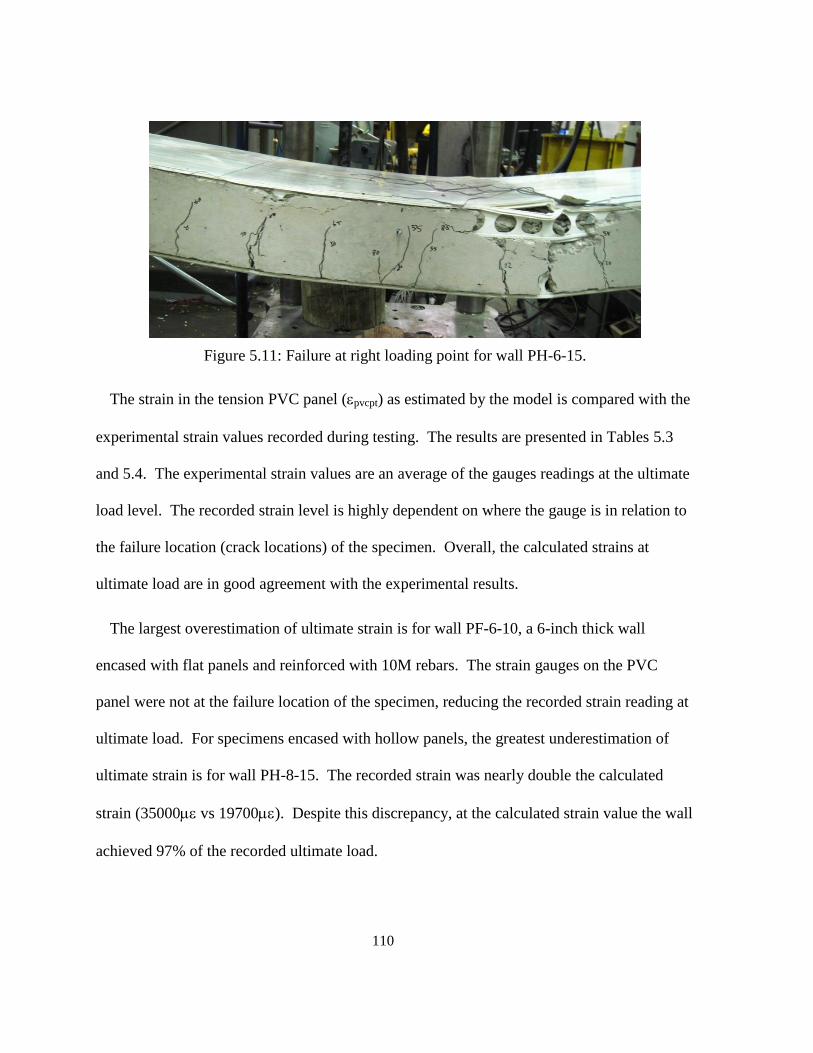
110
Figure 5.11: Failure at right loading point for wall PH-6-15.
The strain in the tension PVC panel (pvcpt) as estimated by the model is compared with the
experimental strain values recorded during testing. The results are presented in Tables 5.3
and 5.4. The experimental strain values are an average of the gauges readings at the ultimate
load level. The recorded strain level is highly dependent on where the gauge is in relation to
the failure location (crack locations) of the specimen. Overall, the calculated strains at
ultimate load are in good agreement with the experimental results.
The largest overestimation of ultimate strain is for wall PF-6-10, a 6-inch thick wall
encased with flat panels and reinforced with 10M rebars. The strain gauges on the PVC
panel were not at the failure location of the specimen, reducing the recorded strain reading at
ultimate load. For specimens encased with hollow panels, the greatest underestimation of
ultimate strain is for wall PH-8-15. The recorded strain was nearly double the calculated
strain (35000 vs 19700). Despite this discrepancy, at the calculated strain value the wall
achieved 97% of the recorded ultimate load.
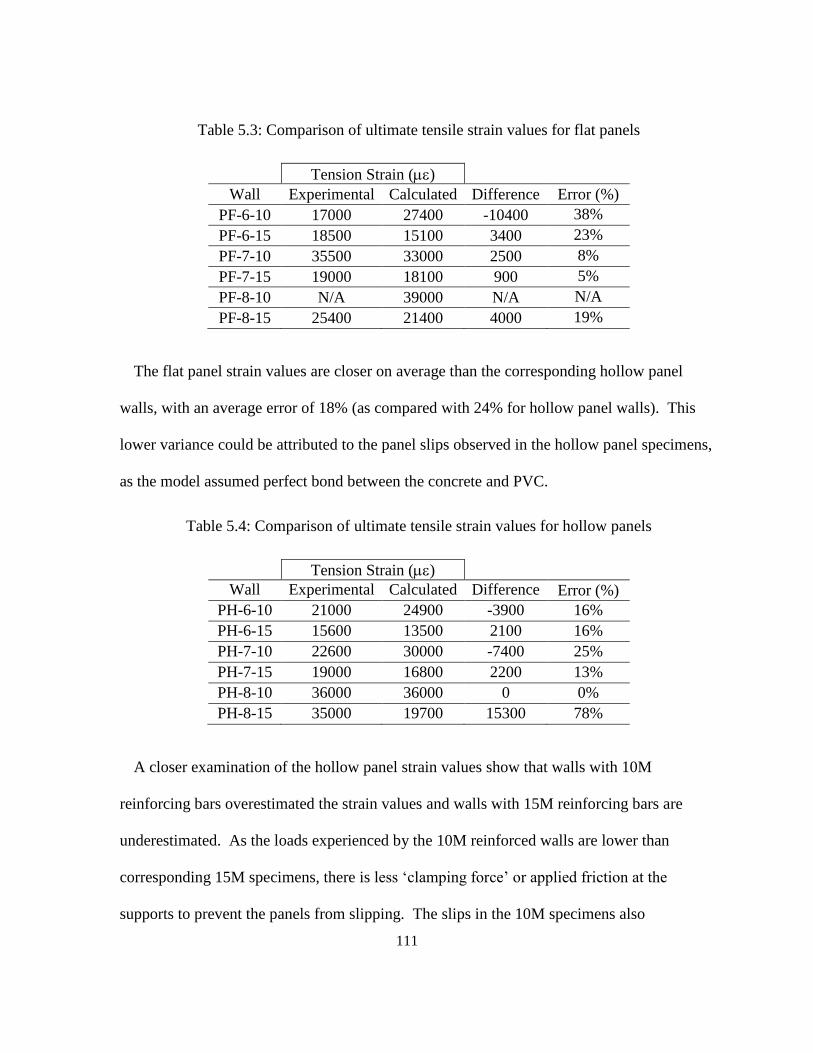
111
Table 5.3: Comparison of ultimate tensile strain values for flat panels
Tension Strain ()
Wall Experimental Calculated Difference Error (%)
PF-6-10 17000 27400 -10400 38%
PF-6-15 18500 15100 3400 23%
PF-7-10 35500 33000 2500 8%
PF-7-15 19000 18100 900 5%
PF-8-10 N/A 39000 N/A N/A
PF-8-15 25400 21400 4000 19%
The flat panel strain values are closer on average than the corresponding hollow panel
walls, with an average error of 18% (as compared with 24% for hollow panel walls). This
lower variance could be attributed to the panel slips observed in the hollow panel specimens,
as the model assumed perfect bond between the concrete and PVC.
Table 5.4: Comparison of ultimate tensile strain values for hollow panels
Tension Strain ()
Wall Experimental Calculated Difference Error (%)
PH-6-10 21000 24900 -3900 16%
PH-6-15 15600 13500 2100 16%
PH-7-10 22600 30000 -7400 25%
PH-7-15 19000 16800 2200 13%
PH-8-10 36000 36000 0 0%
PH-8-15 35000 19700 15300 78%
A closer examination of the hollow panel strain values show that walls with 10M
reinforcing bars overestimated the strain values and walls with 15M reinforcing bars are
underestimated. As the loads experienced by the 10M reinforced walls are lower than
corresponding 15M specimens, there is less ‘clamping force’ or applied friction at the
supports to prevent the panels from slipping. The slips in the 10M specimens also
112
contributed to the experimental strains at ultimate being lower than the corresponding
calculated ultimate strains, where a perfect composite bond was assumed.
In addition, the estimated and calculated strain values tend to be higher in walls with less
steel reinforcing, exceeding 20000 in each case. This value of strain corresponds to the
maximum stress in the PVC, increasing the likelihood for slips to occur. This stress within
the panel would have the highest possibility of exceeding the frictional resistance between
the concrete and PVC, as well as the clamping force at the supports. Conversely, walls with
hollow panels reinforced with 15M bars showed experimental strain values higher than the
calculated values. These conservative estimates (with the exception of wall PH-8-15) are
within 16% of the experimental strains. The calculated strain values were also less than
20000, showing the material had not reached a stress level promoting slip. Finally, due to
higher loads experienced by these walls, the clamping force at the supports increased,
reducing the severity and extent of panel slip.
The model was also used to calculate the wall curvature at the ultimate load level. This
curvature was determined using the following equation [5-22]
[5-22]
Where ult is the ultimate curvature in mm-1
, cu is the crushing strain of concrete, and c is
the depth of the neutral axis. The experimental curvatures were calculated using the strain
data at ultimate load. Table 5.5 presents a comparison between the experimental and
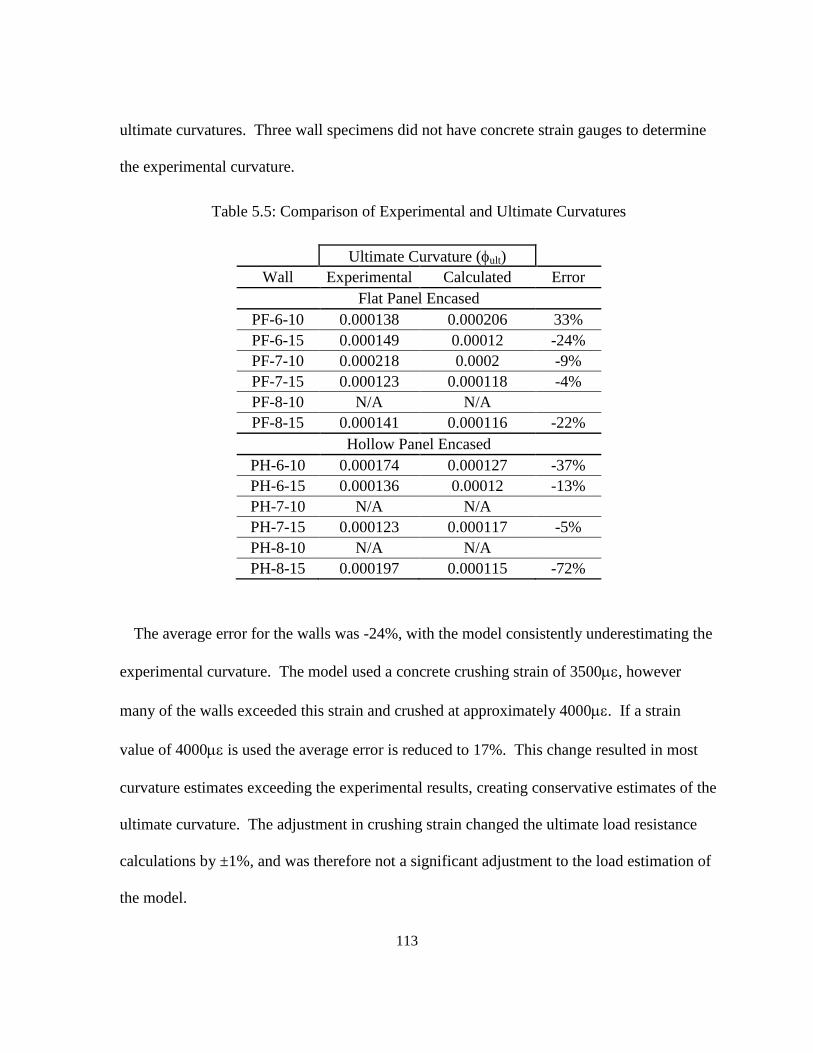
113
ultimate curvatures. Three wall specimens did not have concrete strain gauges to determine
the experimental curvature.
Table 5.5: Comparison of Experimental and Ultimate Curvatures
Ultimate Curvature ( ult)
Wall Experimental Calculated Error
Flat Panel Encased
PF-6-10 0.000138 0.000206 33%
PF-6-15 0.000149 0.00012 -24%
PF-7-10 0.000218 0.0002 -9%
PF-7-15 0.000123 0.000118 -4%
PF-8-10 N/A N/A
PF-8-15 0.000141 0.000116 -22%
Hollow Panel Encased
PH-6-10 0.000174 0.000127 -37%
PH-6-15 0.000136 0.00012 -13%
PH-7-10 N/A N/A
PH-7-15 0.000123 0.000117 -5%
PH-8-10 N/A N/A
PH-8-15 0.000197 0.000115 -72%
The average error for the walls was -24%, with the model consistently underestimating the
experimental curvature. The model used a concrete crushing strain of 3500, however
many of the walls exceeded this strain and crushed at approximately 4000. If a strain
value of 4000 is used the average error is reduced to 17%. This change resulted in most
curvature estimates exceeding the experimental results, creating conservative estimates of the
ultimate curvature. The adjustment in crushing strain changed the ultimate load resistance
calculations by ±1%, and was therefore not a significant adjustment to the load estimation of
the model.
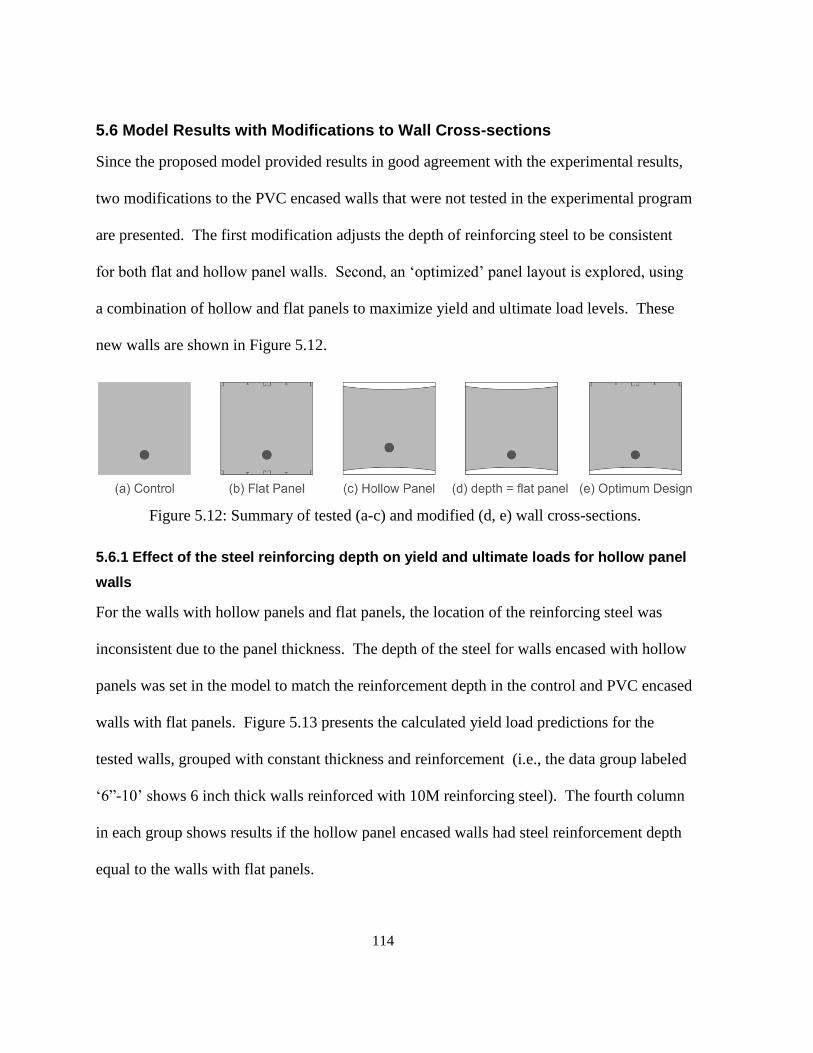
114
5.6 Model Results with Modifications to Wall Cross-sections
Since the proposed model provided results in good agreement with the experimental results,
two modifications to the PVC encased walls that were not tested in the experimental program
are presented. The first modification adjusts the depth of reinforcing steel to be consistent
for both flat and hollow panel walls. Second, an ‘optimized’ panel layout is explored, using
a combination of hollow and flat panels to maximize yield and ultimate load levels. These
new walls are shown in Figure 5.12.
Figure 5.12: Summary of tested (a-c) and modified (d, e) wall cross-sections.
5.6.1 Effect of the steel reinforcing depth on yield and ultimate loads for hollow panel
walls
For the walls with hollow panels and flat panels, the location of the reinforcing steel was
inconsistent due to the panel thickness. The depth of the steel for walls encased with hollow
panels was set in the model to match the reinforcement depth in the control and PVC encased
walls with flat panels. Figure 5.13 presents the calculated yield load predictions for the
tested walls, grouped with constant thickness and reinforcement (i.e., the data group labeled
‘6”-10’ shows 6 inch thick walls reinforced with 10M reinforcing steel). The fourth column
in each group shows results if the hollow panel encased walls had steel reinforcement depth
equal to the walls with flat panels.
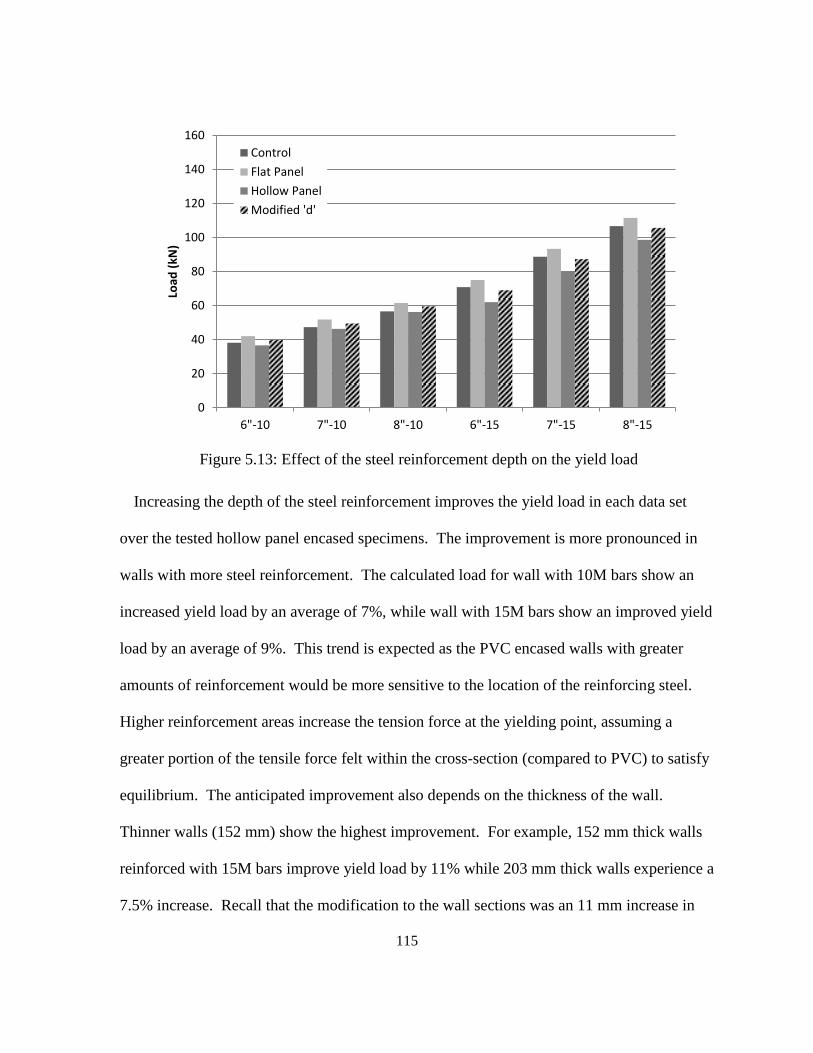
115
Figure 5.13: Effect of the steel reinforcement depth on the yield load
Increasing the depth of the steel reinforcement improves the yield load in each data set
over the tested hollow panel encased specimens. The improvement is more pronounced in
walls with more steel reinforcement. The calculated load for wall with 10M bars show an
increased yield load by an average of 7%, while wall with 15M bars show an improved yield
load by an average of 9%. This trend is expected as the PVC encased walls with greater
amounts of reinforcement would be more sensitive to the location of the reinforcing steel.
Higher reinforcement areas increase the tension force at the yielding point, assuming a
greater portion of the tensile force felt within the cross-section (compared to PVC) to satisfy
equilibrium. The anticipated improvement also depends on the thickness of the wall.
Thinner walls (152 mm) show the highest improvement. For example, 152 mm thick walls
reinforced with 15M bars improve yield load by 11% while 203 mm thick walls experience a
7.5% increase. Recall that the modification to the wall sections was an 11 mm increase in
0
20
40
60
80
100
120
140
160
6"-10 7"-10 8"-10 6"-15 7"-15 8"-15
Load
(kN
)
Control
Flat Panel
Hollow Panel
Modified 'd'
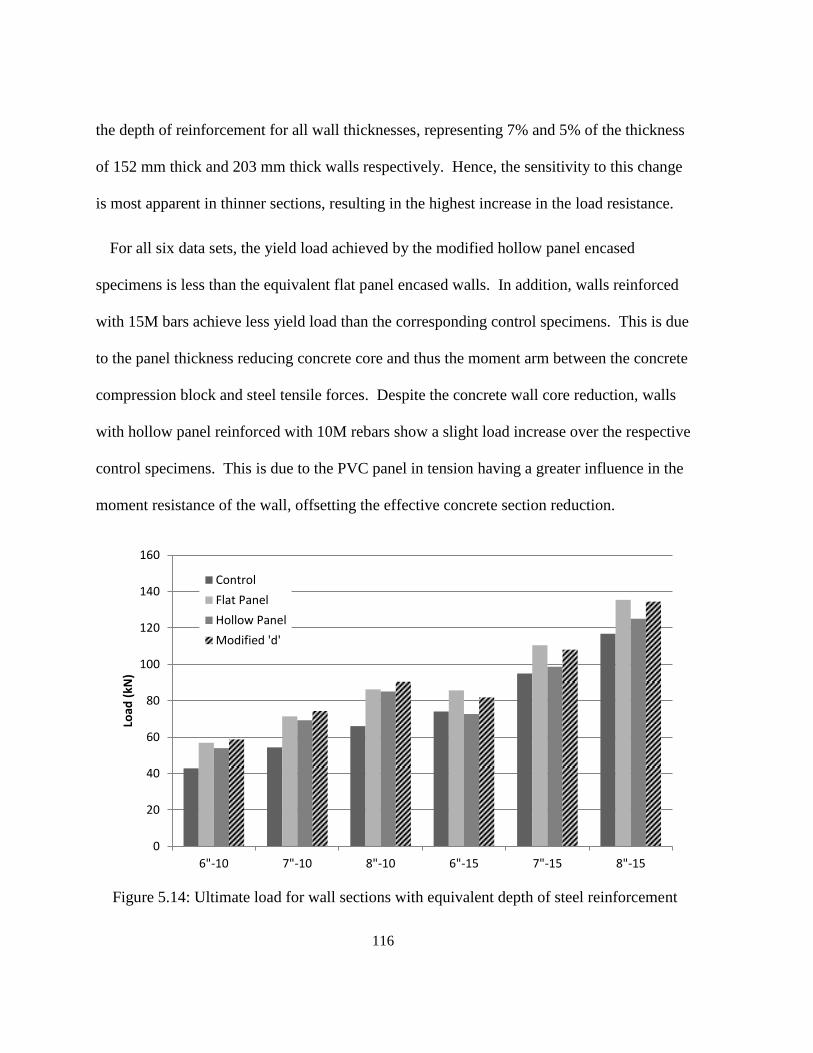
116
the depth of reinforcement for all wall thicknesses, representing 7% and 5% of the thickness
of 152 mm thick and 203 mm thick walls respectively. Hence, the sensitivity to this change
is most apparent in thinner sections, resulting in the highest increase in the load resistance.
For all six data sets, the yield load achieved by the modified hollow panel encased
specimens is less than the equivalent flat panel encased walls. In addition, walls reinforced
with 15M bars achieve less yield load than the corresponding control specimens. This is due
to the panel thickness reducing concrete core and thus the moment arm between the concrete
compression block and steel tensile forces. Despite the concrete wall core reduction, walls
with hollow panel reinforced with 10M rebars show a slight load increase over the respective
control specimens. This is due to the PVC panel in tension having a greater influence in the
moment resistance of the wall, offsetting the effective concrete section reduction.
Figure 5.14: Ultimate load for wall sections with equivalent depth of steel reinforcement
0
20
40
60
80
100
120
140
160
6"-10 7"-10 8"-10 6"-15 7"-15 8"-15
Load
(kN
)
Control
Flat Panel
Hollow Panel
Modified 'd'
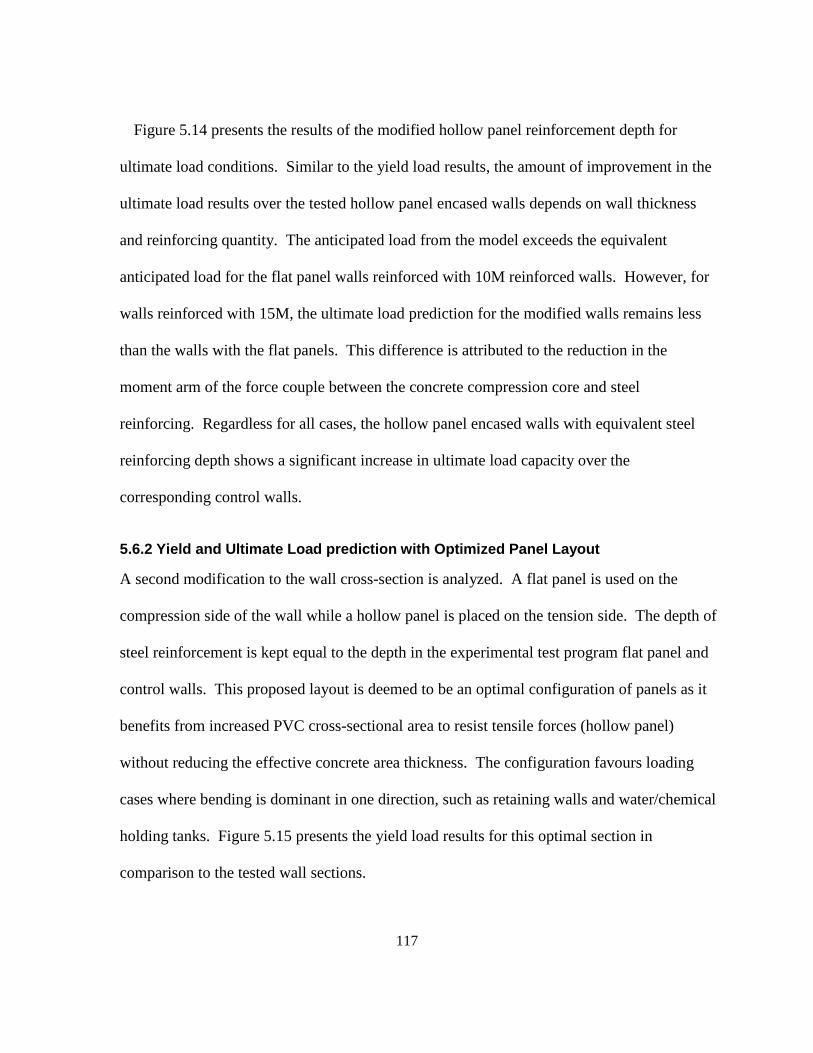
117
Figure 5.14 presents the results of the modified hollow panel reinforcement depth for
ultimate load conditions. Similar to the yield load results, the amount of improvement in the
ultimate load results over the tested hollow panel encased walls depends on wall thickness
and reinforcing quantity. The anticipated load from the model exceeds the equivalent
anticipated load for the flat panel walls reinforced with 10M reinforced walls. However, for
walls reinforced with 15M, the ultimate load prediction for the modified walls remains less
than the walls with the flat panels. This difference is attributed to the reduction in the
moment arm of the force couple between the concrete compression core and steel
reinforcing. Regardless for all cases, the hollow panel encased walls with equivalent steel
reinforcing depth shows a significant increase in ultimate load capacity over the
corresponding control walls.
5.6.2 Yield and Ultimate Load prediction with Optimized Panel Layout
A second modification to the wall cross-section is analyzed. A flat panel is used on the
compression side of the wall while a hollow panel is placed on the tension side. The depth of
steel reinforcement is kept equal to the depth in the experimental test program flat panel and
control walls. This proposed layout is deemed to be an optimal configuration of panels as it
benefits from increased PVC cross-sectional area to resist tensile forces (hollow panel)
without reducing the effective concrete area thickness. The configuration favours loading
cases where bending is dominant in one direction, such as retaining walls and water/chemical
holding tanks. Figure 5.15 presents the yield load results for this optimal section in
comparison to the tested wall sections.
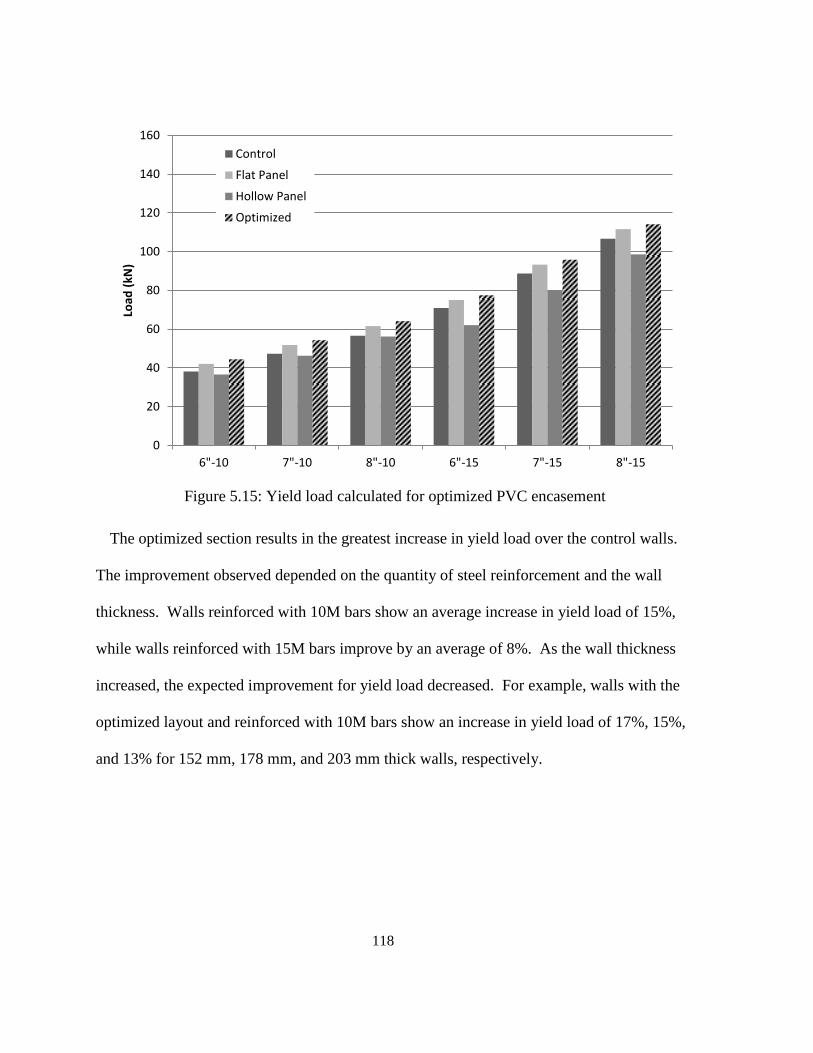
118
Figure 5.15: Yield load calculated for optimized PVC encasement
The optimized section results in the greatest increase in yield load over the control walls.
The improvement observed depended on the quantity of steel reinforcement and the wall
thickness. Walls reinforced with 10M bars show an average increase in yield load of 15%,
while walls reinforced with 15M bars improve by an average of 8%. As the wall thickness
increased, the expected improvement for yield load decreased. For example, walls with the
optimized layout and reinforced with 10M bars show an increase in yield load of 17%, 15%,
and 13% for 152 mm, 178 mm, and 203 mm thick walls, respectively.
0
20
40
60
80
100
120
140
160
6"-10 7"-10 8"-10 6"-15 7"-15 8"-15
Load
(kN
)
Control
Flat Panel
Hollow Panel
Optimized
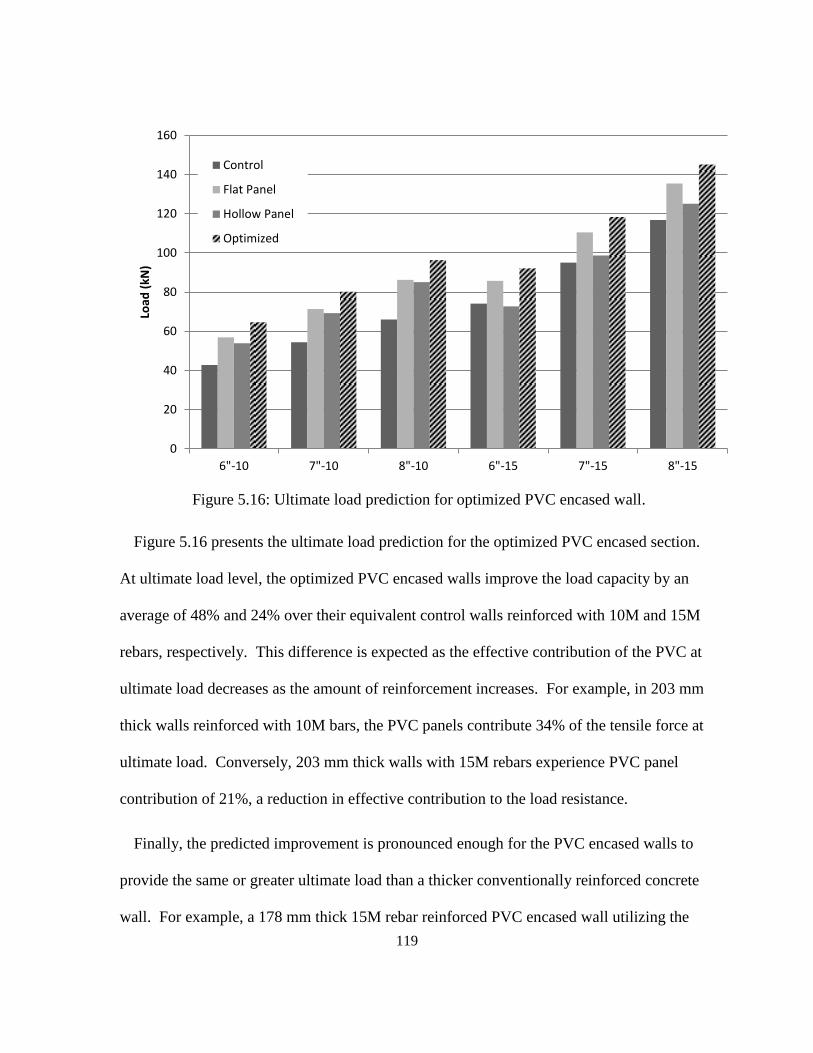
119
Figure 5.16: Ultimate load prediction for optimized PVC encased wall.
Figure 5.16 presents the ultimate load prediction for the optimized PVC encased section.
At ultimate load level, the optimized PVC encased walls improve the load capacity by an
average of 48% and 24% over their equivalent control walls reinforced with 10M and 15M
rebars, respectively. This difference is expected as the effective contribution of the PVC at
ultimate load decreases as the amount of reinforcement increases. For example, in 203 mm
thick walls reinforced with 10M bars, the PVC panels contribute 34% of the tensile force at
ultimate load. Conversely, 203 mm thick walls with 15M rebars experience PVC panel
contribution of 21%, a reduction in effective contribution to the load resistance.
Finally, the predicted improvement is pronounced enough for the PVC encased walls to
provide the same or greater ultimate load than a thicker conventionally reinforced concrete
wall. For example, a 178 mm thick 15M rebar reinforced PVC encased wall utilizing the
0
20
40
60
80
100
120
140
160
6"-10 7"-10 8"-10 6"-15 7"-15 8"-15
Load
(kN
)
Control
Flat Panel
Hollow Panel
Optimized
120
proposed panel layout resulted in an ultimate load of 118 kN, while a 203 mm thick concrete
wall without encasement resists a load of 116 kN.
5.7 Summary of Analytical Model Development
An analytical model was developed to estimate the yield and ultimate load level for PVC
encased reinforced concrete walls. The following findings are concluded from the model
results.
Yield Load
Elastic analysis is used to estimate the yield load resistance. The results from the
model are found to be in good agreement with the test results, with an average error of
8% for the control walls and 5% for the encased walls.
Ultimate Load
Linear strain compatibility is used to estimate the ultimate load resistance. The results
from the model are in good agreement with the experimental data. The average error
for the control specimens is 3%. The flat panel encased walls have an average error of
3%, while the hollow panel encased walls have an average error of 6%.
Modified Cross-sections
With the model producing estimates in close agreement with the experimental results,
the model is used to estimate the results for two more cross-section types; hollow panel
encased walls with steel reinforcement depth equal to the test program depth, and a
wall cross-section that utilized flat panels on the compression side and hollow panels
on the tension side. The hollow panel cross-section with equivalent steel depth
121
improve the yield and ultimate loads by an average of 8% over the tested hollow panel
wall. The later combination of panels results in the largest predicted increase in both
yield and ultimate load levels. The average yield load improvement is 15% and 8% for
10M and 15M walls, while ultimate load improvement is 48% and 24% respectively.
In comparing the relative improvements in load of the PVC encased walls over the
control walls, the effect is most apparent at the ultimate load level. The contribution of
the PVC when steel is yielding is minimal as the strain levels observed and calculated
reflect PVC stresses that are approximately 25% of the ultimate tensile stress.
Conversely, at the ultimate condition, the PVC stress level is close to or at maximum,
providing a much more significant portion of the cross sections resistance.
122
Chapter 6: Conclusions and Recommendations
6.1 Experimental Work
Experimental and analytical studies were conducted on the behaviour of reinforced concrete
walls that were encased in PVC stay-in-place formwork. Eighteen reinforced concrete walls
were cast and tested in four-point bending. Three test variables were examined; the type of
PVC panel (flat or hollow), amount of steel reinforcing (3-10M or 3-15M bars), and wall
thickness (152 mm, 178 mm, or 203mm). The following conclusions can be made from the
experimental results.
The mode of failure observed was different for each type of specimen. Control
walls failed due to steel yielding followed by concrete crushing. For wall
specimens encased in flat panel PVC and reinforced with 10M bars, the failure
mode was through steel yielding, followed by concrete crushing, PVC buckling and
finally PVC rupture. Flat panel encased walls reinforced with 15M bars
experienced failure through steel yielding, followed by concrete crushing and PVC
buckling. For walls encased in hollow panels, all specimens failed by steel
yielding, followed by concrete crushing and PVC buckling.
Unlike the modes of failure reported in the literature, PVC panel slip was observed
during the testing of hollow panel encased walls. The majority of these slips
occurred when the recorded strain values in the panels were approaching the strain
at maximum stress, approximately 25000.
123
PVC encasement improved the load capacity of the reinforced concrete walls. For
flat panel encased walls, the average improvement at yield and ultimate loads were
21% and 27% respectively. Hollow panel encased walls recorded average yield
and ultimate load improvements of 8% and 27% respectively. Therefore, the flat
panel encased walls showed better over improvement to load resistance. This is
due to the shallow location of the steel reinforcement in the hollow panel encased
walls, reducing the effective improvement given from the panels. The observed
improvement was more significant at ultimate load conditions due to the higher
stresses in the tension PVC panels contributing to the load resistance.
The amount of load carrying improvement was found to be a function of the
reinforcing ratio and wall thickness. The effect of the PVC encasement lessened as
the reinforcing ratio or wall thickness increased. Lightly reinforced, thin walls had
the highest improvement. As the reinforcing ratio increased, the strains in the
tension side of the walls at failure were significantly lowered. As the PVC does not
achieve maximum stress until high strains are reached, the contribution of the
panels to resisting the applied loads is lessened. In addition, increasing the amount
of steel reinforcement reduces the relative contribution of the PVC to the cross-
section.
A comparison was made between walls with the SIP PVC system and walls that
were conventionally constructed and 25mm (1”) thicker. The yield and peak loads
were very similar in this comparison, suggesting the potential for using the SIP
124
system as a means to reduce the wall thickness and achieve the same structural
performance.
PVC encasement improved the ductility at ultimate load level and the toughness of
the reinforced concrete walls. Flat panel encased walls improved ductility by an
average of 71% and toughness by 122%. Hollow panel encased walls improved
ductility by an average of 29% and toughness by 70%. Flat panel encased walls
were determined to be better at improving ductility and toughness, as composite
behaviour was achieved, while the hollow panels did not behave as a pure
composite.
There was no statistic difference observed in the concrete strength of PVC encased
walls and traditionally formed concrete.
6.2 Analytical Work
In addition to the experimental testing, an analytical program was developed to estimate
the yield and ultimate loads of PVC encased reinforced concrete walls. The model followed
linear strain compatibility to estimate the internal forces of the wall elements. The following
conclusions were made from the results of the model.
Calculated yield loads were in good agreement with the experimental data, with an
average error of 8% for the control walls and 5% for the PVC encased walls.
Calculated ultimate (peak) loads showed good correlation with the experimental data.
The average error for the control, flat panel and hollow panel encased walls were 3%,
3% and 6% respectively.
125
Calculated and experimental PVC tensile strain values were in good correlation at
ultimate load conditions. The average error for PVC tensile strain prediction was
21%.
With the proposed model providing results in good agreement with the test data, other
PVC encased wall cross-sections were explored. An optimized panel layout was
proposed that utilized flat panels on the compression side of the wall and hollow
panels on the tension side. This configuration of panels resulted in the greatest
estimated improvement over the control walls at both yield and ultimate load levels.
6.3 Recommendations and Proposed Future Work
The following topics are proposed for further investigation in light of the work completed in
this study.
A new cross-section layout was examined using the model developed in this
research. It is recommended that walls be cast and tested using this configuration
of PVC encasement in order to confirm the predicted load resistance behaviour.
This configuration is of particular interest in situations where one-way bending
would dominate, such as retaining walls and holding tanks.
The analytical model developed by this research assumed perfect bond between the
concrete and PVC hollow panel. Slips were observed during testing of the hollow
panel encased walls, suggesting that only partial bond exists. Frictional and bond
tests between the PVC panels and concrete should be investigated.
126
In order to assure bond and full composite action is achieved between the hollow
panel PVC and concrete, the use of a gritting material should be considered. For
instance, 152 mm (6”) thick walls encased in sand coated hollow panels should be
tested to determine if the slip will occur or not.
The nubs present on the interior face of the flat panels appeared to be sufficient in
providing this composite behaviour. These nubs could be potentially be
incorporated into the hollow panels as well.
127
References
ACI 440.R1-06. (2006). Guide for the Design and Construction of Structural Concrete
Reinforced with FRP Bars. ACI 440.1R-06.
Bank, L. C., & Oliva, M. G. (2007). Pultruded FRP Plank as Formwork and Reinforcement
for Concrete Members. Advances in Structural Engineering, 525-535.
Cement Association of Canada. (2006). Concrete Design Handbook. Ottawa.
Chahrour, A. H., Soudki, K. A., & Straube, J. (2005). RBS polymer encased concrete wall
part I: experimental and theoretical provisions for flexure and shear. Construction and
Building Materials, 550-563.
Collins, M. P., & Mitchell, D. (1997). Prestressed Concrete Structures. Toronto: Response
Publications.
Dieter, D. A., & Dietsche, J. S. (2006). Concrete Bridge Decks Constructed with Fiber-
Reinforced Polymer Stay-in-Place Forms and Grid Reinforcing. Transportation
Research Record, 219-226.
Fam, A. Z., & Rizkalla, S. H. (2002). Flexural Behavior of Concrete-Filled Fibe-Reinforced
Polymer Circular Tubes. Journal of Composites for Construction, 123-132.
Fam, A., & Nelson, M. (2014). Full bridge testing at scale constructed with novel FRP stay-
in-place structural forms for concrete deck. Construction and Building Materials,
368-376.
Gia, X., & Darby, A. (2013). Experimental investigation into a ductile FRP stay-in-place
formwork system for concrete slabs. Construction and Building Materials, 1013-
1023.
Kuder, K. G., Gupta, R., Harris-Jones, C., Hawksworth, R., Hendersonq, S., & Whitney, J.
(2009). Effect of PVC Stay-In-Place Formwork on Mechanical Performance of
Concrete. Journal of Materials in Civil Engineering, 307-315.
McClelland, R. (2007). Permanent formwork for composite bridge decks. Concrete, 10-11.
Mohamed, H. M., & Masmoudi, R. (2012). Effect of Test Parameters on Flexural strength of
Circular fiber-reinforced polymer-confined concrete beams. Journal of Reinforced
Plastics and Composites, 897-914.
128
Ritchie, P. A., Thomas, D. A., Lu, L.-W., & Connelly, G. M. (1991). External Reinforcement
of Concrete Beams Using Fiber Reinforced Plastics. ACI Structral Journal, 490-500.
Rteil, A. A., Soudki, K. A., & Richardson, D. J. (2008). Flexural behavior of octaform
forming system. ACI Special Publication, 130-144.
Soudki, K., El-Salakawy, E., & Craig, B. (2007). Behavior of CFRP Strengthened
Reinforced Concrete Beams in Corrosive Environment. Journal of Composites for
Construction, 291-298.
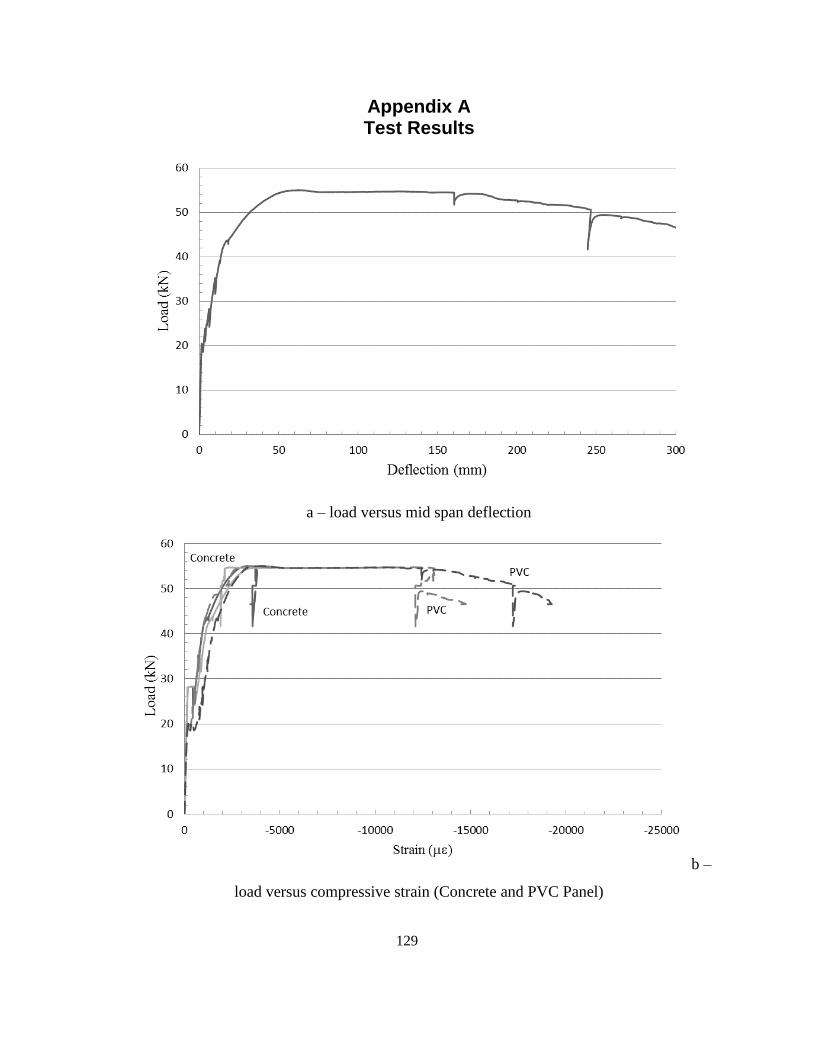
129
Appendix A Test Results
a – load versus mid span deflection
b –
load versus compressive strain (Concrete and PVC Panel)
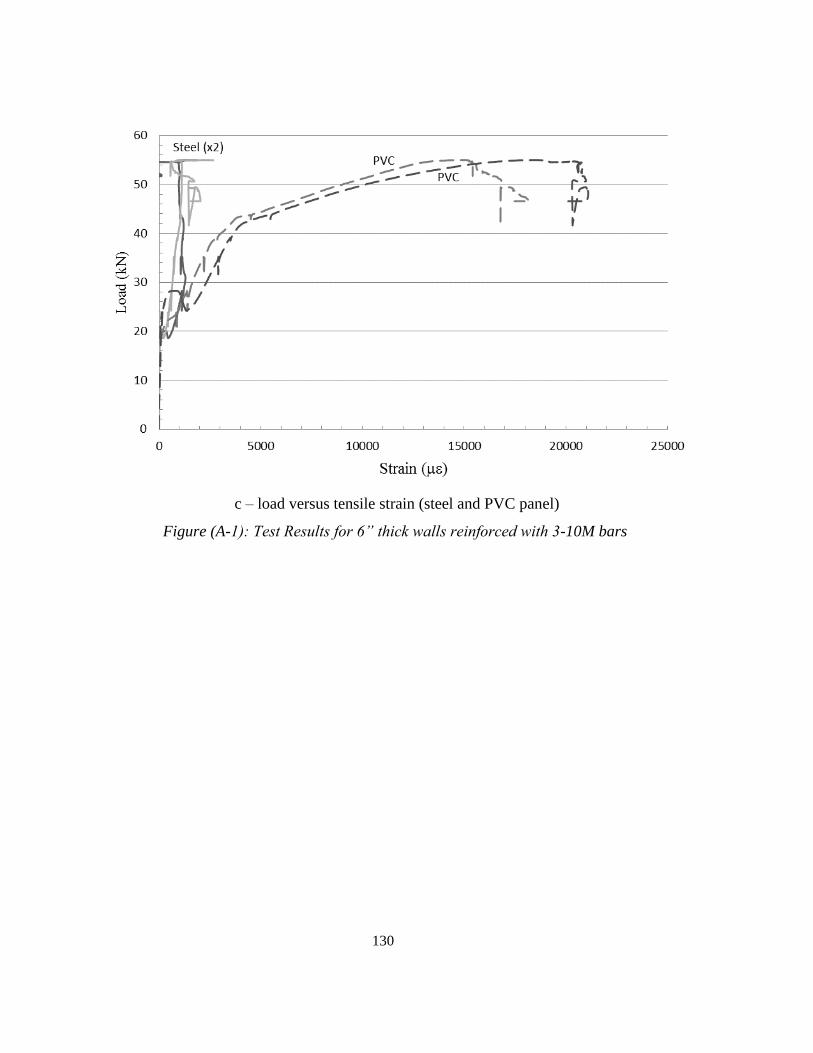
130
c – load versus tensile strain (steel and PVC panel)
Figure (A-1): Test Results for 6” thick walls reinforced with 3-10M bars
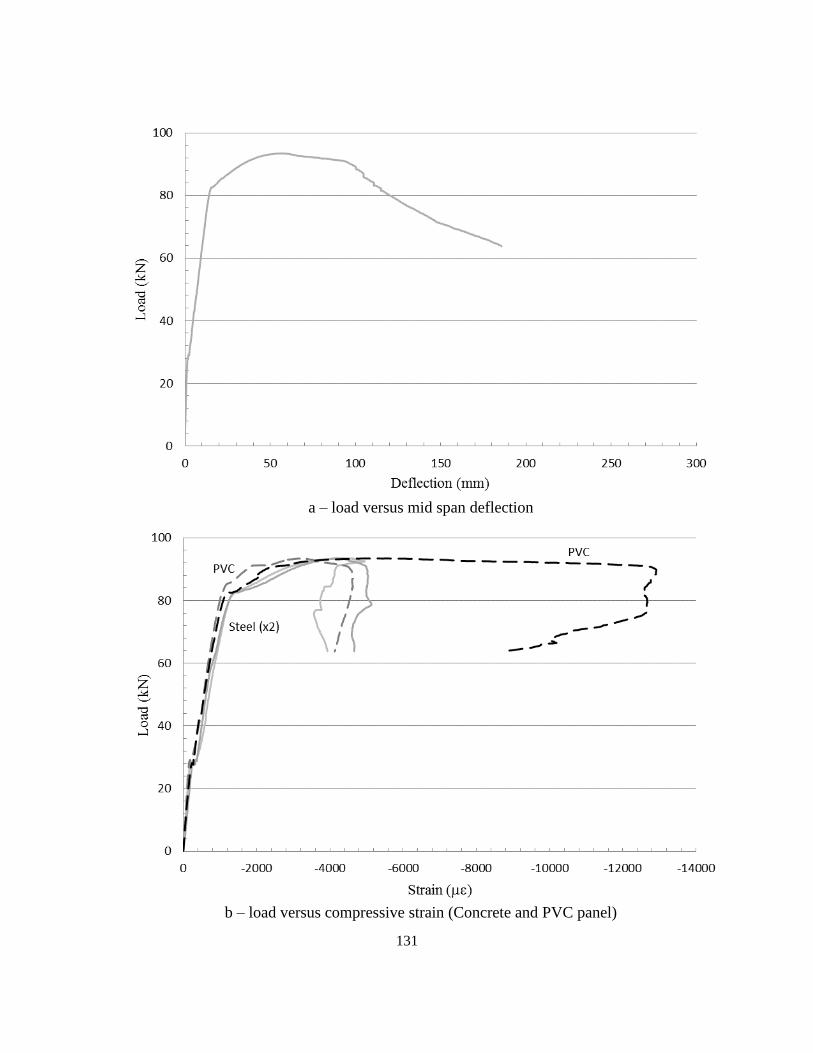
131
a – load versus mid span deflection
b – load versus compressive strain (Concrete and PVC panel)
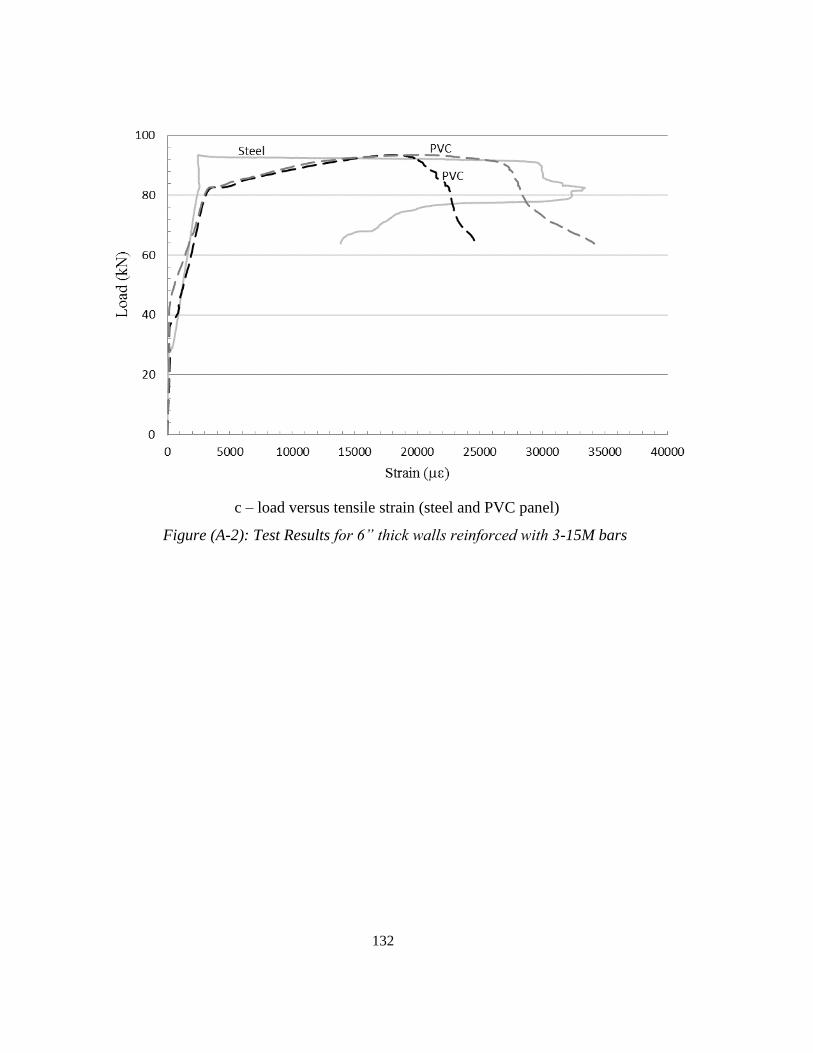
132
c – load versus tensile strain (steel and PVC panel)
Figure (A-2): Test Results for 6” thick walls reinforced with 3-15M bars
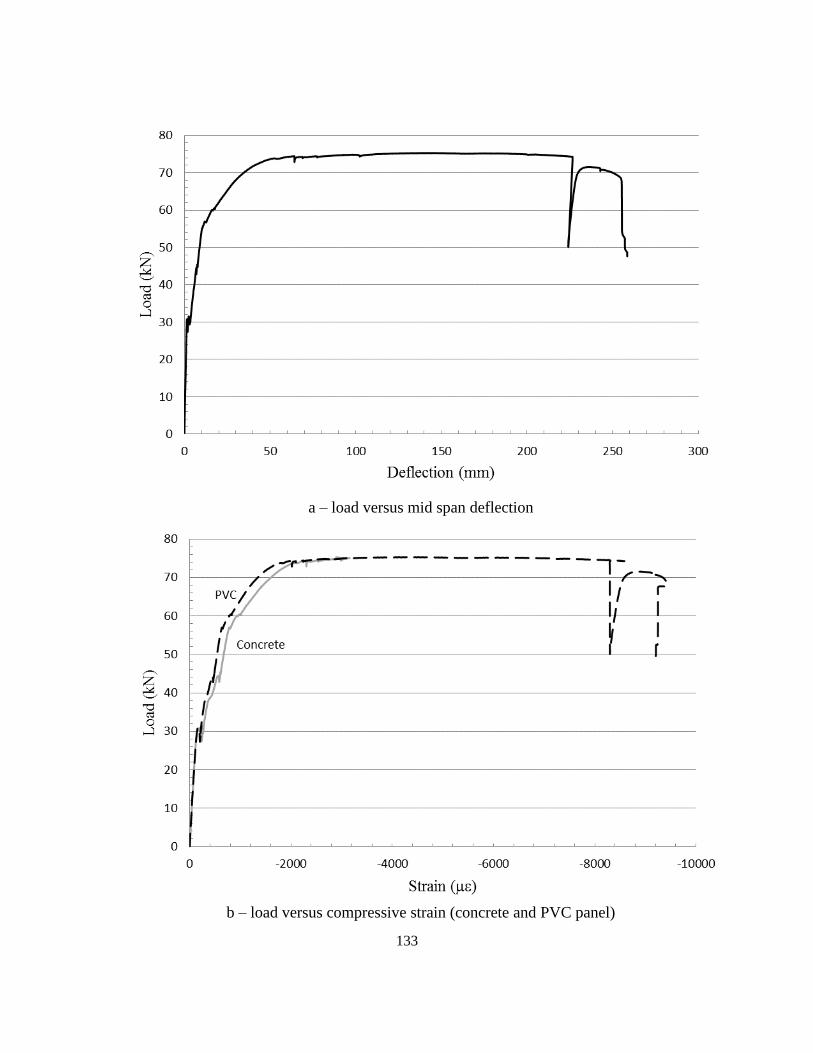
133
a – load versus mid span deflection
b – load versus compressive strain (concrete and PVC panel)
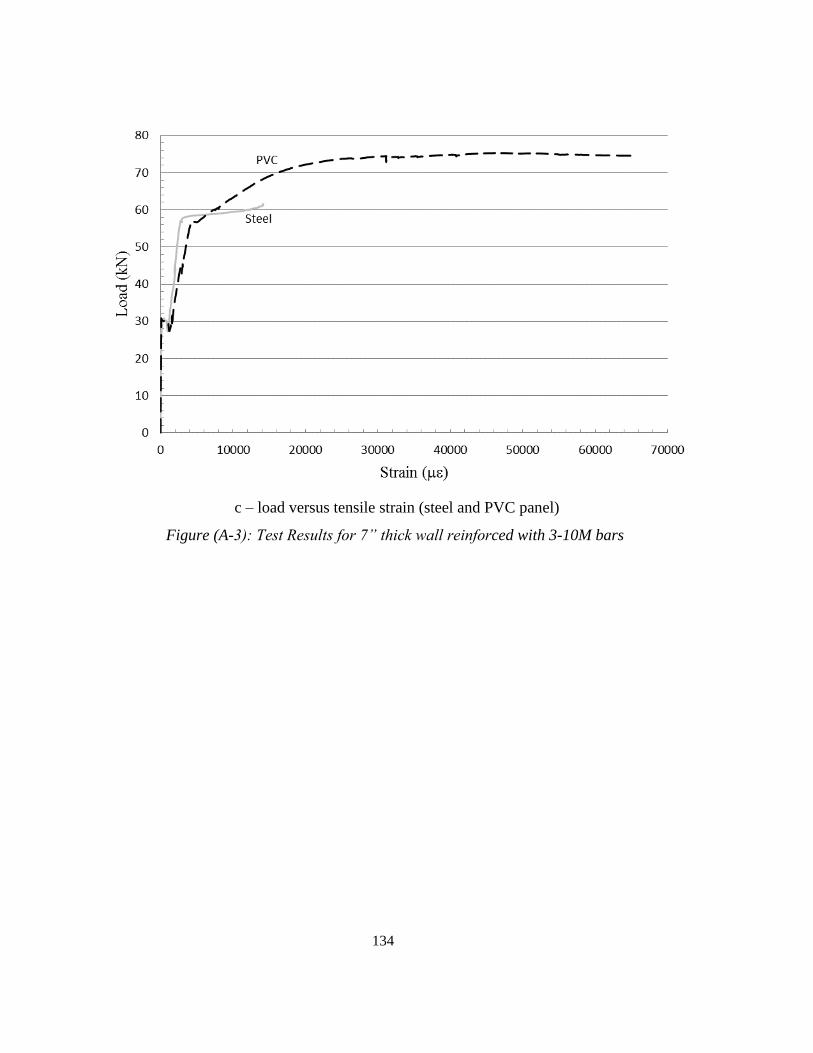
134
c – load versus tensile strain (steel and PVC panel)
Figure (A-3): Test Results for 7” thick wall reinforced with 3-10M bars
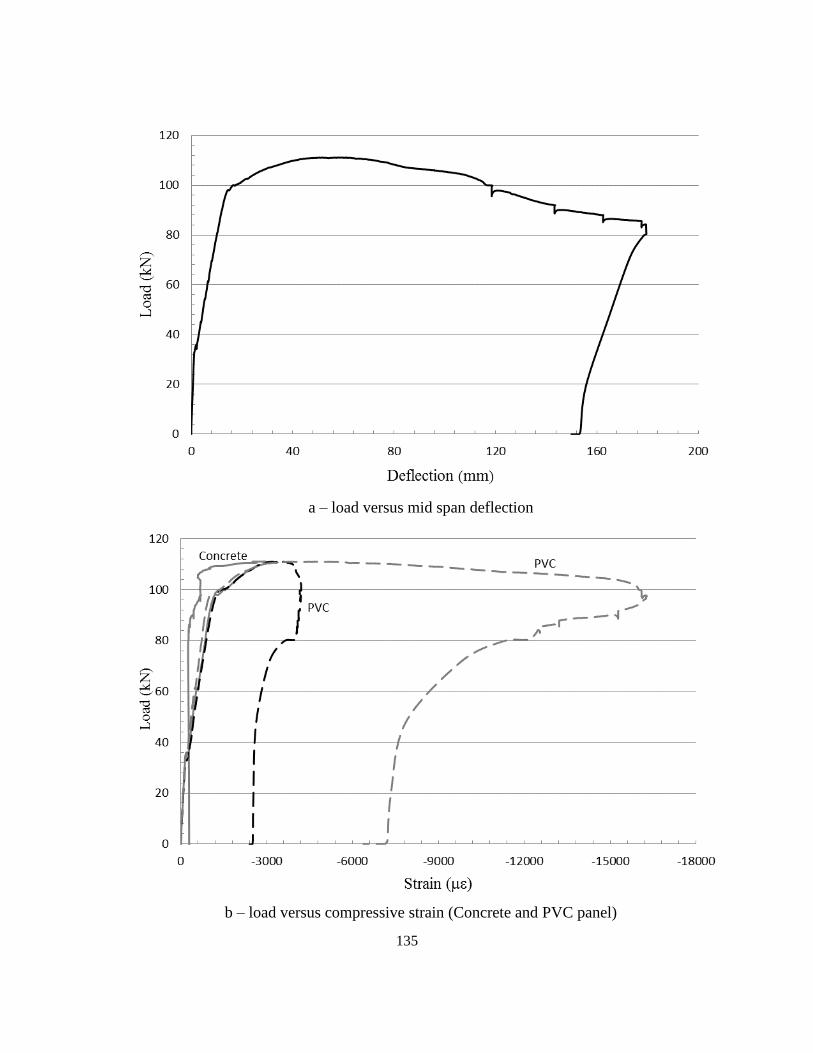
135
a – load versus mid span deflection
b – load versus compressive strain (Concrete and PVC panel)
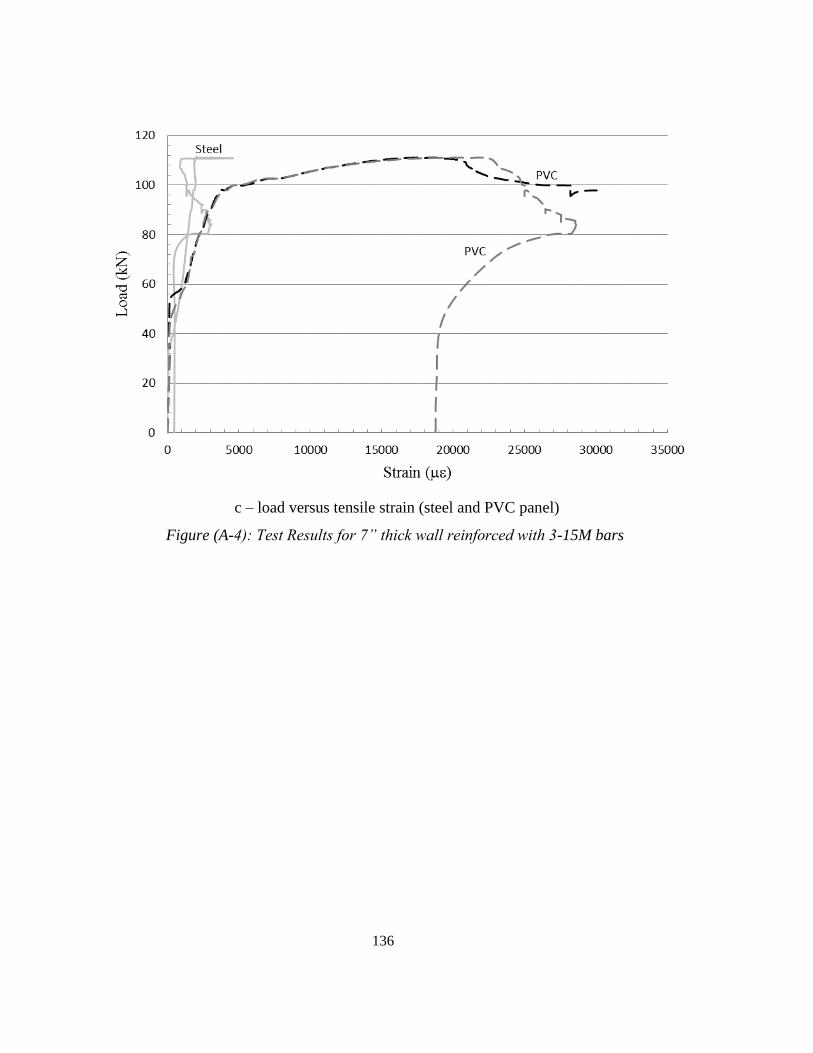
136
c – load versus tensile strain (steel and PVC panel)
Figure (A-4): Test Results for 7” thick wall reinforced with 3-15M bars
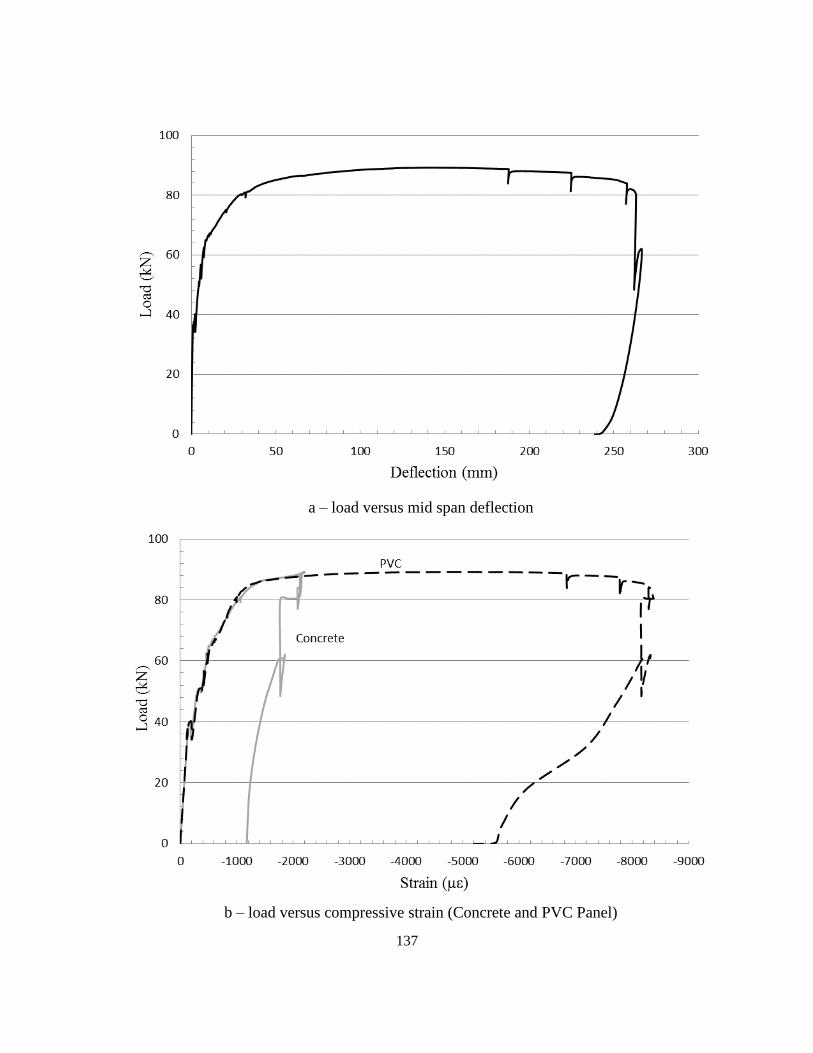
137
a – load versus mid span deflection
b – load versus compressive strain (Concrete and PVC Panel)
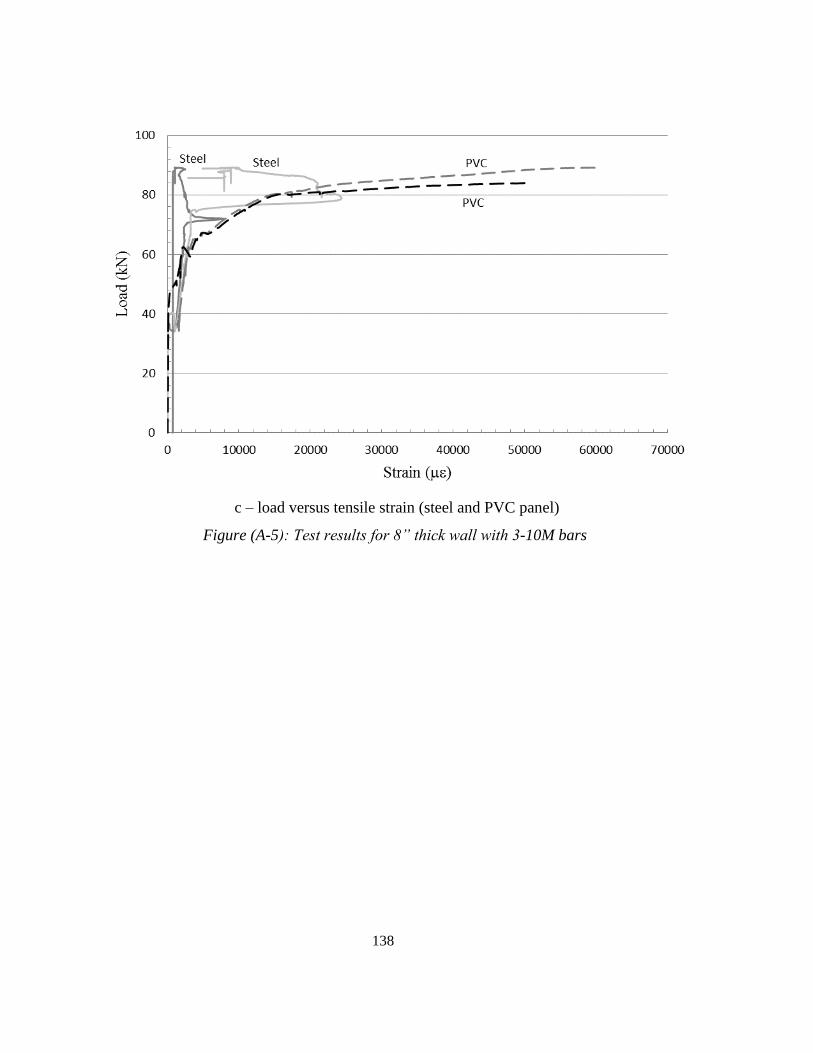
138
c – load versus tensile strain (steel and PVC panel)
Figure (A-5): Test results for 8” thick wall with 3-10M bars
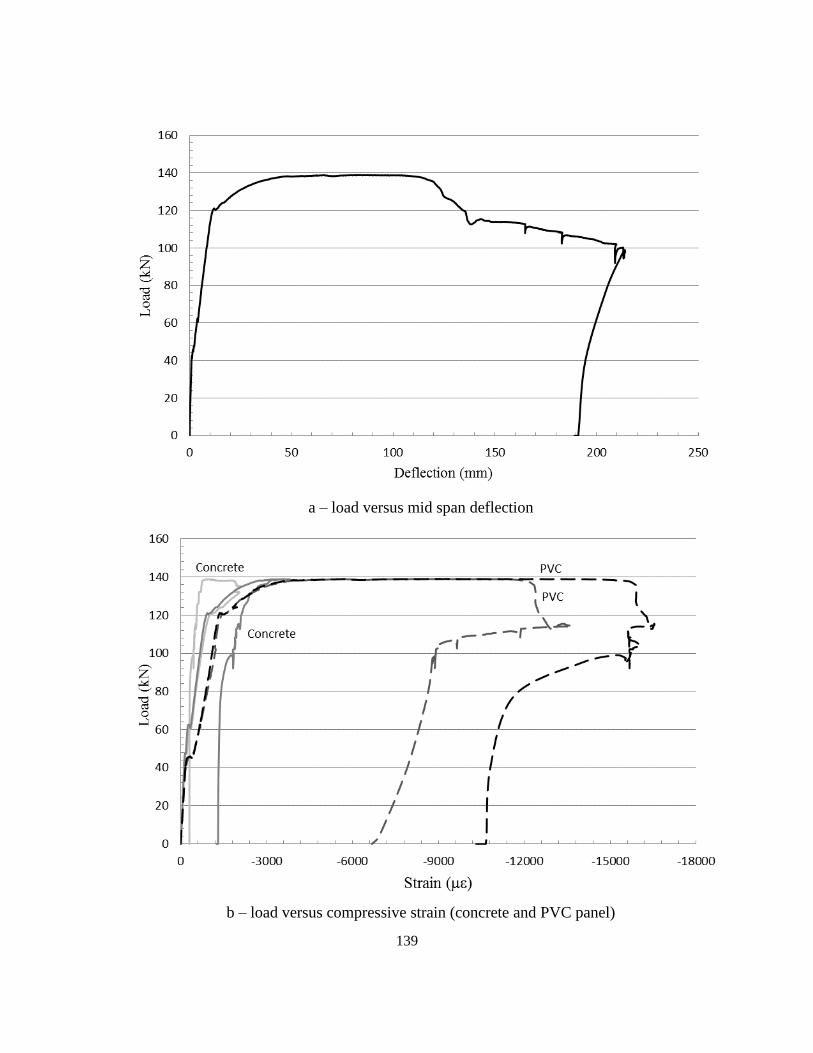
139
a – load versus mid span deflection
b – load versus compressive strain (concrete and PVC panel)
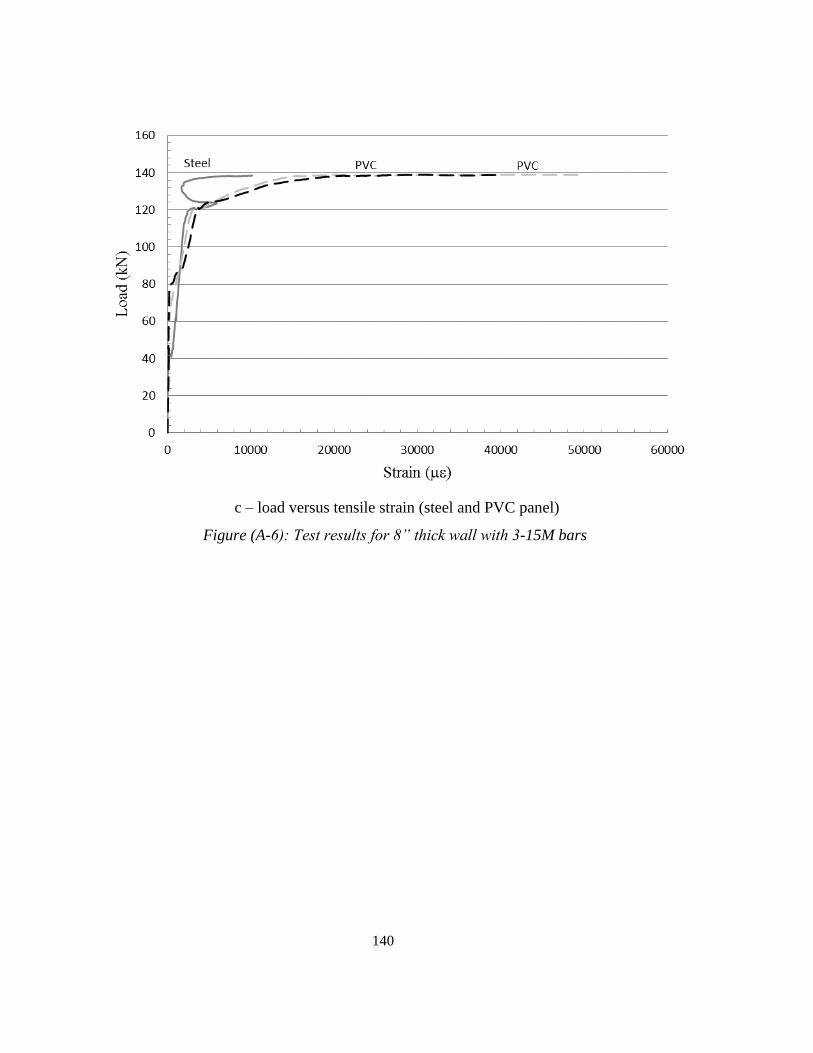
140
c – load versus tensile strain (steel and PVC panel)
Figure (A-6): Test results for 8” thick wall with 3-15M bars
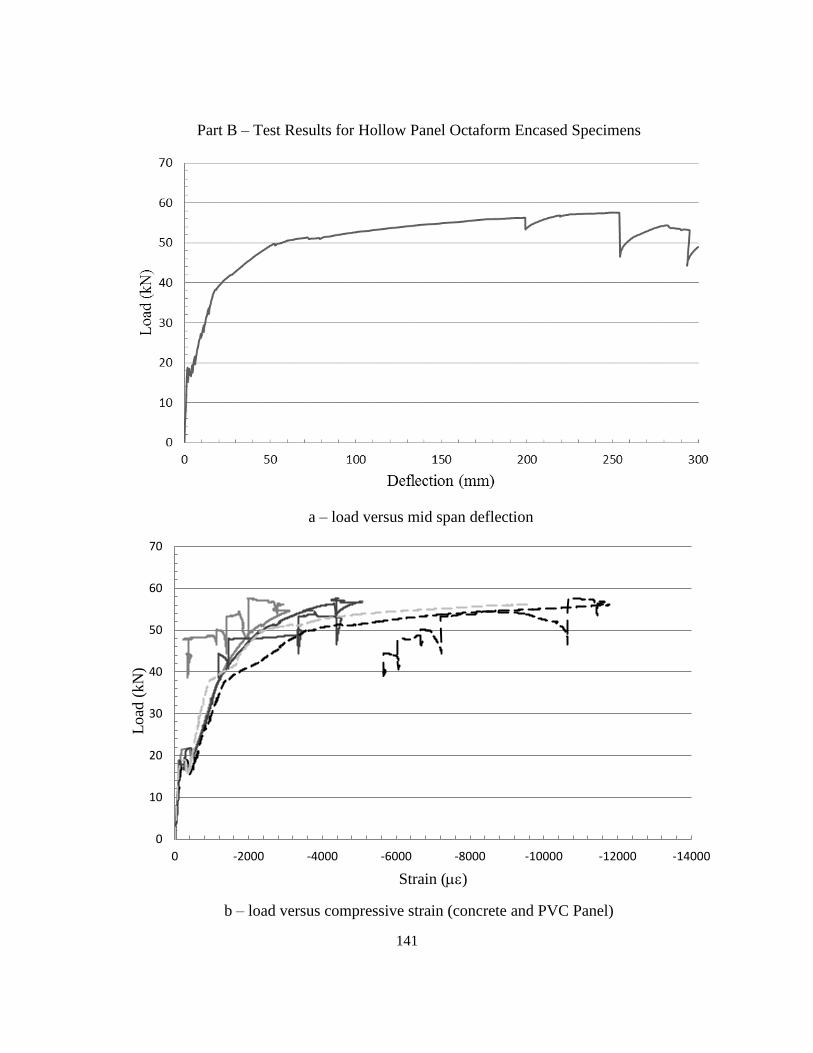
141
Part B – Test Results for Hollow Panel Octaform Encased Specimens
a – load versus mid span deflection
b – load versus compressive strain (concrete and PVC Panel)
0
10
20
30
40
50
60
70
-14000-12000-10000-8000-6000-4000-20000
Load
(kN
)
Strain ()
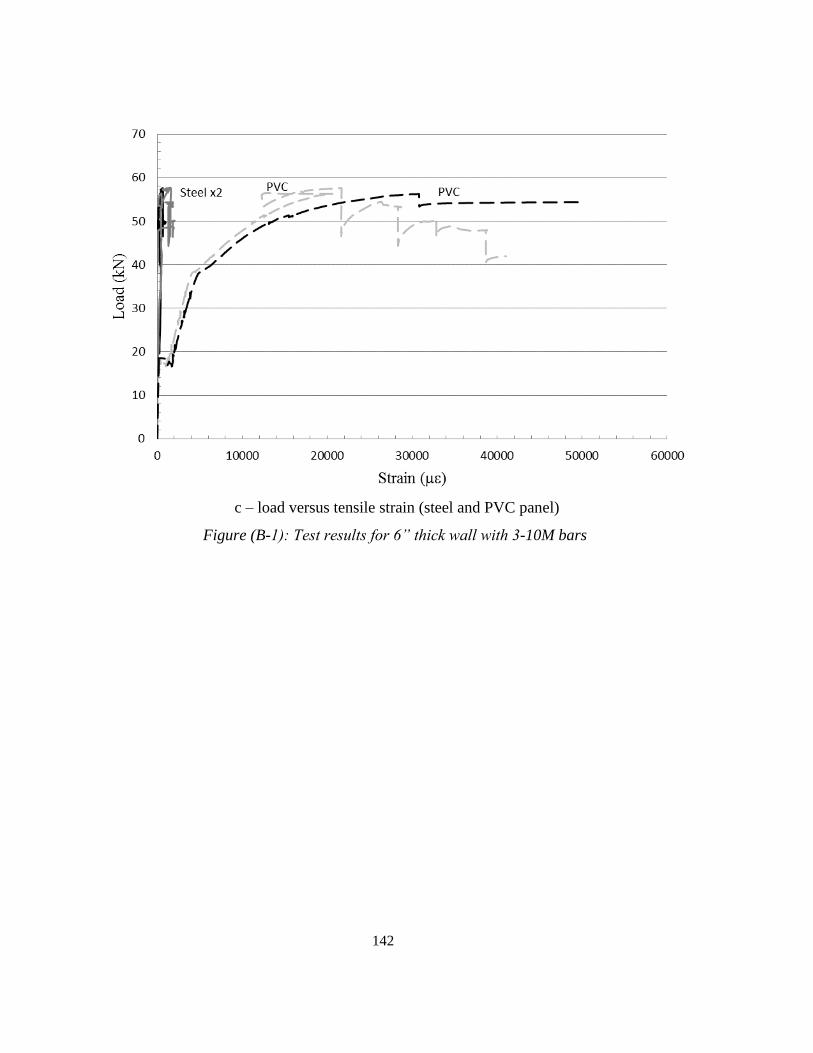
142
c – load versus tensile strain (steel and PVC panel)
Figure (B-1): Test results for 6” thick wall with 3-10M bars
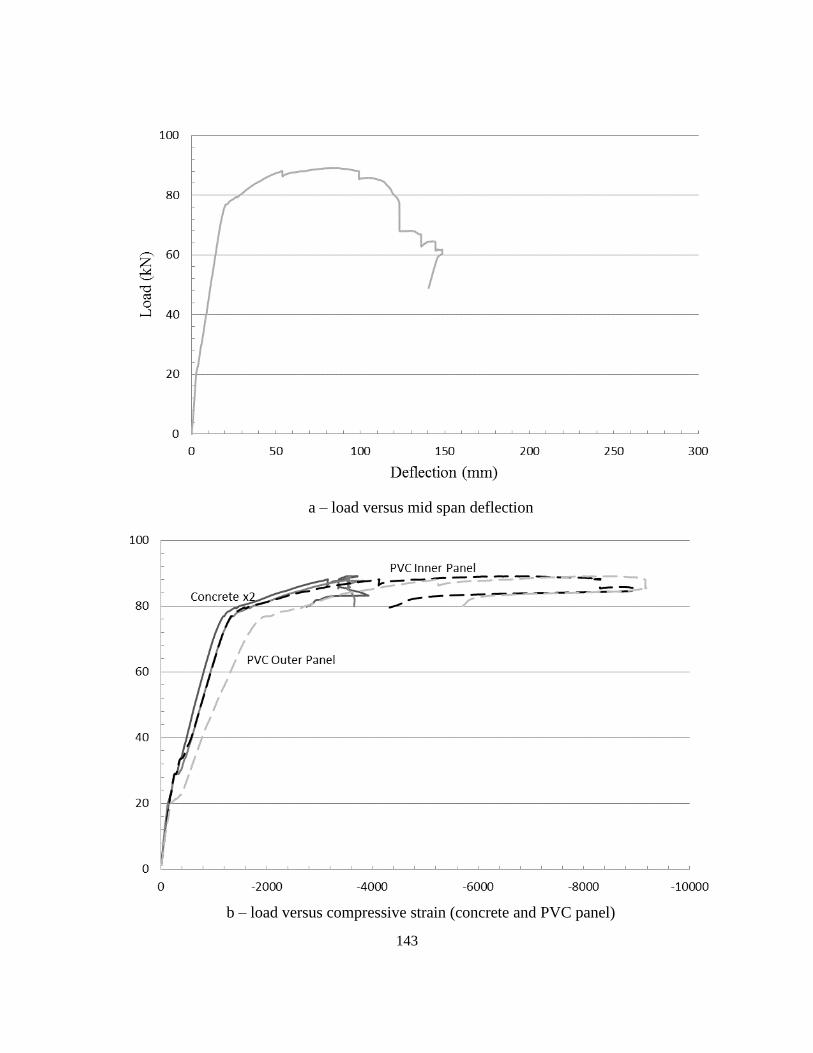
143
a – load versus mid span deflection
b – load versus compressive strain (concrete and PVC panel)
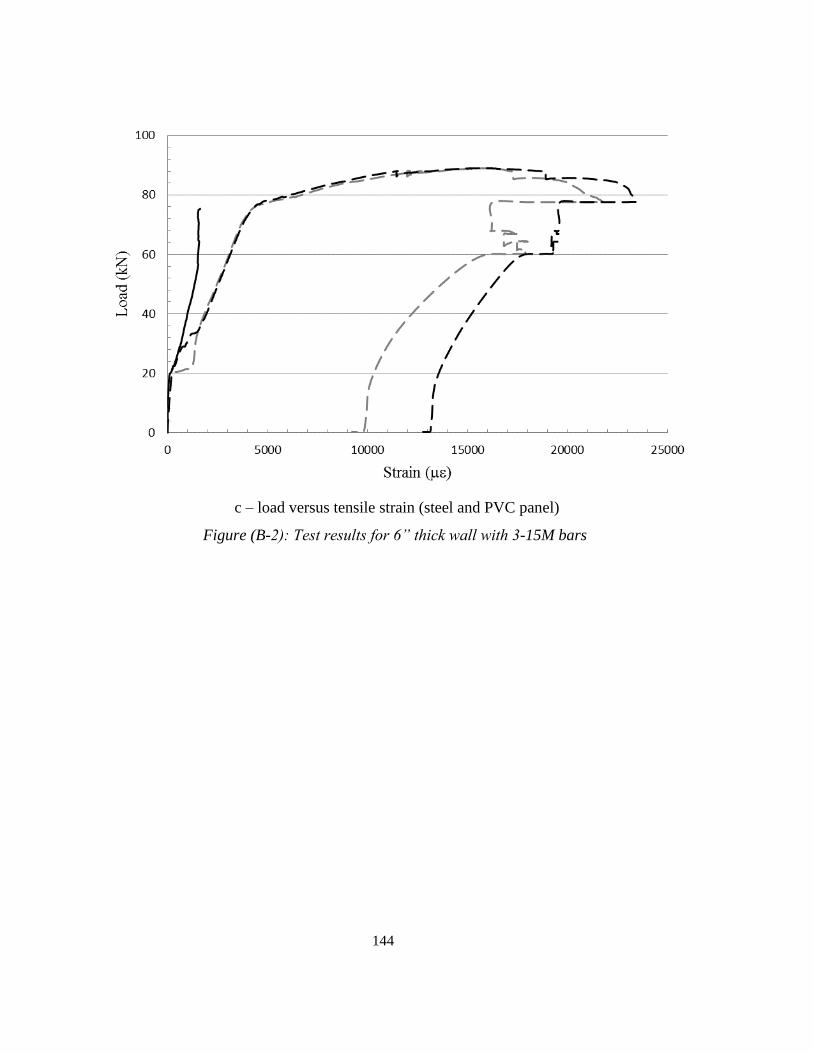
144
c – load versus tensile strain (steel and PVC panel)
Figure (B-2): Test results for 6” thick wall with 3-15M bars
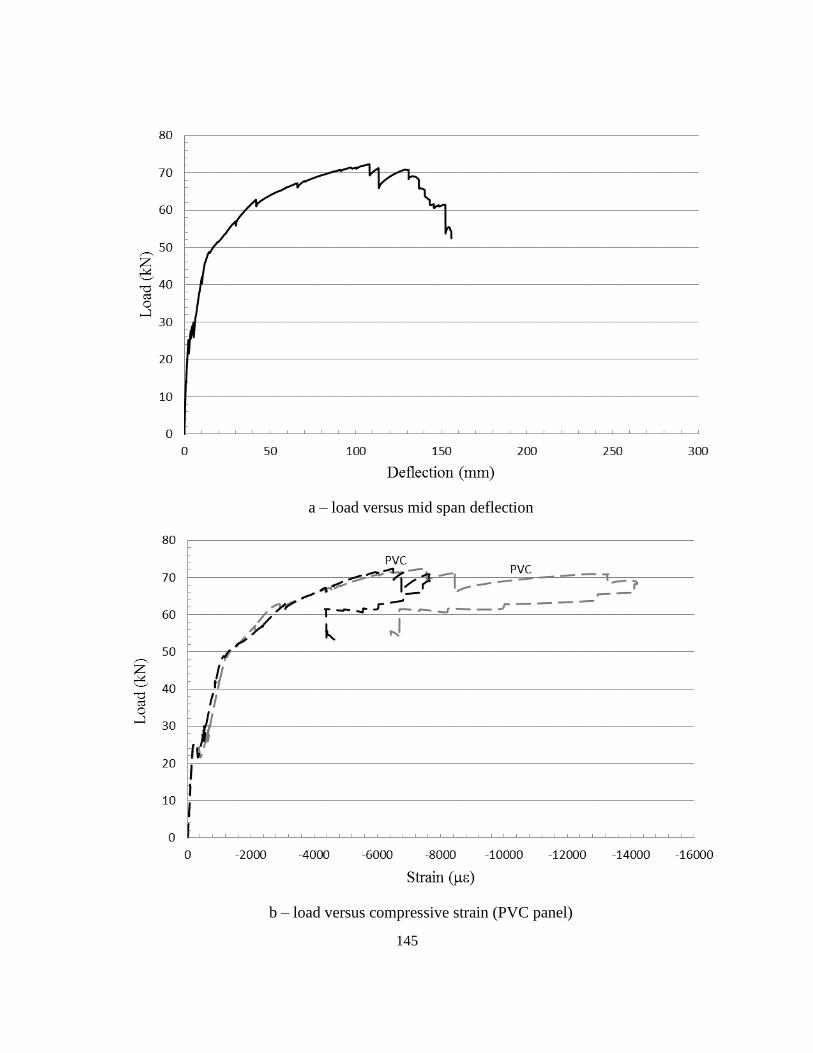
145
a – load versus mid span deflection
b – load versus compressive strain (PVC panel)
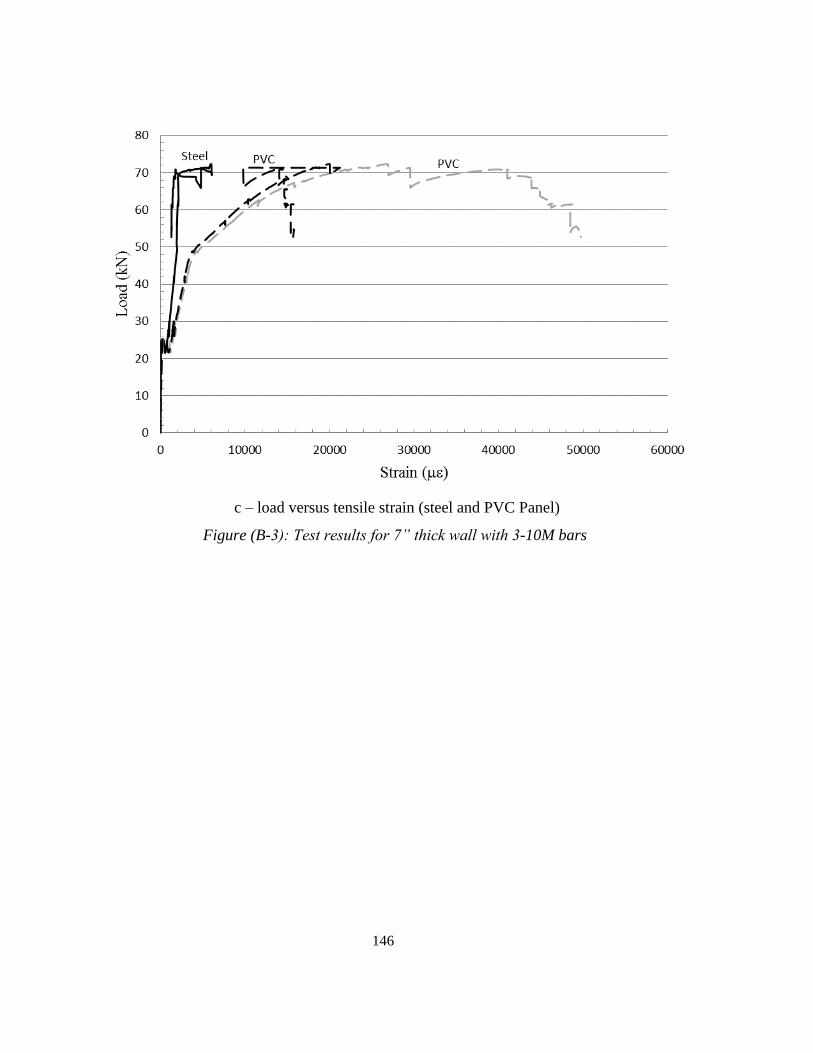
146
c – load versus tensile strain (steel and PVC Panel)
Figure (B-3): Test results for 7” thick wall with 3-10M bars
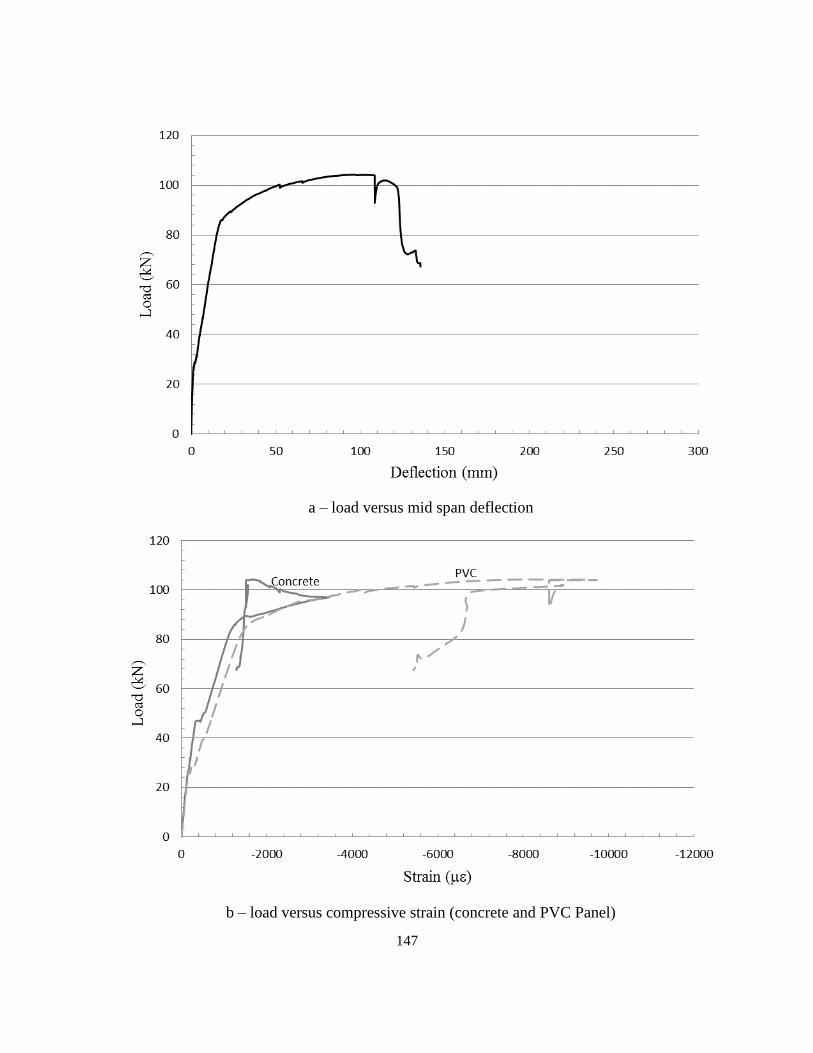
147
a – load versus mid span deflection
b – load versus compressive strain (concrete and PVC Panel)
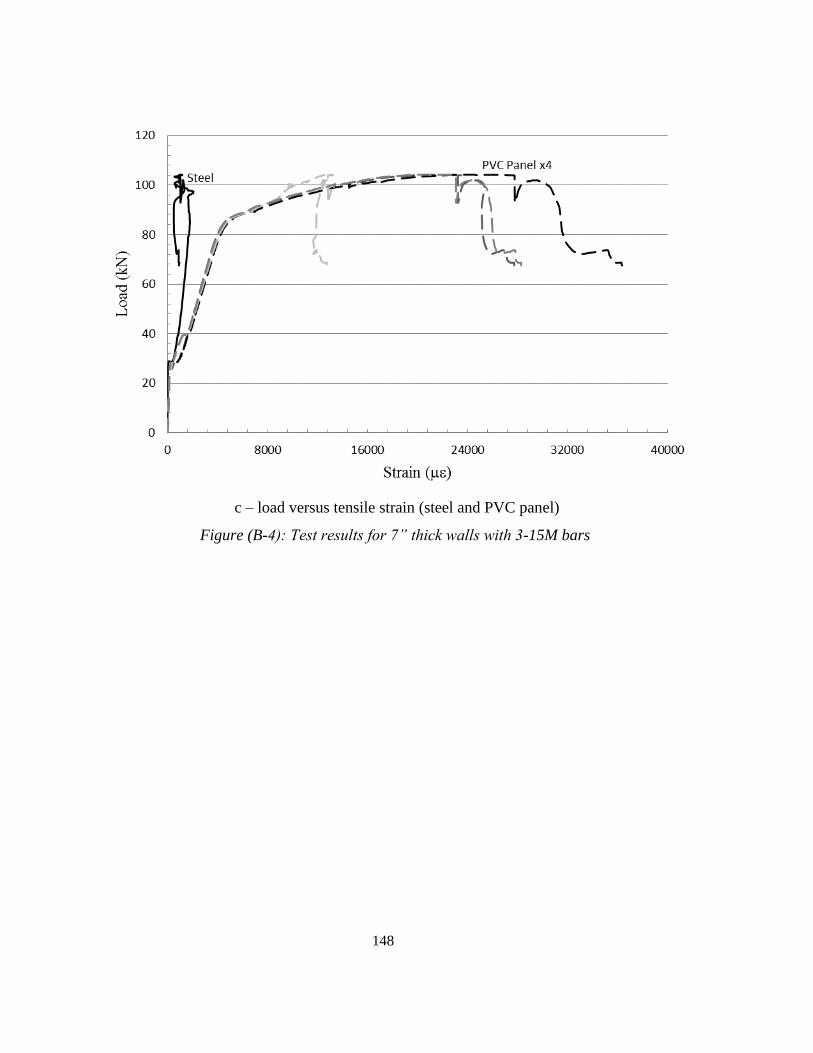
148
c – load versus tensile strain (steel and PVC panel)
Figure (B-4): Test results for 7” thick walls with 3-15M bars
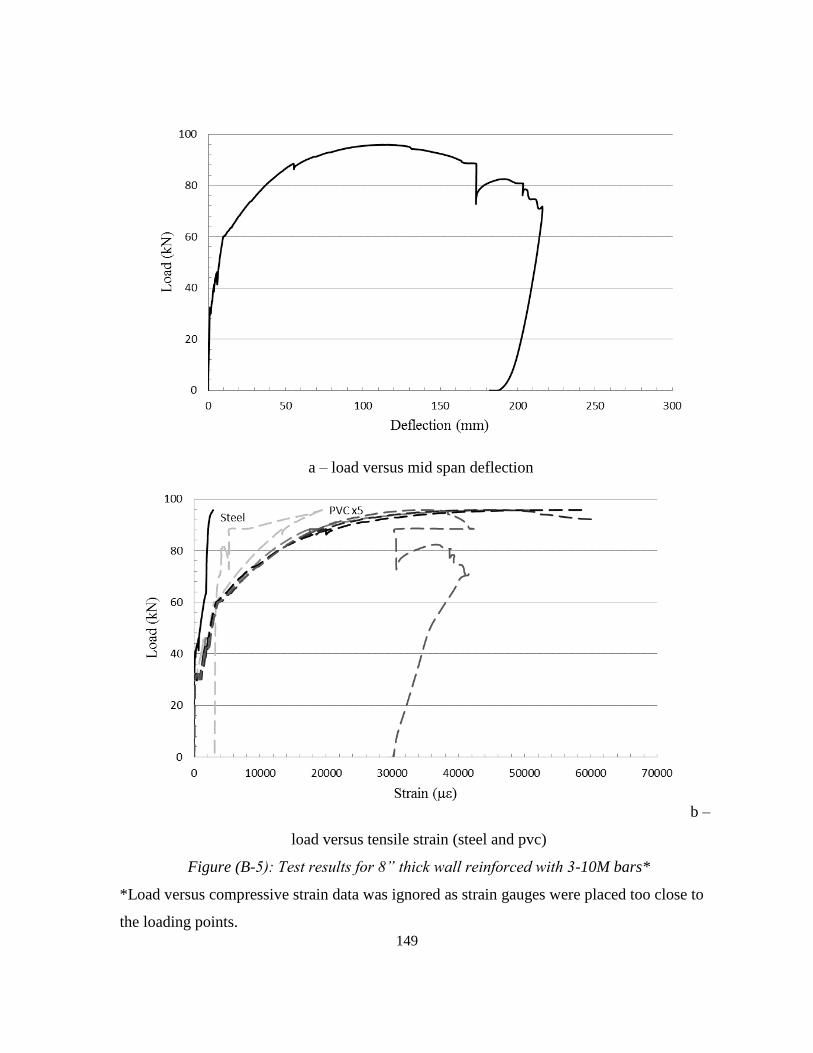
149
a – load versus mid span deflection
b –
load versus tensile strain (steel and pvc)
Figure (B-5): Test results for 8” thick wall reinforced with 3-10M bars*
*Load versus compressive strain data was ignored as strain gauges were placed too close to
the loading points.
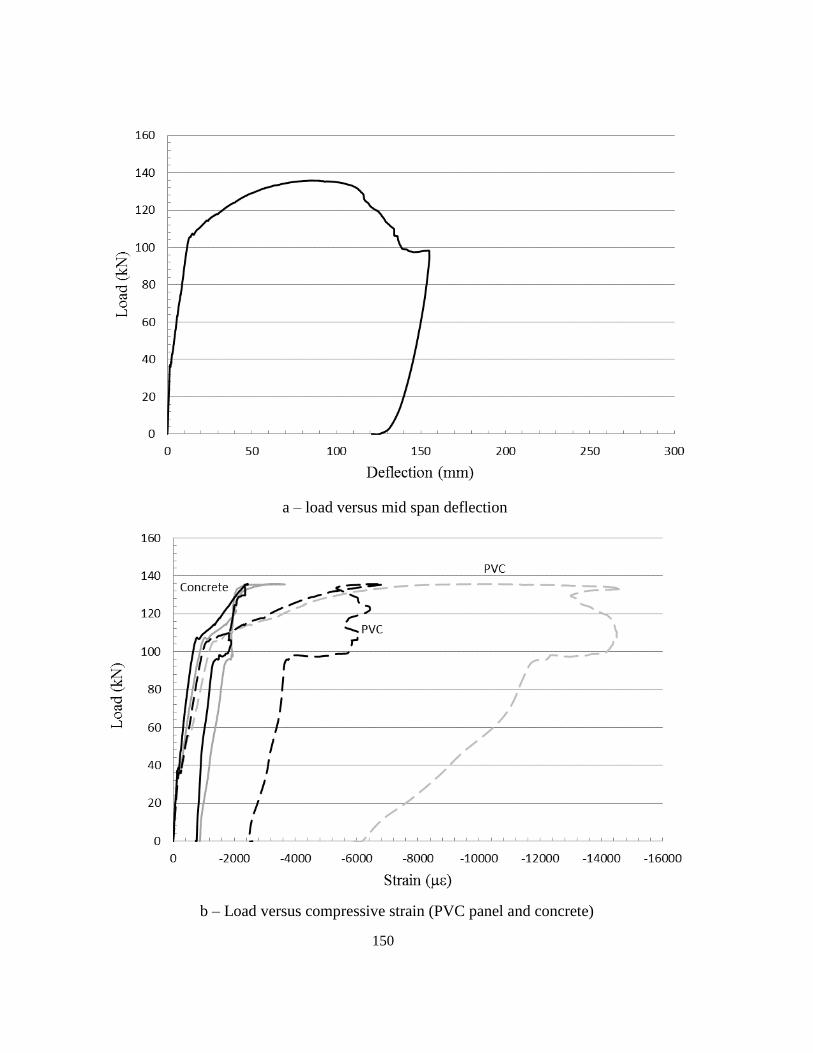
150
a – load versus mid span deflection
b – Load versus compressive strain (PVC panel and concrete)
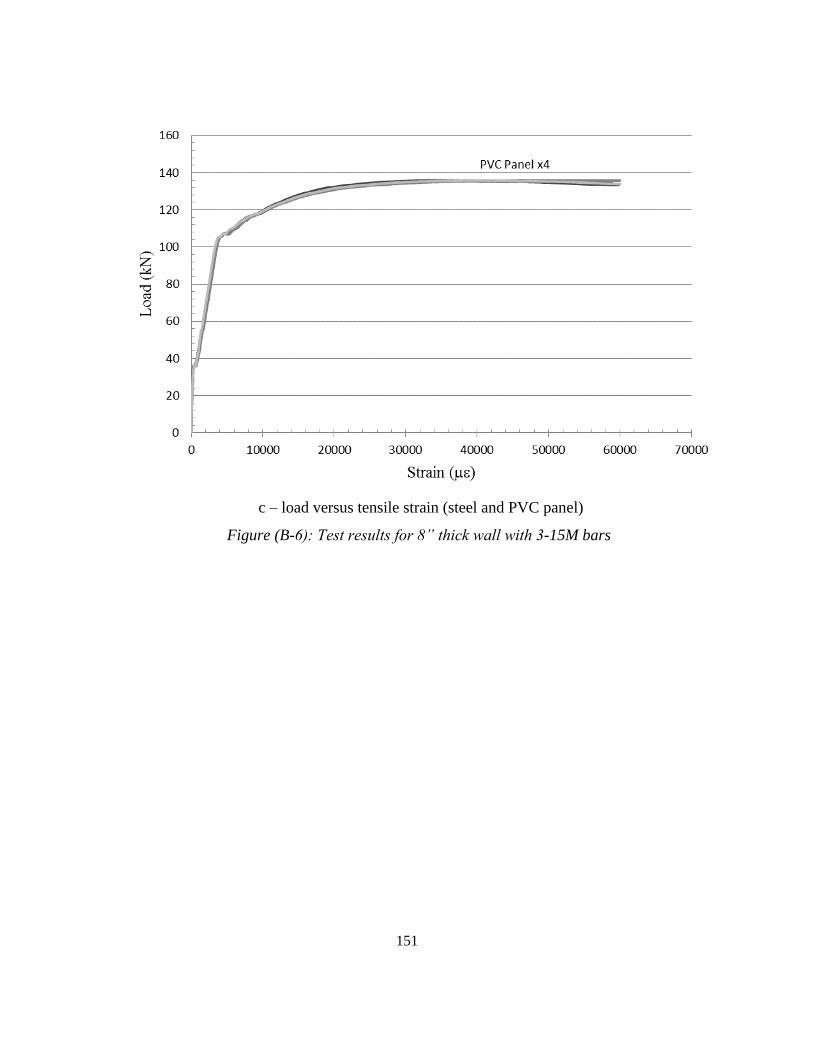
151
c – load versus tensile strain (steel and PVC panel)
Figure (B-6): Test results for 8” thick wall with 3-15M bars