Embed Size (px)
Citation preview

This thesis has been submitted in fulfilment of the requirements for a postgraduate degree
(e.g. PhD, MPhil, DClinPsychol) at the University of Edinburgh. Please note the following
terms and conditions of use:
This work is protected by copyright and other intellectual property rights, which are
retained by the thesis author, unless otherwise stated.
A copy can be downloaded for personal non-commercial research or study, without
prior permission or charge.
This thesis cannot be reproduced or quoted extensively from without first obtaining
permission in writing from the author.
The content must not be changed in any way or sold commercially in any format or
medium without the formal permission of the author.
When referring to this work, full bibliographic details including the author, title,
awarding institution and date of the thesis must be given.

BEHAVIOUR OF REINFORCED CONCRETE
FRAME STRUCTURE AGAINST
PROGRESSIVE COLLAPSE
by
Ofonime Akpan Harry
A thesis submitted in partial fulfilment of the requirements for the
degree of Doctor of Philosophy
Institute for Infrastructure and the Environment
School of Engineering
The University of Edinburgh
March, 2018


i
Declaration
This thesis entitled, ‘‘Behaviour of reinforced concrete frame structure against
progressive collapse’’ is submitted to the University of Edinburgh for the degree of
Doctor of Philosophy. The research work described and reported in this thesis has been
completed solely by Ofonime Akpan Harry under the supervision of Professor Yong
Lu and Dr Tim Stratford. I can confirm:
that the thesis has been composed by the author, and
either that the work is the author’s own or if the author has been a member of
a research group, that the author has made a substantial contribution to the
work, such contributions are clearly indicated, and
that the work in this thesis has not been submitted for any other degree or
professional qualifications.
Publications based on this thesis:
Harry, O. A. and Lu, Y., 2016. “Effect of reinforcement detailing on progressive
collapse resistance” 16th International Conference & Exhibition on Structural Faults &
Repair. May 2016, Edinburgh, Scotland, United Kingdom.
Harry, O. A. and Lu, Y., 2017. “Progressive collapse-arching effect in reinforced
concrete beams” CONFAB 2017: 2nd International Conference on Structural Safety
under Fire & Blast Loading. September 2017, London, United Kingdom.
Cheng, X., Harry, O., Irvine, M., Jacobs, P. and Lu, Y., 2017. “Progressive collapse
- a laboratory perspective of beam assemblies in a column loss scenario” CONFAB
2017: 2nd International Conference on Structural Safety under Fire & Blast Loading.
September 2017, London, United Kingdom.
Harry, O. A. and Lu, Y. “A theoretical model for prediction of catenary effect in beam
assemblies considering strength degradations” (Journal paper in preparation)

ii
Harry, O. A. and Lu, Y. “A semi-empirical analysis approach to predicting arching
action in RC beam assemblies under a column removal scenario” (Journal paper in
preparation)
Signed:
Dated:

iii
Abstract
A structure subjected to extreme load due to explosion or human error may lead to
progressive collapse. One of the direct methods specified by design guidelines for
assessing progressive collapse is the Alternate Load Path method which involves
removal of a structural member and analysing the structure to assess its potential of
bridging over the removed member without collapse. The use of this method in
assessing progressive collapse therefore requires that the vertical load resistance
function of the bridging beam assembly, which for a typical laterally restrained
reinforced concrete (RC) beams include flexural, compressive arching action and
catenary action, be accurately predicted.
In this thesis, a comprehensive study on a reliable prediction of the resistance function
for the bridging RC beam assemblies is conducted, with a particular focus on a) the
arching effect, and b) the catenary effect considering strength degradations. A critical
analysis of the effect of axial restraint, flexural reinforcement ratio and span-depth
ratio on compressive arching action are evaluated in quantitative terms. A more
detailed theoretical model for the prediction of load-displacement behaviour of RC
beam assemblies within the compressive arching response regime is presented. The
proposed model takes into account the compounding effect of bending and arching
from both the deformation and force points of view. Comparisons with experimental
results show good agreement.
Following the compressive arching action, catenary action can develop at a much
larger displacement regime, and this action could help address collapse. A complete
resistance function should adequately account for the catenary action as well as the
arching effect. To this end, a generic catenary model which takes into consideration
the strength degradation due to local failure events (e.g. rupture of bottom rebar or
fracture of a steel weld) and the eventual failure limit is proposed. The application of
the model in predicting the resistance function in beam assemblies with strength
degradations is discussed. The validity of the proposed model is checked against

iv
predictions from finite element model and experimental tests. The result indicate that
strength degradation can be accurately captured by the model.
Finally, the above developed model framework is employed in investigative studies to
demonstrate the application of the resistance functions in a dynamic analysis
procedure, as well as the significance of the compressive arching effect and the
catenary action in the progressive collapse resistance in different designs. The
importance of an accurate prediction of the arching effect and the limiting
displacement for the catenary action is highlighted.

v
Acknowledgement
I would like to sincerely appreciate my supervisor Professor Yong Lu for his immense
support throughout the duration of my PhD study. His thorough guidance and advice
made the successful completion of this study possible.
I am deeply grateful to the Nigerian Government for the financial support without
which this study would not have been accomplished.
Life in Edinburgh would have been boring without amazing friends. For this I thank
my friends: Dr JP Morrissey, Dr Chuanchuan Hou, Dr Jiaming Xu, Dr Ronzin, Dr
Xizhong Chen, Mr Fahad Gulib, Mr Xiaobo Cheng, Mr Tim, Mr. Yu Gu and Mr Joel
Keishing for making my stay in Edinburgh worth the while. I would not fail to thank
Dr Lige Wang, Dr Utibe Umoh and Dr Ranga Radhakrishnan for their invaluable time
in discussing topical issues beyond research.
I will like to specially appreciate my parent Deacon and Deaconness A. H. Etukudoh
for their prayers and support. To my siblings Rose, Jane, Enobong and Christiana thank
you for always having my back and for the words of encouragement. Not forgetting
my in-laws Chijioke Anyawu and Nsisong Charles, I say thank you for all your
support.
Finally, I appreciate my mentors Professor Charles Uko and Dr Edet Amana for their
unwavering supports towards my academic pursuit.

vi
Table of Content
Declaration.… ............................................................................................................... i
Abstract............. .......................................................................................................... iii
Acknowledgement............. ........................................................................................... v
Table of Content............. ............................................................................................. vi
List of Figures.… ....................................................................................................... xii
Listof Tables.… ......................................................................................................... xxi
Symbols...............................................................................................................…xxiv
Chapter 1: Introduction ............................................................................................ 1
1.1 Background .................................................................................................... 1
1.2 Objectives of study ........................................................................................ 3
1.3 Scope of work ................................................................................................ 4
1.4 Organisation of the thesis .............................................................................. 4
Chapter 2: Literature review .................................................................................... 7
2.1 Introduction ................................................................................................... 7
2.2 Definition of key terminologies ..................................................................... 7
2.2.1 Progressive collapse ............................................................................... 7
2.2.2 Robustness .............................................................................................. 8
2.3 Defining cases of progressive collapse .......................................................... 8
2.3.1 Ronan point apartment building in London ........................................... 8

vii
2.3.2 Murrah building located in Oklahoma City, USA ................................. 9
2.3.3 Pentagon building located in Virginia, USA........................................ 10
2.4 Code and design guidelines against progressive collapse ........................... 12
2.5 Experimental studies on progressive collapse ............................................. 16
2.5.1 Studies on RC subassemblies ............................................................... 19
2.6 Parameters affecting compressive arching action in axially restrained
reinforced concrete beams...................................................................................... 33
2.6.1 Effect of axial restraint on compressive arching action capacity ......... 33
2.6.2 Effect of reinforcement ratio on compressive arching action capacity 35
2.6.3 Effect of span depth ratio on compressive arching action capacity ..... 37
2.6.4 Effect of concrete compressive strength on compressive arching capacity
38
2.7 Analytical studies ........................................................................................ 39
2.7.1 Analytical studies on compressive arching action ............................... 39
2.7.2 Analytical studies on catenary action ................................................... 46
2.8 Concluding remarks .................................................................................... 49
Chapter 3: Critical evaluation of compressive arching action - a semi empirical
study 51
3.1 Introduction ................................................................................................. 51
3.2 Existing experimental studies ...................................................................... 51
3.2.1 Test by Su et al. (2009) ........................................................................ 53

viii
3.2.2 Test by Yu & Tan (2013a) and Yu & Tan (2013b) .............................. 59
3.2.3 Test by Vesali et al. (2013) and Vali et al. (2015) ............................... 64
3.2.4 Test by Sadek et al. (2011) ................................................................... 69
3.3 Critical analysis of all the experimental results ........................................... 72
3.4 A simplified formulation for arching action ................................................ 76
3.5 Effect of parameters affecting relative increase in load due to compressive
arching action ......................................................................................................... 85
3.5.1 Effect of axial restraint on compressive arching action capacity ......... 85
3.5.2 Effect of reinforcement ratio on compressive arching action capacity 90
3.5.3 Effect of span depth ratio on compressive arching action capacity ..... 93
3.5.4 Effect of concrete compressive strength .............................................. 95
3.6 Empirical method for the prediction of the arching effect .......................... 96
3.6.1 Consideration of effect of the parameters ............................................ 96
3.6.2 Validation of the proposed semi empirical formulae ........................... 98
3.7 Conclusions ............................................................................................... 100
Chapter 4: Numerical modelling of reinforced concrete beam assembly under a
progressive collapse scenario ................................................................................... 101
4.1 Introduction ............................................................................................... 101
4.2 Background of KCC model ....................................................................... 102
4.2.1 Performance of KCC model ............................................................... 105
4.3 Modelling of reinforcement ....................................................................... 115

ix
4.4 Model checks ............................................................................................. 116
4.4.1 Reinforcement strain localization ...................................................... 116
4.4.2 Mesh sensitivity ................................................................................. 120
4.4.3 Hour glass effect ................................................................................ 126
4.5 Validation of numerical models with experimental study by (Yu & Tan
2013b) .................................................................................................................. 128
4.5.1 Detail of the experiment ..................................................................... 128
4.5.2 Overview of the finite element model for the test beam assemblies.. 130
4.6 Concluding remarks .................................................................................. 136
Chapter 5: Theoretical model on compressive arching action and associated
deformation limit state in axially restrained reinforced concrete beam ................... 139
5.1 Introduction ............................................................................................... 139
5.2 Development of the Analytical Model: Basic Considerations .................. 140
5.2.1 General Concept ................................................................................. 140
5.2.2 Different stages of response ............................................................... 143
5.2.3 Stresses and force equilibrium in the arching effective stage ............ 152
5.2.4 Kinematics for flexible axial support ................................................. 155
5.2.5 Additional moment of resistance due to arching ............................... 156
5.3 Determination of plastic length due to bending and arching ..................... 158
5.3.1 Introduction ........................................................................................ 158
5.3.2 Plastic hinge length for bending ......................................................... 158

x
5.3.3 Determination of effective “plastic” arching depth to length ratio (x/LN)
159
5.4 Validation of the proposed model ............................................................. 166
5.5 Conclusions ............................................................................................... 168
Chapter 6: Simplified theoretical model for prediction of catenary action
incorporating strength degradation in axially restrained beams ............................... 169
6.1 Introduction ............................................................................................... 169
6.2 Scope of the model .................................................................................... 170
6.3 Analysis procedure for a simplified beam model without consideration of
strength degradation ............................................................................................. 171
6.3.1 Elastic stage ........................................................................................ 174
6.3.2 Transient stage/catenary action stage ................................................. 175
6.4 Illustrative example of finite element simulation and theoretical prediction of
load-displacement response of beam without considering strength degradation . 182
6.4.1 Finite element model description ....................................................... 182
6.4.2 Result and discussion for FE and theoretical models with no strength
degradation ....................................................................................................... 184
6.5 Degradation of yield surface ...................................................................... 187
6.5.1 Concept of strength degradation and implications on catenary effect 187
6.5.2 Implementation of degradation of yield surfaces in the beam analysis
procedure .......................................................................................................... 189
6.6 Verification of the theoretical model for prediction of load-displacement
resistance function with strength degradation ...................................................... 194

xi
6.6.1 Validation with a conceptual FE simulation ...................................... 194
6.6.2 Validation with existing experiment .................................................. 197
6.7 Application of the proposed model to reinforced concrete beam-column
assemblies ............................................................................................................ 201
6.7.1 General assumptions .......................................................................... 201
6.7.2 Formulation for fixed end RC beams with plastic hinges at support and
middle sections ................................................................................................. 202
6.7.3 Equilibrium of forces ......................................................................... 204
6.7.4 Failure criteria during catenary action ............................................... 205
6.8 Conclusions ............................................................................................... 208
Chapter 7: Assessment of progressive collapse of RC frame using the developed
model framework ..................................................................................................... 209
7.1 Introduction ............................................................................................... 209
7.2 Design of the building frame ..................................................................... 211
7.3 Simplified column loss representation ...................................................... 213
7.4 Numerical modelling ................................................................................. 217
7.4.1 Detail of the model ............................................................................. 217
7.4.2 Nonlinear dynamic analysis modelling approach .............................. 218
7.4.3 Analysis of quasi static behaviour of the two subassemblies ............ 220
7.5 Comparison of the predicted and FE modelling results ............................ 224
7.5.1 Determination of the yield function for the end and middle section of the
plastic hinge ..................................................................................................... 224

xii
7.5.2 Determination of equivalent axial stiffness of the end support .......... 227
7.5.3 Comparison and discussion of results ................................................ 229
7.6 Progressive collapse-resisting capacity curve ........................................... 229
7.7 Concluding remarks ................................................................................... 233
Chapter 8: Conclusions and recommendation for future work ............................ 235
8.1 Main conclusions ....................................................................................... 236
8.2 Recommendations for future work ............................................................ 237
References....................….....................................................................................…239

xiii
Table of Figures
Figure 2.1: Ronan point apartment building after collapse .......................................... 9
Figure 2.2: North side of Murray building after collapse (Hinman & Hammond 1997)
.................................................................................................................................... 10
Figure 2.3: Collapse area of the Pentagon building (Mlakar et al. 2003a) ................ 12
Figure 2.4: Locations of column removal for assessing collapse (GSA, 2013) ......... 15
Figure 2.5: Test RC frame detail (Yi et al. 2008) ...................................................... 16
Figure 2.6: Load versus unloading displacement of the middle column (Yi et al. 2008)
.................................................................................................................................... 17
Figure 2.7: Reinforcement arrangement of tested specimen (Stinger & Orton 2013) 18
Figure 2.8: Vertical load-displacement relationship for the specimen (Stinger & Orton
2013) .......................................................................................................................... 19
Figure 2.9: Effect of reinforcement ratio on compressive arching action in RC
subassemblies (Su et al. 2009) ................................................................................... 21
Figure 2.10: Effect of span-to-depth ratio on compressive arching action in RC
subassemblies (Su et al. 2009) ................................................................................... 22
Figure 2.11: Reinforcement detailing of tested beam (Sasani and Kropelnicki, 2008)
.................................................................................................................................... 23
Figure 2.12: Load-middle column displacement relationship (Sasani and Kropelnicki,
2008) .......................................................................................................................... 24
Figure 2.13: Vertical and axial load against middle column displacement for RC
specimens (Orton 2007) ............................................................................................. 25

xiv
Figure 2.14: Relationship of load- displacement and horizontal force-displacement of
the middle column (Yu & Tan 2013a) ....................................................................... 27
Figure 2.15: Effect of bottom reinforcement ratio on structural behaviour of
subassemblies (Yu and Tan, 2013b) .......................................................................... 29
Figure 2.16: Effect of top reinforcement ratio on structural behaviour of subassemblies
(Yu and Tan, 2013b) .................................................................................................. 30
Figure 2.17: Effect of span-depth ratio on structural behaviour of subassemblies (Yu
and Tan, 2013b) .......................................................................................................... 31
Figure 2.18: Geometric and reinforcement details for IMF specimen (Lew et al. 2014)
.................................................................................................................................... 32
Figure 2.19: Vertical load against centre column displacement of tested specimens
(Sadek et al. 2011) ...................................................................................................... 33
Figure 2.20: Effect of axial restraint stiffness on normalized CAA capacity (Yu & Tan
2014) ........................................................................................................................... 35
Figure 2.21: Effect of reinforcement ratio on enhancement factor for different L/d ratio
(Yu & Tan 2014) ........................................................................................................ 37
Figure 2.22: Effect of L/d ratio on enhancement factor from experimental test ........ 38
Figure 2.23: Effect of concrete strength on enhancement factor (Vali et al. 2015) ... 39
Figure 2.24: Horizontal forces at support and mid-span (Christiansen 1963) ........... 40
Figure 2.25: Plan and elevation view of RC assemblages with idealised geometry for
half span laterally restrained slab after McDowell et al (1956) (Rankin & Long 1997b)
.................................................................................................................................... 41
Figure 2.26: Equivalent three hinge arches (a) with flexible restraint (b) rigid restraint
(Rankin & Long 1997b) ............................................................................................. 43

xv
Figure 2.27: Compatibility condition of one-half of RC beam (Yu and Tan, 2014) . 45
Figure 2.28: Four response stages (Izzuddin 2005) ................................................... 46
Figure 3.1: Cross section showing the assumed stress distribution at the middle and
end section in specimen A1........................................................................................ 52
Figure 3.2: Plan and elevation view of RC assemblages (after Su et al., 2009) ........ 54
Figure 3.3: Schematic representation of the test set up and tested specimen (after Su et
al., 2009)..................................................................................................................... 56
Figure 3.4: Test set up (after Su et al., 2009) ............................................................. 56
Figure 3.5: Reinforcement detail of sub-assemblage (Yu & Tan 2013b) .................. 59
Figure 3.6: Reinforcement detail of sub-assemblage (Yu & Tan 2013a) .................. 61
Figure 3.7: Damage pattern of specimen S5 at compressive arching capacity with
middle joint displacement of 75mm (Yu & Tan 2013b) ............................................ 62
Figure 3.8: Damage pattern of specimen S8 at compressive arching capacity with
middle joint displacement of 75mm (Yu & Tan 2013b) ............................................ 63
Figure 3.9: Geometric and reinforcement arrangement of the test specimens (Vesali et
al. 2013)...................................................................................................................... 65
Figure 3.10: Anchoring of subassembly to test set up (Vali et al. 2015) ................... 66
Figure 3.11: Damage pattern of the tested specimen (Vali et al. 2015) ..................... 68
Figure 3.12: Geometric and reinforcement details of the test assemblies.................. 70
Figure 3.13: Test set up (Sadek et al. 2011) ............................................................... 71
Figure 3.14: Variation of normalized increase in load due to arching with span depth
ratio for all specimens ................................................................................................ 75

xvi
Figure 3.15: Trend line through the data points ......................................................... 75
Figure 3.16: “Rigid” body rotation analogy for arching deformations ...................... 77
Figure 3.17: “Rigid” body movement of beam with consideration of flexible restraint
.................................................................................................................................... 80
Figure 3.18: Flow chart for the incremental procedure .............................................. 84
Figure 3.19: Effect of axial restraint stiffness on normalized CAA capacity ............ 89
Figure 3.20: Illustration of the arching effect vs. L/d with all data “corrected” to rigid
end supports. ............................................................................................................... 90
Figure 3.21: Effect of reinforcement ratio on relative increase/decrease in normalized
increase in load capacity (normalized with bending capacity) .................................. 92
Figure 3.22: Effect of reinforcement ratio on relative increase/decrease in N ....... 93
Figure 3.23: Effect of L/d ratio on N from simplified model ................................ 94
Figure 3.24: Effect of L/d ratio relative factor with L/d=4 as a base reference ......... 95
Figure 3.25: Correlation of predictions with test results for different L/d ratios ..... 100
Figure 4.1: Three strength surfaces represented in K&C model (Mat_072R3) (Malvar
et al. 1997) ................................................................................................................ 103
Figure 4.2: Default η-λ curve in KCC model ........................................................... 105
Figure 4.3: Tension softening for modified Maekawa model (adopted from DIANA
manual) ..................................................................................................................... 107
Figure 4.4: Stress strain relationship of concrete in tension (Maekawa et al. 2003) 108
Figure 4.5: Modified η-λ curve with and without residual capacity ........................ 109

xvii
Figure 4.6: Uniaxial stress-strain curve of single element simulation test (element
size=25mm) .............................................................................................................. 110
Figure 4.7: Uniaxial compressive stress-strain curve of single element simulation test
(element size=25mm) ............................................................................................... 111
Figure 4.8: Axial stress-strain curves of concrete under different confining pressure
(Ansari & Li 1998) ................................................................................................... 112
Figure 4.9: Stress-strain curves under confined compression with and without residual
capacity (mesh size=25mm) ..................................................................................... 112
Figure 4.10: Stress-strain curves under confined compression with and without
residual capacity (mesh size=25mm) ....................................................................... 113
Figure 4.11: Uniaxial tension and damage index ..................................................... 115
Figure 4.12: FE model of RC beam (mesh size=20mm) ......................................... 117
Figure 4.13: Different stress-strain curve used for the study ................................... 118
Figure 4.14: Axial load-axial displacement response for model with elastic perfectly
plastic stress-strain behaviour of reinforcement ...................................................... 119
Figure 4.15: Axial load-axial displacement response for model with trilinear stress-
strain behaviour (with hardening) of reinforcement ................................................ 119
Figure 4.16: Axial load-axial displacement response for model with curvilinear stress-
strain (with hardening) behaviour of reinforcement ................................................ 120
Figure 4.17: Finite element mesh of model C .......................................................... 121
Figure 4.18: Stress-strain curves for reinforcement ................................................. 122
Figure 4.19: Load and axial force-displacement responses for RC beam with trilinear
stress-strain behaviour .............................................................................................. 123

xviii
Figure 4.20: Load and axial force-displacement responses for RC beam with trilinear
stress-strain behaviour .............................................................................................. 124
Figure 4.21: Strain contour distribution in FE model A at displacement of 500mm125
Figure 4.22: Bottom rebar strain distribution along the beam ................................. 126
Figure 4.23: Illustration of hour glassing arising from bending deformation with no
straining .................................................................................................................... 127
Figure 4.24: Ratio of Hour glass and internal energies during the quasi static loading
for model A. ............................................................................................................. 128
Figure 4.25: Elevation and plan view of the tested specimen (Yu & Tan 2013b) ... 129
Figure 4.26: Details of boundary condition in the experimental test and FE assemblies
.................................................................................................................................. 131
Figure 4.27: Comparison of responses from FE and experiment for specimen S4 .. 132
Figure 4.28: Comparison of responses from FE and experiment for specimen S6 .. 133
Figure 4.29: Comparison of damage pattern from FE and experiment for Specimen S4
(SDF=1.98-2.0) ........................................................................................................ 135
Figure 4.30: Comparison of damage pattern from FE and experiment for Specimen S6
(SDF=1.98-2.0) ........................................................................................................ 136
Figure 5.1: A beam-column subassembly under concentrated load at middle column
(Yu and Tan, 2014) .................................................................................................. 141
Figure 5.2: Free body diagram showing all forces acting on the beam, and the co-
existing bending and arching modes of resistance ................................................... 142
Figure 5.3: Free body diagram showing the two sets of forces corresponding to bending
and arching action modes ......................................................................................... 142

xix
Figure 5.4: Load-displacement response showing the elastic and plastic stages in the
proposed model ........................................................................................................ 143
Figure 5.5: Section stress and strain distribution at elastic bending mode .............. 144
Figure 5.6: Rigid block movement of the beam ....................................................... 147
Figure 5.7: Simple illustration of geometrically compatible combinations of
compression zone scenarios ..................................................................................... 149
Figure 5.8: Schematic of concrete strain distribution in the compression zone....... 151
Figure 5.9: Superposition of strain due to bending and arching .............................. 152
Figure 5.10: Stress distribution considering the concurrent bending and arching
deformation modes ................................................................................................... 153
Figure 5.11: Rigid block movement of beam with flexible restraint ....................... 155
Figure 5.12: Horizontal forces at support and mid-span sections considering only
forces attributed to arching....................................................................................... 157
Figure 5.13: An infinitive RC element ..................................................................... 160
Figure 5.14: Strain variation along top fibre of beam for x=0.1d ............................ 161
Figure 5.15: Stress distribution and strain distribution across depth for x=0.1d ..... 162
Figure 5.16: strain contour of (a) RC element (b) compression zone area only at a
compressed displacement of 0.3mm ........................................................................ 163
Figure 5.17: strain distribution along top fibre of beam for x=0.3d ........................ 164
Figure 5.18: Stress distribution and strain distribution across depth for x=0.3d ..... 165
Figure 6.1: Simply supported beam with flexible axial restraint ............................. 171
Figure 6.2: Schematics of load-displacement curves ............................................... 172

xx
Figure 6.3: Moment-curvature behaviour at section and plastic hinge .................... 174
Figure 6.4: Moment-curvature behaviour at section and plastic hinge .................... 176
Figure 6.5: Free body diagram showing forces acting on the beam ........................ 179
Figure 6.6: Flow chart for calculating internal forces and vertical resistance without
considering strength degradation ............................................................................. 181
Figure 6.7: Geometric and boundary Details of the FE model ................................ 184
Figure 6.8: Load-displacement curve for FE and theoretical model without
consideration of strength degradation ...................................................................... 185
Figure 6.9: Moment-axial force relationship comparison for FE and theoretical model
.................................................................................................................................. 186
Figure 6.10: Plastic strain distribution along the bottom fibre of the beam ............. 186
Figure 6.11: A representative joint connection and process of strength degradation
.................................................................................................................................. 188
Figure 6.12: Ultimate and residual yield surfaces .................................................... 189
Figure 6.13: Illustration of migration between ultimate and residual surfaces ........ 190
Figure 6.14: Flow chart for calculating internal forces and vertical resistance with
consideration of strength degradation ...................................................................... 193
Figure 6.15: Section near middle column with the degraded section shown in the
highlighted area ........................................................................................................ 194
Figure 6.16: Schematic showing the sections before and after degradation ............ 195
Figure 6.17: Moment-axial force interaction curves for full and degraded sections 196
Figure 6.18: Comparison of load-displacement response from FE and proposed model
with strength degradation ......................................................................................... 197

xxi
Figure 6.19: Middle beam-column joint and section details of tested specimen (Li et
al. 2015).................................................................................................................... 198
Figure 6.20: Determination of M-N curves for the critical region of the tested beam
(dimensions in mm) ................................................................................................. 199
Figure 6.21: Moment-axial force curves before and after fracture of bottom weld . 199
Figure 6.22: Comparison of load-displacement response from experimental result and
proposed model ........................................................................................................ 201
Figure 6.23: Idealised load-displacement resistance function for RC assemblies in the
proposed model ........................................................................................................ 202
Figure 6.24: Free body diagram showing force acting on a fixed end beam ........... 204
Figure 6.25: Flow chart for calculating internal forces and vertical resistance without
considering strength degradation ............................................................................. 207
Figure 7.1: Plan view of the building (dimension in metres) ................................... 212
Figure 7.2: Bending moment distribution of the periphery frame ........................... 212
Figure 7.3: Bending moment distribution of Periphery frame without the missing
column ...................................................................................................................... 214
Figure 7.4: Deformation shape of the frame under a unit horizontal at points A and B
.................................................................................................................................. 215
Figure 7.5: Simplified representation of left part of the RC frame .......................... 215
Figure 7.6: Directly affected subassembly of the building ...................................... 217
Figure 7.7: Stress strain curve for longitudinal reinforcement ................................ 218
Figure 7.8: Loading history for simulating sudden column loss .............................. 219

xxii
Figure 7.9: Applied load-middle column displacement and axial force-middle column
displacement relationship of the subassemblies ....................................................... 221
Figure 7.10: Strain damage contour during the catenary action stage (middle column
displacement of 1000mm) ........................................................................................ 222
Figure 7.11: Reinforcement strain distribution in model A and B at selected
displacement ............................................................................................................. 224
Figure 7.12: Complete axial force-moment interaction curves for model A and B . 225
Figure 7.13: Normalised axial force-bending moment interaction curves for the models
.................................................................................................................................. 226
Figure 7.14: Effect of beam axial stiffness on the RC assembly behaviour during
catenary action stage ................................................................................................ 228
Figure 7.15: Load-middle column displacement response ....................................... 229
Figure 7.16: Illustration of the conversion of nonlinear static curve to pseudo static
curve ......................................................................................................................... 230
Figure 7.17: Pseudo static curves for the different RC subassemblies .................... 231
Figure 7.18: Pseudo static curves for the different RC subassemblies .................... 233

xxiii
List of Tables
Table 3.1: Geometric and reinforcement details of tested specimens by Su et al. (2009)
.................................................................................................................................... 55
Table 3.2: Compressive arching and recalculated flexural capacities of specimens
tested by Su et al. (2009) ............................................................................................ 58
Table 3.3: Geometric and reinforcement detail of test specimens (Yu & Tan 2013a; Yu
& Tan 2013b) ............................................................................................................. 60
Table 3.4: Compressive arching and recalculated flexural capacities of specimens
tested by (Yu & Tan 2013c) ....................................................................................... 64
Table 3.5: Compressive arching and recalculated flexural capacities of specimens
tested by Vesali et al. (2013) and Vali et al. (2015) ................................................... 69
Table 3.6: Compressive arching and recalculated flexural capacities of specimens
tested by Sadek et al. (2011) ...................................................................................... 72
Table 3.7: Comparison of axial restraint stiffness from experimental data set .......... 87
Table 3.8: Effect of axial stiffness coefficient on the normalized increase in load due
to arching .................................................................................................................... 88
Table 3.9: Effect of mechanical reinforcement ratio on normalized increased in load
.................................................................................................................................... 92
Table 3.10: Comparison of experimental and predicted result .................................. 99
Table 4.1: Details of mesh size and number of element in the different models ..... 121
Table 4.2: Reinforcement detail of beam-column sub-assemblage (Yu & Tan 2013b)
.................................................................................................................................. 129
Table 5.1: Expressions for plastic hinge length from different researchers ............. 159

xxiv
Table 5.2: Determination of x/LN for FE model with x=0.1d .................................. 163
Table 5.3: Determination of x/LN for FE model with x=0.3d .................................. 166
Table 5.4: Comparison of experimental and predicted result .................................. 167
Table 7.1: Summary of design data .......................................................................... 213

xxv
Symbols
As1’, As2’ Area of compression reinforcements at the end and middle section respectively
at Distance from the centroid of utmost top reinforcement to the extreme top fibre
of concrete at end and middle sections
ab Distance from the centroid of utmost bottom reinforcement to the extreme bottom
fibre of concrete at end and middle sections.
b Width of beam
Cs, Cs’ Steel compressive forces acting at beams end and mid-span section respectively
d Depth of beam section
Ec Elastic modulus of concrete
fc’ Compressive strength of concrete
1cNF Compression force in concrete at the end section attributed to arching
2cNF Compression force in concrete at the middle section attributed to arching
1sNF Compressive steel at the end section attributed to arching
2sNF Compressive steel at the middle section attributed to arching
HR Horizontal reaction
Icr Moment of inertia of a cracked section
Ig Cross moment of inertia of a section
Ka Axial restraint stiffness
Ks Axial stiffness of beam
L Length of double bay beam
Lp Plastic zone length for catenary action
Lpc Plastic zone length for compressive arching action
Mcr Cracking moment of a section
Me Bending moment of end section

xxvi
Mm Bending moment of middle section
N Axial force
Pa Compressive arching capacity of the beam
Pb Flexural capacity of RC beam
Pt Total vertical resistance of the RC beam
Ty, Ty’ Steel tensile forces acting at beam end and mid-span section respectively
Ui Axial elongation/shortening of beam
1bpx Effective compression depth in concrete at the end section attributed to bending
2bpx Effective compression depth in concrete at the middle section attributed to bending
1x Effective compression depth of the rigid block at the end section
2x Effective compression depth of the rigid block at the middle section
max Maximum strain in the plastic zone
Ratio of equivalent rectangular stress block depth to neutral axis depth
Displacement of the middle joint
N Compression depth available for arching
p Plastic rotation angle
N Distance between the compression force at mid-span and support

Chapter 1 Introduction
1
Chapter 1: Introduction
1.1 Background
Conventionally, building structures are designed to resist loads based on ultimate
capacities evaluated from the intact structural system. When a structure is subjected to
abnormal loading due to terrorist attack or human error, one or more vertical structural
members such as columns or structural walls may be severely compromised. In such a
circumstance, the original load transfer path of the building may be altered. If the
directly affected part such as a column is not strong enough to resist the attack and the
associated dynamic effect, failure may initiate there and eventually lead to collapse of
a large portion or even the entire building. This is called progressive collapse. It is
generally recognised (see e.g. definition by the American Society of Civil Engineers,
ASCE 7), progressive collapse is the failure of entire structure or disproportionate part
of it, caused by a local member failure which spread from member to member.
Interest in the study of progressive collapse began after the collapse of 22-storey
Ronan Point apartment building following a gas explosion in 1968. The 1995 terrorist
attack on Murrah Federal Building in USA and the terrorist attack on the twin tower
building of World Trade Centre in New York in 2001 further brought to fore the need
for public buildings to be adequately protected against progressive collapse in the
event of an attack. Consequent upon this, a number of measures aimed at preventing
or reducing the possibility of collapse in existing and new public buildings have been
incorporated into design guidelines (GSA 2013; DoD 2010). Typical design analysis
against progressive collapse is based on two methods: Indirect and direct method. The
indirect method requires that effective ties be provided within the building without any
explicit means of assessing or quantifying the potential of collapse. The direct method
consists of the specific local resistance method and the alternate load path method. In
the specific local resistance method, key structural members are intentionally hardened
to resist a clearly defined threat. On the other hand, alternate load path method allows

Chapter 1 Introduction
2
for local damage but seeks to provide alternate load path to ensure that the major
damage is averted. Due to the inability to determine the exact nature and magnitude of
the attack and the need to put to use the reserve capacity of the structure, the alternate
load path which is a treat independent approach is mostly preferred to the specific local
resistance method. Accordingly, a number of studies on progressive collapse of RC
assemblies based on alternate load path method exist in the literature. Lew et al. (2014)
investigated the behaviour of laterally restraint beam-column RC assemblies using a
full-scale testing. The effect of parameters affecting the compressive arching action
and catenary action was investigated in these studies (Yu & Tan 2013b; Yu & Tan
2013c; Yu & Tan 2013a; Vali et al. 2015; Vesali et al. 2013). In another study,
Albrifkani & Wang (2016) developed a 3D finite element model of RC assemblies
which can be used to assess progressive collapse.
From the review of studies on progressive collapse of laterally restraint RC assemblies,
the load path that exists includes flexural, compressive arching action and catenary
action. Accurate assessment of the progressive collapse potential of a structure
therefore requires that all load paths be taken into consideration. GSA (2013)
recommend linear static, nonlinear static and nonlinear dynamic analysis procedure
for assessing progressive collapse potential of structures based on alternate load path
method.
Of the three methods of analysis, nonlinear dynamic analysis approach is considered
as the most accurate; but nonlinear dynamic analysis method may be too cumbersome
for a routine use. For a simplified analysis of progressive collapse, the nonlinear static
method may be used. However, the accuracy of this method depends on the accurate
determination of the load-displacement behaviour (resistance function) of the critical
assembly, and this includes capturing the key damage events that may occur during
the course of response, such as strength degradation due to failure of weld in steel
structures and rupture of rebar in RC assemblies.
This thesis therefore aims to develop a sufficiently accurate and sound mechanics-
based theoretical model framework to determine the resistance function of beams
assemblies under a column loss scenario. The resistance functions so determined can
Chapter 1 Introduction
3
be used for quick assessment of progressive collapse potential in existing and new
buildings.
1.2 Objectives of study
The main objective of this research are as follows:
To collate and analyse different experimental studies on arching compression
action in RC beams available in the literature. Based on the collated data,
investigate the different effect of parameters such as reinforcement ratio,
concrete strength, axial restraint and span-depth ratio on the arching capacity
of RC beams. With an informed understanding of the aforementioned
parameters, formulate an empirical expression that can quantify the arching
effect and compare the predictions with experimental results.
To develop analytical model for predicting the complete load-displacement
behaviour (resistance function) in axially restrained RC beam assemblies, with
a particular focus on the resistance within the arching effective regime. The
theoretical model is formulated by considering the compounding effect of
bending and arching deformation modes and an equivalent plastic zone length.
To develop an analytical model for the prediction of load-displacement
behaviour (resistance function) within the catenary stage, with a particular
focus on the representation of strength degradation due to partial failure in
critical regions. Application of the proposed model in steel and RC assemblies
and the conditions for the activation of the strength degradation are covered.
To apply the developed framework in the analysis of progressive collapse
behaviour of RC frame assemblies. This is achieved by predicting the complete
load-displacement behaviour (resistance function) of the RC assemblies using
the analytical models for compressive arching and catenary actions developed
in this study.

Chapter 1 Introduction
4
To investigate the behaviour of different RC beam assemblies under
progressive collapse by converting the resistance function into pseudo dynamic
curves based on the energy principle.
1.3 Scope of work
The research in this study only considers beams located at the middle of periphery
frame structures without the consideration of slab contribution. More so the
contribution from transverse beams are not considered. In developing the model for
the compressive arching and catenary action, no loading rate effect is considered;
however, such effect may be easily incorporated into the analysis method developed
in this study using rate-sensitive material properties.
1.4 Organisation of the thesis
There are total of eight chapters in this thesis.
Chapter 2 presents a general review of studies in the area of progressive collapse. Code
provisions for assessing progressive collapse are also explained with particular focus
on the alternate load path method. Experimental tests on RC assemblies and frames
are reviewed including their behaviour and deformation patterns up to collapse.
Finally, a review of existing analytical models on compressive arching action is
presented and gaps in the existing studies are highlighted.
Chapter 3 presents the evaluation of arching action and the effect of span-depth ratio,
reinforcement ratio, concrete compressive strength and axial restraint stiffness on the
normalised arching capacity. Critical scrutiny of each of the parameters mentioned
above is presented. A semi-empirical model is formulated to predict the effect of the
parameters on arching compression, and predictions from the model are compared with
relevant experimental tests.

Chapter 1 Introduction
5
Chapter 4 presents a numerical modelling framework for the progressive collapse of
RC frame assemblies. Issues commonly encountered in the finite element modelling
of RC beams in large deformations are discussed and possible ways of avoiding these
issues are presented. The modelling framework is validated with experimental test
results.
Chapter 5 presents a theoretical model for compressive arching action by considering
the compounding effect of arching and bending deformation modes. The contribution
from bending and arching from the deformation and force point of view are discussed.
Chapter 6 shows the development of a theoretical model for catenary action in axially
restraint beam considering strength degradation. The application of the model to beam
assemblies involving partial local failure is also discussed.
In Chapter 7, the progressive collapse behaviour of a typical RC frame based on two
representative designs is investigated using the developed framework in previous
chapters. Comparison of the results with a nonlinear dynamic analysis of the RC frame
assemblies is also presented.
In Chapter 8, a summary of the main conclusions from the research is presented and
scope for further research is recommended.

Chapter 1 Introduction
6

Chapter 2 Literature review
7
Chapter 2: Literature review
2.1 Introduction
Research in the field of progressive collapse dates back to the 1960’s after the Ronan
Point apartment collapse due to gas explosion. Since that unfortunate incident, effort
has been geared towards preventing progressive collapse or reducing the extent of
damage in the event of extreme attack on the buildings structures. As a result of
extensive research, a large body of knowledge on progressive collapse of reinforced
and steel structures exist in the literature.
The review herein is focused on studies relevant to the progressive collapse of RC
structures. In particular, code provisions and design guidelines aimed at reducing
collapse are reviewed with a further focus on the Alternate Load Path Method (ALP),
to which the theme of this study is closely related. Following that, a review of
experimental studies on RC structures and subassemblies are presented to provide an
in-depth understanding of the factors affecting the compressive arching action in a
laterally restrained RC structure and subsequent process through the catenary stage
leading up to the final failure modes. Lastly, the current state of analytical models on
compressive arching action and catenary action is reviewed and discussed.
2.2 Definition of key terminologies
2.2.1 Progressive collapse
Progressive collapse occurs when a local failure of a structural member caused the
adjoining members to collapse leading to additional collapse (GSA 2003). In most
cases, the damage level is disproportionate to the original cause hence it is sometimes
referred to as disproportionate collapse. For instance, if the failure of one column leads
to the collapse of the entire building, then the initial cause is disproportionate to the
final failure.

Chapter 2 Literature review
8
2.2.2 Robustness
According to General Service Administration (2003) Robustness is the defined as:
‘‘Ability of a structure or structural component to resists damage without premature
and/or brittle failure due to events like explosions, impacts, fire or consequences of
human error, due to its vigorous strength and toughness’’
From the above definition, it can be said that robustness is an inherent property of the
structure and it depends on the structural design and detailing considerations. Thus, in
an unforeseen extreme action, a robust structure is more likely to resist progressive
collapse compared to a less robust structure.
2.3 Defining cases of progressive collapse
There has been a number of collapse cases in the world. According to Taylor (1975),
about 110 collapse events was recorded in USA between 1968 and 1971. Of these
number, 22 were termed to be progressive in nature. In Canada, the number of collapse
cases between 1962 and 1971 was 495 out of which 72 was considered as progressive
collapse. This section only seeks to review a notable number of collapse event in
history.
2.3.1 Ronan point apartment building in London
In May 1968, a match was lit on the 18th floor of a 22-story Ronan Point apartment
building. This led to gas explosion which damaged the walls of the apartment. The
floor and walls of the building were made of precast concrete panels. The partial
collapse of the building was triggered by the damage of the precast panel wall of the
directly affected part and the failure of the load bearing walls at the corner of the
building.
The failure of the load bearing wall at the 18th floor caused the collapse of floors above
and beneath the affected floor as shown in Figure 2.1. It could be said that the collapse
was progressive in nature or disproportionate to the original cause as it initiated on the

Chapter 2 Literature review
9
18th floor and subsequently spread to other floors. Prior to the Ronan point building
collapse, there was no code provisions against progressive collapse and existing design
code at a time only accounted for gravity loading. The Ronan point building collapse
was a wakeup call on the need for buildings to be adequately protected against collapse
in the event of unforeseen extreme event and this led to the modification of national
codes in the UK and other part of the world.
Figure 2.1: Ronan point apartment building after collapse
2.3.2 Murrah building located in Oklahoma City, USA
In the early hours of April 19, 1995 a truck loaded with bomb parked near the Murray
building exploded resulting in many casualties and causing severe damage to the

Chapter 2 Literature review
10
Murray building and other nearby buildings. The truck was parked about 5m metres
away from one of the ground floor columns. The explosion caused the failure of the
column and due to the absent of alternate load path to transfer the additional load
caused by the sudden loss column, the transfer girder collapse causing the failure of
the entire bay supported by the damaged column. Extensive investigation into the
cause of collapse showed that the building could have still collapsed because of the
magnitude of the bomb and the close proximity of the explosion; however, the
presence of alternate load path could have reduced the magnitude of damage (Mlakar,
Sr. et al. 1998; Corley et al. 1998). Following the review on the cause of Murray
Building collapse, Osteraas (2006) noted that a robust structure should (1) possess a
three dimensional space frame which is able to connect all load path and also have a
redundant load path. (2) possess mechanical fuse such that failure of slabs and wall
will not result in the failure of the frame (3) have adequate ductility to bear overload
and (4) the perimeter columns should be purposefully designed against blast.
Figure 2.2: North side of Murray building after collapse (Hinman & Hammond 1997)
2.3.3 Pentagon building located in Virginia, USA
The most catastrophic collapse in history occurred on September 11, 2001. At about
9:38am, a Boeing 757 aircraft flew into the first storey of the Pentagon building.

Chapter 2 Literature review
11
Following the impact, fire engulf the part of the buildings which directly came in
contact with the plane (Figure 2.3). The initial impact damaged about 30 first floor
columns and significantly affected 20 other columns. In addition to the damage on the
ground floor, about six columns at the second-floor were also destroyed and 30 more
columns were affected (Mlakar et al. 2003b). It was reported that despite the damage
caused by the initial impact, the building was able to resist collapse and subsequent
collapse was due to the fire that engulf the building (Mlakar et al. 2003b; Mlakar et al.
2005b; Mlakar et al. 2003a; Mlakar et al. 2005a). The reason for the good performance
of the structure against the initial impact was attributed to (Mlakar et al. 2003b):
Availability of redundant and additional load path for the beams and girder
Exterior wall of the building acted as a transfer girder.
The warehouse was design for a live load well in excess of its service load.
The use of spiral reinforcement in column increase the residual capacity of
the column after initial damage.
Short spacing of columns.
Continuity of bottom reinforcement through the support.
Exterior wall acted as a transfer girder

Chapter 2 Literature review
12
Figure 2.3: Collapse area of the Pentagon building (Mlakar et al. 2003a)
2.4 Code and design guidelines against progressive collapse
Following the Ronan point collapse in 1968, different approaches to prevent
progressive collapse have gradually been incorporated in design codes and guidelines.
Most of the design codes adopt the implicit approach by specifying tying requirements
without any explicit assessment.
In ACI 318-05 and commentary (ACI 318M-05), it is recommended that a structure
be designed to possess structural integrity through provision of vertical, horizontal and
transverse ties around the perimeter of the structure without any explicit procedure to
assess the potential of collapse. The code further recommends using continuous
reinforcement through the support within the critical section. In cases where
reinforcement are lapped, the use of adequate splice length and provision of adequate
hooks at the splice termination points are advised.

Chapter 2 Literature review
13
Eurocode 1 (CEN 2006) also adopt the descriptive tied force method. For public
buildings such as hotels, offices not exceeding four (4) storeys, the code recommends
provision of effective horizontal ties only. For buildings such as hotel greater than (4)
storeys or hospitals greater than 3 storeys but less than 15 storeys, Eurocode requires
horizontal internal ties to be provided in orthogonal directions at each floor level and
the periphery of the buildings. In the vertical direction, each column or wall should be
tied from the roof level to the foundation. For frame buildings, the columns and walls
should be designed to resist accidental load which is the greater of design permanent
load and variable load reaction applied to the column from a single storey. In addition,
a notional column removal by one column at a time is also recommended by the code,
however the column removal procedure is not explicitly stated.
Unlike in Eurocode and ACI 318 code, the ASCE code (ASCE 7-10) does not provide
any prescriptive design requirement for progressive collapse, rather it requires removal
of selected load bearing members one at a time and assessing the capacity of the
remaining structure. The recommended load combination for the assessment is:
SLD 2.05.0)2.1or 9.0( (2.1)
where D is the dead load, L is the live load and S is the snow load.
The General Service Administration and Department of Defence provide detailed
procedure for assessing progressive collapse in new and existing buildings. While UFC
4-023-03 (DoD 2010) recommends both indirect and direct approach depending on the
occupancy category, GSA (2013) only recommends the direct method based on the
alternate load path method.
In UFC 4-023-03 (DoD 2010) building structures are classified into four occupancy
categories. For occupancy I, no specific requirement is needed. For category 2 and
above, assessment of progressive collapse of the structure after removal of specified
columns are to be performed using alternate load path method. Similar classification
is used in GSA (2013), where buildings to be assessed are grouped based on their
Facility Security Levels (FSL). For low occupancy and low risk level buildings (FSL

Chapter 2 Literature review
14
I and II), no checks are required and buildings in this group are exempted from further
checks for progressive collapse. For buildings with four storeys or more (FSL III, IV,
and V), assessment using alternate load path method is recommended. The alternate
load path method requires that a vertical load bearing member be notionally removed
and the structure analysed to ascertain if it can bridge over the removed member. The
location of the vertical members (columns) to be removed for internal and external
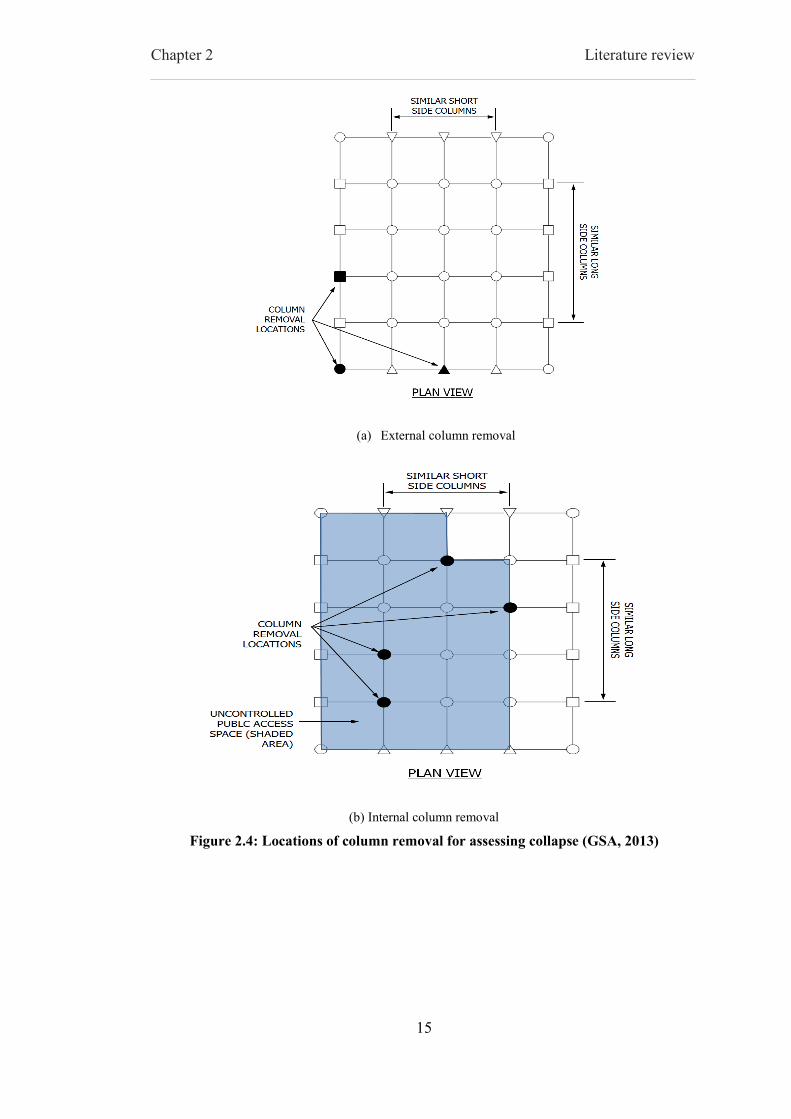
columns are shown in Figure 2.4.
Linear elastic, nonlinear static and nonlinear analysis procedures are recommended for
use with the alternate load path method in both GSA (2013) and UFC 4-023-03 (DoD
2010) and the load combination for the different types of analysis is shown in Equation
2.2.
dynamic nonlinear for )2.0 5.0(2.1
static nonlinear for )]2.0 5.0(2.1[
staticlinear for )]5.0 5.0(2.1[
SorLDG
SorLDG
SorLDG
ND
NN
LLD
(2.2)
where GLD, GN and GND are the increased gravity loading for deformation-controlled
actions for linear static, nonlinear static and nonlinear dynamic analysis respectively.
D, L and S are the dead, live and snow load respectively. L and N are the load
increase factors for linear static and dynamic increase factor for nonlinear static
analysis respectively.
Chapter 2 Literature review
15
(a) External column removal
(b) Internal column removal
Figure 2.4: Locations of column removal for assessing collapse (GSA, 2013)

Chapter 2 Literature review
16
2.5 Experimental studies on progressive collapse
Experimental studies on progressive collapse can be investigated at the entire building
level, frame level or sub-assembly level. For the sub-assembly level investigation, only
the bay of the removed column is considered and effect of the indirectly affected part
on the loss column is simulated using flexible axial restraint. For the present study,
only review at the frame level and subassembly level is discussed. Experimental
studies on RC frame structures
Yi et al. (2008) investigated the behaviour of a four bay three storey reduced scale RC
frame subjected to downward displacement of the middle column. The experiment was
aimed at understanding the progressive collapse of RC frame without a ground floor
column. The axial force of the first and second floor columns calculated as 109KN
was applied to the middle column through servo-hydraulic actuator as shown in Figure
2.5. The ground floor column consisted of a two-mechanical jack stacked together.
During the test, the mechanical jack was gradually unloaded to simulate the loss of
middle column.
Figure 2.5: Test RC frame detail (Yi et al. 2008)

Chapter 2 Literature review
17
The load displacement response indicated that the RC frame went through four
response stages during the test (see Figure 2.6). These included elastic, elasto-plastic,
plastic and catenary action stages. The elastic stage began from the start of unloading
until crack initiated at the tensile zone of the critical section (point A). This was
followed by the elastic plastic part which ended with the formation of plastic hinges
(point B). Between point B and C, the beam behaved in a plastic manner and at point
C catenary action started until rupture of the bottom rebar at the ground floor beam-
column interface which marked the collapse of the RC frame. It was concluded that
the frame did not collapse under its self-weight.
Figure 2.6: Load versus unloading displacement of the middle column (Yi et al. 2008)
In another study, Stinger & Orton (2013) investigated the contribution of compressive
action, Vierendeel action and infill action to the collapse resistance of RC frames. The
tested specimen was one quarter of a two-bay, two-story prototype building designed
according to the ACI 318 requirement. Three different specimens were tested in their
study. The first specimen represented a typical existing building without continuous
bottom reinforcement at the location of the removed column. The second specimen
had continuous reinforcement passing through the location of the removed column and
the third specimen was designed with an infill wall. Reaction frames were used at the

Chapter 2 Literature review
18
end to simulate restraint provided by other part of the building. Figure 2.7 shows the
tested RC frame and the reinforcement arrangement. Displacement control loading
was applied through an actuator at the middle column location until the frame collapse.
The result indicated that compressive arching action occurred at a smaller
displacement. After the attainment of maximum compressive arching action, crushing
of concrete occurred at the middle and end beam-column interface until catenary action
started at middle column displacement of about one-beam depth. The load-
displacement response shows that catenary action developed in both specimens with
and without bottom reinforcement and final failure was due to the rupture of bottom
rebar.
Figure 2.7: Reinforcement arrangement of tested specimen (Stinger & Orton 2013)

Chapter 2 Literature review
19
Figure 2.8: Vertical load-displacement relationship for the specimen (Stinger & Orton
2013)
2.5.1 Studies on RC subassemblies
Su et al. (2009) conducted series of tests on twelve RC beam-column sub assemblages
to investigate the capacity of compressive arching action in axially restrained beam.
Variables investigated in the test were reinforcement ratio, span-depth ratio and
loading rate. Each of the tested beam consisted of a two-bay beam and three column
stubs simulating middle column removal. Three span-depth ratios of 4.08, 6.12 and
9.08 were used and reinforcement ratio ranged between 0.55 to 1.3% representing light
to moderately reinforced section.
The end columns were both connected to a steel socket which was further connected
to a rigid support to achieve the axial and rotational restraint. To avoid rotation of the
middle column, two roller bearings were placed at each face close to the middle
column. The middle column was subjected to displacement controlled loading until
the beam collapse.
The result showed that the ultimate strengths of the specimens were greater than the
flexural capacities implying that compressive forces developed due to the axial
restraint at the end columns and this helped increase the load capacity. The capacity of
0
5
10
15
20
25
30
35
40
0 100 200 300 400 500
Ver
tica
l lo
ad (
KN
)
Displacement (mm)
dicontinuous frame
continuous frame
infill wall
Peak flexural action
Peak compressive arch action
Peak catenary action

Chapter 2 Literature review
20
compressive arching action was between 50 to 160% greater than the flexural capacity
of beam calculated without considering the presence of axial restraint. After the
maximum compressive action capacity was reached, with further deflection, concrete
crushed at the end and middle beam column interface. This was accompanied by
reduction in the applied load until the load started to increase again due to catenary
action.
It was observed that compressive arching capacity increases with decreases in
reinforcement ratio in specimens with symmetrical and unsymmetrical reinforcement
arrangements (see Figure 2.9). This is because the compressive depth for arching
depends on the compressive depth used up for yielding of tensile rebar. Thus, the
higher the tensile reinforcement, the higher the compressive depth required for tensile
rebar yielding and the lower the depth left for arching.
It was further noticed that specimen with low span-depth ratio gave a higher
compressive arching capacity than beams with large span-depth ratio. Specimens with
low span-depth ratio are more susceptible to concrete crushing than specimen with
larger span-depth ratio (see Figure 2.10)
Although the investigation was targeted at studying the compressive arching
behaviour, catenary action kicked in when the axial force changed from negative to
positive. In all tested specimens, failure was due to rupture of bottom rebar at the
interface between the beam and middle column stab.

Chapter 2 Literature review
21
(a) symmetrical reinforcement
(b) unsymmetrical reinforcement
Figure 2.9: Effect of reinforcement ratio on compressive arching action in RC
subassemblies (Su et al. 2009)
-400
-300
-200
-100
0
100
200
300
400
0 0.1 0.2 0.3 0.4 0.5 0.6 0.7 0.8
Ho
rizo
nta
l rea
ctio
n (
KN
)
Ver
tica
l rea
ctio
n (
KN
)
Centre displacement/beam depth (δ/h)
rho=rho'=0.55%
rho=rho'=0.83%
rho=rho'=1.13%
-400
-300
-200
-100
0
100
200
300
400
0 0.2 0.4 0.6 0.8 1
Ho
rizo
nta
l rea
ctio
n (
KN
)
V
erti
cal r
eact
ion
(KN
)
Centre displacement/beam depth (δ/h)
rho=0.38%, rho'=0.55%
rho=0.55%, rho'=0.83%
rho=0.75%, rho'=1.13%

Chapter 2 Literature review
22
(a) symmetrical reinforcement
(b) unsymmetrical reinforcement
Figure 2.10: Effect of span-to-depth ratio on compressive arching action in RC
subassemblies (Su et al. 2009)
Sasani & Kropelnicki (2008) investigated the behaviour of a 3/8 scaled model of a
perimeter reinforced concrete frame structure. The tested beam had a depth of 7.5
inches (190.5mm) with clear span of 65.25inches (1657.4mm) between the edge and
centre column. Reinforcement was made of Grade 500MPa and concrete compressive
-400
-300
-200
-100
0
100
200
300
400
0 0.2 0.4 0.6 0.8 1 1.2 1.4
Ho
rizo
nta
l rea
ctio
n (
KN
)
Ver
tica
l rea
ctio
n (
KN
)
Centre displacement/beam depth (δ/h)
L/h=4.08
L/h=6.58
L/h=9.08
-250
-200
-150
-100
-50
0
50
100
150
200
250
0 0.2 0.4 0.6 0.8 1 1.2 1.4 1.6
Ho
rizo
nta
l rea
ctio
n (
KN
)
Ver
tica
l lo
ad (K
N)
Centre displacement /beam depth (δ/h)
L/h=4.08
L/h=9.08

Chapter 2 Literature review
23
strength was 41MPa. The reinforcement arrangement of the tested beam is shown in
Figure 2.12. Loading was applied on the middle column in a displacement controlled
manner devoid of any dynamic effect.
Figure 2.11: Reinforcement detailing of tested beam (Sasani and Kropelnicki, 2008)
The result in Figure 2.12 indicated that with increasing loading, bottom rebar at the
middle beam-column interface ruptured. After the rupture of bottom rebar, tensile
force in the top rebar caused catenary action to develop. Although the longitudinal
reinforcement within the middle column was lap spliced, there was no splice failure in
the test. This was attributed to the use of splice type B which is 1.3 times longer than
splice type A as per ACI 318 code.

Chapter 2 Literature review
24
Figure 2.12: Load-middle column displacement relationship (Sasani and Kropelnicki,
2008)
Eight specimens were tested to determine if CFRP material can provide continuity and
help prevent progressive collapse in RC frame bridging over a lost column (Orton,
2007). Two of these specimens were made of RC with no CFRP retrofitting. One of
the non-retrofitted specimens had discontinuous bottom reinforcement while the other
had continuous reinforcement at the middle column (column removal point).
The result showed that catenary action developed in both specimens with and without
continuous reinforcement. The development of catenary action in the specimen with
discontinuous bottom rebar was attributed to the transfer of tensile forces from the
positive moment through the stirrups to the negative moment (Figure 2.13).
0
10
20
30
40
50
60
70
80
0 100 200 300 400 500
Forc
e (K
N)
Vertical displacement (mm)

Chapter 2 Literature review
25
(a) discontinuous reinforcement
(b) continuous reinforcement
Figure 2.13: Vertical and axial load against middle column displacement for RC
specimens (Orton 2007)
Yu and Tan (2013a) investigated the effect of seismic and non-seismic detailing on the
behaviour of RC beam column sub-assemblage bridging over a removed column. The
prototype frame was part of a 5-storey commercial building designed in accordance
-40
-20
0
20
40
60
80
-20
-15
-10
-5
0
5
10
15
20
25
30
0 100 200 300 400 500 600 700 Axi
al lo
ad (
KN
)
Ver
tica
l lo
ad p
er p
oin
t (K
N)
Centre displacement (mm)
Vertical load (KN)
Axial load (KN)
-40
-30
-20
-10
0
10
20
30
40
50
60
70
-20
-15
-10
-5
0
5
10
15
20
25
30
0 100 200 300 400 500 600 Axi
al lo
ad (
KN
)
Ver
tica
l lo
ad p
er p
oin
t (K
N)
Centre displacement (mm)
Vertical load (KN)
Axial load (KN)

Chapter 2 Literature review
26
with the ACI 318-05 code. One-half scaled version of the prototype frame consisting
of two beams and three column stubs was used for the experiment. The end columns
were larger than the middle column to avoid damage. One end of the column was
connected to a steel frame and the other end was connected to a reaction wall to
simulate axial restraint by the surrounding structure. The end columns were supported
in the vertical direction by a pin support placed on three steel rollers. Load was applied
to the specimen by pushing the middle column in a displacement controlled manner
with the help of the actuator.
The load-displacement characterisation of the seismic and non-seismic detailing
specimen was similar and the advantage of seismic detailing was not noticed (Figure
2.14). The maximum compressive arching capacity were 20 and 30% higher than the
flexural capacity for specimen with seismic and non-seismic detailing. With further
loading catenary action kicked in at a displacement of 300mm when axial force
changed from negative to positive. For specimen with seismic detailing, at catenary
action stage the first bottom bar ruptured at the middle column joint interface. This
was followed by rupture of the second bottom bar leaving the section with only top
bars. Final failure occurred after the rupture of top bars at one of the end joint interface.
Similar observation was made for specimen with non-seismic detailing.
(a) applied load-displacement response
0
10
20
30
40
50
60
70
80
0 100 200 300 400 500 600 700
Ap
plie
d L
oad
(K
N)
Middle joint displacement (mm)
Specimen with seismic detailing
Specimen with non-seismic detaling

Chapter 2 Literature review
27
(b) horizontal force-displacement response
Figure 2.14: Relationship of load- displacement and horizontal force-displacement of
the middle column (Yu & Tan 2013a)
Yu & Tan (2013b) further performed a parametric study on beam-column sub-
assemblies to investigate the effect of reinforcement ratio, span-depth ratio and
reinforcement detailing at joint on the structural behaviour of RC sub assemblage. The
tested specimens were one-half scaled version of prototype RC frames designed
according to ACI 318-05 code provision. Top reinforcement varied from 0.9 and
1.87% at the column position while bottom reinforcement varied from 0.49 to 0.82%.
Span-depth ratio of the specimens ranged from 13.4 to 23 (defined here as total net
length of actually two beams to the section depth). Two of the tested specimens were
lap spliced to study its effect on the development of catenary action. Grade 500 steel
was used for the test and concrete compressive strength was 38MPa. Axial restraint
was provided by a reaction wall on one end of the column and a steel frame at the other
end. Twisting of the centre column at large deformation was prevented by two out-of-
plane restraints at the middle column and load was applied through a hydraulic actuator
with displacement control at 0.1mm/s rate.
Results of the test were considered at structural, sectional and fibre levels. It was
observed that specimen with higher bottom reinforcement ratio had higher structural
resistance with top reinforcement ratio remaining constant. Similarly, with the same
-200
-150
-100
-50
0
50
100
150
200
0 100 200 300 400 500 600 700H
ori
zon
tal r
eact
ion
(K
N)
Middle joint displacement (mm)
Specimen with seismic detailingSpecimen with non-seismic detaling

Chapter 2 Literature review
28
bottom reinforcement ratio, specimens with higher top reinforcement ratio had higher
structural resistance. However, a higher bottom reinforcement ratio was only
beneficial to the structural resistance at initial catenary stage prior to the rupture of
bottom bars whereas a higher top reinforcement ratio was beneficial both at the initial
catenary action where bottom bars ruptured and at the final stage of the catenary action
which was provided by the top reinforcement. Figures 2.15 and 2.16 show effects of
the reinforcement ratio while Figure 2.17 shows the effect of span-depth ratio. All but
one specimen failed by rupture of reinforcement. It can be seen that the test agree well
with findings from Su et al. (2009). The specimen with L/d ratio of 13.4 failed in shear
due to the short span-depth ratio which caused stirrups to fracture at the beam column
interface.
(a) load-middle joint displacement
0
20
40
60
80
100
120
140
0 100 200 300 400 500 600 700 800
Ap
plie
d lo
ad (
KN
)
Middle joint dislacement (mm)
BRR=0.49%
BRR=0.82%
BRR=1.24%

Chapter 2 Literature review
29
(b) horizontal reaction-middle joint displacement
Figure 2.15: Effect of bottom reinforcement ratio on structural behaviour of
subassemblies (Yu and Tan, 2013b)
(a) load-middle joint displacement
-300
-200
-100
0
100
200
300
0 100 200 300 400 500 600 700 800H
ori
zon
tal r
eact
ion
(K
N)
Middle joint dislacement (mm)
BRR=0.49%
BRR=0.82%
BRR=1.24%
0
20
40
60
80
100
120
140
160
0 100 200 300 400 500 600 700 800
Ap
plie
d lo
ad (
KN
)
Middle joint dislacement (mm)
TRR=1.24%
TRR=1.87%

Chapter 2 Literature review
30
(b) horizontal reaction-middle joint displacement
Figure 2.16: Effect of top reinforcement ratio on structural behaviour of subassemblies
(Yu and Tan, 2013b)
(a) load-middle joint displacement
-300
-200
-100
0
100
200
300
400
0 100 200 300 400 500 600 700 800
Ho
rizo
nta
l rea
ctio
n (
KN
)
Middle joint dislacement (mm)
TRR=1.24%
TRR=1.87%
0
20
40
60
80
100
120
140
0 100 200 300 400 500 600 700
Ap
plie
d lo
ad (
KN
)
Middle joint dislacement (mm)
L/h=13.4
L/h=18.2
L/h=23

Chapter 2 Literature review
31
(b) horizontal reaction-middle joint displacement
Figure 2.17: Effect of span-depth ratio on structural behaviour of subassemblies (Yu
and Tan, 2013b)
In a study to investigate the effect of seismic design and detailing on progressive
collapse of RC structures, two reinforced concrete sub-assemblies were tested (Lew et
al. 2011). The two assemblies were part of a 10-storey building designed according to
the codes from American Concrete Institute (ACI 318-02), American Society of
Engineers (ASCE 2002) and International Code Council (ICC 2003). One of the sub-
assemblies was designed for Seismic Design Category C and the other was designed
for Seismic Design Category D. For the seismic design Category C, Intermediate
Moment Frame (IMF) was used while Special Moment Frame was used for the
Seismic Category D.
The IMF specimen had a beam size of 508 by 711mm (height by width) and
reinforcement consisted of 4no. Ф25mm (0.65%) top bars and 2no. Ф29mm (0.43%)
bottom bars at the support section. For the SMF specimen, the beam size was 660 by
864mm and reinforcement at the support were 7no. Ф25mm (0.69%) for top and 6no.
Ф25mm (0.59%) for bottom section. The geometric and reinforcement detail for IMF
specimen is shown in Figure 2.18. The load was applied to the middle column using a
displacement controlled approach.
-300
-200
-100
0
100
200
300
0 100 200 300 400 500 600 700
Ho
rizo
nta
l rea
ctio
n (
KN
)
Middle joint dislacement (mm)
L/h=13.4
L/h=18.2
L/h=23

Chapter 2 Literature review
32
Figure 2.18: Geometric and reinforcement details for IMF specimen (Lew et al. 2014)
Figure 2.19 shows the middle column load versus displacement relationship of the two
specimens. The behaviour and failure modes of both specimens were similar. With
increasing loading, flexural cracks formed at the end and middle column interface. The
authors noted that these cracks were more uniform throughout the length of the beam
when the beam entered into catenary action stage which implies that the beam was in
tension. In both specimens, the final failure load was greater than the maximum
compressive arching action capacity and rotation at fracture of bottom rebar was 0.18
and 0.2 for IMF and SMF specimens respectively.

Chapter 2 Literature review
33
Figure 2.19: Vertical load against centre column displacement of tested specimens
(Sadek et al. 2011)
2.6 Parameters affecting compressive arching action in axially
restrained reinforced concrete beams
The experimental test in Section 2.5 shows that compressive arching action capacity
is affected by reinforcement ratio, span depth ratio, axial restraint and concrete
compressive strength. In this section, the review of the effect of each of these
parameters are presented.
2.6.1 Effect of axial restraint on compressive arching action capacity
The influence of axial restraint on compressive arching action (CAA) capacity was
studied in Yu & Tan (2014) using a theoretical model. In their study, a non-
dimensional relative axial stiffness ( a ) was used to study the axial restraint stiffness
effect on CAA capacity and it was defined as:
tc
a
aLAE
K
/)( (2.3)
0
200
400
600
800
1000
1200
1400
0 200 400 600 800 1000 1200 1400
Ver
tica
l lo
ad (
KN
)
Vertical displacement of centre column (mm)
IMF specimen
SMF specimen

Chapter 2 Literature review
34
where Ka is the axial restraint stiffness, Ec is the elastic modulus of concrete, A is the
cross-sectional area and Lt is the total net length of the double-span beam and the
middle column stub. Three different specimens were used for this purpose. These
included specimen A5 from test by Su et al. (2009) and specimen S5 and S7 from tests
by Yu & Tan (2013). It should be mentioned that the three specimens considered in
their investigation had different geometrical and reinforcement properties.
For each of the specimens considered, the axial restraint stiffness (Ka) was varied while
other parameters were kept constant. Their result showed that a larger axial stiffness
(Ka) increases the CAA capacity when 1a , whereas for a strong axial restraint
( 1a ), further increase of the axial stiffness (Ka) only has a marginal effect on CAA
capacity. Their classification of weak and strong restraint was based on the lower rate
of increase in CAA capacity for 1a compared to when 1a as can be observed in
Figure 2.20.
The same trend was observed in all three specimens considered, however the increase
in CAA was more pronounced in specimen A5 compared to specimens S5 and S7.
This was attributed to the short L/d ratio of specimen A5 compared to other two
specimens. They suggested that CAA capacity should only be considered as one of the
load path for resisting progressive collapse, when there is a strong axial restraint which
was defined in their study as 1a .

Chapter 2 Literature review
35
Figure 2.20: Effect of axial restraint stiffness on normalized CAA capacity (Yu & Tan
2014)
2.6.2 Effect of reinforcement ratio on compressive arching action capacity
In separate studies, Su et al. (2009) and Yu and Tan (2013) investigated the effect of
reinforcement ratio on compressive arching action (CAA) capacity. Both studies were
performed by varying the bottom reinforcement while keeping the top reinforcement
constant and in turn varying the top reinforcement while keeping the bottom
reinforcement constant. Yu and Tan (2013) reported from their findings that increase
in bottom reinforcement reduces the normalized CAA capacity. The same trend was
also observed when the top reinforcement was varied. Similar findings were made in
the test by Su et al. (2009). In the case of Su et al. (2009), the tensile reinforcement
ratio at the middle and end sections were used to investigate the effect of reinforcement
on CAA capacity. They concluded that when the reinforcement ratio decreased from
1.13 to 0.46%, the normalized increase in load increased linearly from 1.91 to 2.63.
Yu and Tan (2013) also arrive at the conclusion that increase in reinforcement ratio
decreases the CAA capacity.

Chapter 2 Literature review
36
The reinforcement ratio effect on CAA capacity was investigated in a more elaborate
detail in Yu and Tan (2014) using analytical model on compressive arching action. In
the study, the effect of reinforcement ratio and concrete strength was defined using a
single non-dimensional factor ω defined as:
c
y
f
f (2.4)
Where is the sectional reinforcement ratio in the RC beam. fy is the yield strength of
reinforcement and fc is the compressive strength of concrete. The choice of the use of
sectional reinforcement ratio stems from the fact that during the arching action stage,
the bottom reinforcement at the middle joint and the top reinforcement at the end
section are in tension, Hence the total tension reinforcement in the beam can well be
represented using the sectional reinforcement. The reinforcement ratio was varied to
obtain different for a given L/d ratio and the enhancement factor ( ) was
determined in each case. The concrete compressive strength in the study was 38.2MPa
while the yield strength for 10 and 13mm diameter bars were 511 and 494MPa
respectively. Figure 2.21 shows the plot of enhancement ratio ( ) against the arching
mechanical reinforcement ratio ( ). It can be observed that the normalized increase
in load capacity decreases with increase in the reinforcement ratio ( ).

Chapter 2 Literature review
37
Figure 2.21: Effect of reinforcement ratio on enhancement factor for different L/d ratio
(Yu & Tan 2014)
2.6.3 Effect of span depth ratio on compressive arching action capacity
The effect of L/d ratio was investigated in the Su et al. (2009) and Yu & Tan (2013).
In Su et al.(2009), three different L/d ratio including 4.08, 6.58 and 9.08 were
considered. The reinforcement ratios were kept constant in the three specimens
considered although the concrete strength was slightly. Specimen with L/d ratio of
4.08 had concrete strength of 31.2MPa while that of 6.58 and 9.08 were 18.6 and
19.3MPa respectively. In the case of Yu & Tan (2013), three different L/d ratios of
6.2, 8.6 and 11 were used. The concrete compressive strength and reinforcement ratios
were kept constant. Figure 2.22 shows the effect of L/d ratio on the enhancement ratio
( ) in the two existing studies considered. It can be seen from the figure that the
enhancement ratio ranges between 0.49 and 0.89 for L/d ratios of 4.08 to 9.08 in Su et
al. (2009). In Yu & Tan (2013), the difference was slightly lower ranging from 0.33 to
0.43. As mentioned previously, the concrete strength in Su et al. (2009) was not
constant. The difference in concrete strength between specimens with L/d of 4.08 and
the other two specimens may have contributed to higher increase in load capacity in
L/d of 4.08 compared to that of 6.58 and 9.08.
0
0.2
0.4
0.6
0.8
1
1.2
10 15 20 25 30 35 40
α
Mechanical reinforcement ratio ψ (%)
L/d=11
L/d=9.5
L/d=8.5
L/d=7.5
L/d=6.5
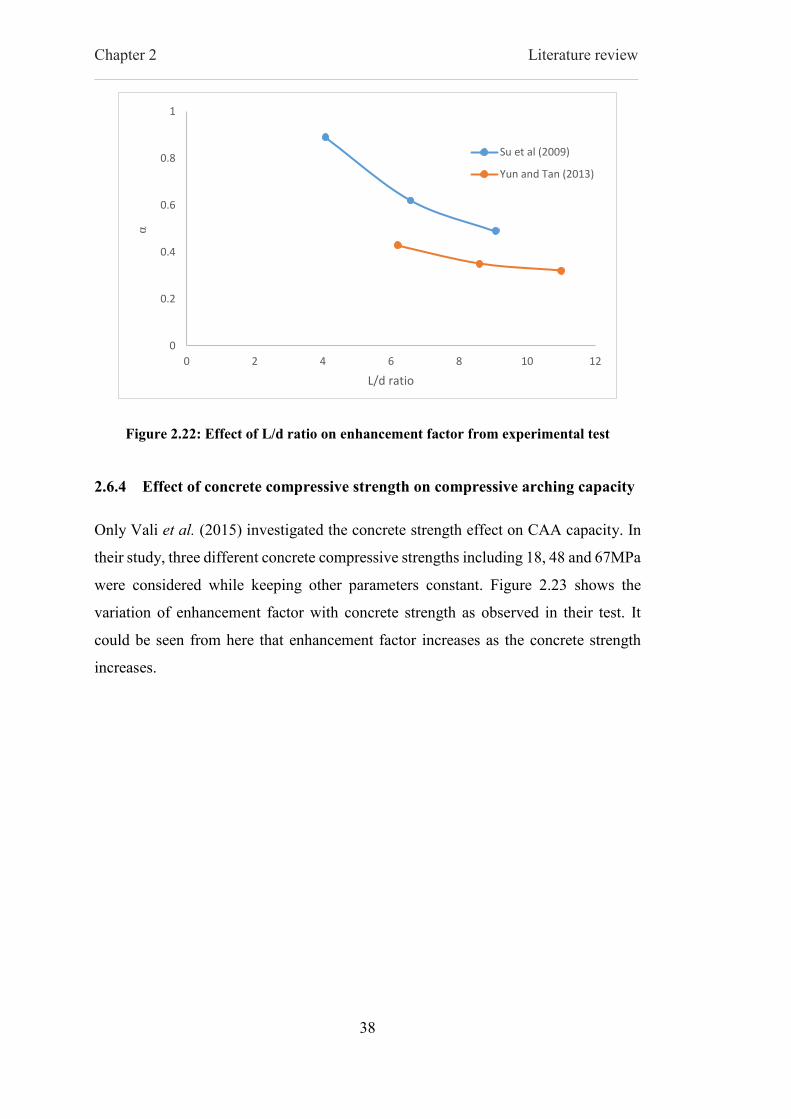
Chapter 2 Literature review
38
Figure 2.22: Effect of L/d ratio on enhancement factor from experimental test
2.6.4 Effect of concrete compressive strength on compressive arching capacity
Only Vali et al. (2015) investigated the concrete strength effect on CAA capacity. In
their study, three different concrete compressive strengths including 18, 48 and 67MPa
were considered while keeping other parameters constant. Figure 2.23 shows the
variation of enhancement factor with concrete strength as observed in their test. It
could be seen from here that enhancement factor increases as the concrete strength
increases.
0
0.2
0.4
0.6
0.8
1
0 2 4 6 8 10 12
α
L/d ratio
Su et al (2009)
Yun and Tan (2013)

Chapter 2 Literature review
39
Figure 2.23: Effect of concrete strength on enhancement factor (Vali et al. 2015)
2.7 Analytical studies
The analytical studies on axially restrained beams can be classified into two groups:
a) compressive arching action, and b) catenary action. In this section, the selected
analytical studies for compressive arching action and catenary action are reviewed and
the underlying assumption and limitations are also discussed.
2.7.1 Analytical studies on compressive arching action
In the 1950’s, experimental studies on one-way and two-way RC slabs showed that
the maximum load was greater than the capacity calculated by yield line theory
(Christiansen 1963; Park 1964; Wood 1961). This increase in load capacity compared
to the flexural capacity was attributed to the development of compressive membrane
action in the slab. Since then a number of analytical studies to predict the capacity of
axially restrained RC slabs and beams have been performed.
Christiansen (1963) developed an analytical model for the prediction of the ultimate
strength of laterally restraint one-way RC slabs and beams. In his study, the ultimate
strength was considered to comprise of bending and membrane stresses. The bending
0
0.1
0.2
0.3
0.4
0.5
0.6
0.7
0.8
0.9
0 10 20 30 40 50 60 70 80
α
Concrete strength (MPa)
3No 10mm top bar
2No. 10mm top bar

Chapter 2 Literature review
40
capacity was determined using the yield line theory. For the arching contribution, the
depth available for arching was determined by equating the outward movement of the
end support with the extension of beam due to rotation minus the elastic and plastic
shortenings of one-half of the beam. This is expressed mathematically as:
cf
CTTha
)2( 211
(2.5)
where a1 is the depth available for arching, h is the depth of beam. T1 and T2 are the
tensile force for per unit width in the tensile reinforcement at the support and middle
section and C is the additional compressive force per unit width due to arching. These
parameters are represented schematically in Figure 2.24. The analytical model
prediction correlated well with the experimental test result. However, the mid-span
deflection at maximum compressive membrane force in the model was less than
observed in the experiment. This discrepancy was attributed to the additional bending
that occurred close to the hinges which was due to the increased compression.
Figure 2.24: Horizontal forces at support and mid-span (Christiansen 1963)
By treating the contribution from bending and arching similar to Christian’s approach,
Rankin and Long (1997) developed analytical model for the determination of
maximum compressive arching action capacity in laterally restrained slab. The study
was based on McDowell’s research work in a laterally restrained masonry walls
fc
C/fc
a1
Support section Middle section
T2/fc
C/fc
T1/fc
fc
T2
T1
a
h

Chapter 2 Literature review
41
(McDowell, 1956). By adopting the stress distribution from McDowell’s work, the
arching moment of resistance was determined for elastic and elastic-plastic cases. The
flexible boundary condition was taken into consideration by considering equilibrium
between a rigid beam and equivalent three-hinge arches with axial stiffness (Ka).
It should however be noted that both Christiansen (1963) and Rankin & Long (1997)
treat the bending and arching deformation separately. In reality, arching and bending
coexist in the beam and deformation compatibility needs to be fulfilled. More so
Rankin model was developed for slab and did not take into consideration the
compressive reinforcement which may affect the arching capacity in a laterally
restrained RC beam.
Rankin and Long (1997) developed a theoretical model to predict the compressive
arching action in slabs using the theory of McDowell et al (1956). The idealised
geometry of the slab is shown in Figure 2.25.
Figure 2.25: Plan and elevation view of RC assemblages with idealised geometry for
half span laterally restrained slab after McDowell et al (1956) (Rankin & Long 1997b)
In McDowell et al (1956), the moment ratio (Mr) for elastic and elastic-plastic stress
distribution was given as:
2
21
4
51
3
8
uu
R
uM r
for elastic stress distribution (2.6)
1d
F
F
y
wydLever 12
1d
y
w
12 d
Lr

Chapter 2 Literature review
42
2
22
32
4
3
214
u
Ru
uRM r
for elastic-plastic stress distribution (2.7)
where R and u are non-dimensional parameters defined as:
2
1
2
4d
LR c
(2.8)
12d
wu (2.9)
Differentiating Equation (2.6) and (2.7) resulted in:
083220 2 uu (2.10)
083220 2 uu (2.11)
The deflection corresponding to the maximum arching action is determined for the
elastic stress distribution. However, for elastic-plastic stress distribution, the
expression depends on R and by solving the expression numerically at discrete point,
the arching moment ratio was obtained for the following range of R:
for 26.0R
R
M r
3615.0 (2.12)
and for 26.00 R
)1243.010*3.3(1.163.4 4 RMr (2.13)
The arching moment of resistance is then calculated as:
4
85.0 21
'rc
a
MdfM (2.14)

Chapter 2 Literature review
43
The arching moment of resistance in Equation (2.14) assumes that the depth (d1) is
used by arching only. Considering that part of the depth is used to balance the tensile
yielding at support and middle section, Rankin and Long adopted Christiansen’s
approach (Christiansen 1963) to determine the effective depth for arching only as:
'1
85.0)(2
c
y
f
dfhd (2.15)
where and are the tensile reinforcement ratio at the support and middle section
of the slab.
The above expression was based on RC slab with full axial restraint. By considering
the equilibrium of equivalent three-hinged arch shown in Figure 2.26, the length of the
rigidly restraint RC slab was expressed in terms of elastic length as:
Figure 2.26: Equivalent three hinge arches (a) with flexible restraint (b) rigid restraint
(Rankin & Long 1997b)
3
1
1
e
cer
KL
AELL (2.16)
where Le is the length of the RC slab with elastic restraint
Ec is the elastic modulus of concrete
K is the axial stiffness of restraining spring and
A is the cross-sectional area of the compression zone

Chapter 2 Literature review
44
The maximum moment due to arching of RC slab with elastic restraint can be
expressed as:
r
eara
L
LMM (2.17)
Finally, the enhanced ultimate capacity due to bending and arching is calculated as:
)( 21 bbb MMkP (2.18)
aa kMP (2.19)
where k = 4/L for RC slab with load applied at middle joint.
The proposed model was validated with experimental test on slabs from Christiansen
(1963), Birke (1975), and Roberts (1969) and the results correlated well. The model
was also used to predict the strength enhancement in T-beams and good agreement
was obtained (Ruddle et al. 2003).
It should however be noted that both Christiansen (1963) and Rankin and Long (1997)
treat the bending and arching deformation separately. In reality, arching and bending
coexist in the beam and deformation compatibility needs to be fulfilled. More so
Rankin and Long’s model ignores the compression reinforcement which for a RC
beam may increase the arching compression.
Yu and Tan (2014) developed an analytical model for the prediction of the
compressive arching capacity of RC beams. The model is an advancement of Park and
Gamble’s model (1960) in that it considers the partial rotational and axial restraint and
the stress state of reinforcement. The model is based on plane section assumption and
also assumes that the maximum compressive strength in concrete at the critical section
is a constant equal to 0.003. The deformation of one-half of the beam is shown in
Figure 2.27. Based on compatibility relation, the neutral axis at the end is related to
the neutral axis at the middle section as:

Chapter 2 Literature review
45
Figure 2.27: Compatibility condition of one-half of RC beam (Yu and Tan, 2014)
r
uo
ac K
lMc
hltN
lKAE
lhc 1
1
2
12
21
222 (2.20)
where c and c1 are the neutral axis at the end and middle section respectively.
Mu1 and N bending moment at the beam end and axial force in the beam respectively.
Ka and Kr are the axial and rotational stiffness of the end restraint respectively.
The neutral axes c and c1 cannot be solved by Equation (2.20) only. The second
equation was determined by considering equilibrium of forces for the end and middle
section as:
'''1 TCCN scu for end section (2.21)
TCCN scu for middle section (2.22)
where Cc and Cc’ are determined using equivalent rectangular stress block as:
11'' 85.0 cbfC cc (2.23)
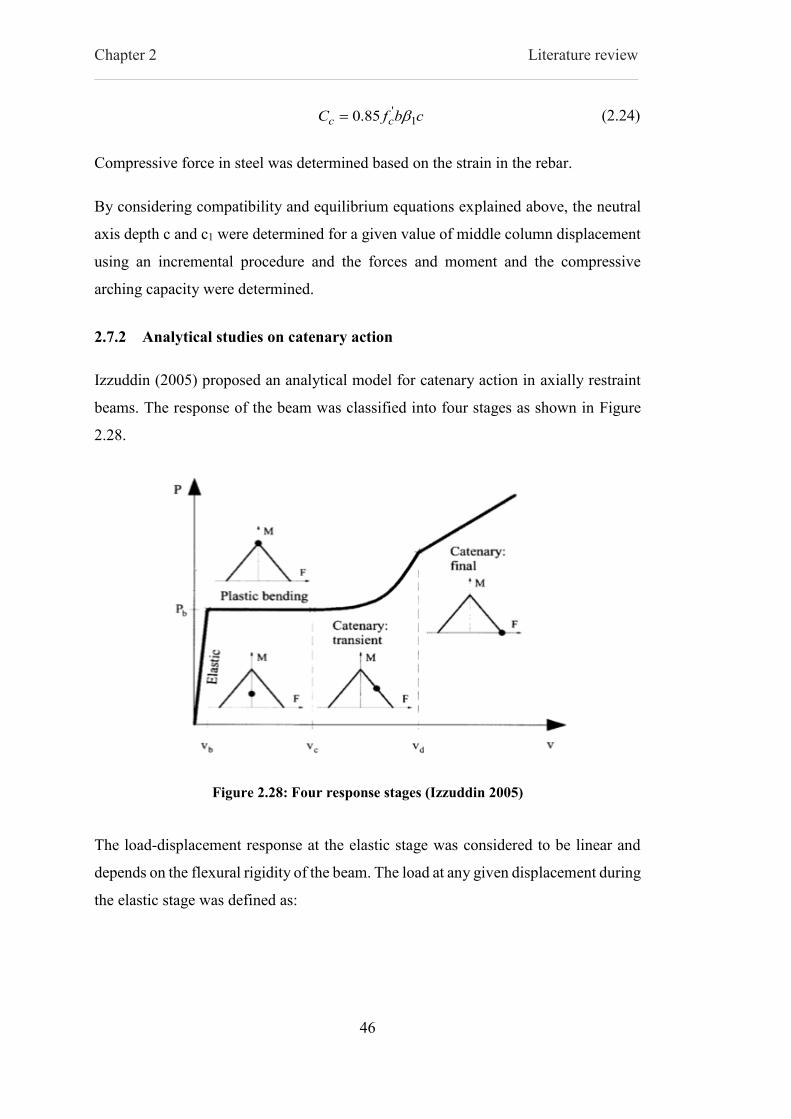
Chapter 2 Literature review
46
cbfC cc 1'85.0 (2.24)
Compressive force in steel was determined based on the strain in the rebar.
By considering compatibility and equilibrium equations explained above, the neutral
axis depth c and c1 were determined for a given value of middle column displacement
using an incremental procedure and the forces and moment and the compressive
arching capacity were determined.
2.7.2 Analytical studies on catenary action
Izzuddin (2005) proposed an analytical model for catenary action in axially restraint
beams. The response of the beam was classified into four stages as shown in Figure
2.28.
Figure 2.28: Four response stages (Izzuddin 2005)
The load-displacement response at the elastic stage was considered to be linear and
depends on the flexural rigidity of the beam. The load at any given displacement during
the elastic stage was defined as:

Chapter 2 Literature review
47
UDL
MPLv
L
EIP
for 8.76
for 48 , (2.25)
For the plastic bending stage, the load was assumed to be constant and depends on the
plastic moment capacity of the section with the load and displacement expressed as:
UDL
MPL
L
MP
p
b
for 8
for 4 , (2.26)
2
EI
LMv
p
b
(2.27)
where Mp is the plastic moment capacity of the section, L is the length of the double
span beam and vb is the mid-span displacement.
In the transient stage, in addition to bending, the beam also elongates causing axial
tension forces to develop. The extension of the beam including the elastic axial support
was given as:
L
v 2
2 (2.28)
Using the principle of Hooke’s law, the deformation of elastic axial restraint was
related to the axial force in the beam by the expression:
)2(2
pe
L
vKF (2.29)
With the flow rule theory, Izzuddin (2008) obtained an expression relating the
incremental plastic axial deformation and rotation at the plastic hinge. The incremental
axial force in the beam was then obtained as:
)44(L
vr
L
vvKF
p
e
(2.30)
where rp is the ratio of the moment and axial force capacities of the section.

Chapter 2 Literature review
48
Integrating Equation (2.30) with starting displacement (vc) corresponding to maximum
of (vb and rp), the axial force during the transient stage was calculated as:
L
rvvvvKF
pcc
e
)2)((2 (2.31)
The corresponding moment was determined from the moment-axial force yield
function and the load was obtained considering equilibrium of forces in the beam and
expressed as:
L
vvrvvvvKM
LP
ppcc
ep
))(2)((2 (2.32)
The end of the transient stage is reached when the axial force equals the axial capacity
of the beam and the load at this stage was calculated as:
e
p
pccd
K
Frvvv
2)( 2 (2.33)
After the axial capacity of the beam is reached, for subsequent displacement greater
than vd, the load was determined as:
L
vFP
p (2.34)
where Fp is the axial capacity of the beam
Although the model can represent the catenary action in axially restraint beams, it does
not consider strength degradation which may occur due to partial failure at critical
region or connection, for example for a typical steel connection this may be fracture
of bottom weld, and for an RC section this could be rapture of part of tensile
reinforcing bars. This leads the prediction from the model to be unreliable in some
cases.

Chapter 2 Literature review
49
2.8 Concluding remarks
From the review presented in this chapter, it is seen that Alternate Load Path is
arguably the most commonly accepted method, as recommended by design guidelines,
for the progressive collapse assessment of structures. For laterally restrained RC
assemblies, the different load path which could develop in a column loss scenario are
flexural, compressive arching and catenary action. Different researchers have agreed
that the maximum compressive arching action in RC assemblies occur at a lower
displacement (within about 0.6 times of the section depth) and is affected by
reinforcement ratio, axial restraint, span depth ratio and concrete compressive strength,
however there are question that are yet to be addressed. Furthermore, the existing
analytical model for catenary action does not consider strength degradation and may
therefore lead to over estimation of the prediction. Based on the research gap existing
in the literature, the questions the present research seeks to address includes:
To perform a detailed quantitative study to ascertain the proportion of
additional load due to arching that can be attributed the factors affecting the
arching compression.
To develop a more detailed analytical model for compressive arching action
that will consider the compounding effect of bending and arching and the
deformation state of the concrete.
To develop a generic analytical model for catenary action in a lateral retrained
subassembly with incorporation of strength degradation. The generic model
can be used to predict the load-displacement response in both RC and steel
assemblies.

Chapter 2 Literature review
50

Chapter 3 Critical evaluation of compressive arching action-
a semi empirical study
51
Chapter 3: Critical evaluation of compressive
arching action - a semi empirical study
3.1 Introduction
Chapter two presented a general review of both theoretical and experimental studies
in the field of progressive collapse of reinforced concrete assemblies and structures. In
this chapter, the focus is on the compressive arching action with particular interest in
the relative increase in the compressive arching capacity taking into consideration the
various parameters that affect this relative increase, based primarily on existing
experimental data in the literature. Despite a number of experimental studies on this
topic, a systematic scrutiny covering a sufficient variation range of parameters from
the various test programmes has not been conducted before. To this end, a detailed
account of existing experimental studies on compressive arching action in RC sub-
assemblage is first presented. This includes test set-up, geometric details and the
results concerning particularly the arching action. Subsequently, a critical analysis of
all the experimental studies with particular focus on the parameters affecting the
relative increase in the compressive arching action is presented. Finally, a semi-
empirical set of equations for predicting the compressive arching action is proposed.
3.2 Existing experimental studies
A number of studies on compressive arching action of RC subassemblies are available
in the literature. Herein, a critical review of five (5) group of studies on compressive
arching action of RC subassemblies are presented. These five studies investigated in
total 32 different specimens with differing geometric, support conditions,
reinforcement ratio and concrete compressive strength.
Lastly, the normalized increase in arching is evaluated for each of experimental test.
Although, the flexural capacity was calculated in some of the test herein, the flexural
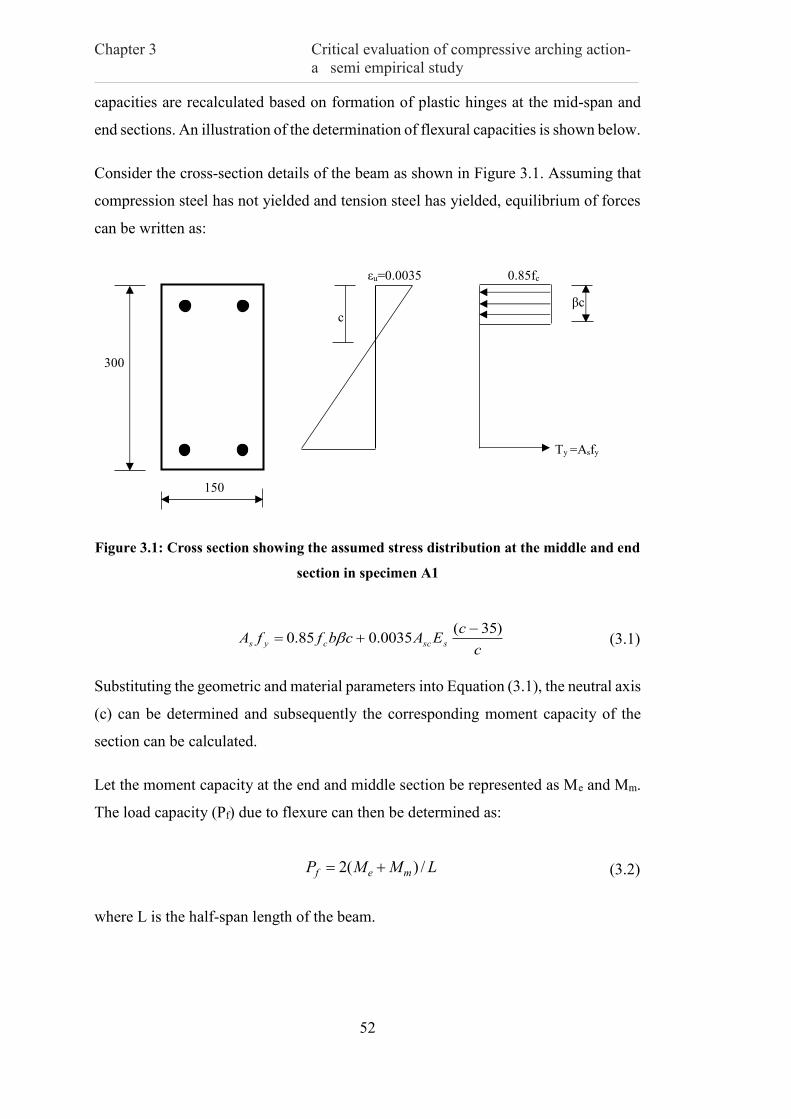
Chapter 3 Critical evaluation of compressive arching action-
a semi empirical study
52
capacities are recalculated based on formation of plastic hinges at the mid-span and
end sections. An illustration of the determination of flexural capacities is shown below.
Consider the cross-section details of the beam as shown in Figure 3.1. Assuming that
compression steel has not yielded and tension steel has yielded, equilibrium of forces
can be written as:
Figure 3.1: Cross section showing the assumed stress distribution at the middle and end
section in specimen A1
c
cEAcbffA ssccys
)35(0035.085.0
(3.1)
Substituting the geometric and material parameters into Equation (3.1), the neutral axis
(c) can be determined and subsequently the corresponding moment capacity of the
section can be calculated.
Let the moment capacity at the end and middle section be represented as Me and Mm.
The load capacity (Pf) due to flexure can then be determined as:
LMMP mef /)(2 (3.2)
where L is the half-span length of the beam.
εu=0.0035 0.85fc
c βc
300
Ty =Asfy
150

Chapter 3 Critical evaluation of compressive arching action-
a semi empirical study
53
The normalized increased in load due to arching is then calculated as:
f
fa
NP
PP (3.3)
Where Pa and Pf are the maximum arching compression and flexural capacities
respectively. Equation (3.3) is used to determine the normalized increased in load for
the different experimental test considered in this study as shown in subsequent
sections.
3.2.1 Test by Su et al. (2009)
This experimental study investigated the load capacity of axially restrained RC beam
assemblage under gravity loading in a column removal scenario and the effect of
reinforcement ratio, span depth ratio and loading rate on the compressive arching
behaviour of the beam. A total of 12 test specimens were considered in the study,
which were further divided into three groups. The first group (group A), with
specimens identified as A1 to A6, investigated the effect of reinforcement ratio. In the
second group (B), the effect of span depth ratio was studied while the third group (C)
investigated the effect of loading rate on the compressive arching action capacity. Each
of the specimen consisted of three column stubs and two beams with load applied at
the middle column stub. The test geometry is shown in Figure 3.2 while the
reinforcement details are shown in Table 3.1. Each of the key parameters considered
in the study are discussed in the section that follows.

Chapter 3 Critical evaluation of compressive arching action-
a semi empirical study
54
Figure 3.2: Plan and elevation view of RC assemblages (after Su et al., 2009)
400 Ln 250 Ln 400
250
h
b
(a) plan
(b) elevation
600

Chapter 3 Critical evaluation of compressive arching action-
a semi empirical study
55
Table 3.1: Geometric and reinforcement details of tested specimens by Su et al. (2009)
3.2.1.1 Boundary condition
The schematic representation of the boundary condition used in the study is shown in
Figure 3.3. It consisted of a steel socket and a rigid support. The end columns were
connected to the steel socket with the help of high strength bolts and steel plate. The
steel socket was in turn connected to a rigid support on a steel test bed using a pin
located 150mm away from the beam end. Using vertical and horizontal strut, these
sockets were then connected to the support such that axial and rotational restraint were
obtained. Figure 3.4 shows the test set-up for the test.
Specimen
ID b x h (mm) Ln (mm) f’c (MPa)
Longitudinal
reinforcement ratio Ties
top bottom
A1 150 x 300 1225 25.8 2ф12
ρ = 0.55%
2ф12
ρ = 0.55% Ф8 @ 100
A2 150 x 300 1225 28.2 3ф12
ρ = 0.83%
3ф12
ρ = 0.83% Ф8 @ 80
A3 150 x 300 1225 31.2 3ф14
ρ = 1.13%
3ф14
ρ = 1.13% Ф8 @ 80
A4 150 x 300 1225 23.0 2ф12
ρ = 0.55%
1ф14
ρ = 0.38% Ф8 @ 100
A5 150 x 300 1225 26.5 3ф12
ρ = 0.83%
2ф12
ρ = 0.55% Ф8 @ 80
A6 150 x 300 1225 28.6 3ф14
ρ = 1.13%
2ф14
ρ = 0.75% Ф8 @ 80
B1 150 x 300 1975 18.6 3ф14
ρ = 1.13%
3ф14
ρ = 1.13% Ф8 @ 100
B2 150 x 300 2725 19.3 3ф14
ρ = 1.13%
3ф14
ρ = 1.13% Ф8 @ 120
B3 150 x 300 2725 21.1 3ф14
ρ = 1.13%
2ф14
ρ = 0.75% Ф8 @ 120
C1 100 x 200 1225 15.9 2ф12
ρ = 1.30%
2ф12
ρ = 1.30% Ф8 @ 80

Chapter 3 Critical evaluation of compressive arching action-
a semi empirical study
56
Figure 3.3: Schematic representation of the test set up and tested specimen (after Su et
al., 2009)
Figure 3.4: Test set up (after Su et al., 2009)
3.2.1.2 Span depth ratio
The span depth ratio (L/d) considered in the study included 4.08, 6.12, 6.58 and 9.08.
It could be argued that the tested specimen’s L/d ratio ranged from very short to
moderate spans. In practice L/d ratio up 15 may be used. It should be mentioned that
L/d ratio of 4.08 is rarely used in practice and the behaviour may be dominated by
shear rather than bending due to the short span.

Chapter 3 Critical evaluation of compressive arching action-
a semi empirical study
57
3.2.1.3 Reinforcement ratio and rebar strength
The reinforcement ratio at the support and mid-span section varied between 0.55 and
1.30%. This range of reinforcement ratio falls within the range commonly used in
practice, thus the reinforcement in the tested specimens may be classified as light to
heavily reinforced sections. Two different reinforcement sizes of Ф12 and Ф14mm
were used for the longitudinal rebar and Ф8mm was used for the transverse
reinforcement. The yield strength of the reinforcements was 350, 340 and 290MPa for
12, 14 and 8mm diameter rebar respectively.
3.2.1.4 Concrete strength
According to the authors, concrete strength was not among the variables investigated
in the test. Nevertheless, the concrete strength in all the tested specimens differed
slightly. This was attributed to the different batches of concrete used in casting the
specimens. The concrete cubic strength used in different specimens varied between
19.9 to 39.0MPa. It should be mentioned that in the test, concrete strength was
measured using cubic strength, herein the cubic strength is converted to cylinder
strength by multiplying with a factor of 0.8 (BS EN 206-1)
3.2.1.5 Damage patterns
The authors noted that during the loading process, cracking of concrete first initiated
at the middle beam-column interface and subsequently at the end interface. Due to the
presence of axial restraint, there was no noticeable reduction in concrete stiffness after
cracking of concrete and almost a linear stiffness was obtained up to the yielding of
tensile reinforcements. It was observed that crushing of concrete occurred in specimen
A2 at a much smaller middle column displacement. This was attributed to the in-plane
rotation of the middle column stub. For other specimens crushing of concrete occurred
after the maximum compressive arching action was reached. This crushing of concrete
led to the sudden reduction in the horizontal reaction and applied force and was more
severe in specimens with shorter L/d ratio than specimens with longer L/d ratio.

Chapter 3 Critical evaluation of compressive arching action-
a semi empirical study
58
3.2.1.6 Maximum compressive arching action capacities
Following the approach explained in Section 3.2, the normalized arching effect is
calculated and presented in Table 3.2.
Table 3.2: Compressive arching and recalculated flexural capacities of specimens tested by Su et
al. (2009)
As can be observed in Table 3.2, the normalized increase in load due to arching
compression varies from 0.49 to 1.89. A closer look at the results further shows that
the maximum normalized increase in load occurred in specimen with minimum bottom
reinforcement ratio. It should however be mentioned that the baseline for
normalization herein refers to the bending capacity of the beam which depends on the
reinforcement ratio and yield strength. For specimens in group A, the L/d ratio was
4.08 and as can be observed in Table 3.2, the effect of arching is more pronounced in
RC beams with shorter L/d ratio which leads to higher increase in normalized load
compared to longer L/d ratio.
Specimen
ID
Axial
stiffness
(KN/m)
Rotational
stiffness
(KNm/rad)
L/d
ratio Pa (KN) Pf (KN)
f
fa
N
P
PP
A1 1.00E+06 1.75E+04 4.08 168 66 1.55
A2 1.00+E06 1.75E+04 4.08 221 97 1.28
A3 1.00+E06 1.75E+04 4.08 246 130 1.89
A4 1.00+E06 1.75E+04 4.08 147 56 1.62
A5 1.00+E06 1.75E+04 4.08 198 81 1.44
A6 1.00+E06 1.75E+04 4.08 226 106 1.13
B1 1.00+E06 1.75E+04 6.58 125 77 0.62
B2 1.00+E06 1.75E+04 9.08 82.9 55.8 0.49
B3 1.00+E06 1.75E+04 9.08 74.7 47 0.59
C1 1.00+E06 1.75E+04 6.12 60.9 37.9 0.61

Chapter 3 Critical evaluation of compressive arching action-
a semi empirical study
59
3.2.2 Test by Yu & Tan (2013a) and Yu & Tan (2013b)
The authors conducted two different studies on the compressive arching action
capacity on RC sub-assemblies using the same beam geometry and test setup, hence
the details of the two studies are discussed together in this section.
Yu & Tan (2013a) investigated the effect of seismic and non-seismic detailing on the
behaviour of RC beam column sub-assemblage bridging over a removed column. The
prototype frame was part of a 5-storey commercial building designed in accordance
with the ACI 318-05 code. One-half scaled specimen of the prototype frame was used
for the study. In the tested beam, clear span between the outer columns was 5750mm,
depth and width of the beam was 250mm and 150mm respectively. Enlarged column
stubs of 400mm wide by 450mm deep were used at the end to simulate continuity. A
total of two (2) specimens were tested. In the seismic detailed specimen, the bottom
reinforcement was lapped at some distance away from the middle column while in the
non-seismic detailing it was lapped within the middle column location.
In a follow-up study, Yu & Tan (2013b) investigated the effect of reinforcement ratio
and span depth ratio on the compressive arching behaviour of RC subassemblies. A
total of six (6) specimens with varying reinforcement and span depth ratios were
considered. The same test geometry and set up used in Yu & Tan (2013a) was adopted
in the study. The geometric detail of the tested specimens is shown in Figure 3.5 while
the reinforcement details in the two tests are shown in Table 3.3.
Figure 3.5: Reinforcement detail of sub-assemblage (Yu & Tan 2013b)
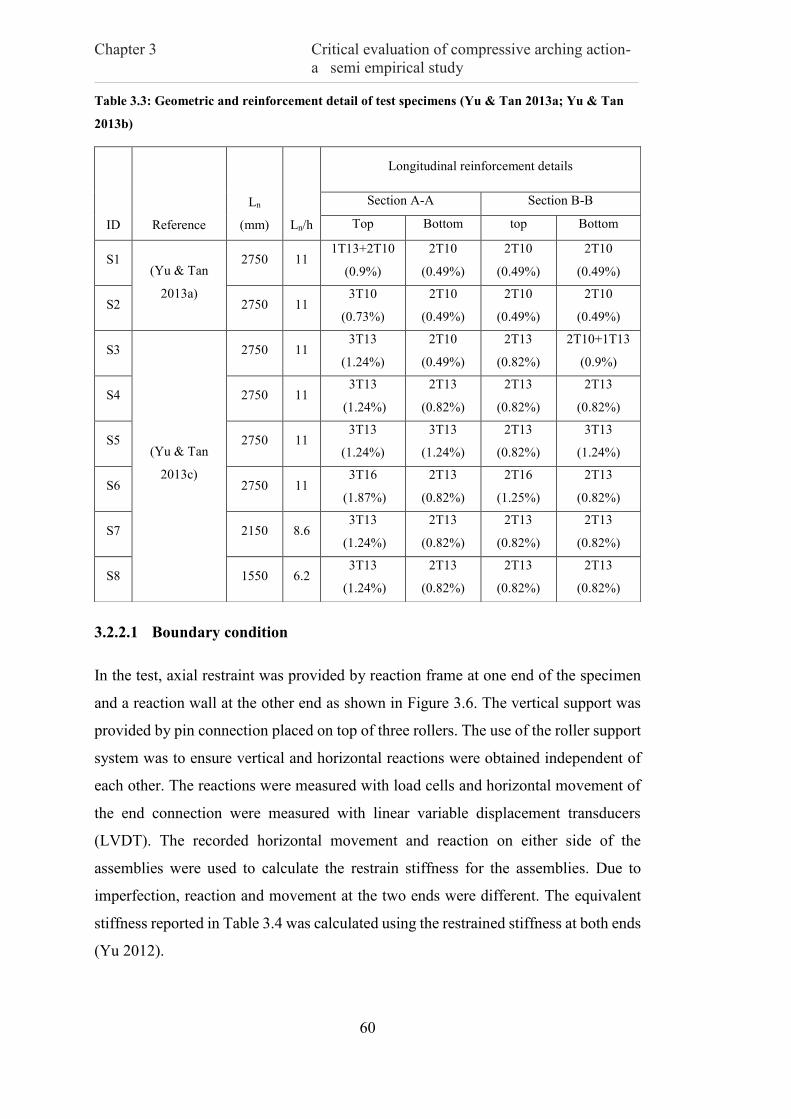
Chapter 3 Critical evaluation of compressive arching action-
a semi empirical study
60
Table 3.3: Geometric and reinforcement detail of test specimens (Yu & Tan 2013a; Yu & Tan
2013b)
3.2.2.1 Boundary condition
In the test, axial restraint was provided by reaction frame at one end of the specimen
and a reaction wall at the other end as shown in Figure 3.6. The vertical support was
provided by pin connection placed on top of three rollers. The use of the roller support
system was to ensure vertical and horizontal reactions were obtained independent of
each other. The reactions were measured with load cells and horizontal movement of
the end connection were measured with linear variable displacement transducers
(LVDT). The recorded horizontal movement and reaction on either side of the
assemblies were used to calculate the restrain stiffness for the assemblies. Due to
imperfection, reaction and movement at the two ends were different. The equivalent
stiffness reported in Table 3.4 was calculated using the restrained stiffness at both ends
(Yu 2012).
ID Reference
Ln
(mm) Ln/h
Longitudinal reinforcement details
Section A-A Section B-B
Top Bottom top Bottom
S1 (Yu & Tan
2013a)
2750 11 1T13+2T10
(0.9%)
2T10
(0.49%)
2T10
(0.49%)
2T10
(0.49%)
S2 2750 11 3T10
(0.73%)
2T10
(0.49%)
2T10
(0.49%)
2T10
(0.49%)
S3
(Yu & Tan
2013c)
2750 11 3T13
(1.24%)
2T10
(0.49%)
2T13
(0.82%)
2T10+1T13
(0.9%)
S4 2750 11 3T13
(1.24%)
2T13
(0.82%)
2T13
(0.82%)
2T13
(0.82%)
S5 2750 11 3T13
(1.24%)
3T13
(1.24%)
2T13
(0.82%)
3T13
(1.24%)
S6 2750 11 3T16
(1.87%)
2T13
(0.82%)
2T16
(1.25%)
2T13
(0.82%)
S7 2150 8.6 3T13
(1.24%)
2T13
(0.82%)
2T13
(0.82%)
2T13
(0.82%)
S8 1550 6.2 3T13
(1.24%)
2T13
(0.82%)
2T13
(0.82%)
2T13
(0.82%)

Chapter 3 Critical evaluation of compressive arching action-
a semi empirical study
61
Figure 3.6: Reinforcement detail of sub-assemblage (Yu & Tan 2013a)
3.2.2.2 Span depth ratio
Three span depth ratios including 11, 8.6 and 6.2 were considered in the study. This
test covered a much wider range of L/d ratio compared to test by Su et al. (2009). The
span to depth ratio of 11 can be a representative of larger span depth which may be
commonly found in practice.
3.2.2.3 Reinforcement ratio and rebar strength
A much wider range of reinforcement ratio was considered in this study compared to
Su et al. (2009). The reinforcement at the support section ranged from 0.9 to 1.87%
and 0.49 to 1.24% for top and bottom section respectively. Similarly, at the middle
section of each beam span, the reinforcement ranged from 0.49 to 1.25% and 0.49 to
1.24% respectively. Thus, the specimen tested in this study can be said to range from
lightly reinforced to heavily reinforced section with reinforcement ratio of 1.87%. As
shown in Table 3.3, different reinforcement sizes were used for the longitudinal
reinforcement. The yield strengths were 511, 494 and 513MPa respectively for 10, 13
and 16mm diameter reinforcements respectively.

Chapter 3 Critical evaluation of compressive arching action-
a semi empirical study
62
3.2.2.4 Concrete strength
Similar to the test Su et al. (2009), concrete strength was not a variable, thus its effect
on the compressive arching action was not investigated. In the first test, the concrete
compressive strength was 31.24MPa in the two specimens tested while in the second
test, one batch of concrete with concrete strength of 38.15MPa was used in all six (6)
specimens.
3.2.2.5 Damage pattern
The authors noted that damage pattern of the specimens S3 to S7 with L/d ratio of 11
was the same and as such only damage pattern of specimen S5 was studied in detail.
Figure 3.7 shows the damage pattern of specimen S5 at the maximum compressive
arching action capacity. Concrete crushing occurred at the middle joint interface and
cracks with approximately equal spacing also occurred near the middle and end
column stubs.
(a) near middle joint interface (b) near end joint interface
Figure 3.7: Damage pattern of specimen S5 at compressive arching capacity with
middle joint displacement of 75mm (Yu & Tan 2013b)
Damage pattern of specimen S8 was marked by severe crushing of concrete near the
middle and end joint interface due to the reduced L/d ratio 6.2. Figure 3.8 shows
damage pattern of specimen S8 with more severe crushing compared to specimen S5.

Chapter 3 Critical evaluation of compressive arching action-
a semi empirical study
63
A close look at Figure 3.7 and 3.8 further shows that crushing of concrete only
occurred close to the middle joint interface at a displacement of 75mm in specimen S5
with L/d ratio of 11 whereas in specimen S8 with L/d ratio of 6.2, concrete crushing
occurred at both end and middle joint interface at a displacement of 75mm. From these
observations, it could be argued that the probability of crushing of concrete during
arching action increases as the L/d ratio decreases.
(a) near middle joint interface (b) near end joint interface
Figure 3.8: Damage pattern of specimen S8 at compressive arching capacity with
middle joint displacement of 75mm (Yu & Tan 2013b)
3.2.2.6 Maximum compressive arching action capacities
Following the approach explained in Section 3.2, the normalized arching effect is
calculated and presented in Table 3.4. The flexural capacities for the specimens are
recalculated for each specimen as shown in the table.
The range of normalized increased in load is 0.13 to 0.44 compared to the wider range
observed in test by Su et al. (2009). The reason for this low normalized increase in
load capcity could be attributed in part to the smaller axial restraint compared to the
axial retraint in test by Su et al. (2009). The detail study on these variation will be
investigated in detail in Section 3.3.

Chapter 3 Critical evaluation of compressive arching action-
a semi empirical study
64
Table 3.4: Compressive arching and recalculated flexural capacities of specimens tested by (Yu
& Tan 2013c)
3.2.3 Test by Vesali et al. (2013) and Vali et al. (2015)
Vesali et al. (2013) investigated the effect of longitudinal reinforcement ratio and
stirrup spacing on RC beams using six scaled reinforced concrete beam assemblages.
The sub assemblages consisted of 2 bay beam and 3 columns stubs with enlarged end
column stubs similar to the test by Yu & Tan (2013b). The geometry and reinforcement
arrangement of the tested beams is shown in Figure 3.9.
Specimen
ID
Axial
stiffness
(KN/m)
Rotational
stiffness
(KNm/rad)
L/d
ratio Pa (KN) Pf (KN) f
fa
N
P
PP
S1 1.06E+05 1.0E+04 11 41.64 33.2 0.25
S2 1.06+E05 1.0E+04 11 38.38 29.68 0.32
S3 4.29+E05 3.0E+04 11 54.47 40.43 0.33
S4 4.29+E05 3.0E+04 11 63.22 47.36 0.32
S5 4.29+E05 3.0E+04 11 70.33 56.29 0.24
S6 4.29+E05 3.0E+04 11 70.33 61.57 0.13
S7 4.29+E05 3.0E+04 8.6 82.82 60.58 0.36
S8 4.29+E05 3.0E+04 6.2 121.34 84.03 0.44

Chapter 3 Critical evaluation of compressive arching action-
a semi empirical study
65
Figure 3.9: Geometric and reinforcement arrangement of the test specimens (Vesali et
al. 2013)
In a follow up study by Vali et al. (2015), the effect of concrete compressive strength
on compressive arching capacity of RC subassemblies was investigated. The same
geometry and test set-up used in the previous test was adopted in the study.
3.2.3.1 Boundary condition
In the test, axial and rotational restraint were provided by two steel bollards. The end
columns were anchored to these bollards boards using a 20mm diameter Mac alloy.
The bollard board was in turn bolted to a strong floor using a 36mm diameter Mac
alloy bar as shown in Figure 3.10. The bottom of the beam was supported by a C-
channel section which was bolted to the vertical bollard board at each end of the beam-
column assembly.

Chapter 3 Critical evaluation of compressive arching action-
a semi empirical study
66
Figure 3.10: Anchoring of subassembly to test set up (Vali et al. 2015)
3.2.3.2 Span depth ratio
The span-to-depth ratio in the two separate studies were kept the same with L/d ratio
of 11.72. This is almost the same L/d ratio used in the study by Yu & Tan (2013b).
3.2.3.3 Reinforcement ratio and rebar strength
In the study by Vesali et al. (2013) six specimens were tested. In three (3) of these
specimens, reinforcement consisted of 3no. Ф10mm (0.87%) and 2no. Ф10mm
(0.58%) at the top and bottom sides of the section of the beam. The remaining three
(3) specimens had 2no. Ф10mm at top and bottom section. The essence of one (1)
additional top reinforcement at the support was to investigate if it has any effect on the
compressive arching behaviour of the subassemblies. The transverse reinforcement at
critical section (near the middle and end beam-column interface) consisted of Ф6mm
at 60, 120 and 180mm spacing for the different specimens. The essence of the variation
in the spacing of transverse reinforcement was to study if it has effect on the
compressive arching behaviour of the beam.
In Vali et al. (2015), six specimens were also tested and the reinforcement ratio was
similar to that used in Vesali et al. (2013). The results of the test by Vesali et al. (2013)

Chapter 3 Critical evaluation of compressive arching action-
a semi empirical study
67
showed that transverse reinforcement did not affect the compressive arching behaviour
and hence transverse reinforcement was provided by Ф6mm at 180mm spacing. The
nominal yield strength for longitudinal and transverse reinforcements was 500 and
250MPa respectively.
3.2.3.4 Concrete strength
Concrete compressive strength of specimens in the first study (Vesali et al. 2013)
varied between 26-30.5MPa. This slight variation in concrete strength was due to the
use of different batch of concrete in casting the specimens. In the second test (Vali et
al. 2015), the objective was to investigate the effect of concrete strength on
compressive arching behaviour. For this reason, a wider range of concrete strength was
considered. The specimens had concrete compressive strength of 18, 48 and 68MPa,
respectively.
3.2.3.5 Damage pattern
The damage pattern around the maximum arching action was not shown in the
literature. The authors only showed the damage pattern at the rupture of bottom which
was almost the end of effective arching stage. According to the authors, the crushing
of concrete concentrated at about 150mm at the end and middle section of the beam
(see Figure 3.11). This corresponds to about 0.85d (d being the depth of the cross-
section).

Chapter 3 Critical evaluation of compressive arching action-
a semi empirical study
68
(a) near middle joint interface (b) near end joint interface
Figure 3.11: Damage pattern of the tested specimen (Vali et al. 2015)
3.2.3.6 Maximum compressive arching capacities
Based on the reported test data, the normalized increase in load due to arching and the
flexural capacities are recalculated and the results is presented in Table 3.5 for the
twelve specimens considered in the two studies. It can be observed that the normalized
increase in load range from 0.36 to 0.81. Comparing the result in this study with that
in Yu and Tan (2013b) which is about the same L/d ratios, it can be observed that the
normalized increase in load is larger in the specimens in this study than in Yu and Tan
(2013b). One reason for this may be because of the difference in the axial restraint
between the two studies. Although the axial restraint in the present study was not
recorded, a close look at the test set up shows that the axial restraint is closer to rigid
restraint. Further analysis of these series of results together with the results from other
test programmes will be discussed later in Section 3.

Chapter 3 Critical evaluation of compressive arching action-
a semi empirical study
69
Table 3.5: Compressive arching and recalculated flexural capacities of specimens tested by
Vesali et al. (2013) and Vali et al. (2015)
3.2.4 Test by Sadek et al. (2011)
This test programme investigated the effect of seismic design and detailing on the
progressive collapse of two reinforced concrete sub-assemblies. One of the tested
beam was designed for Seismic Design Category (SDC) C and the other was designed
for Seismic Design Category (SDC) D. In the former, Intermediate Moment Frame
(IMF) was used to resist lateral loads while in the latter, Special Moment Frame (SMF)
was used. Each of the specimens consisted of two beams and two end columns with a
short column stub at the middle. The geometry and reinforcement arrangement for the
two tests are shown in Figure 3.12.
Specimen ID Reference Pa (KN) Pf (KN) f
fa
N
P
PP
V1
(Vali et al., 2013)
40.5 22.8 0.78
V2 35.7 24.5 0.46
V3 41.4 25.0 0.66
V4 40.1 29.4 0.36
V5 41.6 26.5 0.57
V6 39.4 27.0 0.46
V1*
(Vali et al. 2015)
51.3 28.4 0.81
V2* 42.5 24.6 0.73
V3* 47.4 27.5 0.72
V4* 38.5 22.7 0.68
V5* 33.2 24.0 0.38
V6* 28.3 18.9 0.50

Chapter 3 Critical evaluation of compressive arching action-
a semi empirical study
70
(a) Evelavtion view of the test specimen
(b) section details for IMF specimen
(c) section details for SMF specimen
Figure 3.12: Geometric and reinforcement details of the test assemblies
3.2.4.1 Boundary condition
The end columns were monolithically cast to enlarged concrete footings which were
further anchored to a strong test floor to avoid any rotation and translation. The top
sides of the columns were restrained from horizontal movement using two rollers, one
on either side of the column. Since the tested beam assembly was supposedly part of a
larger frame, the beam longitudinal reinforcements at the end of the column were

Chapter 3 Critical evaluation of compressive arching action-
a semi empirical study
71
anchored using a treaded mechanical device to mimic continuity of reinforcement. The
test setup for the experiment is shown in Figure 3.13.
Figure 3.13: Test set up (Sadek et al. 2011)
3.2.4.2 Span depth ratio
The span depth ratio for the IMF and SMF specimens were 10.6 and 8 respectively.
These span ratios are within the range used in practice and can be classified as
moderate to large spans. It should however be noted that unlike in the other tests where
the depth was larger than the width of the beam, herein the beam depth was smaller
than the width of the beam.
3.2.4.3 Reinforcement ratio and rebar strength
The reinforcement at all the support sections for IMF specimen as shown in Figure 11
consisted of 4no. Ф25mm (0.65%) top bars and 2no. Ф29mm (0.43%) bottom bars.
For the SMF specimen, reinforcement at the support were 7no. Ф25mm (0.69%) and
6no Ф25mm (0.59%) for top and bottom section respectively. The percentage of
reinforcement is within the range used in practice.

Chapter 3 Critical evaluation of compressive arching action-
a semi empirical study
72
The yield strength of 25 and 29mm diameter rebar was 476 and 462MPa respectively
and that of transverse reinforcement was 524MPa.
3.2.4.4 Concrete strength
Concrete strength was not a variable in the test, hence the concrete strength for the
IMF and SMF specimens were 32.4 and 35.9MPa respectively. The concrete strengths
for the two tests.
3.2.4.5 Maximum compressive arching action capacities
The normalized increase in load due to arching and the calculated flexural capacities
for the two specimens are shown in Table 3.6. It can be seen that increase in load due
to arching was very minimal in the test specimens with a maximum normalized
increase ratio of only 0.36. However, as a general trend, it is seen that the normalized
increase in load capacity was lower in specimen IMF which has a larger L/d ratio
compared to specimen SMF.
Table 3.6: Compressive arching and recalculated flexural capacities of specimens tested by
Sadek et al. (2011)
3.3 Critical analysis of all the experimental results
In the preceding sections, each of the tests concerning compressive arching action has
been scrutinised and discussed in detail. The examination clearly shows that the tests
conducted by different authors covered a wide range of variables including the
boundary conditions, geometric and reinforcement details. In this section, the results
of all individual test specimens are analysed together to further shed more light on the
general trend of the normalized increase in load due to arching compression and the
effects of key parameters, namely the span-to-depth ratio (L/d), condition of the end
Specimen ID L/d ratio Pa (KN) Pf (KN) f
fa
N
P
PP
IMF 10.6 296 248 0.19
SMF 8.0 900 664 0.36

Chapter 3 Critical evaluation of compressive arching action-
a semi empirical study
73
support (axial stiffness of the support), reinforcement ratio and concrete compressive
strength on compressive arching capacity.
As the arching effect is directly associated with the depth of the beam, the L/d ratio is
chosen as a primary parameter affecting the arching effect. The L/d ratio has been
generally recognised as a key factor from individual experimental studies. For example
Su et al. (2009) tested a set of beam specimens with a span-to-depth ratio (L/d) of 4,
6.58 and 9.12. Yu & Tan (2013) considered L/d ratios of 6.2, 8.6 and 11. Their results
both showed that compression arching capacity decreased with increase in L/d ratio as
general trend. However, due to the limited cases covered in each individual study, a
systematic examination in a more quantitative manner has not been carried out.
In this section, the variation of the arching capacity with different L/d ratio is
scrutinised in detail in an attempt to establish more clearly the specific effect of the
L/d ratios, as well as the effects that may be attributed to other parameters mentioned
earlier. On the basis of the analysis of the experimental results, a simplified theoretical
model is put forward to facilitate the interpretation of the influences of the key
parameter, especially the L/d ratio, on the arching action. Finally, through calibration
with the experimental data, a semi-empirical model is proposed for the prediction of
the arching effect in RC beam assemblies.
Without discriminating the differences in the other parameters first, Figure 3.14 shows
the plot of normalized increase in strength due to arching against L/d ratio in all the
specimens considered herein.
Not surprisingly, it can be observed that for the same L/d ratio there exist a marked
difference in the enhancement factor, due apparently to variations in some other
conditions as will be discussed later. For instance, with L/d ratio of 4 the highest
enhancement factor is 1.63 while the lowest is 0.88. The same can be said about the
specimen with L/d ratio of 11 and 12.
Nevertheless, the general trend of decrease in the enhancement factor as L/d increases
can be seen up to an L/d ratio of 11 where the enhancement factor is approaching zero
which indicate that arching action tends to become negligible. However, for the

Chapter 3 Critical evaluation of compressive arching action-
a semi empirical study
74
particular series of tests with L/d ratio of 12, the enhancement factor appears to be
higher than that for the lower L/d ratio of 11, and some data points are even above
those for L/d ratio of 6 and 8.
As mentioned earlier the above differences and the discrepancy in the case of L/d ratio
equal to 12 may be the results of several parameters, but let us take a look of the crucial
axial support condition, or more precisely the magnitude of the axial restraint provided
first. For the particular L/d ratio of 12 group, although the axial stiffness of the end
support was not measured during the test, taking a close look at the set up for these
tests shown in sub-section 3.2.3 (Vesali et al., 2013; Vali et al., 2015), it could be
argued that the axial restraint in the test is very close to the upper bound region and
can therefore be classified as rigid. It should also be pointed out that some of the test
specimens had a higher concrete compressive strength (e.g. 48 and 67MPa) as
compared to the rest of the test data in the current collection where the concrete
strength was around 30MPa. As shown in Table 3.5 there was a slight increase in the
normalised net increase in load capacity as the concrete strength increases.
Considering all L/d ratio except L/d ratio of 12 (for the time being), a trend line can be
drawn through the data points as shown in Figure 3.15. It should however be noted
that the trendline drawn in Figure 3.15 is just to show to trend of variation in
normalized increase in load as the L/d ratio increases but it is not in the simplified
empirical formulation to be presented later.

Chapter 3 Critical evaluation of compressive arching action-
a semi empirical study
75
Figure 3.14: Variation of normalized increase in load due to arching with span depth
ratio for all specimens
Figure 3.15: Trend line through the data points
0
0.2
0.4
0.6
0.8
1
1.2
1.4
1.6
1.8
2 4 6 8 10 12 14
∆ω
N=
(Pa-Pf)/P
f
L/d ratio
Su et al. (2009)
Sadek et al. (2011)
Yu and Tan (2013)
Yu and Tan (2014)
Vesali et al. (2013)
Vali et al. (2015)
0
0.2
0.4
0.6
0.8
1
1.2
1.4
1.6
1.8
2 4 6 8 10 12 14
∆ω
N=
(Pa-Pf)/P
f
L/d ratio
Su et al. (2009)
Sadek et al. (2011)
Yu and Tan (2013)
Yu and Tan (2014)
Vesali et al. (2013)
Vali et al. (2015)

Chapter 3 Critical evaluation of compressive arching action-
a semi empirical study
76
It should be mentioned that for some L/d ratios mentioned above such as 4, same
boundary condition was used for each case, only the concrete strength or reinforcement
ratio was varied. This implies that even for a fixed L/d ratio and axial restrained
stiffness, the normalized increase in arching can vary a lot with the variation caused
by the reinforcement ratio or concrete compressive strength, keeping in mind of
inherent uncertainties in a reinforced concrete specimen.
To investigate the effect of parameters affecting the normalized increase in arching
load (N
), each of the following parameters; axial restrained stiffness, reinforcement
ratio, span depth ratio and concrete compressive strength will be further looked at in
detail. For this purpose, a simplified version of the theoretical model for arching action
which takes into consideration the key parameters affecting arching action is derived
in the section that follows.
3.4 A simplified formulation for arching action
As shown in the preceding sections, the trend of the maximum compressive arching
action varies in test from different researchers, due to the wide range of geometric and
material properties considered. This variation is mainly due to the span depth ratio,
reinforcement ratio, concrete strength and axial restraint of the supporting end. To have
an in depth understanding of the effect of these parameters requires extensive
experimental studies which may be costly. On the other hand, the trends of the effect
of these parameters on arching capacity may be established more generally with the
assistance of a mechanics-based simplified model. To this end, a simplified theoretical
model for arching compression is presented in this section. This model follows the
approach by Rankin and Long (1997) in that it considers the maximum arching action
capacity to be contributed by bending and arching actions, but further considers the
contribution from compressive reinforcement which is ignored in Rankin and Long’s
model.
The scope of the formulation here is confined to the maximum compressive arching
capacity. A more comprehensive theoretical model on compressive arching action

Chapter 3 Critical evaluation of compressive arching action-
a semi empirical study
77
which takes into consideration the compounding effect of bending and arching and
able to predict the complete load-displacement response within the arching effective
regime is presented in Chapter 5.
Consider the rigid body rotation analogy shown in Figure 3.16. Based on
compatibility, the relationship between the compression zone depth and middle
displacement can be expressed as shown. The definitions of the relevant geometric
parameters are also illustrated in the figure.
Figure 3.16: “Rigid” body rotation analogy for arching deformations
222 )'()()( BBBABA (3.4)
22
1
2
2)]([()( xdLxL (3.5)
Expanding Equation (3.5) and ignoring second order increment ( ) terms,
212 222 dLxLxL (3.6)
Noting L/ , it can be found that
2
21
dxx (3.7)
Centre of
rotation
L
d-x1
x1 d-x2
x2 O
A A' B
B'
C C' D
D'
δ
N
N
dN

Chapter 3 Critical evaluation of compressive arching action-
a semi empirical study
78
Assuming the compression depths at the end and middle section are the same,
42
21
dxx (3.8)
Using a reference block distribution of compressive stress at fc, the arching
compressive force on each side is:
)42
(
d
bfN cr (3.9)
Now consider that from the beginning up until maximum arching effect, the concrete
compressive stress distribution changes from a “linear” distribution (and magnitude
“zero”) to the final rectangular block, it is reasonable to introduce a proportioning
factor to define the development of the equivalent arching axial force, as:
]/))[(42
()( rc
r
cr
L
dbfNN
(3.10)
where is a compressive strain factor relating the rotation ( /L) to the concrete
compressive stress. c is the current compressive strain (corresponding to ), r is a
reference edge strain marking the attainment of a full plastic compression zone. For
detail analysis, coefficient for and r may be obtained through FE simulation studies.
However, in the present illustration the exact values of these coefficient are not
required.
Thus, the additional moment due to arching compression can be written as:
]2
)[)()(42
( 21)(
xxd
L
dbfdNM
r
cNrigidN
(3.11)
Substituting the expression for 1x and 2x into equation (3.11) assuming they are equal
gives:
]4
3
2)[)()(
42(
)(
d
L
dbfM
r
crigidN (3.12)

Chapter 3 Critical evaluation of compressive arching action-
a semi empirical study
79
]16
3
24)[
1)(( 32
2
)(
dd
LbfM
r
crigidN (3.13)
The “maximum” arching effect may be found by setting the derivative of Equation
(3.13) with respect to δ equal to zero:
0)(
rigidNM (3.14)
0]16
9
4[ 2
2
dd
(3.15)
Rearranging Equation (3.15) gives:
0416)(9 2 dd
(3.16)
Solving the quadratic Equation (3.16):
3.0d
or d3.0 (3.17)
Substituting d3.0 in Equation (3.13), the additional moment due to arching can be
obtained as:
)(035.0)( 2)(
L
ddbfM
r
crigidN
(3.18)
With Equation (3.18), the additional moment due to arching can be calculated.
However, the above expression was derived considering a rigid body rotation of beam
with full axial restraint. More so, the compression reinforcement at the end and middle
section of beam was not considered in the formulation. This will lead to the inaccurate
prediction of the additional moment due to arching.
Now, consider again the rigid body rotation same as that shown in Figure 3.16 but with
flexible axial restraint.

Chapter 3 Critical evaluation of compressive arching action-
a semi empirical study
80
Figure 3.17: “Rigid” body movement of beam with consideration of flexible restraint
Following similar approach as before, the compatibility conditioned yields:
222 )()()( BBBABA (3.19)
22
1
2
2 )]()[()( xdtLxL (3.20)
Expanding, ignoring second order increment ( ) terms
2
122222 LtdLxLxL (3.21)
Noting that L/ and a
KNt /
L
K
Ndxx
a
.2
21 (3.22)
Comparing Equations (3.7) and (3.22) it is seen that the presence of flexible axial
restraint stiffness manifest as a reduction in the compression zone depth. For very large
value of Ka, Equation (3.22) reduces to Equation (3.7).
Now, noting that part of the compression zone depth has been used up by bending, the
compression zone depths for arching alone at the end and middle section can be
expressed as:
Centre of
rotation
L+ t
d-x1
x1 d-x2
x2
O
A A'
B' B''
C C' D
D'
B

Chapter 3 Critical evaluation of compressive arching action-
a semi empirical study
81
21
'
2
'
1.
2bpbp
a
xxL
K
Ndxx
(3.23)
where '
1x and '
2x are the depth attributed to arching at the end and middle section and,
1bpx and 2bpx are the compression zone due to bending at end and middle section which
is simplified as:
bf
Afx
c
sty
bp85.0
'
1 (3.24)
bf
Afx
c
sty
bp
85.02 (3.25)
Equilibrium of forces in the arching effective regime assuming compression rebar
yields may be expressed as:
ysccyscc fAbxffAbxf '2'
'1 85.085.0 (3.26)
Substituting the expression for N (using end section) into Equation (3.23) and
simplifying further yields:
21'''
12
)85.0
1(2 bpbp
a
ysc
a
c xxK
LfAdx
K
bLfx
(3.27)
The depth of arching compression '
1x and '
2x can be determined by solving Equations
(3.26) and (3.27) to give:
a
c
c
scscy
bpbp
a
ysc
K
bLf
bf
AAfxx
K
LfAd
x85.0
2
85.0
)(
2
'
21
'
'1
(3.28)
bf
AAf
K
bLf
bf
AAfxx
K
LfAd
xc
scscy
a
c
c
scscy
bpbp
a
ysc
85.0
)(
85.02
85.0
)(
2'
'
21
'
'2
(3.29)
Taking the arching compression zone at the end section as reference point, the
additional moment due to arching may be calculated as:

Chapter 3 Critical evaluation of compressive arching action-
a semi empirical study
82
)5.0()5.0(
]2
][85.0[
1
'
1
''
11
'
2
'
1
21
'
2
axxfAxxadfA
xxxxdbxfM
bpyscbpysc
bpbpcN
(3.30)
The additional moment due to arching can be determined using Equation (3.30). It
should however be noted that the expression for additional moment is a function of
middle column displacement ( ), thus the vertical displacement corresponding to the
maximum arching compression needs to be determined. One way of doing this is to
differentiate Equation (3.30) with respect to the displacement ( ) and solve the
differential to determine the displacement which corresponds to the maximum arching
moment. Due to the complexity of the expression, this approach may not be visible.
Since only the maximum additional moment is required in the present study, the
displacement can be incremented within a given range to obtain the additional
moment.
From experimental studies on RC assemblies with axial restraint, the displacement
corresponding to maximum arching capacity varies between 0.16 and 0.46d. Thus,
using Equation (3.30), the displacement ( ) can be varied within the range of 0.5d and
the maximum additional moment due to arching is extracted from the incremental
analysis.
After determining the maximum moment based on the approach explained above, the
additional load due to arching compression is then given as:
L
MP N
N
(3.31)
For the determination of bending capacity, herein the sectional bending moment
strength is approximated based on standard RC section analysis as:
)7.1
(bf
AfadAfM
c
sysyb (3.32)
For a general case with unsymmetrical reinforcement arrangement at end and middle
sections and considering one-half of beam, pure bending capacity can be calculated
as:

Chapter 3 Critical evaluation of compressive arching action-
a semi empirical study
83
L
MMP bmbe
b
)( (3.33)
The ratio between the additional load capacity due to arching and the pure bending
load capacity can therefore be expressed as:
b
N
N
P
P (3.34)
The flow chart showing the implementation of above procedure is shown in Figure
3.18.

Chapter 3 Critical evaluation of compressive arching action-
a semi empirical study
84
Figure 3.18: Flow chart for the incremental procedure
Compute xbe, xbm
START
Compute Pb
Input δ
i = 1
Compute arching compression depth
'1
x and '2
x
Arching moment N
M
Compute N
P
Ni
Compute Mbe, Mbm
Compute N
Ni
)1()(
iNiNMM NO
YES
Compute max
M)(iN
M
Ni
END
Ni

Chapter 3 Critical evaluation of compressive arching action-
a semi empirical study
85
3.5 Effect of parameters affecting relative increase in load due to
compressive arching action
With the simplified formulation presented in Section 3.4, the effect of parameters
affecting relative increase in load due to compressive arching action can be looked at
in a more rigorous manner. In this section, the effect of each of the parameters on
compressive arching action as observed from the existing experiments is analysed and
then followed by the detailed examination using the developed simplified model.
3.5.1 Effect of axial restraint on compressive arching action capacity
Using the simplified formulation in Section 3.4 and experimental data in Section 3.2,
the effect of axial restraint on the normalized increase in load capacity is further
investigated in more detail. To enable a consistent comparison regarding the influence
of boundary condition on this normalized increase from different tests, it is necessary
to express the axial constraint by a common factor. One obvious way of achieving this
is to normalize the axial restraint stiffness by the axial stiffness of the beam, as also
considered in Yu and Tan (2014). Herein we shall write the normalized axial support
stiffness in the following expression:
s
a
K
K
K (3.35)
where Ka is the axial stiffness of the end support and Ks is the axial stiffness of the
beam which is defined in this study with respect to the axial stiffness of a single bay
beam (to be corresponding to each of the two end supports considering symmetry) as:
L
EAKs (3.36)
where E is the elastic modulus of concrete, A is the cross-sectional area of the beam
and L is the length of one-bay beam. For experimental tests where Young’s Modulus
(E) is not stated, it is assumed to be c
f4730 according to ACI 318 code, where fc is
the uniaxial compressive strength of concrete in MPa. With this simplification, the

Chapter 3 Critical evaluation of compressive arching action-
a semi empirical study
86
different boundary conditions can be classified as strong (rigid) moderate or weak axial
restraint, as will be elaborated in detail later.
It should be noted that in some of the tests, the axial restraint stiffness of the support
system was not stated. For instance, in the tests by Vesali et al. (2013) and Vali et al.
(2015) the axial stiffness was not mentioned. However, looking at the test set up
previously shown in Section 3.2 it could be argued that such support system provided
a high axial restraint to the specimen hence support system is considered as strong
axial restraint. On the other hand in the test by Sadek et al. (2011), the test set up was
not enough rigid, hence axial movement of the beam-end could not be prevented thus
such restraint can be classified as weak.
Based on the above explanation, the axial restraint stiffness coefficients for all the
specimens are calculated and presented in Table 3.7. For comparison purposes, the
axial restraint stiffness coefficient calculated in Yu and Tan (2014) is also presented.
Specimens for which the axial restraint stiffness were not provided such as in Vesali
et al. (2013) and Vali et al. (2015) are assigned a high axial stiffness of 1.0 x 10⁶ KN/m
because the support system is close to rigid. A marked variation in the axial stiffness
can be observed in this Figure with stiffness ratio ranging between 0.3 and 3.5.

Chapter 3 Critical evaluation of compressive arching action-
a semi empirical study
87
Table 3.7: Comparison of axial restraint stiffness from experimental data set
Spec.
ID Reference
Axial
stiffness
(KN/m)
Lt
(mm)
L
(mm)
Ec
(MPa)
A
(mm2)
tc
a
a
LAE
K
/)(
LAE
K
c
aa
/)(
A1
(Su et al.
2009) 1.00E+06
2700 1225 22857 45000 2.50 1.19
A2 2700 1225 23897 45000 2.39 1.14
A3 2700 1225 25135 45000 2.27 1.08
A4 2700 1225 21581 45000 2.65 1.26
A5 2700 1225 23165 45000 2.46 1.18
A6 2700 1225 24065 45000 2.37 1.13
B1 4200 1975 19407 45000 4.58 2.26
B2 5700 2725 19769 45000 6.10 3.06
B3 5700 2725 20670 45000 5.83 2.93
C1 2700 1225 17943 20000 7.16 3.41
S1 (Yu & Tan
2013a) 1.06E+05
5750 2750 25152 37500 0.62 0.31
S2 5750 2750 25152 37500 0.62 0.31
S3
(Yu & Tan
2013c) 4.29E+05
5750 2750 27813 37500 2.25 1.13
S4 5750 2750 27813 37500 2.25 1.13
S5 5750 2750 27813 37500 2.25 1.13
S6 5750 2750 27813 37500 2.25 1.13
S7 4550 2150 27813 37500 1.78 0.88
S8 3350 1550 27813 37500 1.31 0.64
V1
(Vesali et al.
2013) 1.00E+06
4400 2110 24852 32400 5.2 2.49
V2 4400 2110 23383 32400 5.53 2.65
V3 4400 2110 24648 32400 5.24 2.51
V4 4400 2110 22946 32400 5.63 2.70
V5 4400 2110 24441 32400 5.29 2.53
V6 4400 2110 24648 32400 5.24 2.51
V1*
(Vali et al.
2015)
1.00E+06
4400 2110 36834 32400 3.51 1.68
V2* 4400 2110 36834 32400 3.51 1.68
V3* 4400 2110 31177 32400 4.14 1.99
V4* 4400 2110 31177 32400 4.14 1.99
V5* 4400 2110 19091 32400 6.77 3.25
V6* 4400 2110 19091 32400 6.77 3.25

Chapter 3 Critical evaluation of compressive arching action-
a semi empirical study
88
To further investigate the effect of axial restraint herein the simplified theoretical
formulation derived in the Section 3.4 is used. The beam geometry for the study is 150
by 300mm with the original span length (half of the test double-span specimen) of
1.2m giving L/d ratio of 4. Reinforcement consisted of 2 no. Ф12mm top and bottom.
Concrete compressive strength is 30MPa and yield strength of reinforcement is
500MPa. The only variable is the axial restraint stiffness (Ka) which is varied between
5000 to 1010 KN/m representing very small to very large axial restraint. For each axial
restraint stiffness (Ka) considered, the normalized axial support stiffness (αK) is
calculated according to Equation (3.37) the corresponding normalized increase in load
capacity is determined.
The results of the analysis are presented in Table 3.8, and the relationship between the
normalized increased in load due to arching and the normalized axial stiffness is shown
in Figure 3.20. The rate of increase in load decreases as the axial stiffness increases.
This is similar to the findings by Yu and Tan (2014).
Table 3.8: Effect of axial stiffness coefficient on the normalized increase in load due to arching
Ka (KN/m) Ks (KN/m) αK N
5000 971520 0.0051 0.16
10000 971520 0.0103 0.32
20000 971520 0.0206 0.51
50000 971520 0.0515 0.77
100000 971520 0.1029 0.95
200000 971520 0.2059 1.08
500000 971520 0.5147 1.22
10000000 971520 1.0293 1.28
20000000 971520 2.0586 1.3
50000000 971520 5.1466 1.36
100000000 971520 10.2931 1.4
1000000000 971520 102.9315 1.4

Chapter 3 Critical evaluation of compressive arching action-
a semi empirical study
89
Figure 3.19: Effect of axial restraint stiffness on normalized CAA capacity
Using a coarse approximation as indicated by the dash red line, the expression for the
effect of flexible axial support on arching effect can be written as:
)(
001.0lg5lg
001.0lglgRigidN
k
N
(3.37)
This simplifies to:
50.001for 35lg
3lgK)(
RigidN
k
N (3.38)
and
0N
if 001.0k
, (3.39)
)( RigidNN if 5
k . (3.40)
The implication of the above expression is that if the N
coefficient for all the
specimens are calculated and converted to rigid )(rigidN
the converted all “rigid”
support cases will follow the fit shown in blue dashed line in Figure 3.19 (obviously
0
0.2
0.4
0.6
0.8
1
1.2
1.4
1.6
0.001 0.01 0.1 1 10 100 1000
∆ω
N
αK
ΔωN(rigid)

Chapter 3 Critical evaluation of compressive arching action-
a semi empirical study
90
for the L/d = 9 and 12 groups the original N
will remain. The trend now should
indicate a clearer and consistent relationship.
Figure 3.20: Illustration of the arching effect vs. L/d with all data “corrected” to
rigid end supports.
3.5.2 Effect of reinforcement ratio on compressive arching action capacity
The effect of reinforcement is considered in a broader sense using a common
normalising factor. From the semi-empirical view point, there may be different ways
to consider the effect of reinforcement ratio on CAA capacity. One approach is to
consider the absolute difference in the tension and compression reinforcement. The
shortcoming of this approach is that for a symmetrical reinforcement arrangement, the
difference between tension and compression reinforcement becomes zero. Thus, two
different RC assemblies with different symmetrical reinforcement arrangement having
different enhancement factor will have the same difference in reinforcement ratio (zero
in this case). An alternative approach is to consider the geometric area of tension
reinforcement at the support and middle sections as used in Su et al. (2009) and Yu &
Tan (2014). This approach could be justified in the sense that the compression zone
0
0.2
0.4
0.6
0.8
1
1.2
1.4
1.6
1.8
2 4 6 8 10 12 14
∆ω
N=
(Pa-Pf)/P
f
L/d ratio
Su et al. (2009)
Sadek et al. (2011)
Yu and Tan (2013)
Yu and Tan (2014)
Vesali et al. (2013)
Vali et al. (2015)
Corrected rigid

Chapter 3 Critical evaluation of compressive arching action-
a semi empirical study
91
available for arching is deducted by the amount of compression zone used for
balancing the tension yielding of reinforcement. Although, this gives a consistence
indication of the effect of reinforcement on arching capacity, it may not be applicable
in the case with very high compressive rebar compared to tension rebar. However, it
could be argued that in a typical buildings design, the support reinforcement is either
equal to or greater than the span reinforcement hence this approach is suitable within
the range of reinforcement ratio commonly used in practice. Thus, this approach is
adopted in the present study.
The analysis is performed using the simplified model presented in section 3.4. The
geometry of the beam is 150 by 300mm and length of one-half beam is 1800mm.
Concrete and reinforcement strength are 30 and 500MPa, respectively. Different
combinations of reinforcement ratios are considered such that the machanical
reinforcement ratio ( ) as defined by Equation (3.39) ranges from 10 to 55%. The
axial restraint in the analysis is defined 106 KN/m.
The result of the analysis is presented in Table 3.9 and the plot of normalized increase
in load against the mechanical reinforcement ratio is shown in Figure 3.21. It can be
seen that the trend is similar to that reported in Yu & Tan (2014) and it shows that the
normalized increase in load due to arching reduces as the reinforcement ratio increases.
A key observation herein is that while the normalised increase in load due to arching
shows a very wide margin of variation (0.52 to 1.81), the absolute difference between
maximum arching capacity (Pa) and bending capacity (Pf) shows minimal variation
ranging from 79.1 to 70.9KN for a wide range of mechanical reinforcement ratio
considered in this study ( =13.3 to 47.5%). This means that reinforcement ratio has
less effect on the absolute difference between arching and bending capacities but a
very considerable effect when this difference is normalised by the bending capacity.
This is very much due to the increase in bending capacity with increase in
reinforcement ratio keeping other factors constant.

Chapter 3 Critical evaluation of compressive arching action-
a semi empirical study
92
Table 3.9: Effect of mechanical reinforcement ratio on normalized increased in load
Figure 3.21: Effect of reinforcement ratio on relative increase/decrease in normalized
increase in load capacity (normalized with bending capacity)
To consider the effect of mechanical reinforcement ratio in a semi empirical manner
as would be shown later, it may be necessary to expressed Figure 3.21 in terms of
relative factor. Herein a mechanical reinforcement ratio of 20% is adopted as a base
reference and the factor for other mechanical reinforcement ratios are determined from
this reference point.
0
0.2
0.4
0.6
0.8
1
1.2
1.4
1.6
1.8
2
0 10 20 30 40 50
∆ω
N
ψ (%)
Reinforcement ratio
c
y
f
f
(%)
Pf
(KN)
Pa
(KN)
Pa–Pf
(KN) N
Top Bottom
2T10 (0.4%) 2T10 (0.4%) 13.3 43.6 122.7 79.1 1.81
3T10 (0.59%) 2T10 (0.4%) 16.5 53.7 131.6 77.9 1.45
3T12 (0.85%) 2T10 (0.4%) 20.8 66.6 142.3 75.7 1.14
3T12 ((0.85%) 2T12 (0.57%) 23.6 75.6 152.3 76.7 1.01
3T12 (0.85%) 3T12 (0.85%) 28.3 89.6 167.2 77.6 0.87
3T16 (1.52%) 3T12 (0.85%) 39.5 118.7 194.4 75.7 0.63
4T16 (2.0%) 3T12 (0.85%) 47.5 137.5 208.4 70.9 0.52

Chapter 3 Critical evaluation of compressive arching action-
a semi empirical study
93
Figure 3.22: Effect of reinforcement ratio on relative increase/decrease in N
From Figure 3.22, a simple expression relating the arching factor to the mechanical
reinforcement ratio correction factor can be expressed as:
NN
(3.41)
where 97.0)(14.19
3.5.3 Effect of span depth ratio on compressive arching action capacity
To further investigate the effect of L/d ratio on normalized increase in load due to
arching, the simplified theoretical model developed in Section 3.4 is used. There may
be two different approaches to obtaining the effect of L/d. One approach is adopting a
constant depth and varying the beam length to obtain different L/d ratios. Another
approach is fixing the beam length and varying the section depth to get different L/d
ratio. Noting that arching effect is more sensitive to the depth than the length, the
second approach is adopted in investigating the L/d ratio.
The length of the beam is fixed at 3600mm while the width is 150mm. Reinforcement
consist of 3no and 2no ф14mm top and bottom section respectively and concrete
ɣ = 19.141(ψ)-0.97
0
0.2
0.4
0.6
0.8
1
1.2
1.4
1.6
1.8
0 10 20 30 40 50
rela
tive
fac
tor
(Ɣρ)
ψ (%)

Chapter 3 Critical evaluation of compressive arching action-
a semi empirical study
94
strength is 30MPa. Full axial restraint is assumed for the end supports. Five different
depths of 300, 360, 450, 600 and 900mm are used which result in L/d ratio of 4, 6, 8,
10 and 12. The plot of the normalized increase in load (N
) and the respective L/d
ratio is shown in Figure 3.23. It can be seen that effect of L/d ratio on normalized
increase in load decreases as the L/d ratio decreases. The result is in line with the
experimental result from literature for the effect of L/d.
Figure 3.23: Effect of L/d ratio on N from simplified model
To consider the effect of L/d in the simplified empirical form it may be reasonable to
express the L/d effect in terms of a relative factor taking L/d ratio of 4 as a base
reference as shown in Figure 3.24.
0
0.5
1
1.5
2
2.5
0 2 4 6 8 10 12 14
Δω
N
L/d ratio

Chapter 3 Critical evaluation of compressive arching action-
a semi empirical study
95
Figure 3.24: Effect of L/d ratio relative factor with L/d=4 as a base reference
From Figure 3.24, the expression for the effect of L/d ratio on normalised load can be
expressed as:
NdLdLN *
// (3.42)
where 91.0
/)/(*52.3 dL
dL
3.5.4 Effect of concrete compressive strength
Concrete has a slight effect on compressive arching action as shown in Section 2.6.4
of Chapter 2, However, it could be argued that effect of concrete strength has already
been considered indirectly in the axial stiffness effect and reinforcement ratio factor.
Hence, concrete effect is not considered separately.
γL/d= 3.52*(L/d)-0.91
0
0.2
0.4
0.6
0.8
1
1.2
0 2 4 6 8 10 12 14
Rel
ativ
e fa
cto
r (γ
L/d
)
L/d ratio

Chapter 3 Critical evaluation of compressive arching action-
a semi empirical study
96
3.6 Empirical method for the prediction of the arching effect
3.6.1 Consideration of effect of the parameters
Given the above evaluation on the L/d ratio, axial stiffness ratio, and reinforcement
factors it would be possible to generate empirical prediction formulas for the prediction
of the arching effects, at least for the correction factors to take into account of the span
depth ratio (L/d), axial support stiffness and reinforcement factor effect, assuming the
arching action for a standard reference case of a given L/d is available.
Herein the standard reference case is considered as axially rigid RC beam with L/d
ratio of 4. The beam geometry is 150 by 300mm and reinforcement of 2no ф12mm at
top and bottom sides of cross section, respectively. Yield strength of reinforcement is
taken as 500MPa.
i) The compressive arching capacity of this reference beam is determined using the
simplified theory developed in Section 3.4 as:
KNPa
222 (3.43)
Bending moment of the section is calculated as:
KNm28)7.1
( bf
AfadAfM
c
sysyb (3.44)
Flexural capacity is calculated as:
KN3.93/2*2 LMP bb (3.45)
Normalized increase in load capacity for the reference RC beam ()(Re fN
) becomes:
38.1)(Re
f
fa
fN
P
PP (3.46)
ii) Bringing in the L/d ratio effect:

Chapter 3 Critical evaluation of compressive arching action-
a semi empirical study
97
)(Re//*
fNdLdLN (3.47)
Substituting Equation (3.46) in (3.47) gives
dLdLN //38.1 (3.48)
where 91.0
/)/(*52.3 dL
dL
iii) Bringing in the axial support flexibility effect:
)(
35lg
3lgRigidN
k
NK
for 5001.0 k (3.49)
Now, Equation (3.49) can be written as:
)38.1(35lg
3lg/ dL
k
NK
(3.50)
iv) Bringing in the reinforcement ratio effect:
K
NN * (3.51)
where 97.0)(14.19
Substituting Equation (3.50) into (3.51) gives:
)38.1(*35lg
3lg*)(14.19
/
97.0
dL
k
N
(3.52)
Equation (3.52) gives an expression that considers the effect of reinforcement ratio,
L/d ratio and axial flexibility.
Recalling that;
f
fa
N
P
PP (3.53)

Chapter 3 Critical evaluation of compressive arching action-
a semi empirical study
98
The ratio of the maximum arching to the bending capacity (Ca) can then be expressed
as:
N
b
a
a
P
PC 1 (3.54)
For a given RC beam with a defined geometric and material properties, the ratio of
maximum arching compression capacity to the bending capacity can be obtained by
Equation (3.54).
3.6.2 Validation of the proposed semi empirical formulae
The series of semi empirical formulas derived in Section 3.6.1 are used to predict the
ratio of maximum arching to bending capacities. The result is compared with the
experimental result. As shown in Figure 3.25, the discrepancies between the predicted
and test values are very small. As can be seen, a strong correlation exists between the
predicted and test result with a correlation coefficient of 0.996 which represent a
positive correlated result. It should however be mention that part of the discrepancy in
the test by Yu & Tan (2013b) may be due to the connection gaps that existed between
the test set up and end columns of the specimen during the test which affected the
compressive arching action that could actually develop. Notwithstanding these minor
differences, the empirical expressions can to reasonable level of accuracy predict the
arching capacity in a laterally restrained subassembly.

Chapter 3 Critical evaluation of compressive arching action-
a semi empirical study
99
Table 3.10: Comparison of experimental and predicted result
Specimen ID Axial stiffness
(KN/m)
LAE
K
c
aa
/)(
Ca =Pa/Pf
Predicted
Ca = Pa/Pf
(Test) )(
)(
predicteda
testa
C
C
A1
1.00E+06
1.19 2.58 2.55 0.99
A2 1.14 2.16 2.28 1.06
A3 1.08 1.97 1.89 0.96
A4 1.26 2.68 2.62 0.98
A5 1.18 2.31 2.44 1.06
A6 1.13 2.07 2.13 1.03
B1 2.26 1.64 1.62 0.99
B2 3.06 1.32 1.49 1.13
B3 2.93 1.43 1.59 1.11
C1 3.41 1.35 1.61 1.20
S1 1.06E+05
0.31 1.35 1.26 0.93
S2 0.31 1.40 1.32 0.94
S3
4.29E+05
1.13 1.42 1.33 0.93
S4 1.13 1.36 1.32 0.97
S5 1.13 1.30 1.24 0.95
S6 1.13 1.28 1.13 0.89
S7 0.89 1.43 1.35 0.94
S8 0.64 1.55 1.43 0.92
Mean value of test to predicted ratios 0.999
Correlation coefficient 0.996

Chapter 3 Critical evaluation of compressive arching action-
a semi empirical study
100
Figure 3.25: Correlation of predictions with test results for different L/d ratios
3.7 Conclusions
On the basis of survey and collection of data on compression arching in a laterally
restrained RC beam, the effect of parameters affecting the arching compression have
been succinctly studied. Axial restraint stiffness, reinforcement ratio, concrete
compressive strength and span depth ratio all have effect on the arching compression.
The reinforcement ratio affects the maximum arching compression capacity but has
lesser effect on the relative increase in load between the maximum arching and
bending capacities whereas L/d ratio and axial restraint stiffness affect both the relative
increase due to arching and the maximum arching action that could developed.
A more reliable classification of axial stiffness should be based on the relative rigidity.
The results tend to suggest that RC assemblies with an axial stiffness coefficient (K
)
greater than 5 can reasonably be considered as having a rigid support, and for stiffness
coefficients lower than 5, the arching compression should be scaled down accordingly.
0
0.2
0.4
0.6
0.8
1
1.2
1.4
0 2 4 6 8 10 12 14
Ca
(tes
t)/C
a(p
red
icte
d)
L/d ratio

Chapter 4 Numerical modelling of reinforced concrete beam assembly under a
progressive collapse scenario
101
Chapter 4: Numerical modelling of reinforced
concrete beam assembly under a progressive collapse
scenario
4.1 Introduction
To fully understand the behaviour of reinforced concrete subassemblies under column
removal, experimental tests are required in which various design parameters may be
varied to better understand the governing mechanisms and the influences of the
parameters in question. Such test does not only require time for planning and
execution, but it is also capital intensive. An alternative to experimental tests may be
to use finite element method. In recent years, several studies on behaviour of RC and
composite beams under large deformation have been executed using finite element
analysis (Yang & Tan 2014; Albrifkani & Wang 2016; Lew et al. 2014; Pham et al.
2016). This is due to the advancement in the finite element method (FEM) and the
availability and affordability of high speed computers.
There are numerous finite element codes which can be used to simulate the behaviour
of RC structure subjected to extreme event. Example of these codes are
ABAQUS/Explicit (Dassault Systèmes, 2007), LS-DYNA (LSTC 2012), ADINA
(ADINA 2006), Autodyn (ANSYS 2009). Each of these codes has a large library of
material models which can simulate the behaviour of reinforced concrete structural
elements under a variety of loading conditions. However, the accuracy of such
numerical models depends on the soundness of the material models in capturing the
constitutive behaviour of materials under different stress conditions and the interaction
between concrete and reinforcement. Due to complexities of the concrete material,
there does not exist a material model that is recognised to be capable of describing the
behaviour of concrete across different loading and deformation regimes. This means

Chapter 4 Numerical modelling of reinforced concrete beam assembly under a
progressive collapse scenario
102
different applications require dedicated research effort in the development and
validation of the finite element model.
In the present study, an explicit finite element code LS-DYNA is adopted to model the
behaviour of RC subassemblies. LS-DYNA has a number of constitutive material
models which are capable of simulating the behaviour of concrete including cracking
and softening. Some of the widely used concrete material models in LS DYNA library
include Continuous Surface cap model (MAT_159), Winfrith_Concrete (MAT_84),
Riedel-Hiermaier-Thoma model (RHT) and Karagozian and Case Concrete Damage
REL3 (KCC) model. A comparative studies of the these models shows that they are
capable of capturing the confinement factor, post-peak softening, strain rate effect and
shear dilation (Brannon & Leelavanichkul 2009). Herein, the KCC model is selected
as the material model for concrete. This model has a user-friendly input setting
compared to other three models mentioned above. For modelling longitudinal and
transverse reinforcement, a PIECEWISE_LINEAR_PLASTICITY (MAT_024) is
adopted.
In this chapter, the background of KCC model is first presented, issues commonly
encountered in the simulation of reinforced concrete assemblies under large
deformation such as hour glassing effect, mesh size sensitivity and strain localization
in rebar at large deformation are discussed. Finally, the developed modelling scheme
is validated through benchmarking against available experiment in the literature.
4.2 Background of KCC model
The performances of KCC material model for concrete under different loading and
stress condition are well documented in the literature (Magallanes et al. 2010;
Crawford et al. 2012; Magallanes 2008; Malvar et al. 1997). To facilitate some more
specific discussion into the model behaviour when applied in the simulation of RC
beam assemblies under large deformations, a brief overview of the basic formulation
of this material model is given in this section.

Chapter 4 Numerical modelling of reinforced concrete beam assembly under a
progressive collapse scenario
103
KCC concrete material model has three independent strength surfaces. These include
the yield, maximum and residual surfaces. These surfaces are defined using eight
parameters which include; a0m, a1m, a2m for maximum surface, a0y, a1y, a2y for yield
surface and a1r, a2r for residual surface. These values are determined and validated
using standard test on concrete (Crawford et al. 2012). At each incremental time step,
the current strength surface is interpolated between the yield and the maximum
surfaces or the maximum and the residual surfaces together with the damage
accumulation parameter. A schematic representation of the three surfaces are shown
in Figure 4.1. The state of stress at any increment is determined by Equation (4.1).
Figure 4.1: Three strength surfaces represented in K&C model (Mat_072R3) (Malvar
et al. 1997)
])([
])([
rrm
yym
m
m
(4.1)
where y ,
m and
r represent the yield, maximum and residual surfaces and are defined
by Equation (4.2).

Chapter 4 Numerical modelling of reinforced concrete beam assembly under a
progressive collapse scenario
104
surfaceresidualp
p
surfaceimump
p
surfaceyieldp
p
rr
y
mm
my
yy
yy
max
21
21
0
21
0
(4.2)
With Equations (4.1) and (4.2), the three surfaces shown in Figure 4.1 are defined. As
mentioned previously, the state of stress at each time increment is interpolated between
two surfaces: yield and maximum surfaces when hardening occurs and maximum and
residual surfaces when concrete enters the softening regime. This is achieved using the
eta function (𝜂) in Equation (4.1). is a function of a variable lambda )( which
measures the state of damage at a particular time increment and is defined as shown in
Equation (4.3).
p
ij
p
ijh )3/2( (4.3)
where h is defined as:
(tension) 0
1
1
on)(compressi 0
1
1
2
1
pfor
fr
pr
pfor
fr
pr
h
b
tf
f
b
tf
f
(4.4)
In Equation (4.4), 𝑟𝑓 is a rate scalar, ft is the tensile strength, b1 and b2 are factors that
controls the rate of accumulation of damage in tension and compression. With these
parameters different behaviour of concrete in tension and compression can be defined.
The default values for b1 and b2 are 1.6 and 1.35 and default eta-lambda (η-λ) curve in
KCC model is shown in Figure 4.2.

Chapter 4 Numerical modelling of reinforced concrete beam assembly under a
progressive collapse scenario
105
Figure 4.2: Default η-λ curve in KCC model
4.2.1 Performance of KCC model
In Section 4.2, it was shown that damage accumulation in KCC model is determined
from the η-λ curve together with the b1 and b2 which are parameters that controls the
rate of damage accumulation in tension and compression. Previous study by Xu and
Lu (2016) however reveals that the concrete modelled by KCC in a RC member
subjected to blast load tends to fail abruptly, especially in the region interacting with
the reinforcing bars. This was attributed to the quick descending of the tensile strength
to zero in the softening regime thereby resulting in a state of no stress in concrete
surrounding the rebar.
For relatively simple loading and stress conditions, the default setting of KCC model
may give good prediction. However, in a complex stress condition where concrete-
rebar interaction (through shear or bond) dominates (Xu and Lu, 2016), the default η-
λ curve could fail to capture the behaviour of RC elements. This problem may be more
severe in the case of large deformation of RC element during which the rebar
anchorage in concrete becomes crucial, particularly in the development of the catenary
action. To carter for the need of the present study, a concrete model which is versatile
and able to predict the response of the structure under different stress conditions and
0
0.2
0.4
0.6
0.8
1
1.2
0 0.0001 0.0002 0.0003 0.0004 0.0005 0.0006
eta
(η)
lambda (λ)

Chapter 4 Numerical modelling of reinforced concrete beam assembly under a
progressive collapse scenario
106
loading without the need to explicitly define a bond slip relationship is desired. To
achieve this objective, the softening behaviour of concrete in tension and shear is a
critical factor, and to ensure a good representation of such properties of the concrete
the η-λ curve in KCC model is modified.
The behaviour of concrete is governed by cracking in tension and crushing in
compression in a case where adequate confinement is provided. There are numerous
ways in which the tensile behaviour of concrete may be depicted. In spite of this, a
general practice is that a target fracture energy, which is energy required to propagate
a tensile crack of unit area, should be preserved. In this sense, the fracture energy is
considered as a material property and therefore should be independent of the mesh
size. To ensure the independency of the macroscopic tensile behaviour from the mesh
size, the fracture energy is normally tied to the element length, so that the stress-strain
relation in the softening regime varies with the element size (hc) but the integral over
the element width remains constant,
cf hdG )( or cf hGd /)( (4.5)
Depending on the material models, the softening stage may be represented in different
ways, but if a targeted fracture energy is preserved as depicted in (c) to (f) in Figure
4.3, similar results can be achieved, especially in small deflection problems.

Chapter 4 Numerical modelling of reinforced concrete beam assembly under a
progressive collapse scenario
107
Figure 4.3: Tension softening for modified Maekawa model (adopted from DIANA
manual)
However, in the case of extremely large deformation with multiple tension cracks as
in the present study, the state of concrete-rebar interaction will tend to play
increasingly important role, and without explicit modelling of the bond interface, a
robust description of the tensile stress-strain curve is necessary. This is equivalent to
an implicit representation of rebar-concrete bond which is generally less brittle than
direct tension of concrete, such that a minimal interaction between concrete and steel
after cracking of concrete in tension will be maintained. This can be achieved by
modifying the softening portion of the tension stress-strain curve of concrete to allow
for a prolonged residual capacity.
To achieve this, the η-λ curve is modified to yield a stress-strain relationship similar
to that of a power form stress strain relationship proposed by Maekawa et al. (2003)
and shown in Figure 4.4. In the Figure, εcr is the cracking strain and c determines the
rate of decrease in tension after cracking and depends on the type of reinforcement
used (plain or deformed). Herein, the reinforcements are assumed to be deformed,
hence c is selected as 0.4. This approach has been found to give reasonable result in
studies on large deformation of reinforced concrete beam (Albrifkani & Wang 2016).
Similar stress-strain behaviour of concrete in tension with residual stress gave accurate

Chapter 4 Numerical modelling of reinforced concrete beam assembly under a
progressive collapse scenario
108
result in modelling large deformation behaviour of composite connections (Guo et al.
2013).
Figure 4.4: Stress strain relationship of concrete in tension (Maekawa et al. 2003)
Unlike in some other concrete models for example the concrete damage plasticity
model (CDP), where concrete tensile and compressive behaviour are defined
independently, in KCC model the concrete compressive and tensile behaviours are
defined in a combined manner. This implies that any modification (enhancement) of
tensile behaviour would result in over-ductile behaviour of concrete in compression.
To control this, the b1 and b2 parameters in the model are modified accordingly thereby
allowing the much desired behaviour in tension and compression to be determined.
The effect of these parameters on a single element simulation test is investigated in the
next section.
4.2.1.1 Single element simulation
A single cubic element of size 25mm is used for the simulation. The compressive
strength of concrete is taken as 30MPa. Due to the softening branch, a displacement
control loading is adopted. In the study by Xu and Lu (2016), the η-λ curve with
maximum λ of 0.004 was found to give reasonable result for blast loading. In this
study, the η-λ curve is modified to give a stress-strain response with a prolong residual
capacity similar to the stress-strain response by Maekawa et al. (2003) depicted in

Chapter 4 Numerical modelling of reinforced concrete beam assembly under a
progressive collapse scenario
109
Figure 4.4. The η-λ curve used for the single element simulation test is shown in Figure
4.5. Parameters controlling damage accumulation in compression (b1) and tension (b2)
are taken to be 1.2 and 1.35.
Figure 4.5: Modified η-λ curve with and without residual capacity
The result of the tensile stress-strain response for the single element simulation test
and the prediction by Maekawa et al. (2003) is shown in Figure 4.6. In the Maekawa
et al. (2003), the critical stress is determined as 0.33√fc but in the comparison shown
in Figure 4.6, the critical (maximum) stress from FE simulation test is used in the
Maekawa et al. (2003) model to predict the tensile stress-strain behaviour. It can be
observed that the descending branch of the curve is similar in both the FE and predicted
models. The stress increases up to the maximum value of 3MPa and followed by
softening. At a strain of 0.02, the residual stress is around 0.4MPa in both models.
0
0.2
0.4
0.6
0.8
1
1.2
0 0.002 0.004 0.006
eta
(η)
lambda (λ)

Chapter 4 Numerical modelling of reinforced concrete beam assembly under a
progressive collapse scenario
110
Figure 4.6: Uniaxial stress-strain curve of single element simulation test (element
size=25mm)
The compressive stress-strain behaviour for the model is shown in Figure 4.7. A close
look at the Figure shows that the peak compressive stress of 30MPa occur at a strain
of about 0.0019 which is within the range of values obtain in the experimental tests
(Hognested et al. 1955; Popovics 1973). Tests in literature further shows that concrete
softens after attaining the maximum compressive strength. This behaviour is exhibited
in the simulated stress strain behaviour as shown in Figure 4.7.
0
0.5
1
1.5
2
2.5
3
3.5
0 0.005 0.01 0.015 0.02
stre
ss (
MP
a)
strain
Maekawa et al, 2003
FE

Chapter 4 Numerical modelling of reinforced concrete beam assembly under a
progressive collapse scenario
111
Figure 4.7: Uniaxial compressive stress-strain curve of single element simulation test
(element size=25mm)
With confinement, the compressive strength of concrete is enhanced compared to the
strength of unconfined concrete. Experimental tests shows that the strength of confined
concrete depends on the level of confinement and increases as the confinement
increases (Ansari & Li 1998; Imran & Pantazopoulou 1996; Moradi, Saber; Alam
2013). An experimental test showing the effect of confinement on concrete is shown
in Figure 4.8. It can be seen that the simulated behaviour (Figure 4.9) well represent
the behaviour as observed in the experiment. Thus, in the presence of confinement,
concrete strength is enhanced and the magnitude of enhancement depends on the level
of confining pressure.
0 0.1 0.2 0.3 0.4 0.5
0
5
10
15
20
25
30
35
0 0.005 0.01 0.015 0.02
deformation (mm)
stre
ss (
MP
a)
strain

Chapter 4 Numerical modelling of reinforced concrete beam assembly under a
progressive collapse scenario
112
Figure 4.8: Axial stress-strain curves of concrete under different confining pressure
(Ansari & Li 1998)
Figure 4.9: Stress-strain curves under confined compression with and without residual
capacity (mesh size=25mm)
0
20
40
60
80
100
120
140
160
180
200
0 0.01 0.02 0.03 0.04 0.05 0.06
Axi
al s
tres
s (M
Pa)
Axial strain
0MPa8.2MPa16.4MPa24.6MPa32.8MPa41MPa
0 0.5 1 1.5 2 2.5
0
20
40
60
80
100
0 0.02 0.04 0.06 0.08 0.1
deformation (mm)
stre
ss (
MP
a)
strain
unconfined
5MPa conifned
10MPa confined

Chapter 4 Numerical modelling of reinforced concrete beam assembly under a
progressive collapse scenario
113
4.2.1.2 Effect b2 on stress-strain behaviour
The tensile behaviour of concrete is very important in modelling RC assemblies
subjected to large deformation. This is because residual “bond” effect needs to be
implicitly represented through tension/shear behaviour of the concrete to allow for
accurate representation of RC member behaviour during the large deformation regime.
In KCC model, the default value of b2 is 1.35. In this section, three different values of
b2 are considered to fully understand its effect on the stress-strain behaviour of single
element under. The compression damage accumulation factor b1 is kept constant at
1.2. As shown in Figure 4.10, b2 has a minor influence in the stress strain curves. This
difference occurs within the softening stage of the response. The lower the value of b2
the higher the area under the stress-strain curve. Since the difference is very minimal,
the default value of b2=1.35 is used in the current study.
Figure 4.10: Stress-strain curves under confined compression with and without residual
capacity (mesh size=25mm)
0
0.5
1
1.5
2
2.5
3
0 0.005 0.01 0.015 0.02
stre
ss (
MP
a)
strain
b2 = 0.5
b2 = 1.0
b2 = 1.35

Chapter 4 Numerical modelling of reinforced concrete beam assembly under a
progressive collapse scenario
114
4.2.1.3 Damage definition
As mentioned previously, the damage index in KCC model is defined as:
m
SDF
2 (4.6)
where the range of SDF is from 0 to 2 and m is the value of corresponding to the
maximum value of eta (η). For 0<SDF<1, the concrete is in the pre-peak stage. When
SDF=1, concrete reaches it maximum stress and for 1<SDF<2, concrete enters
softening stage with damage continually increasing as approaches infinity.
Recent study by Xu and Lu (2016) has shown that the above scaler damage factor
(SDF) has a very narrow range of indication of the damage state of concrete. The
Scalar damage factor would need to get very close to 2 to correspond to a significant
damage state or an advanced softening stage. This is illustrated in Figure 4.11. As can
be noticed in this figure, the damage index is already close to 2 even at the early stage
of softening but with the index value it would imply that concrete is damaged and
cannot transfer stresses. This definition may give false information about the damage
accumulation in the KCC model. In view of this problem, Xu and Lu (2016) suggested
that one should discriminate severe damage with the damage scalar factor in close
range to the limiting value of 2, to be representative of the real severe damage state of
concrete. It was recommended that damage index in the range of 1.97-2.0 best
represents an advanced damage or softening state of concrete, such as macro-cracking
in tension. In the present study, this range is adopted when referring to the damage
scale factor for near-failure state of concrete. More so, the strain contour distribution
will also be used to represent the damage in concrete.

Chapter 4 Numerical modelling of reinforced concrete beam assembly under a
progressive collapse scenario
115
Figure 4.11: Uniaxial tension and damage index
4.3 Modelling of reinforcement
In small deformation problems largely dominated by elastic and limited inelastic
responses, reinforcement may be modelled as smeared over concrete. For large
deformation problems smeared approach is no longer valid because of geometric and
material nonlinearity, and reinforcement needs to be explicitly modelled. There are
two methods to explicitly embed reinforcement in concrete in an RC member, these
include shared nodes and constraint method. Perfect bond is assumed between concrete
and reinforcement in both methods, however the shared nodes option requires that the
nodes of concrete and reinforcement be meshed together. This implies that the concrete
and reinforcement nodes to be meshed must be coincident or lie within the same
proximity. In the constraint method, the reinforcement nodes need not be meshed with
the concrete nodes, instead the reinforcing bars are embedded in the concrete such that
the motion of the master nodes (concrete) and slave nodes (reinforcement) are the
same. In LS-DYNA, reinforcement can be embedded in concrete using the keyword
CONSTRAINED_LAGRANGE_IN_SOLID (CLIS). The advantage of the constraint
method over the shared nodes is that the reinforcement and concrete can be meshed
0 0.1 0.2 0.3 0.4 0.5
0
0.5
1
1.5
2
0
0.5
1
1.5
2
2.5
3
0 0.005 0.01 0.015 0.02
deformation (mm)
dam
age
ind
ex
stre
ss (
MP
a)
strain
stress strain curve
damage index

Chapter 4 Numerical modelling of reinforced concrete beam assembly under a
progressive collapse scenario
116
independently. Hence the mesh size of reinforcement does not necessarily have to be
the same with that of concrete. Herein, rebar effect is simulated using the shared nodes
option.
It should be pointed out that, although “perfect” bond is assumed in the RC modelling
herein, macroscopic bond-slip can still be observed as the concrete layer interfacing
with the rebar (through shared nodes) softens and ultimately fails during the course of
response.
4.4 Model checks
When modelling RC assemblies under large deformation, a number of checks is
required to ensure the model performs as expected. Issues such as strain localization
in rebar, mesh sensitivity and hour glass effect may affect the accuracy of the result.
Each of these issues are briefly discussed and the checks for each of them is performed.
4.4.1 Reinforcement strain localization
Strain localisation occurs when plastic strain concentrates in a particular element
within the critical section in the post yield response stage. While numerical localisation
in concrete modelling is well understood and measures such as preservation of fracture
strain energy are available to minimise its effect, localisation in reinforcing bars is
seldom examined. This phenomenon is also mesh size dependent and may be very
sensitive in the simulation of catenary action behaviour, especially the determination
of rebar rupture. As mentioned in Section 4.3, using shared nodes would imply that
the rebar element size has to be the same as concrete mesh size, making potential rebar
strain localisation less controllable from the meshing point of view.
In the simulation of RC assemblies under column loss scenario, the final failure may
be governed by rupture of rebar. The behaviour of RC assemblies during the final stage
(catenary stage) is similar to the RC beam subjected to axial tension. For this reason,
the effect of strain localisation in rebar is investigated in this section using a simple
direct tension simulation test on RC beam.

Chapter 4 Numerical modelling of reinforced concrete beam assembly under a
progressive collapse scenario
117
The beam has a width, depth and length of 40, 200 and 600mm respectively and
reinforcement consist of 2 nos. Ф10mm arranged as shown in Figure 4.12. One-half
of the beam is modelled with the two end regions modelling with “elastic” concrete to
avoid damage to the end of the beam being pulled. The end nodes of the beam on one
side are fixed against translation in all directions and all nodes at the other end are
pulled in the horizontal direction. Three different mesh sizes of 5, 10 and 20mm are
considered in the study. The FE model of the RC element with mesh size of 20mm is
shown in Figure 4.12. Concrete is modelled with KCC material model and with
concrete compressive strength of 30MPa. Reinforcement is modelled with MAT_24
and three different stress-strain curves including elastic perfect plastic, elastic plastic
with linear hardening and real hardening are considered. The three stress-strain curves
are depicted in Figure 4.13.
Figure 4.12: FE model of RC beam (mesh size=20mm)
All end nodes pulled
in horizontal direction
All end nodes constrained
in all directions
rebar

Chapter 4 Numerical modelling of reinforced concrete beam assembly under a
progressive collapse scenario
118
Figure 4.13: Different stress-strain curve used for the study
The load displacement responses of the FE models with different reinforcement stress-
strain curves are shown in Figures 4.14-4.16. It can be observed that the effect of strain
localisation in rebar is more pronounced in the RC beams with elastic-perfectly plastic
stress-strain behaviour. For instance, the difference between the failure displacement
of model with mesh size of 5mm and 20mm is 50%. Such big difference could affect
the result of the simulation. When hardening is introduced, the difference in failure
displacement is reduced to 10 and 27% for models with trilinear and real stress-strain
curves respectively.
It could be concluded from this study that when modelling RC assemblies subjected
to catenary action, the use of elastic perfectly plastic stress strain behaviour of
reinforcement may result in strain localisation causing the failure displacement to be
significantly mesh dependent. This problem could be rectified by introducing strain
hardening. It is also recommended that the effect of strain localisation may be further
reduced by using trilinear stress strain curve as indicated in Figure 4.15.
0
100
200
300
400
500
600
700
0 0.02 0.04 0.06 0.08 0.1 0.12
stre
ss (
MP
a)
strain
trilinear curvecurvilinearelastic perfectly plastic

Chapter 4 Numerical modelling of reinforced concrete beam assembly under a
progressive collapse scenario
119
Figure 4.14: Axial load-axial displacement response for model with elastic perfectly
plastic stress-strain behaviour of reinforcement
Figure 4.15: Axial load-axial displacement response for model with trilinear stress-
strain behaviour (with hardening) of reinforcement
0
10
20
30
40
50
60
70
80
90
0 1 2 3 4 5 6
Axi
al f
orc
e (K
N)
Axial displacement (mm)
5mm
10mm
20mm
0
20
40
60
80
100
120
0 10 20 30 40 50
Axi
al f
orc
e (K
N)
Axial displacement (mm)
5mm
10mm
20mm

Chapter 4 Numerical modelling of reinforced concrete beam assembly under a
progressive collapse scenario
120
Figure 4.16: Axial load-axial displacement response for model with curvilinear stress-
strain (with hardening) behaviour of reinforcement
4.4.2 Mesh sensitivity
FE simulation results are mesh sensitive and this effect may be more pronounced in
the simulation of RC assemblies where there is high level of nonlinearity leading to
softening of the material. Using a coarse mesh size may result in the stress and strain
distributions not being captured properly especially in cases where elements with
reduced integration point are used. On the other hand, very small element size will
increase the computation cost. Thus, it is important that the sizes of the elements used
in the FE model represent to a reasonable accuracy the correct stress and strain
distribution and is not overly costly computation wise. To this end, a mesh
convergence study is undertaken.
The RC subassemblies tested by Yu and Tan (2013) is used for this exploratory
analysis. The beam section was 150 mm by 250 mm and the length of one-half of the
beam assembly was 2750 mm giving a length-to-depth ratio (L/d ratio) of 11.
Longitudinal reinforcement consisted of 3 nos. Ф13mm and 2 nos. Ф13mm top and
bottom at the support section. To simplify the analysis in the present study, the end of
the beam is fixed against translation in all directions.
0
20
40
60
80
100
120
0 10 20 30 40
Axi
al f
orc
e (K
N)
Axial displacement (mm)
5mm
10mm
20mm

Chapter 4 Numerical modelling of reinforced concrete beam assembly under a
progressive collapse scenario
121
Three different mesh sizes are considered. Since the critical regions are the beam-
column interface at the end and middle column regions, the mesh size at these locations
are varied and refined but the mesh size in other areas are kept constant. The summary
of the mesh size and number of elements for the three different models are presented
in Table 1. The FE model is shown in Figure 4.17 for model A as an example. The
critical region is assumed to be within 300mm from the end and middle columns.
Table 4.1: Details of mesh size and number of element in the different models
Figure 4.17: Finite element mesh of model C
Concrete is modelled using KCC material model with uniaxial compressive strength
of 30MPa. Steel is modelled using mat_24 (PIECEWISE_LINEAR_PLASTICITY).
The reinforcement is defined by elastic-plastic behaviour with hardening. Yield and
ultimate strength is 500 and 650MPa respectively. The stress-strain relationship of
steel used in the study is shown in Figure 4.18. Noting that the stress-strain curve used
may have effect on the strain localisation, two different stress strain curves are used.
The two stress-strain curves have the same yield and ultimate strain but differs in the
hardening properties.
Model ID Model A Model B Model C
Mesh size within
critical region 12.5 x 12.5 x 15 12.5 x 12.5 x 20 12.5 x 12.5 x 25
Mesh size in other
regions 12.5 x 12.5 x 25 12.5 x 12.5 x 25 12.5 x 12.5 x 25
Number of solid
elements 34400 30080 28640
Number of beam
elements 1926 1768 1640

Chapter 4 Numerical modelling of reinforced concrete beam assembly under a
progressive collapse scenario
122
Figure 4.18: Stress-strain curves for reinforcement
The load displacement and axial force-displacement responses for the models with
trilinear and curvilinear stress-strain curves are shown in Figures 4.19 and 4.20
respectively. It is seen that the model predictions are similar, however the prediction
from model with mesh size of 25mm slightly overestimate the load capacity when
compared with predictions from models with mesh sizes of 15 and 20mm respectively.
The final failure displacement differs slightly in the models. However, this difference
is about 10% and such difference is small hence, failure displacement within these
range could be taken as correct failure displacement. Furthermore, the residual strength
after rupture of bottom reinforcement could not last for a prolong time before the
eventual rupture of top reinforcement near the middle column interface. This is caused
by the concentration of strain in single rebar element following the rupture bottom
rebar.
0
100
200
300
400
500
600
700
0 0.02 0.04 0.06 0.08 0.1 0.12
stre
ss (
MP
a)
strain
trilinear curve
curvilinear

Chapter 4 Numerical modelling of reinforced concrete beam assembly under a
progressive collapse scenario
123
(a) Applied load-middle column displacement response
(b) Axial force-middle column displacement response
Figure 4.19: Load and axial force-displacement responses for RC beam with trilinear stress-
strain behaviour
0
20
40
60
80
100
120
140
160
180
200
0 100 200 300 400 500 600 700 800
Axi
al f
orc
e (K
N)
middle column displacement (mm)
Mesh size=12.5mm
Mesh size=20mm
Mesh size=25mm
-400
-300
-200
-100
0
100
200
300
400
0 100 200 300 400 500 600 700 800
Ap
plie
d L
oad
(K
N)
middle column displacement (mm)
Mesh size=12.5mm
Mesh size=20mm
Mesh size=25mm

Chapter 4 Numerical modelling of reinforced concrete beam assembly under a
progressive collapse scenario
124
(a) Applied load-middle column displacement response
(b) Axial force-middle column displacement response
Figure 4.20: Load and axial force-displacement responses for RC beam with trilinear stress-
strain behaviour
0
20
40
60
80
100
120
140
160
0 100 200 300 400 500 600 700
Axi
al f
orc
e (K
N)
middle column displacement (mm)
Mesh size=12.5mm
Mesh size=20mm
Mesh size=25mm
-400
-300
-200
-100
0
100
200
300
400
0 100 200 300 400 500 600 700
Ap
plie
d L
oad
(K
N)
middle column displacement (mm)
Mesh size=12.5mm
Mesh size=20mm
Mesh size=25mm
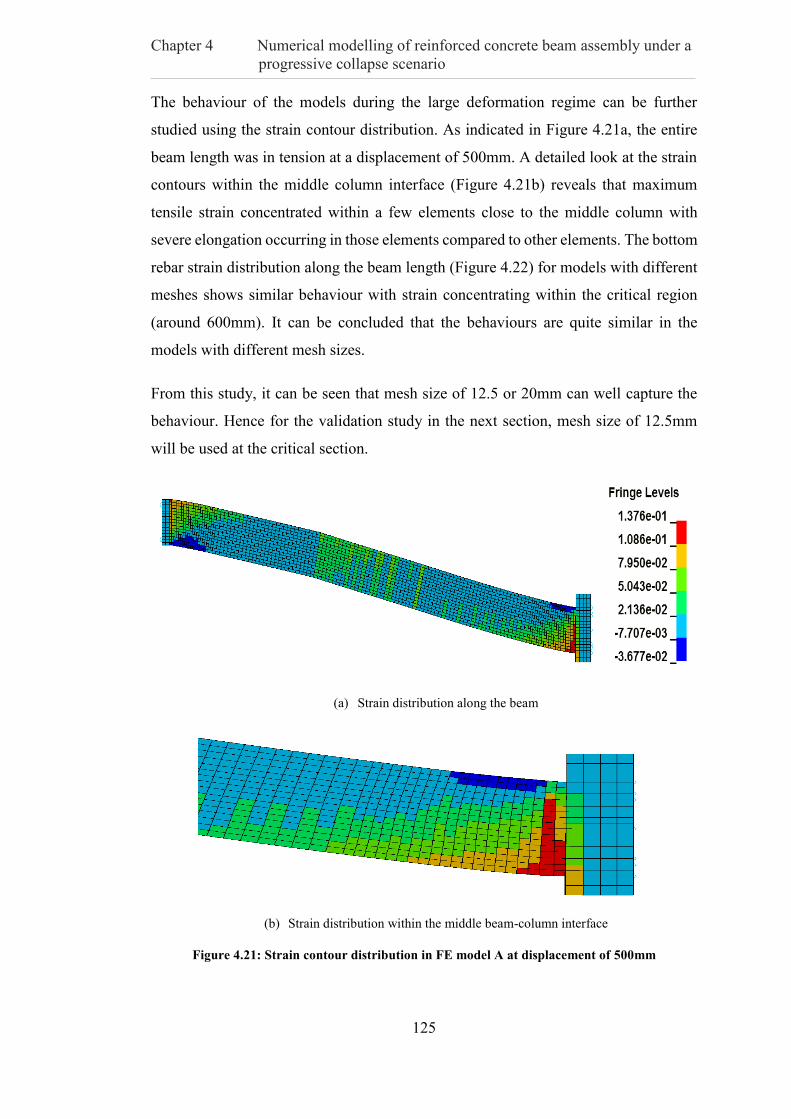
Chapter 4 Numerical modelling of reinforced concrete beam assembly under a
progressive collapse scenario
125
The behaviour of the models during the large deformation regime can be further
studied using the strain contour distribution. As indicated in Figure 4.21a, the entire
beam length was in tension at a displacement of 500mm. A detailed look at the strain
contours within the middle column interface (Figure 4.21b) reveals that maximum
tensile strain concentrated within a few elements close to the middle column with
severe elongation occurring in those elements compared to other elements. The bottom
rebar strain distribution along the beam length (Figure 4.22) for models with different
meshes shows similar behaviour with strain concentrating within the critical region
(around 600mm). It can be concluded that the behaviours are quite similar in the
models with different mesh sizes.
From this study, it can be seen that mesh size of 12.5 or 20mm can well capture the
behaviour. Hence for the validation study in the next section, mesh size of 12.5mm
will be used at the critical section.
(a) Strain distribution along the beam
(b) Strain distribution within the middle beam-column interface
Figure 4.21: Strain contour distribution in FE model A at displacement of 500mm

Chapter 4 Numerical modelling of reinforced concrete beam assembly under a
progressive collapse scenario
126
(a) Bottom rebar strain distribution
Figure 4.22: Bottom rebar strain distribution along the beam
4.4.3 Hour glass effect
The use of 8-node elements with reduced integration point offers advantage over fully
integrated element in that it reduces the computational cost. However, its disadvantage
is that artificial strain energy can be created which may affect the accuracy of the FE
model. Hour glassing effect often occurs when there is a distortion in an elements due
to force concentration on few nodes. This may be more severe in modelling of RC
beam subjected to large deformation. An illustration of the hour glass effect is shown
in Figure 4.23.
0
0.02
0.04
0.06
0.08
0.1
0.12
0.14
0 500 1000 1500
Axi
al s
trai
n
distance along beam (mm)
mesh size=12.5mm
mesh size=20mm
mesh size=25mm
middle
column

Chapter 4 Numerical modelling of reinforced concrete beam assembly under a
progressive collapse scenario
127
Figure 4.23: Illustration of hour glassing arising from bending deformation with no
straining
When hour glassing occurs in FE models, the individual element where the hour
glassing occur is severely distorted while the entire section remains undeformed. This
will cause the hour glass energy to increase.
In LS DYNA (and similarly in other general-purpose FE codes), the effect of hour
glassing can be reduced by using stiffness form of control, among other options, and a
factor between 0.03 and 0.1 is recommended. The hour glass effect can be checked by
comparing the hour glass energy with internal energy. It is recommended that the hour
glass energy should be less than 10% of the internal energy for the FE simulation to
be acceptable.
Figure 4.24 shows the comparison of hourglass and internal energy for Model A. The
ratio is well below the 10%. Apart from the sudden rise of the energy ratios at the
beginning of the loading which is expected, maximum ratio throughout the duration of
the simulation was well below 4%.
Integration point
Undeformed
shape
Deformed
shape

Chapter 4 Numerical modelling of reinforced concrete beam assembly under a
progressive collapse scenario
128
Figure 4.24: Ratio of Hour glass and internal energies during the quasi static loading
for model A.
4.5 Validation of numerical models with experimental study by (Yu
& Tan 2013b)
4.5.1 Detail of the experiment
In this section the numerical modelling framework is validated using experimental test
from Yu and Tan (2013). The experiment was conducted to investigate the effect of
reinforcement ratio and span to depth ratio on the structural behaviour of sub-
assemblage under column removal scenario. In all, five (5) sub-assemblages were
tested. In the present study, two of the tested beams (S4 and S6) are modelled.
The elevation and plan view of the sub-assemblage is shown in Figure 4.25 while the
geometric and reinforcement detail of two of the specimens selected for the validation
study is presented in Table 4.2. Concrete tensile and compressive strength were
3.5MPa and 38.2MPa respectively. Yield strength of 13 and 16mm reinforcement was
0
2
4
6
8
10
0 500 1000 1500 2000
Ho
ur
glas
s en
ergy
/in
tern
al e
ner
gy (
%)
Time (s)

Chapter 4 Numerical modelling of reinforced concrete beam assembly under a
progressive collapse scenario
129
494 and 513MPa while ultimate strength was 594 and 612MPa respectively. The
rupture strain for 13mm bar was 0.11 and that of 16mm rebar was 0.13.
Figure 4.25: Elevation and plan view of the tested specimen (Yu & Tan 2013b)
Table 4.2: Reinforcement detail of beam-column sub-assemblage (Yu & Tan 2013b)
The end columns were connected to a reaction wall on one side and steel A-frame on
the other side to simulate the axial restraint. The vertical support was provided by a
pin connection which rested on a steel roller. This was to avoid the effect of horizontal
reaction and therefore make the entire setting independent. To avoid lateral movement
of the beam, lateral restraint was provided at each side of the middle column.
Displacement controlled loading was provided by an actuator which acted at a rate of
0.1mm/s to avoid any dynamic effect.
Specimen
ID
Ln
(mm)
Longitudinal reinforcement Bottom
rebars at
middle joints
A-A B-B
Top Bottom Top Bottom
S4
2750
3T13
(1.24%)
2T13
(0.82%)
2T13
(0.82%)
2T13
(0.82%)
continuous
S6
2750
3T16
(1.87%)
2T13
(0.82%)
2T16
(1.25%)
2T13
(0.82%)
continuous

Chapter 4 Numerical modelling of reinforced concrete beam assembly under a
progressive collapse scenario
130
4.5.2 Overview of the finite element model for the test beam assemblies
Concrete is modelled with 8-node solid element with reduced integration while
reinforcement is modelled with 2-node beam element. Although the stiffness of the
two end columns in the test was found to be slightly different, only half of the beam is
modelled taking advantage of symmetry. The “beam” elements representing rebar are
embedded into the solid element through node sharing. This represents a perfect bond
condition between rebar and surrounding concrete and renders the “bond-slip”
behaviour to the softening of concrete elements interacting with the rebar, as
mentioned in Section 4.3.
As reported in the test, gaps existed between the connection and the end columns. To
simulate the sub-assemblage behaviour accurately, such gaps needs to be taken into
consideration. In the FE model, nonlinear spring elements (S04) in LS DYNA were
used to simulate the axial behaviour. The spring elements were connected to a steel
plate with elastic properties (MAT 001) similar to the test set up to avoid stress
concentration. To avoid stress localisation, 15 springs with smaller stiffnesses were
used to model the end axial restraint as shown in Figure 4.26. Force-displacement
behaviour of these springs including the gaps that existed between the end column and
connection (as shown in Figure 4.26a) were obtained from the referenced paper.
From mesh sensitivity study, it was shown that concrete mesh size of 12.5 x 12.5 x
12.5mm for the critical region yielded satisfactory accuracy in terms of the mesh. Thus,
this mesh size was adopted to model the critical section while the mesh size at the less
critical section was 25mm. As noticed in the mesh sensitivity studies, the mesh size of
the rebar may cause strain localisation in the top bar after rupture of bottom bar. To
avoid this problem, the mesh size of rebar was doubled within the critical section,
hence rebar mesh size was 25mm.
Figure 4.26 shows the test and finite element model of the end columns. Similar to the
test, steel plate with elastic properties were placed on the middle column to avoid local
failure. The top nodes of this plate were push down in a displacement controlled
manner.
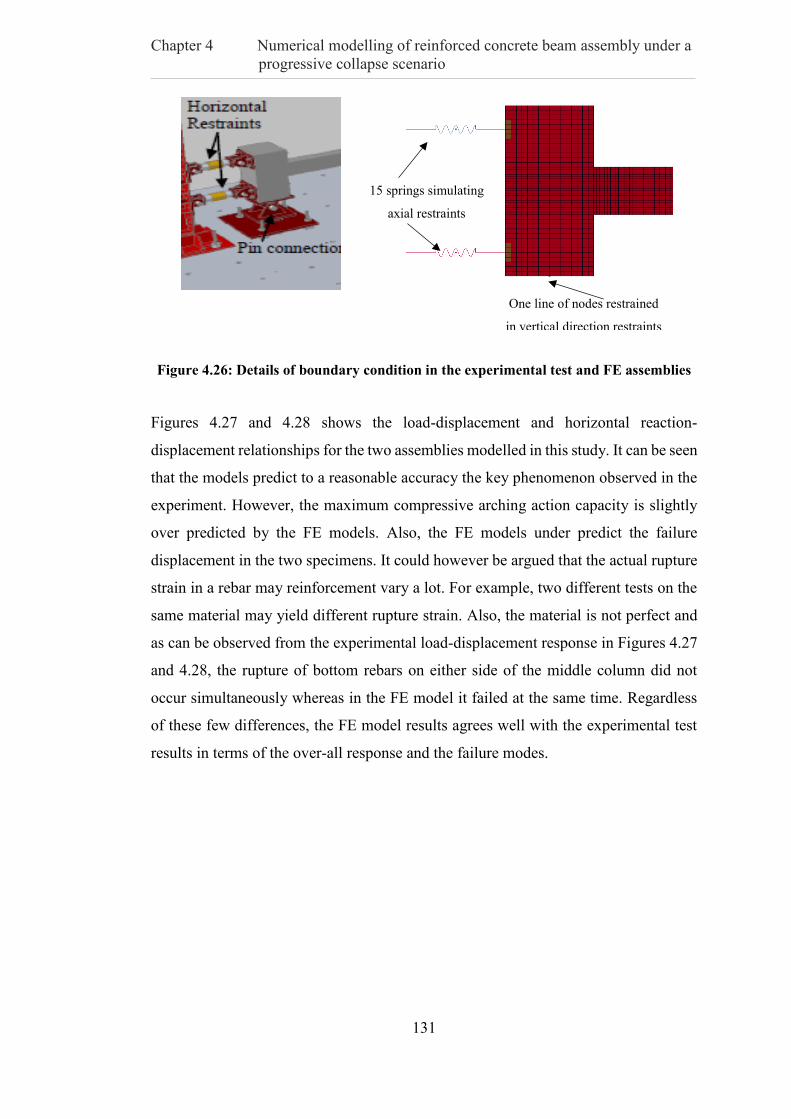
Chapter 4 Numerical modelling of reinforced concrete beam assembly under a
progressive collapse scenario
131
Figure 4.26: Details of boundary condition in the experimental test and FE assemblies
Figures 4.27 and 4.28 shows the load-displacement and horizontal reaction-
displacement relationships for the two assemblies modelled in this study. It can be seen
that the models predict to a reasonable accuracy the key phenomenon observed in the
experiment. However, the maximum compressive arching action capacity is slightly
over predicted by the FE models. Also, the FE models under predict the failure
displacement in the two specimens. It could however be argued that the actual rupture
strain in a rebar may reinforcement vary a lot. For example, two different tests on the
same material may yield different rupture strain. Also, the material is not perfect and
as can be observed from the experimental load-displacement response in Figures 4.27
and 4.28, the rupture of bottom rebars on either side of the middle column did not
occur simultaneously whereas in the FE model it failed at the same time. Regardless
of these few differences, the FE model results agrees well with the experimental test
results in terms of the over-all response and the failure modes.
15 springs simulating
axial restraints
One line of nodes restrained
in vertical direction restraints

Chapter 4 Numerical modelling of reinforced concrete beam assembly under a
progressive collapse scenario
132
(a) Applied load-middle column response
(b) Horizontal reaction-middle column displacement response
Figure 4.27: Comparison of responses from FE and experiment for specimen S4
0
20
40
60
80
100
120
0 100 200 300 400 500 600 700
Ap
plie
d lo
ad (
KN
)
Middle column displacement (mm)
FE
Experiment
-250
-200
-150
-100
-50
0
50
100
150
200
250
0 100 200 300 400 500 600 700
Ho
rizo
nta
l rea
ctio
n (
KN
)
Middle column displacement (mm)
FE
Experiment

Chapter 4 Numerical modelling of reinforced concrete beam assembly under a
progressive collapse scenario
133
(a) Applied load-middle column response
(b) Horizontal reaction-middle column displacement response
Figure 4.28: Comparison of responses from FE and experiment for specimen S6
-20
0
20
40
60
80
100
120
140
160
180
0 100 200 300 400 500 600 700 800
Ap
plie
d lo
ad (
KN
)
Middle column displacement (mm)
FE model
experiment
-300
-200
-100
0
100
200
300
400
0 100 200 300 400 500 600 700 800
Ho
rizo
nta
l rea
ctio
n (
KN
)
middle column displacement (mm)
FE model
Experiment

Chapter 4 Numerical modelling of reinforced concrete beam assembly under a
progressive collapse scenario
134
The damage pattern from experiment and FE models are shown in Figures 4.29 and
4.30 for specimens S4 and S6 respectively. It is seen that in test and FE models,
damage concentrated within the middle and end beam column interface. Although
element erosion was not considered in the numerical models, it can be observed that
concrete near the end and middle column are severely damaged. This is similar to the
test where concrete eroded. A close look at the damage pattern from FE models further
shows that failure mode was perfectly captured and failure was caused by the fracture
of bottom rebar near the middle column which was followed by fracture of top rebar
at a much larger middle column displacement.
(a) test

Chapter 4 Numerical modelling of reinforced concrete beam assembly under a
progressive collapse scenario
135
(a) FE model
Figure 4.29: Comparison of damage pattern from FE and experiment for Specimen S4
(SDF=1.98-2.0)
(a) Test

Chapter 4 Numerical modelling of reinforced concrete beam assembly under a
progressive collapse scenario
136
(b) FE model
Figure 4.30: Comparison of damage pattern from FE and experiment for Specimen S6
(SDF=1.98-2.0)
4.6 Concluding remarks
This chapter presents a numerical modelling scheme for simulating the behaviour of
RC beam-column assembly under a progressive collapse scenario, with particular
attention on the concrete material modelling and rapture of reinforcement bars; these
features are crucial in a realistic simulation of the arching effect and the extent to which
catenary effects may be developed. Thus, the choice of material model for modelling
concrete is presented and essential verification and validation of the material model
carried out. Localisation phenomena and the associated mesh sensitivity for rebar are
examined and possible approaches to minimise such an effect are discussed.
Other general modelling considerations and possible issues, such as general mesh
sensitivity and hour glassing, which can affect the simulation results in modelling of
RC assemblies are also discussed.
Finally, the developed model is benchmarked against experiment tests and it is found
that the FE models replicates well the key features observed in the experiment.
Although for the particular cases examined, the model tends to slightly over predict
the response of compressive arching action, it can be observed that the model
accurately represented the failure modes which included concrete cracking at the

Chapter 4 Numerical modelling of reinforced concrete beam assembly under a
progressive collapse scenario
137
critical beam-column interface, followed by rupture of bottom rebar and final failure
caused by rupture of top rebar.
The FE model will be employed in subsequent chapters to assist in the investigations
of progressive collapse behaviour of representative RC designs.

Chapter 4 Numerical modelling of reinforced concrete beam assembly under a
progressive collapse scenario
138

Chapter 5 Theoretical model on compressive arching action and associated
deformation limit state in axially restrained reinforced concrete beam
139
Chapter 5: Theoretical model on compressive
arching action and associated deformation limit state
in axially restrained reinforced concrete beam
5.1 Introduction
From the critical review and analysis of experimental studies on compressive arching
action in Chapter 3, it is seen that the load capacity in axially restrained RC assemblies
is greater than its flexural capacity, and this increase in the load capacity is due
primarily to the arching compression. The arching effect depends on the reinforcement
ratio, span-depth ratio, concrete compressive strength and axial restraint.
Due to the significant magnitude of the arching capacity, it is important to be able to
predict the arching capacity more accurately, and this may only be achieved through
models that adequately represent the underlying mechanisms. A number of analytical
models on compressive arching action have been developed (Yu & Tan 2014; Alogla
et al. 2017; Abbasnia & Nav 2016; Rankin & Long 1997b; Christiansen 1963). Some
of these models treat the contribution from flexure and arching action in an uncoupled
manner (Rankin & Long 1997b; Abbasnia & Nav 2016), while others treat the arching
action in a coupled manner such that the axial force causes an increase in the moment
capacity of the section, but at the same time a P-delta effect arises which tends to
reduce the load capacity (Yu and Tan, 2014; Alogla et al., 2017).
A more detailed review of representative theories in the literature and their
formulations, which is presented in Section 5.2 of this chapter, reveals that some
limitations exist and consequently the models may not capture realistically the
response of RC assemblies in terms of the arching action in certain cases. For example,
Tan and Yu’s model ignores the bending deformation and as such under-predicts the
displacement corresponding to the maximum arching action capacity. More so, there
is no provision to check for strain in the critical section in this model. Rankin’s model,

Chapter 5 Theoretical model on compressive arching action and associated
deformation limit state in axially restrained reinforced concrete beam
140
which was initially developed for RC slabs, does consider the load resistance to be
contributed by bending and arching deformations; however, the effect of compression
reinforcement on the arching contribution is not considered. This could result in under-
prediction of the response. Also, Rankin’s model only predicts the maximum arching
capacity. For a comprehensive assessment of progressive collapse resistance of the
beam-column assemblies, an accurate determination of both the arching resistance
capacity and the range of displacement upon which the arching action is effective, i.e.
the energy absorption capacity, is required. However, the deformation aspect
associated with the arching effect has seldom been examined in previous studies.
To address these problems, a theoretical model on compressive arching action which
takes into consideration of the compounding flexural and arching deformations, and
hence the stress-strain and damage state of concrete in the critical compressive zones
is proposed.
5.2 Development of the Analytical Model: Basic Considerations
5.2.1 General Concept
Figure 5.1 shows a typical RC sub-assemblage subjected to a concentrated load at the
middle column, representing a situation with a double-span beam created due to
removal of the middle column. In an idealised condition, the ends are assumed to be
fixed against translation and rotation. Due to the restraint at the ends, the tendency of
the RC beam to expand with increasing load (P), is prevented. This causes the
development of axial compressive force which acts in turn to increase the vertical load
bearing capacity of the beam.

Chapter 5 Theoretical model on compressive arching action and associated
deformation limit state in axially restrained reinforced concrete beam
141
Figure 5.1: A beam-column subassembly under concentrated load at middle column
(Yu and Tan, 2014)
Figure 5.2 shows a conceptual illustration of the combined bending and arching effects
while an RC beam is deflected. The external load is represented by a point load at the
column loss location, but it could also be distributed load over the beam spans. Taking
advantage of the symmetry, only the deformed shape of one-half of the beam and the
forces acting are shown.
In this model, the bending and arching modes share the same vertical displacement of
the middle point, but the flexural mode is associated with a presumable pure bending
deformation with no axial force interference. For the sake of analysis, the bending and
arching effects are decoupled into two separate mechanisms as shown in Figures 5.3a-
b. From these Figures, the overall vertical resistance is comprised of a pure flexural
resistance and the compressive arching action.
From the force point of view, this can be separated into two sets of equilibrium
systems, namely a) bending, and b) arching action.

Chapter 5 Theoretical model on compressive arching action and associated
deformation limit state in axially restrained reinforced concrete beam
142
Figure 5.2: Free body diagram showing all forces acting on the beam, and the co-
existing bending and arching modes of resistance
(a) Bending mode
(b) Strut/arching action mode
Figure 5.3: Free body diagram showing the two sets of forces corresponding to bending
and arching action modes
P
FN
FN’
V
L
Strut due to arching
Me
M
m
Me Mm
Pb
Pa
FN
FN’
V L

Chapter 5 Theoretical model on compressive arching action and associated
deformation limit state in axially restrained reinforced concrete beam
143
For simplicity, the response is divided into elastic and plastic response. Figure 5.4
shows the idealised load displacement response in the proposed model. The response
in each of the stages will be discussed in the section that follows.
Figure 5.4: Load-displacement response showing the elastic and plastic stages in the
proposed model
5.2.2 Different stages of response
5.2.2.1 Pre-arching stage (elastic bending stage)
During the elastic stage of the response it is assumed that only bending deformation
occurs. For the present purpose, the elastic response stage ends when tensile
reinforcement starts to yield. It should however be noted that for RC beams, there is
no perfect elastic stage as yielding occurs from the moment when tensile reinforcement
reaches initial yield, and goes on until the stresses over the concrete becomes
stabilised.
Let the plastic moment capacities at the end and middle sections be represented by eM
and mM respectively. Using the strain and stress distribution in Figure 5.5, the load
δe
δp = δ-δe
δ
Load
Deflection
elastic
Plastic
zone Bending
Arching

Chapter 5 Theoretical model on compressive arching action and associated
deformation limit state in axially restrained reinforced concrete beam
144
and the corresponding middle point displacement at the end of elastic stage can be
determined as:
Figure 5.5: Section stress and strain distribution at elastic bending mode
L
MMP me
b
2 (5.1)
ec
be
IE
LP
192
23
(5.2)
Combining equation Equations (5.1) and (5.2) the displacement corresponding to end
of elastic bending stage can be expressed in terms of the plastic moment capacities as:
ec
mee
IE
LMM
12
2 (5.3)
Where Ie is the effective moment of inertia which is calculated as per the ACI 318
requirement. Due to the difference in the moment of inertia at support and mid-span
sections, the average moment of inertia according to ACI 318 code and is given as:
mideee III ,sup,5.0 (5.4)
Where Ie,sup and Ie,mid are the effective moment of inertia at the support and mid-span
sections respectively and is defined as:
d'
bex
Ty
c fc=cEc
Fsb
RC section Strain
distribution
Triangular Stress
distribution
distribution
M

Chapter 5 Theoretical model on compressive arching action and associated
deformation limit state in axially restrained reinforced concrete beam
145
gcrb
crg
b
cr IIM
MI
MM
I
*1*33
(5.5)
Where Mcr corresponds to the cracking moment, Mb is the moment at the section
considered, Icr is the moment of inertia of cracked section and Ig is the gross moment
of inertia. The effective moment of inertia corresponding to the yield moment for
support and mid-span sections are calculated using Equation (5.5), after which the
average moment of inertia for the beam is determined using Equation (5.4).
5.2.2.2 Arching stage (“Plastic stage”)
Following major cracking and yielding of the critical sections at the end support and
middle column interface, the bending and arching modes occur concurrently. For a
given deflection δ, the load resistance is contributed by bending and arching, and at
the same time, the strain deformation in the end and middle-column regions is caused
by both the bending and arching modes, which in turn affects the magnitude of arching
effect which could develop. Each of these modes will be discussed in the section that
follows.
5.2.2.2.1 Bending mode
For the pure bending mode of the response at a given deflection, we need to establish
the following:
a) the bending strains and stresses at the middle and end sections.
b) Bending moment at the middle and end section and hence the bending
resistance (Pb).
However, let us concentrate on the response stages “around” the peak arching effect
first. Let’s further assume that at this stage both end regions have already developed
plastic hinges. The plastic moments at the end and middle section are Me and Mm
respectively assuming symmetry.
Let the deflection under consideration be ,

Chapter 5 Theoretical model on compressive arching action and associated
deformation limit state in axially restrained reinforced concrete beam
146
Plastic deflection is given as:
ep (5.6)
where e is the elastic limit deflection.
Plastic rotation at the end is calculated as:
L
pp
(5.7)
The total plastic strain at the end and middle sections can be evaluated from the above
plastic rotation if a plastic hinge length is known. For an indicative purpose in this
formulation, let us assume
dLp 0.1 (5.8)
where d is the beam depth.
Plastic strain in the extreme compressive fibre (same as the critical zone due to arching
zone) at the “end” and “middle” sections are:
11 bpp
pcp x
L
(5.9)
22 bpp
pcp x
L
(5.10)
where 1bpx and 2bpx are the compression zone depths at end and middle sections.
It should be noted that during the plastic response stage, the compression zone due to
bending further reduced as the stress distribution becomes parabolic. Hence, the
concrete compressive stress distribution can be represented by the equivalent stress
block. With this assumption, the compression zone depth for bending ( bpx ) can be
determined for the end and middle sections.

Chapter 5 Theoretical model on compressive arching action and associated
deformation limit state in axially restrained reinforced concrete beam
147
For the determination of the strain in the compressive concrete, which is a key
parameter in the new formulation for the analysis of the arching effect, the standard
beam analysis can be carried out. Total strain due to bending at the end and middle
sections comprised of elastic and plastic strain and equals:
11 cpec (5.11)
22 cpec (5.12)
where e denotes the compressive strain at the elastic limit stage.
The above concrete compressive strains are to be employed to evaluate the status of
the concrete deformation and stresses in the critical regions in relation to the bending
deformation.
5.2.2.2.2 Strut/Arching mode
Figure 5.6: Rigid block movement of the beam
For the strut/arching mode of response, including the arching compression forces and
the lever arm, and hence the arching moment of resistance, it is necessary to establish
the following:
Centre of
rotation
L
d-x1
x1 d-x2
x2
O
A A' B
B' B''
C C' D
D'
ep

Chapter 5 Theoretical model on compressive arching action and associated
deformation limit state in axially restrained reinforced concrete beam
148
a) Under a given deflection δ, the compressive displacement of the “strut”; this
will lead to the evaluation of the compressive strain;
b) The compressive zone depth, at the end and middle sections;
The above will then allow the establishment of the compressive stress and their
distribution in the compressive zones, and in combination with the stress and strain
states from the bending analysis, will further allow an evaluation of the state of the
compressive concrete and the arching (moment) resistance.
As the basic case, the supports (end and middle) are assumed to be rigid firstly. The
kinematics can be established by using a rigid body rotation analogue, as illustrated in
Figure 5.6. The original beam segment is represented by a rectangular ABCD.
Assuming the centre of rotation at the left end of the beam is point O, i.e. the
compression zone depth is defined by OC (or OC’), where1xCO . The displaced
position of the beam is A’B’C’D’. For a given deflection δ, the plastic rotational angle
Lpp / . Where ep
For generality, assume the compression zone at the middle section (right end in Figure
5.6) is2x . The governing geometric equation can be expressed as:
222 )'()()( BBBABA (5.13)
where:
2xLBBBABA (5.14)
)( 1xdLAAABBA (5.15)
Substituting Equations (5.14) and (5.15) into (5.13),
221
22 )]([()( pxdLxL (5.16)
Expanding, ignoring second order increment ( ) terms

Chapter 5 Theoretical model on compressive arching action and associated
deformation limit state in axially restrained reinforced concrete beam
149
212 222 pdLxLxL (5.17)
Noting Lpp / , it can be found that:
2
21p
dxx
(5.18)
Equation (5.18) satisfy the geometric requirement of the rigid body rotation.
This also means using the rigid body rotation assumption alone will not lead to a
unique solution for the compression zone sizes. For example, if 01 x ,
)2/(2 pdx as illustrated schematically in Figure 5.7.
Figure 5.7: Simple illustration of geometrically compatible combinations of
compression zone scenarios
A unique solution will require a further equation, and this can be sought from the
equilibrium of horizontal compression forces. In the case of uniform design properties,
the force equilibrium will imply that equal compression zone sizes at the two ends
arise, i.e., 21 xx , thus:

Chapter 5 Theoretical model on compressive arching action and associated
deformation limit state in axially restrained reinforced concrete beam
150
42
21pd
xx
(5.19)
In a more general case with unequal reinforcement between the two compression
zones, an equilibrium equation in the following form will arise:
2211 sNCNsNCN FFFF (5.20)
Where 1CNF and
1sNF denote respectively the compressive force in concrete and
compressive steel that may be attributed to the aching action at the left support section,
2CNF and 2sNF are the corresponding counter parts at the middle section (right end in
the Figure 5.6).
The actual compressive forces in concrete and steel that may develop from the arching
deformation will depend on the strain and stress state in the compressive zones taking
into account the concurrent bending deformation in these zones.
For illustration purpose let us assume the compressive stresses from the arching
deformation develop independently from bending, i.e. 11 xx and 22 xx . Let us
further assume that compressive steel is at the yield state at both ends, it follows that:
2211 '' sycsyc AfxbfAfxbf (5.21)
Thus:
1221 ssc
yAA
bf
fxx
(5.22)
Solving Equations (5.41) and (5.37) yields:
12242
ssc
ypAA
bf
fdx
(5.23)
For arching mode of response, the maximum strain in the compressive concrete at the
end and middle sections can be related to the compressive deformations of U1 and U2

Chapter 5 Theoretical model on compressive arching action and associated
deformation limit state in axially restrained reinforced concrete beam
151
being distributed over an equivalent plastic deformation region of length LN1 and LN2
as illustrated in Figure 5.8 (for middle section).
Figure 5.8: Schematic of concrete strain distribution in the compression zone
Edge compression at end section:
111
* xL
xCCUp
(5.24)
Edge compression at middle section (right end):
222
* xL
xBBUp
(5.25)
Compressive strain due to arching at the end and middle sections are given as:
11
1
1
11 **
LL
x
LL
U p
N
p
NN (5.26)
22
2
2
22 **
LL
x
LL
U p
N
p
NN (5.27)
Where 1 and 2
represent the arching compression zone profile and may be
determined by semi-empirical approach based on FE simulations.
d-x2
x2
B
B'
D
D'
N Concentration of
strain zone
Distribution of
compressive strain
LN

Chapter 5 Theoretical model on compressive arching action and associated
deformation limit state in axially restrained reinforced concrete beam
152
5.2.3 Stresses and force equilibrium in the arching effective stage
In the previous section, it was shown that the axial compression force that may be
developed in arching mode depends on the state of strain and stress in bending mode.
To determine the state of compression zone and thus the stress attributed to arching,
the total strain due to bending and arching needs to be determined. Since the strain due
to bending and arching has been determined already following the procedure explained
in section 4.1 and 4.2.1, the bending and arching may be superposed as shown in Figure
5.9.
Figure 5.9: Superposition of strain due to bending and arching
Hence, the combined compression depth may be expressed in terms of the arching
compression depth as:
Nx xx 0 (5.28)
where:
0x Nx
Strain due to
arching
Combined strain distribution
N NcpT
bpx
cp
Strain due to plastic
bending
cpbp
bp
x
xd
N
N
N
x
xd
NN
Ncp
bp
bp
x
xd
x
xd

Chapter 5 Theoretical model on compressive arching action and associated
deformation limit state in axially restrained reinforced concrete beam
153
Ncp
bp
N
Ncpx
x
x
(5.29)
cp and N are the strain due to bending and arching respectively and can be
determined using the formulation in section 5.3. More detailed discussion on the
determination of the plastic hinge length for bending (Lp) and the arching compression
zone profile ( ) strain values will be given in Section 5.4.
It can be seen in Equation (5.29) that when xN = xbp, x0 = xN as expected which implies
that arching action will not develop.
With the combined compression zone depth determined as shown above, the stress
distribution in the compression zone and thus the equivalent compression zone depth
attributed to arching can be determined. For simplicity, let the stress distribution be
represented by the equivalent rectangular stress block with uniform stress intensity of
fc. Taking into account the concurrent bending deformation mode, the compression
zone depth for arching can be determined as illustrated in Figure 5.13.
Figure 5.10: Stress distribution considering the concurrent bending and arching
deformation modes
Equilibrium of forces attributed to arching at the end and middle section yields:
d'
)( 0 bpxx
FsT
fc
RC section Combined Stress
distribution
Stress distribution due
to arching
Ty
FsN
Fsb bpx
Ty
0x
Stress distribution
due to bending
fc

Chapter 5 Theoretical model on compressive arching action and associated
deformation limit state in axially restrained reinforced concrete beam
154
22021101 )()( sNbpcsNbpc FxxbfFxxbf (5.30)
where is the ratio of equivalent rectangular compressive stress block to neutral axis
depth and is taken as 0.85 in this study.
1sNF and 2sNF are the axial compressive forces in compression rebar attributed to
arching at the end and middle section. For simplicity, assuming that at the arching
effective stage the compression bars have yielded, 1sNF and 2sNF can be calculated
as:
ssbyssN EfAF 111 ' (5.31)
ssbyssN EfAF 222 ' (5.32)
where 1sb and 2sb are the strain in compression rebar due to bending deformation
Simplifying Equation (5.30) further yields:
bf
FFxxxx
c
sNsNbpbp
12
210201
(5.33)
Substituting Equation (5.28) for 01x and 02x in Equation (5.33), yields:
bf
FFxxxx
c
sNsNbpbpNN
12
212211
(5.34)
Substituting the expression for 1 and 2 yields:
bf
FFxx
x
xx
x
xx
c
sNsNbpbp
Ncpbp
N
NcpN
Ncpbp
N
NcpN
12
21
222
2
222
111
1
111
(5.35)
The only unknown in Equation (5.35) is 1Nx and 2Nx . These unknowns can be
determined by solving Equations (5.18) and (5.35) simultaneously.

Chapter 5 Theoretical model on compressive arching action and associated
deformation limit state in axially restrained reinforced concrete beam
155
5.2.4 Kinematics for flexible axial support
The illustration in section 5.2.2 was based on a rigid beam with full axial rigidity.
However, experimental result has shown that the end support of the assemblies with
loss column are not always rigid, hence for accurate determination of the axial
compressive force that can developed the flexibility of the end restraint needs to be
considered in the formulation.
Considering again the rigid body movement of beam shown in Figure 5.11. Due to the
flexible ends, the end of the beam moves by a displacement (t). The geometric equation
can be worked out as:
Figure 5.11: Rigid block movement of beam with flexible restraint
222 )()()( BBBABA (5.36)
22
12
2 )]()[()( pxdtLxL (5.37)
Expanding, ignoring second order increment ( ) terms
2
12 2222 pdLxLLtxL (5.38)
This simplifies to:
Centre of
rotation
L+ t
d-x1
x1 d-x2
x2
O
A A' B
B' B''
C C' D
D'
p

Chapter 5 Theoretical model on compressive arching action and associated
deformation limit state in axially restrained reinforced concrete beam
156
Lt
dxxp
p
)
2(21
(5.39)
Equation (5.39) shows that flexible constraint manifest as the relaxation or reduction
of the complexion zone depths which reduces the arching action.
For a flexible axial constraint of stiffness aK ,
aKNt / . Equation (5.39) therefore
becomes:
LK
Ndxx
ap
p
)
2(21
(5.40)
For a flexible boundary condition, Equation (5.40) can be solve simultaneously with
Equation (5.35) to determine the depth of compression zone at the end and middle
section.
5.2.5 Additional moment of resistance due to arching
The contribution of the arching effect to the vertical load carrying capacity may be
looked upon in two different ways: a) treating it as an arching action along the direction
of the “strut” and hence its vertical component contributes to the vertical resistance,
and b) treating it as a result of the additional moment resistance derived from the
arching compression stresses at both ends (left and middle). It can be demonstrated
that the two approaches should arrive at the same result. In the present study, the
formulation has been focused on the compression stresses due to arching, and hence it
is straightforward to adopt the above approach b) in the evaluation of the additional
resistance due to arching.
With the depth of compression zone due to arching ( 1Nx , 2Nx ) calculated, along with
the stresses in the compression zones that are attributed to arching, the additional
moment of resistance due to arching can be obtained. Taking into account the vertical
deflection, the additional moment of resistance can be determined by considering the
forces at the end and middle sections, as illustrated in Figure 5.15. This approach has
been used in the study by Christiansen (1963).

Chapter 5 Theoretical model on compressive arching action and associated
deformation limit state in axially restrained reinforced concrete beam
157
Figure 5.12: Horizontal forces at support and mid-span sections considering only forces
attributed to arching
Assuming that the compression forces in the concrete to act at its centroid and taking
moment of all the forces about the centroid of concrete compressive zone depth at the
support section (point A in Figure 5.12), the additional moment due to arching can be
calculated as:
])(5.0[)](5.0[
)](5.0)([
1011110112
202101212
bbpbpsNbpbptpsN
bpbpbpbppcNar
axxxFxxxadF
xxxxxxdFM
(5.41)
where at and ab are the distance from the extreme compressive fibre to the centroid of
top and bottom reinforcement respectively.
The additional load due to arching can then be calculated as:
LMP arar / (5.42)
Total load is the sum of load due to bending and arching
arbt PPP (5.43)
δ
FsN2
FsN1
FcN1
FcN2
d
Support section Middle section
A
at
ab
d )( 202 bpxx
2bpx
1bpx
)( 101 bpxx

Chapter 5 Theoretical model on compressive arching action and associated
deformation limit state in axially restrained reinforced concrete beam
158
5.3 Determination of plastic length due to bending and arching
5.3.1 Introduction
In the proposed model developed in Section 5.2, it was shown that the combined
compression zone depth depends on the plastic hinge length due to bending (Lp) and
an effective “plastic” arching depth to length ratio (x/LN). Accurate prediction of
compressive arching capacity using this model therefore depends on the plastic lengths
of these two modes of deformation.
5.3.2 Plastic hinge length for bending
Regarding plastic hinge length for bending, a number of empirical expressions based
on experimental and FE numerical studies on RC beams exist in the literature. Some
of the proposed expressions by different researchers are summarised in Table 5.1. It
can be seen from Table 5.1 that most of researchers consider the plastic hinge length
to depend on the depth of the section (d) and the distance from the critical section to
the point of contra flexure (z). However, most of these studies where based on RC
beam subjected to normal load and without axial force which may influence the plastic
hinge length.
For the present study, the empirical expression by Sheikh & Khoury (1993) is adopted
to defined the plastic hinge length because the behaviour of axially restrained beam is
dominated by axial compressive forces during the compressive arching stage. Thus,
the plastic hinge for bending (Lp) is assumed to be 1.0d where d is the depth of the
beam section.

Chapter 5 Theoretical model on compressive arching action and associated
deformation limit state in axially restrained reinforced concrete beam
159
Table 5.1: Expressions for plastic hinge length from different researchers
5.3.3 Determination of effective “plastic” arching depth to length ratio (x/LN)
In the proposed model presented in Section 5.3, the strain attributed to arching is based
on the plastic zone ratio expressed as x/LN. Thus, accurate prediction of the response
depends on the x/LN ratio adopted. There could be different ways of determining a
ratio which best describes this arching compression behaviour. In this section,
numerical simulation of RC beam is studied to understand the variation of x/LN for
different values of x.
As a basic reference state, a quarter-infinite space is considered, where a block of
distributed load is applied on a limited stretch as illustrated in Figure 5.13. For beams
under arching action with a relatively small compression zone, the stress condition
surrounding the compression area would be analogous to this theoretical reference
state and so the analysis of such a scenario provides basic information about the
concentration of stress and deformation in this region, and hence the nominal length
of LN.
5.3.3.1 Consideration of an infinitive RC element
Based on the consideration described above, an RC element of 800mm in length and
height and width of 200mm is considered. One end and bottom nodes are restrained in
all directions and a linearly varying compressive displacement is applied to the top
right end as shown in Figure 5.13. The depth of prescribed displacement is varied as
Researcher reference Plastic hinge length
expression (Lp) Applicability
(Baker 1956) k(z/d)1/4d RC Beams and columns
(Corley 1966) 0.5d+0.2 d (z/d) RC beams
(Mattock 1967) 0.5d+0.05z RC beams
(Priestley & Park 1987) 0.08L + 0.022dbfy RC columns
(Sawyer 1964) 0.25d + 0.075z RC beams
(Sheikh & Khoury 1993) 1.0h RC columns under high axial loads

Chapter 5 Theoretical model on compressive arching action and associated
deformation limit state in axially restrained reinforced concrete beam
160
0.1d and 0.3d where d is the depth of the beam. The result of the two cases are analysed
to determine the variation of strain in the top fibre for a given compressed depth (0.1d
or 0.3d).
Figure 5.13: An infinitive RC element
5.3.3.2 Applied displacement over a depth of 0.1d (80mm)
The strain distribution along the top fibre of the beam at selected time step is shown in
Figure 5.17. It can be observed that nonlinear strain concentrates at the free end and
the strain towards the restrained edge is almost elastic. The total strain comprises of
elastic and nonlinear strain. The elastic strain may be deducted from the total strain.
For simplicity, the elastic deformation may be expressed as:
EA
NLue (5.44)
Restrained in x,y,z
Restrained in x,y,z

Chapter 5 Theoretical model on compressive arching action and associated
deformation limit state in axially restrained reinforced concrete beam
161
where N is the axial force and L is the length of the beam in the loading direction. A
is the cross-sectional area of the beam.
With this expression, the nonlinear displacement can be determined and subsequently
the plastic zone length can be determined. The results of these analysis are presented
in Table 5.2 for three compressed horizontal displacement at the top fibre.
Figure 5.14: Strain variation along top fibre of beam for x=0.1d
The distribution of stress and strain across the depth of the section is shown for three
different horizontal displacement. It can be observed that the compressive zone depth
is slightly smaller than the depth of applied compression displacement. For instance,
the compression zone depth is approximately 50mm whereas the depth of the applied
displacement is 0.1d (80mm). The ratio of compression depth to the plastic zone depth
for the two different cases (depth from stress/strain distribution and 0.1d) are shown
in Table 5.2.
The strain contour at a compressed horizontal displacement of 0.3mm further shows
that the compression zone depth is only 50mm although the depth of prescribed
displacement was 80mm.
-0.007
-0.006
-0.005
-0.004
-0.003
-0.002
-0.001
0
0 200 400 600 800 1000
stra
in
position along beam (mm)
compressed displ. = 0.3mm
compressed displ. = 0.6mm
compressed displ. = 0.9mm

Chapter 5 Theoretical model on compressive arching action and associated
deformation limit state in axially restrained reinforced concrete beam
162
(a) stress distribution
(b) strain distribution
Figure 5.15: Stress distribution and strain distribution across depth for x=0.1d
600
650
700
750
800
850
-250 -200 -150 -100 -50 0 50 100 150 200
Bea
m d
epth
(m
m)
Stress (MPa)
compressed displ. = 0.3mm
compressed displ. = 0.6mm
compressed displ. = 0.9mm
600
650
700
750
800
850
-0.008 -0.006 -0.004 -0.002 0.000 0.002 0.004 0.006
Bea
m d
epth
(m
m)
Strain
compressed displ. = 0.3mm
compressed displ. = 0.6mm
compressed displ. = 0.9mm

Chapter 5 Theoretical model on compressive arching action and associated
deformation limit state in axially restrained reinforced concrete beam
163
Table 5.2: Determination of x/LN for FE model with x=0.1d
(a)
(b)
Figure 5.16: strain contour of (a) RC element (b) compression zone area only at a
compressed displacement of 0.3mm
displ.
(mm)
ue (mm) utotal
(mm)
up=(ut-ue)
(mm)
maximum
nonlinear strain
(εmax)
Lx =u/ εmax
(mm)
x/LN
x=0.1d
x/LN
x=50mm
0.3 0.026 0.3 0.274 0.0018 150 0.53 0.33
0.6 0.052 0.6 0.548 0.0038 145 0.55 0.34
0.9 0.078 0.9 0.822 0.0058 142 0.56 0.35

Chapter 5 Theoretical model on compressive arching action and associated
deformation limit state in axially restrained reinforced concrete beam
164
5.3.3.3 Applied displacement over a depth of 0.3d (240mm)
For the case with x=0.3d, the strain distribution along the top fibre of the beam as
shown in Figure 5.17 indicates that the strain is much smaller for the same compressed
displacement. More so, the strain is not concentrated at the free end but extends almost
the entire length of the beam. For a larger compressed displacement (=1.5mm) the
maximum compressive nonlinear strain is 0.0045 which is less than the maximum
nonlinear strain for compressed displacement of 0.9mm in the model with x=0.1d. This
confirms the uniformity of strain as the compressed depth increases. The stress and
strain distribution across the depth at a selected compressed displacement is also
shown in Figure 5.18. Again, from these distributions, the actual compression zone
depth is 175mm not the initially compressed 0.3d (240mm).
The same analysis to determine x/LN is repeated for the selected time step as shown in
Table 5.3. It is seen that the ratio of x/LN is higher than that of x=0.1d. This again
confirms that the more the depth of the compressed zone, the more uniformed the strain
will be throughout the beam and x/LN will increase.
Figure 5.17: strain distribution along top fibre of beam for x=0.3d
-0.0045
-0.004
-0.0035
-0.003
-0.0025
-0.002
-0.0015
-0.001
-0.0005
0
0 200 400 600 800 1000
stra
in
position along beam (mm)
compressed displ. = 0.6mm
compressed displ. = 0.9mm
compressed displ. = 1.5mm

Chapter 5 Theoretical model on compressive arching action and associated
deformation limit state in axially restrained reinforced concrete beam
165
(a) stress distribution
(b) strain distribution
Figure 5.18: Stress distribution and strain distribution across depth for x=0.3d
400
450
500
550
600
650
700
750
800
850
-150 -100 -50 0 50 100 150 200
Bea
m d
epth
(m
m)
Stress (MPa)
compressed displ. = 0.6mm
compressed displ. = 0.9mm
compressed displ. = 1.5mm
400
450
500
550
600
650
700
750
800
850
-0.003 -0.002 -0.001 0 0.001 0.002 0.003
Bea
m d
epth
(m
m)
Strain
compressed displ. = 0.6mm
compressed displ. = 0.9mm
compressed displ. = 1.5mm
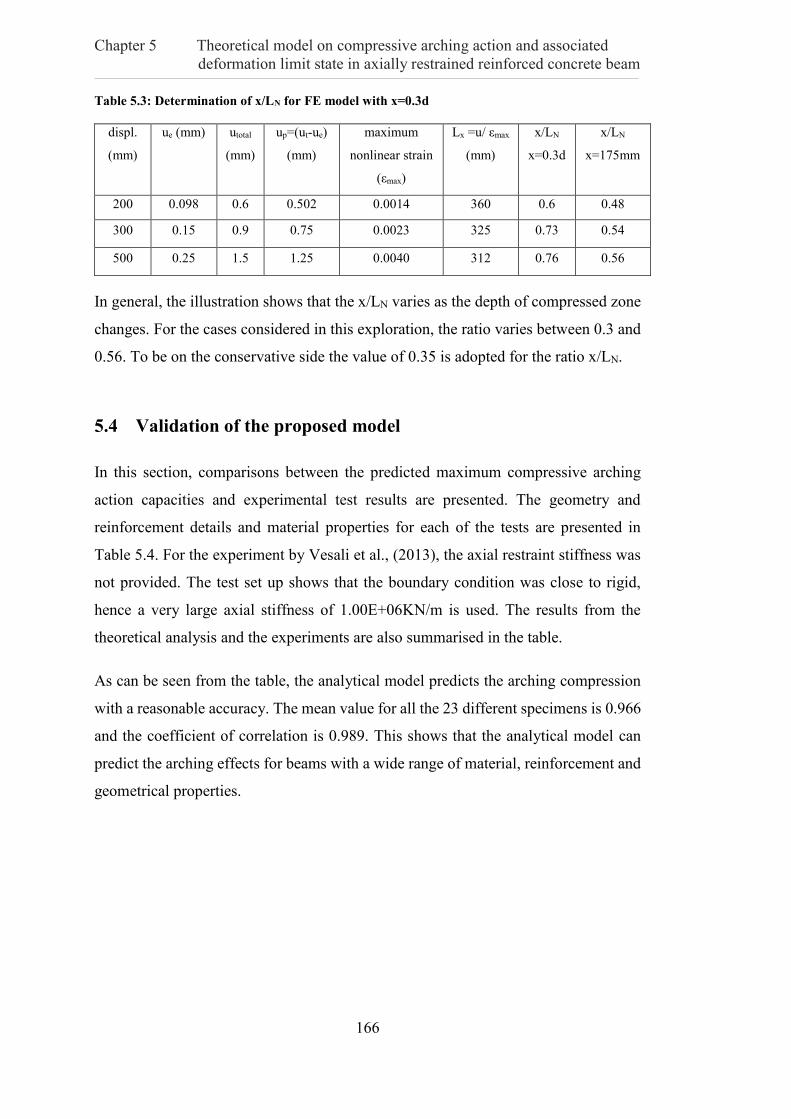
Chapter 5 Theoretical model on compressive arching action and associated
deformation limit state in axially restrained reinforced concrete beam
166
Table 5.3: Determination of x/LN for FE model with x=0.3d
In general, the illustration shows that the x/LN varies as the depth of compressed zone
changes. For the cases considered in this exploration, the ratio varies between 0.3 and
0.56. To be on the conservative side the value of 0.35 is adopted for the ratio x/LN.
5.4 Validation of the proposed model
In this section, comparisons between the predicted maximum compressive arching
action capacities and experimental test results are presented. The geometry and
reinforcement details and material properties for each of the tests are presented in
Table 5.4. For the experiment by Vesali et al., (2013), the axial restraint stiffness was
not provided. The test set up shows that the boundary condition was close to rigid,
hence a very large axial stiffness of 1.00E+06KN/m is used. The results from the
theoretical analysis and the experiments are also summarised in the table.
As can be seen from the table, the analytical model predicts the arching compression
with a reasonable accuracy. The mean value for all the 23 different specimens is 0.966
and the coefficient of correlation is 0.989. This shows that the analytical model can
predict the arching effects for beams with a wide range of material, reinforcement and
geometrical properties.
displ.
(mm)
ue (mm) utotal
(mm)
up=(ut-ue)
(mm)
maximum
nonlinear strain
(εmax)
Lx =u/ εmax
(mm)
x/LN
x=0.3d
x/LN
x=175mm
200 0.098 0.6 0.502 0.0014 360 0.6 0.48
300 0.15 0.9 0.75 0.0023 325 0.73 0.54
500 0.25 1.5 1.25 0.0040 312 0.76 0.56

Chapter 5 Theoretical model on compressive arching action and associated
deformation limit state in axially restrained reinforced concrete beam
167
Table 5.4: Comparison of experimental and predicted result
ID Reference L/d
Restraint
stiffness
(KN/m)
fc
(MPa)
Reinforcement
ratio (%) Exp. Theo
Exp/
Theo Top Bottom
A1
(Su et al.
2009)
4.08 1.00E+06 25.80 0.55 0.55 168.00 147.00 1.14
A2 4.08 1.00E+06 28.20 0.83 0.83 221.00 187.48 1.18
A3 4.08 1.00E+06 31.2 1.13 1.13 246.00 223.88 1.10
A4 4.08 1.00E+06 23.00 0.55 0.38 147.00 123.07 1.19
A5 4.08 1.00E+06 26.50 0.83 0.55 198.00 166.90 1.19
A6 4.08 1.00E+06 28.60 1.13 0.75 226.00 199.51 1.13
B1 6.58 1.00E+06 18.60 1.13 1.13 125.00 116.35 1.07
B2 9.08 1.00E+06 19.30 1.13 1.13 82.90 84.78 0.98
B3 9.08 1.00E+06 21.10 1.13 0.75 74.70 76.50 0.98
S1 (Yu & Tan
2013a)
11.0 1.06E+05 31.24 0.90 0.49 41.64 47.90 0.87
S2 11.0 1.06E+05 31.24 0.73 0.49 38.38 45.10 0.85
S3
(Yu & Tan
2013c)
11.00 4.29E+05 38.15 1.24 0.49 54.47 64.80 0.84
S4 11.00 4.29E+05 38.15 1.24 0.82 63.22 73.10 0.86
S5 11.00 4.29E+05 38.15 1.24 1.24 70.33 85.00 0.83
S6 11.00 4.29E+05 38.15 1.87 0.82 70.33 74.76 0.94
S7 8.60 4.29E+05 38.15 1.24 0.82 82.82 97.20 0.85
S8 6.20 4.29E+05 38.15 1.24 0.82 121.34 137.34 0.88
V1
(Vesali
et al.,
2013)
11.72 1.00E+06 30.50 0.58 0.58 40.50 43.75 0.93
V2 11.72 1.00E+06 27.00 0.58 0.58 35.70 41.38 0.86
V3 11.72 1.00E+06 30.00 0.58 0.58 41.40 43.60 0.95
V4 11.72 1.00E+06 26.00 0.87 0.58 40.10 45.23 0.89
V5 11.72 1.00E+06 29.50 0.87 0.58 41.60 47.60 0.87
V6 11.72 1.00E+06 30.00 0.87 0.58 39.40 47.89 0.83
Mean for all the specimens 0.966
Correlation coefficient 0.989

Chapter 5 Theoretical model on compressive arching action and associated
deformation limit state in axially restrained reinforced concrete beam
168
5.5 Conclusions
In this chapter, a theoretical model for the compressive arching action is developed.
The model takes into consideration the compounding effect of bending and arching. It
is shown that the prediction depends on the plastic zone length for bending and the
ratio of arching depth to plastic zone for the arching contribution.
An exploratory study on the variation of the arching depth with the plastic zone length
shows that it increases with the increase of the depth of the compression zone. The
results indicate that adopting a value of 0.35 for the x/LN ratio gives a reasonable
prediction. Using this ratio yield a stable prediction for the arching action as compared
with experimental results for a wide range of beam property parameters.
With the model developed herein the complete load displacement response within the
arching stage can be predicted. The model will be used together with the model for
catenary action to predict the complete load-displacement response of RC beam
assemblies in Chapter 7.

Chapter 6 Simplified theoretical model for prediction of catenary action
incorporating strength degradation in axially restrained beams
169
Chapter 6: Simplified theoretical model for
prediction of catenary action incorporating strength
degradation in axially restrained beams
6.1 Introduction
In the conventional design of steel and reinforced concrete structures, the capacity of
beams is governed by the flexural behaviour with formation of plastic hinges at critical
locations. However, it has been argued that for axially restraint beams, catenary action
may develop and at a much larger displacement and help increase the load capacity of
the beam. Accordingly, a number of experimental studies on steel, composite and RC
beam-column sub-assemblies with axial restraint has been carried out (Sasani &
Kropelnicki 2008; Sadek et al. 2011; Choi & Kim 2011; Yang & Tan 2013a; Yang &
Tan 2014; Li et al. 2013; Li et al. 2015). These studies confirm that with adequate axial
restraint, following the flexural bending stage, the so-called catenary action can
develop causing the beam to behave in a cable-like manner and thus helps improve the
resistance against collapse due to gravity loads. However, these experiments are
expensive and cannot provide detailed information regarding the mechanism of failure
and the reliability of the catenary action. Due to these limitations, the study of catenary
action in axially restrained sub-assembly has often been carried out with finite element
analysis codes.
With the development of high speed computer and the advancement in the finite
element method, the behaviour of structural components and connections at large
deformation can be analysed with high degree of accuracy thereby allowing the
behaviour of the critical regions at large deformation regime to be investigated in
detail. However, the use of finite element method requires a high level of expertise to
properly model this behaviour thereby making it unsuitable for routine use by
practicing Engineers.

Chapter 6 Simplified theoretical model for prediction of catenary action
incorporating strength degradation in axially restrained beams
170
Simplified theoretical model for catenary action may be used in the design, analysis
and assessment of progressive collapse resistance of framed structures. For such model
to be acceptable, it must be able to capture the key responses as observed in the
experiments and the underlying physical mechanisms. These include hardening,
degradation, and catenary action. So far, research in the simplified modelling of
catenary action has remained at its infant stage. For example, studies by (Izzuddin
2005; Li. et al. 2008) assumed highly idealised sectional strength properties in the
formulation of the catenary effect, whereas strength degradation and softening
behaviour are not considered in their model. Existing models of this type assume that
the plastic strength remains available despite very large deformation, whereas the
actual test and FE simulation studies have shown that the behaviour of RC and steel
structure depends on the plastic hinge and connection details, and the catenary capacity
that may be developed is limited by the failure of connections. The use of existing
simplified models may therefore over-predict the collapse resistance in real structures.
In this chapter, a simplified theoretical model which takes into consideration the
degradation of strength, which may arise from failure of some of the component of the
connection is developed. Although the theme of this thesis is directly associated with
reinforced concrete frame structures, the catenary model developed in this chapter is
generic and can be used to assess progressive collapse in both steel and reinforced
concrete frame assemblies. Consequent upon this, steel and RC subassemblies are used
to validate the prediction from the generic model as would be presented in the chapter
and the following chapter.
6.2 Scope of the model
1) The model is initially formulated for simply supported beam with flexible
elastic axial stiffness. This implies that plastic hinges develop at the mid-span
section only. Subsequently, the same principle is extended to beams with
development of plastic hinges at mid-span and end sections.

Chapter 6 Simplified theoretical model for prediction of catenary action
incorporating strength degradation in axially restrained beams
171
2) Different yield functions (M-N interaction curves) may be used in the proposed
model.
3) Response at the cross-sectional level is assumed to be elastic perfectly plastic
and hardening is ignored.
4) The axial restraint of beam is assumed to be symmetric.
6.3 Analysis procedure for a simplified beam model without
consideration of strength degradation
Consider a simply supported steel beam with an axial restraint, as shown in Figure 6.1.
The axial restraint is represented by elastic axial stiffness (Ka). The load-displacement
behaviour of this beam with and without strength degradation is schematically shown
in Figures 6.2a and 6.2b. Four response stages can be identified in these figures; elastic
bending, plastic bending, transient and catenary action stages.
Figure 6.1: Simply supported beam with flexible axial restraint
L/2 L/2
u
θ θ
Ka, HR Ka, HR
P

Chapter 6 Simplified theoretical model for prediction of catenary action
incorporating strength degradation in axially restrained beams
172
(a) Without strength degradation
(b) With strength degradation and final failure
Figure 6.2: Schematics of load-displacement curves
As shown in Figure 6.2, during the initial stage of loading, the beam behaves in flexure.
After the elastic stage, the displacement further increases but the resistance may
remain flat or with some degree of increase depending upon the flexural hardening
behaviour in the plastic region until a form. For simplicity, in the present discussion
Elastic
Plastic bending Transient
stage
Catenary stage
The curve Continues
infinitely
P
δ δb
Pb
Elastic
Plastic bending
Transient
stage
Catenary stage
End of
curve
Degradation of strength
δ
P
δb
Pb

Chapter 6 Simplified theoretical model for prediction of catenary action
incorporating strength degradation in axially restrained beams
173
the plastic flexural stage is assumed to follow immediately the end of the elastic stage
and without hardening.
It is worth noting here that in real structures the flexural stage of response will
generally involve an elastic-plastic transition stage (see Figure 6.3a) with a nonlinear
moment-curvature or moment-rotation relationship at the sectional or plastic hinge
level. For example, in a steel section this will result in yielding developing at the outer
fibre and gradually extending to the inner fibres until reaching full plasticity. The
approximation of the yield point and the yield strength is a separate subject which will
not be discussed in detail here. In this model, the elastic-plastic phase i.e. the point
between the yield of the outer fibre (denoted as My in Figure 6.3a) and the formation
of full plastic capacity (denoted as Mp in Figure 6.3a) is assumed to be elastic. Plastic
hinge only develops at a full plastic moment capacity Mp. With this assumption, the
beam can be simplified into elastic-perfectly plastic as shown in Figure 6.3b.
The symbol and definition of all the key points in Figure 6.3 are explained as follows:
My corresponds to the moment at which the outer fibre first yield.
Mp is the plastic moment capacity of the section
∅𝑦 is the curvature corresponding to the yield moment and
Φp is the curvature corresponding to the plastic moment capacity of the section

Chapter 6 Simplified theoretical model for prediction of catenary action
incorporating strength degradation in axially restrained beams
174
Figure 6.3: Moment-curvature behaviour at section and plastic hinge
6.3.1 Elastic stage
The beam behaves in a flexural manner and depends on the flexural rigidity and
rotational restraint of the beam. In the basic case, axially restraint simply supported
beam is considered. Plastic hinge will only develop at the middle as shown in Figure
6.1. Since this stage involves elastic bending, small deflections are expected, and hence
axial force is negligible at this stage. The end of the elastic stage is reached once the
plastic moment capacities in the middle and end sections are reached (as illustrated in
Figure 6.3), which also implies the formation of hinge. The load and the displacement
at the idealised yield point are given by:
L
MP
p
b
4 (6.1)
EI
LPbb
48
3
(6.2)
Substituting Equations (6.1) into (6.2), the deflection at the end of elastic stage can be
expressed as:
EI
LM pb
12
2
(6.3)
M
𝑀𝑝
𝑀𝑦
y p
pM
p
yM
(a) Elasto-plastic (b) elastic perfectly plastic
pM

Chapter 6 Simplified theoretical model for prediction of catenary action
incorporating strength degradation in axially restrained beams
175
Where Mp is the plastic bending capacity at the plastic hinge. E and I are the Young’s
modulus of the material and second moment of area of the section respectively.
6.3.2 Transient stage/catenary action stage
In the transient stage, the behaviour of the beam at the plastic regions can be said to be
elastic-perfectly plastic. Thus, there is the stretching of the beam in addition to
bending. Axial force effect needs to be considered. The load-displacement behaviour
in this stage is determined incrementally by considering these three key areas;
(Izzuddin 2005)
a. Interaction between the internal forces i.e. bending moment and axial force
(yield function) at the critical section (plastic hinge).
b. Compatibility relationship i.e. the relationship between deformation
(incremental axial deformation and plastic rotation) at the plastic hinge and the
internal forces (moment and axial force) which is determined by a flow rule.
c. Equilibrium of the external and internal forces.
Each of these three areas are discussed in the section that follows.
6.3.2.1 Interaction equation
The plastic interaction between axial force (N) and bending moment (M) is generally
nonlinear. For simplicity, a linear approximation of the interaction between these
internal forces may be assumed and this assumption has been used in previous studies
(Izzuddin 2005). An example of nonlinear interaction between the internal forces at
critical section (plastic hinge) is schematically shown in Figure 6.4, and they may be
expressed as (Yin & Wang 2005):
1
2
pp N
N
M
M (6.4)
1pp N
N
M
M (6.5)

Chapter 6 Simplified theoretical model for prediction of catenary action
incorporating strength degradation in axially restrained beams
176
where M and N are the moment and axial force, Mp and Np are the maximum plastic
bending capacity and maximum axial capacity of the section. is a coefficient which
depends on the sectional properties. For a rectangular section with perfect plastic
condition is 1 (Jirasek & Bazant 2001). The derivation of the equation for a
perfectly plastic rectangular section is given in Appendix 1. The interaction of forces
(bending moment and axial force) in RC section is much more complex than the case
illustrated in this section, however an expression similar to Equation (6.4) can also be
derived.
Figure 6.4: Moment-curvature behaviour at section and plastic hinge
6.3.2.2 Constitutive relationship between internal forces and deformation
In the theory of plasticity, it is known that for perfectly plastic material, the yield
surface remains fixed. Once yielding condition is fulfilled, an infinitesimal increase in
stress will lead to plastic flow. Von Misses in 1928 proposed the concept of plastic
potential function. In his case, he used associated flow rule (i.e. the yield function and
the plastic potential function coincide with each other). According to the flow rule
theory, the vector of plastic deformation increment has direction normal to the yield
surface. More detail on this can be found in Chen & Han (1988). This concept has been
extended to relate internal forces (M, N) to deformation ),( dd at the plastic hinge
zone (Izzuddin 2005; Long & Hung 2008).
pM
M
pN
N

Chapter 6 Simplified theoretical model for prediction of catenary action
incorporating strength degradation in axially restrained beams
177
Referring to Figure 6.4, let define the yield function, where is a function of
bending moment and axial force. Since any combination of internal forces (bending
moment and axial force) must always lie on the yield surface, it implies that;
0),( NMf (6.6)
For each incremental displacement δi, the corresponding elongation of (i
U ) can be
determined as:
222 )2/()2/(*2 LLU ii (6.7)
Equation (6.7) can be simplified further and neglecting smaller terms, gives:
L
U ii
2
2
(6.8)
The elastic elongation then becomes:
piiei UUU (6.9)
From Hooke’s law, the axial force can be related to the effective axial stiffness and
elastic axial deformation of the beam as:
)( piie UUKN (6.10)
where Ke is the effective axial stiffness which is defined as:
asa
e
KKK
K111
1
(6.11)
where Ka is the elastic axial stiffness of the end spring and Ks is the axial stiffness of
the beam (Ks = EA/L).

Chapter 6 Simplified theoretical model for prediction of catenary action
incorporating strength degradation in axially restrained beams
178
Applying flow rule theory to Equation (6.6), the incremental axial deformation (pdU )
and rotation (pd ) occurring at plastic hinge can be expressed as (Long & Hung 2008):
N
M
dU
d
p
p
(6.12)
where N
is the partial derivative of the yield function with respect to N and M
is the partial derivative of yield function with respect to M. indicates the magnitude
of plastic deformation.
Equation (6.12) can be further simplified to:
pp d
M
NdU
(6.13)
Since the normality condition holds for infinitesimal increments in elongation and
rotation, Equation (6.10) can be re-written in incremental form as:
pe d
M
NdUKdN
(6.14)
Noting that for a rigid-plastic beam, the incremental plastic hinge rotation at the mid-
span is given as:
L
dd pm
4 (6.15)
Also, from Equation (6.8)
L
ddU
.4 (6.16)
Substituting Equations (6.15) and (6.16) into (6.14):

Chapter 6 Simplified theoretical model for prediction of catenary action
incorporating strength degradation in axially restrained beams
179
)4..
4(L
d
M
N
L
dKdN e
(6.17)
Integrating Equation (6.17) and assuming starting deflection as the deflection at the
end of elastic bending stage ( b ), the axial force at any given deflection δi can be
expressed as:
M
N
LLKN bbe
)(4
)(2 22
(6.18)
Thus, for a given deflection, the corresponding axial force can be calculated using the
expression in Equation (6.18) and subsequently the moment can be determined from
the yield function (Equation 6.6).
6.3.2.3 Equilibrium of forces
To determine the load at each incremental deflection, one-half of the beam and the
forces acting on it are considered as shown in Figure 6.5. Although the axial force in
the beam may slightly differ from the horizontal reaction, experimental test (Yu & Tan
2013c) shows that the difference is negligible hence herein the horizontal reaction (HR)
is assumed to be the same as the axial force at plastic hinge which is denoted as (N).
Figure 6.5: Free body diagram showing forces acting on the beam
L/2
δ θ
V Mm
N
HR
P/2

Chapter 6 Simplified theoretical model for prediction of catenary action
incorporating strength degradation in axially restrained beams
180
Taking moment about the middle point,
04/ PLR
Hm
M (6.19)
The load P can be obtained as:
L
M
L
HP mR
44
(6.20)
It should be mentioned that the formulation above is in terms of axial and rotational
deformation (U and ). In reality, the deformation is concentrated in a small section
of the beam called plastic hinge zone with finite length (Lp). In other cases, such as
steel connection, the deformation may be concentrated within a small area in which
case, the behaviour is only determined by the rotation of the beam. In the later section,
the application of this model to different connection types and transformation of the
axial deformation and rotation to strain measures based on assumed plastic hinge
length will be discussed.
The flow chart for the determination of load displacement response based on the above
outline procedure is shown in Figure 6.6.

Chapter 6 Simplified theoretical model for prediction of catenary action
incorporating strength degradation in axially restrained beams
181
Figure 6.6: Flow chart for calculating internal forces and vertical resistance without
considering strength degradation
Input geometric and material
properties, boundary condition
Compute Mi from yield function
equation
START
Initialise
δ0, θp0, U0 M0, N0, Mp0, Np0
Input δ
i = 1
Compute Pi
i = i +1
Compute
dθi, dUi
Compute
dUpi =∂Φ/∂N and dθ pi=∂Φ/∂M
End
Compute Ni
Ni
Output Load-displacement

Chapter 6 Simplified theoretical model for prediction of catenary action
incorporating strength degradation in axially restrained beams
182
6.4 Illustrative example of finite element simulation and theoretical
prediction of load-displacement response of beam without
considering strength degradation
In this section, a rectangular hollow section steel beam is modelled using finite element
code (LS-DYNA) and the result is compared with theoretical prediction without
strength degradation.
6.4.1 Finite element model description
The model consists of a two-span beam made of steel rectangular hollow section. Steel
hollow section is selected for the study to avoid lateral torsional buckling which may
increase the complexity of the problem. The overall span of the beam is 9.2m (4.6m
single span) and depth and width is 300mm by 150mm with wall thickness of 10mm.
Young’s modulus and Poisson’s ratio of steel are 200GPa and 0.3 respectively while
the yield strength is 300MPa.
The beam is modelled with constant stress solid element with reduced integration. This
type of solid element has only one integration point and to ensure accurate result is
obtained, a mesh convergence study was performed and a mesh size of 10 x 5 x 10mm
was used across the beam thickness, and 10 x 10 x 10mm was used within the hollow
session area. Taking advantage of symmetry, only one-half of the beam is modelled
and appropriate boundary condition is applied at the middle column stub of the
subassembly.
Pin boundary condition is applied at the end section to simulate the presence of axial
restraint from the surrounding structures. To achieve this boundary condition, the end
section is modelled with elastic element to avoid damage that may increase the
complexity of the problem. A hole of 20mm diameter is created within the elastic end
section with centre of hole located at mid-depth of the beam. A rigid rod with the same
diameter is created having the same centre as that of the hole. The elastic end is
modelled with MAT_001_ELASTIC and the rod is modelled with rigid element
MAT_020_RIGID in LS DYNA. The choice of rigid element for the rod is to avoid

Chapter 6 Simplified theoretical model for prediction of catenary action
incorporating strength degradation in axially restrained beams
183
any deformation. The ends of the rods are constrained in all direction using
CONSTRAINED_SPC_SET Keyword in LS DYNA. Interaction between the rod and
elastic beam end is defined by the contact type available in LS-DYNA
AUTOMATIC_SURFACE_TO_SURFACE_TIEBREAK, where the rod surface is
defined as the master surface and the elastic beam is defined as slave surface. The FE
model of the end section is shown in Figure 6.7b. The top surface nodes of middle
column are push down in a displacement controlled loading manner. The load curve is
defined using CURVE_SMOOTH and the loading rate is small enough to represent a
quasi-static loading scheme and thereby avoid any dynamic effect.
For the theoretical model, the same material and geometric properties used in the FE
model is adopted. The plastic moment (Mp) and axial force capacity (Np) is calculated
as 248kNm and 2580kN respectively. The axial stiffness (Ka) in the theoretical model
is 10e+20N/mm. This stiffness is greater than the axial stiffness of the beam section
(EA/L) (191KN/mm), hence the model beam is rigidly restrained axially.
(a) Elevation view of the end section of FE model

Chapter 6 Simplified theoretical model for prediction of catenary action
incorporating strength degradation in axially restrained beams
184
(b) Enlarged view of elastic end section showing the bolt hole and rigid rod with applied
boundary condition
Figure 6.7: Geometric and boundary Details of the FE model
6.4.2 Result and discussion for FE and theoretical models with no strength
degradation
The load-displacement response for the FE and theoretical models is presented in
Figure 6.8. The FE model slightly over-predicts the response compared to the
theoretical models and the axial capacity of the beam section is reached at a lower
displacement compared to the theoretical model. This is because in the FE model, axial
force develops at an early stage prior to formation of plastic hinge whereas in the
theoretical model, axial force is assumed to start after formation of plastic hinge. For
instance, the axial force in the FE model at the formation of plastic hinge is 294KN
whereas axial force is yet to develop in the theoretical model at the same displacement.
The M-N relationship at a section near the middle column for FE and theoretical
models are shown in Figure 6.9. It could be seen from this Figure that there is a residual
moment capacity when the axial capacity of the section is reached whereas in the
theoretical model, the moment is zero once the axial capacity is reached. Aside these
Fully Constrained edge
nodes in all directions

Chapter 6 Simplified theoretical model for prediction of catenary action
incorporating strength degradation in axially restrained beams
185
minor differences, the theoretical model prediction is comparable with FE model result
with reasonable accuracy.
Figure 6.8: Load-displacement curve for FE and theoretical model without
consideration of strength degradation
0
100
200
300
400
500
600
700
800
0 100 200 300 400 500 600 700
Load
(K
N)
Mid-span displacement (mm)
FE
Theoretical model
0
500
1000
1500
2000
2500
3000
0 50 100 150 200 250 300
Axi
al f
orc
e (K
N)
Moment (KNm)
FE
Theoretical model

Chapter 6 Simplified theoretical model for prediction of catenary action
incorporating strength degradation in axially restrained beams
186
Figure 6.9: Moment-axial force relationship comparison for FE and theoretical model
The plastic strain distribution along the bottom fibre of the beam at three different
middle column displacements of 90, 300 and 500mm which corresponds to start of
yielding, transient stage and pure catenary action stage are also shown in Figure 10 to
shed more light into the evolution of plastic strain and the plastic zone at the middle
section of beam.
Figure 6.10: Plastic strain distribution along the bottom fibre of the beam
As illustrated in Figure 6.10, at a middle column displacement of 300mm, the
maximum plastic strain is about 0.1. For a typical steel connection with welded flange
and bolted web (e.g. Li et al. 2013; Li et al. 2015; Yang & Tan 2013b) some of the
connection components e.g. bottom flange weld may have fractured causing a
reduction in strength. More so the final failure of the connection may occur well before
the displacement of 500mm is reached. In such cases, using existing model (Izzuddin
2005) with no consideration of strength degradation and eventual failure limit will
overestimate the load capacity of the steel assembly under column removal. For the
real behaviour to be captured, it is imperative to consider the degradation of the
internal forces (axial force and bending moment) caused by the failure of some of the
components of the connection and the eventual failure limit. It is on this premise that
0
0.05
0.1
0.15
0.2
0.25
0.3
0.35
0 1000 2000 3000 4000 5000
pla
stic
str
ain
position along the beam (mm)
displacement = 90mm
displacement = 300mm
displacement = 500mm

Chapter 6 Simplified theoretical model for prediction of catenary action
incorporating strength degradation in axially restrained beams
187
degradation of the strength is considered in the next section to reflect the actual
behaviour as observed in the experiments.
6.5 Degradation of yield surface
6.5.1 Concept of strength degradation and implications on catenary effect
The illustration in Section 6.4 clearly shows the need to incorporate strength
degradation in the theoretical model for accurate prediction. In this section
incorporation of strength degradation is explained in detail.
To illustrate the concept of degradation of strength, consider a steel connection in
Figure 6.11a, which is subjected to large deformation. The connection represents a
typical semi-rigid steel connection where the beam flange is welded to the column and
the beam web is bolted to the column through the web cleat on each side of the
connection. At the start of the loading, the beam behaves in flexure with the top flange
in compression and bottom flange in tension. As the load increases, the flexural
capacity is reached. Further loading will lead to the fracture of the bottom weld. Once
this happens, the flexural and axial capacity of the section is significantly reduced and
it is limited by the bolts connecting the beam to column in the web section and the top
flange weld. This reduction in the flexural and axial capacities of the connections need
to be considered to ensure a more reliable prediction of the global load-displacement
response.
(a) Typical semi rigid steel connection (Li et al. 2015)

Chapter 6 Simplified theoretical model for prediction of catenary action
incorporating strength degradation in axially restrained beams
188
(b) Bending moment-rotation curve
(c) Axial force-axial displacement relationship
Figure 6.11: A representative joint connection and process of strength degradation
As shown in Figures 6.11b and c, due to the failure of the bottom flange weld, the
bending moment and axial force is reduced. The reduction of axial force may be steep
or less steep (as shown in Figure 6.11c) depending on the ductility of the welded area.
The M-N curve corresponding to the ultimate and degraded surfaces after failure of
the bottom weld are shown in Figure 6.12. In this theoretical model, the equilibrium is
sought for on the degraded surface once the failure criteria are met. The way and
manner in which this is done in the model is explained in Section 6.5.2.
M
P
Moment degradation due to
bottom weld fracture
N
∆
Sudden axial strength
degradation due to bottom weld
fracture
Gradual axial strength degradation
due to bottom weld fracture

Chapter 6 Simplified theoretical model for prediction of catenary action
incorporating strength degradation in axially restrained beams
189
Figure 6.12: Ultimate and residual yield surfaces
6.5.2 Implementation of degradation of yield surfaces in the beam analysis
procedure
6.5.2.1 General rules
Given the ultimate and residual yield surfaces, the reduction of internal forces (bending
moment and axial force) can be obtained once the specified failure criteria is reached.
As an illustration, Figure 6.13 is reconsidered. Let A be a point (on the ultimate
surface) at which specified condition for degradation is fulfilled. For further increment,
equilibrium is sought for using the residual yield surface. Before seeking for
equilibrium on the residual surface, the internal forces need to be reduced such that a
combination of axial force and bending moment lies on the new residual yield surface.
Mresidual
Nresidual
Nult
Degradation
Mult

Chapter 6 Simplified theoretical model for prediction of catenary action
incorporating strength degradation in axially restrained beams
190
Figure 6.13: Illustration of migration between ultimate and residual surfaces
The method of reducing these internal forces belongs to the plasticity theory and there
have been different methods to determine the new position on the residual surface
depending on the hardening rule used. In this model, the radial method is adopted
(Dafalias & Herrmann 1986; Seidalinov & Taiebat 2014). According to this method,
every point on the ultimate yield surface (or bounding surface) has a corresponding
image point on the degraded surface. Any mapping rule adopted must satisfy the
identity condition (Seidalinov & Taiebat 2014). By identity condition, it means that
the new internal forces must lie on the degraded surface.
Using the radial mapping rule, the image of point (M, N) on the ultimate surface is
projected onto the degraded surface (M’, N’). This image point can be determined
using the following expression (Seidalinov & Taiebat 2014).
)('CC
MMMM (6.21)
)('CC
NNNN (6.22)
where is the ratio between internal forces on the degraded and ultimate yield
surfaces. MC and NC corresponds to the projecting centre (PC). M and N are the
internal forces on the ultimate yield surface and M’ and N’ are the corresponding
image point on the degraded surface.
Mresidual
Nresidual
Nult
Mult
(M, N)
(M’, N’)
PC
A

Chapter 6 Simplified theoretical model for prediction of catenary action
incorporating strength degradation in axially restrained beams
191
In this model, isotropic hardening is assumed. This means that the yield surface can
expand or contract (hardened or softened) but cannot translate. Therefore, the
projection centre (PC) is fixed. With this assumption, Equations (6.21) and (6.22) can
be further simplified to:
MM ' (6.23)
NN ' (6.24)
where MC and NC are zero as shown in Figure 6.13.
The value of can be determined by substituting Equations (6.23) and (6.24) into the
degraded surface function. An example of generalised representation of degraded
nonlinear yield function is given in Equation (6.25) as:
1
2
pNpM N
N
M
M
(6.25)
where M and N are the reduction factors for axial force and bending moment.
6.5.2.2 Condition for activating strength degradation
The formulation presented in Section 6.3 is in terms of axial deformation and rotation.
For steel connection, the rotation of the connection may be taken as the governing
criteria for determining when strength degradation may occur. This could be argued
on the fact that connection zone is small compared to the entire beam and while the
beam remains elastic, only the connection zone elongates. On the other hand, for a RC
structure, the plastic hinge is much larger and this plastic hinge elongates and also
rotates. To relate the axial elongation and rotation of the beam in this case to physical
behaviour of the plastic hinge, the combined effect needs to be considered. There may
be different ways to measure the combined effect, depending on the details of the
plastic regions and the damage mechanisms. But in general, the combined maximum
strain may be indicative of the local demands and hence the degree of degradation. For
this reason, herein we employ the maximum strain as a limiting criterion for the
development into degradation phase.

Chapter 6 Simplified theoretical model for prediction of catenary action
incorporating strength degradation in axially restrained beams
192
To relate the strain criterion to the plastic deformation in the beam model, it is
necessary to express the two components; axial deformation and rotation in terms of
the maximum strain in the critical cross section (plastic hinge zone). It is known that
rotation is related to the curvature of the section and axial deformation is related to the
axial strain through the following expressions:
pp LU max ; and ppL (6.26)
where d
max2
(assuming bending neutral axis is at the section centre).
Resolving the above equations, the total strain becomes;
p
p
p
py
L
d
L
U
E 2max
(6.27)
where;
y is the yield strength of the material
max is the maximum strain in the plastic hinge
pU is the axial elongation at each increment
p is the angular rotation at each increment
d is depth of the section
pL is the theoretical plastic hinge length.
Although the yield strain is very small compared to the total strain, it should be
considered to achieve a more accurate prediction. In this illustrative work, the
theoretical plastic hinge length is assumed a certain value. In subsequent stage of this
study where the behaviour of reinforced concrete beam will be investigated, an
equivalent plastic hinge length will be used. A flow chart showing the implementation
of the strength degradation is shown in Figure 6.14.

Chapter 6 Simplified theoretical model for prediction of catenary action
incorporating strength degradation in axially restrained beams
193
Figure 6.14: Flow chart for calculating internal forces and vertical resistance with
consideration of strength degradation
Input geometric and material
properties, boundary condition
START
Initialise
δ0, θp0, U0 M0, N0, Mp0, Np0
Input δ
i = 1
Compute Pi
i = i
+1
Compute dθi, dUi
Compute
dUpi = ∂Φ/∂N, dθpi = ∂Φ/∂M
from ultimate yield surface
End
Reduce internal forces
as per Sec. 6.5
Ni
Output Load-displacement
Compute max strain (εmax)
NO
Compute
dUpi = ∂Φ/∂N, dθpi = ∂Φ/∂M
from degraded yield surface
Compute Ni
Compute Mi from
ultimate yield surface
Compute Mi from degraded
yield surface
Compute Ni
YES εmax ≥ εcri
i = i +1

Chapter 6 Simplified theoretical model for prediction of catenary action
incorporating strength degradation in axially restrained beams
194
6.6 Verification of the theoretical model for prediction of load-
displacement resistance function with strength degradation
6.6.1 Validation with a conceptual FE simulation
The same beam modelled in Section 6.4 is considered here. The entire beam is
modelled with elastic properties. The strength degradation is conceptually represented
as follows. A section near the middle column which is 50mm in depth and 100mm in
length is modelled with another material (elastic) such that at specified maximum
strain of 0.1, the element in this section will be eroded which leads to degradation of
strength. Figure 6.15 shows the FE model, the critical section with failure strain of 0.1
is shown in the highlighted area. The schematic representation of the section before
and after strength degradation is shown in Figure 6.16.
Figure 6.15: Section near middle column with the degraded section shown in the
highlighted area

Chapter 6 Simplified theoretical model for prediction of catenary action
incorporating strength degradation in axially restrained beams
195
Figure 6.16: Schematic showing the sections before and after degradation
For the undamaged section used in this analysis, the bending moment-axial force
interaction is governed by the equation:
1
2
pp N
N
M
M (6.28)
To determine the degraded yield surface, three points were selected to calculate the
axial force and bending moment using the degraded section in Figure 14b. These
included;
1) Section in pure bending (no axial force).
2) Section subjected to axial force without bending and,
3) A combination of certain amount of axial force and bending moment
Based on these three points, interaction curve for the full and degraded yield surfaces
are shown in Figure 6.17. It can be seen that the degradation has a pronounced effect
on the moment capacity of the section compared to the axial capacity. While the axial
capacity reduced by only 27% percent, the moment capacity reduced by 46%.
0.15m
0.3m 0.25m
(a) Intact Section (b) Section after partial failure
0.15m

Chapter 6 Simplified theoretical model for prediction of catenary action
incorporating strength degradation in axially restrained beams
196
Figure 6.17: Moment-axial force interaction curves for full and degraded sections
The equation for the normalised relationship between bending moment and axial force
for the degraded surface can be expressed as:
1 14.0 86.01
2
11
ppp N
N
N
N
M
M (6.29)
where Mp1 and Np1 are the moment and axial force capacities for the degraded section
calculated as 134.6KNm and 1890KN respectively. Noting that the moment (Mp) and
axial force (Np) capacities for the full section are 248KNm and 2580KN, the moment
- axial force interaction in Equation (6.28) can be expressed in terms of capacities of
the full section (Mp and Np) as:
1 14.0 86.0
2
pNpNpM N
N
N
N
M
M
(6.30)
where M and N are 0.54 and 0.73 respectively.
The comparison of load-middle column displacement between the proposed
theoretical model and FE model is shown in Figure 6.18. It can be seen that the
proposed theoretical model captures accurately the reduction in the global strength
caused by the failure of elements in the critical section. It should however be noted
that the spread of damage zone has an effect on the global load-deformation behaviour.
0
50
100
150
200
250
300
0 500 1000 1500 2000 2500 3000
Mo
men
t (K
Nm
)
Axial force (KN)
full section
degraded section

Chapter 6 Simplified theoretical model for prediction of catenary action
incorporating strength degradation in axially restrained beams
197
Nevertheless, the exploration herein shows the accuracy of the proposed theoretical
model in capturing the degradation of strength in the critical region on the global
behaviour of the beam assembly.
Figure 6.18: Comparison of load-displacement response from FE and proposed model
with strength degradation
6.6.2 Validation with existing experiment
The reliability of the theoretical model with strength degradation is further checked
using experimental studies by Li et al. (2015) . The steel subassembly tested in their
studies was extracted from a building with the two ends assumed to be the points of
contra-flexures and middle column was removed. The detail of the middle beam-
column connection as shown in Figure 6.19 consisted of a beam web bolted to the
column and the beam flange welded to the column. Pin boundary condition was
applied at the beam ends to simulate the axial restraint and the total length of the beam
assembly was 4500mm. The beam was made of standard H section H300 x 150 x 6 x
8 (H x B x tw x tf) and the middle column section dimension was square hollow section
(SHS) of size 250 x 14 (D x t). Four rows of bolt were used to connect the beam web
0
50
100
150
200
250
300
350
400
450
500
0 100 200 300 400 500 600
Load
(K
N)
Middle column displacement (mm)
FE result
proposed model

Chapter 6 Simplified theoretical model for prediction of catenary action
incorporating strength degradation in axially restrained beams
198
to column. The yield and ultimate strength of the beam section was 407 and 653MPa
respectively. More details about the experiment can be found in Li et al. (2015).
As stated previously, the failure criteria for steel subassembly may be well represented
by the rotation of the connection. The rotation at rupture of weld and rotation at
eventual failure for a given type of joint details may be determined using more detailed
studies including physical experiments. Such data from experimental and other studies
on limiting criteria can be easily employed in the proposed theoretical model for the
evaluation of the load-displacement resistance function. Since such general data is not
currently available, herein the rotation corresponding to the rupture of bottom weld
and final failure reported in the test is used.
For a more accurate determination of moment-axial force strength curves, a detailed
analysis may be performed for the connection before and after the failure of the bottom
flange weld taking into consideration of the bolt arrangements. In the present purpose,
a simplified analysis of the M-N relationship is performed using an equivalent beam
section. The assumed beam section for the calculation of M-N curve before and after
the rupture of bottom flange weld is shown in Figure 6.20. The assumption here is that
after the failure of the weld, the bottom flange no longer contributes to the resistance
and the section can be assumed to comprise of the web and the top flange.
Figure 6.19: Middle beam-column joint and section details of tested specimen (Li et al.
2015)

Chapter 6 Simplified theoretical model for prediction of catenary action
incorporating strength degradation in axially restrained beams
199
Figure 6.20: Determination of M-N curves for the critical region of the tested beam
(dimensions in mm)
The M-N interaction curve for the section before and after bottom weld rupture based
on the simplified approach explained above and the section geometry in Figure 6.20 is
shown in Figure 6.21.
Figure 6.21: Moment-axial force curves before and after fracture of bottom weld
0
50
100
150
200
250
0 500 1000 1500 2000
Mo
men
t (K
Nm
)
Axial force (KN)
before failure of bottom weld
after failure of bottom weld
6
8
300
8
150
(a) before bottom weld failure (b) after bottom weld failure

Chapter 6 Simplified theoretical model for prediction of catenary action
incorporating strength degradation in axially restrained beams
200
From Figures 6.20 and 6.21, the moment-axial force interaction equations for the full
and reduced section following bottom weld fracture can be expressed as:
1
2
pp N
N
M
M (6.31)
133.069.098.01
2
11
ppp N
N
N
N
M
M (6.32)
where Mp1 and Np1 are the moment and axial force capacities for the reduced section
calculated as 109KNm and 1221KN respectively.
The Moment (Mp) and axial force (Np) capacities for the full section is calculated as
205KNm and 1709KN respectively, hence the moment-axial force interaction in
Equation (6.32) can also be expressed in terms of capacities of the full section (Mp and
Np) as:
133.069.098.0
2
pNpNpMN
N
N
N
M
M
(6.33)
Where M
and N
are 0.53 and 0.71 respectively.
Using the actual and degraded yield surfaces, the load-displacement response is
predicted and Figure 6.22 shows the comparison between the experimental and
proposed theoretical predictions. It is seen that the theoretical prediction match well
with the experimental load-displacement curve. As mentioned previously, information
about the rotation at failure of the bottom weld was adopted from the experiment. If
such information is available for a given type of connection, it can be used in the model
to predict the response with accuracy.

Chapter 6 Simplified theoretical model for prediction of catenary action
incorporating strength degradation in axially restrained beams
201
Figure 6.22: Comparison of load-displacement response from experimental result and
proposed model
6.7 Application of the proposed model to reinforced concrete beam-
column assemblies
6.7.1 General assumptions
The model can be applied to predict the load-displacement response of RC assemblies.
From available experimental studies on RC assemblies catenary action start at a middle
column displacement of about one beam-depth (Yu & Tan 2013b; Sadek et al. 2011).
Prior to the displacement of one-beam depth, the assemblies traverse through the
flexural and compressive arching response stages. A schematic representation of the
complete load-displacement response including the different stages of response is
shown in Figure 6.23. The model for compressive arching action developed in Chapter
five can be used to predict the load-displacement response till the deflection of one-
beam depth. For simplicity, it is assumed in this model that the load at the start of
catenary action is determined by the flexural capacity of the beam. In certain instances,
concrete may be severely crushed such that the bending capacity prior to catenary
action stage is lower than the actual bending capacity; however as observed from
0
50
100
150
200
250
300
350
0 50 100 150 200 250 300 350 400
Ap
plie
d L
oad
(K
N)
Middle column displacement (mm)
Li et al (2015)
proposed model

Chapter 6 Simplified theoretical model for prediction of catenary action
incorporating strength degradation in axially restrained beams
202
majority of the available tests and from FE simulation tests, assumption of flexural
capacity is not too far away from the actual behaviour.
Figure 6.23: Idealised load-displacement resistance function for RC assemblies in the
proposed model
6.7.2 Formulation for fixed end RC beams with plastic hinges at support and
middle sections
The formulation presented in Section 6.3 only considered plastic hinge developing at
middle section of the beam. For a typical reinforced concrete assembly located in the
middle of the RC building, plastic hinges will form at the middle and end section,
hence the constitutive equations of all the plastic hinges needs to be considered in
determining the axial force in the beam.
Let the constitutive behaviour of the plastic hinges at the middle and end sections be
m and e .
Load
Starting point of catenary
action in the model δ =1.0d
Displacement
Rupture of bottom
rebar

Chapter 6 Simplified theoretical model for prediction of catenary action
incorporating strength degradation in axially restrained beams
203
where:
0),( NMfmm
for middle section (6.34)
0),( NMf ee for end section (6.35)
As shown previously, the overall elongation of the beam for a given displacement was
calculated as:
L
U22
(6.36)
For a small increment in elongation and rotation, the axial force in the beam can be
expressed as:
)2(pmpee
dUdUdUKdN (6.37)
where pmdU and pe
dU are the incremental elongation of the plastic hinges at the middle
and end sections respectively, assuming the beam is symmetrical about the middle
section such that plastic hinges at both ends are the same.
Applying flow rule theory to Equations (6.34) and (6.35), the incremental axial
deformation pmdU and pe
dU can be worked out as done previously. Hence equation
(6.37) can be expressed as:
pm
m
pe
e
ed
M
Nd
M
NdUKdN
.2 (6.38)
where:
L
dd
pm
4 and
L
dd
pe
2 (6.39)
Substituting Equations (6.39) into (6.38) and integrating with deflection of uc as the
starting deflection, where uc=1.0d, gives:

Chapter 6 Simplified theoretical model for prediction of catenary action
incorporating strength degradation in axially restrained beams
204
m
mc
e
ecc
e
M
N
LM
N
LLKN
)(
4)(
4)(
222
(6.40)
Thus, for each incremental displacement, the axial force can be calculated using the
expression in Equation (6.40) and subsequently the moment at the middle and end
sections can be determined from the yield function in Equations (6.34) and (6.35)
respectively.
6.7.3 Equilibrium of forces
To determine the load at each incremental displacement, one-half of the beam and the
forces acting on it is considered as shown in Figure 6.24. Similar to the assumption
stated in Section 6.3, the horizontal reaction (HR) is assumed to be the same as the
axial force at plastic hinge which is denoted as (N).
Figure 6.24: Free body diagram showing force acting on a fixed end beam
Taking moment about the middle point,
04/ PLHMM Rme (6.41)
The load vertical load P can be obtained as:
L
M
L
M
L
HP emR 444
(6.42)
L/2
δ
θ
V
Mm
N
HR
P/2
Me

Chapter 6 Simplified theoretical model for prediction of catenary action
incorporating strength degradation in axially restrained beams
205
6.7.4 Failure criteria during catenary action
In terms of failure criteria, the rupture of reinforcement during catenary action stage
depends on the strain in the reinforcement at the critical sections. The strain in the
reinforcement (at end and middle section) at the start of catenary action can be
determined using the compressive arching model. Thus, the total strain at the critical
section at any stage of the catenary action can be expressed as:
catcomytotal (6.43)
where y is the yield strain of reinforcement at the end of elastic stage defined as:
E
yy
(6.44)
com is the strain in the tensile reinforcement at the end of compressive arching stage
(deflection of 1.0d) which is determined using the compressive theoretical model in
Chapter 5 as:
LL
xad
p
bp
pcom
*5.0
)( (6.45)
where:
p is the displacement at the end of compressive arching action
d is the depth of the beam
L is the length of double bay beam
a is the cover to reinforcement
Lp is the plastic hinge length used in the theoretical model for compressive arching
action
bpx is the compression zone depth for bending at the critical section (middle or end
section)

Chapter 6 Simplified theoretical model for prediction of catenary action
incorporating strength degradation in axially restrained beams
206
cat is the strain in reinforcement during the catenary action stage which can be
expressed as:
pc
p
pc
p
cat
L
d
L
U
2
5.0 (6.46)
where pcL is the plastic zone length in the catenary action stage.
Comparing Equation (6.27) and (6.46) it can be seen that the strain due to elongation
of the beam is reduced by half. The assumption herein is that plastic hinge length at
the end and middle section are similar. Thus, damage due to elongation of the beam is
divided into two each being taken by plastic hinges at the end and middle section as
represented in Equation (6.46).
During the catenary action stage, the entire beam behaves in a cable like manner.
Severe cracks occur at the end and middle column section with cracks also developing
along the beam at approximately equal spacing (Yu & Tan 2013b; Sadek et al. 2011).
This damage may be lumped within the plastic zone at the end and middle column
section. For this reason, a plastic zone needs to be defined to reflect the behaviour. It
should be noted that the plastic hinge length in the theoretical model on compressive
arching action may be different from the plastic hinge length during the catenary
model. Hence, they are represented by different symbols herein referred to as Lp and
Lpc for compressive arching action and catenary models respectively. Thus, with
selected plastic hinge length for compressive arching and catenary action stages, the
displacement at which the reinforcement ruptures can be determined.
Figure 6.25 shows the flow chat for the implementation of the procedure outlined
above. The application of the model in predicting the load-displacement response of
RC assemblies will be presented in Chapter 7.

Chapter 6 Simplified theoretical model for prediction of catenary action
incorporating strength degradation in axially restrained beams
207
Figure 6.25: Flow chart for calculating internal forces and vertical resistance without
considering strength degradation
Input geometric and material
properties, boundary condition
Compute Me and Mm from yield
function curves m
and e
START
Initialise
δc, Mpe, Np, Mpm, εcri
δ = δc + δi
i = 1
Compute Pi
i = i +1
Compute εTotal
Compute
dUpe =∂Φ/∂Ne, dθ pe=∂Φ/∂Me
dUpm =∂Φ/∂Nm, dθ pm=∂Φ/∂Mm
End
Compute Ni
Ni
Output P, δ
εTotal ≤ εcri YES
NO

Chapter 6 Simplified theoretical model for prediction of catenary action
incorporating strength degradation in axially restrained beams
208
6.8 Conclusions
An analytical model for catenary action in axially restrained beam is proposed in this
Chapter. The model takes into consideration strength degradation which can occur due
to failure of some connection components. The proposed model is initially formulated
for a simply supported beam and is also extended to cover fixed-end beam with axial
restraint. It takes into account the plastic interaction between axial force and bending
moment at the plastic hinges for each incremental displacement.
Comparison of experimental test result and predictions from the proposed model
shows that the model is capable of predicting correctly the load-displacement response
of steel and RC subassembly including the strength degradation which may occur due
to failure of some connection components like failure of bottom weld. The model can
be used for RC assembly and with a starting displacement after which overall tension
in the beams develops (around the order of the depth of the beam). Different criteria
for activating the strength degradation in steel and RC assemblies has been discussed.
The generic proposed model is simple and can give reliable result which can be used
for quick assessment of progressive collapse in steel and RC frame structures.

Chapter 7 Assessment of progressive collapse of RC frame using the
developed model framework
209
Chapter 7: Assessment of progressive collapse of
RC frame using the developed model framework
7.1 Introduction
In the preceding Chapters, it was shown that for a laterally restrained RC beam
assemblage, compressive arching and catenary actions develop to a varying degree,
and these actions add onto the general flexural action and in combination they could
provide the necessary structure bridging over a loss column and prevent the
progressive collapse of the frame structure. Accordingly, theoretical models on
compressive arching action and catenary action have been developed and validated.
Although, beam-column fibre element can be used in modelling the response of
progressive collapse of RC buildings, it still presents some challenges in modelling
accurately the response under column removal. For instance, accurate material model
for modelling the confine and unconfined concrete needs to be selected to be better
represented the compressive arching action. More so, the beam-to-column joint
interface needs to be correctly modelled to obtained accurate result. All this present
additional difficulties hence, the simplified model presented in this study can produce
accurate result with less effort.
Using the developed theoretical models, the complete resistance function (load-
displacement curve) for a critical RC assemblage with a loss of vertical member can
be obtained.
In a conventional design, the compressive arching and catenary actions are not
considered. In general, the capacity of an RC beam is governed by the flexural
behaviour with formation of plastic hinges marking the load capacity of the beam.
Assessing progressive collapse of a laterally restraint beam-assemblage based on the
flexural capacity may therefore considerably underestimate the progressive collapse
resistance capacity of the RC frame as a whole. On the other hand, inaccurate

Chapter 7 Assessment of progressive collapse of RC frame using the
developed model framework
210
estimation of the arching and catenary effects without considering adequately the
degradation mechanisms could lead to overestimate of the collapse resistance. With
the models developed in this thesis, the compressive arching and catenary actions can
be well predicted and with improved accuracy.
The resistance functions (load-displacement curves) in the models are determined
under static conditions. Without any significant effects due to strain rate, which is not
expected to be very high in the progressive phase of the structural response, such
resistance functions should represent the constitutive behaviour, which can
subsequently be employed in a dynamic response analysis procedure. Indeed,
progressive collapse is a dynamic event, and thus an accurate assessment of the
amplitude of the response needs to take into consideration the dynamic effect arising
from the sudden loss of column.
Many researchers have considered different approaches in assessing progressive
collapse using static nonlinear load-displacement curve. GSA (2003) recommended a
dynamic amplification factor of 2 to be used with the nonlinear static approach.
However, a dynamic load factor of 2 has been argued to be too conservative especially
in structures with realistic hardening after initial yielding where the dynamic factor
could be much less than 2, consequently in the current edition of GSA (2013), a factor
which is based on ductility of the member is used in an equivalent nonlinear static
approach.
Izzuddin (2008) proposed a method of assessing progressive collapse using the energy
balance principle. The method involves (1) determination of nonlinear static resistance
function of the structure without the loss column, (2) determination of maximum
dynamic response under sudden column removal using simplified dynamic assessment
i.e. converting the nonlinear static resistance function to pseudo static curve, and (3)
ductility assessment of the connections. The pseudo static curve is determined on the
assumption that part of the building bridging over a loss column has a dominant
deformation mode and respond like a single degree of freedom systems. The accuracy
of this method depends on the accuracy of the nonlinear static resistance function. The

Chapter 7 Assessment of progressive collapse of RC frame using the
developed model framework
211
method has been used in assessing progressive collapse of steel structures (Izzuddin et
al. 2007; Izzuddin et al. 2008; Vlassis et al. 2009; Jahromi et al. 2012)
This chapter therefore presents an investigative study into the importance of including
realistic compressive arching and catenary actions in the assessment of progressive
collapse resistance of RC subassemblies bridging over a loss column. The resistance
functions of the structure with the loss column is determined using the compressive
arching and catenary models developed in this thesis. Using the established energy
method (Izzuddin 2008), the nonlinear resistance function is converted to a pseudo
static response which is then used to assess the potential of collapse. The subassembly
of the directly affected part of the frame structure is also modelled in LS DYNA, and
the nonlinear static and dynamic responses obtained from the analytically predicted
and FE modelling results are compared.
7.2 Design of the building frame
For this analysis, a four-storey office building is designed according to Eurocode 2.
The plan dimension of the building is 35m by 20m and the gross floor thickness is
assumed to be 200mm. The ground storey height is 4m and other storeys are uniformly
3m high, and the spacing between columns in both directions is 5m which is common
in practice. The dead load was determined as 5KN/m2 with an imposed load of 5KN/m2
which is adequate for an office building. In addition to the dead load from the slab, it
is assumed that the periphery frame carries an additional load of 10KN/m due to
cladding and parapet walls. The unfactored dead and live load on the periphery frame
are 22.5KN/m and 12.5KN/m respectively. Applying the appropriate factor of safety
according to Eurocode 2, the maximum design load on the periphery frame is 50KN/m.
Figure 7.1 and 7.2 shows the plan of the building and the bending moment distribution
on the periphery frame (grid line A/1-7) based on the maximum design load of
50KN/m.

Chapter 7 Assessment of progressive collapse of RC frame using the
developed model framework
212
Figure 7.1: Plan view of the building (dimension in metres)
Figure 7.2: Bending moment distribution of the periphery frame
The RC beams are designed according to Eurocode 2. When designing RC structures,
the structural designer has the choice of minimizing reinforcement or section size to
achieve the desired design moment capacity. In this investigative study two different
designs having approximately the same flexural load capacity but different section
sizes and reinforcement ratios are considered. A summary of the design details for the
two designs are shown in Table 7.1. For simplicity, the reinforcement is assumed to
1 2 3 4 5 6 7
5 5 5 5 5 5
A
C
D
E
B
5
5
5
5

Chapter 7 Assessment of progressive collapse of RC frame using the
developed model framework
213
be continuous within the bay of the removed column. In practice, this could be
achieved by using mechanical couplers.
Table 7.1: Summary of design data
7.3 Simplified column loss representation
As mentioned previously, the periphery columns are more exposed to accidental load
or an attack. In this study, column A4 (shown in red in Figure 7.1) is assumed to be
loss. If the indirectly affected bay can provide adequate restraint to the directly affected
bay where column is loss, then damage may be confined within the directly affected
bay. As shown in Figure 7.3, the bending moment in the directly affected bay reverses
sign with amplified magnitude because of the missing column.
Properties/Design ID Model A (L/d=13) Model B (L/d=9)
Beam dimensions (mm) 250 x 350 250 x 500
Longitudinal beam reinforcement at
support
2T20+2T16 (top)
3T16 (bot)
3T16 (top)
2T16 (bot)
Longitudinal beam reinforcement at
mid-span
2T16 (top)
3T16 (bot)
2T16 (top)
2T16 (bot)
Shear reinforcement in beam Ф8 @ 100mm Ф8 @ 75mm
Column dimensions 400 x 400 400 x 400
Longitudinal reinforcement in
columns 12T16 12T16
Shear reinforcement in columns Ф8 @ 150mm Ф8 @ 150mm

Chapter 7 Assessment of progressive collapse of RC frame using the
developed model framework
214
Figure 7.3: Bending moment distribution of Periphery frame without the missing
column
For progressive collapse assessment, the frame without the missing column may be
modelled to assess the potential of bridging over the missing column. The most
comprehensive analysis will involve modelling the entire structure to ensure that
interaction across the structural system is fully taken into account. However, modelling
the entire frame will be computationally expensive.
For this reason, a key substructure, in this case the ground floor beam and column in
the directly affected part, may be modelled while appropriate boundary conditions are
applied at point A and B as shown in Figure 7.3 to simulate the lateral restraint
provided by the remaining part of the building. The axial restraint can be determined
by performing an elastic analysis on the entire frame without the loss column with a
(unit) horizontal force applied at point A and B in Figure 7.3. Previous studies shows
that including floor slab increases the axial restraint considerably (Yu 2012; Sasani et
al. 2011). However, in the present analysis it is assumed that the floor slab is precast
and hence does not contribute to the axial restraint. Figure 7.4 shows the deformed
shape of the frame under a unit load of 1N at point A and B. It can be seen that swaying
of column occurs at the ground and first floor and the other floor columns are less
affected by the swaying.
A B

Chapter 7 Assessment of progressive collapse of RC frame using the
developed model framework
215
Figure 7.4: Deformation shape of the frame under a unit horizontal at points A and B
For a quick estimation of the axial restraint provided by the indirect bay of the building,
the contribution from column/beam members on either side of the directly affected bay
may be considered. Since the building is symmetrical about the removed column, the
axial restraint will be the same. Considering only the left part of the RC frame and
assuming that all upper joints on the right side are restrained in the horizontal
directions as shown in Figure 7.5, the axial restraint stiffness may be calculated as:
Figure 7.5: Simplified representation of left part of the RC frame
1

Chapter 7 Assessment of progressive collapse of RC frame using the
developed model framework
216
333
12*2
12* 3
12*3
b
b
tc
tc
bc
bcRL
L
EI
L
EI
L
EIKK (7.1)
where Ib, Itc and Ibc are the second moment of area of the transverse beam, top column
and bottom column section respectively.
The axial restraint stiffness from the elastic analysis of the frame without the missing
column using GSA software is 88385KN/m while that obtained from the simplified
expression in Equation (7.1) is 107511KN/m. It is seen that the axial stiffness from the
simplified approach is about 18 percent more than the stiffness obtained from the
elastic analysis of the entire frame. This difference may be due to assumption adopted
in the simplified expression that is, ignoring the deformation in the upper columns. As
can be observed in Figure 7.4, the upper joints are not completely rigid, hence the
upper columns exhibit some swaying deformations and this reduces the axial stiffness.
Nevertheless, the simplified approach can give an indication of the axial restraint for
a given geometric properties of RC frame.
From Equation (7.1), it can be seen that axial stiffness depends on the size of the
column and the larger the column, the higher the axial restraint stiffness. Since axial
restraint is not the main focus of the present study, a reasonable axial restraint of value
3 x 10⁵KN/m which is less than the axial stiffness of the beam (EA/L = 5 x 10⁵KN/m)
is selected for the investigative study.
With this simplification, the RC subassembly within the directly affected part may be
considered as schematically shown in Figure 7.6.

Chapter 7 Assessment of progressive collapse of RC frame using the
developed model framework
217
Figure 7.6: Directly affected subassembly of the building
7.4 Numerical modelling
7.4.1 Detail of the model
The FE modelling approach developed in Chapter 4 is used to model the quasi-static
resistance and dynamic responses of the subassemblies. The subassemblies are
modelled using a general-purpose finite element code (LS-DYNA). Concrete is
modelled with KCC model while reinforcements in column and beam are modelled
with PIECEWISE_LINEAR_PLASTICITY (mat_24). The mesh size of concrete and
rebar is selected as 20mm. Due to symmetry, only one-half of the beam is modelled.
The middle nodes of the bottom column are constrained in the vertical direction and
the middle nodes of the end section are connected to elastic springs as schematically
shown in Figure 7.6. This boundary condition allows moment to develop at end section
due to the combined effect of axial constraint and roller pin. Thus, plastic hinges will
develop at the middle and end sections. A group of elastic springs (nine here) are
attached to the end face of the beam just to avoid force concentration to model the
axial restraint with a total of axial stiffness being 3 x 10⁵KN/m.
The compressive strength of concrete is taken as 30MPa and yield strength of
transverse and longitudinal reinforcement are 400 and 500MPa, respectively. For
simplicity, the longitudinal reinforcement is defined with trilinear elastic plastic
Axial stiffness
Symmetry
line
Ka
Removed
column
Roller support

Chapter 7 Assessment of progressive collapse of RC frame using the
developed model framework
218
behaviour with an ultimate strength and rupture strain of 650MPa and 0.1 respectively
as shown in Figure 7.7.
Figure 7.7: Stress strain curve for longitudinal reinforcement
To provide a good reference for comparison with the theoretical model prediction, the
subassembly is first analysed under a quasi-static load acting at the middle column.
For the quasi static loading, displacement controlled loading approach is adopted to
ensure the descending phase is captured properly.
7.4.2 Nonlinear dynamic analysis modelling approach
As stated in Chapter 3, the most direct method for assessing progressive collapse of
building is the nonlinear dynamic analysis. Accordingly, nonlinear dynamic analysis
is performed on the subassembly. The essence of the direct dynamic analysis herein is
to compare with the assessment from the framework developed in this thesis.
In accordance with the procedure stipulated by GSA (2013), the nonlinear dynamic
analysis consist of replacing the column from the structure with equivalent forces and
at the same time applying the uniform gravity loads to the subassembly in a quasi-
static manner, thus resembling the static equilibrium condition as in the original
structure with the column in place. Following which the column reaction is then
0
100
200
300
400
500
600
700
0 0.02 0.04 0.06 0.08 0.1 0.12
stre
ss (
MP
a)
strain

Chapter 7 Assessment of progressive collapse of RC frame using the
developed model framework
219
removed within a stipulated time interval. In this study, the column removal time is
made very small to represent a sudden column removal. The load combination for
dynamic analysis is as per GSA (2013) and is given as:
5.02.1 LDGND (7.2)
where D and L are the unfactored dead and live load respectively. From the RC
building design presented in Section 7.2, the unfactored dead and live loads are 22.5
and 12.5KN/m respectively which result in gravity load of 33.3KN/m for the dynamic
analysis. Consider one-half of the sub-assembly, the total load on the beam is 166.3KN
and it is assumed that half of this load is carried by the middle column (removed
column). Note that there will be another half of the beam load from the right side of
the middle column, but by symmetry only the half load from the left beam is taken into
account. Hence, the middle column is replaced by a reaction force of 83.3KN. The
loading history used in applying the gravity load on the beam and the reaction force
on the middle column is shown in Figure 7.8. Both loads are applied in a sufficiently
long time duration t0=5s such that the load are considered static and initial effects are
minimized. The time of removal of the middle column reaction is 5ms, and this time
duration is small enough to represents a sudden loss of column.
Figure 7.8: Loading history for simulating sudden column loss
Gravity loads (GND)
Middle column reaction
Time
Load
t0

Chapter 7 Assessment of progressive collapse of RC frame using the
developed model framework
220
7.4.3 Analysis of quasi static behaviour of the two subassemblies
The load displacement response of the two models are shown in Figure 7.9 together
with their flexural load capacities. It can be seen that compressive arching action
capacities are 1.46 and 2.3 times the flexural capacities for models A and B
respectively. In terms of the axial compressive force, model B developed twice the
axial compressive force than model A. This increases the moment capacity which in
turn increased the maximum compressive arching action capacity of the subassembly
in model B. However, in the catenary action stage, model A performs better because
catenary action is a cable like behaviour which depends on the reinforcement and
generally speaking the higher the reinforcement the higher the catenary action for the
same axial stiffness (Yu & Tan 2013c; Su et al. 2009). Catenary action started at a
displacement of about 430 and 620mm in models A and B respectively. The starting
displacement for catenary action herein is slightly higher than the assumed starting
displacement of one-beam depth (1.0d) in the catenary model developed in Chapter 6.
However, as would be shown in subsequent section, the use of one-beam depth
provides a reasonable conservative result.
(a) Applied load-middle column displacement relationship
0
50
100
150
200
250
300
350
400
0 200 400 600 800 1000 1200 1400 1600
Ap
plie
ad lo
ad (
KN
)
Middle column displacement (mm)
model Amodel Bflexural (model A and B)

Chapter 7 Assessment of progressive collapse of RC frame using the
developed model framework
221
(b) Axial force-middle column displacement relationship
Figure 7.9: Applied load-middle column displacement and axial force-middle column
displacement relationship of the subassemblies
In terms of damage, strain contour or plastic damage pattern may be further plotted. It
should however be noted that in the large deformation regime, concrete plays little role
in the strength of the beam, thus damage may well be represented by the strain contour
distribution. Figure 7.10a and b shows the strain contour of the two models at a
displacement of 1000mm prior to the rupture of bottom reinforcement.
(a) Model A
-1400
-1200
-1000
-800
-600
-400
-200
0
200
400
600
800
0 500 1000 1500
Axi
al f
orc
e (K
N)
Middle column displacement (mm)
model A
model B
Location of curtailment of top
reinforcement

Chapter 7 Assessment of progressive collapse of RC frame using the
developed model framework
222
(b) Model B
Figure 7.10: Strain damage contour during the catenary action stage (middle column
displacement of 1000mm)
The plastic strain in reinforcement is also plotted to have an understanding of its
distribution during the large deformation regime. As shown in theoretical model in
Chapter 6, the failure criteria for the rupture of reinforcement during catenary action
stage was expressed in terms of the plastic zone length as shown in Equation (7.3).
pc
p
pc
p
cat
L
d
L
U
2
5.0 (7.3)
For RC beams subjected to bending, existing plastic hinge length expression in
literature can be used. However, the behaviour of laterally restrained RC beam
assemblies subjected to large deformation is different from that of bending. Thus, the
equivalent plastic zone length should represent the damage at the catenary action stage
which is tension dominated. Since no information for equivalent plastic zone length
for RC beam assemblies under catenary action exist in the literature, herein the strain
distribution in the top and bottom reinforcement for the two models at selected middle
column displacement are plotted in Figure 2.10 to understand it variation during the
catenary action stage. It could be seen that the plastic zone increases with increase in
the middle column displacement. Although there is a slight difference in the plastic
zone in models A and B, this difference is minimal. Since the displacement of 800mm
is the midway between the start of catenary action and rupture of rebar, the equivalent
plastic zone length can be determined using this displacement.Hence, using the strain

Chapter 7 Assessment of progressive collapse of RC frame using the
developed model framework
223
distribution at a displacement of 800mm an effective plastic zone length is determined
such that the plastic strain lumped into the end and middle section . This is obtained
by computing the area under the plastic strain curve and dividing it by the maximum
strain. This gives a plastic zone length of 820mm. This can be expressed in terms of
the span length as 0.18L where L is the length of one-half of the double span beam.
The equivalent plastic zone length defined here is on the conservative side as the
plastic zone length will further increase until the reinforcement ruptures.
(a) Plastic strain distribution in bottom reinforcement
0
0.02
0.04
0.06
0.08
0.1
0.12
0 1000 2000 3000 4000 5000
stra
in in
reb
ar
position along beam (mm)
model A (displ. = 600mm)
model B (displ. = 600mm)
model A (displ. = 800mm)
model B (displ.=800mm)
middle columnface

Chapter 7 Assessment of progressive collapse of RC frame using the
developed model framework
224
(b) Plastic strain distribution in top reinforcement
Figure 7.11: Reinforcement strain distribution in model A and B at selected
displacement
7.5 Comparison of the predicted and FE modelling results
7.5.1 Determination of the yield function for the end and middle section of the
plastic hinge
The theoretical model for catenary action developed in Chapter 6 is employed here to
predict the load-displacement response. The axial force-moment interaction curve may
be determined by performing sectional analysis on the section based on the geometric
and reinforcement details at the support and mid-span sections. The interaction curve
can be performed using the ultimate or yield strength of reinforcement. It should be
noted that using the ultimate or yield strength will result in slightly different M-N
curve. With ultimate strength, an upper bound curve will be obtained whereas using
yield strength will result in lower bound result. Herein, the bending moment-axial
force interaction curve is determined using the yield strength of reinforcement. The
analysis is performed using a RC sectional analysis program RESPONSE-2000 (Benz
0
0.02
0.04
0.06
0.08
0.1
0.12
0 1000 2000 3000 4000 5000
pla
stic
str
ain
in r
ebar
position along beam (mm)
model A (displ. = 600mm)
model B (displ. = 600mm)
model A (displ. = 800mm)
model B (displ. = 800mm)
middle column face

Chapter 7 Assessment of progressive collapse of RC frame using the
developed model framework
225
& Collins, 2001). The complete axial force-moment interaction for the two models is
shown in Figure 7.12.
(a) Model A
(b) Model B
Figure 7.12: Complete axial force-moment interaction curves for model A and B
During catenary action stage, the beam is in tension and thus the response is described
by the axial force-bending interaction in the positive quadrant in Figure 7.12. As far
as the interaction during catenary action stage is concerned, the interaction may be re-
-3500
-3000
-2500
-2000
-1500
-1000
-500
0
500
1000
-300 -200 -100 0 100 200 300
Axi
al f
orc
e (K
N)
bending moment (KNm)
support section
midspan section
-5000
-4000
-3000
-2000
-1000
0
1000
-400 -300 -200 -100 0 100 200 300 400
Axi
al f
orc
e (K
N)
bending moment (KNm)
support section
midspan section

Chapter 7 Assessment of progressive collapse of RC frame using the
developed model framework
226
plotted in terms of the normalised axial force-moment curves for the two models as
shown in Figure 7.13 and the corresponding equations are:
(a) Model A
(b) Model B
Figure 7.13: Normalised axial force-bending moment interaction curves for the models
For model A support section:
0
0.2
0.4
0.6
0.8
1
1.2
0 0.2 0.4 0.6 0.8 1 1.2 1.4
M/M
p
N/Np
support section
midspan section
0
0.2
0.4
0.6
0.8
1
1.2
0 0.2 0.4 0.6 0.8 1 1.2
M/M
p
N/Np
support section
midspan section

Chapter 7 Assessment of progressive collapse of RC frame using the
developed model framework
227
23.0
for 0.1 63.0
peppeM
M
N
N
M
M (7.4)
23.0
for 08.1 08.1
peppeM
M
N
N
M
M (7.5)
For model A mid-span section:
1
ppm
N
N
M
M (7.6)
where Mpm, Mpe are the plastic moment capacities at the end and middle section which
is equal to 85 and 145KNm respectively. Np is the axial capacity of the beam section
equal to 665KN.
For model B support section:
39.0
for 1 66.0
peppeM
M
N
N
M
M (7.7)
39.0
for 5.4 5.4
peppeM
M
N
N
M
M (7.8)
For model B mid-span section:
1
ppm
N
N
M
M (7.9)
where Mpm, Mpe are the plastic moment capacities at the end and middle section which
is equal to 95 and 136KNm respectively. Np is the axial capacity of the beam section
equal to 475KN.
7.5.2 Determination of equivalent axial stiffness of the end support
According to the theoretical model developed in Chapter 6, the equivalent axial
stiffness can be expressed as:
asa
e
KKK
K111
1
(7.10)

Chapter 7 Assessment of progressive collapse of RC frame using the
developed model framework
228
where Ka is the axial stiffness of the end support and Ks is the axial stiffness of the
beam (Ks=EA/L).
For RC beam assemblies, concrete is severely damage prior to the start of catenary
action and this affect the axial stiffness of the beam that contribute effectively in the
catenary action stage. As an illustration, Figure 7.14 shows the effect of axial stiffness
of beam section on the response of RC beam during catenary action. Model A
subassembly is used for the analysis and the axial stiffness of the end support (Ka) is
taken as 3 x 10⁵KN/m.
Three different cases are considered: first is RC beam with full uncracked axial
stiffness (EA/L), second is half axial stiffness (0.5*EA/L) and one-quarter of axial
stiffness (0.25*EA/L) of the beam. It can be observed that axial stiffness of the beam
influences the state at which the plastic capacity of the beam section is reached. When
the area of the full section is used, the beam enters its plastic state at a much smaller
middle column displacement compared to when 25% of the section is used. Herein the
axial stiffness of the beam is assumed to be 10% of the full section.
Figure 7.14: Effect of beam axial stiffness on the RC assembly behaviour during
catenary action stage
0
50
100
150
200
250
300
0 200 400 600 800 1000
Ks=100% of EA/L
Ks=50% of EA/L
Ks=25% of EA/L
Middle column displacement (mm)
Load
(K
N)

Chapter 7 Assessment of progressive collapse of RC frame using the
developed model framework
229
7.5.3 Comparison and discussion of results
Figure 7.15 shows the comparison between the FE and theoretical predictions for the
two models. It can be seen that the theoretical model predicts reasonably well the
compressive arching catenary behaviour in the two RC beams. However, the model
slightly under predict the compressive arching action capacity in model B. Also, the
failure displacement predicted by the model is much smaller than that of FE
predictions in both models. Aside these few differences, the predicted model captures
well the behaviour of the two beam assemblies.
With the theoretical load-displacement response, the progressive collapse assessment
can be evaluated as will be shown in the next section.
Figure 7.15: Load-middle column displacement response
7.6 Progressive collapse-resisting capacity curve
The nonlinear static curves in Section 7.5 can be converted to a pseudo static capacity
curve for assessing progressive collapse based on the energy balance principle
(Izzuddin et al. 2008). When a primary load carrying member in a building is lost, the
0
50
100
150
200
250
300
350
400
0 200 400 600 800 1000 1200 1400 1600
Ap
plie
ad lo
ad (
KN
)
Middle column displacement (mm)
model A (FE)model B (FE)model A predictedmodel B predicted

Chapter 7 Assessment of progressive collapse of RC frame using the
developed model framework
230
affected part of the building moves downward. The downward movement of the area
creates potential and kinetic energies. The potential energy is caused by the falling
structure whereas kinetic energy is due to the effective moving mass involved. In
reaction to this strain energy is developed in the deformed components. At any given
stage of the collapse process, comparison between the potential energy (external
workdone) and strain energy (energy absorbed by the deformed components) is
checked. According to energy equilibrium and assuming no loss of energy, the
difference between potential and strain energy is equal to the kinetic energy. When
this difference is positive, the building is still in downward motion and collapse is yet
to be halted. If and when the difference becomes zero, the strain energy equals the
potential energy and thus the structure comes to rest and collapse is prevented.
An example calculation for the conversion of nonlinear static curve to pseudo static
curve for a simple bilinear nonlinear static resistance function is as schematically
illustrated below and the result is shown in Figure 7.15.
Figure 7.16: Illustration of the conversion of nonlinear static curve to pseudo static
curve
From energy principle;
Internal work done = external work done
At a displacement δy;
Nonlinear static curve
Py
Pu
δy δu
Pseudo static curve
Pdy1
Pdy1

Chapter 7 Assessment of progressive collapse of RC frame using the
developed model framework
231
ydyyyydy PPPP 5.0 5.0 11 (7.11)
At a displacement δu;
))((5.0)(5.02 yuyuyuyyyudy PPPPP (7.12)
u
yuyuyuyyy
dy
PPPPP
))((5.0)(5.02
(7.13)
Based on the above explanation, the nonlinear static curves for model A and B are
converted to pseudo static curves. Also, the pseudo static curves are calculated from
the flexural capacity of the models as shown in Figure 7.17.
Figure 7.17: Pseudo static curves for the different RC subassemblies
It can be seen from Figure 7.17 that the load to be transferred through the bridging
beam (i.e. the original reaction force in the lost column) crosses the pseudo static
curves at different displacement in the different models. For model A, collapse is
arrested at a displacement of about 950mm which is well into the catenary action stage.
In model B, due to the markedly increased resistance capacity at bending-arching stage
0
20
40
60
80
100
120
140
160
180
200
0 200 400 600 800 1000 1200 1400
Load
(K
N)
Dynamic displacement (mm)
model A
model B
column reaction
flexural

Chapter 7 Assessment of progressive collapse of RC frame using the
developed model framework
232
as a result of compressive arching action, collapse is arrested at a considerably smaller
displacement of 95mm. This again highlight the important of compressive arching
action which is mostly ignored in the progressive analysis of RC buildings. It should
be noted that there is also increased energy absorption capacity due to arching effect
but that is not fully required to be mobilised in this case. In fact, a critical look at the
figure further shows that model B can resist dynamic load of up 180KN and the
structure will only displace downward by 200mm at that point. On the other hand, if
the dynamic load of 180KN is applied to model A, the structure will displace to about
1150mm and such big displacement could practically be catastrophic to the structure.
Considering only the flexural capacity of RC assemblies indicate that the structure will
collapse as no balance could be reached between the internal energy and the external
energy demand. The maximum resistance capacity of the structure based on pure
flexural capacity is much less than the static reaction of the removed column, thus
collapse cannot be prevented.
The result of the simplified dynamic approach shown above is further compared with
the nonlinear dynamic result from FE. Figure 7.18 shows the time history plot of the
two models and the baselines from the simplified approach. The maximum dynamic
displacement from FE models are 985 and 78mm for model’s A and B respectively.
While the predicted dynamic displacement from the simplified approach is 950 and
95mm respectively.

Chapter 7 Assessment of progressive collapse of RC frame using the
developed model framework
233
Figure 7.18: Pseudo static curves for the different RC subassemblies
7.7 Concluding remarks
This chapter investigated the progressive collapse behaviour of two different designs
using the developed framework in the earlier chapters. The approaches on the
determination of axial stiffness of the surrounding substructure and the moment
interaction curves for the middle and support sections based on the material and
geometric properties have beam succinctly presented. The illustration shows that the
model framework in this thesis is able to predict the load-displacement response of the
subassembly, including the compressive arching action and catenary action, and these
can be employed to evaluate the amplitude dynamic response. With this simplified
framework, the progressive collapse of RC assemblies can be easily assessed.
The illustrative example herein shows that the progressive collapse behaviour of two
different designs having the same flexural capacity can be greatly different especially
when the progressive collapse response is well beyond the flexural response stage. For
RC beam assemblies with adequate axial restraint, compressive arching can provide
additional energy absorption which may help avert collapse at a much lower
-1200
-1000
-800
-600
-400
-200
0
200
0 1000 2000 3000 4000 5000 6000 7000
dyn
amic
dis
pla
cem
ent
(mm
)
time history (ms)
model A-FE
model B-FE
model A-predicted
model B-predicted

Chapter 7 Assessment of progressive collapse of RC frame using the
developed model framework
234
displacement. It is recommended based on this study, that in other to accurately assess
progressive collapse potential of a structure, a realistic prediction of the compressive
and catenary action should be carried out and incorporated into the design analysis.
This can be achieved using the simplified framework developed in this thesis.

Chapter 8 Conclusions and recommendation for future works
235
Chapter 8: Conclusions and recommendation for
future work
To assess the progressive collapse potential of structures (RC or steel assemblies) in
design applications, an engineering approach is preferred. Previous studies have
shown that analysis using ALP method can provide a reliable means of assessment for
progressive collapse. However, the use of this method requires that the resistance
function of the assemblies be accurately predicted taking into consideration the
possible failure modes; for steel assemblies, this may involve degradation of strength
due to partial failure at connections and for RC assemblies this can be due to rupture
of reinforcing bars. To take such factors into account in a sound mechanics-based
manner, the thesis has focused on the different mechanisms that could develop in
axially restrained RC frame structures following a column loss, and also on the
quantification of such important mechanisms as the arching effect and the catenary
action. Improved theoretical models for the compressive arching and catenary actions
are developed to predict the complete load displacement behaviour taking into
consideration the arching effect and the possibility of strength degradation due to
failure of some connection component.
Although, beam-column fibre element can be used to model the response of
progressive collapse in RC buildings, it still presents some challenges in modelling
accurately the response under column removal. For instance, selection of suitable
material model for the confine and unconfined concrete is necessary to better represent
the compressive arching action. More so, the beam-to-column joint interface needs to
be correctly modelled by specifying the properties of rotational springs between the
beam and column which in turn must be calibrated. This present additional
complexities to the modelling process. On the other hand, the simplified model
presented in this study is easier to use and can produce accurate result with less effort.

Chapter 8 Conclusions and recommendation for future works
236
8.1 Main conclusions
Based on the research in this study, the following main conclusions can be made:
1) Compressive arching action capacity is affected by the reinforcement ratio,
concrete compressive strength, span-depth ratio and axial restraint. The effect
of these parameters on arching compression can be predicted. Both axial
restraint and span-depth ratio has a pronounced effect on both the relative
increase in load due to arching and the normalised arching capacity whereas
reinforcement ratio has pronounced effect only on the normalised increase in
load but very minimal effect on the relative increase in between maximum
arching and bending capacities. When evaluating the arching capacity, RC
beam assemblies with axial stiffness coefficient (αK) greater than 5 may be
considered as rigid axial support to simplify the calculations.
2) By considering the compounding effect of bending and arching, a
comprehensive theoretical model is proposed. With the developed model, the
load-displacement behaviour (resistance function) in axially restrained RC
beam assemblies can be accurately predicted. This model can be used along
with the energy balance principle to determine the energy absorption that could
be attributable to arching action.
3) Behaviour of RC and steel assemblies under progressive collapse will involve
strength degradation due to failure of connection components. Accurate
analysis should therefore consider the strength degradation that may develop.
With the catenary model developed in this study, load-displacement behaviour
and strength degradation can be correctly captured. Comparison with FE model
and physical experiments confirms that the model’s prediction is accurate.
Damage in the beam and the criteria at which strength degradation will occur
can be obtained by considering the axial elongation and rotation of the beam.

Chapter 8 Conclusions and recommendation for future works
237
Depending on the type of structure, the damage may be based on only the
rotation or both rotation and elongation of the plastic hinge zone.
4) Different RC assemblies having the same flexural capacities will behave
differently when subjected to progressive collapse due to extreme loading. If
adequate compressive arching action can develop in RC structure subjected to
a column loss, progressive collapse may be resisted at a much smaller
displacement compared to similar design having much higher reinforcement
but with a reduced arching effect.
5) The load-displacement behaviour for RC beams located within the periphery
frame in a column loss scenario can be predicted using the models developed
in this study. The framework may be applied in practical design analysis for an
engineering assessment of the progressive collapse potential of RC structures
without the need for a more detailed (and hence computationally costly) FE
modelling of the entire structure. This has been confirmed by the comparison
of the analysis using a detailed nonlinear dynamic analysis and the result from
the simplified framework developed in this study.
8.2 Recommendations for future work
This study presents improved analysis models for the evaluation of the resistance
(load-displacement) function for beam assemblies taking into consideration of the
degradation of strength, as well as the compressive arching action. Such resistance
function can provide an engineering means for assessing progressive collapse potential
of a structure using the energy method. However, the present study only focused on
the assemblies located within the periphery of the structure and floor slab was not
considered in the analytical study. Further research work is therefore recommended in
the following related areas:

Chapter 8 Conclusions and recommendation for future works
238
Develop analytical model for the prediction of compressive arching action in
RC assemblies incorporating the membrane effect in slab.
In GSA (2013) guidelines, removal of interior column for progressive collapse
assessment is also recommended. In such cases, the transverse beams may play
an important role, hence analytical model should be able to capture the effect
of beams in both directions. For this reason, analytical model for compressive
arching action taking into consideration the transverse beams contribution in
load resistance should be developed.
The semi-empirical expressions for the prediction of arching effect developed
in this study should be further validated with more experimental studies to
ascertain its accuracy.
It was shown in the development of the catenary model, that degradation of
strength and actual failure limit is a necessary input for the prediction of
complete load-displacement behaviour (resistance function). Accordingly,
experimental and numerical studies on different connection details should be
studied and a database of failure criteria for the different connections
generated.
As shown in the investigative studies, the final failure displacement for RC
assemblies depends on the plastic zone length adopted. Further experimental
studies should be conducted for different types of connections to determine the
plastic length zone that can well capture the failure displacement in the models
developed in this study.

References
239
References
Abbasnia, R. & Nav, F.M., 2016. A theoretical method for calculating the compressive
arch capacity of RC beams against progressive collapse. Structural Concrete,
17(1), pp.21–31.
ADINA, 2006. ADINA 8.3 Version User Manual, ADINA R&D, Inc., Watertown,
Mass, USA, 1996.,
Albrifkani, S. & Wang, Y.C., 2016. Explicit modelling of large deflection behaviour
of restrained reinforced concrete beams in fire. Engineering Structures, 121,
pp.97–119.
Alogla, K., Weekes, L. & Augusthus-Nelson, L., 2017. Theoretical assessment of
progressive collapse capacity of reinforced concrete structures. Magazine of
Concrete Research, 69(3), pp.145–162.
Ansari, F. & Li, Q., 1998. High-Strength Concrete Subjected to Triaxial Compression.
ACI Material Journal, 95(6), pp.747–755.
ANSYS, 2009. 15317 AUTODYN User Manual Version 12.0 Canonsburg,
Baker, A., 1956. Ultimate Load Theory Applied to the Design of Reinforced and
Prestressed Concrete Frames. Concrete Publications Ltd. London,
Brannon, R.M. & Leelavanichkul, S., 2009. Survey of Four Damage Models for
Concrete. , (August), pp.1–80.
Chen, W. & Han, D., 1988. Plasticity for Structural Engineers, Springer-Verlag, New
York.
Choi, H. & Kim, J., 2011. Progressive collapse-resisting capacity of RC beam-column
sub-assemblage. Magazine of Concrete Research, 63(4), pp.297–310.
Christiansen, K.P., 1963. The Effect of Membrane Stresses on the Ultimate Strength
of the Interior Panel in a Reinforced Concrete Slab. The Structural Engineer,

References
240
41(8), pp.261–265.
Corley, G.W., 1966. Rotation Capacity of Reinforced Concrete Beams. Journal of
Structural Engineering, ASCE, 92(10), pp.121–146.
Corley, W.G. et al., 1998. The Oklahoma City Bombing: Summary and
Recommendations for Multihazard Mitigation. Journal of Performance of
Constructed Facilities, 12(3), pp.100–112.
Crawford, J. et al., 2012. Use and validation of the release III K&C concrete material
model in LS-DYNA,
Dafalias, Y.F. & Herrmann, L.R., 1986. Bounding surface plasticity. II: application to
isotropic cohesive soils. Journal of Engineering Mechanics, 112(12), pp.1263–
1291.
Dassault Systemes, 2007. Abaqus Analysis User’s Manual. Simulia Corp. Providence,
RI, USA.
Guo, L. et al., 2013. Experimental study and numerical analysis of progressive collapse
resistance of composite frames. Journal of Constructional Steel Research, 89,
pp.236–251.
Hinman, E.E. & Hammond, D.J., 1997. Lessons from the Oklahoma City bombing,
ASCE, New York.,
Hognested, E., Hanson, N.W. & McHenry, D., 1955. Concrete Stress Distribution in
Ultimate Strength Design. American Concrete Institute Journal, Proceedings,
52(4), pp.455–480.
Imran, I. & Pantazopoulou, S.J., 1996. Experimental Study of Plain Concrete under
Triaxial Stress. ACI Structural Journal, 93(6), pp.589–601.
Izzuddin, B.A., 2005. A simplified model for axially restrained beams subject to
extreme loading. International Journal of Steel Structures, 5(5), pp.421–429.
References
241
Izzuddin, B.A. et al., 2007. Assessment of Progressive Collapse in Multi-Storey
Buildings. Proceedings of the ICE - Structures and Buildings, 160(4), pp.197–
205.
Izzuddin, B.A. et al., 2008. Progressive collapse of multi-storey buildings due to
sudden column loss - Part I: Simplified assessment framework. Engineering
Structures, 30(5), pp.1308–1318.
Jirasek, M. & Bazant, Z.P., 2001. Inelastic Analysis of Structures, 1 edition., John
Wiley & Sons.
Lew, H.S. et al., 2014. An Experimental and Computational Study of Reinforced
Concrete Assemblies under a Column Removal Scenario,
Li, G. et al., 2008. Catenary action of restrained steel beam against progressive
collapse of steel frameworks. J. Cent. South Univ. Technol. (Engl. Ed.), 15(6),
pp.830–834.
Li, L. et al., 2015. Effect of beam web bolt arrangement on catenary behaviour of
moment connections. Journal of Constructional Steel Research, 104, pp.22–36.
Li, L. et al., 2013. Experimental investigation of beam-to-tubular column moment
connections under column removal scenario. Journal of Constructional Steel
Research, 88, pp.244–255.
Long, H. Van & Hung, N.D., 2008. Second-order plastic-hinge analysis of 3-D steel
frames including strain hardening effects. Engineering Structures, 30(12),
pp.3505–3512.
LSTC, 2012. II LS-DYNA Keyword User’s Manual. Livermore, California.,
Maekawa, K., Pimanmas, A. & Okamura, H., 2003. Nonlinear Mechanics of
Reinforced Concrete, Spoon Press Taylor & Francis Group.
Magallanes, J. et al., 2010. Recent improvements to release III of the K&C concrete
model. 11th international LS- …, pp.37–48.

References
242
Magallanes, J.M., 2008. Importance of concrete material characterization and
modelling to predicting the response of structures to shock and impact loading.
WIT Transactions on the Built Environment, 98, pp.241–250.
Malvar, L.J. et al., 1997. A Plasticity Concrete Material Model for DYNA3D.
International Journal of Impact Engineering, 19(97), pp.847–873.
Mattock, A.H., 1967. Discussion of Rotational Capacity of Reinforced Concrete
Beams, by W. D. G. Corley. Journal of Structural Division, ASCE, 93(2), pp.519–
522.
Mlakar, Sr., P.F. et al., 1998. The Oklahoma City Bombing: Analysis of Blast Damage
to the Murrah Building. Journal of Performance of Constructed Facilities, 12(3),
pp.113–119.
Mlakar, P.F. et al., 2003a. Description of Structural Damage Caused by the Terrorist
Attack on the Pentagon. Forensic Engineering, Proceedings of the Congress,
19(August), pp.197–205.
Mlakar, P.F. et al., 2003b. Findings and recommendations from the Pentagon crash.
Forensic Engineering, Proceedings of the Congress, 19(3), pp.220–221.
Mlakar, P.F. et al., 2005a. Response to Fire Exposure of the Pentagon Structural
Elements. Journal of Performance of Constructed Facilities, 19(August),
pp.212–219.
Mlakar, P.F. et al., 2005b. September 11, 2001, Airliner Crash into the Pentagon.
Journal of Performance of Constructed Facilities, 19(January 1943), pp.189–
196.
Moradi, Saber; Alam, S., 2013. Finite-Element Simulation of Posttensioned Steel
Connections with Bolted Angles under Cyclic Loading. Journal of Structural
Engineering, 1(2), pp.1–12.
Orton, S.L., 2007. Development of a CFRP System to Provide Continuity in Existing
References
243
Reinforced Concrete Buildings Vulnerable to Progressive Collapse.
Osteraas, J.D., 2006. Murrah Building Bombing Revisited: A Qualitative Assessment
of Blast Damage and Collapse Patterns. Journal of Performance of Constructed
Facilities, 20(4), pp.330–335.
Park, R., 1964. Ultimate Strength of Rectangular Concrete Slabs Under Short-Term
Uniform Loading with Edges Restrained Against Lateral Movement.
Proceedings of the Institution of Civil Engineers, 28, pp.125–150.
Pham, A.T., Tan, K.H. & Yu, J., 2016. Numerical investigations on static and dynamic
responses of reinforced concrete sub-assemblages under progressive collapse.
Engineering Structures.
Popovics, S., 1973. A Numerical Approach to the Complete Stress-Strain Curve of
Concrete. Cement and Concrete Research, 3(4), pp.583–599.
Priestley, M.J.N. & Park, R., 1987. Strength and Ductility of Concrete Bridge Columns
Under Seismic Loading. ACI Structural Journal, 84(1), pp.61–76.
Rankin, G.I.B. & Long, A.E., 1997a. Arching action strength enhancement in laterally-
restrained. Proceeding Institution of Civil Engineers Structs and Bldgs, pp.461–
467.
Rankin, G.I.B. & Long, A.E., 1997b. Arching Action Strength Enhancement in
Laterally-Restrained Slab Strips. Proceedings of the Institution of Civil Engineers
- Structures and Buildings, 122(4), pp.461–467.
Ruddle, M.E., Rankin, G.I.B. & Long, A.E., 2003. Arching Action—Flexural and
Shear Strength Enhancements in Rectangular and Tee Beams. Proceedings of the
Institution of Civil Engineers - Structures and Buildings, 156(1), pp.63–74.
Sadek, F. et al., 2011. Testing and analysis of steel and concrete beam-column
assemblies under a column removal scenario. Journal of Structural Engineering,
137(9), pp.881–892.

References
244
Sasani, M. et al., 2011. Progressive collapse resistance of an actual 11-story structure
subjected to severe initial damage. Journal of Structural Engineering, 137(9),
pp.893–902.
Sasani, M. & Kropelnicki, J., 2008. Progressive Collapse Analysis of an RC Structure.
Structural Design of Tall and Special Buildings, 17(4), pp.757–771.
Sawyer, H.A., 1964. Design of Concrete Frames for Two Failure States. In
Proceedings of the International Symposium on the Flexural Mechanics of
Reinforced Concrete. ASCE-ACI. pp. 405–431.
Seidalinov, G. & Taiebat, M., 2014. Bounding surface saniclay plasticity model for
cyclic clay behavior. International Journal for Numerical and Analytical
Methods in Geomechanics, (38), pp.702–724.
Sheikh, S.A. & Khoury, S.S., 1993. Confined Concrete Columns with Stubs. ACI
Structural Journal, 90(4), pp.414–431.
Stinger, S.M. & Orton, S.L., 2013. Experimental evaluation of disproportionate
collapse resistance in reinforced concrete frames. ACI Structural Journal, 110(3),
pp.521–529.
Su, Y., Tian, Y. & Song, X., 2009. Progressive Collapse Resistance of Axially-
Restrained Frame Beams. ACI Structural Journal, 106(5), pp.600–607.
Taylor, D.A., 1975. Progressive Collapse. Canadian Journal of Civil Engineering,
2(4), pp.517–529.
Vali, H. et al., 2015. Influence of Concrete Compressive Strength on the Arching
Behaviour of Reinforced Concrete Beam Assemblages. , 18(8), pp.1199–1214.
Vesali, N.F. et al., 2013. Development of arching action in longitudinally-restrained
reinforced concrete beams. Construction and Building Materials, 47, pp.7–19.
Vlassis, A.G. et al., 2009. Progressive collapse of multi-storey buildings due to failed
floor impact. Engineering Structures, 31(7), pp.1522–1534.

References
245
Wood, R.H., 1961. Plastic andd Elastic Design of Slabs and Plates, London, Thames
and Hudson.
Xu, J. & Lu, Y., 2016. Numerical modelling for reinforced concrete response to blast
load : understanding the demands on material models. American Concrete
Institute - Special Publication, 306, p.3.1-3.22.
Yang, B. & Tan, K.H., 2014. Behavior of composite beam-column joints in a middle-
column-removal scenario: experimental tests. Journal of Structural Engineering,
140(2), p.4013045.
Yang, B. & Tan, K.H., 2013a. Experimental tests of different types of bolted steel
beam-column joints under a central-column-removal scenario. Engineering
Structures, 54, pp.112–130.
Yang, B. & Tan, K.H., 2013b. Robustness of bolted-angle connections against
progressive Collapse: experimental tests of beam-column joints and development
of component-based models. Journal of Structural Engineering, 139(9),
pp.1498–1514.
Yi, W. et al., 2008. Experimental Study on Progressive Collapse-Resistant Behavior
of Reinforced Concrete Frame Structures. ACI Structural Journal, (105), pp.433–
439.
Yin, Y.Z. & Wang, Y.C., 2005. Analysis of catenary action in steel beams using a
simplified hand calculation method, Part 1: theory and validation for uniform
temperature distribution. Journal of Constructional Steel Research, 61(2),
pp.183–211.
Yu, J., 2012. Structural Behavior of Reinforced Concrete Frames Subjected to
Progressive Collapse. Nanyang Technological University.
Yu, J. & Tan, K.H., 2014. Analytical model for the capacity of compressive arch action
of reinforced concrete sub-assemblages. Magazine of Concrete Research, 66(3),
pp.109–126.

References
246
Yu, J. & Tan, K.H., 2013a. Experimental and numerical investigation on progressive
collapse resistance of reinforced concrete beam column sub-assemblages.
Engineering Structures, 55, pp.90–106.
Yu, J. & Tan, K.H., 2013b. Structural Behavior of RC Beam-Column Subassemblages
under a Middle Column Removal Scenario. Journal of Structural Engineering,
139(2), pp.233–250.
Zolghadr Jahromi, H. et al., 2012. Robustness assessment of building structures under
explosion. Buildings, 2(4), pp.497–518.