Embed Size (px)
Citation preview

BEHAVIOUR OF BRICK AGGREGATESIN
BASE AND SUBBASE COURSES
A Thesisby
M. Zakaria
Submitted to the Department of C~vil Engineering,Bsngladesh University of Engine~ring and Technology,Daccain partial fulfilment of the requirements for the degree
ofMASTER OF SCIENCE IN CIVIL ENGINEERING
i
IIII
i
,
i"
September, 19112
1111111111111111111111111111111111#54722#
II.III
J• ..eJ

BEHAVIOUR OF BRICK AGGREGATESIN
BASE AND SUBBASE COURSES
A Thesisby
M. Zak aria
Approved as to style and content by
~(A.F.M. Abdur Rauf )Associate Professor,Dept. of Civil Engineering,BUET, Dacca.
Chairman
~~~(Dr. J.R'.i:houdhlJi'YjProfessor and Head,Dept. of Civii Engineering,BUET, Dacca.
Member'
Member
\
Mr. A.R. Chowdhury MemberChief Engineer,Roads and Highways Department,Bangladesh.
~( Dr. A.M. Hoque 1Associate Professor,Dept. of Civil Engineering,BUET,Dacca. '
"
,),
September, 1982.'"( :

'j",1
5YNOP 515
In Bangladesn roads are usually constructed offlexible pavement in which base and subbase courses servees key elements in distributing the superimposed loads tothe subgrade soil without overstressing. Because of tnedearth of stone aggregates in Bangladesh brick aggregatesara commonly used in base and subbase coursas. 5incemostresearchas on pavament design and analysis have'been carriedout in western countries with stone aggregates, they cannot be applied eli. rect.ly to condit;ions where brick aggregatasare used. In this thesis work attempt is made to investi-gate and recommend the suitable brick aggregates for baseand subbase constructions.
The search for appropriate materials gives gas burntpicked jhama bricks as most suitable type of bricks forbase and subbase construction. The wearability and absorp-tion of these bricks are minimum. The CBR valu'e obteinedwith gas burnt brick eggregates-sand-soil mixtures is ashigh as ninety seven percent; which is much above thatrequired for base courses of high type pavements.
The wsll graded aggregates and sand-soil mixtureswhen compscted give maximum CBR vslues. An optimum amountof fines to be used in the mixtures was obtained at whichmaximum CBR value is attained. The CBR value with brickaggregate-sand-soil mixture is seen to be more susceptibleto compaction than tha typical stone aggragates-sand-soilmixturas. for tha construction 0 f bssa and subbase coursesin flexible pavements, crushed gas burnt picksd jhama brickaggregate-sand-soil mixtures are suggested.
~-'''''', '

ACKNOWLEDGEM ENT
(All Praises to Allah 50bhano-Ta-ale)
The author wishes to express his sincerest indebtnese
and profound gratitude to Mr, A,f ,1'1, Abdur Rauf, Associate
Professor of the Department of Civil Engineering, Bangladesh
University of Engineering and Technology, Dacca, Without the
affectionate guidance and untiring encouragement provided by
him as the Chairman of the Research Committee this work
could never heve materialised,
,j
,;/
The author expresses his heartfelt gratitude to
Dr, J,R, Choudhury, Professor end Head of Civil Engineerlng,
for his constant encouragement and sympathetic co-operation,
The author also exprasses his regards to Dr,50hrabuddin
Ahmad Professor (and former Head), 'Department of Civil
Engineering, Mr, 5yed Noor-Ud-Deen Ahmed, Dr, A,M, Hoque,
Associate Professors of Department of Civil Engineering for
their velueeble advice and encouragement during the research
work.
The author gratafully remembers the as.sistances
rendered by his friends, colleagu es, all Laboratory staff,
for their co-operation and help in completing this work,
finally the author exprasses his thanks .to Mr,M,A,Malek
and Mr, Md, 5hahiduddin for their help in typing the script s
and for helping -in tha preparation of sketches,
I

CONTEIH5
SYNOPSIS
A:cnJOWLEDGEMEN T
LIIST Of TABLESIL'IST Of fIGURES
ABBREVIATIONS
CHAPTER ~ INTRODUCTION
1.1 General1.2 Role of Base and Subbase in Pavement
5tructu re1.3 factors Influencing tha Base and Subbase
Characteristics
1.3.1 Density and Stability
1.3.2 Effect of crushed particles
1.3.3 Effect of plasticity
1.3.4 Effect of skip grading
1.3.5 Effect of soundness
1.4 The Problem
1.5 Objectives of the Research
CHAPTER 2 LITERATURE REVIEW
2 1 General
2.2 Laboratory Studies
2.3 Field Studies2.4 Method of Eva'Iuation of Base and
Subbase courses
2.5 Practices and Recommendations for Baseand Subbase Coursas
Page
i
ii
vii>l
xii
1
1
2
5
6
7
7
8
9
10
10
12
12
12
15
18
23
-r-

, ,
2.5.1 Practices in U.S.A. and AASHTORecommendations
2.5.2 California Division of HighwaysRecommendations
Page
25
262.5.3 U.K. Practices and Transport and
Road Research Laboratory, U.K.Recommendations 28
,2.5.4 Practices and Recommendations by'
Bangladesh Road Research Laboretory 31
CHAPTER 3 MATERIALS 33
3.1 General 33
3.2 Materials Used for the Research 34
3.2.1 Coarse Aggregate for the Study 35
3.2.2 Fine Aggregate for the Study 36
3.2.3 Fines Used for the Study 36I
3.3 Test Procedures for Determining PhysicalProperties of Aggregates 37
CHAPTER 4 LABORATORr INVESTIGATIONS
4.1 Density-Gradation Relationship
4.2 Effect of Gradation on C8R Value
4.3 Effect of Fines on CBR Values
4.4 CBR for Different Types of Aggregates
4.5 CBR at Different Compactive Efforts
4.6 Decrease in Volume After Compaction
4.7 Plasticity Characteristics
CHAPTER 5 ANALYSIS AND DISCUSSIONS OF TEST RESULTS
S.l Appropriate Materials
42
42
43
5683
9999
101
102
102
.~.r-

..
. ,
5.2 Gradation
5.3 Combination of Aggregates to ProduceGradation Z
5,4 Moisture Content
5,5 Percent Fines
5,6 Compaction
5.7 CBR for Different Types of Aggregat~s
S.B Plasticity Characteristics
CHAPTER 6 CONCLUSIONS AND RECOMMENDATIONS
6.1 Conclusion
6,2 Recommendations
6.2,1 Recommendations for the Futur~Study
6.2.2 Recommendations for FieldConstruction.
REfERENCES
Appendix-A: Availability of the Materials
Appendix-B: Hand Crushing of Bricks and Stones
Appendix-C: Test Results and figures of EquipmenfsI
.,~~,.. \-r "-"i~i;;;~1
,,".
v
Page
103
104
105
107
lOB109
110
111
111
114
114
115
11~.
119
123
130.

LIST OF TABLES
Description
2.1 Grading Requirement for Soil-AggregateMaterials for Subbase and Base Construc-tions (From AASHTO) 27
2.2
2.4
2.5
2.6
3.2
4.1
Percentage Composition by Weight of AggregateBase (From CDH)
Grading Requirement for Granular Sub-baseMaterials (From Road Note No. 29)
Typical Limits of Particle Size Distributionsfor Mechanically Stable Natural Gravel forUse as Base Course (From Road Note No. 31)
Strength Limits of Stone and Brick for BaseCourpe (BRRL)
Grading Limits for all in Crushed AggregateBase Materials (From BRRL)
Properties of Bricks
Physical Properties of Cdarse Aggregates
Physical Properties of Fine Aggregates
Physical Properties of Fines
Aggregate Gradation Requirements of DifferentOrganisations and the Selected Gradation Z
Moisture-Density Gradation Data
CBR-Density_Gradation Relationship
CBR-Density-Percent Fines Relationship
26
29
31
32
32
35
36
39
40
43
51
62
62

Table No. Description
4.S CBR for Different. Types of Materials
4.6 CBR-Compactive Effort Relation
vii
83
99
4.7
S. 1
6.1
Results of Hydrometer Analysis of the Finesof the Mixture
Job Mix Formula for Gradation Z
Gradation Z
101
106
113
B-1 Comparison of Gradations for CrushedBoulders and Crushed Bricks (Picked Jhama) 12S
B-2 Typical Gradations for Di fferent MaximumSizes (Crushed Picked J ham a Bricks) 126
B-3 Typical Gradations of Crushed Bricks(til max. si ze) Brok en by Labou rs ofDi fferent Ages and Sex. (Picked Jhama Bricks) 127
C-l CBR Test Results for Gas Burnt Picked JhamaBrick; Gradation Xl 130
C-2 CBR Test Results For Gas Burnt Picked JhamaBrick; Gradation X2 131
IC-3 CBR Test R esu 1t for Gas Burnt Picked Jhama
B rick; Gradation. X3 132
C-4 CBR Test Resu1t for Gas Burnt Picked JhamaBrick; Gradation X4 133
C-S CBR Test Resu 1t for Gas Burnt Picked J ham 8Brick; Gradation Xs 134

viii
Table No. Description Page
C.•.6 CBR Test Results for GAS Burnt PickedJ ham a Brick; Gradation Z 135 ,
C-7 CBR fest H esu 1t for Crushed ::JtonB;Gradation Z 136
C-O CBR Test R esu 1t for Coal Burnt PickedJ ham a Brick; Gradation Z 137
C-9 CBR fest R esul t for '-irst Class Bricks;Gradation Z 13B
C-I0 CBR fest R esu 1t for T hi rd Class Bricks;Gradation Z 139
C-11 Liquid Limit Test R esu 1t 140
C-12 Hydrometer Analysis 141

fig, No,
1,1
1,2
1,3
4,1
4,2
4,3
4,4
4,5
4,6
4,7
LIST Of fiGURES
Description
Typical flexible pavement crass-sectionDistribution of wheel loads.through flexiblepavements to the subgrade
Effect a f plasticity an triaxial strength ofa gravel mixture. Max, aggregate sizes is1 inch
Aggregate grading chart for gradation Xl(BRRL)
Aggregate grading chart for gradation X2( AASHO)
Aggregate grading chart for gradation X3( AASHO)
Aggregate gradin g chart for gradation X4(Rr,.31, TRRL)
Aggregate grading chart for gradation XS( CDH)
Gradations sup erimposed
Aggregate grading chart for gradation Z(selected gradation)
1
3
9
44
4546
4748
49
504,8
4,9
4,10
4,11
4,12
4,13
4.14
4,15
4,16
Moisture-density relationship:(A) for gradation XJ.: (lJ) for gradation X2Moisture-density relationship:(A) for gradation X3, (B) for gradation X4Moisture-density relation~hip:(A) for gradation X5, (B) for gradation Z
CBR curves for different specimens of GBPJbricks; gradation Xl
CBR curves for different specimens of GBPJbricks; gradation X2CBR curves for different specimens of GRPjbricks; gradation X3CBR curves for different specimens of GBPjbricks; gradation X4CRR curves for diff.erent specimens of GBPjbricks; gradation X5CHR curves for different specimens of GBPjbricks; gradation Z
53
54
55
57-59
60-62
63-65
66-68
69-71
72-74

x
CAR, dry density and percent fines relation 81
Moisture content-density relationship forcrushed stone, coalburnt picked jhama, firstclass and third class bricks (gradation Z) 84
"'"--
Fig, No,
4,17
4,18
4,19
4,20
4,21
4,22
4,23
4,24
4,2S
4,26
4,27
4,28
4,29
B-1
B-2
C-l
C-2
C-3
Description
CER-density relation:(A) gradation Xl'(B) gradation X2CBR-density relation: (A) gradation X3,(B) gradation X4CBR-density relation: (A) gradation XS'(B) gradation Z
CBR for different per~ent fines
CBR .for different specimens of crushedstone (gradation Z)CBR for different specimens of coal burntpicked jhama brick (gradation Z)
CBR for different specimens of first classbricks (gradation Z)CBR for different speC1mens of third classbricks (gradation Z)CBR density relation: (A) crushed stone,(B) coal burnt picked jhpma bricks
CBR d.ensity relation: (A) first class bricks,(B) third class bricks
CBR at different compactive efforts
Grain size distribution of the componentaggregates of gradation Z,
Gradation band 0 f gradation 'Z' andgradation of the combined mixture
Equipment and materials for the compactionof CBR molds
The mixture is ready for compaction
The compacted mold is ready for submersionin water
75
76
77
78-80
85
88 -90
91-93
94-96
97
94
100
128
129
142
142
143

Fig,No.
C-4
C-5
C-6
Description
The CBR specim en is being tested ina mechanical loading press
The sample is being tested 1n a universaltesting mac hi n e
The specimens after being tested
xi
143
144
144
~),i",-
. ~.'*r:

AASHO
ABBREVIAT IONS
- American Association for State Highway Officials
AASHTO - American Association for State Highway andTransportation Officials
ASTM - American Society for Testing and Materials
ANSI - American National Standard Institute
ACV - Aggregate Crushing Value
BRRL - Bangladesh Road Research Laboratory
PCF - Pounds Per Cubic Feet
CBR
CDH
GBPJ
LAA .
PI
- California Bearing Ratio
- California Division of Highways
- Gas Burnt Picked Jhama
- Loss Angeles Abrasion
- Plasticity Index,
PSI - Pounds Per Square Inch
Pen. - Penetration
RN - Road Note
SW - Sand Well Graded
SP. Gr. - Specific Gravity
Spn.
TRRL
USA
U.KWT.ZAV
- Sp ecim en
- Transport and Road Research Laboratory
- United States of America
- United Kingdom
- Weight
- Zero Air Void
.r--.
-,

CHAPTER-lINTRODUCTION
1.1 General
In Bangladesh construction of flexible road pavements.
is being preferred because of their low initial cost and
adaptibility for staga constructiop. Flexiblapavament may
be dafinedas a structure that maintains intimate contact
with and distributas loads to the subgrade and depends on
aggregate interlock. particle friction and cohesion for
stabili.ty. Classical flexible pavements include primarily~;C:-...
those pavements that are composed ofa eeries of granular
layers topped by a relatively thin high quality bituminous
wearing surface. Fig. 1.1 shows a typical flexible pavement
IIIWDIII~ltlIII
Subgrade
-Surface or wearing course
Shoulder treatment
~Road bedNatural soil orcom paeled fillmaterial
Base
SubbaseIII III
Subgrade
Intermediatecourse
Surface course&
-"a::;~£"'Illc-",-uC.-'":5€E~,£
Fig, 1,1 Typical flsxible pavement crass-section(l),

2
cross-section. The principal elemen"ts of the infrastructure
here are shown to be the pavemen"t that is composed of a
'wearing surface'; 'base'; subbase and 'subgrade'.
The wearing surface and the base often comprise two
or more layers that are somewhat diffarent in composition
operations. On heavy duty flexible'pavements a subbase o.f
select materiel is generally placed between the base and
subgrade. Sometimes the material under a rigid pavement
is called a subbase.
1.2 Role of Base end Subbase in Pavement Structure
The function of the base course varies according to
the type of the pavement. Base courses are used under rigid
pavements for (1) prevention of pumping, (2) protection
ageinst frost action. (3) drainage. (4) prevention of volume
change of the subgrade. (5) increased structural capacity,
and (c) expedition of construction.
The top lsyer of a flexible pavement is constructed
by a relatively thin high quality bituminous wearing surface.
The main thiCKness is built by the base and subbase courses.
let W be the the load on the surface of the pavement having
a total thickness of 'd' incnes (fig. 1.2a). Based upon
approximations of stress distribution concepts in homogeneous.
one layer (Boussinesq) system, the load is essumed to be
distributed through the pavement to the subgrade in the form

3
of a cone. The surface of ~he cone is at an angle B with
the vertical axis of the cone (the axis being assumed to
be at rignt angles to the surface of the pavement), and
the unit pressure of 'q' pounds per square inch on the
subgrade is assumed to be uniform. The radiuj of the base
of the cone at the subgrade is d t.an B. and tne relation
of the thickness of tne pavement to the load and the unit
w
[ aJ
Bottom or.. pavement
-----
[ b J
fig. 1.2 Distribution of wheel loads througn flexiblepavements to the subgrade.
subgrade pressure is
q = VI2tan B
1.1
Equation 1.1 assumes tnat a wheel load is concentreted
at a point, whereas it is actually distributed over an area
of contact between the tire and the pavement as snown in
fig. 1.2(b). If this area of contact is circular in snape
2 2VI = qn(d+a) tan Band hence the unit subgrade

4
2 2pressure is q = W/u(d+a) tan 8; since a is small in
comparison to d. from the above equations it is seen that
the subgrade stress dua to imposed load i. inversely propor-
tional to the square of the depth of the base and subbase
course (assuming that the thickness of wearing course is
small in comparison of the combined" base and subbass courses),
Analyzing the pavement section as a multilayered
elastic system Peattie(2) found the verticai stress solutions
and presented in graphical forms, The stresses at points
vertically below the road surface ere dependent on factors
influenced by both the thicknesses and the elasticities
of the upper layers.
N"l (3)" 1 d h "f f h " hei son il ustrate t e in luence 0 c anging t e
pavement layer thicknesses upon the vertical compressive
stress factor for a three-layered pavement system, He showed
thet for a given load, the subgrade stress is greatly dec-
reased by an increase of the base course thiCKness,
Hence the principal purpose of base course in e
flexible pevement is to distribute or 'epread' the stresses
created by wheel loads acting on the wearing surface so that
the stresses transmitted to the Bub grade will not be suffi-
ciently great to result in excessive deformation or diaplace-
ment of that foundation layer, The base course also may
provide drainage (if so designed) and give added protection
against frost action when necessary,

5
1.3 Factors Influencing tha Base and Subbase Characteristics
Modern pavement design procedures are based on multi-
Isyered elastic theory concept. In sll rational pavement
design procedures, it is emphasized that the stress at any
point below the pavament due to a load or loads.on tha
surface is a function of many factors of which the quality
.of the material is the constant infiuencing factor. The
strains and stresses are functions of Poison's ratio and
modulus of elasticity which depend on the material type and
quality. The quality reflects the properties like strength,
toughness, soundness, durability. Other important factors
which influence the basa and subbase courses are the parti-
cle size distribution, particle shape, relative density,
internal friction, cohesion, typa of binder, void ratio,
and porosity. The above factors influence the following
general characteristics of the mixture used in base and
subbase construction:
1) Density and stability,
2) Effect of cru shed particles,
3) Effect of plasticity,
4 ) Effect of skip grading,
5) Soundness, and
6) Permeability.
.•..
fIf

6
1.3.1 Density and stability
The stability of any layer is its most important
requirement for design. Stability of an aggregate-soil
mixture depends upon particle-size distribution, particle
shape, relative density, internal friction and ~ohesion •.
A granular material designed for maximum stability should
posses high internal friction to resist deformation under
load. Internal friction and subsequent shearing resistance
depend to e lerge extent upon density, particle shape, and
grain size distribution. Of these factors, the size distri-
bution of the aggregatss, particularly the proportion of
fine to the coarse fraction, is considered to be the most
important. for maximum stability the mixture should have
fines just sufficient to fill all the voids between aggre-
gates to float in the soil. The density will decrease ana
the mixture is practically impervious and frost susceptible.
Thus the stability of an aggregate soil mixture is dependent
upon the grain size distribution of the particles.
The grain size distribution of a material can bed ~represented by the equation p = 100 (0-) where d repre-
sents the sieve in question, p is the percent by weight
finer than the sieve, and D is the maximum size of the
aggregate. Maximum density genera~ly occurs where the expo-
nsnt n equals to 0.5. This yields 6.2 percent passing No.200
« Equation 11.1 given in 'Principles of pavement design'by Yoder and ~itczak.

-".~--------
7
mesh sieve for e material which has a maximum grain size
of t inch. Comparing density and strength in terms of CBR
it is seen that maximum CBR resulted when ~he qu~ntity of
fines was somewnat less than that indicated for maximum
density. Dsnsity ~s well as sta~ility incraases as the
size of the aggregata increases.
1,3.2 Effect of crushed particles
For identical grain size distribution, the California
Bearing Ratios of mixtures made up of angular particles are
usually somewhat graater than those containing mostly rounded
particles. The crushed particles have, in general, more
stability than round grained materials, due primarily to
added grain interlock, In addition, for a particular grad a-
tion the crushed mat.arials alsO possess high co-efficients
of permsability and, hence ere more easily drained, Crushed
materials show excellent perfor~ance in most instances and
ars normally preferred.
1,3,3 Effect of plasticity
The physical properties o.f the binder soil hsve a
great effect on stability, especially when grain to grain
contact is destroyad, Fig, 1,3 shows the effe~t of plasticity
of the binder on the triaxial strength of a gravel with
varying amounts of material passing No, 30 mesh sieve,
!IIIt!

B
I. is seen that when tne percen. passing No. 30 mesh
sieve is low, plasticity has vary li.tle effect on the
strength, and tha. as the amount of material passing No.30
sieve is increased plasticity has an increasing effect.
1.3.4 Effect of skip grading
It must be recognized that if the material is not
'well graded' the plasticity requiremen.s, as weJ.l as the
require~ents relating to the amount of fine material, do
not necessarily appJ.y as they do for well graded ma.erials.
The net effect of having a skip-graded material is .hat
there is a deficiency in intermediate size and, as a result,
the void space is increased.
The effect of skip grading on the triaxial strength
of a mixture has a complex reJ.ationship and depends upon
the amount of material passing No. 200 sieve, as well as
on the dust ratio. The dust ratio is the ratio of the
portion passing No. 30 mesh sieve to the portion passing
a No. 200 mesh sieve. For low amoun.s of material passing
No. 200 sieve the dust ratio has li.tle effect and it can
be concluded that skip grading would have no harm upon the
mix. On the other hand, for higher amounts of material
passing No. 200 sieve, an increase in the dus. ratio causes
a decrease in the strength upon a certain limit of dust
ratio and then the strength increases beyond this limit.
.-..<

9
305 10 15 20 25Percent passing a No. 30 sieve
o
80 -
60
••• Ill 40•••••• .-< :Jx"'10"'
• .-< III
t~20
120
• .-<"'0.
••••••••III•••..";100
Fig. 1.3 Effect of plasticity on triaxial strength of agravel. Maximum aggregate size is 1 inch.¥
Furthermore plasticity becomes less important when skip
grading is used.
1.3.5 Effect of soundness
Soundness as regards base and subbase materials, ie
defined as the ability of the aggregate to withetand abra-
sion and/or crushing. This is important from the standpoint
of generation of fines under the action of rollers and
traffic. Durability ot the course depends mainly on the
soundness of the aggregates. Unsound aggregates disinteg-
rate badly under the action of weather.¥ Fig. 11.5 given in 'Principles of .pavement design'
by Yoder and Witczak.

10
1.4 The Problem
In conventiona~ road pavements the aggregates used
for surface, base and subbase courses consist of crushed
stone, gravel and crusned slag, These dense, low absorptive
natural aggregates having high crushing strength are not
available in Bangladesh except in sma~~ quantities in
Northern 5y~het and Dinajpur areas. It is extremely expen-
sive to carry the stone aggregates from their sources to
the job site if the haulage length is too high. Again with
the increased and continued consumption those naturally
occuring aggregate sources are being depleted. On the other
hand bricks are available readily or can be manufactured
in kilns near the job sites. Crushed brick aggregates are
being used and are in use for a long time in the construc-
tion of base end subbase courses of pavements. But no
research has yet been carried out to investigate their
suitability and no report is available about the perfor-
mences of brick aggregates in such constructions. Therefore
searCh has to be intensified to investigate the suitability
of brick aggregate~ in the base and subbase courses.
1.5 Objectives of the Research
The strength and behaviour of aggregates depend upon
a number of variables, SUCh as gradation, porosity, absorp-
tion,wearability etc. Review of literatures shows a
. "- "'~.~.'-','II

11
deficiency of knowledge in regard to'the properties of
brick aggregates and aggregate sand mixtures. The objec-
tives of the research therefore are as follows:
(i) to determine the physical properties of brick
aggregates to be used i~ base and subbase
construction and to compare these properties
with stone aggregates;
(ii) to find the effect of gradation, moisture
content, perc ant fines on CSR values for
crushed brick-sand-soil mixtures;
(iii) to find the effect of compactive efforts
applied during compaction on the CBR values of
different aggregate sand-soil mixtures.
. .. _0-j

-'''-~'.
CHAPTER-2LITERATURE REV1EW
2.1 General
Literatures are not available directly on the use of
brick eggregetes in base and subbase construction, Stone
aggregates and .stone-sand or stone~soil mixtures have been
used for the construction of base, subbase courses for high
type pavements and top courses for low type pavements.
Leteratures, specifications, recommendations are available
regarding the characteristics of natura~ aggregates and
soil-aggregate mixtures in base and subbase courses. Soma-
times the aggregates are stabilized by some admixturas to
hava a firm basa or subbase to provide the support for a
relatively thin waaring surfaca. Literatures are also avail-
able for such type of construction, The present research
work has been takan to determine the cnaracteristics of
untreated brick aggregata-soil ~ixture in base and subbsse
constructions, Limited litarature available for unstabilized
stone aggregate and/or gravel - soil mixtures are discuased
in the following articles.
2.2 Laboratory Studies
Load supporting capacity indicated by the stability
and density of tha aggregata soil mixtura is the principal
requirement of a base or subbase coursa. Different organiaa-•tions carried investigations to find a suitable gradation

13
to have dense and stable mixtures. These worK in the form
of recommandations are discussed in Article 2.5.
The proportion of the fines (materia~ passing No.200
sieve) to coarse fraction is also an import an) factor to
have a dense and stable mixture. Deklotz1s(4J works discussed
by Yoder (1975) on "Effect of varying the quantity of fines
of highway aggregac~s on their scability" reveals that
there is an optimum amount of fines for e particular aggre- ~':
gate-soil mixture at which the mixture will have its maximum
density and stability for a particu~ar compactive effort.
According to Mr. Yoder results of leboratozy studies on a
well graded stone aggregate snow that the maximum denaity
occurs when the mixes contain about B to 10 perc ant fines
passing a No.200 sieve. In contract, the maximum stability
as measured by the CBR test rasulted when about 6 to B
percent of the msterial passed a No. 200 mesh sieve.
Yoder( 5)(1975) also has slolownthe affect of compactive
effort on density and stability of a stone aggregate mixture
for a particular gradation. He concluded that the more the
compactive effort, the more will be the density and stability.
But the response for the increase is more pronounced in the
case of stability rather than density.
Laboratory studies also were carried on to compare
the density and stebility valuee between round shaped
naturally occuring graval mixtures and crushed stone mixtures.
9( ),

14
These tests and field experiences have shown that crushed
particles have in general, more stability than round-
grained material due primarily to added grain interlock.
Tests to find the effect of the physical properties
of binder soil on
by Makdisi-Ilyas.
the stability
F. (6)al.Z . They
of the mixture were dona
fou'nd that the effect 0 f
. -<-------
plasticity is detrimental to the strength with higher amount
of material passing No. 200 mest) sieve. This happens due
to the reason that plasticity is dependent upon the amount
of material passing No. 30 sieve is increased. The required
amount of material p,as1sing No. 30 sieve for maximum density
is 15.30 percent and when the binder content exceeds this
value, the plasticity becomes important.
Faiz, A( 7) worked with the skip graded mixtures. It
must be recognized that if the material is not 'well graded'
the plasticity requirements as well as requirements relating
to the amount of the fine material, do not necessarily apply
as they do for well graded materials. The net effect of
having a skip graded material is that there is a deficiency
in intermediate sizes and, as a result the void space is
increased. Hesults from laboratory studies show that skip
grading gives a complex relationship with triaxial strength.
which depends on both dust ratio and percent material passing
No. 200 Sl.eve. It is also seen that for high values of dust
r(, I' '
I

15
ratio and plasticity, the skip grading becomes baneficial
to some extent,
Mainfort and Lawton (1952)(6) carried investigations
on the laboratory compaction tests of coarse graded paving
materials. They reported tha result of a laboratory study
for the applicability of the Proctor type of compaction of
coarse graded materials. The tests indicated ths t the
standard Proctor method using a standard 4 inch mold is/ .
suitabla for determining the maximum density and optimum
moisture contant of coarse materials and mixtures. from
their fiald observations it was found that the densities
obtained in the laboratory by the Proctor type of compac-
tion test appear to agree with densities obtainable with
either vibratory or roller types of field equipment,
2,3 field Studies.
Since the end of the second world war there has been
a vast increase in highway traffic and many test roads were
constructed to observe the performances of the roads and
to develop design methods. In 1949 e research project was
set up by Highw~y Re~earch Board in Maryland, USA, to
determine tha relative effects of various axle loads and
configurations on distress of pavements, This test was,
intended for observation of the behaviour of concrets
pavement constructed on a imporved granular subbase material
and no findings regarding base course was obtained,
.~. .j-.

16
The WASHO road test was done prior to AASHTO road
test neer Malad, Idaho, USA, For flexible pavement the
test recommends a total thickness of pavement and basa for
different axle loads,
The most intensive and extensive researc~ on road
was a co-operative project sponsored by AASHO at Ottowa,
Illinois, USA, In the principal flexible pavement test
sections the base course was constructed by a well-graded
crushed lime stone and the subbase by a uniformly graded
sand-gravel mixture, Other test sections were constructed
with bases by a well graded uncrushed gravel, a bituminous
plant mixture, and a cement treated aggregate, On the basis
of the performance records of the various test sections a
new concept to evaluate the pavement infrastructure was
introduced which is PSI - Pavement Service-ability Index,
The important conclusion made by them about bases is -
"the performance of the treated- gravel base is definitely
superior to that of the untreeted cru shed stone base",
The first of 'the British full scale field experimsnt
began in 1949 on a section of the Al trunk roed in Yorkshire
U,K. They used three types of base meterial - tar macadam
baee; dry bound stone base; hand pitched base, From obser-
vations over a period of ten yeers they found He t the
open textured tar macadam bases performed much better than
either the dry bound stone bases or the hand pitched basas.,
r'--,.. :..
"

17
In addition the hand-pitched base showed increased surfaca
deformation and founq worse than dry bound stone base and
is no longer recommended.
A further experiment, also on the Al road at Alconbary
Hill in Huntingdonshire, U.K was initiated in 1957 to
compare tha performances of five different base materials
laid to various thicknesses. The base materials were cement.'''!,.
stabilized sand, wet mix slag, lean concrete, tar macadam, ;r:'
and hot rolled asphalt. Experimantal sections, each 2000 ft
long, wera constructed on a sand subbase of varying thick-
nesses. Results after six years show that the sections with
rolled asphalt bases have performed the best whilst those
with sand-cement base are clearly the worst. All these
field tests for base courses were comparative studies
between different types of beses, treated or untreated but
no test was done with one specific base by varying its
components, materials etc.
Field experiments were done by Mr. Drake(9) of
Kentucky Department of Highways on the performances of
flexible baee courses designed pri'rrl-a,:tilyto improve the"
riding qualities of' high type bituminouS,~pavements. Four'-. '-'-inch dense graded lims stone base was constructed ~ith 1
inch downgraded; 5 to 15 percent passing No. 200 sieve,
well greded material over a 4 inch of waterbound macadam
subbaae course. Observetions and measurements showed that
>, ~\., '
. I

16
the combination of the two courses could be built satie-
factorily, the dense graded aggregate produced a high base
deneity and the possibilities for finishing to uniform
section were much better with the dense graded aggregate
than with the macadam.(10) •Cadergren ,made field CBR tests on granular
subbase end bases. He criticised the general idea that the
CBR values on large macadam type construction will be higher
then with emeller aggregates. In testing coarse grained
materiels he found elmost invariably that CBR values are
not too high but too 10W.J ..
2.4 Method of Evaluation of Base end Subbase Courses
The base and subbase courses are evaluated in the
field end/or in the laboratory by the following methode.
(i) Plete Beering Test - f«(ii) Triaxial Compression Test - L««
(iii) Stabilometer Test - L
(iv) California Bearing Ratio Test (f and L)
(i) Plate Baaring Test
The Plate Bearing test d~veloped by Mr. N.W. McLeod
of Canada Transportation Department expanded the results
« f indicatee field test •• « L indicatee laboratory test.

19
of his exteneive field study relating to it to pavement
design methods based on the theory of elasticity. The test
can be usad to measure the strength at any elevation in an
asphalt pavement structure: surface of the subg.rades. top
of subbase, top of the base course, or surfece o.f the
finished pevement.
Deflection of circular rigid plates are measured by
deflection dials under vertical loads applied at some
standard rate. The modulus of the layer on which the plates
are placed is calculated by means of the following equations,
PD.
where P is the unit load on the plate (psi) and 6 ie the
deflection of the plate (inches). Tests are generally made
directly on the unconfined base course and the field value
is adjusted to the most unfavourable base condition that
can be expected. This can be accomplished by the additional
data obtained by loading the samples in confined conditions,
(ii) Triaxial Compression Test
The triexial comprassion test was developed to deter-
mine the shear stress of a soil sample under lateral pressure,
The test is suitable for only fine grained soil or sand
where specimens are loaded vertically under constant lateral
pressure to have a shear failure. The stability of the soil

is determined by the equation,
S = C + 6" tan iil
where S = shearing res'istanc8 developed
C = cohesion
6 = vertical stress applied
iil = angle of internal friction.
./
20
values of cohesion and internal friction can be determined
from the plots of the test results.
Based on the principles of triaxial test, McDowel
developed Texas triaxial cell to evaluate base course
materials. The apparatus is suitable for performing a large
number of tests economically. Shear stress is measured at
different normal stresses and the results are plotted to
classify different types of materials.
(iii) Stabilometer Test
California Division of Highways developed a semitheo-
ritical method of flexible pavement design based on two
properties of materials cohesion and friction. These proper-
ties of treated or untreated base, subbase or subgrede
materials are determined by tests in the Hveem stabilometer
developed by F.N Hveem and R.M. Coumany of California
Division of Hignways (CDH) which measuree the horizontal
pressure developed in a short cylindrical sample loaded

21
vertically on its ends. This device was concieved to
measure the stability of both field and laboratory samples
of bituminous pavement and treat~d base courses. Loads are
applied vertically; the resulting horizontally devaloped
stresse.s are measured, and the vertical and horizo nta.Lly
developed stresses are measured. T~e vertical and horizon-
tal pressures are utilized in the following equation for
calculating stabilometer resistance values.
R = 100 - lOU(2.5/D2)(Pv/Ph- 1) + 1
where R c resistance vaiueP = applied vertica.L pressure (160 psi)v
Ph= transmitted horizontal pressura at Pv = 160 psi
D2= displacement of stabilometer fluid necessary to
increase horizontal pressure from 5 to 100 psi,
measured in revolutions of a calibrated pump
handle.
Cohesion is measurad by meane of the cohesiometer,
an apparatus capable of breaking small beams of base courseI
materials. The base course materials are then ranked on the
basis of stabilometer resistance values and cohesometer values.
(iv) california Bearing Ratio Test
The California Bearing Ratio test abbreviated as CBR
is the most widely used method of eva.Luation of subgrade,

22
subbase and base course materials. The method was first
developed by California Division of Highways and then
adopted and modified by U.S Corps of Engineers, in 1961.
The American Associetion of State Highway.Officials, AASHO
acceptad this test in 1963 with Designation T 193-63 fordetermining the bearing values of s~bgrade soils and some
sub-base and base course materials containing only a small
amount of material retained on the in sieve.
CBR test is a penetration test wherein, a standardized
piston, having an end area of 3 sq. in. is caused to pene-
trate the sample at a standard rate of 0.05 inch per minute.
The unit load required to penetrate the sample at 0.1 .inch
penetration is then compared with a value of 1000 Ib per eq.
inch required to effect the same penetration in standard
crushed rock. The test is to be carried on sample of subbase
or base material compacted to the moisture and density
condition which site investigat~on and considerations of
the construction methods and plant to be used, indicate to
be appropriate. For design purpose the CBR value of the
base or subbase course at worst condition is required which
can be obtained by testing the sample, after being saturated.
Due to swelling of the specimen, the top surface may be
loose to some extent. Therefore the stress-strain curve
(Fig. 4,11 obtained from the penetration test some times
will be concave upward which requires correction by moving

23
it to the right. By CBR value it means corrected value
when this correction has been applied to the curve.
Laboratory CBR values obtained on samples compacted
in confining steel molds are obviously to be checked in
the field after construction. This can be done by comparing
the densities in the laboratory and in the field or directly
penetrating the course in the field. Field CBR test is
basically the same as the laboratory test bu~ a correlation
is to be established to correct the field values for satu-
ration, The laboratory CBR values are expected to be slightly
higher than those obtained in the field becwse of the
confining action of the mold in the leboratory. Precautione
must be taken during field tests to ensure intimate contact
of the piston with an undisturbed surface of the material
tested.
2.5 Practices and Recommendationa for Base and Subbase Courses
For a high type pavement generally both base, between
surface course" and subbase, and subbase, between base and
subgrade are constructed. For low and intermediate type of
pavement subbase course may be omitted. In some cases the
base for a low type pavement can be used as subbase for a
high type pavement. Whether it is base or subbase the
objective of the present research is about the behaviour
of the materials used in such construction. Mainly thers

~'I,
24
are 3 types of constructions for base and subbase courses
on the basis of materia.ls used. These are:
1. Soil-aggregata and grave.l bases
2. Macadam bases
3. Treated ba ses.
In some types of macadam bases and in treated bases a
binder material is used to create bond between grains. This
treatment is uaua~ly costly and suggasted for high type
pavements and where other type of construction is not
economical. Soil-aggregate and gravel bases often termed
a~ untreated bases are constructed without admixture. The
stability, and density are developad in the course byusing proper gradation, appropriate amount of fina material -
silt and c~ay, moisture content and of coursa by proper
compaction. When aggregates ere available near road side,
soil from the road bed can be mix~d with them and compacted.
In most cases, this type of construction is economical.
The research work has been concerned with the evaluation
of this type of mixtures. Almost in a~l developing countries
and a~so in some developed countries this type of construc7
tion is in use for rural roads. In the following articles
the recommendations and practices regarding this untreated
base course constructions are briefly discussed.
...(.;..7'.~__ .,,=.,.-,;
• ~:":"Jt'l

25
2.5.1 Pra8ti8es in USA and AASHTO Recommendations
In some states of USA low type roads are constructed
with soil aggregate mixtures as the surface course. In
intermediate type of roads and in some high type rural
roads untreated soil aggregate mixtures are used for bese
and subbase constructions. The Amer1can Association of
State Highway and fransportation Officials has first come
to specify meterials for this type of constructions. The
materials for aggregate and soil aggregate subbase, base
and surface courses are epecified by AASHTO(ll) under
designation M 147-57(67) (71). AASHTO specified 'Materiale
for Aggregate and Soil-Aggregate subbasa, base, and surface
courses'. The requiremente are as follows:
General Reguirement
(a) Coarse aggregate retained on NO,lO sieve shall
consist of hard, durable particl~s or fregments of stone,
gravel or slag.
(b) Coarse eggregate shall have a percentege of wear
by Los Angeles test, of not.more then 50,
(c) Fine aggregate passing NO,lO sieve shall consist
of natural or crushed sand, and fine mineral particlas
passing NO,200 sieve,
(d) The fraction passing No. 200 sieve shall not be
greater than two thirds of the fraction passing No. 40 sieve,
.'. ;'~r

26
The fraction passing No. 40 sieve sha~l have a liquid limit
not greater than 25 and a plasticity index not greater
than 6.
(e) All material shall be free from vegetable matter
and lumps or balls of clay.
Subbase Material
Materials for subbase shall conform to the general
requirements for gradings A,B,C,D,E or F (Table 2.1).
Base Course Material
Materials for base cours~ shall conform to the
general requirements for grading A,B,C,D,E or F.
The United states Agency for International Development(l2)
in the Guidelines for Highways and Bridges specified Grading
B (Table 2.1) for class-l aggregate base course. The require-
ments ere same as specified by AA5HTO M 147.
2.5.2 California Division of Highways Recommendations
Since its establishment the California Division of
Highways (CDH) has been making vital contribution to the
development of pavement technology. Engineers, researchers
of this division from time to time brought new techniques
for the construction of road pavements. In the 'standard
:,
;, .
1,' •... , I\ .'.f
. "'_. :tr

27
Table 2.1 Grading Requirement for Soil Aggregate Materialsfor Subbase and Base Constructions (from AASHTO)
Sievedesi g-nation
Percentage by wt. passing square mesh sieveGrading Grading Grading Grading Grading
ABC D EGrading,
f
2 inch
1 inch
t inch
No. 4
No. 10
No. 200
100
30-65
25-55
15-40
2-8
100
75-95
40-75
30-60
20-45
5-20
100
50-85
35-65
25-50
5-15
100
60-100
50-85
40-70
5-20
100
55-100
40-100
6-20
100
70-100
55-100
8-25
specification,(13) of this division, aggregate subbase and
base courses are specified under section 25 and 26 respectively.
CDH classified both subbase and base courses into three
classes viz c'!'ass-l,class-2 and class-3. Requirements for
class-l aggregata base are as fol~ows:
la) The aggregates shall consist of a crushed product
of stone or gravel. It sha'!'lbe free from vegetable matter
and other deleterious substances, ,and shaj,l be of such natura
that it can be compacted readily under watering and rolling
to form a firm. stable base.
(b) The amount of crushing shall be regulated SO that
at least 80 percent by weight of lt inch maximum size material
retained on the No. 4 sieve and 90 percent by weight of the
t inch maximum size material retained on No. 4 sieve.

2B
(c) The percentage composition by weight of aggr~gate
base shall conform to one of the grading given in Table 2.2.
Table 2.2 Percentage Composition by Weight for AggregateBase (from CDH)
Sieve Percenta~e passingsize
It" maximum size t" maximum size
2" 100
It" 90-100 100
t" 50-B5 90-100
No. 4 30-45 35-55
No. 3D 10-25 10-30
No.200 2-9 2-9
(d) The aggregate base shall conform to tha following
requiremsnts:
Test sLoss in Wetshot Rattler
Loss in Loss-Angeles Rattler
Resistance (R-value)
Sand equivalent
Reguirem ent s
55% rna".
SO% rna".
BO min.
50 min.
2.5.3 U.K. Practice and Transport and Road ResearchLaboratory. U.K. Recommendations
The road subbase and base courses are constructed
conforming to the requirements given in Road Note No.29(14)
"
0".".""1.

29
of Transport and Road Research Laboratory, U.K and Ministry
fT t 'f' ,(15)o ranspor spec~ ~cat~on suggests a granular subbase
. = •.. ~ .
material to conform to the gradings specified in Table-2.3.
Type-l aggregates comprise crushed rock, crushed concrete.
crushed slag or well burnt nonplastic shale. These materials
will remain stable over a much wider ~ange of moisture
contents than type 2 aggregates whicn include well graded
natural sands, gravel:s. and rock or slag fines, and are
therefore to be preferred in Bangladesh, where site conditions
are likely to be wet during construction. The Road Note No.29
requires a minimum CBR of 30 'percent on aggregate subbase.
Table 2.3 Grading Requirements for Granular SubbaseMaterials (From Road Note No, 29)
B.S. Percent by wt. passingsievesize Type-l Aggregate Type-2 Aggregate
3 inch 100 100
1-2-inch 85-100 85-100
3/8 inch 25-85
3/16 inch 25-45 25-85
No. 25 8-22 8-45
No.200 0-2 0-10
For base course the minimum CBR requirement is 80
percent and suitable materials for base include crushad stone
or blast furnance slag, dry lean concrete, cement bound
granular material and bituminous bound materials •

30
The Transport and Road Research Laboratory, U.K prepared
Road Note No. 31(16) in 1962, edited third time in 1977 to
give e guide line for the structural design of bitumen-
surfaced roads in tropical end subtropical countries. The
techniques given in this report are suitable for and followed
by many deve~oping countries. They ~ecommended in the note
the two types of untreated base materiels sucn as
i) mechanica~ly-stable natural gravel or crushed
gravel and
ii) cru shed rock.
The requirements of these base courses are given as folloWB:
a) The natural gravel or crushed gravel must have a
grading that is mechanically stable and must contain suffi-
cient fines to provide a dense material. TabLe 2.4 gives
typicel grading limits of suitable mater~als.
b) The material passing 85 ~25 um sieve (No. 40 ASTM)
should be such that plasticity Inde.x is less than 6; liquid
limit is less than 25 and linear strinkage does not exceed
4.0 percent.
c) The gravel should be compected to a field density
equel to or greater than the maximum density acnieved in
the British Standard compaction test (lUO percent meximum
stendard AA5HD density) and for this density in the leboratory
the minimum CBR after four days immersion in water, should
be BD percent.
Il-
Ii,

31
Table 2.4 Typical Limits of Partic~e Size Distributionsfor Mechanica~ly Stable Natural Gravel forUse as Base Course (from Road Note No. 31)
Percentage passingB.S. sieve Nominal maximum sizesize
mm(ftin)37.5 mm(lt") 20 mm(1- in) 10 mm(tin) 5
37.5 mm(lt in) 100 - .20 mm(t in) 80-100 100
10 mm(t in) 55-80 80-100 100
5 mm(3/16 in) 40-60 50-75 80-100 100
2.36 mm(No.7) 30-50 35-60 5U-80 80-100
1.18 mm(No.14) 40-65 50-80
600 um(No.25) 15-30 15-35 30-60
300 u mm (No.52) 20-40 20-45
75 um (No. 200) 45-15 5-15 10-25 10-25
2.5.4 Practice and Recommendation by Bangladesh Road ResearchLaboratory
W.G. HoDGKIN50N(17) under assignment to the Ministry of
Overseas Development, U,K, prepared a guide in co-operation
with the Bangladesh Road Research Laboratory for the etruc-
tural design of bitum~n surfaced roads in Bangladesh. The
guide recommends the requirements of brick aggregates to be
used for base course construction. But no field test or
laboratory tests were made to eva~uate the construction with
crushed brick aggregates. The design charts call for the baae

32
to have B minimum CBH of 80 percent, Only gas burnt picked
picked jhama bricks with the following properties are
suggested to be used,
Table 2,5 Strength Limits of Stone and BriCk for BaseCourse (BRRL)
Aggregate Lrushing Value (ACV) - not greater than 30 percent J
Los Angeles Abrasion{LAA) - not great er than 34 percentv'
Average Cru shing Strength - not less than 5000 psi j(bricks only)
water Absorption - not greater than 9 percent
Plasticity Index of Fines - no t greater than 6 percentJ
A typical grading envelope for a~l in crushed brick
aggregate is shown in Table 2.6 whicn employes a continuous
graded brick (or stone) material of maximum size 37.5-50 mm
(It - 2").
Table 2.6 Grading Limits for a~l in Crushed Aggregate BaseMaterial (From BRRL Guide)
Sieve size Percent passingby weight
50 mm 100
37. 5 mm (1t" ) 90-lUO
20 mm (i" ) 60-BO,.,,
10 mm (i" ) 40-60
5 mm (No. 4) 30-452. 3 mm (No.B) 20-35600 urn (No. 30) 12-2576 urn (No. 200) 5-15
-<,,",,.IL

CHAPTER-3
MATERIALS
3.1 General
The design of a pavement is valid only if the materials
of construction meet the specification. For high~ay construc-
1lI!
tions various alternate materials are available byt the
pavement should be constructed with the materiaAs having
properties to give sufficient stability and durability. In
flexible pavement, base course is the main structural compo-Inent to distribute the superimposed load to the subgrade. If
II
\i
there is some failure in the base course due to the weaknesses
type of distress gradually
after being progressive;
ieads to the eventual failure of the road. The properties
in the material, deterioration
dhuckholes may be formed. This,
i
of these materials individually or the mixture as a wholeare of such criticaA importance to pavement life that examplee
of pavement failure traceable to improper material selection
and use ere numerious. Therefore,' special amphasis must be
given for the selction of materials for construction of base
and subbase courses. The materials dealt with are those
consisting of artificially prepared bricks and natural sand
and. soil. The one.of the objectives of this thesis is to
search for appropriate material for the construction of base
and subbase courses for flexible pavement. Following articles
ere viewed to classify and investigate the appropriate soil-
aggregate materials for such constructions.

34
3.2 Materials Used for the Research
The materials used in the mixture to be used in base
or subbase construction .consists 0 f cru shed brick, coarse
to medium sand and silt and c~ay fractions of soil. These
three components of the mixture were selected to meet the
desired gradation. Informations regllrding the evailebility
of the materials is contained in Appendix-A. For comparison
four types of bricks with different crushing strength and
abeorption were used. These bricks are locally named as
'Picked Jhama'; 'First Class' and' Third Class' (Description
of bricks are contained in Appendix-A). In addi"ion a compa-
rative study was made using stone aggregates. Main portions
of the coarse and fine aggregates in the mixture.were
obtained by crushing these bricks or stones. Very small
amount of materials between No. B mesh sieve to No. 200 mesh
sieve are obtained during crusning of bricks. To meet the
grading requirement between No. B mesh sieve to No. 200 meeh
sieve some coarse to medium sand was blended. Informations
regarding the typical hand crusning of bricks and stones are
contained in Appendix-B.
Properties of the different types .of bricks used in
the study are tabulated in Table 3.1.
Boulders used to get the stone aggregates hsve average
crushing strength of 15,500 psi and absorption of 1.65 percent.

35
Table 3.1 Properties of Bricks
Properties
Colour andBurning condition
••Averagea brick,
weight ofIb s
'Gas burntpickedjhama '
Blackishred/overbu rnt
7,55
Coalburntpickedihame
Blackishred/overburnt.'6.36
Firstclass
Red/wellburnt
6,15
Thirdclass
Pale red/underburnt
5.66
i
Average crushingstrength, psi.
Av~rage absorption,percent
5050
11.0
3575
11.03
3130
12,25
1375
••Average velues are taken from at least ten samplesselected at random.
Sand used as fine aggregate has a fineness modulus
of 2.70 and a specific gravity of 2,59.
Soil used as fines passing No. 2UO sieve has a specific
gravity 2.72 and unit waight of 113.5 Ib/cft (dense condition),
These materials were used to have 'coarse aggregate'.
'fine aggregate' and' fines' in the mixture,
3.2.1 Coarse Aggregate for the Study
Coarse aggregate has been defined as that portion of
the mixture which is retained on No. 10 sieve. The coarse
aggregates contribute to the stability of the mixture by
interlocking and frictional resistance of adjacent aggregate
particles to displacement.

36
Coarse aggregates ware obtained by crushing the bricks
or boulders (for stona aggregate). The crushing was done
manually and brought to the sizes of one inch or less. The
aggregates were then sieved using U.S~ standard sieves and
separated out in different fractiona. They wera then washed
and dried and combined in appropriate proportions of designed
gradations.
3.2.2 fina Aggregate for the Study
fine aggregate is that portion of the aggregate
material in ths mixture which passes No. 10 sieve and is
retained on a No. 200 sieve. fine aggregate contributes to
the stability of the mixture through interlocking and internal
friction and also by filling the voids in coarse aggregate.
After crushing briCKs or boulders it is seen thet all of
the fine aggregates required for a well graded mixture are
not obtained. Therefore some sa~d is to be blended with the
crusned aggregate to meet the grading specification. for
the gradations considered in this work coarse to medium sand
having finenass modulus between 2.5 to 3.0 is required to be
mixed. The fine aggregate in the mixture is therefore a
mixture of crushed bricK or stone and sand.
3.2.3 fines Used for the Study
fines are that portion of the mixture which passes No.200
sieve. They largely are visualized as void filler material in
."

37
the mixture. Fines are used in a well graded dense mixture
in amounts ranging from 5 to 15 percent by weight. From
crushing of overburnt picKed jhama bricK a negligible
amount of fines are obtained. The major portion of the
fines is obtained by mixing dry powdered soil which is the
cheep est among the available mateDials. In mo~t cases the
subgrade ,soil or soil from adjacent site can be mixed with
aggregate blend to have the desired percentage of fines in
the mixture.
3.3 Test Procedures for Determining Physical Propertiesof Aggregates
Coarse Aggregate: Tests required to determine the
physical properties of coarse aggregates are loose and
dense unit weight, specific gravity, water absorption,
percent wear by Los Angeles Abrasion. All iliese tests were
performed according to ASTM standard 1979 and AASHO standard.
1971. In Table 3.2 the test results of coarse aggregates
obtained from different types of bricks and boulders are
summarized.
According to AASHTO specification M19S-65, the maximum
dry loose unit weight of light weight aggregate for struc-
tural concrete is 55.U Ib/cft. Table 3.2 shows that the unit
weight of all types of bricks particularly gas burnt picked
jhama briCK is much above 55.0 Ib/ft3• Hence bricKs used

38
cannot be treated as light weight aggregate. But these
unit weight values indicate that they are lighter compared
to the conventional natural aggregates.
From the specific gravity records it is seen that
the differences between the apparent and bulk spec~fic
gravities for brick aggregates are ~ucn higher than the-
Table 3.2 Physicai Properties of Coarse Aggregates
Type of coarse aggregateName of the test ASTM/AASHO Gas Coal First Cru shed
designa- burnt burnt class stonetion picked picked brick
jhama j hama
Unit weight, C29-78 75.72 72.68 68.98 101.75lb/cft
Bulk speci fic Cl27-77 2.06 1.96 1.76 2.59gravity
Apparent speci fic Cl27-77 2.49 2.37 2.31. 2.66gravity
Absorption, Cl27-77 7.29 7.99 10.32 0.66percent
Percent wear Cl31-76 32.00 35.00 40.00 29.50in LAA
same for stone aggregates. This is due to high absorption of
brick aggregates.
The percent wear in Los Angeles abrasion for gas burnt-
picked jhama bricK is lower than those for other types of
bricks. This is because of the high crushing strength of gaa
burnt picKed jhama brick (see Table 3.1).
.-. '.',

39
The absorption of brick aggregates are about lU times
that of stone aggregates indicating that the bricks contain
much more water permeable pores compared to boulders or
stones.
fine Aggregate: Tests were pe:formed on fine aggregates
to determine the loose and dense unit weight, .specific gravity
and water absorption. The fine aggregates were mixtures of
finer portion crushed brick or stone and sand. The results
obtained for different fine aggregates are listed in Table 3.3.
Three types of fine aggregates, mixing sand with fine portions
of gas burnt brick, first class brick and crushed .stone were
considered. Eighty to ninety percent .and were used in the
mixture.
Table 3.3 Physicel Properties of fine Aggregates
Name of Test ASTM/Designa-tion
Type of fIne aggregatesSand plus Sand plusgas burnt first classpick jhame brickbrick
Sand pluscru shedstone
Unit weight,lb/cft
Speci ficgravity(apparent)
Absorptionpercent
C29-78
Cl27-77
Cl27-77
83.65
2.62
4.23
82.34
2.61
5.15
103.75
". " ...

40
About ten to twenty five percent of the total fine
aggregates required in the mixture can be obtained during
the hand crushing of brick s or stones. The lower value is
for materials having higher crushing strength. The rest
of the fine aggregates may be used by mixing appropriate
sand. Table 3.3 ShOWS that the unit weight and specific
gravity decrease when crushed bricks are mixed with sand
and these values with stone chips remain more or less same
as that of sand. The absorption of the brick aggregate-sand
mixture is much higher than that for stone screenings-sand
mixture.
fines: The specific gravity of the natural fines was
determined according to ASTM standard C128-68 and the value
is 2.72. The unit weight of fines was determined accordingc:
to ASTM standard C29-71 and the values are 61.3 lb/cft at
loose state and 73.2 lb/cft at dense state. These values ara
tabulated in Table 3.4. A hydrometer analysis of fines to
determine the grain size distribution was also done and tha
results are tabulated in Appsndix-C.
Table 3.4 Physical Properties of fines
Name of the test
Specific GravityUnit weight (loose)lb/c ftUnit weight (dense)lb/cft
ASTMDesigna1:ion
Cl28-68C29-71
C29-71 73.2U

•
CHAPTER-4
LABURATORY INVESTIGATION AND TEST RESULTS
The ptoperties of the materials as discussed in
Chapter 3 reveal that aggregates obtained from the gas
burnt bricks are suitable for base and subbase constructions
from the consideration of strength and toughnesS. With these
brick aggregates-sand-soil mixture first a suitable gradstion
was found out after performing CBR tests for different
gradations described in Artic~e 4.1. With the gradation
giving maximum CBR value then a search ~as made by varying
amount of fines to fin~ ths optimum percsnt fines and finally
a gradation with optimum fines is suggested.
After the gradation of the mixture ~as found, comparative
studies ~ere made bet~een different types of brick and stone
aggregate:s. If excess amount of clay material is present in
the mixture, when mixed ~ith water, the mixture bscomes
plastic. This type of material is not suitable for base
course construction. The plasticity of the mixture depends
on the portion of the mixture passing No. 40 sieve. An
investigation is therefore carried to find the plasticity
characteristics of the portion of the mixture passing No.40
sieve.
A relstion batween the compactive efforts and CBR
values were also established. The laboratory works done for
the research and the tsst results are discussed in the
following articles.

42
4.1 Density-Gradation Relationship
Initially fi0e aggregate gradations were selected
from available literature. these gradatione are listed
in Table 4.1. The grain size distribution bands are shown
in Figs. 4.1 to 4.5. The gradations are designated as
Xl,X2,x3,X4 and XS' Gradation Xl waa taken from the reco-
mmendations of Bangladesh Road Research Laboratory for
aggregate crusher run base (shown in Table 2.S). ~radation
X2 and X3 are chosen from the AA5HO standard M147 grade
A and B (Table 2.1). X4 is the gradation in Road Note No.31
of TRRL, U.K. for untreated crushed aggregate base (Table
2.3 - It inch maximum size). From specifications of California
Division of Highways gredetion Xs was selected (It inch
maximum size of Table 2.2). From the combined plot of all
the gradations (Fig. 4.6) an arbitrary gradation was selected
from the analysis of the results of all the above gradations
in view to have the best results. That final gradation is
gradation Z (Fig. 4.7). Table 4.1 shows gradation Z with
other gradations for comparison.
Coarse aggregates, fina aggregates,' sand and soil
were mixed together in proportions as specified in these
gradations and optimum moisture content and maximum dry
density were found for these mixtures according to the
standard AA5HO compaction method under A5TM designation
D696-76. The results of these compaction tests are shown
(.

43
in a concised form in Table 4.2. The moisture content- density
graohs are plotted in Figs. 4.8 to 4.10. The line of lero Air
Void (ZAV) also is plotted with the help of average apparent
specific gravity of tl3combined mixture. CIJR tests were performed
samples at respective optimum moisture contents.
Table 4.1 Aggregate Gradation Requirements of Different
Organisations and the Selected Gradation l.
Sieve Percent Finer for Gradationssize
,Xl X2 X3 X4 X5 Z
2 inch 100 100 100 100
1+ inch 90-100 100 90-100 95-1001 inch 75-95
i inch. 60-80 80-100 50-85 70-90
t inch 40-60 30-65 40-75 55-80 50-68Na.4(3/16") 30-45 25-55 30-60 40-60 30-45 38-50NO,8 20-35 30-50 28-40No.lO 15-40 20-45
No.3o 12-25 15-30 10-25 15-22No. 40 8-20 15-30
No. 200 5-15 2-8 5-25 5-15 2-9 8-12
4,2 Effect of Gradation on CBR Value
Picked jhama Brick chips with sand and soil at different
gradations were compacted in the laboratory to find the CBR

-"
AGGREGATE GRADATIONCHART
B. S. STANDARD SIEVES
--'",
t I' 'I ¥#l:t :=J--ll~E=200 10080 '>0 (.0 30 20 15
o.lu.JiZ
«>-IU)IO!
t:-~Zw.u<r'.JJ0..
-'«1--oI-
21'1)0o10f--20
30
80
10072 ~.2 3(.
108 4
"410090
80
<.?70 z-
lJ)lJ)50 «0..
,>0>-zw40 u<rw30 a.
20 -'«I-010 I-
•~u. S. STANDARD
FIG. 4.1 GRADATION Xl (BRRL)
r-r-

[1
",p':;;' .;II .~'"',.~'~.~:~:SI7:
i.J1
iI
AGGREGATE GRADATIONCHART
B.S. STANDARD SIEVESI,
4100
90
80
..::>70 z-
V\V\60 <J:CL
SO >---zwLO u0:::W30 CL
-'20 <J:t-o
10 t-
u. S. STA NDAR D
200
10
20
30
90~1
S 2 3 L 18, L 3 " 12" 3 L' 1" " ~' 21~"3"I '_L---t---r !
---+-L :~I--J--- ,- I+i-- 1-+=--EFBl---I-=H-- ---- i
': I I I --t--t---r-: ----j !j I r-f--I-i-!----i-J-.~. ,~--
LOI I; -+-j--!-I---1----I-I~--L- --, I ~ i '--+--+- I L_J __ I L1__ -----l---t illI I I ill I I I ' ; ,cor -.---~.__L-.._-l--_ -~~ I I
J " I" .~ " I -,---r-;i----~+---._.1- , -,_ i I . : .[I ; I '_'_L_' I i I :6 0 i: I" • I' , -,----.----.
! I I ~ t L. --I'---l..--I I i I I I I
701 I I ! i I--~ --+--:--!~-- I ; i!j -' --------t I I .I I: I' I ' 'Ii ~I !: I
, -", Iii I-I' -,. i '------t-- I ; ~- i I
, ., I' I-L __ , ,.------<--- :!t=----,-, "
iii: : I I IIIJ:::: I---T-----i '010080 SO LO 30 20 16 . 108 L 318'11t 3/4" 1" 1'/2' 2' 2lfh" L'
SIEVES
80
t--
Zwu0:::WCL
owZ
<J:>---W0:::
--'<J:>---o>---
FIG.4.2 GRADATION X2 (AASHO)I1
~ ~-~"~,.,
.•...v<
:...+_~-=,,::::lIi

:oJ- __ ,.,J
AGGREGATE GRADATIONCHART
~70 z-
Lf)Lf)
60 <t(L
SO t-
Zw1,0 u0::W30 a..
20 ...J<tt-o
10 t-
80
90
I .LJU4
U.S. STANDARD
~-
B.S. STANDARD SIEVES. .:)().-J.QO 72 52 31. 18 11, 7 3116" 31B" 12" 31," 1" 3" 1,';00
r- If+ETI-~II J==''" -LL_L I
o'~_~__L! I~ <----- '. " L I I 'I" 1 i"' !--~--,- ------f_----,--
: I ! -I l~--f-~! : ,,i "r---lil : !-~--+-----1-" I I
I-------r-~-~-j- , . l__ U ---+-.....-I ,: i I ! 'I' I I , ,I L_L :r--Tt i ~ i 1-1---\-1 -- -I--l---i/ -r-t--;f--~_: __.L_~ I [ L n-~-=i ' I I -;t-L i .1 ; :__ i :...4, ' I L.L-J'-- __ , - i I ~ __ ; i ! ! i !
I . I I . , _L_~--l __ ~:__ : II! 'I~~. . i' , I 1 ,i
! i i : ~ 'II Iii'i e--- I iii!
I --1--1 - __L__ -I; I I
~ I i_100 I i I I 0
200 10080 SO 1.0302016 108 I, 3!8'l!t 3/1,'1" 11r2'2'21/h'I.'51EV ES
0
10
0 20wz- 30<t•....W0:: /'0•...-z SOwu0:: 60w(L
70...J<t•.... 800t-
90
I
ii
iFIG. 4.3 GRADATION X3 (AASHO)
~'~
E"-O>

;.:;> l .••. _-" ",.dO.
~f••~
I,!
AGGREGATE GRADATIONC HART
...J20 <l:
>-o>-
1.0
10
30
-:>70 :z:
l/ll/l
50 <l:0...
,,>0 >-
zwU0::WlL
80
90
"1.100
_ Uo1\/22' 2\12'3" I.'3/8' 112" 3/1." 1"
SIEVES
I.108
U.S. STANDARD
18 11.J.1
B.S. STANDARD SIEVES
7 315" •I I. 1" "" 1 "I ' 2 2123"
i 1__ 1_ tL~,L--1I' '~,--1..._I ! -f-e_1 ii'LL-i-:------f-.- fII I'i
~
' ,_""; i .,__ L.. +-1-l--J, I' _. ,,"
, ._ ..t-I--- I '"I I I I .' ,i
i i [--,--J--: ! -l! i I' : II : I' ! . .t-I---; ,r-- I ', .' • , ' . ' t.1 1 ' I-Ii I t \' I ::! , " I
i I I 'j t • j' i
___.'----1.- " - ,,"i : 1--'- I I, ,.;---+ .,'~_ I I I I
~+--~I_ I I ' I I I I "I$_~: Ii l~ [: II~ I i I -r- : : II ! -+--i- I, i
I
_ I !' ,iiI ,I . ,
II
v
t
10080 50 1.0 30 20 15
100 72 52 3 I.2.00oo
I.v
50
20
30
50
80, ~
70
90c
100200
...J<l:>-o>-
>-zwu0::W0...
owZ
<l:>-W0::
FIG ..4.4 GRADATION XI. (RN 31,TRRLJ.•.....•
AiIl..~1 -

zo~<l.o<l.n::t-l.')n::
<l.wIru<l.l.')
wet:l.')l.')
<l.
o::>
V1W> u)
lJJ
V1
Cl0::«ClZ
~V1
8'0
o(7)-
o
o00
o. '"
oM
o 0
cD '"
o'"
o,.., oN
Clu::
--.1 «ClZ
, «l-
t ;-+- '0 V1t~l ;2 V1
+__ cD -::l
j- ~I,_ 0i MI 0r --~i .n
o00oo
oo'"
:r:ou~U>
X
zo~«o«0:::l.')
1.,8
03NIV13CJ 1N3:JCJ3d 1V101
- -~

••>
AGGREGATE GRADATIONCHART
90
80...:>
10 zIIIV'l60 et0-
:,0 .-zUJ40 ua:.w30 a..~
20 <tt-o
'0 t-
"lilOO
o3/8',p' 1/4"" Nl 2' 2V2" 3' "4
a.s. STANDARD SIEVES
200 lOQ 72 ')1 j. '6 ,~ I "'"'''',!8" V). 1'4' 1" ,II, • 2\. •
I I i . I I : : / ~ ~
--+- -_. [ ~ r II / // W) I : I ! T /'/ /r~ i
+- i/ /1 // V / II I ' H-i ,
) ii - --1-- -- 1/ /.1 Ii I } I
I
i // :",1 / /1) ! 77 p / i 1
! 7' .-1' / .' /, i I
!, /' // / / I \ I
DI , ~/ -/ /1 / II , i
I , '" ." V/ I 1/ ii
, , ~ r' ~ '/ //: i,~ i I ~I ...:;•..• / ./ / ,
: J~/ -'" '1 1/ r=' /D-- I -...- ~ ,.../ .7 ....--' I..-----:: .......- /-1 1/ .. .'/ ,
i
)
,______ I ~. ~' !~. .-: '"
.. T ,
/. ~~ i0~- I
f- , I i i I :
9
I,
5
2
8
100---200 1flO80 ')0 1.0 30 20 16 '0 B
s
7
1
,.----'«>-o
owZ<1:>-Wa:>-~W
.Ua:W0..
U.S.STA,Wt..RD SIEVES
FIG._L6, GRA OAT IONS SUPERIMPOSED
. ')I
'~~/ r-lD _ ~.
;'

:11: , ., ."
AGGREGATE GRADA110NC HART
I-
ZWu0::W(L
...J20 <l:
>-o>-
~70 ~
Lf)Lf)60 <l:
CL
10
30
(,0
SO
80
90
"1,100
! I
II I! I 0
,1/2' 2' 21!h" I.'
,"2&I,
...~_+__---~---: -.f------t--- ..+i ! : !.l! i
108 I, 3i8' 1i2" 3!1,"1"
_;...-4 ;--__ -~
iSO 1.0 30 20 16
i~__
i----t-------;----------- ,I:' -r _1 .1
10080
____l i.. --__ +-_
I '
0400
10
20
30
60
so
90
80
70
100200
B. S. STANDARD SIEVES
31. 1811. 7 3116"
i I ~-J--lJ---~.-~i~1--1. I \ i! \- ! . I: r L ,. I I , I i
--Li---- ---~----,-+---L--- + \ +----~-t_I_J __ L_~;_i-J ~i __ ~J i -t
I . : i J i! j i.'__ 1-.[-~_:__L'-=!=-~~~:t~~_~r-_=;--!
"e-~~~l-,~~=~ef~;~;-j-~~~.~r-u, . L... ~'I' I' - . i' I--=;-~~-=~-~-------====~==t~--~-~.~-=i i _-' _-1.'
owZ
<l:>-W0::
r'Zwu0::wCL
...J<l:>-o>-
U.S.STANDARD SIEVES
FIG.4.7 GRADATION Z(SELECTED GRADATION)
I
"r~? U'o
~

51
Table 4.2 Moisture Density-Gradation Data
Moisture Wet •. Dry- ,Optimum Maximum
Gradation content density density moisture dry-density(%) " lb sl c ft lbs/cft content(%) lb sl c ft
5.0 115.0B 109.60 [:7.5 120.50 112.1,0
Ii,Xl 10.0 126.17 114.70 13.0 1'17.9~'.I
(':'i<J
12.3 132.17. 117.7f:l
14.5 133.39 116.50
16.0 133.05 114.70
5.0 ' 114.34 loB.90
7.3 120.33 112.15
X2 10.0 125.95 114.50 12.5 117.0,!.\
12.5 131.62 117.00,
15.0 133.70 116.30
17. 0 131.27 112.20
5.0 115.17 110.20
9.0 124.26 114.00
X312.5 132.30 117. 60 13.5 116.0
15.0 134.55 117.00
17 •4 135.12 115.10

Table 4.2 (Contd •••••
52
Moi sture .Wet. Dry- Optimum MaximumGradation content density density moi sture dry-density
( % I lbs/cft lbs/cft content(%l lbs/cft
5.0 117.2B 111.7
7.5 123.41 114. B
X4 10.0 129.25 117.5 12.5 120.5
12.0 134.40 120.0
13.5 135.B5 119.7
15.5 133.90 116.0
5.0 116.13 110.6
8.75 124.0B 114.1
X5 11.75 129.85 116.2 13.0 116.5
14.0 132.56 116.0
17.0 133.3B 114.0
z
5.0
7.59.75
13.0
15.0
115.50
124.42
134.20
lLO.O
113.0
116.1
119.0
116.7
13.0 119.0

125
130
•
.. 1tr
ZAV - Density CurvelAvg. App. Sp, Gr.: 2.59)
IIIIIII')IIIIIII I II
5 10 15 20
MOISTURE CONTENT •IN PERCENT OF DRY WT.
(8)
Gradation X2
"0'-
105
120
125
no
20
Z AV - Den s.' ty Curve(Avg. App. Sp. Gr.=-2.61)
5 '0 15
MOISTURE CONTENTIN PERCENT OF DRY WT,"
(AI
/'
Gradation X,
-----------------
110
1\5
105o
>-~lJlZuJo>-a:o
~I.J.ul 120"-lJl(D....I
FIG. 4.~ MOISTURE- DENStT'( RE LATIONSHIP:(A) FOR GRADATION X, (8) FOR GRADATION X2 ~
(7, "~. t... -- -"'" .~_:...; -=-....-~" C"::.:._~.. ..• j
"'

12':>1- Gradation x3
20
ZAV- Dens',ty Curve( Avg. App. Sp. Gr.:2.6t.l
5 10 15
MOISTURE CONTENTIN PERCENT OF DRY WT
(Bl
Gradation xI.
--------------
105o
110'-
120
115
no
20
ZAV - Den si ty CurvelAvg. App. Sp.Gr.=2.671
125
/
10 15
MOISTURE CONTENTIN PERCENl OF DRY WT.
P
(Al
':.
--------------
lOSo
11':>
110
120
no
<flZlJJCl
~Cl
...-u..'-'.••..<flCD--l
'"rt-
,'jl<''f':,."
FIG.4.9 MOISTURE DENSITY RELATIONSHIP:(A) FOR GRADATION X) (B) FOR GRADATION X" ;:

20
WT.
15
ZAV - Dens; ty curve(Avg. app. sp. g'. = 2.63)
10
MOISTURE CONTENTIN PERCENT OF DRY
(B)
5
Gradation Z.
105 o
130
ZAV - Dens;ty curve(Avg. app. sp. g'.~2.':>9) 125Gradation X,:>
lOS' I I; I I.o 5 10 15 20
MOISTURE CONTENTIN PERCENT OF DRY WT.
( A)
12':>
130
t-
tl 120r.....\1\
\
m...J
120
>--------
t-
\1\ 115zuJ0
"'\
~I
11':>
110~/x
, 110
FIG.4.lO MOISTURE- DENSITY RELATIONSHIP: (A) FOR GRADATION Xs (B) FOR. GRADATION Z. ~. .I'l "- _...•
, .•.." _J

56
value of the compacted mixture. The test was performed follow-
ing the orocedure in A5TM DIB83-73 and AASHO T-193-63. The
moisture content during compaction was maintained to be
optimum, Six samples were prepared at a particular compactive
effort. The dry densities of the compacted specimens were
measured, The compacted specimens were ,subjected to. four
days soaking period applying 10 Ibs surcharge and providing
swell measuring arrangements, :owell measured after the soaking
period was very negligible. Soaked specimens after 15 minutes
of free drainage were tested in the te1ting machines (Figure,C-l to C-6 in Appendix-C). After plotting the data in Figs.4,ll -
4.16 corrected soaked CSR values were ~btained. For all the
samples CBR values at 0,1 inch penetration are higher than the
values at 0,2 inch penetration, with different compactive
efforts, dry density and CSR values ar~ plotted in Figs, 4.17
to 4,19, The CRR values for 100 percent standard AASHO maximum,"Idensities were obtained from CSR-density plots and compared
for different gradations in Table 4,3.
4,3 Effect of Fines on CSR Values
By varying the percent fines from zero to twenty in
gradation Z, CBR values were determined with gas burnt picked
jhama bricks, The results of this investigation are tabulated
in Table 4,4 and plotted in Figs. 4,20a ~ 4,20c, The percent
fines versus CBR and dry density are plotted in Fig, 4,21,

2S002S00
._---~----•••••~
~
r:r40')
-:-0)'1-'~ 1.e~ ,)
~
e c..&R::;.4fDi"
GO el-O I ..;
\B eJ-ow~ ,G'e,:z.::.4oi'. '."
0'2
PENElRATION IN INCHES~
lS00
1000
2000
0'4
.r
0'3
,QI.-olN';' eeR:O ':>0'/.
~o..... .,~tr156L-Dw' ,ceR=c39/,
o ,{,cP<iL-:-0 .....,
'l'l!!>'e>••.•o",">
0'2
PENETRATION IN IN CHES~..L-~-"
0"
FIG.4.11a CBR FOR DIFFERENT SPECIMENS OF GAS BURNT PICKED JHAMA BRICK (GRADATION xtl/"
Via..T lS00
2000
zwa..o....wi 1000'uz«•...VlVlW0::
.' .~ 7:_~-'--':""- - -".-__.,; .:~ :-'~"'=--.~-: -"~=0

~, - ,--~~-
2500 2500
O'L,0.30'2Ocr0'1,0'30'2
2000r- .\ . LOOO,,">
~
.,.,,'O~ <Vc/o
'Il'!>' ~'~,,0 0.•••Vl '0 '0••.•a- 1500 j/ 1500 ",'?.z
".>wa- -?-o' ./
0 ~. - .;,.~.;I. '" ~ 491'c.?>•....!l}q '0""'- ';'J ~ •'tIe;;"C; ~\..PW 1000 e\..o 1000 ---- ___ '?J"u '?>O
Z0'" ~ 51':.,,3'31.<l: ~O' eL-o ••••~' c.•... •••
Vl Y \5 'OL.OW:> , C.5R: 4-z.1. •••.•• \?0« ,~VlW0:, SOOt- ~- -,- - Y'l' ,.;.....-- SOO~---
PENETRATION IN INCHES•• PENETRATION IN INCHES
""FIG.4.11b CBR FOR DIFFERENT SPECIMENS OF GAS BURNT PICKED JHAMA BRIGcK- lGRADATION Xl.) ~
,--..'-- -----......;\.•
~.-..--,... ) --~

'"
2 500 2500
2000 2000
I I II i I
II I I I I I0-' 0'2 0"3Cl'~o
O' ~'0'3O'Loo
lilt ~ ~ee;I', ~ 'fn. "'-' e'3 '1500 c,'" . ",R" ¥-'i. «>,,0<''''' 1500 0"'''' ' c,"'~w ",<:> e>" .....~
n.
o<-
7'w 1000 - </)" ~~ _ _ _ _ __ ,,"e, CBR ,,4B'/. 1000t Y eeR= 1,94: '" \..P " 0 y/ e ,t- 1'"30 - - - - - - - ~o B'-III I ~\\III ","Wi,,"'" l'3e\-owe,.CBR=-~ai'. ' ",,, ..0::1 c~~ ' ?",.>\o~ 0 I I "'.~ \",B~O'N"" cel{~:;"'.l,
500
PENETRATION IN INCHES PENETRA TION IN INCHES•••FIG.4.11c CBR FOR DIFFERENT SPECIMENS OF GAS BURNT PICKED JHAMA BRICK (GRADATION XI)
ltd
IIi -- ,1

--
2500 2500
2000'- 2000
\'5 e\...o"" ~, ceR:::' 34./.
~o.",\...ow~,c.eR~ "'''1.
IY'I,
'Bl..Owoz" c.eR.::' '30.
0')
'''' e.\...o"'" c."R ~ 39 ~!,
oo
500
1000
1500
0'40'3
C- '0"- -= 'Bw 'f. "-~;••0-tJ:;;.,:
",'" :--- 'f..
I
0'20'1
1000
1500~
V'lC-
.zwC-
o>-
wuZ<>-V'l
Vlwa::
PENETRATION IN INCH~S PENETRATION IN INCHE..?
FIG.4.12aCBR FOR DIFFERENT SPECIMENS OF GAS BURNT PICKED JHAMA BRICK (GRADATION X2.)C1\o
'Ii;'", ~

,~
2500.- 2500
0'40'2 003
PENETRATION IN INCHES••
2000
0- "0'2 0-3
PENETRATION IN INCHESI
2000
",{,c.""",'3'Cl'Z>'1500L - '0,-0
<b-~.,~t.1~'1 1'/,
_l.ll.
-'"c.1!l1l -
c..'B~-
.'> ~••••••
",••.•0
... e\..o'?Jo: 1000~ _____
'!> •• 1-
• 4\'/.
~ ~,C""R~0"- J >
o~ e.~o~
0
•• \'5
~~. I
",<1"', . ~(), I~
~1000
'0,-0 °W
15 I
u --
o ,
ZoCt
500
~VlVlw
500 --a::
FIG.4.12b CBR F'OR DIFFERENT SPECIMENS OF GAS .BURNT PICKED JHAMA BRICK (GRADATION Xl)
.;
~
.~~}. "'<::.-:l 'C:::)
a>.•.•.,~ ::.
--,--",.

2'5002'500
2000200
0'40'30"2 .0'1o0'40'30'20'1
o o
lIl1 . ~ <:-el'- __O)'2:/O I eFl':c9!+'{'
~ lS00. e\o-o'('l~' 1. 15001- (o~e"'O'fl~'Cz ~~wa.
~
~ 1000 oW'e.cep;:.loei" 1000~ / c:.eQ.:c1<9"f.Z '!)o el- . - - - -' el-o'l'ltl •<t ~c>.1 ~ c&R_::' ?le;t. . . '!>o
til 9.... ISeL-O'I'I ' I f I e;- , "III '!) l'\.O,I~ • 9.... e\.OWtl ,C&R:37,.w 9"" I ~ ," P.> 0 0cr _ u ~ I .. , .••0, .
500
PENETRATION IN INCHESJlov PENETRATION IN INCHES
II>
FIG.4.12c CBR FOR DIFFERENT SPECIMENS OF GAS BURNT PICKED JHAMA BRICK (GRADATION X21.)'
.~' ~.:-"j
! ,..- :< ~ ,
jCD.N
, ..," ~

...
S-~72--~,
2500 2500
2000 2000
0'40'30'20"10"1,0'30'2oo
l/l
0-1 1500r c~ 1500~...l~'Zl1J0-f2
Y • ",0 'f.l1J 1000 ~.
c'B~ -
lOOO~ 7'"u
-----;.' .,., oW5 '
~ ~,?>O e\-
O~':l'Z _____ _ ~o 'i3\..<l:w~ ' caR:' "'37{. I '"o~ w" CeR~ ,oi',
t-I ",l/lI .,'< \ ':) T3 \..0 --0--- J .•.• ~. '5 aLO ----Cl_l/l ' ,
,~ ()
l1J0::, 5001=----,,1-- -'-7(' ~ 50
PENETRATION IN INCHES~ PENETRATION IN INCHES
, "':)'
FIG.I,.r3a CBR FOR DIFFERENT SRECtMENS OF GAS BURNT PICKED JHAMA
--BRICK (GRADATION X3l enw
,i,

~
\
2500 2500
2000 2000
O'l,OC10'2O'l,0'30'20'1
il 15°°1'2.'"
150°1_ &11,
~~t.6~-•••••"," . e"oe"o fI>">,.<;
c..0•....•
1000rw 1000 r c"~ ~ 48'/'u
ceR = 47.'/.e>~o,"~I _____ r-
Z "" "!10 A< ow'eJ .•....• ,,0 el.:VI
~ I I I ~~+-~ BL-O"'f>, I C.6Jt:. ~~7,VI 'i"" A BLOWS. c.aR = 34."1, I ,<;w ,_<l _ ,~ '15'a: 500
PENETRATION IN INCHES PENETRATION IN INCHES---FIG.4.13b CBR FOR DIFFERENT SPECIMENS OF GAS BURNT PICKED JHAMA BRICK (GRADATION X)
0>ZOo
:/'~.-{ --'"

.,
2500 2500
2000 2000
o ~
e\..oW5, ceR==-~\'I.
03
\'3 e\.-OW~' caR'::. 3(,°/,~-
~
o 2o 1o ~0302o 1oo
~I 1500~ ~~ c"'''' 1500"'~.'0\-0 .
Z' , ",'!> ~W(L
0t-
wi 1000uz r---]f<l: 'fI~ cllR= 41'/.t- 30 8\..0, 4_III
~ .lil •.....~~~ \5 a\..OW~ J C8R -= 31 'I.e:: 500
FIG.4.1"3c CBR FOR DIFFERENT SPECIMENS OF GAS BURNT PICKED JHAMA BRICK (GRADATION X3),PENETRATION IN INCHES PENETRATION IN INCHES
-.enU'l

" ~.--:;
25002500
0'40'30'2PENETRATION IN INCHES. -
0'10'40"30'2PENETRATION IN INCHES
••
0'1oo
2000,2000
_ \07.'1'
IS,J~~
5t lSOO~
c.:a'\1.- "' ••. -'1'15' c.13,-0 O"~' ~
~C/'-wa..0~ -----/ <.,,1<='5?>'/.W 1000 ovl!:; I
1000u '30 el.z II I -j: w"', <.8" = 49'/.< I' el-o0.""1 ?>ol- I "', '" \'5 el-oW5. e"" = 4<;'Y, 'o'~Vl- I e.,'1YA"'" " 131-0"" , C8"; 4si'.Vl ' 0 ~,",' 113
Wa::: I 500. ., - 500
FIG.4.14a CBR FOR DIFFERENT SPECIMENS OF (,AS BURNT PICKED JHAMA enBRICK (GRADATION X4) en
'"-t.:...
",
t•

2500
"'
0'2_1-0") 0"4
2500
0"2 0') 0"4
PENETRATION IN INCHES. ~ PENETRATION IN INCHES
FIG.4,14b CBR FOR DIFFERENT SPECIMENS OF GAS BURNT PICKED JHAMA BRICK (GRADATION X4) '""

,iT
L~
J
2500 2S00
t'
2000 2000
0' "0']
150aLO,"~ ,CbR ':. 411.
~o eL-o"''''c ~ ~'50'/.-
0'2
_,00'/'
~o. ~,,'
C')</
0'10'"
1500
_\..o ••~~/,~~' -'IS t!>'-o"" ,c.llR ~~~'I.1000
.0']0'20'1oo
Vl
~I 1500zwa..oI-wi 1000 _uz<l:I-VlVlWcr I SOO
PENETRATION IN INCHES•• PENETRATION IN INCHES
FIG.4.14c CBR FOR DIFFERENT SPECIMENS OF GAS BURNT PICKED JHAMA BRICK (GRADATION X,)~
"

2500 2500
O! I,0""30'20"ooO'l,0'30"20"1
0_0'
2000r 2000
CD'/'~, '(2.~ec.~1500 "" f> •",0 . 1500
1
.,'?>c6t:<. - 87:/'Z '"W B~o~~~ ~
a.. \CO'"
O'0
..;:.>- ~.w 1000 V)« , 000u eel'<::' /),0'/.z« IPw"'" r------ -- :e "/ eLoWe. , C8R ::.4'"/,>- ~o ceo\<.= "3co • .III e.L.-o Y'4 ~ ) "30
III,<;
500 I ~w
I","'" 1'3 B'-OW"" caR= 3"1-
a: 500 ~ _~.~.~9 0
PENETRATION IN INCHEStao PENETRATION IN INCH~S
FIG.l,.11SaCBR FOR DIFFERENT SPECIMENS OF GAS BURNT PICKED JHAMA BRICK (GRADATION Xs) ~
.' .

.,
-:-:;
2':>00 2':>00
2000 2000
r.'" ~I-Ow"" CllR~73'{'
30 a\..ow ~ • c. 8~:'40"/.ti '\1'3 aI-oWl), ell" =34'{.
0'4
1'3BLOW'. CBR:3oi'.
0'3
30
"1.-0"'''' c."'" 3""/'
Co"It = .,,,,1,e\..o"'~.•
••<'
~f"".~O.15o
0-20-100
1':>00
0- 40'3
VI
~I 1':>00.zI.LI11.
gtlll000z~VIVII.LIQ:
PENETRATION IN INCHES1>= PENETRATION IN INCH~.S
FIG.4.1SbCBR FOR DIFFERENT SPECIMENS OF GAS BURNT PICKED JHAMA BRICK (GRADATION Xs) ;.;.;, 0
I.

..
2500 2500
2000 2000
0;40'30'1,0'30'1oa
V'l
a..J 1500i 1500.z 0°; twa.. c.eR =- r
.p\-ow" ,g ,,'5
LJ.l 1000 1000 ~ t.. '?J'J.'OR-
U '("t'epcZ e\-o<l: LOWD, c13R" lto.f, ~o>- ~o e ~ _~I'(,V'l ,- ." 3 1 q~. e~ow~,c6~•i1J t-\Q e.\.-ow~,c..eR.-::::_O::. 0 •
". 15 '? .n \'5a:: 500 ,,"< .o'~ e SOD,. .
PENETRATION IN INCHES1Io
PENETRATION IN INCHES••FIG.I,.15cCBR FOR DIFFERENT SPECIMENS OF GAS BURNT PICKED JHAMA BRICK (GRADATION XS>
,-~...-..-~,, '
1/'~

0'40'30'20'1o oO'~0'30-20'1
2500r ....¥" 2500
,\,01,
~~4:-0
20001- OJ'/ 2000o~~v
"'"IIIG- 1500 1500z l Y
_ ,,0 'I.w ----yG- eaR-_ 5 '!>'f ' -otl'" ,
0
~
'0,,0I- ---- ,,0'1'15•
,?OW 1000 30 e 1000uz
~I I I I~ \5 B\..ow,",) ee>R=40/.OJ"?
1IIIWcrt 5001- I ,.)1 ....------ 500
PENETRATION IN INCHES PENETRATION IN INCHES•••FIG.4.16aCBR FOR DIFFERENT SPECIMENS OF GAS BURNT PICKED JHAMA BRICK (GRADATION Z)
;j
.:~. - ~'s. .

PENETRATION IN INCHES•
0'4
\'3 e,-OWf> , ceR:; 45'l.
~_ (0'/."/'
~""c,'O -e>"o
"!)o
•••
0'3IN INCHES
_ \,'!I'I'
,,'0 'i'--.;."> '
,,0~<t>
C;
0'1 0' 2
PENETRATION
500
ao
2500
1500
2000
1000
0'1,0'3
'_0'1,~o::."'"
c.~.,.'!>''(>,,0
~O
,\ '","",'~Q-
(J
"J'o~
<iTv"
0'20'1
W] 1000uz<l:r--Ul
I{]cr:
2000
1500Ul0..
2500
.zW
,0..
..~/
...•FIG.I,.16 b CBR FOR DIFFERENT SPECIMENS OF GAS BURNT PICKED JHAMA BRICK (GRADATION Z) W
;j

-.
,
0'1,
_(oil'e1"--
,;\" , c.<bvo
0'3
-eo?----:"G
~'o-tl
<bY<,
C9
0'2
r..~o~.q
t?
0'1o o
500 _•
1500
1000
2500
2000
0'1,0"3
'?:J~~el.
\'5 e\.-OW~1 c'O'r'<-:'4'5/.
0'2
-<;-.0 ~"
'<~:~
0'1
2500
2000
ViCL.
11500
zwCL
0•....wi 1000(Jz<•....V!VlWcr
PENETRATION IN INCHES•• PENET RATION IN INCHES;10 ••••••~
FIG.4,16c CBR FOR DIFFERENT SPECIMEN OF GAS BURNT PICKED JHAMA BRICK .(GRADATION Z )
o./~...I~. - \ ...• \. :,

-'
"
120 120
100
1201'5"0
60
80
30105
1,0
100
120
II .IJ
IIIIIIIII
115110
60
80~- - - - - ---------
1,0
30105
~
~f-ZWucrWQ.
crCOu
ow:x:~III
DRY DENS~Y AS MOLDED!PC~
IN
FIG.~.'~ C6R
DRY DENSITY AS MOL DED. PCF~
IS)
DENSITY RELATION: IA) GRADATION X, CB) GRADATION,. X2
...•""
F)1/ .~- ...•
"

~zwua::w0.
a::enu
ow:.::<oVI
;
125
lOa
80
60
~o
125
100
80
60
~O
~ 'I
~;.- --'..i
105 110 115 120 lOS 110 115 120
DRY DENSITY AS MOLDED. PCL
l A)DRY DENSITY AS MOLDED, PCF••
( B)•••••~
~I
;/
FIG.4.1HBR DENSIlY RELATION:{A) GRADATION X]lB) GRADATION'X4 i:,
~ .•..-----.;..T_~_'t.

-~,.~=--~:-~,.
120115110
/'0
80
30lOS
60
120
100
12011511030lOS
/'0
120
100
,
•....ZQJul 80crWll.
et:' ~------------ ..•..alu 60aw::c<loIII
FIG. 1<.19 CBROENSITY RELATION: (A) GRADATION Xs (B.) GRADATio'N Z
fJ
DRY DENSITY AS MOL DED, PCF~
(A)
DRY DENSITY AS MOLDED,PCF•
(8) ..,..., ..
. ~...--:~ - -..!.
'~-~--.--1

IIIlL
zWlL
o~wuZ<l:~Vl
IIIW0::
"
2500
2000
1500
1000
0'2
,c..efZ~~'
~ft'" A5/.c.'" f>. -=- 44'; 1.
0'3 O'l,
2500
2000
1500
1000
SOD
0'2
~_",,,.5'/'c.~ee.l'l = (,,2.5'1.
c'B~-=:'~o.O"/.cel"-'" '57.0/.
0'3 0"
PEN ETRAT ION IN INC H E 5
( A)
PENETRATION IN INCHES••(8 ) -..l
ao
..~i~f
FIG.~.20QC8R FOR DIFFERENT PERCENT OF FINES~(A) O'/.FINES (8) l,"l.FINES

VlCl.~
ZUJCl.
o>-UJuz«>-Vl
VlUJcr
2500
2000
1500
1000
500
,II11'1IIIIJI'I11II1I1I
_I0'1 0'2 0'3 0'4
2500
2000
1500
1000
500
00
,IIII
1"1
illI,ll
JUII
I ,III
0'1 0'2 0-3 0'4
.>
FIG.4.20b CBR FOR' DIFFERENT PERCENT OF FINES~.(A} 8°/. FINES (B) 12~. FINES
-.<>•. 'I>:'.~-tI?>.
PENETRATION IN INCHESIIJ
(A)PENETRATION IN INCHES•
(B) -..ll- •U) Ii,
II.,-~
...-fi

2500 2500
2000 2000
0.'40')I
0'2
III0-, 1~UUr- 0.%' 0~ --- 1500u _~, ._0.zW0-00-
W(JZ«V;-IIIWcr, r~~ IIII , ,
500
-
PENETRATION IN INCHES••IA)
FIG.I,.20c CBR FOR DIFFERENT PERCENT OF FINES~ lA)
PENETRATION IN INCHES110
(B )
16%FINES (S) 20'10 FINEScoo
•j.y~

110125
120:-------,~90
DRY
~115 lL
~
u
z 70
0-
ILlU
""~
0::
~
ILl
VI
0-
Zz
110 ~50
~el
0::0
II /"
10530
'0 o I, 8 12 16 20tOO
24PERCENT FINES ••
FIG.4.2t CBR DRY DENSITY PERCENT FINES RELATION e'"'
-~ ~
.' " ,F,

, 82
Table 4.3 CBR~Uensity-Gradation Relationship
Optimum Maximum CBR at 100
Gradation moisture dry density percent maximumcontent standard AA5HO densitypercent AA5HO percent
Ib/c ft
Xl 13.0 117.9 79 .5
X 12.5 117.0' 71.02
X] 13.5 118.0 77.5
X4 12.5 120.5 87.0
X5 13.0 116.5 65.0
l 13.0 119.0 97.0
Table 4.4 CBR-Density-Percent fines Relationship

83
4.4 CSR for Different Types of Agoregates
Sahd and soil were mixed with crushed chips of coal
burnt picked jhama brick, first class brick, third class
brick and crushed stone in gradation L fdr the comparison
of their stabilities in terms of CBR values, The molds were
compacted in accordance with standard AASHO procedure applying
optimum moisture content, The moistur~ content density rela-
tionships of these materials are shown in Fig, 4.22. The CSR
graphs of mixtures containing crushed stone. coal burnt
picked j hama brick, first class brick. third class brick are
shown in Figs, 4.23, 4.24, 4.25, and 4.26 respectively. The
CSR density relationships for crushed stone and coal burnt
picked jhama brick are shown in Fig, 4,27 and those for first
class brick and third class brick are shown in Fig. 4.28. The
penetration and resistance to penetration relations are shown
in Table A-l to A-IO in Appendix-A, The stability in terms of
CBR value of these materials are compared with that of gas
burnt picked jhama brick in Table 4.5.
Table 4.5 CBR for Different Types of Materials
ParameterGas burntpick edj hamabri ck
Coalburntpickedj hamabrick
Firstclassb ri ck
Thirdclassbrick
Crushedstone
Optimummoisture 13,0 14.5 15,0 16.5 10.5contentin percent-, Maximum dry-densi ty, 119,0 118.74 115,6 113.5 149.0Ib/ c ft
CSR valu e 97,0 74,0 62.5 42.0 94.0in percent

•• '/
I SO, _ ~ _ 125
201510s
10':1
2015105
110
lLOI- '", 120
rl-
I!.e.>
"Vl
~J 1301 I 11':1
>-I-
VlZW0,
1201 ' I 110>-a:0
MOISTURE CONTENT INIo
PERCENT OF DRY WT.
MOISTURE CON-lENT' IN ;0
PERCE'NT OF DRY WT.
llI>~
FIG.4.22 MOISTURE CONTENT - DENSITY RELATIONSHIP ( GRADATION - Z)
.,. .. ---~_ ..•'..-.~,_.--------- __~<""';;;-=-.c~::".: :-(

) '/
25002500
PENETRATION IN INCHES
•O'~
R" lOG>,/.c..B",', •••\..O~ .,
O~ ~COI.~ R '=-c.'"
n.PENETRATION IN INCHES
2000
1000
1500
O'~0'3
15 BLOWS. CBR.."" 9 'j,
e'-o'{i '" , C \3Y> ~ (PI 1.~o A _
0'20'1
2000
~.1500~zUJll.
gtjl 1000z«(
~V1
VIUJa::
FIG.4.23QCBR FOR DIFFERENT SPECIMENS OF CRUSHED STONE (GRADATION Z) CD
'"..,
-. ~- -.~ --- - .- - -~-y--~"-'~ - =-=--~...,.._, .-~:":::;;i-.~

,f ,)
250 2500
0'40'3
ro'" e\.o"'''"' ceR~ 104'f'JL
\< ~~~~. ...,.X~
x
~
eR-:'CtJ'l'"
~
~o'2o\.o"'''''
,0 A~o.
".'''/"'~/' , ,') '20\.0'<15 ,cBR> s,Y.
0,,"0.1'
'" ","'-
0'40-30-20_o
200~
~
2000~'"c""
'" '" ''0"';'0..",,<'- ~/VlCL 1500 1500~ 0'. "z !'UJ
CL
0 - roOf'•...UJ 1000 ;" '0 "';;'''' '""- •. 1000u I • '? R~ '30{.Z I ..,.,o~ Low5,c.a 0<t _~. A '-:' '6•... IVl I\II
~I 500L- - L - .A.i.../'" 500
PENETRATION IN IN£H PENETRATION IN IN<;J:iCJ>en
FIG.4.23b CBR FOR DIFfERENT SPECIMENS OF CRUSHED StONE (GRADATlON.Z)...•.;-~'
\,
--;;-- -'- -.:-.::.-~o.:;_ ----.:_-~~ ~ '7" ~-==.:.:q.l

,I ,/
2500 2500
0"0"3
PENETRATION IN INCHES1lIo
o0'40'30'2PENETRATION IN INCHES•
0'1o o
200Qt- 2000.
~-G'6~ -'tJ 0 )
~V\
~a.. (p;'1500 1500 0'~ ~oy1- ""Z 1w
'"""'f,a.. r c'OR",-sa1.~
0 -- - -- • ~ '2:>,•.... -- ---- e'--Ow 1000 -1'1 1000 ;: ~ R""""/'U c.BZ / I \\ A
''':- .Co. 8LO'fl!l1
~ I "c,' ",5 caR =- 491.~. 1'5 ~LO ,V\-V\W0::, 5001--- -1- ~ J:J../ 500
c'~. ,,
FIG.4,23c CBR FOR DIFFE RENT SPECI MENS OF CRUSHED STONE (GRADATION Z ) .'ClO"'4.
.~-

'.I '/
2500 2500
2000 2000
l/)
O;.T 1500zUJIl.
o0-
PENETRATION IN INCHESil>
0"4
5. cBR -=-, 4S'.
ceR -:.a s1.:A..-'::.--
0'3
\~eLO'''' , C6R- 34"/_...:.0 - 0 .
0"2
PENETRATION IN INCHES••0"'
500
1500
1000
0'40'3
.~c ",-oV<5,CeR= 4""7'.;;...--A- .••••••
15 BLOW". CBR = '371.
0'20'1
1000UJUZ<{0-l/)
lila::
FIG.4.2J,llC8R FOR DIFFERENT SPECIMENS OF COAL BURNT PiCKED JHAMA BRICK ,(GRADATION Zl
QIloQIIl
;;{ /~" .•. ' _-:'. """-
-.~~-- - - --- ---~~~---- ------"J".."--- ---~-~- -~ ----
--!
_J'

~ , ,->
2'500 2'500
2000
O'l,
10; BL.O""~' G",,'R.,,"31'/.
0-3
~
'" ceR:::.~ol.0..\...0'''' ---
~o ~",
~
9R" <3\'I.'/._
(.~~'7
0'20'1
Ii=-l--J~'
o o
'500
lOCO
1'500
0'4
\'5 51.-0'<'''''' <:-BR" 3'2.'/.
0'3
c.'3\'<. ~ '5~'/.~o e\..o'tle> ,
~ :;.0,'1' _C\?'- ~'/.
~~'.0,-°(c0
~O' I')
0.20-1
2000
U14 1'500-~•zW0-0••••. 1 1000wuz«t-~U1w
'5000::1
PENE1RA110N IN INCHES PENE1RA110N IN INCHES-FIG.4.24b CBR FOR DIFFEREN1 SPEC IMENS OF COAL BURN1 PICKED JHAMA BRICK (GRADAlION Z) ~
.£,~)II'..:,..".J.,:" ~. - ~
.~.,......,.,. ..
-_.....-.-."".-'-~ ~j;.'

'J -"
2500 2500
2000! 2000
0'1,
u
0'3
30 eLOWS , CEIR '" 47/...,- .~-
ce~--83'/.p~;;::---~-
0-20,10'1,0'30'2
~T 1500r-'" 0~ 1500
zw0..0 f"Y c6R ,,-'So'l.I-
w 1000 (/) 'O\-o'l'/~' ~ 1000uZ -----[ '~
<{ ~ , ~ - "l- I ,,0 - e-BR - ,:>7'/Vl 1.,..' '5 'BI.-OW5,
.1 _ C • \11lW0::' 50Q;
PENETRA TION IN INCHES••
PENETRATION IN INCHES•••
FIG,I,,24c CBR FOR DIFFERENT SPECIMENS OF COAL BURNT PICKED JHAMA BRICK (GRADATION Zl• J,t f:""
, ,,;:--.--.,::,; \.I ./~
<Do

.<j1 , ,> > ,
2500 2500
2000 2000
0'40'30'2oo0'40'30'2oo
~t1500~
\?),I •.•. --1500
c"..~'. •••0
z c••••..".,.8'" c." ~wCL
O'll'!) •
0
<0'1 e\.
0-
W 1000 ru1000
_.,B'/,
Z+" 'l\~'
c.e"-
-< c.8R~.,<o'I, .J e'-o
0- - - - --;0
If)6\.0\'1 ~ •
-- - -
If)~o /:w "0.1 _ 2.'/.'1, ..~o/ caR ~2.9'1.
a:::~'
\~ -eLO'ri~• cuR ~ 0
500.,~ '8'-0"'& •
•.. _~- "'0 .~ 6 500\~
PENETRATION IN INCHES- PENETRATION IN INCHES••FIG.4.2Sa CBR FOR DIFFERENT SPECIMENS OF FIRST CLASS BRICK (GRADATION Z
~~~
~ . 'j.
!
~.
j

,
2500 2500
2000 2000
ef'. - At)'/,A,Oe"'o"'''''c - 1000
0'40')
O'llS- C~R:,o'l
~'S llLO'llS, C»R~,1'1,
0'20'1o o
500
1500
0"4
\? e\..O'H~ lc.eR=~o'I.
0')
~
'"_ Co'Il_~ '" ",0
"..s' -'" •• 9>~"I:'
sf""O ,s 0
0'20"oo
1000
1500ZllJc..
~llJuZ«t-V>V>llJa::
V>c..
PENETRATION IN -INCHES-------------'~PENETRATION IN INCHES-
FIG,4,25b CBR FOR DIFFERENT SPECIMENS OF FIRST CLASS BRICK (.GRADATION Z ) oQ•••••
,6--;l:~
-",~r

, >
2500 2500
0'40'30-20'40'30'20"oo
200or- 20001-_-79'\'0;<-c.eo~,I
__r"'- I 'Ol",.c..eR-
,-01500
•.•~\J'::I' _~ .••..,.." ",<' ~
ZW0-
0t-
W 10001000~ /u eeR-=3?'f.
Z« caR = ~r:.'I,
\,..o'fl':>'~o et-
"306L.O"M~1 4 ------ C1!~R= 28'/-Vl ~- ~\II
\~ _6\..O't4~)
W,.. , '
'?)'f 1'3 el.OW& J caR = '?.77.0:: 500 ••.• \wr Q d 500
FIG.4.25cCBR FOR DIFFERENT SPECIMENS OF FIRST CLASS BRICK (GRADATION, Z J
,><>
PENETRATION IN INCHES•PENETRATION IN INCHES••
'"••• ,-~~j
~. 1"

, >
2500 2500
2000 2000
PENETRATION IN INCHES"
0'1,
o.r .Co'e 'R = 3.we>.o~\..e:...-- _24 '{,
3~ ce~-o.-"' .. -\..0""\., '"
,,5 e\.-o"""" c.", ••.=-571.
0'3
PENETRATION IN INCHES
o
1500
1000
0'1,0'3
,0 6\.-oW5, G~R",,4'/'~\'5 B\.-oW~. c.BR =- 2'5"/'~_---<l
Bl<",,?<i/'",,~IC.
'0••••0(p"
0"20-1oo
Ulc...~ I 1500.zwc...
0•....w 11000uz<!•....UlVlW0:, 500
.'1:"j:
FIG.t; •.26a CBR FOR DIFFERENT SPECIMENS OF THIRD CLASS BRICK (GRADATION Z)
•
oD
'" ,',::;r
;!,...,
'",~[cf~

, ,
2500 2S00
2000 2000
O'~0'300
VI1S00..T 1S001-~.
zw~
1000L
f>- s"'/'c.BR -;:.55/.0 ",~.Ge -t- e •.OW~' - e\.O",5 (,,">W 1000 "u '!> j.Z ,,0 . GB~=: 37/. I V f>-~4'I,<l: .•... eI-0",5. ,?,,' , 1-0""~'Cea. -t- 0'1. '3° '" :30 eoVIVI
\'3 51-OW". caR" 23/.w - ----sOar0:: sao o ~ }'I .~ 51-OWe>. GeR." 21'/.
'5.J" 0
FIG.';~26~ CaR FOR DIFFERENT SPECIMENS OF THIRD CLASS BRICK (GRADATION Z
PENETRATION IN INCHES PENETRATION IN INCHESlIo- ..,
'"-i- •... ,':-
-~:-~"'
-~~;0;;;,
._- ._~:_ -;~~--:- -,.o~,-_-_. - 'j

- •
2500 2500
2000 2000
Vl11. 150 1500~
I I0'3 O'~
'''' 6J..OW';' Ce>R='2.'2.'/.-cr-
6,-0'1'15' C6R" 31- 'f.3°
e,-o'l<';'c eR" ",'/.'1.
",S ~ 'f.
0'20'1
1000
O'~0'3
30 e\..O'//S" c.6R =. 33"/ .~=2.""I.
.~r_ C.BR=.53'/'c:a.\..O" ':J' '
[0<' u
0'2
500
oo
100wuZ<•....VlVlW0:
zW11.
o•....
PENETRATION IN IN CHES•••PENETRATION IN INCHES•
..,;;-~-
FIG.4.26e'CBR FOR DIFFERENT SPECIMENS OF THIRD CLASS. BRICK (GRADATION Z)oj)
'" :r."_.__::'"-:---_.. -'-. r]
.=-.-~--- J

120 120,
1201151101051S 515011,511,0
100t- I rooT
t=zwuct:
~BOI- I I 80
I 1-- - -- - - - - - - - - - - - - --Ict:CDu
BI 60, / I 60::.:::.q:0VlI ~J/ I
II ~o
DRY DENSI1Y AS MOL DED, PCF.
( A)
DRY DENSI1Y AS MOLDED, PCF_
(B)
:.:,.' .~{:..~.-"
FIG.4.27 CBR DENSI1Y RELATION: (Al CRUSHED STONE (8) COAL BURNT
E ~ R ~
PICKED JHAMA\P-.t
1,,

~;~~:]-,~;-~
100 100
eoBO
t-
Z~, GOr- --- -----)1 GO~ , IW~ I
I
;1 II
1,0 I 1,0
0I
w I::<: I<f , I0 IVl
20 I 20III
105 110 115 120 105 110 115 120
DRY DENSITY AS MOLDED,PCF ••( A)
DRY DENSITY AS MOLDED,PCF ••
( B)
I,'"/"
FIG.I".28C8R DENSITY RELATIONSHIP: (A) FIRST CLASS BRICK (8) THIRD CLASS BRICK0.000
1-~--J'
J:~,•

99
4.5 CBR at Uifferent Compactive Efforts
CBR molds were compacted at different compactive
efforts and soaked CBR values were determined. The mixtures
were taken in gradation Z for gas burnt picked jhama brick
aggregates and crushed stone. The values obtained are com-
pared in Table 4.6 and graphs of the. average CBR.'values are
shown in fig. 4.29.
Table 4.6 CBR-Compactive Effort Relation
Compactive CBR-value in perc eriteffortapplied in Gas burnt Cru shed stoneft-lb/cft pick ed ihama
56,000 156.0 169.0(Modi fied AASHO)
12,320 97.0 94.0(Standard AA SHO)
14,300 115.5 110.0
6,600 59.5 61.5
3,300 45.6 52.6
4.6 Decrease in Volume Aftar Compaction
for the mixture in gradation Z the volume of loose
mixture and the volu~e after compaction.was measured for
different specimens. The average decrease in volume after
compaction was 20 to 22 percent.
. '. -
• \. •• 1•••.
\:-~~.;~~

,
.'1./
,-",'
2500
)'-)
2500
Gradation= Z20001 .~~~
2000
I 7~}:i .'~"
1500F-~ ----- =I;! c,o({l<;l.
~~1500f---- --/
Sy..\)1'1'
~~o -lJJ
c,\<>~ c,'CIR-CL
0>--
lJJ -- -1-u 1000 1000z I I<{ I I>-- I I IVl I I- j I IVl
I IIJJ I I I I I0::
500 I II 500 I III I I II I I 1I I, I
I ,I I I I I
I I I I I I I 0 I I I0.1 0) 0) 0.'. 0 0,1 0) 0,3 0.'.
PENETRATION IN INCHES - PENETRATION IN INCHES •
.>~). j
j~..
FIG.429 CBR AT DIFFERENT COMPACTIVE EFFORTS
..I. .<
oo
,:i...?

101
4.6 Plasticity Characteristics
Plasticity characteristics of the soil binder in the
~ixture was determined. The liquid limit and plastic limit
tests were performed in accordance with A5TM/AN5l D423-66
(Reapproved in 1972) and ASTM/ANSl 424-59 (Reapproved in
1971) respectively. The material passing No. 40 sieve was
taken from the mixture for these determinations. Results
are shown in Appendix-C (Table C-12).
A hydrometer analysis of the fina portion of the
mixture was done eccording to the procedure described by
LAMB£(16). The result~ of this analysis is shown in Table 4.7
and in Table C-ll in Appendix-C.
Table 4.7 Results of Hydrometer Analysis of the Finesof the Mixture
D in m.m. 0.0699 0.052 0.037 0.0~4 0.019 0.014 0.01 0.00712
!!ii
r,I
t
Percentfiner 33.66 24.0 16.27 11.52 6.72 5.76 4.8
o
4~r~.. -:~_.

CHAPTER-5
ANALYSIS AND DISCUSSIONS OF TEST RESULTS
5.1 Appropriate Materials
For a dense mixture, the general requirements for
coarse and fin e aggr'egates ere that, •aggregates should
be hard, tough, durable and free frQm excess amount of flat
end elongeted pieces and vegetable particles or other organic
compounds'. From the results of the tests of coarse and fine
eggregates summarised in Table 3.2 and 3.3 it can be said
that the crushed brick aggregetes satiafy the general criteria
of the aggregates.
The quality of coarse aggregate is controlled by
specifying that the percentage of wear by Los Angeles
Abrasion test should not exceed 50 percent (According to
AA5HO) and 34 percent (according to BRRL) for high type
bituminoue pavement construction. Table 3.2 reveals that
all types of bricks for the study satisfy the requirements
of AASHTO but only gas burnt picked jhama bricks satisfy
ths requirement of BRRL. Tha percentage of wear for coal
burnt bricks slightly exceeds the BRRL limit.
5.2 Gradation
were selected with a view to obtaining the densest mixture
giving maximum stability. Gas burnt picked jhama aggregates

103
and sand-soil mixtures were used for obtaining these greda-
tions. The maximum dry density and the CBR values for these
mixtures are summarized in Table 4,3. The CBR curves for
all these gradations are presented in Figs, 4,11 to 4,16.
These curves are similar in nature indicating increasing
resistances for higher values of pe~etrations. But the
moisture density graphs shown in Figs. 4.8 to 4.10 are not
identical in shape and varies according to the finenesses
of the mixtures. Hie finer mixture gives sharper curve and
coaraer mixture have flater ones. The CBR values at 100
percent maximum AASHO density varies from 65.0 percent for
gradation X5 to 97.0 percent for gradation Z. A close study
of these results reveals that the CBR values increase es
the densities of the mixture increases and at maximum density V'there is maximum CBR value. rhe maximum CBR value is obtained
for gradation Z shown in the last column of Table 4,2.
The other requirements for, gradation by AASHO and TRRL
as discussed in Chapter 2 are that:
1) the fraction passing No. 200 sieve shall not be
greater than two thirds of the amount passing
No. 40 sieve;
ii) not less than lU percent should be retained between
each pair of successive sieves except for the top
two largast sieves,
The gradation I Z' satisfies all the above requirements.

104
5.3 Combination of Aggregates to Produce Gradation 'Z'
In most cases no suitable single aggregate may be
available to meet the requirements of gradation Z. In such
cases aggregates from diffarent sources may have to be
blended to meet the requirements of the specifications as
in gradation Z. The blending should be such that the compoei-
tion of the mixture which is to be designed must be within
the limits of the gradation.
The specified gradation Z employs 66.0 percent coarse
aggregates. 24.0 percent fine aggregates and lU.O percent
fines in the aggregate mixture. The author made an additional
study regarding the gradation of the hand crushed brick
aggregate sources in Bangladesh. The study is contained
in Appendix-B. It is found in the study that the crushed
brick aggregate obtained when the labours were assigned
to crush t inch downgrade is the suitable source to supply
most of the coarse aggregates anq some portion of the fine
a9gregates in gradation Z. To obtain the rest of the fine
aggregates and the fines of the mixture. a medium to coarse
sand and some soil were mixed with crushed bricK aggregatea.
The sand mey be c~assified as well graded (5W) according
to unified soil classification system. The value of the
uniformity coefficient C is 8.46 and that of gradationu
coefficient Cg is 2.34. The fineness modulus of the sand
is 2.80. The soil used in the blending is silty and plasticity
index is less than 6. The grain size distributione of the
II-I~I.I

105
components of the mixture are shown in Fig, B-1, The band
It is seen from the table that 70 percen. crushed
blending of crushed brick, sand and soil is found out,
Fig, B-2 which also shows the position of the blended
a job mix formula for theIn the Table 5,1
mixture within the band,
of the grain size distribution of gradation Z is shown in
brick aggregates. 20 percent of medium sand and 10 percent
crushed bricK aggregates, 20 percent of medium sand and
10 percent of silty soil are mixed, The combined aggregate
in the above percentage proportions falls within the
grading band of Gradation Z. In most sieve the value of
the percent finer. is very near to the mid point bf limits
of gradation Z, Hence the above percentages of the respectiva
aggregates may serve as a job mix formula to produce crushed
brick aggregate-sand~soil mixture in gradation Z,
5,4 Moisture Content
The moisture content-dry density relationships for six
mixtures shown in Figs, 4,B to 4,10 indicate that the density
increases with an increase in the moisture content, After
a certain percentage of moisture in the mixture, the dry-
density decreases with the increase of moisture, The moieture
contents for maximum densities for these mixtures varies
from 12,50 percent to 13,50 percent shown in Table 4,2.
'.-~

•
\
,, '/
Table 5.1 Job Mix Formula for Gradation Z.
Percent Passing
Contribu- Total Contribu- Total Contribu-tion in the tion in the tion in themix, 70% mix,20% mix, 10%
Sievesize
ttl max. sizecrushed brickaggregateTotal
MediumsandF,M=2,8o
Silty soil Combi-nedgrading
Midpoint
ofZ
Limi t5
ofZ,
.~\t;
..,~~
It" 100 70 100 20 100 10 100 97.5 95-100
i" " 70 19.0 100 20 100 10 79 80,0 70-90
t" n 22.4 100 20 100 10 52.4 59.0 50-68.No. 4 20 14.0 100 20 100 10 44,0 44.0 38-50
,
No. 8 13.5 4,55 30 6,0 ' 97 9,7 20,0 18.5 15-22
No, 200 1.5 1.05 3 0.60 87 8.7 10,35 10.0 8-12
•...o0\
/

107
For brick aggregates, it is said in artic~e 5.2 that
maximum CBR values are obtained at maximum dry densities
and the maximum dry density is obtained at optimum moisture
content. In other words it can be said that the maximum
CBR value is obtained when the mixture is compacted at
optimum moisture content. From the test results it is seen
that for gradation Z. the mixture with which maximum CBR
value is obtained has an optimum moisture content of 13.0
percent of the dry weight of the mixture. The maximum dry
density for this mixture at this moisture content is
119.0 lbs/cft.
5.5 Percent Fines
Like moisture content the amount of fines applied in
the eggregate-sand-~oil mixture controls the density of the
mixture and also the stability. An optimum amount of fines
which is just sufficient to fill most of the voids in
aggregate combination gives the maximum stability. For gas
burnt picked j hama brick-sand-soil mixtures, the CBR tests
were done by vsrying ths percentages of fines. Results are
shown in Fig. 4.21. The soaked CRR values for different
amount of fines are shown in Table 4.4.
It is seen in Fig. 4.21 that the maximum dry density
occurs' at 12.5 percent of fines whereas the maximum CBR
value is obtained at about 10 percent of fines. The maximum
", •.• '~

lOB
dry density at Dptimum mDisture CDntent and 10 percent finee
was 119.0 Ibs/cft fDr gradatiDn Z. But when the percent Df
fines was increased tD 12.5 percent the density increased
tD 121.5 Ibs/cft and the CSR value decreased by 2 percent.
Thus it can be seen that fines in excess Df Dptimum may
SDmetimes increase the density but aecreases the stability
Df the mixture.
5.6 CompactiDn
The density as well as the stability Df the mixture
is very much dependent Dn the cDmpactive effDrts applied
during compactiDn. The cDmpactive efforts applied by
standard AA5HO compactiDn method is 12,320 ft-lb/cft. The
loose mixture in gradation Z was compacted applying this
amount of effort. The volume of the loose mixture was
decreased by about 20 to 22 percent after compactiDn. The
density of the mixture increasea from 105.0 Ibs/cft to
119.0 Ibs/cft. From the compactive effDrt - CBR relationship
shawn in Table 4.6 it is seen that for gas burnt picked
jhame brick the CBR value at modified AA5HU compaction is
about 1.6 times the eBR at standard AA5HU compaction. The
compactive effort applied in modified AA5HO is 4.5 times
the standard AA5HO effort.
Crushed stone aggregates were alsO studied to have a
cDmparison with brick aggregates. Sand, silt and clay
fractiDns of sail were blended with hand crushed stone
••••• r"" .~
',,' C'-'!!-

109
aggregates in gradation l. The CBrt values were then deter-
mined following standard AASHU procedure. It is found in
Table 4.6 that at modified AASHU compaction the CBR value
is about 1.B times the CaR value at standard AASHO compaction.
From the results it is also observed that at lower compactive
efforts the crushed stone aggregate'mixture has comparatively
higher CBR values than brick aggregate mixture.
5.7 CaR fot Different Types of Aggregates
Four types of brick and stone aggregates were taken
for the comparative study. All the mixtures compacted were
in gradation Z. The physical properties 0 f these aggregate
types are shown in Tables 3.2 and 3.3. The maximum dry
density. CBR values for these materials are shown in
Table 4.5. A study of these fables indicates that the
higher the crushing strength, the higher is the CBR value.
For the crushed stone used CBR v~lue of 94 percent is
attained for gradation l. Among the four types of bricks.
the gas burnt picked jhama brick aggregate gives the maximum
CBR value, maximum dry density and minimum optimum moisture
content. The bricks classified here as third cless are
the under burnt low quality bricks collected from different
kilns. The average crushing strength of these bricks is
1375 psi and this aggregate gives the minimum CUR value of
42.0 percent at lUD percent standard AASHO density.

110
5.8 Plasticity Characteristics
With crushed brick or stone aggregates some sand and
soil were mixed to satisfy the designed gradation, Normally
the fines produced during hand crushing of bricks or stones
are nonplastic. The amount thus obtained is very small in
quantity. To have specified percentage of fines in the
mixture silt and clay fracfion of soil (material passing
No, 200 sieve) is used in the mixture. The combined mixture
may sometimes be plastic (PI greater than 6) if there is
excess clay particles, Hence plasticity tests were performed
according to standard procedure with the portion of the
mixture passing No, 40 sieve.
The plasticity tests described 1n article 4.6 shows
that the material used in this investigation fulfil the
requirements.
III
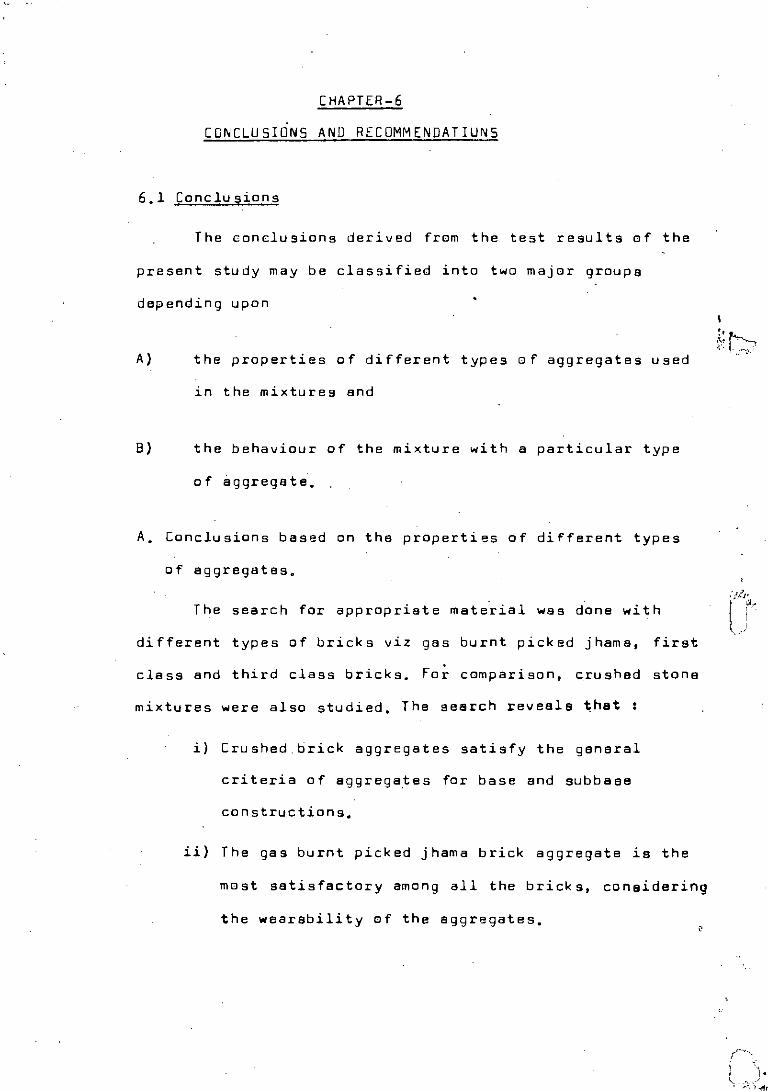
CHAPTER -6CONCLUSIONS AND RECOMMENDATIUNS
6.1 Conclusions
The conclusions derived from the test results of the
present study may be classified into two major groups
depending upon
A) the properties of different types of aggregates used
in the mixtures and
8) the behaviour of the mixture with a particular type
of aggregate.
A. Conclusions based on the properties of different types
of aggregates.
The search for appropriate material was done with
different types of bricks viz gas burnt picked jhama, first
class and third class bricks. Fo~ comparison, crushad stone
mixtures were also studied, The search reveals thst :
i) Crushed.brick aggregates satisfy the general
criteria of aggrega.tes for base and subbase
constructions.
ii) The gas burnt picked jhama brick aggregate is the
most satisfactory among all the bricks, considering
the wearsbility of the aggregates.

112
iii) Among four types of brick aggregate mixtures,
tha gas.burnt picked jhama brick aggregate mixture
has tha maximum density and minimum optimum moistura
content. When compacted in the standard AASHO
procedure the maximum drydensity is l19.q pounds.per cubic feet and the optimum moisture contant
is 13.0 percant. The mixture was compacted as in
grada~ioh Z shown in fable 6.1.
iv) Using suitable gradation, the CBH value of the
mixture is the most important characteristic for
the base or subbase constructions. The capacity
in terms of CSR value waS the highest for gas burnt
picked jhama brick aggregate mixture. The CBR value
at 100 percent standard AASHO compaction is found
to be 97.0 percant when the aggregates and soil
were mixed in gradation Z. TheCBR values for
other types of brick aggiegate mixtures were as
follows:
._-¥}
for coal burnt brick aggregate mixture: 74.U percent
for first class brick
for third class brick"
"
"
"
62.5 parcent
42.0 percent.
Although the CSR value for crushed stone aggregates
should be 100 percent, but in gradation Z, a CSR value of
only 94.0 percent is attained.

113
For base course constructions gas burnt brick
aggregate mixtures can be used satisfactorily.
For subbase course constructions, any type of the
brick aggregates can be used.
,B, Conclusions based on the behaviour of the mixture
with a particular type of aggregate mixture,
i) Gradation of the aggregate mixture is an important
factor determining the load carrying capacity of
base or subbase courses,
The gradation of the crushed brick sand and soil
mixture shown below in Table 6,1 gives the maximum CBR
valua and is suggested to be used in base or subbase
courseSe
Table 6,1 Gradation Z
Sieve size Percent Finer
" 2 inch ..:t~.
It inch 95-100
t inch 70-90
1- inch 50-6B,O
No, 4 3B,U-50
No, B 28,0-40
No, 30 15-22,0
No, 200 B,O-12,O
0,--~-----"''',~~-....-,J',
,~:'<~,r

114
ii) The fines used in the mixture increase or
decrease the CBR value depending on their percentage
in the mixtures. At optimum percent fines the CBR
value is the maximum. For gradation Z, the optimum
percent fines (combined silt and clay) is 10.0
percent.
iii) The optimum moisture content at which maximum
CDR value is attained in the mixture varies with
the type 0 f the aggregates, gradation of the
mixtures and the percent fines in the mixtu~e.
For gas burnt picked jhama brick aggregates with .•
ten percent fines, the optimum moisture content
is 13.0 percent and the maximum dry density is
119.0 pounds per cubic foot at 100 percent
standard AASHo compaction.
iv) The CBR value is depndent on the compactive efforts
applied. For crushed ga's burnt picked j hama brick
aggregate mixture, the CBR value at 100 percent
standard AASHo compaction is 97.0 percent and at
100 percent modified AASHo compaction, the CBR
value is 156.0 percent.
6.2 Recommen~ations
6.2.1 Recommendations for the Future Study
i) In the present study six gradations were used
for investigati6n; More gradations could be taken
.rl"'- ..•..:~ "
\j

115
to find theCBR values. In the future more
close iovestigation shuuld be takeo to find a
suitable gradation at which maximum CBR value
would be attained.
ii) In the present study the CBIi values of al-l
mixtures were determined in the laboratory. The
same materials should be compacted in the field
at the same deosities and field CGR values should
be determined. Correlations should be developed
between laboratory and field CGR values.
6.2.2 Recommendations for Field Constructions
i) For the construction 0 f base courses for high
type pavements, gas burnt picked jhama bricks
are recommended to be used.
ii) The mixture is to be blenped as 1n gradation
l (Table 6.1) found in the study.
iii) Duriog constructioo in the field, the gradation
of the mixture should be maintained.
iv) The optimum moisture content should be present in
the mixtu"re during compaction. For thorough dis-
tribution of moisture water should be added
several hours in advance of compection.
,

116
REFERENCES
1. Special Report No. 113, High"ay Research Board, "StandardNomenclature and Definition for Pavement Components andDeficiencies" Washington D.C. (1970).
2 Peattie, K.R., "Stress and ~train Factors for Three LayerElastic ~ystem", Highway Research Board Bulletin 342, 1962.
3.
4.
Neilson, J.p., "Rational Pavement f..valuation - Review ofPresent Technology" Air Force .eapons Laboratory TechnicalReport, ~ew Mexico 1969.
Deklotz, I.A., "Effect of Varying the Quantity and qualityof the Soil Portion of Highway Aggregates on Their Stability"Proceedings, Highway Research Board 1940.
QI,
5. Yoder, E.J. and Woods, K.B., "Compaction and StrengthCharacteristics of Soil Aggregate Mixtures" Proceedings,Highway Research Board 1946.
6. Makdisi-Ilyas, Faiz, "The Effect of Plasticity and Quantityof Fines on Stability of Soil-Gravel Mixes", Joint HighwayResearch Project 16, 1972.
7. Faiz, A., "The Effect of Skipgrading on stability of SoilAggregate Mixtures" Joint H1ghway Research Project Report 10,1971.
8. Mainfort,R.C. and Lawton, W.L, "Laboratory Compaction Testsof Course-Graded Pav~ng and Embankment Materials" HighwayResearch Board Proceedings 1953.
9. Drake, ,~.IJ., "Combination of Waterbound-Macadam and Dense-Graded Aggregate Base for Flexible Pavements", HighwayResearch Board, Proceedings, 1953.
10. Cedergren, H.R., "Is- Field CBR test Adaptable to GranularSubgrades and Bases 1" Civil Engineering Journal. 1948.
(""1'.\T'~';
.~'-

117
11. American Association for State Highway and Transportation
Officials, "Standard Specifications for Highway Materials
and ~1ethod. of Samplina and Te'Oting" 1966.
12. U.S. Aqency for International Developments, "(;uide Lines
for Standard Speci fications fo r Highways and Bridges"
washington, D.C. 1975.
13. California Division of Highways, "'otandard Specification"
1960.
14. Road Research Laboratory, "A Guide to the Structural
Design of Pavements for New Roads", Department of Environment,
Road Note No. 29, London, 1'170.
15. Ministry of Transport, "Specification for Road and Bridge
W0 r k s", Lon don, HN50 1963.
16. Transport and Road Research Laboratory, "A Guide to the
Structural Design 0 f Bitumen-surfaced Roads in Tropical
and Subtropical Countries", Road Note No. 31, London
HMSO 1977.
17. Hodgkinson, W.G•• "A Guide for the ::itructural Design of
Bituminou s Surfaced Pavements" .Bangladesh Road Research
Laboratory, Oacca 197B.
lB. Lambe, W.T. (195B) "Soil Tebting for EnGineers", Jhon
Wiley and Sons, Inc. London.
19. ASn~, "Annual Book of ASH1 Standards" Part 14, Concrete
and Mineral Aggregates, ASTM, USA 1979.
20. Yoder and Witczak, "Principles of Pavement Design"
2nd Edition wiley Interscience 1977.
21. Ashworth, R., "Highway Engineering" Heinemann Education
Books Ltd., .London .1969.
"
o:'(..." ".C."a.

APPENUIX-AAVAILABILITY OF MATERIALS
. :-'.' ~ ... ' .-..ilr

119
APPENDIX-A
Availability of Materials Used in the Study for Base and
Sub-base Constructions.
The materials used to blend together for getting the
desired gredetions are:
i) Bricksii) Stones
iii) Sandiv~ Silt and cley fraction from soil.
i) Bricks: Bricks are most widely used artificial
building stone in Bangladesh. Bricks can be prepared any
where in Bangladesh. The qualities, of which strength and
durability are important are functions of constituent
materials and burning process. Day by day coal burning
process is becoming obsolete where gas is available.
Fortunately Bangladesh has an abu.ndant storage 0 f natural
gas which are being supplied to almost all parts of Bangladesh
at a cheaper rate. Use of gas as the fuel in Brick kilns
is undoutedly more economic and efficient than any other
burning method.
Where gas is not av~ilable, only. there, coal or oil
can be used. for burning bricks. This study re;'eals that
the gas burnt picked jhama bricks and jhama bricks ere
the most suitable type of bricks for base ans subbase cons-
truction. Oth~r types of bricks wer~ also used for comparison.

120
These types are classified by Bangladesh Public Works
Department (P.w.D.l.
1. Picked Jhama Bricks: These bricks are uniformly
varified throughout, but must be of good shape, heavy
and of selected quality. They must not be spongy. ,
2. Jhama Bricks: These are slightly over burnt bricks
but not quite so well shaped as picked jhama bricks. They
must not be spongy and must be free from cinders and projec-
ting lumps and of fairly good shape.
3. First class Bricks: They should be of uniform size
and colour, thoroughly and evenly burnt. They should ring
clearly when struck with a hammer or anohter brick. They
should be well shaped with even surfaces and without cracks,
rainspots or flaws of any kind. They should not absorb
watar more than one sixth of their weight when wet in water
for 24 hours.
4. Second class Bricks: these bricks must posses the
hardness and colour of first class bricks but are slightly
irregular in shape, size or rough on the surface.
5. Third Class Bricks: These are bricks which are
not sufficiently burnt to the class as first or second but
which are burnt sufficiently and of uniform shape and size
for use in unimportant works.
On the basis of fuel two varities of picked jhama
and jhama bricks were used - gas burnt and coal burnt.
C':.' '~.X~"

121
Actually for the construction of pavements the bricks are
evaluated by their crushing strength values and percent
wear in Los Angeles Abrasion machine. In Chapter J a
comparison is given for differen" types of bricks used
in this study. Now these bricks can be prepared at places
near job sites and after crushing br~ck aggregates can be
obtained.
ii) Stone, Boulders can be crushed to the desired
sizes to have crushed stone aggregates. The smaller sized
stones - shingles and pea~gravels can also be mixed ta
have the aggregate mixture. The general name af these
natural aggregates is gra~el and includes Granite, Trap,
Basalt, Sandstone, Limestone, Argillaceous Limestone
(Kankar), Dolomite, Laterite, Quartzite, Slates and Marbles.
In Bengladesh most of the big quarries for the collec-
tian of stones are in Sylhet District. Bhalagonj, Jafflong,
Shella and Bhowal qua~ries are i~portant for the callection
of Boulders and Shing~es. Small quantities of stones are
also available at Shita Kundu, Rangamati, Cox's Bazar of
Chittagong district and in the beds of Mohadea and other
river coming from Garo Hills in Mymensingh. Stones are
also available in some places of the northern districts
like Rangpur and Dinajpur.
r
I
iii) Sand: Some sand is required to be blended with
soil and aggregate to meat the standard gradations. The
01--~

122
fineness of sand which is to be used depends on the propor-
tions in the aggregete mixture and the type of the soil
employed in the mixture. The send may be from coarse to
fine according to grain size. It can be obtained from
river bed or from pits..
Sand is abundantly available allover Bengladesh.
Very good variety of river sand is available in the districts
of Dacca, Mym~nsingh and Sylhet. Both sea sand and river
sand of good quality are found in the coastal districts.
Sands are also available in the northern districts of
Bangladesh but not of good quality.
ivl Soil (for silt and clay fractions): Some minimum
amount of silt and clay fraction of soil (material passing
No. 200 mesh sieve) is required in the mixturs. Normally
bed soil, efter drying and pulverizin~, can be mixad with
aggregates. But if thara i.s excess amount of clay fractiona
in the soil, lumps, clay balls may be formed during mixing
which deteriorates the quality of the mixture. In such
cases, suitable soil from adjacent areas can be used.
r

APPENDIX-BHAND CRUSHING OF BRICKS AND BOULUERS

123
APPENDIX-BHand Crushing Df Bricks and BDulders
This appendix pertains tD the cDnstructiDn Df any
structure where crushed aggregates are used. The naturally
Dccuring shingles and paa-gravels are rDundshaped with
pDlished surfaces. The strength Df these smaller sized
aggregates are less than that frDm large sized stDnes named
as bDulders. TD ensure prDper interlDcking and increased
surface rDughness, bDulders are crushed tD smaller sized
aggregates. Bricks are nDrmally crushed tD smaller sized
angular rDugh surfaced aggregates fDr use in cDnstructiDn
work.
Thee crushing Df bricks Dr bDulders can be' dDne manually
by a hammer Dr by using machines. It is an accepted fact
that machine crushing prDduces unifDrmly graded aggregates.
FDr CDncrete wDrks and fDr the cDnstructiDn Df dense greded
pavement cDmpDnents ~ell graded aggregates are required.
By hand crushing Df bricks Dr bDulders a well graded Dr
clDse tD well graded aggregate is expected tD be Dbtained.
Bangladesh ia a pDpulous pDDr cDuntry. The economy
prevail~ng nDw in this cDuntry desires tD undartake labDur
intensive methDds rather than capital intensive methods
fDr cDnstructiDn wDrks. TherefDre in mDst Df the cDnstruction
wDrks, bricks Dr bDulders are crushed manually tD get graded
crushed aggregates.

124
The author used crushed bricks and boulders for this
study. fo meet the standard gr~dation it was found that
some aggregate of particular sizes are to be blended with,
and some aggregate are to be discaraad from the mixture
of aggregates obt'ained from hand crushed source,!. In this
connection additional informations were collected regarding
the gradation of typical hand crushing which is most common
in this country. The information are obtained in the following
forms:
i) Comparison of gradations for crushed bouldars
and crushed bricks (Picked jhama).
ii) Typical gradations for crushed bricks (picked jhama) Pt:".
under the following circumstances: Labours were
recruited at random of different eges and sex.
A group of labours were directed to crush bricks
into 1" maximum size. The crushed materials were
collected and gradations for different labours
of a particular group were found out. Average
values of thesa gradations of that particular
group was taken. Similarly gradations for other
maximum sizes were also obtained.
iii) Typical gradations for crushed bricks of a
particular maximum sizes by labours of different
ages and sex.

125
Table B-1 Comparison of Gradations for Crushed Bouldereand Crushed Bricks (Picked Jhama)
5i ev ePercent Finer .i~~..
size Avg. gradation for Avg. gradation for cru shedcru shed stone b ro ken bricks broken by typicalby t ypical labou rs labours
Max. si ze 1" Max. size" 1"
It" 100 100
1" 79.5 92.59
1-" 47.0 64.6B
t" 26.0 41.47
i" 16.75 15.20
t" 9.'50 1'315.07 i~'','
No. 4 6.34 2.71 .~h
No. B 3.00 0.55
No. 16 1.B5 0.36
No. 30 1.15 0.20
No. 50 0;50 0.05
No. 100 0.20 0.02
No. 200 0.05 0.01
Itis seen from the above comparison that stones after
crushing remains more oversized than bricKs. It can also be
said that crushed bricks are more well graded than the stones.
For brick~ therefore hand crushing is more suitable than for
stones.

126
Table 8-2 Typical Gradations for Different Maximum Sizes(Crushed Picked Jhama Bricks)
Percent finerSieve s~ze ln tn tn
It'' 100 100 lUO.1" 92.6 94.0 96.0
tn 64.65 71.75 69.60
t" 41.45 39.30 39.95
in 15.20 27.35 31.95
t" 5.10 16.65 23.40err
No. 4 2.70 13.00 19.95 '4:0~.' '?,,?~"f>'
No. B 0.55 7.20 13.40 "
No. 16 0.35 4.40 9.60
No. 30 0.20 2.45 6.20
No. 50 0.05 1.45 4. ro
No. lUO ,0.02 0.50 2.50 "f';'"
No. 200 0.01 0.10 1.,10
It is seen from the above table that more over sized
materials are obtained for lower sizes and lower sized
materials after crushing are more well graded."Ie

.,.
127
Table B-3 Typical ~radations of Crushed Bricks (t" max. size)Broken by Labours of Different Ages and Sex.
(Crushed Picked Jhama Bricks)
SievePercent Finer
size Male Female
Gr. 1 Gr. 2 Gr. 3 Gr. 1 Gr. 2 Gr. 3
1" 87.00 96.0 91.20 71.1e 85.80 77•80
tn 66.35 69.6 67.55 27.82 57.20 49.85 {j)
tn 41.65 39.9 41.85 12.42 30.40 27. 50
t" 32.65 31.9 31.00 6.58 21.90 •19.65
t" 19.20 23.5 19.80 4.16 14.75 11.40
No. 4 15.35 19.95 15.75 2.52 11.75 6.65
No. 8 8.65 13.40 8.45 2.10 7.45 4.75
No. 16 4.40 9.60 4.90 1.98 4.90 2.95
No. 30 0.85 6.15 2.95 1.74 3.25 2.00
No. 50 0.40 4.16 1.75 1.44 0.60 1.45 • f
No. 100 0.15 2.50 1.00 0.82 0.35 0.90 ~
No. 200 0.00 1.10 0.35 0.00 0.00 0.45
Gr.'1: Age between 12-20 yrs.
Gr. 2: Age between 25-35 yrs.
Gr. 3: Age above 50 yrs.
From Table B-3 it reveals th",t the quality of cru shing is
better by group 2 labours for both male and female. Also this
group having age between 25-35 years crush more well graded
materials.

,.}
AGGREGATE GRADATIONCHART
•....oI-
•....zwucrW<L
-'20 <l:
10
30
\:;l70 ~
VlVl60 <l:0..
'0
50
o1\'2" 2' 2\/23"~' -3/8' )~. 3/( ,"
SIEVES
~
- ,
,~
108
U. S. STANDARD
STANDARD SIEVE S1'" 'I
318" 112" )ii: 1" ,112 2 2'R 3" ";00I '1-7-!
_______ • _. 1- _.•_, __ - ••
70( )'Y' 7 2 5 2 3 ~o10
30'--1 - -' -~--:_--' -~ - __ '_L.sQl):d_~I__ t" . I "~0r= ---,--'-'--:-- ----..-----,--r -----r--, t- -'L-'-"-- , .
______ ._. , _', 'I - --1---- ---;- lL2..;MClx..5.t
501 ' . __ ' : : ~ ,Brlck. .._~QQS.1
t ~-,--~=:-~~t--.,-f , "• • . t '70 :----- -- --.- --- .- -I -- -.--, -----: _,__ '_, I I
1 • I .:
80, ---r-, , ,-'--'L __ •._-J :;.
, I I : I901-7 CLJ-_-J-_I ! ~--i--I I ! i • I I .
_I _
10080 50 ~o 30 20 )6)00
200
-J<l:I-
oI-
0---ZWucrW0..
<l:•....wcr
zo 20w
,l.JFIG. B-1 GRAIN SIZE DISTRIBUTION OF THE COMPONENT AGGREGATES OF
GRADATION 'z.NCIo
• __ w ,_ -

d ,-: .,
AGGREGATE GRADATIONCHART
90.
. "L. __lU()
" 'J2\23'111) I
._-_. ------'
" ! I'318 112 j,L.
1---
-------- ~----- - -- •..
B. S. STMWARD SIEVE S
1')072 S2 jL 18 14 7 j115"! I I! ' ! \ '! 1;-t-.-j-----i--L--.-L.--'-J- i -"----I--. _L_
j ;_~ __ ~L_L~~-L_~_~--L--~---.~__-:!L_
__~t. L --\- _I -.--0-- ---+--
- . -0- , ~ -.- __
0200u
10
20I_~_~__ ~.~.~_ .. _. __._. _ ,. .- -.--~-.--::-:=1S 0
301' --- •__.. ~--.13..<l:~d-.2.~..iir<:l<J.aJ..!.O!1....Z_ -- - -------17(, ~, -Lo~I--~-~-::::::-=-:..--:=:-:-:--.. . .-----.L. --- --'-~'---==l5( ~L-~.-. ; . .Comblned G,radlngl, -- -----1 . 0'v,I ~. ~~o..L.llie ..-Blendgd .. --.. _- ''0:
oU • Mi'>:tu re '=76:b--.~---~i-.~-~-;~-=:~-.----.:-' ~-::~80 r _ir--T~;-~~_~~.==;:~_--~~~.-__-~--.~=~-.~=--=~:~_-:::-j2 [; ~
. I . . ., .. 090 __==+ ' __-i__ i ! .!_L__. • .--- -----,---.-: . 10 ,....: : 1 i : l' , I ,
II,' -----r---~~.-- ~__-1-_
100 I I I Iii ii' , : 10200 10080 SO 1,0302015 108 1, 3is'1!i 31('" ,i;'i'i21/2'3"L'
<J:,....o,....
z
--'
u0:::W0..
wcr
wz<J:
U.S.STANDARD SiEVES
, .FIG. B"2 GRADATION BAND OF GRADATION Z AND GRADATION OF THE
BLENDED MIXTURE
NID
~,:j'-"
".,

-je
APPENllIX-CTABLES OF TEST RESULTS
AND
FIGURES OF TEST EQUIPMENTS

'"
,
Table C-l CBR Test Results for Gas Burnt Picked Jhama Brick; Gradation Xl
Compactive Spn. Penetration load in psi required for penetrations Dry Avg. Correc- Avg.effort, No. in inches density dry ted CBReor.1b-ft/cft 0.02 0.04 0.06 O.OB 0.10 0.15 0.20 0.30 0.40 Ibslcft density in 10 CBR
1bsic ft in :;;1 103 ~~7 470 652 635 1100 1252 1525 1712 11B.8 90"-~,
14,300 2 115 3u5 d95 673 855 1115 1300 1602 1BOO 11~'.1 32(65 blm,s 3 113 320 525 736 900 1192 1395 1720 1980 121.9 119.3 95 91.Bper layer) 4 115 318 523 715 906 1209 1402 1660 1413 121,3 97
5 103 27- 450 648 810 1105 1250 1460 1642 117.7 B8,0
6 110 2BO 4:J:J 665 BOO 1048 11120 1465 1645 117.0 89
1 52 121 235 330 410 583 675 815 882 112.7 508 50 1[3 .190 280 376 550 652. 805 804 1l0.8 46
6,6000 9 50 125 217 328 432 640 775 950 1090 113.3 112.7 53 4?2(30 blowsper layer) 10 51 120 203 302 400 614 762 976 1135 113,2 49.
11 50 100 195 300 395 588 755 810 895 112.0 4812 45 116 210 320 425 617 720 855 960 114.2 49
13 24 48 87 162 235 452 545 640 672 107,4 3914 35 61 72 210 300 455 573 660 713 108.7 40
3,300 15 21 51 131 208 302 465 550 630 665 109.3 108.4 42 39.0(15 blowsper layer) 16 20 58 125 218 300 445 570 720 825 lQ9.3 39
17 22 55 120 207 297 425 510 596 620 107,9 3818 20 52 105 185 255 400 490 570 622 107.8 36
From CBR-density plot (Fig.~.17A),CBR at 100 percent standard AASHO density is 79.5 percent,
t-w
• 0
(

.} .'\", .,
Table 0-2 OaR Test Result for Gas Burnt Picked Jhama Brick; Gradation X. 2
Compactiveeffort,Ib-ft/c ft
5pn.No.
~enetration load
0.02 0.04 0.06
in psi required for penetra"tionsin inches0.08 0.10 0.15 0.20 G.ao 0.40
LJrydensitylos/eft
Av g.drydensityIb sic ft
:....orrec-ted CUR
in ',70
,; '}g.cor.:JR'::"il
14,300(65 blowsper layer)
1
2
3
4
5
6
122118127108106126
285295
27420C24830G
512:167
50G474
403
cOS
548627610622637676
875
782t1ZC
878776
9CJ
1142 .111'1 1'115 1620 ll~.('
1051 1234 1367 1518 118.31150 1350 1671' 1910 12[.91128 1324 1500 1675 119.1lu70 1252 1415 1596 110.5119~ 133L 1475 16S~ 11~:.5
Ii'!.]
?L
949135
86, c
;::2.6
562 759 a78 972 112.3
6,600(30 blowsper layer)
3,300(15 blowsper layer)
7
B
9
1011
1213
1415161718
4845
5450
45
47181516171815
1071115
13313010510858
5654503850
20G1u7~~,
226,~-.J.!:J
18020212413C141
12482
125
296
300350
268267
307
208204223103150200
3844uJ
400371370
400303
2n7~,
300252240267
540620
SSG525650
446445
457402405450
700
BOG642
700762
550
526
565507
460557
86G 980IOU 1246
BiD 998824 90S
922 1031
690 785647 648
729 77 5
600 732
635 660720 825
112.41.:'3.
112. [
111.C;
113.21, 1 ~
•••••..L ••••••
11e. ~
11G.7
1nn' •L':;' • 4
lOb.7109.5
':'1 ~. c
110.1
464 ~~
i"
46513B
37
1..1
35
34
39
~~.3
From CDR-density plot (Fig.4.171l),CBR at 100 percent standard AA5HO density is 71.0 percent.
~
.,...'.... \ /.I- -,-. ,
r'~'__ r-.'
,,....f..>....
_ ..•.

"\.1-
Table C.,.3 CE,~ Test Result ~or Gas Burnt Picked Jhama Brick; Gradation X3
Compactive Span. Penetration load in psi reouired for oenetrations Dry A v g. Correc- Avg.effort, No. in inches density dry ted cor.Ib-ft,Lcft 0.02 0.011 0.06 0.08 0.10 0.15 0.20 0.30 0.40 Ibs/cft density C3R eRR
Ibs/cft in ~"~ . d1n ,~)
1 135 286 457 575 760 1035 1162 1375 1540 121.5 8414,300 2 101 247 470 600 770 1020 1140 1332 1772 120.1 84(65 blows 3 199 253 438 550 742 1033 1152 1315 1455 119.4 120.2 82 86per layer)
4 110 290 475 636 820 1055 1225 1380 1550 119.6 875 123 272 450 597 803 12023 1163 1370 1538 118.4 866 102 290 47c.. 650 842 1075 1170 1436 1639 122.6 90,~
7 45 140 187 300 403 605 710 865 980 113.3 50,6,600 Il 37 IG4 2Gl 296 350 532 655 800 920 112.0 44(30 blows
0 42 102 180 260 340 40 ~ 638 747 516 112. [) 112.1 42 46per layer) , / ~.10 47 126 183 300 405 570 674 90C 973 11C.8 4811 50 102 150 255 332 501 556 674 740 111.1 4112 46 121 252 310 430 600 684 853 994 113.5 51.
13 16 50 122 200 276 421 512 642 655 112.7 373,300 14 18 52 140 202 300 435 522 620 670 11.4 3d(15 blows 15 13 51 98 200 250 400 470 535 560 110. 5 lleJ.75 34 35per layer)
16 20 54 107 175 253 410 450 550 605 109 . 6 3417 18 52 108 155 238 350 421 517 562 109.4 3118 22 51 124 200 270 424 500 591 673 IHi.9 36
From CBR-Density plot (Fig.'l.IIlA),CBR at 100 percent standard AA5HO density is 77.5 percent.
iC ". .\~:~---:--\ •...) w
N
/.

'..,,' ,,-
Table C-4 CBR Test Result for Gas iJurnt Picked Jhal7laBrick; Gradation X4,
Compactive Spn. Penetration lo-i3d--'fn- psi requireCf for penetrations Dry Avg. Correc- Avg.effort. IYo. inches density dry ted CRR Cor.lb-ft/cft 0.02 0.04 0.06 0.08 0.10 0.15 0.20 0.30 0.40 lbs/cft density in % CBR
lbs/cft • -Il.n i~
1 142 325 509 735 940 1138 1295 1545 1730 121.7 1022 115 323 505 697 882 1165 1307 1600 1774 121.G 98
14,300 3 136 364 550 705 938 1242 1460 1665 1847 123.4 121.8 101 99.0(65 blowsper layer) 4 112 27 j 525 675. 868 1197 1350 1570 1754 121.7 97
5 U5 297 495 698 840 1158 1365 1593 .L806 120.8 966 118 320 504 700 902 1165 1375 1550 1695 121.8 1007 50 130 220 322 425 630 750 915 1025 115.0 53
6,600 8 48 lOB 196 305 403 596 732 853 902 114.1 49(30 b1010'S 9 45 125 237 330 426 634 750 915 1028 114. 2 114.0 52 52per layerj
10 50 108 218 320 4.10 590 786 960 1120 112.5 5211 51 136 210 373 435 622 755 925 1063 115.1 5412 50 125 262 323 410 598 728 870 928 113 •.0 50
13 16 65 150 240 332 500 580 650 695 111.9 46
3,300 14 15 54 132 231 320 487 602 695 730 111.5 45(15 blows 15 13 52 106 200 301 471 632 652 722 110.9 111.2 41 43.3per layer
16 17 65 117 222 307 475 605 760 925 109.7 43
17 13 66 160 200 310 500 605 800 850 112.4 44
18 23 67 114 240 300 475 573 675 680 110.8 41
From CDR-density plot (Fig.4.186),CBR at 100 percent standard AA5HO density is 87.0 percent.
~
~..,..,

.r.~ ',-
Table e.5 eRR Test Result for Gas Jurnt Picked Jhama Urick; - d ~' Xbra 8 ...1.0n 5.
Compactiv-e Spn. Pen~tration load in psi required for penetrations Dry Avg. Correc- Avg.effort, No. in inches density dry ted eBR cor.lb-ft,tcft O.OZ 0.04 0.06 0.08 0.10 0.15 o.ZO 0.30 0.40 lbs/cft density in % eSR
lbs/cft in %1 106 303 440 600 806 1060 1255 lJ24 1695 ' l' .:0 ' 86J.. .•...O. -' u
14, 300 2 98 268 453 628 -0 - 1065 1225 1495 1520 116. I j 87{-' J(65 blolvs 3 87 217 375 535 670 B76 990 111;;> 1205 116. B 117.75 73 79.0per layer)
4 72 215 4U6 520 ' 712 954 1040 1225 1400 117.0 795 75 210 355 51B 623 865 lOD3 1142 1250 116.3 706 110 ,255 410 603 712 965 1120 1355 1547 118.7S 79
7 47 100 175 204 355 517 600 760 875 113.76 426,600 8 48 a6 180 235 330 500 605 7=2 aoo 113.clc 41(30 blows 0 37 9B 1'53 236 31 J 483 570 668 725 113.J2 113.5 40 41.[;per layer;
10 "" 56 1'56 2:'10 31C 47G :laO illS a10 112.9:: 30J~
11 36 82 153 2 L; 5 32~ 99G 57- 685 750 113.::;L1 40,0
12 82 184 262 3S2 550 665 675 622 960 114.[:0 43
13 13 5G 112 170 252 426 520 623 744 112.0 363,300 14 15 50 125 196 270 400 SOD 560 605 112.9 36(15 blows 15 11 47 lCU 165 245 ""r 44Z 455 6UO 112.9'] .liZ.8 34 33.0per layer) ~~u
16 10 26, 87 152 220 325 347 387 400 112.35 301 7 10 42 92 173 185 335 425 535 565 :2.12.7 30~,18 45 97 145 2UO 27C 366 507 560 655 112.9 31
~
from CBR-Density plot (fig.4,~A), e8~ at 100 percent standard AASHO density
.~
is 65.0 percent.•...to>~


-~ ~
Table C-7 CBR Test Rasult for Crushed stone; Gradation Z.
Compactive Span P en-;-tiat-io n 10 a-d- in ----psir equ ir 8d for penetrations Dry Avg. [orrec- Avg~
effort, No. in inches density dry ted CBR Cor.Ib-ft/cft 0.02 G.04 0.06 u.olJ U.I0 0.15 0.20 o.llo 0.40 Ibs/cft density in % CBR
Ib sl cft . ,./1. n ;'J
1 1r-, c:: 4L.;2 SUO 802 lC:1S 1450 1647 1960 2lB 5 152.7 112Wo
14,300 2 1[17 ~~47 54 L aDS loue 1335 1563 IB28 211[: F, 1 .3 108(65 blows 3 135 35LJ 551 792 1C<:~0 1"" :::: 1506 1750 lY 36 IJ,B.O 149.9 114 110per layer) ...;..L ••.••
4 110 325 530 741 9 S5 1326 1'\00 lC12 1675 140.8 1045 105 347 600 725 997 1302 1418 1720 IB22 149.2 1[;76 103 345 513 798 1G5o IdOO 1550 1635 1906 149.9 115
~ 48 182 290 400 515 72C 825 1040 lId 5 145.0 61I
6,600 8 50 145 300 4C 5 54C 815 933 1135 1222 147.2 66(30 blows 9 45 • "0 24B 386 ~OC 6Q~ 3:2 93Q 982 145.5 145. 5 60 61. 6per layer) l.~~ ..,-/ ...J v .
lQ 72 155 32[; ,,26. 548 748 8::;7 1062 1190 145.6 62
II 46 126 224 402 486 704 81C 996 llOo 1d5.6 58.12 47 135 280 405 532 747 875 108Q 1212 la 5 .6 63
13 18 78 150 252 355 552 638 642 750 142.9 49
3,300 14 20 05 182 30D 4DC 620 750 955 1042 144.9 56(15 blows 15 15 B4 165 285 350 552 662 7Bo 845 143.8 143.8 50 52.8per layer)
16 d3 In~ 205 303 486 582 730 8lJ3 864 144.2 . 53WI
17 15 68 155 250 305 585 610 721 760 143.8 49
18 35 7d 196 306 420 648 758 BBo 976 142.5 5B
from CBR-density plot (fig. ~.."'A), C~R at 100 ~8rcent standard AA5Ho density is 94.0 percent.
l~. •••---.-
:~ w~. .0\
-- ~

..:'
Table C-8 CBR Test Result for Coal Burnt Picked Jhama Brick; Gradation Z.Compactive 5pn. Penetration load in psi required for penetrations Dry Avg. Correc- Avg.effort, No. in inches density dry ted CBR Cor ..Ib-ft/cft 0.02 0.04 0.06 0.08 0.10 0.l5 0.20 0.30 0.40 Ibs/cft density in % CaRIbs/cft in ~
1 103 252 458 560 7B7 1093 1230 1482 1652 119.6 B614,300 2 98 248 450 642 743 1078 1241 1390 1489 120.8 85(65 b
l10WS) 3 105 286 516 650 822 1155 1354 1691 1832 123.3 120.8 91 67.3
per ayer 4 97 21B 503 692 B43 1145 1272 1537 1700 121.4 915 98 270 419 655 BOO 1109 1268 1550 1746 119.5 906 121 240 410 600 772 1028 1176 136B 149B 120.7 B3
7 46 105 202 2B2 395 522 697 701 B50 112.9 466,600 8 47 96 205 300 401 401 550 730 825 915 112.7 48 4i.5(30 blows 9 48 121 173 348 451 652 778 978 1150 113.3 54per layer) 10 40 100 160 2J3 320 460 650 847 942 111.9 40
11 51 112 200 320 412 57B 746 696 998 11?8 5012 45 115 184 295 378 526 690 800 871 112.6 47
13 15 47 150 194 262 423 538 624 670 110.9 373,300 14 17 58 119 175 250 415 468 568 588 111.0 34(15 blOWS) 15 14 46 91 161 225 370 470 547 620 107.3 108.9 32 33.6per layer .16 15 49 90 177 227 364 957 550 653 107.9 31
17 20 64 128 200 275 425 533 648 730 10B.9 3718 15 48 96 173 226 350 426 557 648 107.2 31
From CSR-density plot (Fig.4.~~, CSR at 100 percent standard AA5HO density is 74.0 percent.
(, - ~'. w ~~.~~-- ---

Table C-9 CBR Test Ilesult for First Clas"s Brick, Gradation Z.
Compactive Span Penetra~ion load in psi required for penetra'tions Dry Avg. Correc- Avg.effort, No. in inches "----- densi':y dry ted cor.Ib-ft/cft 0.02 0.04 J.OS 0.G8 0.10 0.15 o . 20 0.30 o 40 Ib sl c ft den si ty CBR CaR
. Ib sl c ft i n ~~ in %1 lul 250 405 546 703 935 1102 1270 1365 119,1 78
14,300 2 102 235 462 59G 747 11UO 121U 1500 1692 116.3 81(65 blowsper layer) 3 98 241 410 550 712 HilS 1098 1370 1565 116. G 117.0 80 79.0
4 100 253 419 562 722 995 1230 1480 1675 116,1 Bl5 99 248 390 550 64B 950 1125 1315 16U8 115.6 756 102 250 414 555 706 102il 1126 1407 1622 llB.7 79
1 42 77 180 2[,0 266 455 545 672 765 112,6 366,600 2 49 98 162 22B 310 4BO 650 B15 96B 111.B 3B(30 blows 3 29 70 151 240 316 500 624 B20 945 109,9 110. B 49 37.5per layer) .
4 22 76 153 247 312 4<;;5 572 77B B46 109.u 395 2B 7B 155 210 33B 450 562 673 7Bo 110.1 366 30 75 147 212 313 407 56B 710 765 111.2 35
1 25 47 7B 147 200 326 415 500 602 111.2 2B3,300 2 22 51 100 132 225 327 430 505 595 109.4 29(15 blows 3 13 28 62 152 200 350 442 545 556 lLlB.2 10B.9 30 29.0per layer)
4 12 47 100 150 222 367 472 550 650 107.9 325 10 42 75 140 IBO 300 405 495 510 lu 7. B 276 11 43 73 145 19B 315 400 514 647 luB,9 2B
From CBR-Density plot (Fig. 4"~8A), CaR at 100 percent stand ard AASHO density is 62.5 percent.,l( , •••
W5/_ ex> .~

~.
Table C-I0 CBR Test Result for Third Cless Brick; Gradation Z.
Compactive Span, Pene~ration load in psi required for penetrations Dry Avg, Correc- Av g,effort, No. in inches density dry ted CaR ClDr.Ib - ft/ cft 0,02 D,04 0.06 0,08 0,10 0,15 U,20 0,30 0,40 Ibs/cft density in % CBR
Ibs/cft . ~~n 1'"J
1 lU5 210 315 ,110 540 755 9l~0 1165. 1370 118.0 5814,300 2 85 120 295 402 515 7U2 oC 3 S 950 llJ45 117.1 57(65 blows 3 70 145 320 390 483 723 897 1COO 1113 116.) 116,0 55 56. ~per layer)
4 68 15U 312 385 452 62lJ 84U 985 1145 114.[; 545 82 120 268 375 501 71L; 605 1007 1100 115,1 536 74 157 302 455 557 728 045 922 1040 115.6 62
7 25 75 130 205 270 445 525 705 805 112.8 346,600 8 ,~ 63 135 183 245 370 5eO 635 720 111.5 304/
(30 blows 9 33 75 15u 247 279 476 57C 710 796 11C.9 11U,75 37 33.4per layer)10 37 76 148 208 282 4117 %5 647 75[; llC.5 34.
62211 38 72 142 200 27U 3q~ 515 572 1[9.5 33- I
12 36 76 150 200 265 400 520 600 670 }O9.3 32
13 15 45 75 120 180 300 375 520 580 109.9 253,300 14 10 32 77 lOS 180 262 362 472 557 108,8 24(blows 15 18 42 72 128 152 298 351 485 505 108,1 108,2 23 23,5per layer)
16 16 28 74 120 138 255 312 375 403 107,7 2117 26 45 97 148 198 305 382 477 548 109,S 2618 10 28 65 112 163 250 335 417 465 106,9 22
From CBR-density plot (Fig,4.;<aa),CRR at 100 percent stand ard AA5HO density is 42,0 percent,
l-e..>
'"
~;
~,

..,,
Table [-12 Liquid Limit Test Result
140
No. 0 l'observation
No. of blows
\Jater -content
1
9
28,5
2
12
26,5
3
18
23.5
4
30
20.5
5
41
19.5
The soil is non plastic

Table 0-11 Hydrometer Analysis
141
Soil Sample: Materials passing No. 4U sieve from soil-aggregate
mixture in gradation L.
"t. of dry soil: 50 gms. Specific gravity of soil: 2.67
N': % finer : 6U~ : 0.60oTemp. : 32 Hyd. No, 002966.
ElapsedDate Time R: R : R-R Z in D in N in N' in
in w w r %cm %minutes m.m
21.12,81 1/4 1023 -D.5 23,5 11,36 0.D926 75.33 45.19
1/2 ID17 " 17.5 12.945 0.0699 56.10 33,66
1 1012 " 12,5 14.215 O,U52 40,0 24,0
2 1009 " 9 •5 15.025 0,037 30,45 18.27
4 1005,5 " 6.0 14,83 0,0264 19,20 11,52
8 ],003 " 3,5 15.505 0,019 11,20 6,72
15 1002.5 " 3.0 15,74 0.014 9.60 5,76
30 1002 " 2.5 15,875 0.01 8.0 4,8
60 1001.2 " 1.7 16.1 0.00712 5.4 3,24
120 1000,8 " 1.3 16,28 0.005 4.16 2.496
240 IDOO,2 " 0.7 16,60 0.0036 2,24 1,34
..-~"~

I
F' C, Equipment and materiels for the'9. - compaction of ellR molds.
- .••
,,~
J'.
, '..;I J
.., .•.. •..L.' <:Q..••••
,.•..
"."
f :~~'.I .1 'IjQ.~ . '.' ~~~ ~~
,f '<C:l'!." .e.~
,/
~,. /
f ...•
F,'9,C-2 The mixture is ready for compaction

5 '"0
~
eo.
'-- :>,, ...,
fir']"C
':-, IIIIII
'"OJ.,. •'"'tI III
IJ' rol •••~! Q III
V' Ie :J
,> 'tI c:
\ I ,I) ..-l•••, u c:
/ "
l!l Q
./ c. .,.-.t ~--~~- e lJl
~,'" / 0 '"er~- u I)
~'i!I ,- ..;~ eI) Cl.os:. ~•...
,
•
•III!:I'mc: III.,. kIII 0-.0
a>lJl c:.,. .,.
1;1c: I)Ql Qerol.,.UrolIII IIIo.uIll.,.
c:0:: III:=s:.u U
IIIQl es:.
•••• CD