Embed Size (px)
Citation preview
Federal Reserve Bank of New York
Economic Policy Review
Special Issue:Behavioral Risk Management in the Financial Services Industry The Role of Culture, Governance, and Financial Reporting
Augu
st 2
016
Volu
me
22 N
umbe
r 1

Economic Policy Review
EditorKenneth D. Garbade
CoeditorsMeta Brown Richard Crump Marco Del Negro Jan Groen Andrew Haughwout Stavros Peristiani
Editorial StaffValerie LaPorte Trevor Delaney Maureen Egan Anna Snider
Design StaffTheresa Izzillo Jessica Iannuzzi
Federal Reserve Bank of New York research publications—the Economic Policy Review, Staff Reports, and the Liberty Street Economics blog—are available online at www.newyorkfed.org/research.
Follow us on Twitter: @NYFedResearch
Federal Reserve Bank of New YorkEconomic Policy Review
August 2016Volume 22 Number 1
Special Issue
Behavioral Risk Management in the Financial Services Industry: The Role of Culture, Governance, and Financial Reporting
Contents1 Introduction
Hamid Mehran
Part 1: Culture and Risk Management
5 Corporate Culture in Banking
Anjan Thakor
Until recently, regulatory discourse has paid scant attention to the issue of organizational culture in banking. Yet ethical lapses and systematic weaknesses exposed in the 2007-09 financial crisis suggest that future policy dialogue is unlikely to ignore culture’s significance. Drawing from an approach developed in organizational behavior research, the author introduces a framework for diagnosing and changing corporate culture in a way that more effectively supports a bank’s growth strategy and induces behavior that enhances financial stability. The normative exercise, highlighting the tensions and trade-offs arising from competing organizational goals, is useful for bank leaders seeking to foster a specific culture. An examination of bank culture under the “Competing Values Framework” also offers insights for policymakers designing regulations that proactively address foreseeable problems.

17 The Gordon Gekko Effect: The Role of Culture in the Financial Industry
Andrew W. Lo
Culture is a potent force in shaping individual and group behavior, yet it has received scant attention in the context of financial risk management and the 2007-09 financial crisis. This article presents a brief overview of the role of culture as it is seen by psychologists, sociologists, and economists, and then describes a specific framework for analyzing culture in the context of financial practices and institutions. Using this framework, the author addresses three questions: (1) what is culture? (2) does it matter? and (3) can it be changed? He illustrates the utility of this framework by applying it to five concrete situations—the collapse of Long-Term Capital Management, the fall of AIG Financial Products, the use by Lehman Brothers of “Repo 105,” Société Générale’s rogue trader, and the Securities and Exchange Commission’s handling of the Madoff Ponzi scheme. The article concludes with a proposal to change culture through “behavioral risk management.”
43 Risk Management, Governance, Culture, and Risk Taking in Banks
René M. Stulz
This article examines how governance, culture, and risk management affect risk taking in banks. It distinguishes between good risks, which are risks that have an ex ante private reward for the bank on a standalone basis, and bad risks, which do not have such a reward. A well-governed bank takes the amount of risk that maximizes shareholder wealth, subject to constraints imposed by laws and regulators. In general, this involves eliminating or mitigating all bad risks to the extent that it is cost effective to do so. The role of risk management in such a bank is not to reduce the bank’s total risk per se. It is to (1) identify and measure the risks that the bank is taking; (2) aggregate these risks in a measure of the bank’s total risk; (3) enable the bank to eliminate, mitigate, and avoid bad risks; and (4) ensure that the bank’s risk level is consistent with its risk appetite. Organizing the risk management function so that it plays that role is challenging because there are limitations in measuring risk and because, while detailed rules can prevent destructive risk taking, they also limit the flexibility of an institution to take advantage of opportunities that increase firm value. Limitations of risk measurement and the decentralized nature of risk taking imply that setting appropriate incentives for risk takers and promoting an appropriate risk culture are essential to the success of risk management in performing its function.
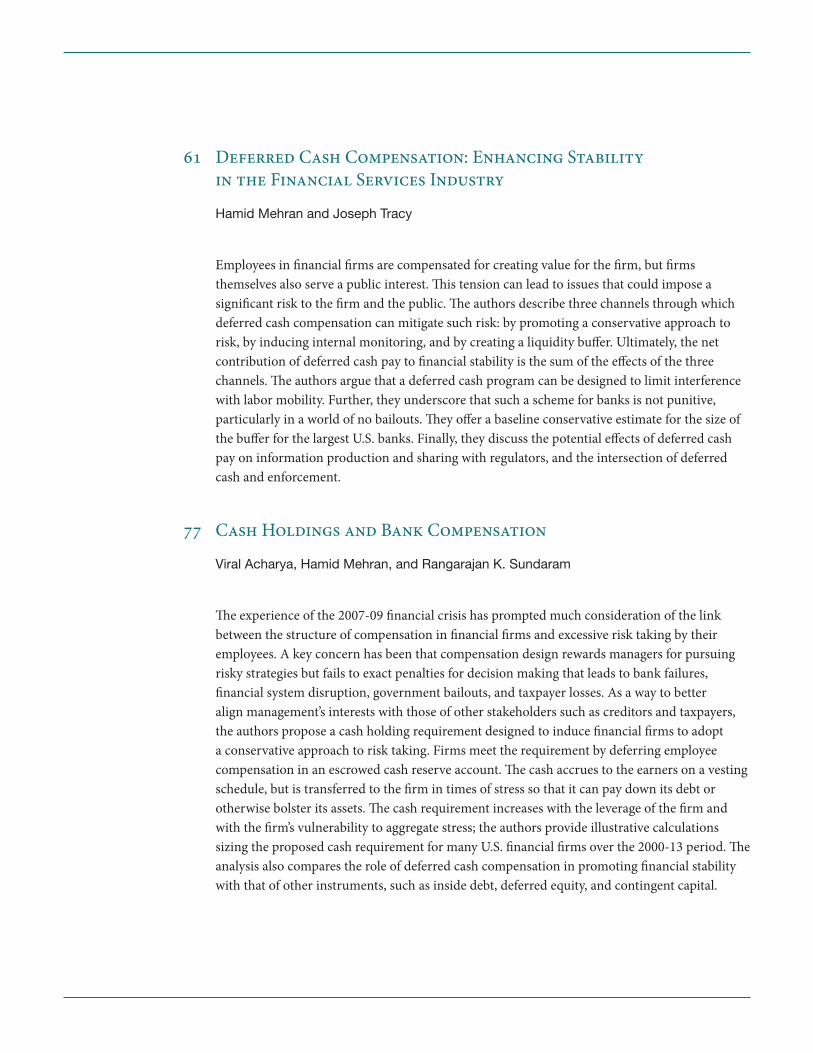
61 Deferred Cash Compensation: Enhancing Stability in the Financial Services Industry
Hamid Mehran and Joseph Tracy
Employees in financial firms are compensated for creating value for the firm, but firms themselves also serve a public interest. This tension can lead to issues that could impose a significant risk to the firm and the public. The authors describe three channels through which deferred cash compensation can mitigate such risk: by promoting a conservative approach to risk, by inducing internal monitoring, and by creating a liquidity buffer. Ultimately, the net contribution of deferred cash pay to financial stability is the sum of the effects of the three channels. The authors argue that a deferred cash program can be designed to limit interference with labor mobility. Further, they underscore that such a scheme for banks is not punitive, particularly in a world of no bailouts. They offer a baseline conservative estimate for the size of the buffer for the largest U.S. banks. Finally, they discuss the potential effects of deferred cash pay on information production and sharing with regulators, and the intersection of deferred cash and enforcement.
77 Cash Holdings and Bank Compensation
Viral Acharya, Hamid Mehran, and Rangarajan K. Sundaram
The experience of the 2007-09 financial crisis has prompted much consideration of the link between the structure of compensation in financial firms and excessive risk taking by their employees. A key concern has been that compensation design rewards managers for pursuing risky strategies but fails to exact penalties for decision making that leads to bank failures, financial system disruption, government bailouts, and taxpayer losses. As a way to better align management’s interests with those of other stakeholders such as creditors and taxpayers, the authors propose a cash holding requirement designed to induce financial firms to adopt a conservative approach to risk taking. Firms meet the requirement by deferring employee compensation in an escrowed cash reserve account. The cash accrues to the earners on a vesting schedule, but is transferred to the firm in times of stress so that it can pay down its debt or otherwise bolster its assets. The cash requirement increases with the leverage of the firm and with the firm’s vulnerability to aggregate stress; the authors provide illustrative calculations sizing the proposed cash requirement for many U.S. financial firms over the 2000-13 period. The analysis also compares the role of deferred cash compensation in promoting financial stability with that of other instruments, such as inside debt, deferred equity, and contingent capital.

Part 2: Governance and Financial Reporting
85 Bank Corporate Governance: A Proposal for the Post-Crisis World
Jonathan Macey and Maureen O’Hara
The corporate governance problems of banks are qualitatively and quantitatively different from those of other firms. The authors argue that a key factor contributing to this difference is the growing opacity and complexity of bank activities, a trend that has increased the difficulty of managing risk in financial firms. They also cite the governance challenges posed by the holding company organization of banks, in which two boards of directors—the bank’s own board and the board of the holding company that owns the bank—monitor the bank. This paradigm results in significant confusion about the role of bank holding company directors: While regulators focus on directors’ safety and soundness responsibilities, state corporate laws governing the conduct of managers focus on the conflicting goal of maximizing shareholder wealth. Reviewing the existing solutions to bank corporate governance problems, the authors argue that it is time to impose a more rigorous standard of conduct on bank directors. They contend that post-crisis bank directors should be held to high professional standards rather than the amateur standard that governs directors generally, and they propose “banking expert” requirements for risk committee members akin to the requirements that Sarbanes-Oxley imposes on audit committees. They further assert that all bank directors should be “banking literate,” possessing the specialized knowledge needed to monitor and control risk taking in complex banking institutions.
107 The Role of Financial Reporting and Transparency in Corporate Governance
Christopher S. Armstrong, Wayne R. Guay, Hamid Mehran, and Joseph P. Weber
The authors review recent literature on the role of corporate financial reporting and transparency in reducing governance-related agency conflicts between managers, directors, shareholders, and other stakeholders—most notably financial regulators—and suggest some avenues for future research. Key themes include the endogenous nature of governance mechanisms with respect to information asymmetry between contracting parties, the heterogeneous nature of the informational demands of contracting parties, and the corresponding heterogeneity of the associated governance mechanisms. The authors also emphasize the role of credible commitment to financial reporting transparency in facilitating informal multiperiod contracts among managers, directors, shareholders, and other stakeholders. Finally, they discuss the importance of regulatory supervision and oversight as a class of governance mechanisms that is particularly important for banks and financial institutions.
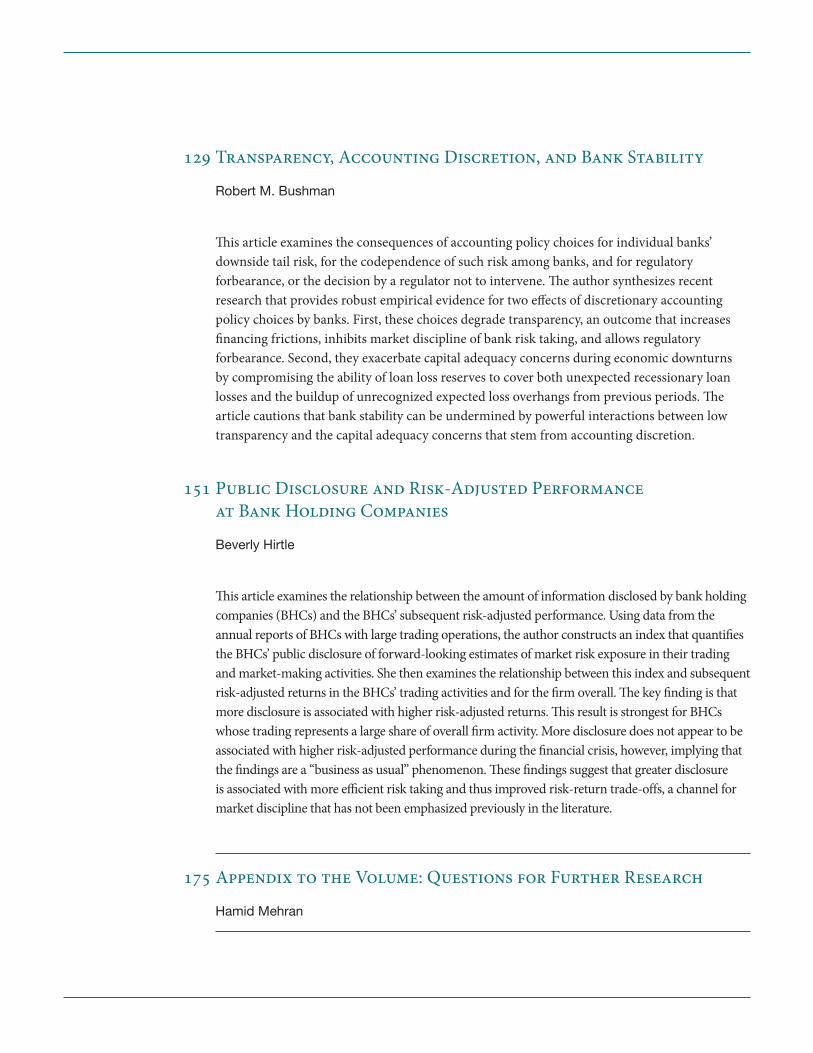
129 Transparency, Accounting Discretion, and Bank Stability
Robert M. Bushman
This article examines the consequences of accounting policy choices for individual banks’ downside tail risk, for the codependence of such risk among banks, and for regulatory forbearance, or the decision by a regulator not to intervene. The author synthesizes recent research that provides robust empirical evidence for two effects of discretionary accounting policy choices by banks. First, these choices degrade transparency, an outcome that increases financing frictions, inhibits market discipline of bank risk taking, and allows regulatory forbearance. Second, they exacerbate capital adequacy concerns during economic downturns by compromising the ability of loan loss reserves to cover both unexpected recessionary loan losses and the buildup of unrecognized expected loss overhangs from previous periods. The article cautions that bank stability can be undermined by powerful interactions between low transparency and the capital adequacy concerns that stem from accounting discretion.
151 Public Disclosure and Risk-Adjusted Performance at Bank Holding Companies
Beverly Hirtle
This article examines the relationship between the amount of information disclosed by bank holding companies (BHCs) and the BHCs’ subsequent risk-adjusted performance. Using data from the annual reports of BHCs with large trading operations, the author constructs an index that quantifies the BHCs’ public disclosure of forward-looking estimates of market risk exposure in their trading and market-making activities. She then examines the relationship between this index and subsequent risk-adjusted returns in the BHCs’ trading activities and for the firm overall. The key finding is that more disclosure is associated with higher risk-adjusted returns. This result is strongest for BHCs whose trading represents a large share of overall firm activity. More disclosure does not appear to be associated with higher risk-adjusted performance during the financial crisis, however, implying that the findings are a “business as usual” phenomenon. These findings suggest that greater disclosure is associated with more efficient risk taking and thus improved risk-return trade-offs, a channel for market discipline that has not been emphasized previously in the literature.
175 Appendix to the Volume: Questions for Further Research
Hamid Mehran

et al. 2016).2 Second, finance is a notoriously opaque industry, where appropriate measures of performance and risk are difficult to determine within firms, let alone among outside researchers. Third, the unique governance structure of the financial industry means that, when a banking firm defaults, directors have little or no opportunity to learn from their own mistakes or the mistakes of others in similar positions. In the case of banks, which cannot go through the bankruptcy reorganization process and emerge as the same entity, there is no avenue for directors who have firsthand experience of bank failure to share their knowledge and insights with others. Further, the risk of litigation often acts as a deterrent to information sharing even though sharing insights in such cases could help build a stronger financial system. Instead, regulators are often called upon to fill this void of institutional learning by establishing industry-wide best practices through a multitude of compliance-oriented regulations.
The adoption of new guidelines, however, is likely to be a lengthy process for struggling financial firms, in contrast to the experiences of nonfinancial enterprises in a similar situation. Nonfinancial firms in distress are forced by creditors and large stockholders to make rapid changes to their business models, culture, and governance. Often, the employees with the most influence on culture—the incumbents—are forced out. Thus, a
2 Christopher S. Armstrong, Wayne R. Guay, Hamid Mehran, and Joseph P. Weber, “The Role of Financial Reporting and Transparency in Corporate Governance,” Federal Reserve Bank of New York Economic Policy Review 22, no. 1 (2016).
Corporate governance has been at the center of everycrisis involving U.S. business practices since at least the
Armstrong investigation of the insurance industry in 1905-06.1 Public anger re-emerges after each new revelation of mis-management, though it varies in degree with the scope of the crisis. Fraud and abuse cases make front-page news, with the media pointing to failures in organizational leadership. Politi-cians hold hearings, and changes in laws and regulations often ensue. While the public costs of a given crisis are difficult to measure, settlements associated with the lawsuits that invariably follow can be in the hundreds of billions of dollars, as with the 2007-09 crisis. In the aftermath, academics try to isolate the factors that contributed to the crisis. Although it is hard to identify the root cause of a crisis or to fully understand the con-tributing factors, the focus eventually turns to the effectiveness of governance and how it might be improved. Typical questions include: Were boards forsaking their obligations to shareholders and to the public? What did the boards do or not do? What do we want them to do differently going forward?
Identification of governance problems is an issue for all firms, but it takes on particular significance in the case of financial institutions. Why is this so? First, bank gover-nance—the firms’ structure and conduct—is the product of market forces as well as regulatory expectations (Armstrong
1 For a discussion of the Armstrong investigation, see Mark J. Roe, Strong Managers, Weak Owners: The Political Roots of American Corporate Finance (Princeton, N.J.: Princeton University Press, 1994).
FRBNY Economic Policy Review / August 2016 1
Hamid Mehran
Introduction
Hamid Mehran is an assistant vice president at the Federal Reserve Bank of New York.
The author thanks Maureen Egan and Valerie LaPorte for their editorial work on the volume and Lindsay Mollineaux for helpful comments on the introduction. The views expressed in the introduction are those of the author and do not necessarily reflect the position of the Federal Reserve Bank of New York or the Federal Reserve System.

2 Introduction
new culture can be adopted to support the new business model. However, in the banking sector, the incumbents of weak banks continue their employment, and so the old culture persists for a while. Regulators and nonsupervisory advocates, including shareholders, citizen groups, and other interested parties, then propose a new culture with the goal of enhancing financial stabil-ity. Over time, the banks will try to strike a balance between the old and the new, and culture and governance will slowly evolve. A bank’s strategy and the behavior of its employees will coincide in ways not observed before the financial crisis, with the safety and soundness of the bank—at best a minor concern to employees in the pre-crisis world—now the goal of both. The bank will craft new measures of performance and productivity that reflect the priorities of the new culture. Still, the transition to the new culture will be gradual.
Why such a gradual transition? In a world of complete knowledge—or one in which governance is simpler to define—when regulators observe failure, it is straightfor-ward to determine the ultimate cause of that failure, and thus trivial to know which regulatory response is most fitting. Edmonson (2011) offers a useful “spectrum of reasons for failure” that ranges from deviance (“an indi-vidual chooses to violate a prescribed process or practice”) and lack of ability (“an individual doesn’t have the skills, conditions, or training to execute a job”) to process inade-quacy (“a competent individual adheres to prescribed but faulty or incomplete process”).3 Now, eight years past the financial crisis, it remains frustratingly difficult to untangle these various explanations, as well as the causal or enabling role of governance.
Why did firms that looked well-governed from the outside crumble under stressed market conditions or collapse as a result of outsized bets placed by a few from within the organization? Was their failure a failure of process, policy, or people? Were the risks calculated or accidental? At what level did the governance system break down? Despite our best efforts, we still have very few answers, including to the most important question of all: What should we do differently this time? And in our attempt to answer that question, what kind of research and insights could help?
A new approach to the pursuit of financial stability was advanced by Federal Reserve Bank of New York President William C. Dudley at the October 2014 Workshop on Reform-ing Culture and Behavior in the Financial Services Industry. In his remarks at the workshop, Dudley emphasized the role of corporate culture in banking and the importance of a deep understanding of the concept and its application to financial stability. Culture suggests that the way organizations manage
3 Amy C. Edmondson, “Strategies for Learning from Failure,” Harvard Business Review 89, no. 4 (April 2011).
themselves has a predictable economic effect, particularly with respect to the financial strength and soundness of the organization. A culture-centric view also focuses attention on employees and human behavior while recognizing the influ-ence of the firm’s asset structure and organizational design on performance and risk. The benefits of an effective culture arise in part from the culture’s contribution to internal information production and to the flow of this information to the entire organization (bottom-up and top-down) and to all stakehold-ers, including supervisors, in close to real time. The prompt disclosure of information, in effect, can help unmask the firm’s weak spots, whether they are driven by negligence or not.
The literature on the economics of culture, particularly in the banking industry, is small, and identification of key issues in culture and governance marks an important step toward achiev-ing soundness. This special volume of the Economic Policy Review is designed to foster a better understanding of corporate culture and governance—particularly as they apply to banking firms—among regulators, investors, researchers, and the interested public. The contributors to the volume analyze the topic from the perspective of several disciplines, including financial accounting, financial economics, and law and regulation. They also summa-rize and synthesize the literature on vital issues of culture and governance, and identify key areas for future research.
The volume is divided into two complementary parts. The first part, consisting of five articles, introduces the concept of culture and its importance to risk management and financial stability. The articles present a framework for diagnosing and changing culture, describe how corporate culture is transmitted and shaped, explore the importance of taking the optimal amount of risk, and examine the role of deferred cash compensation and bank cash holdings in promoting financial stability. The second part, featuring four articles, takes a closer look at several critical areas of corporate governance: the role of boards of directors, the monitoring function of large outside shareholders, the importance of financial disclosure and transparency, and the relationship between banks’ disclo-sure practices and performance.
In the appendix to the volume, I provide an extensive list of additional questions for future research. These questions extend and augment the important research presented in the volume and should help advance the burgeoning study of the role of culture and governance in banking.
Finally, it should be noted that this volume of the Economic Policy Review has been four years in the making. Offering insights in the growing area of financial stability viewed through the lens of human behavior, the volume will assist practitioners and researchers in their efforts to establish a stronger and healthier financial system in the United States and around the world.

FRBNY Economic Policy Review / August 2016 5
The author thanks Hamid Mehran for helpful comments. The views expressed are those of the author and do not necessarily reflect the position of the Federal Reserve Bank of New York or the Federal Reserve System.
To view the author’s disclosure statement, visit https://www.newyorkfed.org/research/author_disclosure/ad_epr_2016_corporate-culture_thakor.html.
Anjan Thakor is a research associate at the European Corporate Governance Institute and the John E. Simon Professor of Finance at Washington University in St. Louis.
Corporate Culture in Banking
Anjan Thakor
1. Introduction
Culture can be a very complex issue as it involves behaviours and attitudes. But efforts should be made by financial institutions and by supervisors to understand an institution’s culture and how it affects safety and soundness. While various defini-tions of culture exist, supervisors are focusing on the institution’s norms, attitudes, and behaviours related to risk awareness, risk taking, and risk management or the institution’s risk culture. (Financial Stability Board 2014)
The issue of corporate culture in banking has surfaced in recent discussions as a topic of pivotal significance for addressing two concerns: restoring public trust in the banking system and enhancing financial stability.1 With more than $100 billion in fines imposed on the largest financial institutions since the financial crisis, there is now a growing suspicion that ethical lapses in banking are not just the outcome of a few “bad apples”—such as rogue traders—but rather a reflection of systematic weaknesses. The lack of confidence in banking engendered by such mistrust may
1 See Federal Reserve Bank of New York President William Dudley’s speech “Enhancing Financial Stability by Improving Culture in the Financial Services Industry,” October 20, 2014. Available at http://www.newyorkfed.org/newsevents/speeches/2014/dud141020a.html.
invite more intrusive regulation, which could reduce risk but may also restrict lending. Given how essential banks are for economic growth and their complementarity with financial markets for channeling capital from savers to investors, this issue is of broad economic interest.2
In this dialogue, considerable attention has been paid to executive compensation in banking, with the prevailing view being that improperly structured pay was one of the culprits in the recent financial crisis (see, for example, Curry [2014]). This issue was addressed in the Dodd-Frank Act, which requires regulatory agencies to implement appropriate incentive-based compensation rules covering institutions with assets of $1 billion or more. The Office of the Comptroller of the Currency, for example, published a proposed rule in 2011 that is based on three principles: (1) incentive-based compen-sation should balance risk and reward, and should include deferred compensation and other mechanisms to reduce the sensitivity of compensation to short-term results; (2) com-pensation plans should be compatible with effective controls and risk management; and (3) incentive-based compensation should be supported by strong corporate governance.
Focus on compensation is a useful first step. But as import-ant as pay is for driving employee behavior, it is but one piece of the puzzle, and excessive reliance on compensation may actually distract attention from other important determinants of the decisions banks make. I am heartened by the growing
2 See, for example, Song and Thakor (2010).

6 Corporate Culture in Banking
recognition of bank regulators in the United States and Europe that organizational culture in banking is a crucially important factor in generating positive observable outcomes in banking. Culture not only determines the efficacy of com-pensation in influencing employee behavior, but it can also induce employees to work in a manner consistent with the stated values of the organization, particularly when achieving this outcome via formal contracts may be either costly—owing to bargaining, asymmetric information, and imperfect state observability—or infeasible (see Kreps [1990] and Song and Thakor [2016]). Cultural difference means that the same incentive-based compensation scheme can produce different behavioral outcomes in two banks.
It is easy to see, however, why culture has not been a big part of banking regulation. Variables like capital ratios and compensation are tangible and visible, so it is easy to target them in the formulation of regulations. Culture, by contrast, is a nebulous concept that often means different things to differ-ent people. Because it is fuzzy, culture tends to be overlooked. Moreover, we have a vast body of research on capital
Culture not only determines the
efficacy of compensation in influencing
employee behavior, but it can also induce
employees to work in a manner consistent
with the stated values of the organization,
particularly when achieving this outcome
via formal contracts may be either
costly . . . or infeasible.
requirements and incentive-based compensation, but precious little on culture, at least in economics. This omission too adds to the reasons why culture has received relatively scant atten-tion until recently in regulatory discourse. Yet, the inattention to the significance of culture has limited our ability to design regulations that proactively cope with foreseeable problems. It is unlikely, however, that future banking regulation will operate in a culture vacuum.
The purpose of this article is threefold. The first objective is to define culture and briefly consider the way culture has been viewed in the economics and organizational behavior literatures. The second goal is to introduce a framework to diagnose the attributes of a culture, formulate views about the preferred culture of an organization, and examine prac-tical ways in which a bank can undertake a change from the current to the preferred culture. The third purpose is
to discuss the regulatory policy implications of this way of thinking about bank culture.
This article draws its inspiration and many ideas from the previous work done on organizational culture. Kreps (1990) views culture, in a game-theoretic sense, as serving two goals: as a coordinating mechanism when there are multiple equi-libria and as a way to deal with unforeseen contingencies. In particular, he emphasizes the role that culture can play when inducing cooperation through formal contracts is costly or infeasible because of bargaining costs, moral hazard, and asymmetric information. Repeated interactions can help bring about outcomes that formal contracts cannot achieve efficiently, but they often generate multiple equilibria, leaving outcomes unpredictable. When multiple equilibria are pos-sible, it means that we cannot pin down theoretically which equilibrium outcome will occur, which some interpret as a kind of instability. Whether we view it as instability or not, it is at the very least something that represents a diminished ability to predict outcomes for any given set of actions by individuals and firms. In Kreps’ view, a strong organizational culture can facilitate the elimination of undesirable Nash equilibria. His work has important messages on two fronts. First, it offers a word of caution against relying excessively on formal compen-sation contracts in banking. Second, it makes the point that absent a strong culture as a coordinating mechanism, beliefs about the actions (such as misbehavior) of others can induce employees to behave unethically or take excessive risks.
Cremer (1993) argues that an organization’s culture is knowledge shared by the members of the organization, but not the general public.3 Culture acts as a substitute for explicit communication by providing a common language, shared knowledge of the facts, and shared knowledge of behavioral rules. Thus, with a strong culture, individual employees need not invest in acquiring organization-specific knowledge of rules. One result is that there are decreasing returns to scale when it comes to the benefits of culture. So as the organization grows larger and more complex, it is likely to develop subcultures in different divisions or business units. An important implication for banking is that large and complex financial services companies are likely to have a bigger challenge developing a uniform culture that guides the actions of all employees.
Hermalin (2001) describes culture as being either weak or strong and develops a model in which firms with strong cultures produce more in equilibrium than firms with weak cultures. The choice of strong versus weak culture is characterized as a choice between a high-fixed-cost,
3 Lazear (1995) focuses on culture as shared preferences or beliefs that arise from an evolutionary process within firms.

FRBNY Economic Policy Review / August 2016 7
low-marginal-cost regime (strong culture) and a low-fixed-cost, high-marginal-cost regime (weak culture). An important result is that the cost of developing a strong culture can be determined by the firm, but the benefit depends on the com-petitive environment. An implication for banking is that the actors in the industry must collaborate—or be induced to do so by regulators—to develop strong organizational cultures, or else short-term competitive pressures may diminish the value an individual bank attaches to developing a strong culture.
Akerlof and Kranton (2010) do not directly address the issue of organizational culture, but touch upon a related idea. They develop the concept of “identity economics,” in which an individual’s actions depend on the identity an individual associates with himself. Identity enters the indi-vidual’s utility function directly, and individuals can identify themselves as being firm “insiders” or “outsiders.” Insiders tend to expend high effort and outsiders low effort. A key result is that the presence of identity utility reduces the wage differential needed to induce the agent to expend high effort. The takeaway for banking is that culture may be a mechanism for changing the individual’s identity, and may help the bank to rely less on compensation strategy to encourage desired behavior.
Van den Steen (2010a) develops an interesting theory of culture based on two important ideas. The first idea, familiar from previous research, is that culture is about shared values and beliefs. The twist, though, is that beliefs may be heteroge-neous, and this divergence can lead to disagreement about the right course of action.4 He argues that corporate culture
Inattention to the significance of
culture has limited our ability to design
regulations that proactively cope with
forseeable problems. It is unlikely,
however, that future banking regulation
will operate in a culture vacuum.
“homogenizes” beliefs in three ways: screening in hiring (employees are chosen based on whether they share the beliefs that guide the organization, and they work harder knowing others do also); self-sorting (the employee’s utility depends on her manager’s actions); and joint learning. A key result is that corporate culture is stronger in older, smaller, and more suc-cessful (valuable) firms. Implications for banks are that growth
4 See also Boot, Gopalan, and Thakor (2006, 2008).
in size may be costly from the standpoint of culture, and that high charter values may be a significant ingredient in strong banking cultures.5
In a companion paper, Van den Steen (2010b) uses the same notion of culture as a set of shared beliefs and starts with the result that shared beliefs lead to increased delegation, higher utility, more effort, and less-biased communication. He then shows that a merger generally brings together two inter-nally homogeneous groups with beliefs and preferences that differ. As a consequence, the extent to which employees in the merged firm might share beliefs is lower than what it was in each firm before the merger. Thus, agency problems are higher in the combined firm. One thought-provoking implication is that regulators ought to consider the congruence of cultures when evaluating proposed bank mergers.6
While the focus in economics has been on explaining why culture matters for economic outcomes, there is an older and more extensive literature in organizational behavior that views culture as a mediating, endogenously chosen variable that affects individual and group behavior. Although less familiar to economists, the organizational behavior research has had greater direct impact than work in economics in terms of its use in companies.
The organizational behavior literature on culture is vast. I will not discuss it extensively here since my discussion of the Competing Values Framework (CVF) later in this article captures many of the key elements that have been covered in this field of research. Useful references are Deal and Kennedy (1982), Peters and Waterman (1982), Cartwright and Cooper (1993), and Cameron and Quinn (2011). In a nut-shell, this literature defines culture in terms of the descriptive categorizations of behavior associated with specific cultures, so that organizational leaders can predict more effectively how people will behave in a given culture and be influenced by explicit incentive-based compensation policies.7 The focus is thus on exploring the drivers and design of a culture. The exercise is normative in nature, and useful for leaders of banks who wish to understand how to develop a specific culture, as well as for banking regulators and supervisors who want to understand the kinds of behaviors a bank can be predicted to exhibit, given a specific culture.
5 This is reminiscent of Keeley (1990), who provided empirical evidence that banks with high charter values take less risk.6 Fiordelisi and Martelli (2011) examine the dependence of merger success in banking on the cultures of the merging banks.7 Bouwman (2013) provides a more extensive discussion.
8 Corporate Culture in Banking
The rest of this article is organized as follows. Section 2 defines culture and introduces the Competing Values Framework as an example of a framework for understanding culture. Section 3 extracts the main lessons of the CVF and combines them with insights from the economics lit-erature to build a set of considerations for bank executives and boards as well as for bank regulators and supervisors. Section 4 summarizes key findings.
2. A Framework for Culture
2.1 The Definition of Culture and the Challenge of Identifying Culture
I define culture as the collective assumptions, expectations, and values that reflect the explicit and implicit rules deter-mining how people think and behave within the organization. Culture includes a set of implicit contracts that enable the organization to delegate more effectively. Because the employ-ees have shared (homogenous) beliefs when the organization has a strong culture (Van den Steen 2010a) and employees use similar, simplified rules for decision making (Cremer 1993), it becomes easier for organizational leaders to dele-gate tasks to subordinates.
What the research shows is that when culture is aligned with strategy, it facilitates value creation and ensures more effective execution of strategy (see Cameron, DeGraff, Quinn, and Thakor [2014]). Most organizations grasp this. However, understanding is not enough—leaders must know how to diagnose and change the culture of the organization to achieve optimal performance.
This point is where things become difficult. Because culture is such a nebulous concept, it is often difficult for leaders to think about it in tangible terms, so the notion of culture sometimes ends up being blended into the organization’s statement of values or ethical behavior. While the values that the organization cherishes do affect its culture, this commingling of ethical behavior guidelines and culture into one expanded statement of values means that most employees will view culture merely as a set of guidelines to avoid unethical behavior—something nice to put on posters or walls, but hardly a guide for day-to-day decision making. In organizations where this happens, culture has little impact on the execution of strategy.
Culture is more than just a set of guidelines that define ethical behavior in the organization. As The Economist noted in an article discussing the way banks are run,
“The overall culture of the organization matters as much as the experience of the top brass, particularly when it comes to risk management.”8 However, to make culture an integral part of how the organization behaves, the follow-ing points are important to note:
• The culture of the organization must support the execution of the organization’s growth strategy.
• The strategy of the organization must specify how resources—human and financial—will be allo-cated to various activities.
• An important consideration in assessing leadership capabilities of employees should be their respect for and practice of the culture.
When these three conditions are met, culture is actually “practiced” in the sense that day-to-day operating decisions are made in a manner consistent with the organization’s strat-egy and its way of thinking. However, it should be apparent that for these conditions to be met, there must be a shared understanding of what culture is. To start, leaders must iden-tify the culture of the organization and then communicate it clearly up and down the line in succinct, easily comprehended language. This challenge, in my view, is a major one because of the inherent complexity of organizational culture and the myriad ways in which culture operates within the organiza-tion. How can such complexity be communicated in simple terms so that culture becomes a part of the daily rhythm of organizational decision making?
Cameron, DeGraff, Quinn, and Thakor (2014) point out that, when it comes to understanding inherently complex concepts, one must seek the help of a “master” rather than an “expert.” An expert is cognizant of the complexity of a phenomenon and therefore aware of its multiple and compli-cated elements. The expert’s explanation of the phenomenon is elaborate and intricate, so the complexity of the idea is conveyed, but not in simple terms. In contrast, a master understands a concept in so much greater detail and depth than the expert that he is able to explain it in very plain terms and in a manner that the whole organization can grasp. In the next subsection, I describe a framework that has been used extensively to define and communicate culture. This approach should be viewed merely as an example. There may be other frameworks for diagnosing culture that may be used as well, as long as they are simple and effective.
8 “Tightrope Artists,” The Economist, May 15, 2008.

FRBNY Economic Policy Review / August 2016 9
2.2 The Competing Values Framework
The Competing Values Framework, depicted in Exhibit 1, pro-vides a way to characterize organizational culture in simple, easy-to-communicate terms. Developed in the organizational behavior literature (see, for example, Quinn and Cameron [1983], Quinn and Rohrbaugh [1983], Quinn [1988], and Cameron and Quinn [2011]), this framework is widely used by organizations (see, for example, ten Have et al. [2003]).
The CVF begins with the observation that organizations engage in countless activities to create value, but the vast majority of these activities can be put into one of the four cat-egories or quadrants depicted in the exhibit above: Collaborate (Clan), Control (Hierarchy), Compete (Market), and Create (Adhocracy). The action verbs are the labels from Cameron, DeGraff, Quinn, and Thakor (2014). We have found them to be more useful when working with organizations on cultural diagnosis and intervention than the words in the parentheses, which are the labels from the original research in organiza-tional behavior. I will now discuss each quadrant.
Collaborate: Value-enhancing activities in this quadrant deal with building human competencies, developing people, and encouraging a collaborative environment. The approach to change in this quadrant is deliberate and thoughtful because the reliance is on consensual and cooperative processes. Leadership development, employee satisfaction and morale, the creation of cross-functional work groups, employee retention, teamwork, and decentralized decision making are all areas of focus in this quadrant. Organizational effectiveness is associated with human capital development and high levels of employee engagement.
Control: Value-enhancing activities in this quadrant include the pursuit of improvements in efficiency through better processes. The goal is to make things better, at lower cost, and with less risk. One of the hallmarks of this category is achieving a high degree of statistical predictability in out-comes. Organizational effectiveness is associated with capable processes, measurement, and control. Examples of activities in this quadrant include risk management, auditing, planning, statistical process control, Six Sigma and Lean Six Sigma
Individuality and Flexibility
Stability and Control
Stability Control
Inte
rnal
Mai
nten
ance
External P
ositio
ning
NewchangeLo
ng-te
rm
chan
ge
Fast
chan
ge
Incremental
change
Exhibit 1
The Competing Values Framework
Culture type: Clan
Orientation: Collaborate
Leader type: Facilitator Mentor Teambuilder
Value drivers: Commitment Communication Development
Theory of Human development and higheffectiveness: commitment produce effectiveness
Culture type: Hierarchy
Orientation: Control
Leader type: Coordinator Monitor Organizer
Value drivers: Ef�ciency Timeliness Consistency and uniformity
Theory of Control and ef�ciency with capableeffectiveness: processes produce effectiveness
Culture type: Adhocracy
Orientation: Create
Leader type: Innovator Entrepreneur Visionary
Value drivers: Innovative outputs Transformation Agility
Theory of Innovativeness, vision, and consistenteffectiveness: change produce effectiveness
Culture type: Market
Orientation: Compete
Leader type: Hard-driver Competitor Producer
Value drivers: Market share Goal achievement Pro�tability
Theory of Aggressively competing and customereffectiveness: focus produce effectiveness

10 Corporate Culture in Banking
techniques for improving manufacturing processes, and so on. These activities make the organization function more smoothly, efficiently, and predictably.
Compete: Value-enhancing activities involve being aggres-sive and forceful in the pursuit of competitiveness. Activities in this quadrant involve monitoring market signals and emphasizing interactions with external stakeholders, custom-ers, and competitors. The focus is on customer satisfaction and delivering shareholder value. A mantra here might be “compete hard, move fast, and play to win.” Organizational effectiveness is associated with achieving desired outcomes—such as profits, market share, and shareholder value—with speed. Market domination is a goal.
Create: Value-enhancing activities in this quadrant involve innovation in the organization’s products and services. A mantra of this quadrant might be “create, innovate, and envision the future.” Organizations that excel in this category effectively handle discontinuity, change, and risk. They allow freedom of thought and action among employees, so thoughtful “rule breaking” and stretching beyond the existing boundaries are commonplace. Organizational effectiveness is associated with entrepreneurship, vision, new ideas, and constant change.
2.3 Tensions within the Framework
To understand the CVF, one must examine the similarities and differences between the quadrants. Consider first the Collaborate and Control quadrants, both of which are inter-nally focused. Collaborate focuses on the “human capital” within the organization—its employees and their harmony, retention and morale, teams, leadership development, and so on. Control focuses on the “process capital” within the orga-nization—the manner in which internal processes are used to achieve efficiency and predictability of outcomes.
By contrast, the Compete and Create quadrants are outwardly focused. Compete is focused on the customers, competitors, markets, and opportunities that exist today, while Create is focused on the customers, competitors, markets, and opportunities that will exist in the future.
So one dimension of similarity and difference is whether there is an internal or external focus. In this dichotomy, Collaborate and Control stand on one side—characterized by an internal focus—and Compete and Create stand on the other side—characterized by an external focus.
A second dimension along which one can compare the quadrants is in the degree of their focus on stability and control as against individuality and flexibility. On this dimen-sion, Control and Compete share an emphasis on stability and
control. These quadrants place importance on tangible and measurable outputs, where the rules for how best to operate are well known. Leadership style tends to be prescriptive, and organizations often have detailed manuals describing how things should be done. The time horizon for achieving results is typically short. By contrast, Collaborate and Create involve a great deal more individuality and flexibility. The rules of success are not as well defined, and more experimen-tation is encouraged. Leadership style is more participative than prescriptive, and the time horizon for achieving results is typically longer.
A key insight of the CVF is that diagonally opposite quad-rants have nothing in common. That is, Collaborate shares no similarity with Compete, and Control shares nothing with Create. Indeed, one can make an even stronger statement: at the margin, these quadrants pull the organization in opposite directions. Any resources allocated to one quadrant pull the organization away from its diagonal opposite. In a sense, the quadrants represent competing forms of value creation. This split creates inherent tensions within the organization, as stakeholders at opposite ends engage in a veritable tug-of-war as they compete for resources to devote to the activities they believe will create the most value. These competing views and beliefs about what creates value can be considered similar to the disagreement stemming from heterogeneity described by Van den Steen (2010a, 2010b).
Collaborate
50
40
30
20
10
50
40
30
20
10
Create
Control Compete
Exhibit 2
A Competing Values Framework Culture Map

FRBNY Economic Policy Review / August 2016 11
When an organization chooses its culture, it is effec-tively deciding its relative degrees of emphasis on the four quadrants in Exhibit 2. This picture of culture would typi-cally be constructed on the basis of a survey of employees in the organization, using a diagnostic instrument (see Cameron and Quinn [2011]). The usefulness of this pictorial depiction of culture is that:
• it can communicate the organization’s culture to all key stakeholders;
• it clarifies how the organization will allocate resources to execute its growth strategy;
• it becomes a guide for the organization’s hiring, develop-ment, and retention processes; and
• it serves as a mechanism to coordinate beliefs and guide day-to-day decision making.
2.4 Adapting the CVF to Analyze Credit Culture in a Bank
The use of the CVF is not limited to analyzing the culture that supports the overall growth strategy of the organization; the framework can also be used to analyze specific aspects of the overall culture, such as those relating to the credit risk-management of the bank.9 Exhibit 3 shows what the four quadrants of the CVF would translate into when it comes to credit culture (which reflects the values, norms, and formal and informal practices that pertain to how the organization makes credit decisions and manages credit risk).
A credit culture that emphasizes Collaborate would be a partnership culture, one in which employees would find it beneficial to work in collaborative, cross-functional teams. This quality may perhaps be viewed as a dominant aspect of the culture that existed in U.S. investment banks before they became publicly traded corporations, and it is the culture that currently exists among Farm Credit System banks.
A credit culture that emphasizes Control would be a risk-minimization culture, in which a great deal of importance is placed on rigorous credit analysis and post-lending mon-itoring of adherence to covenants, with a low tolerance for default risk. Growth would be sacrificed in the interest of pru-dence and safety. There would be tight controls, and violations of process guidelines would not be tolerated.
9 Clearly, the credit culture in a bank has to be consistent with the overall culture that supports its growth strategy. However, describing the credit culture separately enables a focus on details relating to the credit risk management of the bank.
A credit culture that emphasizes Compete would be a com-petitive, individual-performance-oriented culture, in which employee bonuses depend on exceeding performance targets, the ratio of bonus to base pay would be high, and market share gains and revenue growth would be greatly valued. Such firms will display an appetite for acquisitions and will value decisive, fast-moving, and aggressive employees.
A credit culture that emphasizes Create would be one focused on product innovation and organic growth. In such an environment, experimentation with new products would be encouraged. So firms with this culture would extend secu-ritization to new asset classes, devise new contracts providing an expanding array of individuals and firms with access to the credit market, design new instruments for hedging and transferring risk, and so on. The investment banking industry in the United States has been a leader in financial innovation because it places a greater degree of emphasis on product cre-ation than its counterparts in other areas of the world.10
A key message of the CVF is that while most banks will have an organizational culture that spans all four quadrants, each bank will typically be strongest in one quadrant, and this strength will have a large influence on how the bank operates, where it is most successful, and what it finds most challenging. For example, a bank with a Create culture will consistently come out with new financial products and achieve a high level of organic growth, but will have the most difficulty maintaining consistent risk-control standards and eliminating regulatory compliance errors. Similarly, a bank with a Compete credit culture will be fiercely competitive in the marketplace, winning most of its market share battles, and will grow aggressively through acquisitions. Its biggest challenges will be creating trust
10 Boot and Thakor (1997) develop a theory that explains why U.S. investment banks have been more successful in financial innovation than investment banks in Europe.
Partnership culture
CollaborateCreate
Control Compete
Credit culture
Product-innovation-focused culture
Risk-minimization-focused culture
Competitive,individual culture
Exhibit 3
Credit Culture

12 Corporate Culture in Banking
among employees within the organization, achieving collabora-tion, and having a high employee retention rate.
2.5 Diagnosing and Changing Culture Using the CVF
The CVF enables any organization to assess its current culture as well as its preferred culture. Using a diagnostic instrument that has been validated by extensive research in organizational behavior, it is possible to conduct a survey of any subset of the organization’s employees about organizational practices and individual behaviors.11 The responses can then be aggregated and averaged in order to produce a map of the current and preferred cultures, as shown in Exhibit 4.
The unbroken lines in the exhibit depict the current culture of the organization, and the broken lines depict the preferred culture. In this case, the organization wishes to shift from a focus on control and stability (the Control quadrant) to a focus on flexibility, collaboration (the Collaborate quadrant), and innovation (the Create quadrant). Knowing this goal, the organization can engage the organization in a discus-sion of how this change in culture can be achieved, a topic addressed in the next subsection.
The CVF is currently a leading method used in assessing organization culture. Several consulting firms have employed this framework to organize items on their climate and culture instruments (see, for example, DeGraff and Quinn [2006]).
2.6 Levers for Changing Culture
There are primarily four levers that must be pulled in order to change culture: performance metrics for judging individuals, projects, and business units; compensation; processes for decision making and resource allocation; and behaviors to encourage, tolerate, and punish.
Consider performance metrics. Many organizations rec-ognize the importance of having their executives develop the leadership abilities of those who report to them, so that the individuals they supervise can become future leaders. However, mentoring and coaching are time-consuming activities, so quite often there is an under-provision of effort to this task. One organization that attaches high value to this activity altered performance metrics to encourage more investment of time and
11 See Cameron and Quinn (2011) for a complete discussion of the Organizational Cultural Assessment Instrument. See Cameron, DeGraff, Quinn, and Thakor (2014) for a rebuttal of criticisms of the CVF in the organizational behavior literature.
effort in this activity. Specifically, every leader, in collaboration with his or her supervisor, is asked annually to evaluate all direct reports on their readiness for leadership, specifically their readiness to replace their boss. Just as criteria can be set for promotion, they can also be prescribed for dismissal.12
Compensation design also has a big impact on how employees behave. In banking, there is a greater emphasis on return on equity (ROE) for computing executive bonuses than in any other industry.13 It is not surprising then that bankers are averse to higher capital requirements, since holding higher capital leads to a lower ROE, other things equal. Similarly, if loan officers are compensated for growth in loan volume, then they will have incentives to grow loan volume with far less emphasis on credit quality.14 A culture that emphasizes Collaborate and Create will wish to rely more on deferred compensation, perhaps imposing a longer compensation “duration.”15
12 As Jack Welch, former chairman and chief executive officer of General Electric, said in an interview with Stuart Varney on CEO Exchange in 2001, any organization that fails to root out and dismiss those who deliver great results but disrespect the culture cannot talk credibly about values.13 See Bennett, Gopalan, and Thakor (2012).14 See Acharya and Naqvi (2012) for a theory of how such compensation incentives for loan officers sow the seeds of crises.15 See Gopalan, Milbourn, Song, and Thakor (2014) for a definition of empirical evidence on compensation duration.
Collaborate
Current culture
Preferredculture
50
40
30
20
10
50
40
30
20
10
Create
Control Compete
Exhibit 4
Changing Organizational Culture

FRBNY Economic Policy Review / August 2016 13
Processes also matter for culture. For example, if an orga-nization has numerous checks and balances in its resource allocation—typical of a strong Control culture—then its employees are unlikely to allocate significant resources to the pursuit of new products and services. A reason for this is that often there is considerable disagreement over whether an innovation is worth introducing.16
Finally, one should not underestimate the importance of the behaviors that leaders encourage, tolerate, and punish. If leaders are vocal about these behaviors and reinforce their views with action in terms of rewards and punishments, then they will be able to influence behavior that supports the preferred culture.
3. Implications for Banks, Regulators, and Supervisors
In this section, I summarize the key lessons from the research on culture in economics and the CVF, discuss what leaders of banks and other financial services organizations can learn, and conclude with some takeaways for bank regulators and supervisors.
3.1 Summary of Insights
• A bank’s culture must support the execution of its growth strategy, so that the culture affects all aspects of decision making. In other words, culture is much more than a statement about ethical behavior in banks; it is embedded in operations overall, such as how employees are hired, rewarded, and fired, how resources are allocated, and how risks and opportunities are managed.
• A strong culture can act as a coordination mechanism to eliminate Nash equilibria in which employees behave badly, and can help to achieve (desirable) outcomes that cannot be reached with formal contracts (such as incentive-based compensation) alone.
• It is more challenging to have a strong culture that operates effectively and consistently in a large and complex bank since subcultures are likely to emerge, leading employees to identify first with their business unit and then with the bank. Size creates the potential for more intrabank competition and behavior that is at odds with the bank’s preferred culture.
16 See, for example, Thakor (2012).
• The benefit to a bank from developing a strong culture may depend on the competitive structure of the banking indus-try. Smaller, older, and more successful banks are likely to have stronger cultures.
• A strong culture can change an employee’s “identity” in a positive way and allow the bank to rely less on incentive compensation to induce the desired behavior.
• If two banks with disparate cultures merge, there will be greater disagreement over decision making and higher agency costs than in either bank before the merger. This outcome is especially likely if the merging banks had cultures that were strong in diagonally oppo-site quadrants of the CVF.
• There is no such thing as a uniquely best culture. Because culture must support the bank’s growth strategy and banks have different strategies, there is likely to be a distinct preferred culture for each bank.
• There are four types of cultural orientation: Collaborate, Control, Compete, and Create. In a two-by-two matrix, there are inherent tensions between diagonally opposite quadrants representing competing forms of value creation—Collabo-rate versus Compete, and Control versus Create. Choosing a preferred culture therefore invariably involves trade-offs, and being very strong in one dimension often creates a weakness or a blind spot in another dimension.
3.2 Lessons for Bank Executives
Bank chief executive officers, other senior executives, and board directors should have much to mull over on the issue of bank culture. As Federal Reserve Bank of New York President William Dudley’s remarks in a 2014 speech indicate, if banks do not develop robust cultures that eliminate ethical lapses, regulators may have to step in.17 The most important take-aways for senior bank leaders are outlined here.
First, leaders should articulate a sense of higher purpose for the bank that transcends business goals but also intersects with these goals.18 Usually, a higher purpose is customer-centric, employee-centric, or designed to serve society. For example, Zingerman’s, a deli in Ann Arbor, Michi-gan, aims to develop its employees as entrepreneurs and to give customers the best restaurant experience possible. A higher purpose for a financial services firm is to help its clients manage their finances so that they can provide better lives for their
17 Dudley (2014). 18 See Thakor and Quinn (2014) for a discussion of the economics of higher purpose.
14 Corporate Culture in Banking
children and grandchildren. Howard Schultz, chairman and CEO of Starbucks, articulated a purpose for the coffee company of offering that “third place between work and home.” Whatever a bank’s stated objective, if it looks for the intersection of its growth strategy with that higher purpose and then ties its culture to it, the effect can be significantly positive. Research has shown that when employees truly believe that the organization is driven by a higher purpose that transcends the usual business goals and that this higher purpose actually affects the growth strategy and business decisions of the organization, agency problems are smaller and employees work harder.19
Second, leaders should do a diagnostic survey to get a sense of the bank’s existing and preferred cultures.
Third, leaders can engage in a cultural-change exercise using the levers discussed in the previous section.
Fourth, leaders should be cognizant of the tensions and trade- offs between the bank’s growth strategy and preferred culture.
Finally, before finalizing a merger, leaders should con-sider the compatibility of the cultures of the merging banks, based on a cultural diagnosis.
3.3 Takeaways for Bank Regulators and Supervisors
Currently, much of the focus of bank regulators, when it comes to culture, appears to be on ensuring ethical behavior and cur-tailing risk taking in banks. In light of the events surrounding the crisis of 2007-09, this approach is understandable. However, the CVF provides a word of caution on this point—an excessive focus on Control can kill Create. So the key takeaways for bank supervisors are the following: First, it may be valuable to examine the practices of promotion and compensation to enhance understanding of an organization; the criteria for both will be quite informative about a bank’s culture.
Second, while it is not surprising that bank supervisors emphasize the Control quadrant of the CVF more than banks themselves will, it would nonetheless be useful to consider the fact that an excessive focus on goals like predictability can hurt financial innovation, with negative consequences for growth. Thus, a balanced and nuanced approach is needed.
Third, in addition to focusing on deferred compensation as a way to encourage more long-term thinking, it may
19 See Thakor and Quinn (2014) and the references therein. A customer-centric higher purpose can also foster the development of a stronger “relationship banking” culture, thereby helping to reduce inefficiencies in formal intertemporal contracts with customers (see Boot and Thakor [1994] for an analysis of these in a relationship banking context), and can provide a barrier to protect relationship banking profits against competitive erosion.
be valuable to consider formulating guidelines based on the compensation duration measure recently developed in the literature (see, for example, Gopalan, Milbourn, Song, and Thakor [2014]).
Fourth, large and complex banks are likely to find it more challenging to have a single overarching culture, so subcultures are likely to emerge. It will be important to understand the characteristics of these subcultures.
Finally, in the case of bank mergers, the cultural compati-bility of the two banks is an important determinant of success. Large mergers—like Daimler-Chrysler and Citi-Travelers—have often failed owing to cultural incompatibility.20
4. Conclusion
In this article, I have discussed the issue of culture in banking, reviewing the relatively small literature on culture in economics and describing a CVF framework—developed in the organizational behavior field—as an example of a conceptual tool to diagnose and change culture.
Numerous important takeaways—detailed in the preceding section—emerge from this exercise. There are common lessons for all, but the messages for senior bank executives and bank regulators and supervi-sors are more specialized.
A strong bank culture—one that supports the bank’s growth strategy and consistently influences employee behavior—can be a form of “off-balance-sheet capital” for the bank. It can reassure regulators that there will be prudent risk taking in the bank and adherence to ethical standards, while also providing the bank a basis for enhanced and sustainable value creation. This is good both for financial stability—as a useful complement to a high level of equity capital in banking—and economic growth.21
Much more research is needed on this subject. We know already that culture and trust at the national level affect trade and economic outcomes (see Guiso, Sapienza, and Zingales [2009]), and that corporate governance affects culture in organizations (see Guiso, Sapienza, and Zingales [2015]). A strong corporate culture can also be used to foster trust within banks, with positive consequences for ethical behavior and stability.
20 Bouwman (2013) discusses numerous case studies of mergers that failed due to lack of cultural compatibility. Fiordelisi and Martelli (2011) empirically examine the impact of culture on the success of mergers in U.S. and European banking.21 Thakor (2014) provides an extensive review of the role of bank capital in influencing financial market outcomes and financial stability overall.
FRBNY Economic Policy Review / August 2016 15
References
Acharya, V., and H. Naqvi. 2012. “The Seeds of a Crisis: A Theory of Bank Liquidity and Risk Taking over the Busi-ness Cycle.” Journal of Financial Economics 106, no. 2 (November): 349-66.
Akerlof, G. A., and R. E. Kranton. 2010. Identity Economics: How Our Identities Shape Our Work, Wages, and Well-Being. Princeton, N.J.: Princeton University Press.
Bennett, B., R. Gopalan, and A. V. Thakor. 2015. “The Structure of Bankers’ Pay.” Working paper, Washington University in St. Louis.
Boot, A., and A. V. Thakor. 1994. “Moral Hazard and Secured Lending in an Infinitely Repeated Credit Market Game.” Inter-national Economic Review 35, no. 4 (November): 899-920.
———. 1997. “Banking Scope and Financial Innovation.” Review of Financial Studies 10, no. 4 (October): 1099-1131.
———. 2000. “Can Relationship Banking Survive Competition?” Journal of Finance 55, no. 2 (April): 679-713.
Boot, A., R. Gopalan, and A. V. Thakor. 2006. “The Entrepreneur’s Choice between Private and Public Ownership.” Journal of Finance 61, no. 2 (April): 803-36.
———. 2008. “Market Liquidity, Investor Participation, and Man-agerial Autonomy: Why Do Firms Go Private?” Journal of Finance 63, no. 4 (August): 2013-59.
Bouwman, C. 2013. “The Role of Corporate Culture in Mergers and Acquisitions.” In E. Perrault, ed., Mergers and Acquisitions: Practices, Performance, and Perspectives. New York: Nova Science Publishers, Inc.
Cameron, K. S., and R. E. Quinn. 2011. Diagnosing and Changing Organizational Culture. San Francisco: John Wiley & Sons, Inc.
Cameron, K. S., J. DeGraff, R. E. Quinn, and A. V. Thakor. 2014. Competing Values Leadership. Northampton, Mass.: Edward Elgar Publishing.
Cartwright, S., and C. Cooper. 1993. “The Role of Culture Com-patibility in Successful Organizational Marriage.” Academy of Management Executive 7, no. 2 (May): 57-70.
Cremer, J. 1993. “Corporate Culture and Shared Knowledge.” Indus-trial and Corporate Change 2, no. 3 (January): 351-86.
Curry, T. J. 2014. “Keynote Remarks.” Remarks delivered at the Annual Conference of the Clearing House Association, New York City, November 21.
Deal, T. E., and A. A. Kennedy. 1982. Corporate Cultures: The Rites and Rituals of Corporate Life. Reading, Mass.: Addison-Wesley Publishing.
DeGraff, J., and S. E. Quinn. 2006. Leading Innovation: How to Jump Start Your Organization’s Growth Engine. New York: McGraw-Hill.
Dudley, W. 2014. “Enhancing Financial Stability by Improving Culture in the Financial Services Industry.” Remarks delivered at the Federal Reserve Bank of New York’s Workshop on Reform-ing Culture and Behavior in the Financial Services Industry, New York City, October 20. Available at: https://www.newyorkfed .org/newsevents/speeches/2014/dud141020a.html.
Financial Stability Board. 2014. “Guidance on Supervisory Interaction with Financial Institutions on Risk Culture: A Framework for Assessing Risk Culture.” Available at http://www.financialstabilityboard.org/2014/04/ guidance-on-supervisory-interaction-with-financial-institutions -on-risk-culture-a-framework-for-assessing-risk-culture-2/.
Fiordelisi, F., and D. Martelli. 2011. “Corporate Culture and Merger Success in Banking.” Working paper, University of Rome.
Gopalan, R., T. Milbourn, F. Song, and A. V. Thakor. 2014. “Duration of Executive Compensation.” Journal of Finance 69, no. 6 (December): 2777-2817.
Guiso, L., P. Sapienza, and L. Zingales. 2009. “Cultural Biases in Economic Exchange?” Quarterly Journal of Economics 124, no. 3 (August): 1095-1131.
———. 2015. “ The Value of Corporate Culture.” Journal of Finan-cial Economics 117, no. 1 (July): 60-75.
Hermalin, B. E. 2001. “Economics and Corporate Culture.” In C. Cooper, S. Cartwright, and P.C. Early, eds., The Inter-national Handbook of Organization Culture and Climate. Chichester, England: John Wiley & Sons, Ltd.

16 Corporate Culture in Banking
References (Continued)
The views expressed are those of the author and do not necessarily reflect the position of the Federal Reserve Bank of New York or the Federal Reserve System. The Federal Reserve Bank of New York provides no warranty, express or implied, as to the accuracy, timeliness, completeness, merchantability, or fitness for any particular purpose of any information contained in documents produced and provided by the Federal Reserve Bank of New York in any form or manner whatsoever.
Keeley, M. 1990. “Deposit Insurance, Risk, and Market Power in Banking.” American Economic Review 80, no. 5 (Decem-ber): 1183-1200.
Kreps, D. M. 1990. “Corporate Culture and Economic Theory.” In J.E. Alt and K.A. Shepsle, eds., Perspectives on Positive Political Economy. Cambridge: Cambridge University Press.
Lazear, E. P. 1995. “Corporate Culture and Diffusion of Values.” In H. Siebert, ed., Trends in Business Organization: Do Par-ticipation and Cooperation Increase Competitiveness? Tübingen, Germany: J.C.B. Mohr/Paul Siebeck.
Peters, T., and R. H. Waterman, Jr. 1982. In Search of Excel-lence: Lessons from America’s Best-Run Companies. New York: Harper & Row.
Quinn, R. E. 1988. Beyond Rational Management: Mastering the Paradoxes and Competing Demands of High Perfor-mance. San Francisco: Jossey-Bass, Inc.
Quinn, R. E., and K. Cameron. 1983. “Organizational Life Cycles and Shifting Criteria for Effectiveness.” Management Science 29, no.1 (January): 33-51.
Quinn, R. E., and J. Rohrbaugh. 1983. “A Spatial Model of Effec-tiveness Criteria: Towards a Competing Values Approach to Organizational Analysis.” Management Science 29, no. 3 (March): 363-377.
Song, F., and A. V. Thakor. 2010. “Financial System Architecture and the Co-evolution of Banks and Markets.” The Economic Journal 120, no. 547 (September):1021-55.
Song, F., and A. V. Thakor. 2016. “Bank Culture.” Working paper, Washington University in St. Louis.
ten Have, S., W. ten Have, F. Stevens, M. van der Elst, and F. Pol-Coyne. 2003. Key Management Models: The Management Tools and Practices that Will Improve Your Business. London: FT Prentice-Hall.
Thakor, A. V. 2012. “Incentives to Innovate and Financial Crises.” Journal of Financial Economics 103, no. 1 (January): 130-148.
———. 2014. “Bank Capital and Financial Stability: An Economic Trade-off or a Faustian Bargain?” Annual Review of Financial Economics 6: 185-223.
Thakor, A. V., and R. E. Quinn. 2014. “The Economics of Higher Purpose.” Working paper, Washington University in St. Louis and University of Michigan.
Van den Steen, E. 2010a. “On the Origin of Shared Beliefs (and Corporate Culture).” RAND Journal of Economics 41, no. 4 (Winter): 617-48.
———. 2010b. “Culture Clash: The Costs and Benefits of Homogene-ity.” Management Science 56, no. 10 (December): 1718-38.
The views expressed are those of the author and do not necessarily reflect the position of the Federal Reserve Bank of New York or the Federal Reserve System. The Federal Reserve Bank of New York provides no warranty, express or implied, as to the accuracy, timeliness, completeness, merchantability, or fitness for any particular purpose of any information contained in documents produced and provided by the Federal Reserve Bank of New York in any form or manner whatsoever.
what is now the Haas School of Business of the University of California at Berkeley. The speaker? Ivan Boesky, who would be convicted just eighteen months later in an insider trading scandal.1
Millions of people saw Wall Street, and Gekko’s monologue became part of popular culture. Hundreds, perhaps thousands, of young people were inspired to go into finance as a result of Douglas’s performance. This dismayed Stanley Weiser, the co-writer of the screenplay, who met many of these young people for himself. As Weiser wrote in 2008 at the height of the financial crisis, “A typical example would be a business executive or a younger studio development person spouting something that goes like this: ‘The movie changed my life. Once I saw it I knew that I wanted to get into such and such business. I wanted to be like Gordon Gekko.’ . . . After so many encounters with Gekko
1 Bob Greene, “A $100 Million Idea: Use Greed for Good,” Chicago Tribune, December 15, 1986; James Sterngold, “Boesky Sentenced to 3 Years in Jail in Insider Scandal,” New York Times, December 19, 1987.
1. Introduction
In the 1987 Oliver Stone film Wall Street, Michael Douglas delivered an Oscar-winning performance as financial “Master of the Universe” Gordon Gekko. An unabashedly greedy corporate raider, Gekko delivered a famous, frequently quoted monologue in which he described the culture that has since become a caricature of the financial industry:
The point is, ladies and gentleman, that greed, for lack of a better word, is good. Greed is right, greed works. Greed clarifies, cuts through, and captures the essence of the evolutionary spirit. Greed, in all of its forms, greed for life, for money, for love, knowledge, has marked the upward surge of mankind. And greed, you mark my words, will not only save Teldar Paper, but that other malfunctioning corporation called the USA.
Despite the notoriety of this encomium to enlightened self-interest, few people know that these words are based on an actual commencement speech delivered in 1986 at
FRBNY Economic Policy Review / August 2016 17
Andrew W. Lo
The Gordon Gekko Effect:The Role of Culture in the Financial Industry
The author thanks Tobias Adrian, Brandon Becker, Chyhe Becker, Roland Bénabou, Natasha Burns, Jakob de Haan, Leigh Hafrey, Joseph Haubrich, Claire Hill, Ed Kane, Joseph Langsam, Hamid Mehran, Adair Morse, Christine Nolder, Antoinette Schoar, Tracy Wang, seminar participants at Harvard Law School and the U.S. Securities and Exchange Commission, and participants at the October 2014 FAR meeting, the May 2015 Consortium for Systemic Risk Analytics, and the November 2015 Wharton Culture and Ethics Banking Workshop for helpful comments and discussions; and Jayna Cummings for editorial assistance. The views expressed in this article are those of the author and do not necessarily reflect the position of the Federal Reserve Bank of New York or the Federal Reserve System.
https://www.newyorkfed.org/research/author_disclosure/ad_epr_2016 _gordon-gekko-effect_lo.html.
Andrew W. Lo is the Charles E. and Susan T. Harris Professor at the MIT Sloan School of Management, director of the MIT Laboratory for Financial Engineering, and principal investigator at the MIT Computer Science and Artificial Intelligence Laboratory.

18 The Role of Culture in the Financial Industry
admirers or wannabes, I wish I could go back and rewrite the greed line to this: ‘Greed is good. But I’ve never seen a Brinks truck pull up to a cemetery.’”2
What makes this phenomenon truly astonishing is that Gekko is not the hero of Wall Street—he is, in fact, the villain. Moreover, Gekko fails in his villainous plot, thanks to his young protégé-turned-hero, Bud Fox. The man whose words Weiser put into Gekko’s mouth, Ivan Boesky, later served several years in a federal penitentiary for his wrongdoings. Nevertheless, many young people decided to base their career choices on the screen depiction of a fictional villain whose most famous lines were taken from the words of a convict. Culture matters.
This is a prime example of what I propose to call “the Gekko effect.” It is known that some cultural values are positively correlated to better economic outcomes, perhaps through the channel of mutual trust.3 Firms with stronger corporate cultures, as self-reported in surveys, appear to perform better than those with weaker cultures, through the channel of behavioral consis-tency, although this effect is diminished in a volatile environment (Gordon and DiTomaso 1992; Sørensen 2002). However, not all strong values are positive ones. The Gekko effect highlights the fact that some corporate cultures may transmit negative values to their members in ways that make financial malfeasance significantly more probable. To understand these channels and formulate remedies, we have to start by asking what culture is, how it emerges, and how it is shaped and transmitted over time and across individuals and institutions.
2. What Is Culture?
What do we mean when we talk about corporate culture? There are, quite literally, hundreds of definitions of culture. In 1952, the anthropologists A.L. Kroeber and Clyde Kluckhohn listed 164 definitions that had been used in the field up to that time, and to this day we still do not have a singular definition of culture. This article does not propose to solve that problem but merely to find a working definition to describe a phenomenon. Kroeber and Kluckhohn settled on the following: “Culture consists of patterns, explicit and implicit, of and for behavior acquired and transmitted by symbols, constituting the distinctive achievements of human groups, including their embod-iments in artifacts” (Kroeber and Kluckhohn 1952, 35). Embedded in this seemingly straightforward and intuitive
2 Stanley Weiser, “Repeat after Me: Greed Is Not Good,” Los Angeles Times, October 5, 2008.3 For example, see Guiso, Sapienza, and Zingales (2006).
definition is an important assumption that we shall revisit and challenge below—that culture is transmitted rather than innate—but that we will adopt temporarily for the sake of exposition and argument.
A corporate culture exists as a subset of a larger culture, with variations found specifically in that corporate entity. Again, there are multiple definitions. The organizational theorists O’Reilly and Chatman define corporate culture as “a system of shared values that define what is important, and norms that define appropriate attitudes and behaviors for organizational members” (O’Reilly and Chatman 1996, 166), while Schein defines it in his classic text as “a pattern of shared basic assumptions that was learned by a group . . . that has worked well enough to be considered valid and, therefore, to be taught to new members as the correct way to perceive, think, and feel in relation to [the group’s] problems” (Schein 2004, 17).
The key point here is that the distinctive assumptions and values of a corporate or organizational culture define the group. These assumptions and values will be shared within the culture, and they will be taught to newcomers to the culture as the correct norms of behavior. People who lack these values and norms will not be members of the shared culture, even though they may occupy the appro-priate position on the organizational chart. In fact, these outsiders may even be viewed as hostile to the values of the culture, a point to which we will return.
It is clear from these definitions that corporate culture propagates itself less like an economic phenomenon—with individuals attempting to maximize some quantity through their behavior—and more like a biological phenomenon, such as the spread of an epidemic through a population. Gordon Gekko, then, can be considered the “patient zero” of an epidemic of shared values (most of which are considered repugnant by the larger society, including Gekko’s creator).
This biologically inspired model of corporate culture can be generalized further. Three factors will affect the transmission of a corporate culture through a group: the group’s leadership, analogous to the primary source of an infection; the group’s composition, analogous to a population at risk; and the group’s environment, which shapes its response. The next sections will explore how the transmission of values conducive to corporate failure might occur, how such values emerge, and what can be done to change them.

FRBNY Economic Policy Review / August 2016 19
3. Values from the Top Down: Authority and Leadership
Who maintains the values of a corporate culture? Economics tells us that individuals respond to incentives—monetary rewards and penalties. From this mercenary perspective, corporate culture is almost irrelevant to the financial realities of risk and expected return.
However, the other social sciences offer a different per-spective. A corporate culture directs its employees through authority—sometimes called “leadership” in the corporate world—as much as through financial incentives, if not more so. The great German sociologist Max Weber broke down authority into three ideal types: the charismatic, who main-tains legitimacy through force of personality; the traditional, who maintains legitimacy through established custom; and the legal-rational, whose legitimacy comes from shared agreement in the law (Kronman 1983, 43-50). We can see that Gordon Gekko is almost a pure example of Weber’s charis-matic authority; however, at this point in our discussion, the style of authority is less important than the fact of authority.
According to Herbert A. Simon’s classic analysis of admin-istrative behavior, a person in authority establishes the proper conduct for subordinates through positive and negative social sanctions (Simon 1997, 184-5). These sanctions, in the form of social approval or disapproval, praise or embarrassment, may be the most important factor in inducing the acceptance of authority. Also important is the sense of shared purpose, which, in the military, is sometimes called esprit de corps. People with a sense of purpose are more likely to subordinate themselves to authority, in the belief that their subordination will aid in achieving the goals of the group.
How much economic incentive is needed for an authority figure to influence the members of a culture into bad behaviors? Experimental social psychology gives us a rather disturbing answer. In the infamous Milgram experiment, originally con-ducted by the psychologist Stanley Milgram at Yale University in 1961, volunteers administered what they believed were high-voltage electric shocks to a human experimental subject, simply because a temporary authority figure made verbal suggestions to continue (Milgram 1963). Of these scripted sug-gestions, “You have no other choice, you must go on,” was the most forceful. If a volunteer still refused after this suggestion was given, the experiment was stopped. Ultimately, twenty-six out of forty people administered what they believed was a dan-gerous, perhaps fatal, 450-volt shock to a fellow human being, even though all expressed doubts verbally and many exhibited obvious physiological manifestations of stress; three even experienced what appeared to be seizures. One businessman
volunteer “was reduced to a twitching, stuttering wreck, who was rapidly approaching a point of nervous collapse . . . yet he continued to respond to every word of the experimenter, and obeyed to the end.” Milgram’s volunteers were paid four dollars plus carfare, worth about fifty dollars today.
Even more notorious is the Stanford prison experiment, con-ducted by the Stanford University psychologist Philip Zimbardo in 1971. In the two-week experiment conducted in the basement of the Stanford psychology department, Zimbardo randomly assigned volunteers to the roles of guards and prisoners (Haney, Banks, and Zimbardo 1973a, b). Almost immediately after the experiment began, the “guards” started to behave in a dehumanizing way toward the “prisoners,” subjecting them to verbal harassment, forced exercise, manipulation of sleeping conditions, manipulation of bathroom privileges (some of it physically filthy), and the use of nudity to humiliate the “prisoners.” Zimbardo, who played the role of prison superin-
tendent, terminated the experiment after only six days, at the urging of his future wife, Christina Maslach, whom he had brought in as an outsider to conduct interviews with the sub-jects.4 Zimbardo paid his subjects fifteen dollars a day, roughly ninety dollars per diem in today’s dollars.
It should be obvious that monetary incentives are a completely insufficient explanation for the behavior of the volunteers in these two experiments. In Milgram’s experiment, the majority of subjects submitted themselves to the verbal demands of an authority despite the severe mental stress inflicted by these tasks. In Zimbardo’s experiment, volunteers threw themselves into the role of guards with gusto, with Zimbardo himself playing the role of the superintendent willing to overlook systemic abuses. In each case, the volunteers fulfilled the roles that they believed were expected of them by the authority.
Leadership is important in harnessing the behavior of a corporation’s employees to become more productive and competitive. Unfortunately, as Milgram and Zimbardo demonstrated, the same factors that allow leadership to
4 Additional details from the Stanford Prison Experiment are available at http://www.prisonexp.org.
The same factors that allow leadership to
manifest itself through performance and
teamwork also allow it to promote goals
that lack a moral, ethical, legal, profitable,
or even rational basis.

20 The Role of Culture in the Financial Industry
manifest itself through performance and teamwork also allow it to promote goals that lack a moral, ethical, legal, profitable, or even rational basis. Remember that the 65 percent of Milgram’s experimental subjects who continued to administer electric shocks were compelled to do so merely by verbal expressions of disapproval by the authority figure.
In corporate cultures that lack the capacity to assimilate an outside opinion, the primary check on behavior is the author-ity. From within a corporate culture, an authority may see his or her role as similar to that of the conductor of an orchestra, managing a group of highly trained professionals in pursuit of a lofty goal. From a viewpoint outside the culture, however, the authority may be cultivating the moral equivalent of a
gang of brutes, as Zimbardo himself did in his role as mock prison superintendent. It took a trusted outsider to see the Stanford prison experiment with clear eyes and to convince Zimbardo that his experiment was, in fact, an unethical deg-radation of his test subjects.
Finally, even if the authority has an excellent track record, a subtle form of moral hazard is associated with this excellence, as has been pointed out by Robert Shiller: If “people have learned that when experts tell them something is all right, it probably is, even if it does not seem so . . . thus the results of Milgram’s experiment can also be interpreted as springing from people’s past learning about the reliability of authorities” (Shiller 2005, 159).
4. Values from the Bottom Up: Composition
Not all of corporate culture is created from the top down. A culture is also composed of the behavior of the people within it, from the bottom up. Corporate culture is subject to compo-sitional effects, based on the values and behaviors of the people the organization hires, even as corporate authority attempts to inculcate its preferred values and behaviors into employees.
The pool of possible corporate employees today is wide and diverse. Firms and industries draw from this pool with a particular employee profile in mind, often filtering out other qualified candidates. However, this filter may shape the corporate culture in unexpected ways. In the late 1990s, the anthropologist Karen Ho conducted an ethnographic survey of Wall Street investment banks. Beginning in the 1980s, the era of Oliver Stone’s Wall Street, these firms deliberately tar-geted recent graduates of elite schools, in particular Harvard and Princeton, appealing to their intellectual vanity: “the best and the brightest.” These fresh recruits brought their social norms and values with them to Wall Street (Ho 2009, 39-66). As they were promoted, and older members departed, a new norm of behavior developed within investment bank culture through population change. Knowledge of the older Wall Street culture faded and became secondhand, while Liar’s Poker, Michael Lewis’s memoir about graduating from Princeton and going to work at Salomon Brothers, became a manifesto for the new elite (Ho 2009, 337). Even the drawbacks of a Wall Street job could confirm the values of an elite worldview. Ho found that her informants rationalized Wall Street job insecurity as normative, since the insecu-rity revealed “who is flexible and who can accept change” (Ho 2009, 274). The historically high levels of Wall Street compensation were, in her informants’ view, the natural reward for members of the elite assuming the personal risk of losing their jobs.
Corporations deliberately choose employees with attributes that corporate leadership believes are useful to the organization. To borrow another biological metaphor, the hiring process is a form of artificial selection from a population with a great deal of variation in personality type, worldview, and other individual traits. All else being equal, employees with traits that more closely fit the cor-porate culture will do better in the corporation since they are already adapted to that particular environment. This leads to a feedback loop reinforcing the corporate culture’s values. Employees who do not fit this profile find themselves under social pressure to adapt or leave the organization. This process of selection and adaptation leads to stronger corporate cultures, which are correlated with stronger performance. However, there are times when a corporation benefits from a diversity of viewpoints to prevent groupthink (Janis 1982). The innovator, the whistleblower, the contrar-ian, and the devil’s advocate all have necessary roles in the modern corporation, especially in a shifting economic envi-ronment. A human resources manager, then, faces much the same dilemma as a portfolio manager—how to pick winners, shed losers, and manage risk so as to increase the value of the overall portfolio.
Employees with traits that more closely
fit the corporate culture will do better in
the corporation since they are already
adapted to that particular environment.
This leads to a feedback loop reinforcing
the corporate culture’s values.

FRBNY Economic Policy Review / August 2016 21
Many corporations deliberately hire “self-starters” or “go-getters,” people with aggressive or risk-taking personali-ties who are thought to have a competitive nature and whose presence (so goes the belief) will lead to higher profits for the firm. This personality type is drawn to what the sociologist Stephen Lyng has described as “edgework” (Lyng 1990). Borrowing the term from the writings of gonzo journalist Hunter S. Thompson, Lyng uses it to describe the pleasurable form of voluntary risk taking sometimes found in adventure sports such as skydiving or in hazardous occupations such as test piloting. In these fields, the individual is put at severe risk, but the risk is made pleasurable through a sense of satisfaction in one’s superior ability to navigate such dangerous waters. This dynamic naturally extends to the financial industry, and, in fact, sociologist Charles W. Smith recently used the concept of edgework to compare the financial market trader to the sea kayaker (Smith 2005).
Edgeworkers normally think of themselves as ferociously independent. Nevertheless, Lyng has found that success in the face of risk reinforces among edgeworkers a sense of group soli-darity and belonging to an elite culture, even across professions. But this sense of solidarity extends only to fellow edgeworkers, which puts these individuals at odds with the larger culture. In a corporation, this can lead to a split between a trading desk, or even upper management, and the rest of the corporate culture. For example, the organizational theorist Zur Shapira conducted surveys of fifty American and Israeli executives and found that, even though many urged their subordinates to maintain risk-averse behavior, they themselves took greater risks, deriv-ing active enjoyment in succeeding in the face of those risks. One company president still viewed himself as an edgeworker, telling Shapira, “Satisfaction from success is directly related to the degree of risk taken” (Shapira 1995, 58). For a new hire who patterns his or her job behavior on an authority figure within the firm, this may be a case of “Do as I say, not as I do.”
Group composition may lead to differences that cannot be explained by culture alone. An individual’s temperament and personality are largely internal in origin and difficult to change. Some traits, such as the propensity for risk taking, may have deeper causes. For example, it has long been documented that younger men are more prone to engage in dangerous activities than older men or women of the same age, with behaviors ranging from reckless driving to homicide (Wilson and Daly 1985). There may be a neuroscientific reason for this difference in the development of the adolescent brain.5 These differences are by definition not cultural: They can neither be learned nor transmitted symbolically. Yet these differences affect the highest levels of human behavior.
5 For example, see Steinberg (2008).
Nevertheless, culture is still powerful, even in the face of intrinsic behavioral variation. To take the most dramatic example, consider risk-taking behavior, which has known physiological and neurological correlates. Insurance compa-nies use automobile fatalities as a proxy to measure risk-taking behavior among groups. However, there has been an absolute decline in automobile fatalities in the United States over the last forty years, despite a vast increase in the number of drivers and miles traveled. This decline was caused by changes in culture: in material culture, such as advances in the design of automobiles and highways; in regulatory culture, such as the enforcement of appropriate speed limits; and in social culture, such as the stigmatization of driving under the influ-ence of alcohol. The same propensity for risk is as present today as it was in 1975, but the culture at large has changed to limit its negative effects on the highway.
5. Values from the Environment: Risk and Regulation
The third factor influencing corporate culture is the envi-ronment. Competition, the economic climate, regulatory requirements—the list of possible environmental factors that affect corporate culture may seem bewilderingly complex. However, anthropologist Mary Douglas made the elegant observation that a culture’s values are reflected in how it manages risk, which, in turn, reflects how the culture perceives its environment (Douglas and Wildavsky 1982). No culture has the resources to eliminate all risk; therefore, a culture ranks its dangers according to what it finds most important, both positively and negatively. This prioritization
acts as a snapshot of the culture’s operating environment, just as an insurance portfolio might act as a snapshot of the policyholder’s day-to-day environment. It is important to note that a culture’s ranking of danger may have little to do with the mathematical probability of an event. As a modern example, Douglas looked at the expansion of legal liability in the United States and its role in the insurance crisis of the 1970s. The underlying probability of medical
No culture has the resources to eliminate
all risk; therefore, a culture ranks its
dangers according to what it finds most
important, both positively and negatively.

22 The Role of Culture in the Financial Industry
malpractice or illness from toxic waste changed very little over that decade. In Douglas’s analysis, what changed was how society chose to respond to those dangers, owing to a change in cultural values.
Cultures warn against some dangers but downplay others in order to reinforce internal cultural values. For example, sociologist Sudhir Venkatesh finds that in “Maquis Park,” his pseudonym for a poor African-American neighbor-hood in Chicago, it is a risk-taking behavior to leave the established network of formal and informal business relationships that define the community and experience the impossible-to-measure Knightian uncertainty of estab-lishing new connections with few resources in the hostile environment of greater Chicago (Venkatesh 2006, 148-50). Despite the neighborhood’s high crime rate, the culture of Maquis Park is risk-averse. Criminal behavior there is often an application of economic rationalism and cost-benefit analysis in the face of limited options, rather than an expression of a higher tendency to take risks.
Douglas’s idea that the values of a culture are reflected in how it prioritizes risk has immediate application in under-standing differences in corporate behavior. For example, compare risk taking in the insurance industry with that of
the banking industry. The insurance industry is culturally more conservative precisely because a significant portion of insurers’ revenue is determined by state regulation. As a result, insurers make money by protecting their downside—in other words, by carefully managing risk. In the banking industry, however, revenue is variable and, in many cases, directly related to bank size and leverage; therefore, risk taking is much more flexible and encouraged.
According to Douglas, modern cultures fall into three ideal types: the hierarchical—including the bureaucratic tendencies not only of government but also of the large corporation; the individualistic—the world of the market, the entrepreneur, and classic utility theory; and the sectarian—the world of the outsider, the interest group, and the religious sect. These cultures interact with one another in predictable ways. The United States is obviously multicultural, but its central institutions are largely hierarchical or individualistic, while its
population is largely sectarian. Each type of culture has a dis-tinctive response to danger—a re-emphasis of the importance of the hierarchy, the individual, or the sect—which it uses to reinforce the values of the culture, often at the expense of competing views. Thus, for individualistic cultures, as the late German sociologist Ulrich Beck said, “community is dissolved in the acid bath of competition” (Beck 1992, 94).
This cultural defense mechanism has important implica-tions, not only for managers but also for regulators. To borrow Douglas’s distinction, the central cultures of the financial world find it very easy to ignore voices from the border, whether they are radicalized protestors in the streets, regula-tors from a government agency, or a dissenting opinion from within the financial community. Regulators are not immune to this defense mechanism, whether they are federal agencies, professional standards organizations, or law enforcement. In fact, the sanctions taken against a whistleblower in a regu-latory organization may be much harsher than those taken against a corporate whistleblower because the regulatory whistleblower diminishes the regulator’s legitimacy, the source of its legal-rational authority over others.
A corporate culture may defend itself so strongly that, despite almost everyone’s dissatisfaction with the status quo, the organization may find itself unable to change its norms of behavior. This statement is not an exaggera-tion. In the 1990s, the organizational theorist John Weeks conducted an ethnographic survey of a large British bank, “British Armstrong,” in which he found precisely this pattern of behavior (Weeks 2004). Prevailing corporate cultural values in “BritArm” were used to diminish or discount crit-icism. For example, BritArm prided itself on its discretion, which meant that complaints had to be made obliquely, and these complaints were therefore easily ignored. However, employees who made blunt or outspoken criticisms were viewed as outsiders who lacked BritArm’s cultural values, and their complaints were also ignored as part of the cul-ture’s immune response. An acceptable level of complaint, in fact, became a new norm among BritArm’s employees, part of their corporate cultural identity. As Weeks explains, “Complaining about a culture in the culturally acceptable ways should not be seen as an act of opposition to that culture. Rather, it is a cultural form that . . . has the effect of enacting the very culture that it ostensibly criticizes” (Weeks 2004, 12).
Culture is also subject to the social trends and undercur-rents in the environment, creating a unique and palpable set of ideals, customs, and values that broadly influence societal behavior. From a sociological perspective, we might call these instances the “collective consciousness” of society, a term first proposed by the late nineteenth-century French sociologist
A corporate culture may defend itself so
strongly that, despite almost everyone’s
dissatisfaction with the status quo, the
organization may find itself unable to
change its norms of behavior.

FRBNY Economic Policy Review / August 2016 23
Émile Durkheim (Durkheim 1893). Twentieth-century examples might include the giddy dynamism of the Roaring Twenties, the flirtation with Marxism and socialism in midcentury, and the countercultural movement of the 1960s. From an economic perspective, examples might include recessions, depressions, hyperinflation, and asset bubbles—periods when macroeconomic factors overwhelm industry- or institution-specific factors in determining behavior through-out the economy.
During such periods, it is easy to see how entrepreneurs, investors, corporate executives, and regulators are all shaped by the cultural milieu. In good times, greed is indeed good
and regulation seems unnecessary or counterproductive; in bad times, especially in the aftermath of a financial crisis, greed is the root of all evil and regulation must be strength-ened to combat such evil.
6. Values from Economists: Responding to Incentives
Economists have traditionally looked at theories of cultural values with skepticism, whether such theories have come from psychology, anthropology, ethnography, sociology, or management science. Part of this skepticism stems from the culture of economics, which prizes the narrative of rational economic self-interest above all else. Given two competing explanations for a particular market anomaly, a behavioral theory and a rational expectations model, the vast majority of economists will choose the latter—even if rationality requires unrealistically complex inferences about everyone’s preferences, information, and expectations. The mathematical elegance of a rational expectations equilib-rium usually trumps the messy and imprecise narrative of corporate culture. For example, Schein breaks down an organizational culture into its observable artifacts, espoused values, and unspoken assumptions (Schein 2004, 26). In
the pure economist’s view, this is much too touchy-feely. An economist will measure observables but look askance at self-reported values and ignore unspoken assumptions in favor of revealed preferences. Gordon Gekko’s motiva-tion—and his appeal to moviegoers—is simple: wealth and power. He is Homo economicus—the financial equivalent of John Galt in Ayn Rand’s Atlas Shrugged—optimizing his expected utility, subject to constraints. From the economist’s perspective, Gekko’s only fault is optimizing with fewer con-straints than those imposed by the legal system.
However, the economist’s view of rational self-interest is not simply axiomatic: Economic self-interest is a learned and symbolically transmitted behavior. We do not expect children or the mentally impaired to pursue their rational self-interest, nor do we expect the financially misinformed to be able to maximize their self-interest correctly. There-fore, this view of economic behavior fulfills the textbook definition of a cultural trait, albeit one that economists believe is universal and all-encompassing, as the term Homo economicus suggests.
Through the cultural lens of an economist, individuals are good if they have an incentive to be good. The same motivation of self-interest that drives a manager to excel at measurable tasks in the Wall Street bonus culture may also induce the manager to shirk the less observ-able components of job performance, such as following ethical guidelines (Bénabou and Tirole 2015). Yet, the same manager might behave impeccably under different circumstances—in other words, when faced with dif-ferent incentives.
There are a few notable exceptions to this cultural bias against culture in economics. Hermalin (2001) presents an excellent overview of economic models of corporate culture, citing the work of several researchers who have modeled culture as
1. game-theoretic interactions involving incom-plete contracts, coordination, reputation, unforeseen contingencies, and multiple equilib-ria (Kreps 1990);
2. a store of common knowledge that provides efficiencies in communication within the firm (Crémer 1993);
3. an evolutionary process in which preferences are genetically transmitted to descendants and shaped by senior management, like horse breeders seeking to produce championship thoroughbreds (Lazear 1995);
4. and the impact of situations on agents’ percep-tions and preferences (Hodgson 1996).
[Gordon Gekko] is Homo economicus
. . . optimizing his expected utility, subject
to constraints. From the economist’s
perspective, Gekko’s only fault is
optimizing with fewer constraints than
those imposed by the legal system.

24 The Role of Culture in the Financial Industry
Despite these early efforts, and Hermalin’s compelling illus-trations of the potential intellectual gains from trade between economics and culture, the study of culture by economists is still the exception rather than the rule. One reason is that the notion of rational self-interest, and its rich quantitative implications for behavior, has made economics the most analytically powerful of the social sciences. The assumption that individuals respond to incentives according to their self-interest leads to concrete predictions about behavior, rendering other cultural explanations unnecessary. In this framework, phenomena such as tournament salaries and Wall Street bonuses are a natural and efficient way to increase a firm’s productivity, especially in a high-risk/high-reward industry in which it is nearly impossible to infer performance differences between individuals in advance.6 If a corporate culture appears “greedy” to the outside world, it is because the world does not understand the economic environment in which the culture operates. The economist’s view of culture—reducing differences in behavior to different struc-tures of incentives—can even be made to fit group phenomena that do not appear guided by rational self-interest, such as self-deception, over-optimism, willful blindness, and other forms of groupthink (Bénabou 2013). Greed is not only good, it is efficient and predictive. Therefore, individual misbehavior and corporate malfeasance are simply incentive problems that can be corrected by an intelligently designed system of finan-cial rewards and punishments.
This description is, of course, a caricature of the economist’s perspective, but it is no exaggeration that the first line of inquiry in any economic analysis of misbehavior is to investigate incentives. A case in point is the rise in mortgage defaults by U.S. homeowners during the financial crisis of 2007-2009. Debt default has been a common occurrence since the beginning of debt markets, but after the peak of the U.S. housing market in 2006, a growing number of homeowners engaged in strategic defaults—defaults driven by rational economic considerations rather than the inability to pay. The rationale is simple. As housing prices decline, a homeowner’s equity declines in lockstep. When a homeowner’s equity becomes negative, there is a much larger economic incentive to default, irrespective of income or wealth. This tendency to default under conditions of negative home equity has been confirmed empirically.7 In a sample of homeowners holding mortgages in 2006 and 2007, Cohen-Cole and Morse (2010) find that 74 percent of those households that became delinquent on their mortgage payments were nevertheless current on their credit card pay-
6 However, see Burns, Minnick, and Starks (2013) for links between culture and compensation in a tournament framework.7 See, for example, Deng, Quigley, and Van Order (2000) and Elul et al. (2010).
ments, behavior consistent with strategic default. Moreover, homeowners with negative equity are found to be more likely to re-default, even when offered a mortgage modification that initially lowers their monthly payments (Quercia and Ding 2009). As Geanakoplos and Koniak observe in the aftermath of the bursting of the housing bubble:
Every month, another 8 percent of the subprime homeowners whose mortgages . . . are 160 percent of the estimated value of their houses become seriously delinquent. On the other hand, subprime homeowners whose loans are worth 60 percent of the current value of their house become delinquent at a rate of only 1 percent per month. Despite all the job losses and economic uncertainty, almost all owners with real equity in their homes are finding a way to pay off their loans. It is those “underwater” on their mortgages—with homes worth less than their loans—who are defaulting, but who, given equity in their homes, will find a way to pay. They are not evil or irresponsible; they are defaulting because . . . it is the economically prudent thing to do.8
Economists can confidently point to these facts when debating the relative importance of culture versus incentives in determining consumer behavior.
However, the narrative becomes more complex the further we dig into the determinants of strategic default. In survey data of one thousand U.S. households from December 2008 to September 2010, Guiso, Sapienza, and Zingales (2013, Table VI) show that respondents who know someone who strategically defaulted are 51 percent more likely to declare their willingness to default strategically. This contagion effect is confirmed by Goodstein et al. (2013), who, in a sample of more than thirty million mortgages originated between 2000 and 2008 that were observed from 2005 to 2009, find that mortgage defaults are influenced by the delinquency rates in surrounding ZIP codes, even after controlling for income-related factors. The authors’ estimates suggest that a 1 percent increase in the surrounding delinquency rate increases the probability of a strategic default by up to 16.5 percent.
These results show that there is no simple dichotomy between incentives and culture. Neither explanation is com-plete because the two factors are inextricably intertwined and jointly affect human behavior in complex ways. Reacting to a change in incentives follows naturally from the unspoken assumptions of the economist. Economic incentives cer-tainly influence human decisions, but they do not explain all behavior in all contexts. They cannot do so, because
8 John Geanakoplos and Susan Koniak, “Matters of Principal,” New York Times, March 5, 2009.

FRBNY Economic Policy Review / August 2016 25
humans are incentivized by a number of forces that are nonpecuniary and difficult to measure quantitatively. As Hill and Painter (2015) observe, these forces may include status, pride, mystique, and excitement. In addition, “what confers status is contingent, and may change over time.”9 These cul-tural forces often vary over time and across circumstances, causing individual and group behavior to adapt in response to such changes.
However, economists rarely focus on the adaptation of economic behavior to time-varying, nonstationary envi-ronments—our discipline is far more comfortable with comparative statics and general equilibria than it is with dynamics and phase transitions. Yet, changes in the economic, political, and social environment have important implications for the behavior of individual employees and corporations alike, as Hermalin (2001) underscores. To resolve this problem, we need a broader theory, one capable of reconciling the analytical precision of Homo economicus with the cultural tendencies of Homo sapiens.
7. Values from Evolution: The Adaptive Markets Hypothesis
If corporate culture is shaped from the top down, from the bottom up, and through incentives in a given environment, the natural question to ask next is, how? A corporation’s leadership may exert its authority to establish norms of behavior within the firm, but a corporation’s employees also bring their preexisting values to the workplace, and all of the actors in this drama have some resistance to cultural sway for noncultural, internal reasons. None of them are perfectly malleable individuals waiting to be molded by external forces. This resistance has never stopped corporate authority from trying, however. In one notorious case, Henry Ford employed hundreds of investigators in his company’s Sociological Department to monitor the private lives of his employees in order to ensure that they followed his preferred standard of behavior inside the factory and out (Snow 2013). The success or failure of such efforts depends critically on understanding the broader framework in which culture emerges and evolves over time and across circumstances.
Determining the origin of culture, ethics, and morality may seem to be a hopeless task, and one more suited to philosophers than economists. However, there has been surprising progress in the fields of anthropology, evolutionary biology, psychology, and the cognitive neurosciences that has
9 Hill and Painter (2015, p. 111).
important implications for economic theories of culture. For example, evolutionary biologists have shown that cultural norms such as altruism, fairness, reciprocity, charity, and cooperation can lead to advantages in survival and repro-ductive success among individuals in certain settings.10 E. O. Wilson argued even more forcefully that social conventions and interactions are, in fact, the product of evolution, coining the term “sociobiology” in the 1970s. More recent observa-tional and experimental evidence from other animal species, such as our close cousins the chimpanzees, has confirmed
the commonality of certain cultural norms, suggesting that they are adaptive traits passed down across many generations and species. A concrete illustration is the notion of fairness, a seemingly innate moral compass that exists in children as young as fifteen months as well as in chimpanzees.11
This evolutionary perspective of culture arises naturally in financial economics as part of the adaptive markets hypothesis (Lo 2004, 2013), an alternative to the efficient markets hypoth-esis. In the adaptive markets hypothesis, financial market dynamics are the result of a population of individuals com-peting for scarce resources and adapting to past and current environments. This hypothesis recognizes that competition, adaptation, and selection occur at multiple levels—from the subtle methylation of sequences in an individual’s DNA, to the transmission of cultural traits from one generation to the next—and they can occur simultaneously, each level operating at speeds dictated by specific environmental forces. To under-stand what individuals value, and how they will behave in various contexts, we have to understand how they interacted with the environments of their past.
10 See, for example, Hamilton (1964); Trivers (1971); and Nowak and Highfield (2011).11 See Burns and Sommerville (2014) for recent experimental evidence of fairness with fifteen-month-old babies, and de Waal (2006) for similar experimental evidence for capuchin monkeys and chimpanzees.
Determining the origin of culture, ethics,
and morality may seem to be a hopeless
task, and one more suited to philosophers
than economists. However, there
has been surprising progress. . . that
has important implications for economic
theories of culture.

26 The Role of Culture in the Financial Industry
The adaptive markets hypothesis explains why analogies to biological reasoning are often effective in the social sciences. Darwinian evolution is not the same process as cultural evolu-tion, but the two processes occur under similar constraints of selection and differential survival. As a result, one can fruitfully use biological analogies, as well as biology itself, to explain aspects of culture—even of corporate culture, a concept that did not exist until the late nineteenth and early twentieth centuries. These explanations fall into two categories: explanations of individual behavior by itself, and explanations of the interactions between individuals that lead to group dynamics.
Viewing behavior at the level of the individual, recent research in the cognitive neurosciences has refined insights into the nature of moral and ethical judgments. These judg-ments arise from one of two possible neural mechanisms: one instinctive, immediate, and based on emotion; and the other more deliberative, measured, and based on logic and reasoning (Greene 2014). The former is fast, virtually impossible to override, and relatively inflexible, while the latter is slow, much more nuanced, and highly adaptive. This “dual-process theory” of moral and ethical decision making—which is supported by a growing body of evidence from detailed, experimental neu-roimaging studies—speaks directly to the question at hand of the origin of culture. At this level of examination, culture is the combination of hardwired responses embedded in our neural circuitry, many innate and not easily reprogrammed, and more
detailed complex analytic behaviors that are path-dependent on life history, which can be reprogrammed (slowly) and are more in tune with our social environment.
Apart from its pure scientific value, the dual-process theory has several important practical implications. Current efforts to shape culture may be placing too much emphasis on the ana-lytical process while ignoring the less malleable and, therefore, more persistent innate process. A deeper understanding of this innate process is essential to answering questions about whether and how culture can be changed. One starting point is the work of social psychologist Jonathan Haidt, who proposed five moral dimensions that are innately determined and whose relative weightings yield distinct cultural mores and value systems: harm versus care, fairness versus cheating, loyalty versus betrayal, authority versus subversion, and purity versus degradation.12 Since the relative importance of these moral dimensions is innately determined, their presence in the population naturally varies along with hair color, height, and other traits.
Haidt and his colleagues discovered that, far from being dis-tributed across the population in a uniformly random way, these traits had strong correlations to political beliefs (see Chart 1).13 For example, people in the United States who identified them-
12 Haidt (2007). In more recent writings, Haidt has added a sixth dimension, liberty versus oppression.13 Graham, Haidt, and Nosek (2009); Iyer et al. (2012).
Chart 1The Importance of Haidt’s Five Moral Dimensions among Individuals of Various Political Views
1
2
4
5
6
Source: Haidt, J. 2007. “�e New Synthesis in Moral Psychology.” Science 316, no. 5827 (May): 998-1002. Figure 1. Reprinted with permission from AAAS.
Veryliberal
Liberal Slightlyliberal
Moderate Slightlyconservative
Conservative Veryconservative
Purity3
Authority
FairnessHarm
Ingroup
How relevant to moral judgment (1 = never, 6 = always)
Politics

FRBNY Economic Policy Review / August 2016 27
selves as liberal believed that questions of harm/care and fairness/cheating were almost always relevant to making moral decisions. The other three moral foundations Haidt identified—loyalty/betrayal, authority/subversion, and purity/degradation—were much less important to liberals. However, those who identified themselves as conservative believed that all five moral foundations were equally important, although conservatives did not place as high an importance on any of the factors as liberals placed on fairness/cheating or harm/care. These traits had predisposed people to sort themselves into different political factions.
It takes little imagination to see this sorting process at work across professions. People who believe that fairness is the highest moral value will want to choose a vocation in which they can exert this value, perhaps as a public defender, a teacher of underprivileged children, or a sports referee. Those who believe, instead, that fairness is less important than other values might find themselves drawn to high-pressure sales, or indeed, Gordon Gekko’s caricature of predatory finance. This is not to say that everyone in those professions shares those values, of course, but rather that individuals with those values may find such professions more congenial—a form of natural selection bias—and will, therefore, eventually be statistically overrepresented in that subpopulation.
At the same time that evolution shapes individual behav-ior, it also acts on how individuals relate to one another. We call the collective behavior that ultimately emerges from these interactions “culture.” It has been conceptually difficult for classical evolutionary theory to explain many forms of collective and group behavior because evolutionary theory is primarily centered on the reproductive success of the individual or, even more reductively, of the gene. Recent research in evolutionary biology, however, has revived the controversial notion of “group selection” (Nowak, Tarnita, and Wilson 2010), in which groups, not just individuals or genes, are the targets of natural selection. Although many evolutionary biologists have rejected this idea (Abbott et al. 2011), arguing that selection can occur only at the level of the gene, an application of the adaptive markets hypothesis can reconcile this controversy and also provide an explana-tion for the origins of culture.
The key insight is that individual behavior that appears to be coordinated is simply the result of certain common factors in the environment—“systematic risk” in the ter-minology of financial economics—that impose a common threat to a particular subset of individuals. Within specific groups under systematic risk, natural selection on indi-viduals can sometimes produce group-like behavior. In such cases, a standard application of natural selection to
individuals can produce behaviors that may seem like the result of group selection but that are, in fact, merely a reflection of systematic risk in the environment (Zhang, Brennan, and Lo 2014).
For example, consider the extraordinary behavior of Specialist Ross A. McGinnis, a nineteen-year-old machine-gunner in the U.S. Army who, during the Iraq war, sacrificed himself when a fragmentation grenade was tossed into a Humvee during a routine patrol in Baghdad on December 4, 2006. McGinnis reacted immediately by yelling “grenade” to alert the others in the vehicle, and then pushed his back onto the grenade, pinning it to the Humvee’s radio mount and absorbing the impact of the explosion with his body. His actions saved the lives of his four crewmates.14
Although this was a remarkable act of bravery and sacri-fice, it is not an isolated incident. Acts of bravery and sacrifice have always been part of the military tradition, as documented
by the medals and other honors awarded to military heroes. Part of the explanation may be selection bias—the military may simply attract a larger proportion of altruistic individuals, people who sincerely believe that “the needs of the many out-weigh the needs of the few.”
A more direct explanation, however, may be that altruistic behavior is produced by natural selection operating in the face of military conflict. Put another way, selfish behavior on the battlefield is a recipe for defeat. Military conflict is an extreme form of systematic risk, and over time and across many similar circumstances, the military has learned this lesson. However, altruistic behavior confers survival benefits for the population on the battlefield, even if it does not benefit the individual. Accordingly, military training instills these values in individuals—through bonding exercises like boot camp, stories of heroism passed down from sea-soned veterans to new recruits, and medals and honors for
14 http://www.army.mil/medalofhonor/mcginnis/profile/ (accessed March 20, 2015).
Individual behavior that appears to
be coordinated is simply the result
of certain common factors in the
environment—“systematic risk” in the
terminology of financial economics—that
impose a common threat to a particular
subset of individuals.

28 The Role of Culture in the Financial Industry
courageous acts—so as to increase the likelihood of success for the entire troop. Military culture is the evolutionary product of the environment of war.
Now consider an entirely different environment: Imagine a live grenade being tossed into a New York City subway car. Would we expect any of the passengers to behave in a manner similar to Specialist McGinnis in Baghdad? Context matters. And culture is shaped by context, as Milgram and Zimbardo discovered in their experiments with ordinary subjects placed in extraordinary circumstances (see Section 3).
Context matters not only on the battlefield but also in the financial industry. Cohn, Fehr, and Maréchal (2014) doc-ument the impact of context on financial culture in an experiment involving 128 human subjects recruited from a large international bank. These subjects were asked to engage in a task that measured their honesty, using a simple coin-tossing exercise in which self-reported outcomes deter-mined whether they would receive a cash prize. Prior to this exercise, subjects were split into two groups. In one group, participants were asked seven questions pertaining to their banking jobs; in the other, participants were asked seven non-banking-related questions. By bringing the banking industry to the forefront of the subjects’ minds just prior to the exercise, the authors induced the subjects to apply the cultural standards of that industry to the task at hand. The subjects in the former group showed significantly more dishonest behavior than the subjects in the latter group, who exhibited the same level of honesty as participants from
non-banking industries. The authors concluded that “the prevailing business culture in the banking industry weakens and undermines the honesty norm, implying that measures to re-establish an honest culture are very important.”15
However, innate variation determines how much the individual is influenced by context. Gibson, Tanner, and Wagner (2015) show that even in cultures where there has been a crowding-out of honest behavior by situational norms, individuals with strong intrinsic preferences to honesty as a “protected” value resist the bad norm, and may potentially be able to form the nucleus of a good norm in an altered situation.
Two recent empirical studies of fraud provide additional support for the impact of context on financial culture. Dyck, Morse, and Zingales (2013) use historical data on securities class action lawsuits to estimate the incidence of fraud from 1996 to 2004 in U.S. publicly traded companies with at least $750 million in market capitalization. They document an increasing amount of fraud as the stock market rose in the first five or six years of the period, but find that the fraud eventually declined in the wake of the bursting of the Internet bubble in 2001-02 (see Chart 2). This interesting pattern suggests that the business environment may be related to changes in corporate culture that involve fraudulent activity and corporate risk-taking behavior. Deason, Rajgopal, and Waymire (2015) find a similar pattern in the number of Ponzi schemes prosecuted by the U.S. Securities and
15 Cohn, Fehr, and Maréchal (2014, p. 86).
0
10
20
30
40
50
60
Chart 3Frequency of SEC-Prosecuted Ponzi Schemes by Year from 1988 to 2012
Source: Deason, Rajgopal, and Waymire (2015, Figure 1). Used by permission.
Market share
1210080604022000989694921990
0.06
0.05
0.04
0.03
0.02
0.01
0
Percent
Starting fraudEngaging in fraud
1997 1998 1999 2000 2001 2002 2003 20041996
Chart 2Estimated Percentage of Large Corporations Starting and Engaging in Fraud from 1996 to 2004
Source: Dyck, Morse, and Zingales (2013, Figure 1). Used by permission.

FRBNY Economic Policy Review / August 2016 29
Exchange Commission (SEC) between 1988 and 2012 (see Chart 3). The number of schemes shows an upward trend during the bull market of the late 1990s, a decrease in the aftermath of the Internet bust of 2001-2002, and another increase as the market climbed until the financial crisis in 2007-2009, after which the number of Ponzi schemes fell sharply. In fact, Deason, Rajgopol, and Waymire estimate a correlation of 47.9 percent between the quarterly return on the S&P 500 index and the number of SEC-prosecuted Ponzi schemes per quarter, which they attribute to several factors: Ponzi schemes are harder to sustain in declining markets, and SEC enforcement budgets tend to increase after bubbles burst, owing to more demand for enforcement by politicians and the public. The authors also find that Ponzi schemes are more likely when there is some affinity link between the perpetrator and the victim, such as a common religious back-ground or shared membership in an ethnic group, or when the victim group tends to place more trust in others (senior citizens, for example)—reminding us that culture can also be exploited maliciously.
These two studies confirm what many already knew instinctively: Culture is very much a product of the envi-ronment, and as environments change, so, too, does culture. Therefore, if we wish to change culture, we must first understand the forces that shape it over time and across circumstances. This broader contextual, environmental framework—informed by psychology, evolutionary theory, and neuroscience, and quantified through empirical measure-ment—will play a key role in Section 11, where we consider what can be done about culture from a practical perspective.
8. Examples from the Financial Industry
Moving from the general to the specific, we now explore several recent financial debacles that demonstrate the role of corporate culture in financial failure. Let us start with a control case, the fall of Long-Term Capital Management (LTCM). In organizational theorist Charles Perrow’s terminology, LTCM’s collapse was a “normal accident” (Perrow 1999). That is, it was caused by a combination of “tight coupling” in the engineering sense—in which the execution of one process depends critically on the suc-cessful completion of another—and complex interactions within the financial system. To summarize a well-known story very briefly, LTCM’s sophisticated models were caught off-guard by the aftermath of Russia’s default on its
short-term government bonds, or GKOs, on August 17, 1998, triggering a short and vicious cycle of losses and flights to liquidity and ultimately leading to LTCM’s bailout on September 23, 1998.16
On paper, LTCM’s corporate culture was excellent. The firm’s composition was elite, as LTCM was founded by John Meriwether, the former head of bond trading at Salomon Brothers, and future Nobel Prize winners Robert C. Merton and Myron Scholes. Its culture was indi-vidualistic, as the cultures of many trading groups are, but the firm derived its authority from a legal-rational basis—the superiority of its mathematics. Its corporate culture played little direct role in its failure. In fact, with much of their personal fortunes invested in the business, LTCM’s managing partners were perfectly aligned with their inves-tors. Not a single client has sued them for inappropriate behavior. Not a single regulator has cited them for viola-tions of any sort.
Because of this excellence, however, the general culture of Wall Street was caught off-guard by LTCM’s predicament. LTCM’s counterparties perceived the impressive firm to be a paragon of the industry’s highest values—a combination of intelligence, market savvy, and ambition that was sure to succeed—when a more accurate assessment of LTCM might have been as an experimental engineering firm, working daringly (or hubristically, as some have argued) on the cutting edge. LTCM’s creditors notoriously gave it virtually no “haircut” on loans, on the assumption that its trades were essentially risk free. In addition to these very low, or even zero, margin requirements, LTCM was able to negotiate other favorable credit enhancements with its counterparties, includ-ing two-way collateral requirements, rehypothecation rights, and high thresholds for loss.17 These were often made on the strength of the firm’s reputation rather than on a detailed examination of its methods. Daniel Napoli, Merrill Lynch’s head of risk management at the time, was quoted as saying, “We had no idea they would have trouble—these people were known for risk management. They had taught it; they designed it [emphasis in original].”18 (Napoli himself lost his position shortly after LTCM’s collapse.) And so, while LTCM’s failure may be viewed as akin to the failure of a bridge whose exper-imental materials were exposed to an unfamiliar stress, the behavior of LTCM’s creditors is more likely a failure of their own corporate cultures.
16 See, for example, General Accounting Office (1999, 38-45).17 GAO (1999, 42).18 Lowenstein (2000, 179).

30 The Role of Culture in the Financial Industry
Corporate cultures can be overconfident in their abilities to assess risk. This overconfidence can be seen in the fall of the large multinational insurer American International Group (AIG) in 2008. Under its original chairman, Maurice “Hank” Greenberg, AIG was run not merely hierarchically, but almost feudally, with reciprocal chains of loyalty and obligation centered on Greenberg.19 In fact, Greenberg had deliberately structured AIG’s compensation plan to promote lifetime loyalty to the firm. Greenberg was, in Weberian terms, a charismatic authority, overseeing each division of his large, multinational organization person-ally. In regular questioning sessions, Greenberg demanded to know exactly what risks each unit of AIG was taking and what measures were being used to reduce them. Many observers ascribed AIG’s continued growth to the firm’s excellent practice in insurance underwriting, closely moni-tored by Greenberg.
However, the “headline risk” of Greenberg’s possible role in financial irregularities caused AIG’s board of directors to replace him with Martin Sullivan in early 2005. Sullivan had risen through the ranks of AIG, originally starting as a teenage office assistant. Sullivan assumed that AIG’s vigorous culture of risk management would maintain itself without Greenberg at the helm. Meanwhile, Joseph Cassano, the head of AIG’s Financial Products (AIGFP) unit, had a working relationship with Greenberg that did not transfer to Sullivan. Cassano’s conduct grew more aggressive without Greenberg’s check on his behavior (Boyd 2011, 161).
AIGFP’s portfolio contained billions of dollars of credit default swaps (CDS) on “toxic” collateralized debt obligations. These CDS were not the only toxic items on AIG’s balance sheet, which also reflected significant problems in the compa-ny’s securities lending program, but they were the largest, and they created the most visible effects during the financially dan-gerous autumn of 2008. While AIGFP’s first sales of CDS on collateralized debt obligations began in 2004, during Green-berg’s tenure, they accelerated into 2005, before executives within AIGFP convinced Cassano about declining standards in the subprime mortgage market. AIGFP’s final sale of CDS took place in early 2006, leaving a multibillion-dollar time bomb on AIG’s balance sheet, which the prolonged downturn in the housing market started ticking. Cassano defended his actions in an increasingly adverse environment until his ouster from AIG in early 2008 (Boyd 2011, 258-62).
It is probably too easy to ascribe AIGFP’s extended period of CDS sales to Greenberg’s departure. As noted, Cassano’s unit began selling CDS well before Greenberg’s exit. However,
19 Boyd (2011) and Shelp and Ehrbar (2009) provide two viewpoints of AIG’s culture from which a triangulation can be made.
Robert Shiller’s insight into the Milgram experiment is pertinent here. Greenberg’s culture of risk management, which was accompanied by consistently high growth in the traditionally low-growth insurance industry, led Cassano and Sullivan to believe that AIG’s risk management proce-dures were consistently reliable under conditions where they were not. Paradoxically, the moral hazard of past success may have led AIG to make much riskier investments than a company with a poorer track record of risk management would have made.
Some corporate cultures actively conceal their flaws and irregularities, not only from the public or from regulators but also from others within the corporation itself because of the risk that wider knowledge of these issues might
undermine the firm’s position. For example, let us look at Lehman Brothers’ use of the “Repo 105” accounting trick.20
Briefly, this was a repo, or repurchase agreement, valued at $1.05 for every dollar, that was designed to look like a sale. Lehman Brothers paid more than five cents on the dollar to temporarily pay down the liabilities on its balance sheet before it repurchased the asset. The firm used this accounting trick in amounts totaling $50 billion in late 2007 and 2008 to give itself a greater appearance of financial health—which, of course, was ultimately a failure.
Was this tactic legal? Because no American law firm would agree to endorse it, Lehman Brothers engaged in regulatory arbitrage and found a distinguished British law firm, Linkla-ters, willing to give the practice its imprimatur. Linklaters’ endorsement of Repo 105 was kept secret from the outside world (except for Lehman’s auditors, Ernst and Young, who also allowed the practice to pass21) and also from Lehman’s
20 Valukas (2010).21 Valukas (2010, 782-6 and 948-51). See also Nolder and Riley (2014) for the impact of cultural differences on auditors.
Some corporate cultures actively conceal
their flaws and irregularities, not only from
the public or from regulators but also
from others within the corporation itself
because of the risk that wider knowledge
of these issues might undermine the
firm’s position.

FRBNY Economic Policy Review / August 2016 31
board members.22 Lehman Brothers omitted its use of Repo 105 in its quarterly disclosures to the SEC and also neglected to tell its outside disclosure counsel.23
In contrast to LTCM, the corporate culture at Lehman Brothers less resembled a cutting-edge engineering firm expe-riencing an unforeseen design failure than it did Zimbardo’s Stanford experiment. An internal hierarchy within Lehman’s management deliberately withheld information about the firm’s misleading accounting practices from outsiders who might have objected, as well as from those within the firm, because this internal hierarchy believed that was its proper role. When Lehman’s global financial controller reported to two consecutive chief financial officers his misgivings that Repo 105 might be a significant “reputational risk” to the company, his concerns were ignored.24 Lehman’s hierarchical culture defended its values against voices from its border, even though these voices occupied central positions on its organi-zational chart. Instead of taking measures to avoid headline risk, the firm buried its practices in secrecy.
The case of rogue trader Jérôme Kerviel illustrates another possible type of failure of corporate culture, that of neglect. Unauthorized, or rogue, trading is necessarily a form of fraud, since it deliberately evades the legal responsibilities of proper financial management. In January 2008, Kerviel, a trader in the corporate and investment banking division of the French bank Société Générale, built up a €49 billion long position on index futures before his trades were detected (Société Générale 2008, 2). For comparison purposes, Société Générale’s total capital at the time was only €26 billion. Unwinding his unauthorized position cost Société Générale €6.4 billion, an immense loss that threatened to take down the bank. Ker-viel’s legal difficulties are still ongoing, but he has stated that Société Générale turned a blind eye to his activities when they were making money—and Société Générale’s own internal investigation reports that he made €1.5 billion for the bank on his unauthorized trades in 2007.
However, the internal investigation paints a very different, if equally unflattering, picture of Société Générale’s corporate culture. Kerviel’s first supervisor did not notice his early fraud-ulent trades or the cover-up of those trades but, in fact, allowed Kerviel to make intraday trades, a privilege well above Kerviel’s status as a junior trader. In January 2007, Kerviel’s supervisor quit, and his trading desk was left effectively unsupervised for three months. During this time, Kerviel built up a futures posi-tion of €5.5 billion, his first very large position. His new desk
22 Valukas (2010, 945-7).23 Valukas (2010, 853-6).24 Valukas (2010, 884-7).
manager, hired in April 2007, had no prior knowledge of Ker-viel’s trading activities and did not use the monitoring programs that would have detected his trades. Moreover, Kerviel’s new manager was not supported by his own supervisor in assisting or supervising Kerviel’s new activities. The Société Générale report found that a culture of inattention and managerial neglect existed up to four levels above Kerviel’s position, to the head of Société Générale’s arbitrage activities (Société Générale 2008, 3-8). Ultimately, it was the attention and perseverance of a monitor in Société Générale’s accounting and regulatory reporting division that caught Kerviel, after the monitor noticed an unhedged €1.5 billion position while calculating the Cooke ratio for Société Générale’s Basel compliance requirements (Société Générale 2008, 31-4).
This is Douglas’s individualistic culture taken to a point of absurdity. Mark Hunter and N. Craig Smith believe that the roots of Société Générale’s Corporate and Investment Banking division’s inept management culture can be found in the firm’s complex corporate history (Hunter and Smith 2011). Société Générale was a private retail bank nationalized after the Second World War and then privatized again in 1986. Through-out its postwar history, however, the bank was a proving ground for elite French graduates, similar to the way Wall Street investment banks recruit from Ivy League universities in the United States. The key difference is that the elite focused its oversight on Société Générale’s retail banking business, because of its close connection to French policymakers in the public and private sectors, rather than its proprietary trading desks. Société Générale’s corporate culture viewed the Corporate and Investment Banking division as a “cash machine,” not central to the bank’s elite outcomes. Kerviel, a graduate of provincial universities, was not expected to rise in the elite hier-archy. Therefore, little attention was paid to his activities, even when he made surprisingly large amounts of money.
9. Regulatory Culture
Regulatory culture is hardly immune to these challenges. Consider the unraveling of the mother of all Ponzi schemes: Bernard Madoff ’s. The SEC formally charged Madoff with securities fraud on December 11, 2008, the day after Madoff ’s sons turned him in to the Federal Bureau of Investigation. Justice was swift in this case; on March 12, 2009, Madoff pleaded guilty to all charges.25 However, although justice was swift, the SEC’s internal Office of Investigations discovered
25 SEC (2009, 1).

32 The Role of Culture in the Financial Industry
that the SEC was not. The Office of Investigations learned that the SEC had received six “red flag” complaints about Madoff ’s hedge fund operations, dating as far back as 1992, and had been presented with two reputable articles in the trade and financial press from 2001 that questioned Madoff ’s abnor-mally consistent returns.26
It is instructive to consider how the SEC’s culture dealt with these claims. A portfolio manager named Harry Markopolos submitted the earliest of the analytical complaints about Madoff ’s performance to the SEC. Markopolos, originally with Rampart Investment Management, found he could not replicate Madoff ’s returns without making impossible assumptions. Markopolos submitted his findings to the SEC several times to no avail: in 2000, through its Boston office, a complaint that was never recorded as reaching the SEC’s Northeast Regional Office (NERO);27 in 2001, a submission that NERO decided not to pursue after one day’s analysis;28 in 2005, which I will discuss in further detail below; a significant follow-up e-mail in 2007, which was “ignored,” in the words of the Office of Investigations report;29 and in April 2008, which failed to arrive owing to an incorrect e-mail address.30
Two similar analyses were brought to the SEC’s attention, one directly and one indirectly. In May 2003, an unnamed hedge fund manager contacted the SEC’s Office of Compliance Inspections and Examinations (OCIE) with a parallel anal-ysis.31 In November 2003, upper management at hedge fund Renaissance Technologies became concerned that Madoff ’s returns were “highly unusual” and that “none of it seems to add up.” In April 2004, this Renaissance correspondence was flagged for attention by a compliance examiner at NERO during a routine examination.32
OCIE and NERO conducted two separate, independent examinations of Madoff. Each examination was unaware of the other, until Madoff himself informed examiners of their mutual existence. (OCIE had not used the SEC’s tracking system to update the status of its examination; however, NERO had not checked the system, rendering the point moot.)33 OCIE passed its unresolved examination
26 SEC (2009, 21-2); Michael Ocrant, “Madoff Tops Charts; Skeptics Ask How,” MARHedge, May 2001; Erin Arvedlund, “Don’t Ask, Don’t Tell,” Barron’s, May 7, 2001.27 SEC (2009, 61-7).28 SEC (2009, 67-74).29 SEC (2009, 61 and 354).30 SEC (2009, 361-3).31 SEC (2009, 77-80).32 SEC (2009, 145-9).33 SEC (2009, 195-7).
documents to NERO and made no further communication with NERO about the case.34 Although NERO examiners still had important questions about Madoff ’s actions, NERO closed the examination before they were answered because of cultural time constraints. “There’s no hard and fast rule about field work but . . . field work cannot go on indefinitely because people have a hunch,” one NERO assistant director later testified.35
Markopolos’ 2005 complaint reached NERO with the strong endorsement of the SEC’s Boston office.36 However, the previous fruitless examination of claims against Madoff biased the NERO examiners against Markopolos’ claim.37 The examiners quickly discounted Markopolos’ idea that Madoff was running a Ponzi scheme. The staff attorney involved with the examination wrote at the beginning of the investigation that there wasn’t “any real reason to suspect some kind of wrongdoing . . . all we suspect is disclosure problems [empha-sis in original].”38 The Office of Investigations was harsh in its verdict: “As a result of this initial failure, the Enforcement staff never really conducted an adequate and thorough inves-tigation of Markopolos’ claim that Madoff was operating a Ponzi scheme.”39
The Madoff failure, summarized above in a necessarily streamlined account, was only one of many events that caused the internal culture of the SEC to fall under scrutiny. An extensive study of the SEC by the Government Accountability Office (GAO) in 2012 and 2013 found systemic problems throughout its organizational culture:40
Based on analysis of views from Securities and Exchange Commission (SEC) employees and previ-ous studies from GAO, SEC, and third parties, GAO determined that SEC’s organizational culture is not constructive and could hinder its ability to effectively fulfill its mission. Organizations with constructive cultures are more effective and employees also exhibit a stronger commitment to mission focus. In describing SEC’s culture, many current and former SEC employees cited low morale, distrust of manage-ment, and the compartmentalized, hierarchical, and risk-averse nature of the organization. According to an Office of Personnel Management (OPM) survey
34 SEC (2009, 136-8).35 SEC (2009, 223).36 SEC (2009, 240-4).37 SEC (2009, 255-9).38 SEC (2009, 266-8).39 SEC (2009, 368).40 Government Accountability Office (2013).

FRBNY Economic Policy Review / August 2016 33
of federal employees, SEC currently ranks 19th of 22 similarly sized federal agencies based on employee satisfaction and commitment. GAO’s past work on managing for results indicates that an effective personnel management system will be critical for transforming SEC’s organizational culture.
Apparently, the SEC’s hierarchical culture was hardened into “silos,” which not only prevented the flow of information from one division to another but also hindered the flow of infor-mation between management and staff.41 Morale, the sense of shared purpose, was low among staff, but management believed it was much higher.42 Despite earlier initiatives, the SEC’s culture had grown more risk-averse over time, and a majority of both staff and senior officers explicitly agreed that this was owing to the fear of public scandal. Some staff members anonymously reported that “managers have been afraid to close cases or make decisions because senior officers want to minimize the chances that they would be criticized later.”43
The GAO concluded its report with seven specific recom-mendations for changing the SEC’s culture. These included improvements in coordination and communication across internal departments and other agencies—presumably to prevent future cases like Madoff ’s from slipping through the cracks—and changes in personnel management practices to better align job performance with compensation and promo-tions. The SEC agreed with all seven recommendations. By its own account, it has made significant progress in addressing each of them since then. For example:44
Based on GAO’s recommendations, SEC made significant efforts to improve communication and collaboration. In an effort to optimize communications and collaboration, the SEC benchmarked and imple-mented a variety of best practices used both within the public and private sector, including cross-agency working groups, an agency-wide culture change initiative, and a more robust internal communication strategy. Work continues in this area to ensure that employees across the SEC are sharing critical informa-tion. . . . The purpose of OPM’s audit was to determine SEC’s adherence to merit system principles, laws, and regulations, and to assess the efficiency and effective-ness in administering human resources programs under the Talent Management System of the Human Capital
41 GAO (2013, 33-8).42 GAO (2013, 11). To be clear, low morale was not an issue at the SEC in 2008 but emerged in the wake of the unraveling of the Madoff Ponzi scheme and the realization that the SEC had failed to prevent it.43 GAO (2013, 16-7).44 SEC (2014, 132).
Framework. OHR is currently in the process of address-ing all of the required and recommended actions identified in the OPM audit and anticipates that all rec-ommendations will be resolved by the end of FY 2015.
These changes seem to be having an impact. The SEC’s score on the OPM’s Global Satisfaction Index—based on the same survey45 cited in the GAO’s earlier report—improved from 59 in 2012 to 65 in 2014. For comparison, in 2014, the agency with the highest job satisfaction rating was the National Aeronautics and Space Administration (an index value of 74), the agency with the lowest rating was the Depart-ment of Homeland Security (an index value of 48), and the government-wide index value was 59.
10. The Role of Feedback Loops
Although the SEC’s improvements may seem too little too late to those swindled by Madoff, the process by which these changes were proposed and implemented is a significant mechanism through which culture can be modified. By conducting a thorough, nonpartisan analysis of what hap-pened, how it happened, why it happened, and what can be done to reduce the likelihood of it happening again in the future, the GAO provided important feedback that led to improvements at the SEC, including improvements in its organizational culture. And this is not the only institutional feedback mechanism now in place at the SEC. The SEC Office of the Inspector General—an independent office within the SEC that conducts periodic audits and investigations within the agency—provides ongoing feedback to the SEC’s lead-ership to “prevent and detect fraud, waste, and abuse and to promote integrity, economy, efficiency, and effectiveness in the Commission’s programs and operations.”46 Meanwhile, regular employee surveys conducted by the OPM and the SEC provide objective metrics by which to measure progress and identify problems with morale and culture as they emerge. The well-known adage that “one cannot manage what one does not measure” encapsulates the critical role that metrics and feedback play in managing culture.
Perhaps the best example of the impact that negative feedback can have is the work of the National Transportation Safety Board (NTSB), an independent government agency with no regulatory authority whatsoever. The NTSB’s mandate is to investigate accidents, provide careful and conclusive
45 Office of Personnel Management (2014).46 http://www.sec.gov/about/offices/inspector_general.shtml (accessed March 18, 2015).

34 The Role of Culture in the Financial Industry
forensic analysis, and make recommendations for avoiding such accidents in the future. When an airplane crashes, the NTSB assembles a pre-arranged team of on-call engineers and flight-safety experts who are immediately dispatched to the crash site to conduct a thorough investigation. This laborious process includes interviewing witnesses, poring over historical flight logs and maintenance records, and sifting through the wreckage to recover the flight recorder, or “black box,” and, if necessary, reassembling the aircraft piece by jigsaw piece to determine the ultimate cause of the crash. Once the team’s work is done, the NTSB publishes a report summarizing the investigation, concluding with specific recommendations for avoiding future occurrences of similar accidents. The report is entered into a searchable, publicly available database.47 Despite having no regulatory authority, the NTSB has had enormous impact through these reports, which have been one of the major factors underlying the stunning improvement in the safety record of modern air transportation.
One concrete example of the NTSB’s impact involves the now-standard practice of spraying airplanes with de-icing fluid just prior to takeoff when it is raining or snowing and the tem-perature is near freezing. This procedure was instituted in the aftermath of the crash of USAir Flight 405 on March 22, 1992. Flight 405 stalled just after becoming airborne because of accu-mulated ice on its wings. De-icing fluid had been applied just before the aircraft left its gate, but takeoff was delayed because of air traffic when the plane was on its way to the runway, and ice re-accumulated on the plane’s wings while it waited for a departure slot in the freezing rain. The NTSB Aircraft Accident Report AAR-93/02—published February 17, 1993, and available through several websites—summarized the NTSB’s findings:
The National Transportation Safety Board deter-mines that the probable causes of this accident were the failure of the airline industry and the Federal Aviation Administration to provide flight-crews with procedures, requirements, and criteria compatible with departure delays in conditions conducive to airframe icing and the decision by the flightcrew to take off without positive assurance that the airplane’s wings were free of ice accumula-tion after 35 minutes of exposure to precipitation following de-icing. The ice contamination on the wings resulted in an aerodynamic stall and loss of control after liftoff. Contributing to the cause of the accident were the inappropriate procedures used by, and inadequate coordination between, the flightcrew that led to a takeoff rotation at a lower than pre-scribed air speed.
47 http://ntsb.gov/_layouts/ntsb.aviation/index.aspx.
Rather than placing blame on the technology or on human error, the NTSB conducted a thorough forensic examination and concluded that a systemwide failure to apply the technology correctly—waiting too long after de-icing and not checking for ice buildup just before takeoff—caused the crash. The change in de-icing procedures following this tragedy has no doubt saved many lives, thanks to NTSB Report AAR–93/02, but this par-ticular innovation did not come cheaply. It was paid for with the lives of the twenty-seven individuals who died in the crash of Flight 405. Imagine the waste if the NTSB had not investi-gated this tragedy and produced concrete recommendations to prevent it from happening again.
Financial crashes are far less deadly, generally involving no immediate loss of life. However, the recent financial crisis and its impact on people’s lives should be enough motivation to create a “Capital Markets Safety Board” (CMSB) dedicated
to investigating, reporting, and archiving the “accidents” of the financial industry. The CMSB would maintain teams of experienced professionals—forensic accountants, financial engineers from industry and academia, and securities and tax attorneys—who work together on a regular basis. Over the course of many investigations of major financial disasters, a number of new insights, common threads, and key issues would emerge from CMSB analyses. The publicly available reports from the CMSB would yield invaluable insights for those seeking to protect their future investments from similar fates, and, once in the hands of investors, this information would eventually drive financial institutions to improve their “safety records.”
A case in point is the Madoff Ponzi scheme. While several reports have been written on the SEC’s failure to recognize and stop this massive fraud, the forensic analysis on how Bernard Madoff—a highly respected and successful businessman who accumulated a huge fortune long before he began conning investors—came to commit such a crime has yet to be written. What was the cultural
The recent financial crisis and its impact
on people’s lives should be enough
motivation to create a “Capital Markets
Safety Board” (CMSB) dedicated to
investigating, reporting, and archiving the
“accidents” of the financial industry.
FRBNY Economic Policy Review / August 2016 35
milieu that gave rise to Madoff? How did someone with so many genuine accomplishments come to defraud friends and family, not to mention legions of admiring and (in not a few cases) worshipful investors? Is this an isolated incident that can be forgotten now that the perpetrator is behind bars, or should it serve as a cautionary tale because we each have the capacity for similar crimes within us? And what were the factors that allowed even sophisticated institutional investors to be duped and seduced by Madoff? Greed? Exclusivity? Competitive pressures from a low-yield environment and gyrating stock markets? Madoff ’s power and wealth? Unless we begin conducting forensic analyses of cultures gone wrong so we can learn what and how to change, we will be condemned to repeat the mistakes of our past. We need a CMSB.
As an aside, consider the cultural features that have led to the NTSB’s success. The NTSB’s culture of definitive expertise and teamwork has earned the public’s trust, and the agency is widely regarded as “the best in the
business,” not just in the United States but throughout the world (Lebow et al. 1999, 2). If we apply the classification scheme discussed earlier in this article, the NTSB has an individualistic culture with an elite composition and a legal-rational basis for its authority, but with a twist: small teams are the cohesive, accountable unit in the organiza-tion, rather than individuals per se. This organizational structure increases the sense of shared purpose during an investigation, while allowing flexibility of assignments at other times. Unlike at other regulatory agencies, a job at the NTSB is considered the capstone of a career, rather than a stepping stone. As a result, the NTSB is that rarest of government agencies: a highly focused, effec-tive organization with strong morale (Fielding, Lo, and Yang 2011, 29-33).
11. Practical Implications for Regulators and Risk Managers
Corporate culture is clearly a relevant factor in financial failure, error, and malfeasance. As we have seen, risk priorities mirror a corporate culture’s values, since no corporation has the resources to manage risk perfectly. Société Générale put very little priority on managing its trading desks, which reflected the low value it placed on its traders. Lehman Brothers spent more time concealing the flaws in its balance sheet than it spent remedying them—the risk of disclosure was more important than the risk of bank-ruptcy. AIG felt so secure in its practice of risk management that it allowed billions of dollars of toxic assets to appear on its balance sheet not once, but twice, the second in its much less publicized but comparably vulnerable securities lending program. These generalizations contain grains of truth, but they offer little guidance on what to change and how to change it.
What is the best way to immunize against the Gordon Gekko effect? The psychologist Philip Zimbardo put it succinctly enough: Resist situational influences (Zimbardo 2007, 451-6). Zimbardo was lucky enough to have a dissenting opinion that he implicitly trusted before his prison experiment spiraled out of control. Since that time, Zimbardo has investigated how the surrounding culture can influence good people to do evil things, much as the character Bud Fox was seduced by Gordon Gekko’s culture in Wall Street. Zimbardo offers ten key behaviors that he believes will minimize the effectiveness of a destructive culture in spreading its values, whether cor-porate or otherwise. Among them are the willingness to admit mistakes, the refusal to respect unjust authority, the ability to consider the future rather than the immediate present, and the individual values of honesty, responsibil-ity, and independence of thought. These behaviors may sound hackneyed, but they are no more hackneyed than the instructions to cover one’s mouth while coughing or to wash one’s hands regularly to prevent the spread of com-municable diseases.
However, skeptics would argue that, like fighting city hall or trying to cheat death, attempting to change a large organization’s culture is a Sisyphean task. How can any single agent expect to change attitudes and behavioral patterns that can span years and tens of thousands of current and former employees? While I believe such skep-ticism is misplaced, the dual-process theory of moral and ethical decision making does explain one source of this skepticism: It is indeed hard to change innate behavior, by definition. But the dual-process theory also implies a
Skeptics would argue that, like
fighting city hall or trying to cheat
death, attempting to change a large
organization’s culture is a Sisyphean
task. . . . The adaptive markets hypothesis
provides a framework in which we can
think systematically about taking on
this challenge.

36 The Role of Culture in the Financial Industry
path by which culture can be changed. More practically, the adaptive markets hypothesis provides a framework in which we can think systematically about taking on this challenge.
The first step is a subtle but important semantic shift. Instead of seeking to “change culture,” which seems naïve and hopelessly ambitious, suppose our objective is to engage in “behavioral risk management.”48 Despite the fact that we are referring to essentially the same goal, the latter phrase is more concrete, actionable, and unassailable from a corporate gov-
ernance perspective. Human behavior is a factor in virtually every type of corporate malfeasance; hence, it is only prudent to take steps to manage those behaviors most likely to harm the business. Once this semantic leap has been made, it is remarkable how readily more practical implications follow. By drawing on traditional risk management protocols used at all major financial institutions, we can develop a parallel process for managing behavioral risk.
Consider, for example, the typical process used to manage the risk of a financial portfolio (Lo 1999), which can be summarized by the mnemonic SIMON (Select, Identify, Measure, Optimize, Notice). First, select the major risk factors driving portfolio returns; second, identify the objective function to be optimized, along with any constraints that must be satisfied; third, measure the statistical laws of motion governing portfolio-return dynamics; fourth, optimize the objective function subject to the return dynamics and any constraints, which yields the optimal portfolio weights and hedging positions; and finally, notice any change in the system and repeat the previous four steps, as needed. Any systematic financial risk-management protocol must have every element of SIMON represented in some fashion. For example, an emerging market debt fund might select exchange rates and interest rates as the major risk factors affecting the fund; identify the information ratio as the objective to be optimized; measure exchange rate and interest rate dynamics using sta-tistical time series and mathematical term structure models; optimize the information ratio subject to these dynamics and
48 I thank Hamid Mehran for suggesting this terminology.
a volatility or tracking-error constraint; and notice when the optimal weights for futures and forward contracts require rebalancing, and start the process all over again. SIMON says “manage your risk!”
Now consider applying SIMON to the management of behavioral risks. First, select the major behavioral risks facing the firm—for example, a lack of appreciation and respect for compliance procedures, senior management’s intolerance for opposing views, the cutting of corners with respect to operational policies and procedures to achieve growth and profitability targets, and so on. Second, identify the objective function and constraints—for example, corporate values, short- and long-run goals, and the firm’s mission statement. Third, measure the statistical “laws of motion” governing behavior—for example, the dual-process theory of moral reasoning, Haidt’s five-factor model, and the OPM’s Global Satisfaction Index. Fourth, optimize the objective function subject to constraints, which yields the optimal compensation structures and hedging instruments—that is to say, compliance procedures, reporting requirements, and supervisory relationship—for aligning the culture with the objectives. Finally, and most importantly, notice any changes in the system to ensure that the behavioral risk management protocol is achieving the desired result, and repeat the previ-ous four steps as often as needed.
The weakest link in this analogical chain is the third: measuring behavioral laws of motion. Our quantitative understanding of human behavior is still in its infancy, and without reasonably accurate predictive analytics, behavioral risk management is more aspirational than operational. In the case of financial risk management, the laws of motion of asset returns are readily available from a multitude of risk management software platforms and real-time data vendors in the form of linear factor models, credit scores, and value-at-risk and loss-probability models. Nothing comparable exists to support behavioral risk managers. Psychological profiles, social network maps, and job satisfaction surveys such as those conducted by the OPM are currently relegated to human resources departments, not risk committees or corporate boards.
However, the starting point for any scientific endeavor is measurement. Psychological profiles, social networks, and human resources data can serve as the basis for constructing behavioral risk models, perhaps along the lines implied by the work of social psychologists such as Haidt (2007), and empirically based models of the systematic and idiosyn-cratic factors underlying fraud, malfeasance, and excessive risk-taking behavior, as described in Dyck, Morse, and Zingales (2013) and Deason, Rajgopal, and Waymire (2015). But even before attempting to construct such models, we can
Human behavior is a factor in virtually
every type of corporate malfeasance;
hence, it is only prudent to take steps to
manage those behaviors most likely to
harm the business.

FRBNY Economic Policy Review / August 2016 37
learn a great deal by simply documenting the reward structure for individuals within an organization so as to develop an integrated view of the corporate ecosystem. For example, if a financial institution’s chief risk officer (CRO) is compensated through bonuses tied only to the firm’s profitability and not to its stability, it should be obvious that risk may not be the CRO’s primary focus.
From a quantitative perspective, the ultimate achievement would be an empirically based methodology for predicting individual and group behavior to some degree as a function of observable systematic and idiosyncratic factors. For example, imagine being able to quantify the risk appetite of financial executive i by the linear factor model
Risk Appetitei = αi + βi1(Reward) + βi2(Potential Loss) + βi3(Career Risk) + βi4(Competitive Pressure)
+ βi5(Peer Pressure) + βi6(Self-Image) + βi7(Regulatory Environment) + εi
where the coefficients measure how important each factor is to the executive’s risk appetite and the factors vary across time, circumstances, and institutions. If we could estimate such a behavioral risk model for each executive, then we would be able to define “culture” quantitatively as a preponderance of individuals with numerically similar factor loadings. A culture of excessive risk taking and blatant disregard for rules and regulations might consist of an entire division of individuals who share very high loadings for the “Reward” and “Competitive Pressure” factors and very low loadings for the “Potential Loss” and “Regulatory Environment” factors. If such a risk model could be empirically estimated, we would begin to understand the Gordon Gekko effect at a more granular level and to develop ways to address it. Moreover, since this framework implicitly acknowledges that the factors driving behavior are time-varying and context-dependent, as competitive pressures increase owing to low yields and increased competition, regulators can expect behavior to change and should adapt accordingly.
Such a framework may seem more like science fiction than science at this point, but its development has already begun. In 2009, in the aftermath of the financial crisis, De Nederlandsche Bank (DNB), the Dutch central bank, proposed a new approach to supervising banks. In a mem-orandum titled “The Seven Elements of Ethical Culture” (De Nederlandsche Bank 2009), the bank said:
This document presents DNB’s strategy on the issue of behaviour and culture. It describes the background and reasons why it is important to include ethical
behaviour and culture in supervision, sets out the legal framework for doing so, and explains what the current situation is, both within institutions and in the exercise of supervision by DNB. In presenting these elements for an ethical culture and sound conduct, this document describes the supervisory model that DNB wishes to follow in determining its supervisory efforts and, in a general sense, the plan of action for 2010-2014.
To support this effort, DNB has created the Expert Centre on Culture, Organisation, and Integrity, hired organizational psychologists and change experts, and launched several inter-nal research projects to develop new supervisory methods specific to corporate culture.49
More recently, researchers at the Federal Reserve Bank of New York undertook an important empirical first step in creating a behavioral risk model: They conducted and published a survey about the New York Fed’s supervisory activities for large financial institutions, describing how these activities are staffed, organized, and implemented by the New York Fed on a day‐to‐day basis (Eisenbach et al. 2015). This survey provides an unprecedented level of trans-parency into bank supervision for the many stakeholders not privy to these policies and procedures. As observed by the authors of the survey, “Understanding how prudential supervision works is a critical precursor to determining how to measure its impact and effectiveness.”
Pan, Siegel, and Wang (2015) provide another example of a new breed of empirical analysis of culture by econ-omists. They define and measure corporate risk culture by determining the risk preferences among corporate founders, executives, and board members at more than
49 See Nuijts and de Haan (2013) for further details of DNB’s current efforts on supervising bank culture.
Once the specific behaviors, objectives,
and value systems in the corporate
culture are identified and quantified, the
alignment of corporate values . . . with
behavior can be facilitated in a number of
ways. Economic incentives are the most
direct approach, and the one favored by
economists and the private sector.

38 The Role of Culture in the Financial Industry
6,000 U.S. public firms from 1996 to 2012, using surnames to infer cultural heritage and then linking this heritage to the risk attitude of the country of origin. Although surely imperfect and subject to the obvious critique of overly broad generalizing and cultural stereotyping, this intriguing method of inferring risk culture is worthy of study and, with time and collective effort, can be refined as a better understanding of its strengths and weaknesses is developed. As Knight (1940, 16) instructed, “ . . . and when you can’t measure, measure anyhow.”
Once the specific behaviors, objectives, and value systems in the corporate culture are identified and quantified, the alignment of corporate values and mission with behavior can be facilitated in a number of ways. Economic incentives are the most direct approach, and the one favored by economists and the private sector (see Section 6). However, other tools are available to the behavioral risk manager, including changes in corporate governance, the use of social networks and peer review, and public recognition or embarrassment.
If, for example, an organization is concerned about insuffi-cient controls owing to a culture that equates risk taking with power and prestige, consider the following three measures: First, the organization can appoint a CRO who (1) reports directly to the company’s board of directors, (2) can only be removed by a vote of the board, and (3) has the authority and the responsibility to temporarily relieve the CEO of his or her responsibilities if the CRO determines that the firm’s risk levels are unacceptably high and the CEO has not responded to the CRO’s request to reduce risk. A second, more radical measure to change the risk-taking culture of an organization is to make all employees who are compensated above some threshold, let’s say one million dollars, jointly and severally liable for all lawsuits against the firm. Such a measure would greatly increase the scrutiny that these well-paid individuals place on their firm’s activities, reducing the chances of misbehavior. A third, even more extreme, measure is Kane’s (2015) proposal to hold indi-vidual executives criminally liable for not fulfilling a fiduciary duty to the public, which would no doubt change the corporate culture of important financial institutions.
Of course, such measures would also greatly decrease the amount of risk that the firm is willing to take, which may not sit well with shareholders. Balancing the trade-offs between
various incentives and governance mechanisms will ulti-mately determine the kind of culture that emerges and whether this culture is consistent with the corporation’s core values and mission.
A similar behavioral risk model can, of course, be esti-mated for regulators. The recent reforms at the SEC provide an opportunity to consider how quantitative metrics, such as those produced by the OPM survey, can be combined with empirical patterns of corporate fraud and malfeasance to produce more adaptive regulation. For example, rising markets should be accompanied by increasing surveillance for potential Ponzi schemes among the most vulnerable affinity groups, and regulatory examinations should target those institutions with cultures most likely—as defined by their behavioral risk models—to violate key regulations.
In addition, the potential exists for regulators to pick up elements of culture from the corporations they regulate that can render them less effective, much like public health workers becoming infected with the disease they are fighting. In some cases, this leads to full-fledged regulatory capture, while in others, it merely leads to an inaccurate bill of good health. It is essential to the goal of regulatory efficacy that regulators remain immune to the values of other corporate cultures while main-taining a sufficiently deep working knowledge of them. This is easier said than done, but measurement of regulatory culture may be a starting point for identifying potential problems before they turn into more serious lapses.
These hypothetical examples show that culture can be a choice, not a fixed constraint. The emerging discipline of behavioral risk management can be the means by which a corporation’s culture is measured and managed. And, thanks to advances in the behavioral and social sciences, big data, and human resources management, for the first time in regulatory history, we have the intellectual means to construct behavioral risk models. We just need the will to do so. To paraphrase Reinhold Niebuhr’s well-known serenity prayer, the behav-ioral risk manager must seek the serenity to accept those parts of culture that cannot be changed, the courage and the means to change those parts of culture that can and should be changed, and the behavioral risk models and forensic studies required to distinguish one from the other.

FRBNY Economic Policy Review / August 2016 39
References
Abbot, P. et al. 2011. “Inclusive Fitness Theory and Eusociality.” Nature 471, no. 7339 (March): E1–E4.
Beck, U. 1992. Risk Society: Towards A New Modernity. London: Sage Publications.
Bénabou, R. J. 2013. “Groupthink: Collective Delusions in Organi-zations and Markets.” Review of Economic Studies 80, no. 2 (April): 429-62.
Bénabou, R. J., and J. Tirole. 2016. “Bonus Culture: Competitive Pay, Screening, and Multitasking.” Journal of Political Economy 124, no. 2 (April): 305-70.
Boyd, R. 2011. Fatal Risk: A Cautionary Tale of AIG’s Corporate Suicide. Hoboken, N.J.: Wiley.
Burns, M. P., and J. A. Sommerville. 2014. “‘I Pick You’: The Impact of Fairness and Race on Infants’ Selection of Social Partners.” Frontiers in Psychology 5, no. 93 (February). doi:10.3389/fpsyg.2014.00093.
Burns, N., K. Minnick, and L. T. Starks. 2013. “CEO Tournaments: A Cross-Country Analysis of Causes, Cultural Influences and Consequences,” August 10. Available at SSRN: http://ssrn.com/abstract=2261788.
Cohen-Cole, E., and J. Morse. 2010. “Your House or Your Credit Card, Which Would You Choose? Personal Delinquency Tradeoffs and Precautionary Liquidity Motives.” Available at SSRN: http://ssrn.com/abstract=1411291 or http://dx.doi.org/10.2139/ssrn.1411291
Cohn, A., E. Fehr, and M. A. Maréchal. 2014. “Business Culture and Dishonesty in the Banking Industry.” Nature 516, no. 7529 (December): 86-9.
Crémer, J. 1993. “Corporate Culture and Shared Knowledge.” Industrial and Corporate Change 2, no. 1: 351-86.
De Nederlandsche Bank (DNB). 2009. “The Seven Elements of an Ethical Culture.” Available at http://www.dnb.nl/en/binaries/The%20Seven%20Elements%20of%20an%20Ethical%20Culture_tcm47-233197.pdf.
Deason, S., S. Rajgopal, and G. Waymire. 2015. “Who Gets Swindled in Ponzi Schemes?” Unpublished paper, Emory University, Goizeta Business School.
Deng, Y., J. M. Quigley, and R. Van Order. 2000. “Mortgage Termi-nations, Heterogeneity, and the Exercise of Mortgage Options.” Econometrica 68, no. 2 (March): 275-307.
De Waal, F. 2006. Primates and Philosophers: How Morality Evolved. Princeton, N.J.: Princeton University Press.
Douglas, M., and A. Wildavsky. 1982. Risk and Culture: An Essay on the Selection of Technological and Environmental Dangers. Berkeley, Calif.: University of California Press.
Durkheim, É. 1893. The Division of Labor in Society. Trans. W. D. Halls, intro. L. A. Coser, 1997. New York: Free Press.
Dyck, A., A. Morse, and L. Zingales. 2013. “How Pervasive Is Corpo-rate Fraud?” Working paper, August.
Eisenbach, T., A. Haughwout, B. Hirtle, A. Kovner, D. Lucca, and M. Plosser. 2015. “Supervising Large, Complex Financial Insti-tutions: What Do Supervisors Do?” Federal Reserve Bank of New York Staff Reports, no. 729, May. http://www.ny.frb.org/research/staff_reports/sr729.pdf.
Elul, R., N. S. Souleles, S. Chomsisengphet, D. Glennon, and R. Hunt. 2010. “What ‘Triggers’ Mortgage Default?” American Economic Review 100, no. 2 (May): 490–4. Papers and Proceedings of the 122nd Annual Meeting of the American Economic Association.
Fielding, E., A. W. Lo, and J. H. Yang. 2011. “The National Transportation Safety Board: A Model for Systemic Risk Management.” Journal of Investment Management 9, no. 1 (First Quarter): 17-49.
General Accounting Office (GAO). 1999. “Long-Term Capital Man-agement: Regulators Need to Focus Greater Attention on Systemic Risk.” GAO/GGD-00-3. October.
Gibson, R., C. Tanner, and A. F. Wagner. 2015. “Do Situational Social Norms Crowd Out Intrinsic Preferences? An Experiment Regard-ing the Choice of Honesty.” Swiss Finance Institute Research Paper no. 15-01, April. Available at SSRN: http://ssrn.com/abstract= 2557480.
Gordon, G. G., and N. DiTomaso. 1992. “Predicting Corporate Perfor-mance from Organizational Culture.” Journal of Management Studies 29, no. 6 (November): 783-98.

40 The Role of Culture in the Financial Industry
References (Continued)References (Continued)
Goodstein, R., P. Hanouna, C. D. Ramirez, and C. W. Stahel. 2013. “Contagion Effects in Strategic Mortgage Defaults.” GMU Working Paper in Economics no. 13-07, January. Available at SSRN: http://ssrn.com/abstract=2229054 or http://dx.doi .org/10.2139/ssrn.2229054.
Government Accountability Office. 2013. “Securities and Exchange Commission: Improving Personnel Management Is Critical for Agency’s Effectiveness.” GAO-13-621. July.
Graham, J., J. Haidt, and B. A. Nosek. 2009. “Liberals and Conser-vatives Use Different Sets of Moral Foundations.” Journal of Personality and Social Psychology 96, no. 5 (May): 1029-46.
Greene, J. 2014. “Beyond Point-and-Shoot Morality: Why Cog-nitive (Neuro)science Matters for Ethics.” Ethics 124, no. 4 (July): 695-726.
Guiso, L., P. Sapienza, and L. Zingales. 2006. “Does Culture Affect Economic Outcomes?” Journal of Economic Perspectives 20, no. 2 (Spring): 23-48.
———.2013. “The Determinants of Attitudes toward Strategic Default on Mortgages.” Journal of Finance 68, no. 4 (August): 1473-515.
Haidt, J. 2007. “The New Synthesis in Moral Psychology.” Science 316, no. 5827 (May): 998-1002.
Hamilton, W. 1964. “The Genetical Evolution of Social Behavior. I and II.” Journal of Theoretical Biology 7, no. 1 (July): 17-52.
Haney, C., C. Banks, and P. Zimbardo. 1973a. “Interpersonal Dynamics in a Simulated Prison.” International Journal of Criminology and Penology 1: 69-97.
———. 1973b. “Study of Prisoners and Guards in a Simulated Prison.” Naval Research Reviews 9: 1-17.
Hermalin, B. E. 2001. “Economics and Corporate Culture,” in C. L. Cooper, S. Cartwright, and P. C. Earley, eds., The International Handbook of Organizational Culture and Climate. Chichester, U.K.: John Wiley & Sons.
Hill, C. A., and R. W. Painter. 2015. Better Bankers, Better Banks. Chicago: University of Chicago Press.
Ho, K. Z. 2009. Liquidated: An Ethnography of Wall Street. Durham, N.C.: Duke University Press.
Hodgson, G. M. 1996. “Corporate Culture and the Nature of the Firm,” in John Groenewegen, ed., Transaction Cost Economics and Beyond. Boston: Kluwer Academic Press.
Hunter, M., and N. C. Smith. 2011. Société Générale: The Rogue Trader. Fontainebleau, France: INSEAD. Available at: http://cases.insead.edu/publishing/case?code=26046.
Iyer, R., S. Koleva, J. Graham, P. Ditto, and J. Haidt. 2012. “Under-standing Libertarian Morality: The Psychological Dispositions of Self-Identified Libertarians.” PLoS ONE 7, no. 8: e42366, August. doi:10.1371/journal.pone.0042366
Janis, I. L. 1982. Groupthink: Psychological Studies of Policy Decisions and Fiascoes. Boston: Houghton Mifflin.
Kane, E. J. 2015. “Unpacking and Reorienting the Executive Subcul-tures of Megabanks and Their Regulators.” Unpublished paper. Available at SSRN: http://ssrn.com/abstract=2594923.
Knight, F. H. 1940. “‘What Is Truth’ in Economics?” Journal of Political Economy 48, no. 1 (February): 1-32.
Kreps, D. M. 1990. “Corporate Culture and Economic Theory.” In J. E. Alt and K. A. Shepsle, eds., Perspectives on Positive Political Economy. Cambridge: Cambridge University Press.
Kroeber, A. L., and C. Kluckhohn. 1952. Culture: A Critical Review of Concepts and Definitions. Cambridge, Mass.: Peabody Museum of American Archaeology.
Kronman, A. T. 1983. Max Weber. Stanford, Calif.: Stanford University Press.
Lazear, E. P. 1995. “Corporate Culture and the Diffusion of Values.” In H. Siebert, ed., Trends in Business Organization. Tübingen, Germany: J.C.B. Mohr (Paul Siebeck).
Lebow, C. C., L. P. Sarsfield, W. L. Stanley, and E. Ettedgui. 1999. Safety in the Skies: Personnel and Parties in NTSB Aviation Acci-dent Investigations. Santa Monica, Calif.: RAND Corporation.
Lo, A. W. 1999. “The Three P’s of Total Risk Management.” Financial Analysts Journal 55, no. 1 (January/February): 13-26.

FRBNY Economic Policy Review / August 2016 41
References (Continued)
———. 2004. “The Adaptive Markets Hypothesis: Market Efficiency from an Evolutionary Perspective.” Journal of Portfolio Management 30, no. 5 (Thirtieth Anniversary Issue): 15-29.
———. 2013. “The Origin of Bounded Rationality and Intelligence.” Proceedings of the American Philosophical Society 157, no. 3 (September): 269-80.
Lowenstein, R. 2000. When Genius Failed: The Rise and Fall of Long-Term Capital Management. New York: Random House.
Lyng, S. 1990. “Edgework: A Social Psychological Analysis of Volun-tary Risk Taking.” The American Journal of Sociology 95, no. 4 (January): 851-86.
Milgram, S. 1963. “Behavioral Study of Obedience.” The Journal of Abnormal and Social Psychology 67, no. 4 (October): 371-8.
Nolder, C., and T. J. Riley. 2014. “Effects of Differences in National Culture on Auditors’ Judgments and Decisions: A Literature Review of Cross-Cultural Auditing Studies from a Judgment and Decision Making Perspective.” Auditing: A Journal of Practice and Theory 33, no. 2 (May): 141-64.
Nowak, M., and R. Highfield. 2011. SuperCooperators: Altruism, Evolution, and Why We Need Each Other to Succeed. New York: Free Press.
Nowak, M. A., C. E. Tarnita, and E. O. Wilson. 2010. “The Evolution of Eusociality.” Nature 466, no. 7310 (August): 1057-62.
Nuijts, W., and J. de Haan. 2013. “DNB Supervision of Conduct and Culture.” In A. J. Kellermann, J. de Haan, and F. de Vries, eds., Finan-cial Supervision in the 21st Century. Berlin: Springer-Verlag.
O’Reilly, C. A., and J. Chatman. 1996. “Culture as Social Control: Corporations, Culture, and Commitment.” In B. M. Staw and L.L. Cummings, eds., Research in Organizational Behavior 18, 157-200. Greenwich, Conn.: JAI Press.
Office of Personnel Management. 2014. 2014 Federal Employee Viewpoint Survey: Agency Ratings. Accessed March 18, 2015. http://www.fedview.opm.gov/2014FILES/Global_Satisfaction_Index_Score_Trends_2014.xls.
Pan, Y., S. Siegel, and T. Y. Wang. 2015. “Corporate Risk Culture.” Unpublished paper. Available at SSRN: http://ssrn.com/abstract=2675594.
Perrow, C. 1999. Normal Accidents: Living with High-Risk Technologies. Princeton, N.J.: Princeton University Press.
Quercia, R. G., and L. Ding. 2009. “Loan Modifications and Rede-fault Risk: An Examination of Short-Term Impact.” Cityscape 11, no. 3: 171-93.
Schein, E. H. 2004. Organizational Culture and Leadership. San Francisco: Jossey-Bass.
Securities and Exchange Commission (SEC). Office of Investigations. 2009. Investigation of Failure of the SEC to Uncover Bernard Madoff’s Ponzi Scheme. Public version. Report OIG-509. August 31. Washington, D.C.: Government Printing Office.
Securities and Exchange Commission (SEC). 2014. Agency Finan-cial Report: Fiscal Year 2014. Washington, D.C.: Securities and Exchange Commission.
Shapira, Z. 1995. Risk Taking: A Managerial Perspective. New York: Russell Sage Foundation.
Shelp, R. K., and A. Ehrbar. 2009. Fallen Giant: The Amazing Story of Hank Greenberg and the History of AIG. 2nd ed. Hoboken, N.J.: Wiley.
Shiller, R. 2005. Irrational Exuberance. 2nd ed. Princeton, N.J.: Princeton University Press.
Simon, H. A. 1997. Administrative Behavior: A Study of Deci-sion-Making Processes in Administrative Organizations. 4th ed. New York: Free Press.
Smith, C. W. 2005. “Financial Edgework: Trading in Market Cur-rents.” In S. Lyng, ed., Edgework: The Sociology of Risk Taking. London: Routledge.
Snow, R. 2013. I Invented the Modern Age: The Rise of Henry Ford. New York: Scribner.
Société Générale. 2008. “Mission Green: Summary Report.” English translation. Accessed September 20, 2014.

42 The Role of Culture in the Financial Industry
References (Continued)
The views expressed are those of the author and do not necessarily reflect the position of the Federal Reserve Bank of New York or the Federal Reserve System. The Federal Reserve Bank of New York provides no warranty, express or implied, as to the accuracy, timeliness, completeness, merchantability, or fitness for any particular purpose of any information contained in documents produced and provided by the Federal Reserve Bank of New York in any form or manner whatsoever.
Sørensen, J. B. 2002. “The Strength of Corporate Culture and the Reliability of Firm Performance.” Administrative Science Quarterly 47, no. 1 (March): 70-91.
Steinberg, L. 2008. “A Social Neuroscience Perspective on Adolescent Risk-Taking.” Developmental Review 28, no. 1 (March): 78-106.
Trivers, R. L. 1971. “The Evolution of Reciprocal Altruism.” Quarterly Review of Biology 46, no. 1 (March): 35-57.
Valukas, A. R. 2010. “Report of Anton R. Valukas, Examiner: Chapter 11, Case No. 08‐13555 (JMP), In Re Lehman Brothers Holdings Inc., et al., Debtors.” Volume 3. March 11. United States Bankruptcy Court, Southern District Of New York. Accessed September 23, 2014. http://jenner.com/lehman/VOLUME%203.pdf.
Venkatesh, S. A. 2006. Off the Books: The Underground Economy of the Urban Poor. Cambridge, Mass.: Harvard University Press.
Weeks, J. 2004. Unpopular Culture: The Ritual of Complaint in a British Bank. Chicago, Ill.: University of Chicago Press.
Wilson, M., and M. Daly. 1985. “Competitiveness, Risk Taking, and Violence: The Young Male Syndrome.” Ethology and Sociobiology 6, no. 1: 59-73.
Zhang, R., T. J. Brennan, and A. W. Lo. 2014. “Group Selection as Behavioral Adaptation to Systematic Risk.” PLoS ONE 9, no. 10: e110848. doi:10.1371/journal.pone.0110848.
Zimbardo, P. G. 2007. The Lucifer Effect: Understanding How Good People Turn Evil. New York: Random House.

FRBNY Economic Policy Review / August 2016 43
The author thanks Rich Apostolik, Brian Baugh, Harry DeAngelo, Rudiger Fahlenbrach, Andrei Gonçalves, Ross Levine, Hamid Mehran, Victor Ng, Jill Popadak, Anthony Santomero, Anjan Thakor, and Rohan Williamson for comments. The views expressed in this article are those of the author and do not necessarily reflect the position of the Federal Reserve Bank of New York or the Federal Reserve System.
To view the author’s disclosure statement, visit https://www.newyorkfed.org/ research/author_disclosure/ad_epr_2016_risk-management-governance_stulz.html.
René M. Stulz is the Everett D. Reese Chair of Banking and Monetary Economics at the Fisher College of Business, Ohio State University, and is affiliated with the National Bureau of Economic Research, the European Corporate Governance Institute, and the Wharton Financial Institutions Center.
René M. Stulz
Risk Management, Governance, Culture, and Risk Taking in Banks
1. Introduction
The Oxford Dictionary defines risk as a situation that involves exposure to danger. It also states that the word comes from the Italian word risco, which means danger. I call risks that are only danger bad risks. Banks—and any firm for that matter—also have opportunities to take risks that have an ex ante reward on a standalone basis. I call such risks good risks.1
One might be tempted to conclude that good risk manage-ment reduces the exposure to danger. However, such a view of risk management ignores the fact that banks cannot succeed without taking risks that are ex ante profitable. Consequently, taking actions that reduce risk can be costly for shareholders when lower risk means avoiding valuable investments and activities that have higher risk. Therefore, from the perspec-tive of shareholders, better risk management cannot mean risk management that is more effective at reducing risk in general because reducing risk in general would mean not taking valuable projects. If good risk management does not mean low risk, then what does it mean? How is it implemented? What are its limitations? What can be done to make it more effec-tive? In this article, I provide a framework to understand the
1 For a related useful taxonomy, see Kaplan and Mikes (2012). The authors distinguish between preventable, strategic, and external risks and show that the role of risk management differs across these types of risk.
role, the organization, and the limitations of risk management in banks when it is designed from the perspective of increas-ing the value of the bank for shareholders.
In corporate finance, the well-known Modigliani-Miller theorem of leverage irrelevance implies that the value of a firm does not depend on its leverage. For the theorem to hold, markets have to be frictionless, so there cannot be transaction costs of any kind. As has been stressed by modern banking research, there is no reason for banks to exist if the conditions of the Modigliani-Miller theorem hold. With the Modigliani-Miller theorem, a bank has the same value whether it is mostly financed by debt or mostly financed by equity. Hence, the value of a bank is the same irrespective of its risk of default or distress. It follows that if the conditions for the Modigliani-Miller theorem apply, a bank has no reason to manage its risk of default or its risk of financial distress (see, for example, Stulz [2003]).
When the Modigliani-Miller theorem does not apply, the most compelling argument for managing risk is that adverse outcomes can lead to financial distress and financial distress is costly (Smith and Stulz 1985). When a firm is distressed, it loses its ability to implement its strategy effectively and finds it more difficult and expensive to conduct its business. As a result, the value of a firm’s equity is reduced by the present value of future costs of financial distress. When a

44 Risk Management, Governance, Culture, and Risk Taking in Banks
firm manages risk so that it reduces the present value of these future costs of distress by more than the cost of reducing risk, firm value increases. Banks differ from firms in general because they create value for shareholders through their liabilities as part of their business model. Banks produce liquid claims and the value of a bank depends on its success at producing such claims. For instance, the value of a bank depends on its deposit franchise. A bank’s ability to issue claims that are valued because of their liquidity depends on its risk, so that risk management is intrinsic to the business model of banks in a way that it is not for nonfinancial firms (DeAngelo and Stulz 2015).
Since an increase in risk can enable a bank to invest in assets and projects that are valuable but can also lead to a loss in value because of an adverse impact on the bank’s risk of financial distress and its ability to create value through liabilities, there is an optimal amount of risk for a bank from the perspective of its shareholders. A well-governed bank will have processes in place to identify this optimal amount of risk and make sure that its actual risk does not differ too much from this optimal amount. Theoretically, the bank’s problem is simple: it should take any project that increases its value, taking into account the costs associated with the impact of the project on the bank’s total risk. But in practice, the bank’s problem is difficult because risk-taking decisions are made all the time throughout the bank and each decision affects the bank’s probability of financial distress to some degree. As a result, risk-taking decisions cannot be evaluated in isolation but must be assessed in terms of their impact on the overall risk of the bank.
In principle, if there is an optimal level of risk for a bank, the cost of taking on a new risk that increases the bank’s total risk should be traded off against the potential gain from taking the risk. However, ignoring hedges, it would never make sense for a bank to take a risk that destroys value as a standalone risk. We call such risks bad risks. They correspond only to danger. An example is a trader who writes underpriced deep-out-of-the-money puts because he believes that, if the puts are exercised, he will not receive a bonus anyway, while if they are not exercised, his bonus will be higher. Such a pur-chase is a negative net present value project for shareholders as a standalone project since the firm sells an asset for less than it is worth. Writing an overpriced put would be a positive net present value project on a standalone basis. Hence, such a risk would be a good risk. However, writing this option creates risk for the bank that may or may not be worth it given its total risk and the costs associated with its total risk. With our examples, both the bad risk and the good risk increase the bank’s total risk. While it is clear that taking the bad risk makes no sense for the bank, we cannot determine whether
it makes sense for it to take the good risk by considering the good risk on a standalone basis. This is because taking the good risk increases the total risk of the bank.
At a point in time, how the risk of a project contributes to the total risk of the bank depends on the other risks the bank is exposed to at that time. Consequently, when risk taking is decentralized, the trade-off between how a project’s risk contributes to the bank’s risk and its expected return cannot be made in real time for most risk-taking actions because the project’s contribution to the bank’s value and its risk depends on the bank’s total risk at that time. Instead, a shortcut is typically used, which is to focus on risk separately (ignoring return) and manage the overall amount of risk of the bank by imposing limits on the risk that can be taken by units of the bank and/or by charging units for the risks they are taking. The risk management function in a bank measures and monitors risk taking by a bank’s units to ensure that their risk remains within prescribed limits and that the bank has the right amount of risk. A bank’s risk management function is generally called a bank’s risk management, and I follow that language. Unfortunately, focusing separately on risk has the potential to destroy value if not done well when it leads the bank to reject projects that are valuable for the insti-tution despite their risk.
There are two fundamentally different ways that a bank’s risk management can destroy value. First, risk management can fail to ensure that the bank has the right amount of risk. This failure can come about for a number of reasons. In particular, risk management can fail to uncover bad risks that should be eliminated, it can mismeasure good risks, and it can fail in its task to measure the firm’s total risk. Second, risk management can be inappropriately inflexible, so that increases in risk are prevented even when they would be valu-able to the institution. When risk management becomes too inflexible, it destroys value because the institution no longer has the ability to invest in valuable opportunities when they become available, and it also becomes less effective in making sure that the firm has the right amount of risk. The reason is straightforward: as risk managers become policemen, they are viewed within the institution as an obstacle rather than as partners in creating value. Striking the right balance between helping the firm take risks efficiently and ensuring that employees within the firm do not take risks that destroy value is a critical challenge for risk management in any bank.
In this article, I first discuss the determinants of a firm’s optimal risk level in general, and then I turn to banks. In Section 3, I examine the role of governance and risk man-agement in helping a bank achieve its optimal risk level. I offer an analysis of the determinants of the organization of risk management in Section 4. I assess the tools used by risk

FRBNY Economic Policy Review / August 2016 45
management to ensure that the bank does not take on an excessive amount of risk in Section 5. In Section 6, I show that the limitations of the tools used by risk management create an important role for incentives and for a firm’s culture. Section 7 presents my conclusions.
2. Determining the Risk Appetite
In a market economy, there are compelling reasons for cor-porations to be run to maximize shareholder wealth. These reasons apply to banks as well. However, no corporation maximizes shareholder wealth in a vacuum. In particular, corporations are constrained in their actions by laws and reg-ulations. Laws and regulations play a special role with banks because bank failures and weaknesses can have damaging effects on the financial system and the economy. If a bank is managed to maximize shareholder wealth, it will choose a level of risk consistent with that objective. A bank with too much risk could not conduct its business even if regulators allowed it to do so. Such a bank would find it hard to fund itself. While deposit insurance guarantees depositors against losses, it does not guarantee that they have continuous access to their deposits. Further, many short-term liabilities of banks are not insured. To the extent that safe and liquid deposits are a source of value for banks, too much risk will limit a bank’s ability to supply safe and liquid deposits and hence will adversely affect the value of the bank.
Some borrowers may have no reason to care if the bank they borrow from is too risky, but others will care. Borrowers who rely on their relationship with the bank could see that relationship jeopardized or lost if the bank becomes distressed or fails.2 They might therefore seek to borrow elsewhere rather than deal with a risky bank. If the bank is in the derivatives business, counterparties will be leery of dealing with it if it is too risky. The bank might also find it difficult or expensive to hire employees because potential employees will be reluc-tant to make bank-specific human-capital investments in a bank that is too fragile.
These and other reasons can explain why a bank that is too risky is worth less. At the same time, however, a bank that has no risk whatsoever might not be worth much either. Of course, if a bank could find valuable projects whose value it could capture without having to bear the risks, perhaps because it could perfectly hedge all those risks, that bank
2 See, for instance, Poloncheck, Slovin, and Sushka (1993) for evidence that corporate borrowers are affected adversely when their relationship bank becomes distressed.
would have considerable value already and might not be able to increase its value by taking risks. In practice, however, banks cannot eliminate all risks through hedging and diversification. Hence, they have to take some risks to create wealth for their shareholders.
There are many ways to define risk. Shareholders who hold diversified portfolios have no reason to care about the volatility of the return of a stock in their portfolio on a standalone basis. They only care about the volatility of their portfolios. If a stock’s volatility increases so that shareholders’ portfolios become more volatile, shareholders can change their asset allocations. Hence, the risk that shareholders care about when they consider a bank is risk that makes the bank worth less than it would otherwise be worth. For risk to affect share-holder wealth, it has to affect future cash flows or the rate at which these cash flows are discounted. The possibility of unexpectedly low cash flows in the future that would make the bank distressed will reduce the value of the bank now because the market will adjust its value for the possibility that the bank will incur distress costs. These costs arise because the bank is
Striking the right balance between
helping [a] firm take risks efficiently and
ensuring that employees within the firm
do not take risks that destroy value is a
critical challenge for risk management
in any bank.
no longer able to execute its strategy. Hence, the loss to share-holders is the loss that arises when the bank cannot implement its strategy. Viewed from this perspective, the risk that has to be managed to maximize shareholder wealth is the risk of financial distress.
For now, I will assume that the risk of financial distress is appropriately captured by the bank’s credit rating. Given the previous discussion, the optimal rating of a bank is generally not the highest rating, AAA, but some other rating. This is because, typically, achieving a AAA rating requires the bank to give up too many valuable risky projects. Suppose that a specific bank’s value is at its highest when the bank is given an A rating. An A rating essentially corresponds to a very low probability of default. From 1981 to 2011, the annual average default rate for A-rated credits was 0.08 percent, according to Standard and Poor’s.3 Hence, by targeting a specific probability
3 Standard and Poor’s, “Default, Transition, and Recovery: 2011 Annual Global Corporate Default Study and Rating Transitions,” March 21, 2012.

46 Risk Management, Governance, Culture, and Risk Taking in Banks
of default, the bank achieves its desired level of risk. For that institution, a higher rating than A will necessarily limit its activities so that it would have to give up projects. A lower rating than A might make it impossible for the bank to keep engaging in value-creating activities. This might be the case, for instance, if potential counterparties are not willing to transact with it if it has such a rating.
A bank with more of a deposit franchise and with more relationship lending is likely to prefer a higher rating than an institution that is engaged in more transactional activities. Similarly, a bank that enters into long-term derivatives contracts might find a higher rating more valuable than one that does not. Consequently, the rating that maximizes bank value differs across banks. The exhibit above shows the relationship between ratings and bank value for two different banks, Bank Safe and Bank Risky. In both cases, the relation-ship is concave, so that there is a maximum value. However, in the case of Bank Safe, firm value falls steeply if the bank is riskier than its target rating and increases only moderately as it increases its risk toward the target rating. For Bank Risky, the relationship between bank value and rating is substantially different. Its target rating is BBB and its value rises significantly as it increases its risk toward its target and falls sharply if it exceeds it. For both banks, having too much risk is extremely costly in terms of their value. However, for one bank, having too little risk has little cost, while for the other it has a large cost.
The relationship between bank value and risk presented for Bank Safe and Bank Risky in Exhibit 1 is sharply different from the relationship that would prevail if the Modigliani-Miller leverage irrelevance theorem applied to banks. In the Modigliani-Miller case, bank value would be the same
irrespective of the bank’s risk of default or of financial distress. In other words, the bank could achieve exactly the same value if its rating were AAA or CCC. The reason for this is straight-forward. If the Modigliani-Miller theorem applies, the firm can always alter its leverage at zero cost and hence achieve a specific rating through changes in leverage—for instance, by issuing equity and investing the proceeds in fairly priced risk-free securities. Since changing leverage has no impact on value when the Modigliani-Miller theorem applies, it follows that there is no relationship between bank value and risk of default in that world.
If the Modigliani-Miller theorem applies, decision making in a bank can be decentralized as long as new projects do not have an adverse impact on existing projects. If new projects do not affect the value of existing projects, it is optimal for the bank to take all projects that create value on a standalone basis. However, if there is an optimal level of risk for the bank as a whole, a new project necessarily has an impact on other projects because it changes the bank’s aggregate level of risk and hence changes its own value through its impact on the risk of the bank. Consequently, fully decentralized decision making cannot be optimal when the Modigliani-Miller theorem does not apply and there is an optimal level of risk for a bank.
With the approach presented so far, bank value is highest if the bank achieves a specific target rating that depends on characteristics of the bank, such as its strategy and business model. But in practice, not all banks are rated. I have focused on a rating as a measure of risk because it is intuitive. However, a rating corresponds to a probability of default, and a bank that does not have a rating can still figure out the probability of default that is optimal. Obviously, banks might choose to tailor their risk in a more complex way. They might want to specify how they are affected by specific shocks. For instance, a bank might choose to set a level of risk such that it can survive a major recession with only a one-notch downgrade. An obvious difficulty with multiple constraints on a bank’s risk is that these constraints might be inconsistent and their impact on bank value might be hard to assess. At the same time, however, multiple constraints can be advantageous in that they could make it more likely that a bank will be well positioned following adverse shocks.
A bank’s risk appetite is the result of an assessment of how taking on more risk affects the opportunities that the bank can capitalize on. This assessment can change as the bank’s oppor-tunities change. Consequently, a bank’s risk appetite cannot be inflexible. At the same time, however, the risk appetite is not determined in such a precise way that a small shift in opportunities will affect it.
Bank Value as a Function of Bank Risk Measuredby the Bank’s Credit Rating
Value of bank
AA BB Credit rating
Bank Risky
Bank SafeVSafe
VRisky

FRBNY Economic Policy Review / August 2016 47
Banks differ from other firms because their failure can have systemic effects. If a producer of widgets fails, as long as there are other producers of widgets, the impact on society will be extremely limited and will be immaterial for most. The same is not true if a large bank or a group of smaller banks fails. While it is important for society to limit the systemic risk that a bank creates, there is no a priori reason that a bank that has less systemic risk is worth more for its shareholders. It follows that a bank that maximizes its value for its shareholders may have an amount of systemic risk that is excessive from the perspective of society.
Because of the role of banks and the consequences of bank failures, regulators impose restrictions on banks’ ability to take risks on the asset side and they require banks to satisfy minimum capital requirements. As a result, each bank’s systemic risk is reduced. These restrictions and require-ments also mean that a bank chooses its level of risk subject to constraints. However, these constraints do not change the bottom line, which is that there is an optimal level of risk for a bank and this optimal level of risk differs across banks depending on the nature of their business. Because the optimal level of risk differs across banks, the costs to shareholders of constraints imposed by regulators are not equal across banks. For instance, Boyson, Fahlenbrach, and Stulz (2014) show that banks with high franchise value have incentives to choose low-risk strategies, so that for such banks, capital requirements are unlikely to be constraining.
3. Governance and Risk Taking
In Section 2, I presented a risk appetite framework from the perspective of the bank’s shareholders. Good gover-nance means that shareholders get the maximum benefit from their ownership of the firm (Shleifer and Vishny 1998). With banks, regulation is a constraint that shareholders have to meet. Given the constraint, shareholders still want to maximize their wealth, and hence a well-governed bank should have mechanisms in place so that the level of risk chosen by management maximizes shareholder wealth subject to the constraints imposed by regulation. In this section, I address key trade-offs that must be made when designing a firm’s risk governance. This section is not meant to address general governance issues in banking, since excellent reviews of those issues already exist (Mehran, Morrison, and Shapiro 2011; Mehran and Mollineaux 2012; de Haan and Vlahu 2013) and the topic goes beyond the risk issues I am focused on.
In the framework of Section 2, there is, for each bank, a level of risk such that the value of the bank is maximized for shareholders. This level of risk is not zero. Good governance should ensure that the firm chooses this level of risk. This means making sure that the firm has processes in place that enable it to measure its risk, understand how firm value is related to risk, and maintain the right level of risk.
An obvious concern for shareholders is that management might do a poor job managing the firm’s risk or might have incentives to take risks that are not in the interest of share-holders. To alleviate this concern, the board has to ensure
A well-governed bank should have
mechanisms in place so that the level of
risk chosen by management maximizes
shareholder wealth subject to the
constraints imposed by regulation.
that the firm has the capability to measure and manage risk so that it has the right level of risk given its risk appetite, and has to ensure that it uses this capability effectively so that it actually takes the right level of risk. This means that the bank should have a risk management organization in place capable of making sure that it has the right level of risk. I discuss risk management organizational issues in the next section.
An important governance issue is that the bank’s board of directors has to have enough expertise to assess management’s efforts in measuring and managing risks. Understanding whether a firm takes the right risks is a rather complex and technical task. Even if the board has the proper expertise, it may be difficult for it to develop such an understanding. While boards require an external assessment of a firm’s accounting, they do not typically require such an assessment of what is effectively a firm’s risk accounting (though auditors may comment on various aspects of risk management). It would seem that risk audits might be valuable tools in helping the board reach the proper level of comfort that management is handling a bank’s risk properly.
An important implication of this view of risk governance is that good risk governance does not mean less risk. In fact, it could well be that management, left to itself, would choose for the bank to have too little risk rather than what is best for shareholders. Good governance means that the bank has the right amount of risk for its shareholders. This amount of risk may not be the amount that is appropriate from the perspec-tive of society as a whole because shareholders may not have the proper incentives to take into account the externalities

48 Risk Management, Governance, Culture, and Risk Taking in Banks
created by the bank’s risk taking. Because the optimal amount of risk from the perspective of shareholders need not be the optimal amount for society, it would be wrong to believe that somehow better governance makes banks safer. It can make them more valuable but also riskier.
To make the issues clearer, consider the situation where it is optimal in terms of shareholder value to increase the risk of a bank. This greater risk may make the bank more fragile but also more valuable. If an adverse realization of the increased risk taken by the bank leads it to become distressed, this can have an adverse impact on other banks that are counterparties of the bank. For instance, a default by the bank could mean that other banks sustain losses on unsecured obligations from the defaulting bank. As these other banks sustain losses, they become financially weaker and potentially endanger the
Because the optimal amount of risk from
the perspective of shareholders need not
be the optimal amount for society, it would
be wrong to believe that somehow better
governance makes banks safer. It can
make them more valuable but also riskier.
stability of the financial system. A bank maximizing share-holder wealth will take into account the potential impact of its actions on the financial system only to the extent that they affect its value. This means that the bank is likely to take too much risk from the perspective of society because it will ignore the impact of that risk on society beyond what is reflected in its value. For instance, the fact that a failure of the bank could lead counterparties of its counterparties to fail will be a cost that has little impact on the value of the bank but may have considerable impact on the safety of the financial system. Hence, to make sure that banks take proper account of the impact of their actions on the financial system, constraints have to be put on the actions they can take and/or taxes have to be imposed on actions that are costly to the financial system.
Existing empirical research does not seem to support the proposition that better governance in banks leads to less risk. The credit crisis provides a natural experiment for testing this proposition. If it were correct, we would expect better-governed banks to be less affected by the crisis since they would have been less exposed to risks that manifested themselves during the crisis, assuming these risks were properly measured beforehand. Alternatively, it could be
that the risks were not or could not be properly assessed in advance. In any case, there is no evidence suggesting that better-governed banks performed better during the crisis.
Specifically, research examines four dimensions of gov-ernance. First, evidence shows that banks with boards that were more shareholder friendly performed worse than other banks, not better (Beltratti and Stulz 2012; Erkens, Hung, and Matos 2012). Anginer et al. (2013, 2014) provide a more general exploration of the relationship between governance, performance, and capitalization using an international data set. They find that banks with better governance have less capital, and, strikingly, that better governance is associated with more insolvency risk for banks and that the effect is larger in countries with better fiscal health. The authors attribute this stronger effect to the fact that there is more value for banks in exploiting the financial safety net. Laeven and Levine (2009), using a cross-country data set, show that when ownership is more concentrated, so that shareholders have more power, banks take more risk.
Second, the governance literature emphasizes that more stock ownership by top management leads to better alignment of incentives between management and shareholders. However, existing evidence shows that banks whose management had more of a stake performed worse during the crisis, not better (Fahlenbrach and Stulz 2011).
Third, there is a considerable literature that focuses on CEOs’ ability to entrench themselves so that they can pursue their own objectives rather than maximize shareholder wealth. Such entrenched CEOs are likely to take less risk than shareholders would like them to because they could lose their jobs if their banks experience distress. Ferreira et al. (2013) show that managers of banks that were more entrenched were less likely to be bailed out during the crisis. Relatedly, Chen, Hong, and Scheinkman (2010) show that institutional investors had a preference for banks that were taking more risk before the crisis.
Finally, there is no evidence that banks whose boards had more financial expertise performed better (Minton, Taillard, and Williamson 2014). All this evidence, at the very least, implies that better governance did not lead banks to perform better during the crisis. Of course, the implication is not that better governance is bad for shareholders; rather, the correct implication is that better governance does not mean less risk. Better governance meant taking risks that would have been rewarding for shareholders had there not been a crisis. Because a crisis like the one that transpired, if it was contem-plated at all, was viewed as an exceedingly low-probability event, the evidence supports the view that shareholders saw the taking of these risks as worthwhile for them ex ante.

FRBNY Economic Policy Review / August 2016 49
4. The Organization of Risk Management
In this section, I discuss the trade-offs that affect how risk management should be organized in a bank. Consider a bank where employees throughout the organization can take risks. Suppose that the top management could know exactly what the bank’s risk is at each point in time, and suppose further that it could instantly hedge risk at zero cost. In this case, risk management would be straightforward. Having determined its risk appetite, the bank could control its risk through hedging by top management. As long as risk takers in the bank only took projects that create value regardless of their risk, top management would have no reason to monitor the risk in the sense of assessing risk decisions made by employees. All the bank would have to do is measure the risk taken within the bank and control it through hedging.
Real-world banks cannot control risk this way for at least three important reasons:
1. Limitations in risk-measurement technology: While real-time risk measures exist for a number of activities within banks, such measures do not exist for banks as a whole. Further, risk measurement is imperfect and can be quite imprecise. Finally, risk measurement can be affected by behavioral biases. For instance, over-optimism and groupthink can lead to important issues being ignored or underappreciated (Greenbaum 2014).
2. Limitations on hedging: Even if a bank had a highly precise measure of its overall risk, it does not follow that it could safely manage its overall risk through hedging by top man-agement. Some risks cannot be hedged and hedges may not work out as planned.
3. Limitations regarding risk-taker incentives: Risk takers do not take only those risks that increase the value of the bank. Some risk takers turn out to be rogue traders. More importantly, however, risk takers often are rewarded in ways that give them incentives to take risks that are not as valuable to the bank as they are to the risk takers. It is even possible that risk takers can gain from taking risks that destroy value for the bank. This problem is made worse by the limitations in risk measurement tools.
These three limitations mean that risk has to be monitored and managed throughout the organization. To help with this task, large banks have risk management organizations that employ risk managers and are headed by a chief risk officer (CRO). Despite their title, risk managers, for the most part, do not manage risk. They primarily measure it, monitor it, and help those who do manage risk. To see this more concretely, consider the interactions between the head of a trading desk at a bank and the bank’s risk managers. The head of the
trading desk manages the risk taken by the desk, taking into account the opportunities that are available and their risk. He does so within constraints set by senior management and possibly the board. Risk management will help in setting these constraints and may have a more direct role because of delegation from senior management and possibly the board. Risk management will monitor the risk of the desk and make sure that that risk stays within the limits that have been set by the bank. Similarly, at the firm level, risk management also has a monitoring and advising role, but the top risk manager in a company is the CEO, not the CRO.
Section 2 presented a framework for understanding the type of risk management an organization should select to maximize shareholder wealth. If the relationship between bank value and risk is close to flat, risk management cannot create much value by making sure that the bank’s aggregate risk is at its optimal level. In contrast, if too much risk results in a sharp drop in bank value, risk management that keeps the bank from taking on too much risk creates significant value in that the bank would be worth much less if the market lacked confidence in its ability to manage risk. It therefore follows that the extent of a bank’s investment in risk management depends on how its value is related to its risk. The size of the investment in risk management is an investment decision like any other for a bank. Therefore, it has to compare costs and benefits. Excessive investment in risk management can destroy value just as much as insufficient investment in risk management can.
The risk-taking framework also helps in assessing how independent the risk management function should be. One often-held view is that risk management is the equivalent of the audit function, but for risk. From this perspective, since the audit function in a firm is independent, the risk manage
Despite their title, risk managers, for the
most part, do not manage risk. They
primarily measure it, monitor it, and help
those who do manage risk.
ment function should be independent as well. Unfortunately, this view is problematic on two grounds. First, auditors who follow the rules cannot be an obstacle to the profitability of the firm. Their job is to make sure the profits are real. They only have a verification function. They cannot tell the firm not to take on a project. The same is not true for risk managers. Risk managers have more than just a verification function; they are involved when employees contemplate an action, to help assess the risks of the action and when it will lead to limits
50 Risk Management, Governance, Culture, and Risk Taking in Banks
being breached. Risk managers can prevent employees from taking actions that could increase firm value, and they can help employees increase firm value by devising strategies that are less risky but not less profitable. Hence, it is important for risk man-agers to be able to help and support risk takers when appropriate. Second, if risk managers are viewed as the risk police, they face obstacles in gathering information and understanding strategies. They are likely to be kept out of the information flow that is critical in assessing risk and they may not learn about model weaknesses and new risks until it is too late.
The right degree of independence for risk managers cannot be achieved by formal rules alone. The reporting line of a risk manager may be completely separate from the business line whose risk he is monitoring, yet the risk manager might have the ambition to move into that business line. In that case, formal independence may not lead to the desired indepen-dence (Landier, Sraer, and Thesmar 2009). A risk manager might be partly evaluated by the business line he monitors, but this incomplete independence can have very different implications depending on the culture of the institution. In an
The occurrence of an undesirable outcome
is not evidence of excessive risk taking or
bad management. It could simply be the
realization of an extremely low-probability
event that was fully contemplated by the
bank when it chose its strategy.
institution where business lines have a weak commitment to managing risk effectively, this incomplete independence can be a way for business lines to retaliate against the risk manager if he is uncooperative, and it can lead to a situation where the business line can take risks that it should not. In an institution with a strong commitment to managing risk effectively, such incomplete independence can help in setting incentives so that risk management collaborates with business units to enable them to achieve their goals within existing risk limits.
A small but growing literature attempts to relate charac-teristics of a firm’s risk governance or risk organization to risk outcomes and firm performance. This literature faces three important challenges. First, limited data are available on how the risk function is organized in firms. Second, the risk framework I have discussed implies that characteristics of the risk function are partly determined by the risk appetite of the firm. Hence, a characteristic of the risk function might be associated with low risk not because having this characteristic reduces risk but because it is optimal for the firm to have low
risk when it displays such a characteristic. For instance, given a risk target, better risk management means that the firm will be less likely to miss the target materially. If missing the target is more costly for firms with a low target, better risk management will spuriously appear to be associated with low risk. Third, at the firm level, poor ex post performance can be consistent with very good risk management.
Risk management targets the level of risk. However, as long as a bank takes risks, there is some chance, albeit small, that an undesirable outcome could take place. Hence, the occurrence of an undesirable outcome is not evidence of excessive risk taking or bad management. It could simply be the realization of an extremely low-probability event that was fully contemplated by the bank when it chose its strategy.
The literature on risk governance has focused on two dis-tinct characteristics of risk governance. First, it has examined attributes of the board and its functioning. In particular, the literature studies whether the board has a risk committee, how often that risk committee meets, and whether the risk committee has members who have expertise on financial or risk issues. Lingel and Sheedy (2012) construct a measure of the quality of board oversight of risk whose value depends on the fraction of experienced directors on the board’s risk committee and how frequently the committee meets. The authors consider two measures of risk, both stock-based: stock return volatility and the worst weekly return. Using a sample of the sixty largest publicly listed banks from 2004 to 2010, the authors show that better board oversight of risk in a given year using these measures is associated with lower risk the following year. Second, the literature looks at the status of the CRO. Lingel and Sheedy (2012) investigate the role of CRO status and find that having a high-status CRO (one who is a member of the senior executive team and is among the top five most highly paid executives) leads to less risk. The authors find that banks with CROs of higher status have less risk. The authors find no evidence that banks with better risk management according to their proxies performed better during the crisis.
Other studies explore the relationship between risk and similar variables. One variable that other studies have used is CRO centrality, which is the ratio of the compensation of the CRO to the compensation of the CEO. Authors find that CRO centrality is associated with lower implied volatility ahead of the crisis (Kashyap 2010) and better loan performance (Keys et al. 2009). Another variable is whether the CRO reports to the board. Aebi, Sabato, and Schmid (2012) find that banks in which the CRO reports to the board rather than to the CEO performed better during the crisis. Ellul and Yerramilli (2013) combine a number of risk governance attributes into an index. They show that banks in the United States that had higher

FRBNY Economic Policy Review / August 2016 51
values for the index had higher returns during the crisis. Further, they find that bank holding companies with a higher value of the index have less tail risk, measured by the average return on the five worst daily stock returns during a year.
The studies investigate how risk management affects tail risk and stock returns. Risk management does not target these measures, and the relationship between metrics that risk management does focus on and these measures does not appear straightforward. Therefore, one would want to know through which channels risk management affects stock returns and stock tail risk measures because an understanding of these channels would give reassurance that the relationships documented in these studies are not spurious. An interesting paper by Berg (2014) provides some evidence on this issue. He shows that, in a bank where loan officers are rewarded according to loan volume, having risk management monitor loan decisions reduces the probability of default of loans in the bank’s loan portfolio.
Another issue with these studies is that a financial insti-tution could have good risk governance because it is costly for that institution to have too much risk and so it wants low risk. Hence, the institution sets up its risk management organization to ensure that it will have low risk. Viewed from this perspective, the empirical evidence shows that a financial institution that wants to have low risk can achieve low risk. Simply paying a CRO a higher salary relative to the CEO will not ensure that a financial institution has low risk.
5. Tools and Challenges in Achieving the Optimal Level of Risk
If all the risks of a firm could be captured by a reliable valueat-risk (VaR) measure, the risk framework presented in Section 2 could be implemented in a conceptually straight-forward way. I show this in the first part of this section. I then turn to the limitations of using VaR to manage firm-wide risk.
5.1 Using VaR to Target Risk
The risk framework of Section 2 implies that a firm wants to target the probability of making a loss that could put it in financial distress or in default. In other words, it wants the probability of a loss that exceeds a threshold amount to be its target probability. Hence, if the firm wants its probability of default within a year to be, for the sake of illustration, 0.06 percent, it wants the loss that has only a 0.06 percent
probability of being exceeded to be the largest loss it could incur without being forced into default. A loss that is exceeded only with a probability p over one year is the value at risk (VaR) over one year at the probability level p. It follows that the risk framework leads directly to the use of VaR as a firm-wide risk measure (Nocco and Stulz 2006). The use of VaR is ubiquitous in risk management, which gives rise to a constant debate about the merits of VaR. However, despite its weaknesses, VaR is the right risk measure in a wide range of circumstances.
Consider a bank that has chosen a risk appetite that implies that its probability of failure is 0.06 percent over one year. This means that the bank is expected to fail less than once in a
The use of VaR [value at risk] is ubiquitous
in risk management, which gives rise to a
constant debate about the merits of VaR.
However, despite its weaknesses, VaR is
the right risk measure in a wide range of
circumstances.
thousand years. Suppose that the bank has $100 billion of assets and $10 billion of equity. If all the risks that the bank faces could be measured through a bank-wide VaR, the bank should have an equity cushion such that there is a 0.06 percent probability that it will make a loss that would be larger than its equity cushion. If this bank has a bank-wide VaR of $15 billion, it has taken too much risk given its risk appetite because its probability of default is higher than 0.06 percent. Hence, this bank should either reduce the risk of its assets or raise additional equity.
Within a bank, a VaR can be estimated for any risk-taking unit (see, for instance, Litterman [1996]). For instance, a VaR can be estimated for the book of a trader as well as for the unit that the trader belongs to. Starting from the smallest units for which VaR is estimated, the VaRs can be aggregated so that the bank-wide VaR is a function of the VaRs of these units as well as of the correlations in risks across these units. Further, using the VaRs of the smallest units and the correlations, it is possible to assess how each unit contributes to the risk of the bank. For instance, a bank could estimate how much of its risk as measured by VaR is accounted for by a specific trader.
The fact that the bank-wide VaR results from the aggrega-tion of VaRs of units of the bank means that risk management can target the bank’s VaR by setting limits on the VaRs of units of the bank. With such an approach, if all units are within

52 Risk Management, Governance, Culture, and Risk Taking in Banks
their limits, the VaR of the bank should not exceed the VaR that corresponds to its risk appetite.
5.2 Setting Limits
The risk framework provides guidelines for how VaR limits should be set. First, the firm’s risk appetite specifies the firm-level VaR limit. Second, within the firm, VaR limits should depend on the profitability of the risk-taking unit in relation to its VaR. Ideally, the marginal unit of risk should have the same expected profit across all risk-taking units of the bank. It would make little sense for a bank to allow a unit to take up large amounts of risk if that unit cannot use that risk to create value for the bank. Because profit opportunities change, it follows that limits cannot be unchangeable. When profit opportunities appear for a sector of the bank, it makes sense for limits to be adjusted. However, if the bank’s risk appetite has not changed, VaR limits cannot be increased in one sector of the bank without being decreased elsewhere. Of course, if profit opportunities change for the bank as a whole, so that the expected return from risk taking increases, it can be optimal for the bank to change its risk appetite and, as a consequence, its firm-wide VaR limit as well.
With the risk framework of Section 2, a bank targets its probability of default over a year. To properly target this probability of default, it has to make sure that its risk does not depart from its target over the year. This means that it must monitor and set limits at a higher frequency during the year. For instance, the bank can monitor and control the risk of trading activities in liquid markets using a one-day VaR. Within the year, the bank can change limits in response to unexpected losses. This flexibility means that it has the ability to take more risks if it expects that it can adjust its risk easily.
An obvious problem with setting limits is that the bank’s units might not make full use of their ability to take risk. Consider a unit with a daily VaR limit of $10 million. If that unit can alter its VaR through trades quickly and at low cost, it will operate close to its limit as long as it has opportunities to trade. However, if a unit cannot alter its VaR quickly and at low cost, it will want to keep some risk capacity in reserve so that it can take advantage of opportuni-ties if circumstances change.
An important issue in setting limits is determining the level of aggregation for which limits are set. In practice, this is often described as the issue of selecting the level of granularity of limits. Consider the case where a limit is set for a department that trades in mortgage-backed securities. More granular limits would be limits at the trader level.
Even more granular limits would be for maturity bins at the trader level. More granular limits make it much harder, and sometimes impossible, for risk-taking units to accumulate large unmonitored pockets of risk. However, more granular limits also make it much more difficult for risk-taking units to aggressively take advantage of good opportunities without negotiating a relaxation of limits. As limits become less gran-ular, the discretion of the risk-taking units increases. More discretion makes it easier for these units to take advantage of opportunities quickly, but it also makes it easier for them to end up with large losses.
5.3 The Limits of Risk Measurement
Measuring risk at the firm level presents obvious difficulties. First, aggregating VaR measures to obtain a firm-wide risk measure is fraught with problems. Second, VaR does not capture all risks. Third, VaR has substantial model risk. I assess these issues in turn.
To organize the analysis, I will continue using the risk framework of Section 2. Hence, the bank targets a probability of default. I will assume that it targets that probability over a one-year horizon. The firm defaults or fails if it makes a loss large enough that it exhausts its equity buffer. So, to prop-erly target a probability of default, the firm has to correctly measure the risk of a loss that exceeds the size of the equity buffer. This means that all risks that could lead to losses have to be modeled. If the firm targets a probability of default of 0.06 percent but models only some of the risks, it will have a higher probability of default if its equity buffer corresponds to the one-year VaR obtained from the modeled risks.
A typical approach for a bank is to divide risks into market, credit, and operational risks. Basel II introduced this division and requires banks to hold capital for each of these types of risk. Unfortunately, a firm-wide VaR that is obtained by aggregating market, credit, and operational risks will typically not reflect all risks. Such an approach misses business risks if these risks are not modeled as part of operational risk. For many banks, noninterest income is a large component of revenue. This income is variable and it tends to be low when the bank makes losses on loans. Such income has to be modeled when assessing the amount of equity necessary to support the targeted probability of default. Second, credit VaRs do not necessarily model the risk arising from unexpected changes in interest rates and credit spreads. More generally, interest rate risks in the banking book and interest rate risks arising from liabilities are typically not included in firm-wide VaRs.

FRBNY Economic Policy Review / August 2016 53
The firm-wide measurement apparatus used by banks is focused on risks arising from the asset side. In practice, however, banks can fail because their funding vanishes (see, for example, Duffie [2010]). Before the crisis, funding liquidity risk was often not even part of risk management in banks but instead was the focus of the treasury department. Now, funding liquidity risk is an issue that is given more attention by risk management. However, it is still not the case that funding risk is integrated in the firm-wide VaR analysis. A shock to funding can force the bank to sell assets at a loss. Further, shocks to funding are more likely to happen
A typical approach for a bank is to divide
risks into market, credit, and operational
risks. . . . Such an approach misses
business risks if these risks are not
modeled as part of operational risk.
in periods when markets for securities are themselves less liquid, so that selling assets quickly will be costly because they are sold at a discount.
If a bank divides risks between market, credit, and operational risks, it has to aggregate these risks to obtain a firm-wide measure of risk (Rosenberg and Schuermann 2006). This aggregation requires estimates of the correlations between these types of risks. It turns out that aggregate risk is very sensitive to these estimates. To see this, suppose that a bank has a VaR of $1 for each type of risk. If the correlations are 1 among the risks, the bank-wide VaR is $3. If the correla-tions are 0, the bank-wide VaR falls to $1.73. Unfortunately, data to estimate such correlations are sparse. Yet, these cor-relation estimates make an enormous difference in the amount of equity that is required to target a given default probability. Mistakes in correlation estimates could lead a bank to have too little capital and to have a risk of default much larger than its targeted risk of default.
Another important problem in aggregating risk is that different types of risk have different statistical distributions. While market risk generally has a fat-tailed symmetric dis-tribution but can often be well-approximated by the normal distribution, the distributions for credit risk and operational risk are both fat-tailed and highly skewed. Risks that are normally distributed can be added up in a straightforward way because the sum of normally distributed variables is a normally distributed variable. However, it is not straight-forward to add risks that follow different distributions. One approach that the literature has focused on is the use of
copulas. Implementing this approach in practice has proven challenging, especially in the context of yearly frequencies, where there is only limited data available for estimation.
A VaR is a forecast. When it is estimated for the firm as a whole, it is a forecast for the firm as a whole. One can assess whether a VaR is properly estimated by examining the VaR exceedances (see, for example, Christoffersen [2011]). If a bank estimates a one-day VaR at the 5 percent level for its trading book, it expects the VaR to be exceeded roughly thirteen times in a year. If the VaR is exceeded fewer than thirteen times, it is a potential indication that the bank’s VaR estimates are biased upward. Alternatively, if the VaR is exceeded more than thirteen times, the VaR may be biased downward or random variation may be such that the unbi-ased VaR was exceeded more than thirteen times. Statistical tests have been developed that can be used to assess whether a VaR is biased given sampling variation. The problem with an annual VaR estimated at the 0.06 percent probability level is that there cannot be a sufficient history to reliably assess whether the VaR is unbiased. The fact that a 0.06 percent VaR is not exceeded over a period of five years tells us almost nothing. Consequently, risk measures used to assess the appropriate size of a capital buffer cannot be back-tested sat-isfactorily. The only way to assess whether such risk measures are reliable is to assess the process that is used to produce them. However, such an approach does not resolve the key issue that the one-year VaR estimated for extremely low probability levels (such as the 0.06 percent in my example) is very sensitive to assumptions made about the extreme tail of the distribution of the value of the bank. These assumptions cannot be tested robustly in the way that assumptions for a 5 percent daily VaR can be tested.
No discussion of risk management can be complete without addressing the issue of risks that are not known—the famous black swans of Nassim Taleb or the “unknown unknowns” of Donald Rumsfeld. These rare risks are not relevant for VaR when the VaR is estimated at probability levels that are not extremely low. Hence, they do not create a bias in such VaR forecasts. However, the role of these risks becomes much more consequential when assessing an annual VaR at extremely low probability levels, such as the 0.06 percent level. The losses corresponding to such a VaR are caused by extremely rare events, so that one’s understanding of what such rare events could be becomes important. A focus on historical data and the use of established statistical techniques cannot by itself be sufficient to estimate a VaR at the 0.06 percent level because the historical data generally encompasses a period that is too short to develop an accurate representation of extreme losses that have an annual probabil-ity of less than 0.06 percent of occurring.

54 Risk Management, Governance, Culture, and Risk Taking in Banks
A 0.06 percent VaR is one that should be exceeded less than once every thousand years. In other words, a bank that targets a 0.06 percent probability of default should be able to survive just about any crisis. This suggests another approach to investigating whether the VaR is correctly estimated. Since the bank should survive almost all crises, a simple way to assess whether the bank’s targeting of the probability of default is done correctly is to simulate what the performance of the bank would be if historical crises were to repeat. This approach amounts to performing stress tests. If such tests show that the bank would be unable to survive past crises, it is likely that its VaR is biased. More generally, however, stress tests can help us understand the risks that a bank is exposed to and whether it has enough equity to withstand adverse realizations of these risks.
6. Incentives, Culture, and Risk Management
Risk measurement is never perfect. Even if it were, there would still be the problem that firm value does not depend on risk alone. Risk management that is structured so that it rigidly keeps a bank’s risk below some pre-specified level and does so through a large set of inflexible limits may well succeed in controlling risk, but in the process it may prevent the institution from creating wealth for its shareholders. In a bank, risk management is part of the production technol-ogy. If risk management works well, the institution creates more value because it can issue more liquid claims and because it has more capacity to take profitable risks.
An unfortunate tendency among some board members and regulators is to think of the risk management function as a compliance function in the same way that auditing is a compliance function. Assuredly, there is an important compli-ance element to risk management. If a limit is set for a specific risk, the risk function must ensure that the limit is respected and understand why it is exceeded if it is. However, auditors are never in a position to conclude that departures from generally accepted accounting principles (GAAP) can create shareholder wealth. In contrast, risk managers who have some discretion over limits have to know when limit exceedances should be allowed and when a business line should be forced to respect a limit. Risk managers also have to determine, or help determine, when limits have to be changed and when it is appropriate for the institution to adjust its risk appetite.
Banks always face trade-offs between risk and expected return. To complicate matters, risk and expected return are measured imperfectly. If the costs to an institution of having
more risk than is optimal are extremely high, that institution may benefit from having a risk management organization that operates as a police department that enforces rules. In this
Lines of business cannot know by
themselves the extent to which the risks
they take increase firm value because
the amount of risk the bank can take at a
given point in time depends on other risks
taken by other lines of business.
case, it would also make sense for the organization to account for limitations in risk measurement by imposing a substantial risk buffer—in other words, set a limit for the risk measure that is lower than the objective to account for the fact that the risk measure might understate risk. However, this is not typi-cally the situation that an institution faces. In general, an institution can lose a lot from not being able to take advantage of opportunities that might be precluded by an inflexible risk organization. Further, difficulties in assessing risk mean that a risk management organization might make incorrect risk assessments without having a dialogue with business units. Unfortunately, such a dialogue is often impossible if the risk management function is viewed as a compliance unit rather than an essential part of the firm that seeks to implement poli-cies that increase firm value.
Hall, Mikes, and Millo (2013) and Mikes, Hall, and Millo (2013) conducted a clinical study of two banks, which they denote as Saxon Bank and Anglo Bank. Their study shows vividly the issues involved in the positioning of risk manage-ment within the organization. In Saxon Bank, risk managers succeeded in being part of the important decisions. They helped shape these decisions and could make sure that risk considerations would be taken into account. In contrast, in Anglo Bank, risk management was divided between a group more focused on formal measures and a group more focused on intuition and interpersonal relationships. The group more focused on formal measures became dominant, but the risk management function failed in that it had no influence on the main decisions of the bank. Importantly, employing the formal measures of the role of risk management used in the literature discussed earlier, it is not clear that these two banks could be distinguished, yet risk management played a fundamentally distinct role in the two. This indicates that new measures for the role of risk management are needed.
If everyone in an organization is focused on ensuring that the institution takes risks that increase firm value and not

FRBNY Economic Policy Review / August 2016 55
risks that decrease it, risk management becomes a resource in making this goal possible. Lines of business cannot know by themselves the extent to which the risks they take increase firm value because the amount of risk the bank can take at a given point in time depends on other risks taken by other lines of business. Hence, risk management has to bring to these risk-taking decisions the perspective of the firm as a whole to make sure that the firm itself does not have a suboptimal amount of risk. By bringing in this perspective, risk managers face potential conflicts with managers who are concerned about their unit only. Hence, for risk management to work well, it has to be that executives within the firm have reasons to care about the firm as a whole. This outcome requires incentives that reward executives if they create value for the firm as a whole and makes them bear adverse consequences from taking risks that destroy value.
Setting correct incentives for risk taking is complex. However, as Rajan (2006) discusses, poor incentives can impose large costs, both on shareholders and on society at large. Many banks have developed a bank-wide mechanism that can properly assess the cost of taking specific risks. Such a mechanism is called risk capital (see, for example, Matten [2000]). For a bank, risk capital is the amount of capital the bank requires to support the risks it takes so that, as a whole, its level of risk meets its risk appetite. As a unit of the bank takes a risk, the bank can keep its aggregate level of risk by acquiring more equity capital to support its risk taking.
If a bank does not force executives to
take into account the cost of their risk
taking for the bank as a whole, all of the
burden of limiting risk will be borne by
risk management.
This greater equity capital has a cost and this cost should be taken into account when evaluating the risk. Taking this equity capital cost into account may mean that it is no longer worthwhile to take the risk. If a bank does not force executives to take into account the cost of their risk taking for the bank as a whole, all of the burden of limiting risk will be borne by risk management. Such an approach is problematic for two reasons. First, it means that risk limits end up running the lines of business because the lines of business have no reason to internalize the cost of risk. Second, when risk is managed mostly through limits, the risk capacity of the bank is used less efficiently—risk-bearing capacity becomes allocated more through rationing than through the price mechanism.
Incentives should be set right, but incentives have limits. It is not possible to set up an incentive plan so precisely cali-brated that it leads executives to take the right actions in every situation. Executives have to deal with situations that nobody thought possible. Employment contracts are by their very nature incomplete. A further issue is that not all risks can be quantified or defined. When a bank focuses on specific risks that it quantifies and can account for in employee reviews and incentive plans, there is an incentive for employees to take risks that are not quantified and monitored.
Because of the limits of risk management and incentives, the ability of a firm to manage risk properly depends on its corporate culture as well. There is a large organizational behavior literature on corporate culture and a smaller economics literature on the topic (for a recent review, see Bouwman [2013]). An often-used definition of corporate culture from the organizational behavior literature is that an organization’s culture is “a system of shared values (that define what is important) and norms that define appropriate attitudes and behaviors for organizational members (how to feel and behave)” (O’Reilly and Chatman 1996). An important aspect of corporate culture is that it is the result of learning over time. This aspect of culture is emphasized by the follow-ing definition: “Culture is what a group learns over a period of time as that group solves its problems of survival in an external environment and its problems of internal integration” (Schein 1990). As a result, a culture is hard to change. It also has to be transmitted to new hires and it may leave with key employees. Hence, a firm’s culture is not permanent.
Within the economics literature, culture is a mechanism that makes the corporation more efficient because it simplifies communication and facilitates decisions. From this perspec-tive, having a strong culture has important fixed costs but it decreases marginal cost (Hermalin 2001). The organizational behavior literature is more focused on characterizing a firm’s culture, so it has various typologies of corporate cultures. With the organizational behavior approach, different orga-nizations have different cultures and an organization may not necessarily have the culture that maximizes shareholder wealth or ensures the success of the organization. For instance, Cartwright and Cooper (1993) distinguish between a role- oriented culture which is very bureaucratic and centralized; a task/achievement-oriented culture, which emphasizes teamwork and execution; a power-oriented culture, which is highly centralized and focuses on respect of authority; and a person/support-oriented culture, which is egalitarian and nurtures personal growth.
Limited empirical work exists on the relationship between culture and corporate outcomes, in part because it is difficult to measure the dimensions of culture. As one author put it

56 Risk Management, Governance, Culture, and Risk Taking in Banks
more than twenty years ago, “Organizational culture is a complex phenomenon, and we should not rush to measure things until we understand better what we are measuring” (Schein 1990). Two recent studies have used data from surveys of employees on how attractive their companies are as a place
Firms in the financial industry differ
from other firms in the extent to which
employees typically make decisions
regarding risk.
of work. Guiso, Sapienza, and Zingales (2015) show that com-panies whose managers are viewed as trustworthy and ethical have higher valuations and higher profitability. Popadak (2013) finds that improvements in shareholder governance change a firm’s culture, in that the firm becomes more results-oriented but less customer-oriented, and employee integrity falls. In that study, shareholders gain initially from the better governance, but these gains are partly offset over time because of the change in culture.
The literature on culture does not focus on risk taking or, for that matter, on the issues that are unique to the financial industry. An exception is Fahlenbrach, Prilmeier, and Stulz (2012). The authors do not use a direct measure of culture. Instead, they show that latent characteristics of banks, which could be explained by culture, are helpful to understanding how crises affect banks. Specifically, they show that a bank’s performance in the crisis of 1998 helps predict its performance in the recent crisis. This effect is of the same magnitude as bank leverage in helping to understand bank performance.
Firms in the financial industry differ from other firms in the extent to which employees typically make decisions regarding risk. A loan officer who can decide whether a loan is granted makes a decision to take a risk. She may have information about that risk that nobody else in the organization has. No one may ever know whether the decision was right from the perspective of the firm, for a number of reasons. First, it may not be possible for the loan officer to credibly communicate the information that she has. Second, the loan officer may have incentives to grant loans that she knows should not be granted. Third, loan outcomes are of limited use since expected defaults are not zero. A solution for the bank is to minimize the discretion of the loan officer by relying on statistical
models for the decision. However, such a solution can be costly because it reduces flexibility and eliminates the use of soft information that can be valuable. A bank’s culture can constrain loan officer discretion in a way that leads to better outcomes for the bank. A bank with an underwriting culture that is highly focused on the interests of the bank will make it harder for a loan officer to deviate from the social norms within the bank because employees who are in contact with the loan officer might be able to assess that the officer is deviating from the bank’s norms and the extent to which she is doing so in a way that neither risk managers nor executives could.
Another example where corporate culture can make risk management more effective is with respect to acceptable inter-actions with risk managers. If the social norm is for traders to be confrontational when questioned, it is much harder for risk managers to correctly assess the risk of positions and how to mitigate this risk. In this case, the risk managers’ energies have to be devoted to fighting with traders and figuring out what they might be hiding.
A final example involves how employees use information about risk that they discover through routine interactions. Consider a situation in which an executive observes a trader on a desk that the executive is not responsible for take a position that cannot be expected to be profitable for the firm but might be very valuable to the trader if it pays off. For some reason, the trader’s own supervisor either does not understand the position or does not care. The position breaches no limits, so risk management has not investigated it. Depending on the firm’s culture, the executive could act very differently. In some firms, he would say nothing. In other firms, he would start a dialogue with the supervisor or the trader. In the latter firms, one would expect risk taking to be more likely to increase value since risk taking that destroys firm value is less likely to take place.
As far as I know, only Sorensen (2002) has examined the implications of corporate culture for risk outcomes. Sorensen predicts that a strong culture, by which he means strong agreement within a firm on shared values and norms, leads to more consistency. In other words, culture is a control mechanism. With a stronger control mechanism, there should be less variability in outcomes. His study exam-ines the volatility of unexpected performance on measures of culture strength. He finds a strong negative relationship between the volatility of unexpected performance and culture strength. Unfortunately, his sample includes no firms from the financial industry.

FRBNY Economic Policy Review / August 2016 57
7. Conclusion
The success of banks and the health of the financial system depend critically on how banks take risks. A bank’s ability to measure and manage risks creates value for shareholders. There is no simple recipe that enables a bank to measure and manage risks better. For risk taking to maximize shareholder wealth, a bank has to have the right risk management, but
also the right governance, the right incentives, and the right culture. A risk management structure that is optimal for one bank may be suboptimal for another. Ultimately, the success of risk management in performing its functions depends on the corporate environment and on risk management’s ability to shape that environment. However, while better risk man-agement should lead to better risk taking, there is no reason for a bank with good risk management to have low risk.

58 Risk Management, Governance, Culture, and Risk Taking in Banks
References
Aebi, V., G. Sabato, and M. Schmid. 2012. “Risk Management, Corpo-rate Governance, and Bank Performance in the Financial Crisis.” Journal of Banking and Finance 36: 3213-26.
Anginer, D., A. Demirguc-Kunt, H. Huizinga, and K. Ma. 2013. “How Does Corporate Governance Affect Bank Capitalization Strate-gies?” World Bank Policy Research Working Paper no. 6636.
———. 2014. “Corporate Governance and Bank Insolvency Risk: International Evidence.” CentER Discussion Papers, no. 2014-53, Tilburg University.
Beltratti, A., and R. M. Stulz. 2012. “The Credit Crisis around the Globe: Why Did Some Banks Perform Better?” Journal of Financial Economics 105: 1-17.
Berg, T. 2014. “Playing the Devil’s Advocate: The Causal Effect of Risk Management on Loan Quality.” Bonn University working paper.
Bouwman, C. H. S. 2013. “The Role of Corporate Culture in Mergers and Acquisitions.” In E. Perrault, ed., Mergers and Acquisitions: Practices, Performance and Perspectives. Hauppauge, New York: NOVA Science Publishers.
Boyson, N., Fahlenbrach, R., and Stulz, R. 2014. “Why Do Banks Practice Regulatory Arbitrage? Evidence from Usage of Trust Preferred Securities.” NBER Working Paper no. 19984, March.
Cartwright, S., and C. L. Cooper. 1993. “The Role of Culture Com-patibility in Successful Organizational Marriage.” Academy of Management Executive 7: 57-70.
Cheng, I.-H., H. Hong, and J. Scheinkman. 2010. “Yesterday’s Heroes: Compensation and Creative Risk-Taking.” NBER Working Paper no. 16176, July.
Christoffersen, P. 2011. Elements of Financial Risk Management. San Diego: Academic Press.
DeAngelo, H., and R. M. Stulz. 2015. “Liquid-Claim Production, Risk Management, and Capital Structure: Why High Leverage is Optimal for Banks.” Journal of Financial Economics 116, no. 2 (May): 219-36.
De Haan, J., and R. Vlahu. 2013. “Corporate Governance of Banks: A Survey.” De Nederlandsche Bank working paper no. 386, July.
Duffie, D. 2010. “The Failure Mechanics of Dealer Banks.” Journal of Economic Perspectives 24, no. 1 (Winter): 51-72.
Ellul, A., and V. Yerramilli. 2013. “Stronger Risk Controls, Lower Risk: Evidence from U.S. Bank Holding Companies.” Journal of Finance 68, no. 5 (October): 1757-1803.
Erkens, D., M. Hung, and P. Matos. 2012. “Corporate Governance in the 2007-2008 Financial Crisis: Evidence from Financial Insti-tutions Worldwide.” Journal of Corporate Finance 18, no. 2 (April): 389-411.
Fahlenbrach, R., R. Prilmeier, and R. M. Stulz. 2012. “This Time Is the Same: Using Bank Performance in 1998 to Explain Bank Performance during the Recent Financial Crisis.” Journal of Finance 67, no. 6 (December): 2139-85.
Fahlenbrach, R., and R. M. Stulz. 2011. “Bank CEO Incentives and the Credit Crisis.” Journal of Financial Economics 99, no. 1 (January): 11–26.
Ferreira, D., D. Kershaw, T. Kirchmaier, and E-P Schuster. 2013. “Shareholder Empowerment and Bank Bailouts.” European Corporate Governance Institute (ECGI) finance working paper no. 345/2013.
Hall, M., A. Mikes, and Y. Millo. 2013. “How Do Risk Managers become Influential? A Field Study in Two Financial Institutions.” Harvard Business School working paper no. 11-068, October.
Greenbaum, S. I. 2014. “Tail Risk Perspectives.” Unpublished paper, Washington University in St. Louis, Olin Business School.
Guiso, L., P. Sapienza, and L. Zingales. 2015. “The Value of Corporate Culture.” Journal of Financial Economics 117, no. 1 (July): 60-76.
Hermalin, B. E. 2001. “Corporate Culture and Economic Theory.” In C. L. Cooper, S. Cartwright, and P. C. Earley, eds., Inter-national Handbook of Organizational Culture and Climate. New York: Wiley.
Kaplan, R. S., and A. Mikes. 2012. “Managing Risks: A New Frame-work.” Harvard Business Review 90, no. 6 (June): 48-60.
Kashyap, A. K. 2010. “Lessons from the Financial Crisis for Risk Management.” Paper prepared for the Financial Crisis Inquiry Commission.

FRBNY Economic Policy Review / August 2016 59
References (Continued)
The views expressed are those of the author and do not necessarily reflect the position of the Federal Reserve Bank of New York or the Federal Reserve System. The Federal Reserve Bank of New York provides no warranty, express or implied, as to the accuracy, timeliness, completeness, merchantability, or fitness for any particular purpose of any information contained in documents produced and provided by the Federal Reserve Bank of New York in any form or manner whatsoever.
The views expressed are those of the author and do not necessarily reflect the position of the Federal Reserve Bank of New York or the Federal Reserve System. The Federal Reserve Bank of New York provides no warranty, express or implied, as to the accuracy, timeliness, completeness, merchantability, or fitness for any particular purpose of any information contained in documents produced and provided by the Federal Reserve Bank of New York in any form or manner whatsoever.
Keys, B. J., T. Mukherjee, A. Seru, and V. Vig. 2009. “Financial Regulation and Securitization: Evidence from Subprime Loans.” Journal of Monetary Economics 56, no. 5 (July): 700-20.
Laeven, L., and R. Levine. 2009. “Bank Governance, Regulation, and Risk Taking.” Journal of Financial Economics 93, no. 2 (August): 259-75.
Landier, A., D. Sraer, and D. Thesmar. 2009. “Financial Risk Manage-ment: When Does Independence Fail?” American Economic Review 99, no. 2 (May): 454-8.
Lingel, A., and E. Sheedy. 2012. “The Influence of Risk Governance on Risk Outcomes—International Evidence.” Unpublished paper, Macquarie University.
Litterman, R. 1996. “Hot Spots™ and Hedges.” Journal of Portfo-lio Management, Special Issue (December): 52-75.
Matten, C. 2000. Managing Bank Capital: Capital Allocation and Performance Measurement, 2nd ed. New York: Wiley.
Mehran, H., and L. Mollineaux. 2012. “Corporate Governance of Financial Institutions.” Federal Reserve Bank of New York Staff Reports, no. 539, January.
Mehran, H., A. Morrison, and J. Shapiro. 2011. “Corporate Governance and Banks: What Have We Learned from the Financial Crisis?” Federal Reserve Bank of New York Staff Reports, no. 502, June.
Mikes, A., M. Hall, and Y. Millo. 2013. “How Experts Gain Influence.” Harvard Business Review 91, nos. 7-8 (July-August): 70-4.
Minton, B., J. Taillard, and R. Williamson. 2014. “Financial Expertise of the Board, Risk Taking, and Performance: Evidence from Bank Holding Companies.” Journal of Financial and Quantita-tive Analysis 49, no. 2 (April): 351-80.
Nocco, B., and R. M. Stulz. 2006. “Enterprise Risk Management: Theory and Practice.” Journal of Applied Corporate Finance 18, no. 4 (Fall): 8-20.
O’Reilly, C. A., and J. Chatman. 1996. “Culture as Social Control: Corporations, Cults, and Commitment.” Research in Organi-zational Behavior 18: 157-200.
Polonchek, J. A., M. B. Slovin, and M. E. Sushka. 1993. “The Value of Bank Durability: Borrowers as Bank Stakeholders.” Journal of Finance 48, no. 1 (March): 247-66.
Popadak, J. 2013. “A Corporate Culture Channel: How Increased Shareholder Governance Reduces Value.” Unpublished paper, The Wharton School.
Rajan, R. 2006. “Has Finance Made the World Riskier?” European Financial Management 12, no. 4 (September): 499–533.
Rosenberg, J. V., and T. Schuermann. 2006. “A General Approach to Integrated Risk Management with Skewed, Fat-Tailed Risks.” Journal of Financial Economics 79, no. 3 (March): 569-614.
Schein, E. H. 1990. “Organizational Culture.” American Psycholo-gist 45, no. 2 (February): 109-19.
Shleifer, A., and R. W. Vishny. 1997. “A Survey of Corporate Gover-nance.” Journal of Finance 52, no. 2 (June): 737-83.
Smith, C. W., and R. M. Stulz. 1985. “The Determinants of Firms’ Hedging Strategies.” Journal of Financial and Quantitative Analysis 20, no. 4 (December): 391-406.
Sorensen, J. B. 2002. “The Strength of Corporate Culture and the Reliability of Firm Performance.” Administrative Science Quarterly 47, no. 1 (March): 70-91.
Stulz, R. M. 2003. Risk Management and Derivatives. Mason, Ohio: South-Western Publishing.
———. 2008. “Risk Management Failures: What Are They and When Do They Happen?” Journal of Applied Corporate Finance 20, no. 4 (Fall): 39-48.
Thakor, A. 2014. “Bank Capital and Financial Stability: Economic Tradeoff or Faustian Bargain.” Annual Review of Financial Economics 6 (December): 185-223.

A prosperous and healthy banking sector is essential to the growth of the U.S. economy. The health of the banking sector, in turn, rests on a competitive and fluid labor market, espe-cially in the major financial centers. To ensure a competitive market, banks reward employees for their contribution to value creation. In banking, value creation entails risk taking. The costs of poor business decisions in banking are not fully internalized by the employee taking the risk, by the employee’s trading desk, or by the firm and its owners and creditors; poor business decisions also inflict costs on other stakeholders. This outcome holds whether decision makers act morally and judiciously or, alternatively, engage in fraud and abuse. The effect, however, is likely to be larger in the latter case, owing in part to the obfuscation of critical information that often accompanies fraudulent activities.3 Therefore, early detection of the problem may be more difficult in these instances, and the longer the delay in detection, the larger the associated destruction of value and the higher the social costs.4 The key
3 Obfuscation is likely because of the large financial stakes for the material risk takers and the fear of loss of discretion as a result of regulatory oversight.4 In crisis management, time is critical and learning about the scope of the problem is not easy (JPMorgan Chase’s London Whale, for example).
1. Introduction
Employee compensation packages at large financial firms have recently been the focus of great concern, in particular because of their possible role in the 2007-09 financial crisis.1 Especially worrisome is that, while these pay structures are crafted to create shareholder value by rewarding employees for taking risks that increase the value of the firm, they often (perhaps unintentionally) lack robust risk management features. Consequently, the prevailing pay structure before the financial crisis may have created risks to financial stability and, in the downturn, imposed costs on other stakeholders, including taxpayers and creditors.2 As a result, at no time in recent memory has the balance of risk and return in employee decision making been under greater scrutiny.
1 See Fahlenbrach and Stulz (2011) and Cheng, Hong, and Scheinkman (2015) for empirical evidence on the compensation of bank executives during a crisis. 2 Thus, one important lesson from the crisis is that a governance structure focused on enhancing value to the shareholders might be in conflict with social objectives, particularly in the presence of a safety net.
FRBNY Economic Policy Review / August 2016 61
Hamid Mehran and Joseph Tracy
Deferred Cash Compensation: Enhancing Stability in the Financial Services Industry
Hamid Mehran is an assistant vice president and Joseph Tracy an executive vice president and senior advisor to the president at the Federal Reserve Bank of New York.
[email protected] [email protected]
The authors thank Rajlakshmi De, Lance Auer, Kathy Baumler, Stein Berre, Mark Carey, LaVerne Cornwell, Andrew Danzig, William Fitzgerald, Mark Flannery, Michelle Hanlon, Beverly Hirtle, Elizabeth Kessenides, S. P. Kothari, Dina Maher, Steven Manzari, James McAndrews, Robert McDonald, Susan Mink, Kevin Murphy, Thomas Noone, Anthony Ragozino, João Santos, Audrey Schwarz, Til Schuermann, Glen Snajder, Chester Spatt, Kevin Stiroh, René Stulz, Joseph Weber, Barbara Yelcich, and David Yermack. The views expressed in this article are those of the authors and do not necessarily reflect the position of the Federal Reserve Bank of New York or the Federal Reserve System.
To view the authors' disclosure statements, visit https://www.newyorkfed.org/research/author_disclosure/ad_epr_2016_deferred-cash-comp_mehran.html.

62 Deferred Cash Compensation
issue, then, is how to design incentive schemes to motivate bank employees to increase the value of the firm and, at the same time, ensure that the employee and the firm also serve the broader public interest. A successful approach to designing these incentive schemes could take many forms. In this article, we focus on one such form: incentives based on employee compensation.
In our framework, employee compensation is designed, first, to encourage a conservative approach to risk (which we refer to here as “conservatism”) that better aligns the interests of bank employees with those of creditors and the public while still preserving incentives for creating value. Specifically, we explore incentive features associated with performance bonds—funded through the withholding of some portion of bank employees’ compensation—and their prudential application in promoting financial stability. We argue that such a deferred cash program is likely to induce conservatism because it better internalizes the costs associated with risk
taking. In this way, deferred cash complements both the bank’s internal risk management and public enforcement.
Further, we argue that deferred cash is likely to reduce the free-rider problem because, unlike stock or stock options, deferred cash has no upside potential to gain in value. This effect will, in turn, improve internal monitoring in cases of fraud, abuse, or excessive risk taking because such actions by one or more employees will now potentially have an adverse effect on the welfare of other employees. If a culture of inter-nal information production and sharing exists within the firm, then internal monitoring is akin to a risk control scheme. Therefore, a second motivation for implementing a judicious deferred pay policy is that it is likely to make the firm less risky by promoting information production and sharing.
Third, we argue that aggregation of deferred pay for mate-rial risk takers, over many years, can build a liquidity buffer that could be used to help cover any unexpected capital or liquidity shortfall in the event the firm comes under stress.5
5 This idea is in the spirit of contingent capital: an exchange of one claim for another claim by stockholders or employees when the firm is in poor financial condition. A stock dividend (as a substitute for cash) is the oldest known type of contingent capital. The failure to pay cash dividends depresses prices, just
Losses could occur as a result of market factors or manage-ment’s or employees’ poor decisions, as well as abuse and fraud.6 In extreme adverse cases, the buffer could also help to support regulatory capital and liquidity plans. (In fact, there is evidence that firms with a higher share of deferred pay have lower costs of debt and a higher credit rating.) The difference is that bank employees, as opposed to stockholders, contribute to the buildup of this buffer.7
As mentioned, one specific form of deferred cash com-pensation is the performance bond.8 With a performance bond, the deferred cash is at risk not only because the firm is experiencing financial stress but also because of possible legal violations. For example, a trader may be implicated in fraudulent activities that lead to fines against the firm. These fines can be paid out of the employee’s deferred cash account as well as the accounts of others involved in the related activity, their supervisors, and the firm’s senior management. This arrangement is in contrast to the current framework, in which the fines are paid by the firm’s equity holders. The deferred cash compensation functions as a performance bond because the employee is essentially posting a financial bond to ensure future performance to standards. If the performance meets standards, the bond is repaid; otherwise, some or all of the bond is forfeited.9
Footnote 5 (continued) like the failure to pay interest on a debt. Giving stocks as a substitute for wages in distressed firms is another example of contingent capital (and a concept much closer to this proposal). Paying part of bonuses in debt and converting it to equity are also part of the same general structure. Paying bonuses in equity, however, is not an example of contingent capital. Forgoing (writing off) bonus claims for the right to remain employed at the firm is, in essence, a contingent claim.6 It should be noted that deferred cash pay without liquidity creation could induce risk taking as funds are needed at the end of a deferral period. If a bank has not performed sufficiently well, it may be unable to cover the promised deferred pay. In addition, some employees may leave the firm and opt to work for a competitor.7 The terminology in the proposed approach is rather different from that of inside debt as in Wei and Yermack (2011). In their approach, management’s claim is unfunded, while, in our approach, the employees’ deferred cash is funded. In both approaches, the claims are unsecured and, consequently, the expected default risk is likely to decrease. In our approach, one could argue that the default risk will be relatively lower because the deferred cash could operate as higher equity capital.8 For a general discussion of performance bonds, see Becker and Stigler (1974) and Ritter and Taylor (1994).9 An example of a performance bond outside of banking is a security deposit on an apartment rental. If the apartment is not returned in good condition at the end of the lease, the landlord can use the security deposit to defray the expenses incurred in repairing any damage. Another example of a performance bond is a bail bond that helps ensure that the charged individual shows up in court. See, also, John W. Miller and Dan Frosch, “Coal Miners Pressed on Cleanup Costs,” Wall Street Journal, July 19, 2015.
A deferred cash program . . . better
internalizes the costs associated with
risk taking. In this way, deferred cash
complements both the bank's internal risk
management and public enforcement.

FRBNY Economic Policy Review / August 2016 63
We have outlined three motivations for expanding the use of deferred compensation in banking: its contribution to conserva-tism, its effect on internal monitoring and control, and its role in the creation of a financial buffer that can be accessed if the firm is in distress. The joint effect of these three economic incentives could be to make banks and the financial system (through inter-connectedness) safer. While it will remain an empirical challenge to measure the effect of each motivation in isolation, focusing on one motivation to the exclusion of the others would limit our recognition of the many benefits of deferred compensation for overall financial stability. For example, if we were to focus solely on the financial buffer incentive, then we might learn only whether the aggregate deferred pay by material risk takers over a few years could produce a sufficient buffer to avert the type of default or distress experienced by large firms in the last crisis. Such a narrow inquiry might be misleading because it ignores the effects of deferred pay both on employee conservatism, which may reduce the likelihood that a firm comes under stress, and on managers’ incentives to be more proactive in maintaining robust capital to protect their deferred pay. By contrast, an inquiry that takes into account the interplay of these incentives might show that a much smaller buffer might suffice.
To get a sense of the amount of deferred cash that could be generated in the banking sector, we estimate the potential buffer for three large banks created by various choices of deferral and vesting periods, as well as the deferral amount and its composition between cash and equity for 6,000 mate-rial risk takers (or managing directors) in each bank. We report these estimates for the average of the three banks. Our baseline estimate (outlined in an October 20, 2014, speech on culture by Federal Reserve Bank of New York President William Dudley)10 produces deferred cash of $17 billion and deferred equity of $3.5 billion for 2013. The resulting aggre-gate deferred cash is nontrivial. A large bank could address some financial difficulties inflicted by its own culture of risk taking with the buffer, if needed.11
10 Available at http://www.newyorkfed.org/newsevents/speeches/2014/dud141020a.html.11 An interesting question is how deferred cash accounts at Lehman Brothers may have altered the firm’s situation during the summer of 2008.
In exploring the three incentives offered by deferred com-pensation, we do not imply that the firms or their employees should not take risks to create value, only that any adverse consequence of investment choices should be internalized as much as possible. We also argue that deferred cash compen-sation is not punitive in that it does not restrict overall pay levels. Rather, it promotes longer employment in a healthy financial sector. Therefore, it may help to promote finance as a profession.
The outline of this article is as follows: Section 2 provides a very brief overview of the evolution of compensation in banking. Section 3 presents an economic discussion of the potential financial stability benefits of deferred cash and reviews the supporting evidence on the link between deferred pay and conservatism. A few practical issues with the applica-tion of deferred cash are outlined in Section 4. Calibration of compensation estimates under various scenarios is presented in Section 5. Section 6 summarizes our findings.
2. A Brief Sketch of Compensation History in U.S. Commercial and Investment Banking
Evidence on the history of compensation structures and trends in U.S. financial firms is sparse.12 This is partly because of limited disclosure13 and partly because most commercial banks were traded as over-the-counter (OTC) through the 1950s and hence were not required to file disclosures with regulators.14 Adams and Mehran (2003) report executive compensation structure and trends for the thirty-seven largest banks beginning in 1992. For example, they calculate the ratio of option grants relative to the sum of salary and bonus and compare these ratios, by year, to those of manufacturing firms in the S&P 500 index. They document that, over the period from 1992 to 1999, nonfinancial firms granted 60 percent more stock options than banks. Mehran, Morrison, and Shapiro (2012) extend this analysis to 2007 and document the trend in stock options, salary, and bonuses for bank executives for the universe of banks in
12 Roe (1994) provides an excellent review of compensation scandals around the 1907 crisis and subsequent reforms. 13 In fact, very few banks were included in Standard and Poor’s Compustat database until the early 1960s. See Adams and Mehran (2012) for more discussion of related issues.14 OTC securities were exempt from filing Securities and Exchange Commission (SEC) disclosures until the mid-1960s. The OTC markets have different requirements that were expanded over time (as more firms became SEC registrants). For a discussion of the requirements, see Bushee and Leuz (2005) and Greenstone, Oyer, and Vissing-Jorgensen (2006).
Deferred cash compensation is not punitive
. . . it does not restrict overall pay levels.
Rather, it promotes longer employment in
a healthy financial sector. Therefore, it may
help to promote finance as a profession.

64 Deferred Cash Compensation
Standard and Poor’s ExecuComp service. They report that grants of stock options increased over the period from 1992 to 2001 but that the trend reversed very quickly after 2001. In contrast, average bonuses increased over the period from 1992 to 2007, with no reversal similar to options.15
The empirical description of bank compensation, however, is not likely to uncover a direct link between top management pay policy and the financial crisis for at least two reasons.
First, we have little insight into bank pay policy for those below the very senior management level.16 Second, other structural or legal developments may have contributed to the observed changes.17 Among these developments are changes in the public’s perception of chief executive officer (CEO) compensation following a number of fraud and abuse cases by large firms in early 2000, and the passage of the Gramm-Leach-Bliley Act of 1999. The publicized enforcement cases (and the subsequent passage of the Sarbanes-Oxley Act of 2002 [SOX]) dramatically altered compensation structures and the reliance on stock options by both financial and nonfinancial firms. While for nonfinancial firms restricted stocks replaced stock options, for banks the shift was mostly from stock options to bonuses, and arguably with less trans-parency.18 To the extent that compensation structure affects investment decisions, SOX might have altered the investment choices and corporate policies of banks and nonbanks. Gramm-Leach-Bliley deregulation expanded the scope for investment decisions and, in turn, affected compensation and other bank policies.19
The deregulation of the banking sector also influenced the acquisition of investment banking firms by commercial banks. When an acquirer is unfamiliar with its target’s business lines, the target firm’s management often demands, and is granted, significant autonomy, as well as board representation.
15 See Core and Guay (2010) and Murphy (2012) for additional evidence on compensation trends in banking.16 Nearly every empirical analysis to date has examined the compensation of senior management in relation to various corporate attributes. Pay policy for midlevel managers (about 12,000 managing directors for a large U.S. bank) and its effect on risk taking have not been studied.17 In addition to these two reasons, most, if not all, of the empirical research on bank compensation focuses on average statistics of the sample. But inferences on average statistics may not provide insights into the behavior of very large banks. Also, much of the pay of bank executives is in the form of deferred equity and cash, with various vesting periods. This raises a challenge for empirical studies. For example, part of the bonuses observed in the proxies filed with the SEC may reflect different timing of awards. This might create a mismatch between bonuses observed and firm characteristics in a given year.18 A few regulatory agencies have advocated a more detailed disclosure of compensation.19 See Smith and Watts (1992) on the effect of investment policy on other corporate policies.
Thus, a higher likelihood exists that the target’s culture will spill over to the acquirer’s culture. In the acquisition process post-Graham-Leach-Bliley, the culture of the investment banks was transferred to the culture of the commercial banks. Prior to deregulation, the compensation and human resources practices of investment banking groups were quite distinct from the policies of the acquiring commercial banks. Over time post-acquisition, the reward structures of the investment banking targets influenced the entire entity.
Yet, some safeguards or risk management tools used (explicitly or implicitly) in investment banking practice did not migrate. For example, investment banks, even those that were public, retained to a degree the risk culture of a partnership. When a partnership is in financial need, the partners supply the necessary capital, if available. In one well-known case, in 1929 Goldman Sachs was almost brought down by a manager-partner, Waddill Catchings. Catchings created what was known as the Goldman Sachs Trading Corporation, essentially a trust that used debt to buy companies that had themselves used debt to buy other companies. When the crash came, the Goldman Sachs part-ners agreed among themselves to place about half of the partnership’s capital of $20 million in the venture to avoid its potential failure.20 Goldman Sachs Trading Corporation
was a “big” risk, but one whose adverse consequences were largely borne by the manager-partners. From a policy perspective, this example is of interest because of the extent to which Goldman’s problems, if not addressed, might have jeopardized the welfare of the broader financial system.
This example is not to imply that partnerships do not fail but to make the point that a culture transferred without the mechanisms that contributed to its stability and per-sistence could become dysfunctional in a new environment. Deferred cash bonuses function in much the same way as partnership capital in that the risk takers are required to set aside a fraction of their bonuses every year to manage the bank’s need for capital in times of crisis.
20 See Endlich (1999, 45).
Deferred cash bonuses function [like]
partnership capital in that the risk takers
are required to set aside a fraction of their
bonuses every year to manage the bank's
need for capital in times of crisis.

FRBNY Economic Policy Review / August 2016 65
Why should bankers embrace the concept of deferred cash in a world of no bailouts?21 The reason is that the private costs to bankers associated with their bank’s failure are extremely high (Lehman Brothers, for example).22 In the traditional corporate finance model of a levered firm and the valuation of corporate securities, stockholders have an option on the underlying assets of the firm. If the value of the firm is less than the promised payment to creditors at the option’s matu-rity, the assets are passed to the creditors and the option is not exercised (Merton 1974). This framework may have impli-cations for bankers, because bankers provide large human capital investments to the firm. In addition, the firm’s future prospects depend on the continued effective deployment of this human capital. In this setting, employees’ deferred cash is analogous to an option premium. At the exercise—that is,
in a time of crisis—employees forgo their deferred cash but increase the likelihood that their employment at the firm will continue and that they will earn a return on their human capital. Further, they avoid the damage to their earnings capacity that would arise from loss of reputation, as well as other costs. Thus, in an uncertain world, one interpretation is that deferred cash is the capital needed by the firm and supplied by employees (just as in the example of Goldman) to preserve the employees’ option to remain with their employer.
Deferred cash compensation can also be viewed as insurance. Just as with any insurance, size (the buffer) is important. In this case, the deferred cash payments are like insurance premiums. If the firm performs well over the vesting period, the insurance premiums are rebated. However, if the firm becomes financially stressed, the premiums are forgone. Unlike traditional insurance, which can increase the likelihood of a bad outcome by persuading the insured parties that they are protected against it, deferred cash compensation unambiguously reduces the likelihood of a bad outcome.
21 One bank, UBS, has already adopted deferred pay for its risk takers. See Compensation Report 2014 of UBS Group AG.22 It should be noted that the private costs to all financial firms of restructuring, including labor relocation and termination, arguably might have been larger in the absence of intervention.
However, the degree of protection that this form of insurance provides against a bank’s experiencing distress depends on the extent to which management and senior risk takers participate in the insurance program. If every bank takes part in these deferred cash programs, then in the event of a crisis, not only is the likelihood of financial stress for any participating firm reduced, but also the damage to the banking sector as a whole is likely to be much smaller. Buying insurance is not a perfect remedy in most cases, but it can dampen the adverse outcome. Thus, in a world of no bailouts, deferred cash compensation might be a valuable option for bank employees.
Finally, an important point to underscore is that promoting deferred cash policy as a risk management tool in a complex financial industry and an uncertain world depends on the availability of supporting evidence (or the lack thereof) on the contribution of compensation to financial crises.
3. How Could Deferred Cash Contribute to Financial Stability?
In this section, we discuss in detail the three mechanisms by which a deferred cash compensation program could help to control risk taking by internalizing the costs and benefits of risk. We also review the supporting evidence on the link between deferred pay and risk taking.
3.1 Economic Benefits of Deferred Cash
Deferred cash induces conservatism. Payment in the form of fixed claims, such as deferred cash, alters employee incentives, making employees more likely to act like debt holders. And because deferred cash payments have a lower priority than the claims of other creditors, bank employees would be more inclined to undertake corporate policies that lower the firm’s default risk (Jensen and Meckling 1976) in order to protect the value of their fixed claims. Such policies include investing in safer projects, reducing the firm’s leverage, economizing on payouts, and engaging in diversification activities.23 It should be noted that a proper balance is needed between deferred equity and deferred cash. If the balance is tilted too far in either direction, employees may take too
23 There is a wide range of evidence supporting the link between pay and corporate policies. For a summary of the evidence, see, for example, Murphy (1999) and Frydman and Jenter (2010).
Deferred cash . . . can also be viewed as
insurance. . . If the firm performs well over
the vesting period, the insurance premiums
are rebated. However, if the firm becomes
financially stressed, the premium is forgone.

66 Deferred Cash Compensation
little risk (although more so with deferred equity),24 which would result in an undesirable transfer of value from equity holders to creditors.25
Deferred cash improves internal monitoring. Granting deferred cash to employees has the potential to mitigate the free-rider problem associated with compensation in the form of stock or stock options. This free-rider problem arises because of the potential for gains on deferred equity that depend on firm achievement rather than individual performance. With the introduction of deferred cash bonuses, the asymmetric behavior associated with equity compensation is likely to be reduced, in that the cost of excessive risk taking and poor decisions by an individual or an entity (a trading group, for example) will adversely impact a broader set of employees.26 Since the deferred cash has debt-like features with no potential for gain, each participant in the deferred cash program is, in effect, a lender to the firm. Further, like any other lender, participants are likely to exert effort to protect their claims. Thus, deferred cash compensa-tion is likely to encourage monitoring among the firm’s risk takers (who are likely to be more sophisticated monitors than outside parties). In essence, this is the internal dynamic of partnerships, whereby incentives for risk and reward are more balanced.
The enhanced internal monitoring associated with deferred cash compensation may reduce the cost of enforcement to an individual, a group of employees, or the firm as a whole. For example, suppose that an individual observing an instance of fraud decides to disclose the wrongdoing in order to protect herself. Her action not only protects or limits the damage to the firm but it is also likely to protect the offender (or offenders) from a “slippery slope” dynamic whereby attempts to cover up a problem make the initial situation even worse. Further, an employee’s disclosure to the firm of information about the wrongdoing of another employee increases the
24 Morrison and Wilhelm (2004) argue that the holding of long-deferred equity by firm employees produces partnership characteristics. 25 See William Dudley’s 2013 speech “Ending Too Big to Fail,” in which he argues that deferred compensation could complement the Comprehensive Capital Analysis and Review (CCAR) to enhance financial stability. He states that restructuring compensation plans in financial firms could “strengthen senior bank managers’ incentives to proactively manage risk. For example, imagine how incentives would change if a significant portion of senior bank management’s compensation each year were deferred to be available to cover future capital losses.”26 Different employees have different degrees of discretion to enhance or harm the value of equity (or deferred equity). Further, they might have a different assessment of its future valuation. This kind of heterogeneity is likely to produce an impediment to monitoring, since determining what constitutes an action that damages the equity value becomes rather complex. For example, different employees may have different perceptions of excessive risk taking and its impact on equity value. They might agree more about its impact on deferred cash. Therefore, deferred cash is likely to produce a consensus among employees on how to preserve its value.
cost of covering up by those who were expected to take action based on the information disclosed to them, thereby providing an incentive to those employees to take action promptly. Therefore, the deferred pay scheme better aligns the employee’s and the firm’s interests with those of the public. If this approach is applied successfully—that is, if the firm acknowledges employee disclosures—it is likely to produce earlier disclosure to authorities, which, in turn, may lead to reduced regulatory punishment or enforcement costs.27
Deferred cash inventory can be used to offset financial losses. Employees’ claims on the firm in the form of deferred cash can be an important resource for risk management. In a severe downturn, employees forgo their (contractually agreed) accu-mulated deferred cash to support the firm’s operation, and the firm writes off the employee liability and can use the cash. (This typically occurs at a time when new equity capital would be relatively expensive.) As a result, the firm exhibits many of the attributes of a partnership, particularly in that material risk takers and senior management contribute capital to the firm to ensure its survival.
A deferred cash compensation program accumulates bal-ances during good years, thus acting like a built-in stabilizer. By design, the scheme allocates more funds to the buffer when a firm’s earnings, and thus bonuses, are high. And if the firm is doing poorly and the buffer is used, then the fraction of the deferral amount and vesting schedule may be changed temporarily to help rebuild an adequate buffer. This setup is similar to that of a capital conservation buffer, whereby a div-idend cut may be necessary to build up the regulatory buffer if capital has been diverted to bank operations owing to an unexpected reversal.
While deferred cash is not part of regulatory capital, it can mitigate the potential moral hazard consequences of higher required capital: namely, that bank management may take bigger risks. With higher capital requirements, the fact that bank insiders will be using the resources of outside
27 Early disclosure arguably benefits the firm and the public in the long run. The key point is to align the bank employees’ incentives with those of the stakeholders as a group. Two examples might be instructive. In a case where lack of disclosure hurt the firm, Germany’s Federal Financial Supervisory Authority (BaFin) criticized Deutsche Bank’s management “for negligent oversight and selective or inaccurate disclosures to regulators who were investigating market manipulation” (see David Enrich, Jenny Strasburg, and Eyk Henning, “Deutsche Bank Hit in Sharp Critique,” Wall Street Journal, July 17, 2015). An example of self-reporting that was helpful to a firm is the case of Garth Peterson at Morgan Stanley. Peterson was an employee who had a number of improper dealings with Chinese government officials. Morgan Stanley received a public declination (in other words, a decision by the Justice Department not to sue) as a result of its self-reporting and extraordinary cooperation during the investigation. For the full story, see http://www .davispolk.com/Morgan-Stanleys-FCPA-Declination-and-the-Benefit-of -Effective-Compliance-10-09-2012/.

FRBNY Economic Policy Review / August 2016 67
claimholders may give them additional incentives for risk taking. However, they are less likely to take larger risks when their own resources are also at stake—in other words, when they hold unvested deferred cash.
To summarize, the debt-like feature of deferred cash should lead to safer and more independent banks. With the intro-duction of deferred cash, a firm better internalizes the costs and benefits of risk taking and, at the same time, decreases its dependency on outside parties for financing its capital. This reduced dependency is particularly relevant in a downturn, when banks need equity capital and investors are reluctant to supply that capital. Instead, the bank can write off the liability to its employees and deploy deferred cash in its operation. As a result, the approach may motivate the firm and its risk takers to build up a large cushion above the minimum regulatory buffer in order to avoid any potential write-offs, or to become more proactive in acquiring capital (internally or externally). In fact, a firm’s risk takers may opt to cut dividends and impose a cost on stockholders rather than risk their own money.
3.2 Evidence
Recent research suggests that deferred debt-like compensation reduces incentives for risk taking and risk shifting (Bebchuk and Spamann 2010; Edmans and Liu 2011; Mehran 2010; and Sundaram and Yermack 2007).28 For example, Sundaram and Yermack find that when managers hold large inside debt positions (that is, compensation at risk in the event of default), the expected probability of the firm defaulting on its external debt is reduced. This is consistent with the hypothesis that these managers operate the firm conservatively to protect their deferred compensation. Similarly, Wei and Yermack (2011) construct a CEO’s “relative incentive ratio,” which estimates how a unit increase in the value of the firm raises the value of the CEO’s inside debt versus inside equity claims. They document that, following the disclosure of pensions and deferred pay in proxy statements filed with the Securities and Exchange Commission (SEC) in 2006 and 2007, firms in which CEOs had larger pensions and deferred pay in their compensation packages exhibited lower credit spreads and higher bond prices. The intuition is that in the event of default, top executives’ claims have a lower priority relative to creditors’ claims, or at least relative to secured
28 See, also, the report by the Squam Lake Group (2013). In addition, other approaches to induce conservatism have been suggested in the literature. For example, Bolton, Mehran, and Shapiro (2015) propose tying compensation to a bank’s credit default swap (CDS) spread.
creditors’ claims. Consequently, top executives are more likely to pursue policies that preserve the value of their claims—for example, by investing in less risky assets or engaging in better risk management. Although many of the actions and decisions of executives are unobservable, Wei and Yermack find that credit markets consider their holdings and price the firms’ credit accordingly. Similarly, Anantharaman, Fang, and Gong (2014), using a large sample of firms with private loans over the period 2006-08, document that firms with a higher ratio of CEO inside debt, measured by the ratio of the CEO’s pensions and deferred pay to his or her equity-based compensation, have lower credit spreads.
The empirical evidence on deferred debt compensation for banking firms provides support for the existence of
conservatism similar to that documented for nonfinancial firms. For example, Bennett, Güntay, and Unal (2015) find that a higher incidence of inside debt relative to inside equity in a CEO compensation package was associated with lower default risk and better performance of banking firms during the crisis period. Further, the authors show that bank internal examination CAMELS ratings29 (and, specifically, capital, management, earnings, and sensitivity to market risk ratings) are related to CEOs’ inside debt compensation proxied by their pensions and deferred pay. Also, Van Bekkum (2014) documents that banks with a higher ratio of CEO inside debt in 2006 experienced lower equity vol-atility and lower tail and default risk over the period 2007-09.
It should be noted that empirical work to date focuses mostly on the pensions of top management (and some deferred pay) as a proxy for debt-like compensation. There is no study of the effects on corporate policies of deferred bonuses of top management or broad-based deferred bonuses (the approach outlined in this article). Further, in banks where the CEO inside debt ratio (as in Sundaram and Yermack [2007]) is far smaller than the bank debt-to-assets
29 The acronym “CAMELS” refers to the components of a bank’s condition that are assessed by banking supervisors: capital adequacy, asset quality, management, earnings, liquidity, and sensitivity to market risk.
While deferred cash is not part of
regulatory capital, it can mitigate the
potential moral hazard consequences of
higher required capital: namely, that bank
management may take bigger risks.
68 Deferred Cash Compensation
ratio, a deferred bonus plan is likely to be more potent than pension plans in inducing conservatism because a few good years produce bonuses that are, in the aggregate, larger than pensions.
4. Practical Issues
Below, we address a few matters critical to the concept of deferred cash compensation.
4.1 Factors Influencing the Size of the Deferred Cash Buffer
The accumulated size of the deferred cash buffer is positively related to the percentage of deferred cash bonuses, the length of the deferral and vesting periods, and the number of employees (risk takers) covered by the plan. In addition, as noted earlier, the size of the buffer will grow when the economy, and presumably the firm, is prospering. The deferral amount could be larger and vesting schedules could be longer for more senior bank employees. Further, effective use of a deferral policy, amount, and vesting schedule as a risk management instrument requires design flexibility for different states of nature. That is, as noted earlier, the firm should have the ability (based on contractual agreements) to alter the deferral amounts and vesting schedules.
4.2 How Much Deferred Cash Is Prudent?30
As outlined earlier, there are three primary motivations for using deferred cash: to induce conservatism, to promote internal monitoring, and to build a buffer as insurance against unexpected distress. Further, the fund could be designed to partially, if not totally, cover any fines imposed on the firm stemming from abuse or fraud by its employees.31 In order to induce conservatism or internal monitoring, the deferral amount at the individual level should not be small.
30 To better answer this question, one needs to get a sense of the employee’s conservativeness. That requires information on the employee’s degree of risk aversion, income, total wealth, and hedging choices, if any. Simulations based on these characteristics could then be used to better understand the optimal mix between deferred cash and deferred equity. 31 Many of the post-crisis settlements provide examples of fines that could potentially have been covered by employees.
Determining how much cash should be deferred to produce a buffer to cover a large loss, however, is a much harder question. Acharya, Mehran, and Sundaram (2016) produce a simple framework to determine the amount of cash holdings a bank needs in order to stay above its minimum regulatory capital ratios in stressed times. Specifically, they look at historical debt levels and estimate the marginal expected shortfalls of the market value of common equity to compute the required deferred cash-to-equity ratio for a given bank. Using historical data for the largest banks in the United States, they document that the ideal minimum cash holding is approximately 20 percent of equity value.
4.3 Timing of the Deferred Cash Trigger
Deferred cash can be triggered with the imposition of fines or prior to or at the time of a default. For example, employee deferred cash could be written off when the bank is near a violation of its minimum capital. In a sense, the firm is forced to use its employees’ contingent claim to help it recapitalize (in the spirit of partnerships). A trigger based on the firm’s status as an “ongoing” concern is appealing because, to all of its claimholders, a firm is more valuable alive than dead. A later trigger is less likely to mitigate fears, given the speed of deterioration in the final stages of a bank’s demise.32
4.4 Deferred Cash Versus Deferred Equity
A key feature of deferred cash is that it induces conservatism. Deferred equity may also produce conservatism if the vesting period is very long, such as the length of employees’ working horizons. A very long horizon, however, seems impractical. In addition, holding a claim on a large amount of deferred equity may increase the incentive for risk taking, unlike deferred cash, which has no potential for gain. Moreover, the operation of a deferred equity program is highly dependent on two corporate policies: ongoing bank stock issuances and ongoing stock repurchases (to avoid dilution). These activities can reduce the effectiveness of a deferred equity program in bank risk management owing to the timing of
32 If the deferred cash is in the form of bail-in-able debt, then the risk takers’ debt can be converted into equity at default. In such a setting, the deferred cash has the potential to align the interests of the current employee risk takers with those of future shareholders at default, which is a plus. However, there are other perverse effects as well, which will need further thought.

FRBNY Economic Policy Review / August 2016 69
repurchases and issuances relative to vesting schedules, particularly if all risk takers are covered by the deferred equity plan. Deferred cash programs are independent of other corporate policies, including equity issuances and repurchases, and they are subject to less potential manipulation by insiders.33 Finally, deferred cash is likely to reduce the debt overhang problem more than deferred equity.34 Risk takers fearing big losses of personal wealth are more likely to maintain adequate capital or raise capital ex ante, and the bank is still more likely to be able to raise capital even after using its employees’ resources than it would be if it did not use a deferred cash program, since the use of deferred cash could lower the debt over- hang problem.35
4.5 Deferral and Vesting Periods and Labor Mobility
A concern with the long deferral and vesting period for the cash component of deferred compensation is that it might create a friction for workers moving between firms and thus promote inefficient allocation of the labor force.36 While it
33 Market timing is a key factor in any corporate decision, particularly in repurchases and issuances. As outlined earlier, the operation of a deferred equity program, for the most part, is in conjunction with the two policies above. This may raise two potential problems. First, a deferred equity program lends itself to market manipulation and timing of disclosure. Consider a case where insiders have private information about bad news not available to outsiders, including supervisors. Also consider that insiders’ deferred equity will be vested in the near future. In cases like this, one or more insiders may delay the disclosure of the bad news so that they can sell their vested shares at higher prices. This problem can be mitigated by implementation of a holding period beyond vesting. To our knowledge, only top management may be subject to a holding period. While major decisions are made by management, risk takers may not share the bad news with top management if they have the right financial incentive. Deferred cash mitigates this problem. Second, there could be an adverse effect on cash conservation. The timing of repurchases versus issuances to support the operation of vested deferred equity may not be most effective in this regard. Firms issue and repurchase throughout the year for many reasons, and rarely are these operations simultaneous. Therefore, there is a possibility that they may repurchase the shares at a higher price than issuances. Thus, more cash leaves the firm. In a downturn, this is more likely, because the tendency for repurchases to stabilize prices is much higher, since issuances depress share prices further.34 Debt overhang occurs when a firm loses its ability to raise equity capital because the proceeds are more likely to benefit creditors than equity holders.35 The firm might be able to raise equity capital more easily after using its employee deferred cash if the investors are uncertain as to whether the firm will commit its employee deferred cash.36 It should be noted that the aim of our framework is not to induce retention (or promote turnover). This is clear for the case of deferred cash. While the
is common for unvested deferred equity to be forfeited if an employee leaves a firm, this should not be a feature of the deferred cash compensation. That is, the vesting and payouts should continue even if a worker has left the firm. This feature prevents the creation of a mobility friction but still maintains the incentive for workers to speak up if they see a problem. In addition, there would be little reason for a firm trying to hire away an employee to buy out the employee’s deferred cash compensation. With only short-vesting deferred equity, a worker may decide that it is better to leave a firm before a problem in her area becomes widely visible than to stay at the firm and try to correct the problem. The deferred cash compensation provides an incentive to stay and attempt to bring the problem to management’s attention. If, instead, she chooses to leave, her deferred cash compensation is still at risk.
Another concern regarding deferral and vesting periods is that senior managers might try to delay the resolution of a problem in order to continue receiving payouts from their deferred cash accounts. To avoid this behavior, once an investigation has been opened, the vesting for those implicated and their senior managers could be frozen. This will ensure that the responsible parties bear the costs of their actions regardless of how long it takes to resolve the issue. In addition, if a new senior manager is recruited into the firm to help fix a problem, the manager’s deferred cash account can be exempted from any fines that might arise owing to the earlier problems.
4.6 Labor Market Consequences
The press and academics, at times, point to the unintended consequences of potential regulatory change.37 Some may argue that a deferred compensation scheme in the banking sector might deprive the industry of highly talented individuals and that industry growth and returns may suffer as a result. This kind of issue is certainly relevant in a public policy debate. It is important to balance any costs against a potential gain in financial stability. While one could argue that the potential gains are elusive since such plans have yet to exist, we would argue
Footnote 36 (continued) effect of vesting on reducing voluntary departures has been documented in the literature (for example, Mehran and Yermack [1997]), the short deferral of equity and its vesting in our approach is not likely to interfere with bank employees’ mobility.37 See, for example, Murphy (2013) on bonus caps. However, Benabou and Tirole (2015) argue that bonus caps could restore incentives but could generate other distortions.

70 Deferred Cash Compensation
that the costs are likely to be negligible, given our experience with regulatory reforms. For example, in the banking sector, the certification of financial statements by the chief executive or chief financial officer of each firm did not start with SOX; rather, the requirement goes back to the 1991 Federal Deposit Insurance Corporation Improvement Act (FDICIA). While SOX covers listed companies, FDICIA covers banks; therefore, there are two requirements for listed banking firms. Section 36 of FDICIA requires (among other things) that banks report annually on “Management Responsibility for Financial Statements and Internal Controls” and “Internal Control Evaluation and Reporting Requirements for Independent Public Accountants.” The management responsibility report must be signed by the CEO and the chief accounting or financial officer.38 The important point to note is that there is no evidence of adverse labor market consequences resulting from the adoption of FDICIA or SOX. Arguably, there are transition costs, but changes in regulation often affect organizational tax structure and listing choices, and could motivate the firm to change its regulators (to overcome the regulatory burden), rather than result in changes in the managerial and skilled labor market.39
38 See Altamuro and Beatty (2010) for the discussion of FDICIA’s internal controls.39 See, for example, Mehran and Suher (2009) for the effect of tax changes in the banking industry on organizational tax choices. See Doidge, Karolyi, and Stulz (2015) on the effects of various regulations that affect capital markets.
4.7 Disclosure of the Sum of the Deferred Pay
Arguably, annual disclosure of the amount might help financial stability, given the banks’ many stakeholders.
5. Estimation of the Potential Size of Deferred Cash and Equity Compensation
In this section, we provide some basic conservative estimates of the potential size of deferred cash and equity under various assumptions, starting with the terms outlined in President Dudley’s October 2014 speech. We rely solely on publicly available data and provide estimates of deferred cash and equity using averaged data from the three largest U.S. banks over the period 2004-13. This horizon is chosen to capture changes in compensation expenses over the crisis period. These calculations should be viewed as illustrative.
Total compensation expenses and employment per year, averaged across the three largest banks, are reported in Columns 2 and 3 of Table 1. Figures are obtained from the FR Y-9C Consolidated Report of Condition and Income, a form that is completed on a quarterly basis by each bank holding company with at least $500 million in total assets. Annual compensation is the sum of compensation and
Table 1 Average Employee Compensation and Executive Compensation in Top Three Banks, 2004-2013
Year
Total Employee Compensation
(Billions of Dollars)
Number of Employees
Average Employee Compensation
(Thousands of Dollars)
Average Top Five Executive
Compensation (Thousands of Dollars)
Ratio of Top Five Average Compensation to Average Employee Compensation
2004 17.4 215,599 80.7 15,476 1922005 19.8 223,262 88.9 16,004 1802006 23.4 244,462 95.9 16,867 1762007 25.6 264,254 96.8 16,019 1652008 24.7 267,448 92.2 13,751 1492009 28.0 262,007 107.0 9,929 932010 29.4 268,848 109.3 9,055 83
2011 30.6 276,314 110.9 12,554 1132012 30.6 267,566 114.4 12,146 1062013 30.0 252,718 118.8 13,468 113
Sources: Federal Reserve Board, Consolidated Financial Statements of Bank Holding Companies (FR Y-9C data); Compustat.
Notes: These figures are the average of the three largest banks. Data on the number of employees and total employee compensation are from FR Y-9C reports. Executive compensation figures are from Compustat’s ExecuComp database.

FRBNY Economic Policy Review / August 2016 71
benefits.40 Column 4 uses the information in Columns 2 and 3 to produce average compensation per employee, regardless of employee rank. Two points should be noted. First, average employee compensation is rather high, reflecting the fact that there are many high-income earners in each bank. Second, there does not seem to be a dramatic post-crisis change in average employee compensation and benefits (it should be noted that the numbers are all nominal). Column 5 presents average compensation for the top five executives as reported in the proxy statements filed with the SEC. Executive compensation is the sum of salary, bonuses, and the value of grants of equity-based compensation. These are estimated using a consistent approach and reported in the S&P Compustat ExecuComp database. In Column 6, we report the ratio of the average top five compensation to the average employee compensation. The column produces two insights. First, top five compensation as a fraction of average employee compensation is declining over the period 2004-10. It should be noted that average employee pay does not seem to be getting smaller. Second, the numbers on pay disparity between top management and average employees are far smaller than those reported in the press for all S&P 500 firms.
We next provide estimates of the running totals for the deferred equity and cash program using averaged data from these three banks, assuming that the deferral programs were put into place in 2005. In order to estimate deferrals, the following assumptions are used (note that all figures are nominal):
1. Each bank has about 6,000 material risk takers (this varies across firms, given differences in lines of operation, size of the work force, and international focus).
2. Assumptions in estimating compensation for the top 6,000 employees:
• The top 50 employees receive forty-two times the average bank employee’s compensation (forty-two times is far below those numbers reported in Column 6 of Table 1).
• The next 450 employees receive twenty-one times the average bank employee’s compensation.
• The next 2,500 employees receive sixteen times the average bank employee’s compensation.
40 Benefits should be a much larger fraction of employee pay for lower-rank employees than for more senior employees or material risk takers. Thus, our estimates are unlikely to be affected by the size of benefits allocated to bank employees.
• The next 3,000 employees receive eight times the average bank employee’s compensation.
3. Assumptions regarding the deferred compensation program:
• Fifty percent of annual compensation is deferred.
• Equity is deferred for one year, with subsequent uniform vesting over three years.
• Cash is deferred for five years, with subsequent uniform vesting over the next five years (note that vesting does not depend on continued employment).
In Table 2, we provide estimates for the sums of cash and equity that would be available in each year (2009 to 2013) had the deferral program been implemented beginning in 2004. Deferred compensation is estimated as 50 percent of compensation in each year (for the 6,000 material risk takers in each firm), and 60 percent of the deferred amount is held as cash (and 40 percent as equity). The sum of deferred cash in a particular year is calculated as the sum of the deferred cash from the five most recent years plus the uniformly vested amounts from five years prior to that, beginning with 2004. For example, the 2009 figure is cal-culated by summing cash deferrals from 2005 to 2009 and adding 80 percent of the 2004 cash deferral, 60 percent of
Table 2 Average Aggregate Firm-Level Cash (60 Percent) and Equity (40 Percent) Deferred in Top Three Banks, 2009-2013
YearSum of Cash Deferred (Billions of Dollars)1
Sum of Equity Deferred (Billions of Dollars)2
2009 12.4 3.02010 14.1 3.22011 15.4 3.32012 16.3 3.42013 17.0 3.5
1Deferred cash is 60 percent of deferred compensation. Sum of cash deferred is deferred cash held for five years and vested uniformly on a five-year schedule, beginning with 2004.
2Deferred equity is 40 percent of deferred compensation. Sum of equity deferred is deferred equity held for one year and vested uniformly on a three-year schedule, beginning with 2004.
Sources: Federal Reserve Board, Consolidated Financial Statements of Bank Holding Companies (FR Y-9C data); Compustat.
Note: All figures reflect the average of the three largest banks.

72 Deferred Cash Compensation
the 2003 cash deferral, 40 percent of the 2002 cash deferral, and 20 percent of the 2001 cash deferral. Similarly, the sum of deferred equity is calculated as the deferred equity plus two-thirds of the previous year’s deferred equity plus one-third of the deferred equity from two years prior. For example, the 2009 figure is calculated by summing the equity deferral in 2009 with two-thirds of the equity deferred in 2008 and one-third of the equity deferred in 2007. The table shows that the aggregate deferred cash over the period 2009 to 2013, averaged for the three banks, is always above $10 billion and nears $20 billion in later years. The aggregate deferred equity is $3 billion in 2009 and climbs to $3.5 billion by 2013.
Table 3 re-estimates the 2009-2013 sums of cash and equity but uses a different proportion of cash to equity. Instead of 60 percent of deferrals being cash, the figures reflect using 50 percent cash (and 50 percent equity) for the deferrals. Under this scheme, the 2013 aggregate deferred cash decreases from $17 billion to $14.1 billion, while equity rises from $3.5 billion to $4.4 billion.
In Table 4, we present an alternative cash schedule based on a program that defers for four years and then vests uni-formly for the next three years. The aggregate deferred cash is again always above $10 billion, though it does not climb as high as the figures in Table 2 or Table 3 because of the shorter deferral and vesting period.
Our baseline estimate reported in Table 2 (deferred cash of $17 billion and deferred equity of $3.5 billion for 2013)
suggests that the deferred compensation scheme could produce a nontrivial financial buffer. As such, it could address some liquidity shortfalls in adverse scenarios. Acharya, Mehran, and Sundaram (2016) estimate a cash-to-equity ratio requirement of about 20 percent for large banks. We compare our estimate of deferred compensation with that of Acharya, Mehran, and Sundaram, realizing that the two estimates are not directly comparable. We use Compustat to calculate the average equity valuation of the three banks in our study at the end of 2013. We find the average valuation to be $180.8 billion. Therefore, the total deferral compensa-tion for 2013 in Table 2 is 11 percent of the average market capitalization of the three banks, and the cash deferral alone is 9 percent. It should be noted that, while our estimates are not based on an economic model, they are very conservative. For example, managing directors account for 3 to 6 percent of the work force in a large bank, or a lower bound of about 8,000 employees. Our estimates account for 6,000 managing directors. Thus, differences between our estimate and that of Acharya, Mehran, and Sundaram could be much smaller.
6. Conclusion
A healthy banking sector is central to the growth of the U.S. economy (and economies elsewhere). A sound banking sector does not imply little or no risk taking;
Table 3Average Aggregate Firm-Level Cash (50 Percent) and Equity (50 Percent) Deferred in Top Three Banks, 2009-2013
YearSum of Cash Deferred (Billions of Dollars)1
Sum of Equity Deferred (Billions of Dollars)2
2009 10.3 3.82010 11.7 4.02011 12.8 4.12012 13.6 4.22013 14.1 4.4
1 Deferred cash is 50 percent of deferred compensation. Sum of cash deferred is deferred cash held for five years and vested uniformly on a five-year schedule, beginning with 2004.
2 Deferred equity is 50 percent of deferred compensation. Sum of equity deferred is deferred equity held for one year and vested uniformly on a three-year schedule, beginning with 2004.
Sources: Federal Reserve Board, Consolidated Financial Statements of Bank Holding Companies (FR Y-9C data); Compustat.
Note: All figures reflect the average of the three largest banks.
Table 4 Average Aggregate Firm-Level Cash (60 Percent) and Equity (40 Percent) Deferred in Top Three Banks, 2009-2013; Shorter Cash Schedule
YearSum of Cash Deferred (Billions of Dollars)1
Sum of Equity Deferred (Billions of Dollars)2
2009 10.8 3.02010 11.3 3.22011 11.7 3.32012 12.1 3.42013 12.6 3.5
1 Deferred cash is 60 percent of deferred compensation. Sum of cash deferred is deferred cash held for four years and vested uniformly on a three-year schedule, beginning with 2004.
2 Deferred equity is 40 percent of deferred compensation. Sum of equity deferred is deferred equity held for one year and vested uniformly on a three-year schedule, beginning with 2004.
Sources: Federal Reserve Board, Consolidated Financial Statements of Bank Holding Companies (FR Y-9C data); Compustat.
Note: All figures reflect the average of the three largest banks.

FRBNY Economic Policy Review / August 2016 73
rather, it implies prudent decision making. Banks generate a great deal of value to the economy, yet as we saw in the 2007-09 crisis, their demise inflicts significant costs on the economy. Because of the importance of banks, the official sector stepped in during the crisis to rescue the banking sector—indeed, it has done so twice in recent times. In the process of this rescue, resources were diverted from other important social goals. Even if the diversion is justifiable, the reality is that society’s resources (and its patience) for these rescue operations are diminishing, partly because banks make up a much larger share of the economy than they did a decade ago.
What should we do differently this time? We need to remind ourselves that finance is a notoriously opaque industry and that future crises are liable to occur because risks are hard to measure and to understand. The goal of public policy should be to reduce the likelihood and severity of these future crises. Essential to this aim is an industry that better manages itself and that limits its reliance on public resources in other potential downturns. In this article, we described the potential benefits of introducing deferred cash compensation for risk takers in the banking industry, including promoting conservatism, inducing internal monitoring, and creating a liquidity buffer. Taken together, these benefits would likely contribute to greater financial stability.

74 Deferred Cash Compensation
References
Acharya, V., H. Mehran, and R. K. Sundaram. 2016. “Cash Holdings and Bank Compensation.” Federal Reserve Bank of New York Economic Policy Review 22, no. 1. Forthcoming.
Adams, R., and H. Mehran. 2003. “Is Corporate Governance Different for Bank Holding Companies?” Federal Reserve Bank of New York Economic Policy Review 9, no. 1 (April): 123-42.
Adams, R., and H. Mehran. 2012. “Bank Board Structure and Performance: Evidence for Large Bank Holding Companies.” Journal of Financial Intermediation 21, no. 2 (April): 243-67.
Altamuro, J., and A. Beatty. 2010. “How Does Internal Control Regulation Affect Financial Reporting.” Journal of Accounting and Economics 49, nos. 1-2 (February): 58-74.
Anantharaman, D., V. W. Fang, and G. Gong. 2014. “Inside Debt and the Design of Corporate Debt Contracts.” Management Science 60, no. 5 (May): 1260-80.
Bebchuk, L. A., and H. Spamann. 2010. “Regulating Bankers’ Pay.” Georgetown Law Journal 98, no. 2: 247–87.
Becker, G. S., and G. Stigler. 1974. “Law Enforcement, Malfeasance, and Compensation of Enforcers.” Journal of Legal Studies 3, no. 1 (January): 1-18.
Benabou, R., and J. Tirole. Forthcoming. “Bonus Culture: Competitive Pay, Screening, and Multitasking.” Journal of Political Economy.
Bennett, R. L., L. Güntay, and H. Unal. 2015. “Inside Debt, Bank Default Risk, and Performance during the Crisis.” Journal of Financial Intermediation 42: 487-513.
Bolton, P., H. Mehran, and J. Shapiro. 2015. “Executive Compensation and Risk Taking.” Review of Finance 19 (October): 2139-81.
Bushee, B., and C. Leuz. 2005. “Economic Consequences of SEC Disclosure Regulation: Evidence from the OTC Bulletin Board.” Journal of Accounting and Economics 39, no. 2 (June): 233-64.
Cheng, I. H., H. Hong and J. A. Scheinkman. 2015. “Yesterday’s Heroes: Compensation and Risk at Financial Firms.” Journal of Finance 70, no. 2 (April): 839-79.
Core, J. E., and W. R. Guay. 2010. “Is There a Case for Regulating Executive Pay in the Financial Services Industry?” In Y. Fuchita, R. J. Herring, and R. E. Litan, eds., After the Crash: The Future of Finance. Baltimore: Brookings Institution Press.
Doidge, C., G. A. Karolyi, and R. M. Stulz. 2015. “The U.S. Listing Gap.” Ohio State University working paper.
Dudley, W. C., 2013. “Ending Too Big to Fail.” Remarks at the Global Economic Policy Forum, New York City. Available at http://www .newyorkfed.org/newsevents/speeches/2013/dud131107.html.
———. 2014. “Enhancing Financial Stability by Improving Culture in the Financial Services Industry.” Remarks at a workshop on reforming culture and behavior in the financial services industry, Federal Reserve Bank of New York. Available at http://www .newyorkfed.org/newsevents/speeches/2014/dud141020a.html.
Edmans, A., and Q. Liu. 2011. “Inside Debt.” Review of Finance 15, no. 1 (January): 75-102.
Endlich, L. J. 1999. Goldman Sachs: The Culture of Success. New York: Knopf Doubleday Publishing Group.
Fahlenbrach, R., and R. Stulz. 2011. “Bank CEO Incentives and the Credit Crisis.” Journal of Financial Economics 99, no. 1 (January): 11-26.
Frydman, C., and D. Jenter. 2010. “CEO Compensation.” Annual Review of Financial Economics 2 (December): 75-102.
Greenstone, M., P. Oyer, and A. Vissing-Jorgensen. 2006. “Mandated Disclosure, Stock Returns, and the 1964 Securities Acts Amendments.” Quarterly Journal of Economics 121, no. 2 (May): 399-460.
Jensen, M. C., and W. H. Meckling. 1976. “Theory of the Firm: Managerial Behavior, Agency Costs, and Ownership Structure.” Journal of Financial Economics 3, no. 4 (October): 305-60.

FRBNY Economic Policy Review / August 2016 75
References (Continued)
The views expressed are those of the authors and do not necessarily reflect the position of the Federal Reserve Bank of New York or the Federal Reserve System. The Federal Reserve Bank of New York provides no warranty, express or implied, as to the accuracy, timeliness, completeness, merchantability, or fitness for any particular purpose of any information contained in documents produced and provided by the Federal Reserve Bank of New York in any form or manner whatsoever.
Mehran, H. 2010. “Enhancing Bank Risk-Management: (Inside) Contingent Capital as Employee Compensation.” Working paper.
Mehran, H., A. Morrison, and J. Shapiro. 2012. “Corporate Governance and Banks: What Have We Learned from the Financial Crisis?” In M. Dewatripont and X. Freixas, eds., The Crisis Aftermath: New Regulatory Paradigms. London: Centre for Economic Policy Research.
Mehran, H., and M. Suher. 2009. “The Impact of Tax Law Changes on Bank Dividend Policy, Sell-Offs, Organizational Form, and Industry Structure.” Federal Reserve Bank of New York Staff Reports, no. 369, April.
Mehran, H., and D. Yermack. 1997. “Compensation and Top Management Turnover.” NYU Working Paper no. FIN-98-051. Available at SSRN: http://ssrn.com/abstract=1297755.
Merton, R. 1974. “On the Pricing of Corporate Debt: The Risk Structure of Interest Rates.” Journal of Finance 29, no. 2 (May): 449-70.
Morrison, A., and W. Wilhelm. 2004. “Partnership Firms, Reputation, and Human Capital.” American Economic Review 94, no. 5 (December): 1682-92.
Murphy, K. J. 1999. “Executive Compensation.” In O. Ashenfelter and D. Card, eds., Handbook of Labor Economics. Vol. 3. Amsterdam: Elsevier.
———. 2012. “Pay, Politics, and the Financial Crisis.” In A. Blinder, A. Lo, and R. Solow, eds., Rethinking the Financial Crisis. New York: Russell Sage Foundation.
———. 2013. “Regulating Banking Bonuses in the European Union: A Case Study in Unintended Consequences.” European Financial Management 19, no. 4 (September): 631-57.
Ritter, J. A., and L. J. Taylor. 1994. “Workers as Creditors: Performance Bonds and Efficiency Wages.” American Economic Review 84, no. 3: 694-704.
Roe, M. J. 1994. Strong Managers, Weak Owners: The Political Roots of American Corporate Finance. Princeton, N.J.: Princeton University Press.
Smith, C., Jr., and R. L. Watts. 1992. “The Investment Opportunity Set and Corporate Financing, Dividend, and Compensation Policies.” Journal of Financial Economics 32, no. 3 (December): 263-92.
Squam Lake Group. 2013. “Aligning Incentives at Systemically Important Financial Institutions.” Available at http://www .squamlakegroup.org/Squam%20Lake%20Bonus%20Bonds%20Memo%20Mar%2019%202013.pdf.
Sundaram, R. K., and D. L. Yermack. 2007. “Pay Me Later: Inside Debt and its Role in Managerial Compensation.” Journal of Finance 62, no. 4 (August): 1551-88.
Van Bekkum, S. Forthcoming. “Inside Debt and Bank Risk.” Journal of Financial and Quantitative Analysis.
Wei, C., and D. L. Yermack. 2011. “Deferred Compensation, Risk, and Company Value: Investor Reaction to CEO Incentives.” Review of Financial Studies 24, no. 11 (November): 3813-40.
FRBNY Economic Policy Review / August 2016 77
The views expressed in this article are those of the authors and do not necessarily reflect the position of the Federal Reserve Bank of New York or the Federal Reserve System.
To view the authors’ disclosure statements, visit https://www.newyorkfed.org/research/author_disclosure/ad_epr_2016_cash-holdings_acharya.html.
Viral Acharya is the C.V. Starr Professor of Economics at the Stern School of Business, New York University; Hamid Mehran is an assistant vice president at the Federal Reserve Bank of New York; Rangarajan K. Sundaram is a professor of finance at the Stern School of Business, New York University.
[email protected] [email protected] [email protected]
Cash Holdings and Bank Compensation
Viral Acharya, Hamid Mehran, and Rangarajan K. Sundaram
1. Introduction
Executive pay in banks and the possible incentives it provides for excessive risk taking have been the focus of considerable atten-tion in the wake of the financial crisis. A particular concern is that traditionally compensation has been designed to align man-agement’s interests with those of equity holders but not those of creditors or other stakeholders such as taxpayers. From a regula-tory perspective, the challenge is to modify compensation design in a way that continues to encourage value creation even as it discourages excessive risk taking that could lead to bank failures.
In this article, we offer a simple set of guidelines for this purpose. Our approach, which relies on the use of cash rather than debt or equity as compensation, offers a framework for thinking about the role of cash in a bank’s capital structure and for iden-tifying a lower bound on the amount of cash that banks should be required to hold to help reduce the risk of systemic crises. The simplicity and transparency of a cash requirement—as well as the ease with which such a requirement could be made operational—are key. Our objective is to draw on the various properties of cash as part of a bank’s assets to furnish us with a benchmark level of cash holdings that is optimal from a regulatory standpoint.
Distilled to its basics, our approach is to use cash compen-sation in banks as a contingent asset of the banks. We propose that incentive compensation in banks involve a substantial cash component; that this component be deferred and placed in an
escrow account with a vesting schedule; and that ownership of the account revert to the bank in “stressed” times (subject to creditors’ forfeitures), allowing the bank to access this cash to pay down its debt or otherwise bolster its assets.
Importantly, we do not pin down the absolute size of cash holdings but determine this sum in relation to the bank’s equity levels and other parameters; inter alia, as the equity cushion decreases, our proposed cash holding requirement increases. As an alternative to holding more cash, banks can choose to delever-age to bring down the minimum required cash holdings.
For “typical” numbers for U.S. banks, we find a cash requirement of around 18 to 25 percent of equity value. However, empirical analysis suggests that the numbers are highly variable depending on the actual asset mix used by a bank at a given point in time; for instance, looking at the years immediately preceding the crisis, we find that cash requirements for many U.S. financial institutions (including those like Fannie Mae and Freddie Mac that would later fail) often exceeded 50 to 60 percent even by late 2006 and early 2007.1
1 Several recent proposals aim to increase the liability of bank management and thereby address risk-taking incentives (notably, Admati, Conti-Brown, and Pfleiderer [2012]; Baily et al. [2013]; and Calomiris, Heider, and Hoerova [2015]). While there are some conceptual differences between our cash compensation proposal and theirs, the key distinguishing features of our proposal are that it is easy to operationalize, fits naturally into the “stress test” approach used by regulators to manage risks of systemically important financial institutions, and, as we show in this article, can be readily calibrated.

78 Cash Holdings and Bank Compensation
There is an important, if obvious, caveat to our proposal. Since our analysis focuses on avoiding bank failures in stressed times, the cash holdings we derive will necessarily be more than those required in “normal” times. We regard this as the natural cost of a strategy that aims to reduce the costs of financial system disruption stemming from bank failures.
Our proposal is outlined in Section 2; a discussion of its empirical properties follows in Section 3. Section 4 examines the use of deferred cash in compensation and its role in promoting financial stability relative to that of other instruments, such as inside debt, deferred equity, and contingent capital. The model underlying the proposal is presented in Section 5.
2. The Proposal
In Section 5 we derive our minimum cash holding rule in a simple model. We find that a bank’s minimum cash C holding must satisfy
(1) C ≥ (1 - q)D - qE(1 - MES),
or, equivalently, that
(2) C __ E ≥ (1 - q) D __ E - q(1 - MES),
where D is the amount of the bank’s debt, 1 - q is the poten-tial loss in asset value that would result from a liquidation in stressed times, E is the equilibrium value of the bank’s equity (assuming implementation of our proposal), and MES is the marginal expected shortfall of bank equity conditional on the bank’s being stressed at the time.
2.1 A Numerical Illustration
Suppose that
1. the initial capital structure is D __ E = 9.0;
2. the loss in asset value from forced liquidation is 6 percent, so q = 0.94; and
3. in a stress scenario, the bank loses 50 percent of equity value in a crisis, so that MES = 0.50.
Then, plugging these numbers into the right-hand side of expression (2), we obtain the condition
C __ E ≥ (0.06 × 9.0) - [0.94 × 0.50] = 0.07,
meaning that the bank’s cash holding should be around 7 percent of its equity value. Of course, cash requirements would climb steeply as losses in liquidation mount. For example, if we assume 1 - q = 8 percent, the required minimum cash ratio rises sharply to 26 percent, while at 1 - q = 10 percent, the required minimum escrowed cash holding surges to 45 percent of equity value.
3. Empirical Analysis
Using historical estimates of MES from the NYU Stern School of Business V-Lab, which calculates long-run marginal expected shortfall (LRMES) in a stress scenario (modeled as a 40 percent decline in the S&P 500 index) and making an assumption concerning q, we can use the model to compute the required cash holding-to-equity ratio for banks.2 Of course, these numbers are only meant to be indicative. Different values for q and for anticipated equity-value losses in a stressed situation will give rise to different numbers.
We present in Chart 1 the computed values of this ratio for five banks that survived the crisis—Bank of America, Citigroup, JPMorgan Chase, Goldman Sachs, and Morgan Stanley—from March 2000 to July 2013 on a monthly basis. The computations take q = 0.94 (so the loss in asset value from forced liquidation is 1 - q = 0.06 or 6 percent). For each month, we smooth the calculated values by taking the average of the cash-to-equity ratio over the past three months.
Chart 2 depicts the same information with a different scale on the y-axis. Note that even prior to the collapse of Bear Stearns in mid-March 2008, three of these banks would have needed cash-to-equity ratios greater than 20 percent, accord-ing to the model. That is, in a scenario in which losses in a future market downturn were anticipated to be 40 percent, these firms were operating well off the model’s minimum recommended cash-to-equity ratios.
The model can also be used to compute cash-to-equity ratios for institutions that failed during the crisis. Charts 3 and 4 present this information for Bear Stearns, Lehman Brothers, Fannie Mae, Freddie Mac, and Wachovia. Chart 3 displays computed ratios from July 2000 to August 2008 that show the cash requirements exploding as these firms approach severe distress, near-failure, or failure.
Chart 4 focuses on the period July 2006 to August 2008, and shows that for all of these institutions except Wachovia,
2 For more discussion, see Acharya et al. (2010); Acharya, Engle, and Richardson (2012); and Brownlees and Engle (2011).

FRBNY Economic Policy Review / Forthcoming 79
the cash-to-equity ratio requirement would already have been much higher than 20 percent by March 2007. Fannie Mae and Freddie Mac, in particular, would have required cash-to-equity ratios exceeding 60 percent even by late 2006, reflecting their steeply rising debt levels during this period.
4. Why Cash and Not Inside Debt, Deferred Equity, or Contingent Capital?
Deferred cash compensation is akin to “inside debt,” that is, debt claims held by those inside the firm. The use of debt in executive compensation provides incentives for executives to undertake corporate policies that protect the value of these fixed claims, thereby lowering the firm’s default risk (Jensen and Meckling 1976). Such policies could include some or all of the following: investing in safer projects, lowering the firm’s leverage, reducing payouts (such as dividends) to other claimholders, stockpiling cash, and engaging in diversification activities that lower risk (even those that may sometimes be value-reducing).3
3 Substantial evidence supports the idea that the form of managerial compensation affects corporate policies (see, for example, Murphy [1999] or Frydman and Jenter [2010]). On the theoretical side, compensation ideas have been developed in the context of financial firms by Mehran (2008) and Bolton, Mehran, and Shapiro (2015).
A number of recent papers have confirmed that debt-like compensation reduces incentives for risk taking (Bebchuk and Spamann 2009; Edmans and Liu 2011; Mehran 2008; Sundaram and Yermack 2007; Wei and Yermack 2011). For instance, Sundaram and Yermack (2007) find that higher holdings of inside debt by managers reduce the likelihood of firm default. Similarly, Wei and Yermack (2011) find that firms in which chief executive officers (CEOs) had larger pensions and deferred pay in their compensation packages exhibited lower credit spreads and higher bond prices, imply-ing that markets were pricing in the lowered risk incentives stemming from the deferred debt-like claims. The findings for financial firms mirror those for nonfinancial firms. For example, Bennett, Güntay, and Unal (2015) document that a higher incidence of inside debt relative to inside equity in a CEO pay package in 2006 is associated with lower default risk and better performance during the crisis period 2007-08. They also find that higher CAMELS ratings (bank supervisory assessments of capital adequacy, asset quality, management capability, earnings, liquidity, and sensitivity to market risk) are associated with greater CEO inside debt compensation.
Nevertheless, three important features distinguish our deferred cash proposal from the inside debt approach and lead us to prefer our proposal. First, under our proposal, owner-ship of the (escrowed) deferred cash compensation reverts to the bank in times of stress so that the bank can repay its debts (or, more generally, so that it can repay any nonequity liabil-ities that if ignored could constitute a default). Thus, almost by definition, the deferred cash compensation of insiders in
-200
0
200
400
600
800
1,000
1,200
1,400
Morgan Stanley
Goldman Sachs
JPMorganChase
Citigroup
1210080605040302012000
Bank of America
Percent
Chart 1Minimum Recommended Cash Holdings-to-Equity Ratios by Bank, 2000-13
Source: Authors’ calculations.
Chart 2Minimum Recommended Cash Holdings-to-Equity Ratios by Bank, 2007-09
Percent
Source: Authors’ calculations.
-100
-50
0
50
100
150
200Morgan Stanley
Goldman Sachs
Citigroup
Bank of America
200920082007
JPMorgan Chase

80 Cash Holdings and Bank Compensation
our proposal is junior to all other debt. In contrast, current inside debt proposals, to the best of our knowledge, would give insiders a slice of bank debt that is repaid in tandem with other debts.4
Second, deferred cash under our proposal would be escrowed, and management and shareholders would not have the discretion to deploy the cash for risk-taking purposes. While rewarding insiders with debt (rather than cash) would preserve the bank’s cash, the current inside debt proposals do not explicitly require that retained cash be outside of mana-gerial and shareholder discretion. Indeed, if inside debt is not designated as the senior-most debt of the firm, management and shareholders would have incentives to deploy the cash for risk-taking purposes, with the intention of shifting risk to the senior creditors.
Third, deferred equity or equity-linked claims (including options) do not provide quite the same incentives toward con-servatism as deferred cash or debt-like claims. Although the deferral aspect will induce some risk aversion, equity, as the residual claim on the firm’s assets, benefits from an increase in firm volatility. Hence, the incentive to reduce risk is smaller with deferred equity than it is with deferred cash or inside debt.
Finally, our proposal is closely related to, but distinct from, the notion of “contingent capital” (Flannery 2005; Squam Lake
4 We observe, too, in this context that the transfer of ownership of cash compensation from insiders to the bank in the event of stress does not constitute (in a technical sense) “default” by the bank on its creditors. In contrast, failure to pay on inside debt would constitute a default unless the terms of the contract explicitly allow for the possibility.
Working Group on Financial Regulation 2009). Contingent capital is debt that converts to equity under pre-specified trig-gers, thus reducing the leverage ratio of the bank in stressed times. As such, contingent capital is effectively a contingent liability of the bank, whereas the cash in our model represents a contingent asset; of course, to the extent that cash may be viewed as negative debt, this distinction in terminology may not in itself be that important. But unlike contingent capital, the contingent asset in our proposal is intended to come entirely from deferred executive compensation, and so directly affects risk-taking incentives of the executive. Moreover, there is no dilution of existing equity from the trigger in our approach. Further, the cash is compensation that has already been paid out by the bank but which is held in escrow to be clawed back in poor times; it is a not a liability owed by the bank.
5. Deriving the Minimum Cash Holding Rule
Here we turn to the model underlying the proposal. Consider a single-period binomial model for distribution of the value of a bank’s noncash assets. The current value of assets is A. At the end of the period, the assets may be worth Ah in state H, which arises with a probability of p ∊ (0,1). Alternatively, they may be worth Al in state L which arises with a probability of (1 - p), where Ah > Al.
Chart 3Cash-to-Equity Ratios: Selected Institutions(2000-08)
Percent
Source: Authors’ calculations.
-50
0
50
100
150
200
250
300
350
400
Wachovia
Freddie Mac
Lehman Brothers
Bear Stearns
08070605040302012000
Fannie Mae
Chart 4Cash-to-Equity Ratios: Selected Institutions(2006-08)
Percent
Source: Authors’ calculations.
-40
-20
0
20
40
60
80
100
120
140
Wachovia
Freddie Mac
Fannie Mae
Bear Stearns
200820072006
LehmanBrothers

FRBNY Economic Policy Review / August 2016 81
The bank’s owners have an option at date 0 to alter the quality of noncash assets from the benchmark cash flow structure to a riskier cash flow structure, such that the future value of assets in states H and L and is given respectively by Aht and 0, and the probability of these states is altered as well to p' and (1 - p'), respectively. In this case, the current value of the assets will be denoted as A'.
The bank has legacy debt of face value D, which is due at the end of the period, and a starting stock of contingent cash assets worth C, which are assumed to be riskless with no fluctuation in value across the states H and L. The cash C is to be thought of as an escrow account carrying the deferred cash compensation of bank employees. However, if the bank cannot meet its creditor payments, the escrow account would be made available to fulfill these payments; only if creditor payments can be met fully from asset cash flows will the deferred cash compensation be paid out to bank employees.
The discount rate is assumed to be zero throughout, which is also the rate of return on cash assets. Bank owners as well as creditors are assumed to be risk-neutral. Debt claims are assumed senior to all other claims, and there is no violation in any state of this priority structure. Under these assumptions, it follows that
(3) A = pAh + (1 - p)Al, and
(4) A' = p'Ah'.
We will assume further that an interim and perfect signal about the future state of the world becomes available to bank owners as well as creditors. Upon receipt of this signal, if it is optimal for creditors to “run” on the bank’s assets and force them to be liquidated, then the liquidation value of assets is a fraction q ∊ [0,1) of the future value. We assume that Al > D > qAl, so that even if the bank has no cash assets (C = 0), creditors can be paid in full in state L if they wait for realization of the value of the noncash assets. But if they force early asset liquidation, they incur a haircut in their recovered payoff relative to the promised payoff. We also assume, in con-trast, that qAh > D and qAh' > D, so that in state H creditors can be paid in full, even if the bank has no cash assets and early liquidation is forced.
We will assume for now that, owing to a coordination problem, creditors may run on the bank in state L (in the case of the benchmark assets) and force asset liquidation provided that
(5) qAl + C < D.
This run can be rationalized as a “sun spot” along the lines of Diamond and Dybvig (1983).
In what follows, we calculate what cash levels enable the bank to avoid a run in state L, preserve equity value in this state, and in turn, preserve bank owners’ ex ante incentives not to switch from the benchmark asset to the alternative riskier asset.
5.1 Analysis
We first calculate the value of bank equity in the benchmark assets case assuming a run and no run, denoted as E r and E nr, respectively.
• Run: In the case of a run in state L, bank owners and employees are left with no residual cash flows; in state H, creditors are paid off from cash flow Ah, cash is paid out to employees, and the residual (Ah - D) is residual cash flow that accrues to bank equity. As a result,
(6) E r = p(Ah - D).
• No run: In the case in which there is no run in state L, the bank owners are left with a residual cash flow (Al - D) and employees are paid out the cash C. As a result,
(7) E nr = p(Ah - D) + (1 - p)(Al - D) = A - D.
It can be readily observed that Er < Enr for all D.Next, it is straightforward to see that the value of bank
equity in the riskier assets case is given by
(8) E' = p'(Ah' - D).
Since there is no cash flow from assets in state L in the riskier assets case, whether there is a run or not is irrelevant for bank equity valuation.
We now analyze the incentives of bank owners at the beginning of the period to alter the riskiness of noncash assets from the benchmark case to the riskier one:
• Run: If bank owners anticipate a run in state L in the benchmark assets case, they switch to the riskier asset if and only if
(9) E r < E'.

82 Cash Holdings and Bank Compensation
• No run: If bank owners do not anticipate a run in state L in the benchmark assets case, they switch to the riskier asset if and only if
(10) E nr < E'.
Then, we obtain the standard asset-substitution or risk-shifting result (Jensen and Meckling 1976) that there is an incentive to switch to the riskier asset whenever the firm’s debt level is sufficiently high. So, we have the following:
Lemma 1: E r < E' if and only if D > _
D r ≡ pAh - p'Ah'
_______ p - p' .
Similarly,
Lemma 2: Enr < E' if and only if D > _
D nr ≡ A - p'Ah'
_______ 1 - p' .
Finally,
Proposition 1: _
D nr > _
D r.
In other words, risk-shifting incentives are weaker when there is no expectation of a run in state L in the benchmark assets case. The intuition is that this condition preserves equity value in state L and reduces the benefits of gambling for resurrection by switching to the riskier assets.
We can now ask what level of cash assets would be necessary to avoid a run and also have the desirable effect of reducing bank owners’ risk-shifting incentives. There is no run in state L in the benchmark assets case provided that
(11) qAl + C ≥ D,
or, in other words, provided that
(12) C ≥ D - qAl.
We define the bank’s expected shortfall (ESnr) to be the percentage change in equity valuation between the beginning of the period and state L in the case of no run. The result is that
(13) ES nr = 1 - (Al - D) ______ (A - D) .
Rearranging this equation, we can express Al in terms of ES as
(14) Al = D + (A - D) (1 - ES nr)
(15) = D + E nr(1 - ES nr).
Substituting in the condition for no run, we obtain our main result, which expresses the cash requirement for the bank that avoids a run as:
Proposition 2: C ≥ (1 - q)D - qE nr(1 - ES nr).
Since the asset liquidation losses (q < 1) are generally incurred during systematic states of nature, we can replace ES nr with MES nr, which is the marginal expected shortfall of bank equity, conditional on an adverse market or adverse aggregate state.
Finally, if we consider incentives from the standpoint of a bank management that not only owns all bank equity but also factors in its cash payouts, we again obtain the result that there is risk shifting when bank debt is sufficiently high. In the cases of a run and no run, the critical debt levels above which risk shifting occurs are given respectively by
_ D r,m =
_ D r + C,
and __
D nr,m = _
D nr + C. In turn, it follows that _
D nr,m > _
D r,m. Risk-shifting incentives are weaker for management than bank owners, because management has additional liability from its deferred cash compensation. However, the relative risk-shifting incentives between the run and no-run cases are unaffected, so that if it is desirable to avoid the run in order to reduce risk-shifting incentives, then the cash requirement is identical to the one in our proposition.

FRBNY Economic Policy Review / August 2016 83
References
Acharya, V., L. Pedersen, T. Philippon, and M. Richardson. 2010. “Measuring Systemic Risk.” NYU Stern School of Business Department of Finance technical report.
Acharya, V., R. Engle, and M. Richardson. 2012. “Capital Shortfall: A New Approach to Ranking and Regulating Systemic Risks.” American Economic Review 102, no. 3 (May): 59-64. Papers and Proceedings of the 124th Annual Meeting of the American Economic Association.
Admati, A., P. Conti-Brown, and P. Pfleiderer. 2012. “Liability Holding Companies.” UCLA Law Review 59, no. 4 (April): 853-913.
Baily, M. N., D. W. Diamond, D. Duffie, K. R. French, A. K. Kashyap, F. S. Mishkin, R. Rajan, D. S. Scharfstein, R. J. Shiller, M. J. Slaughter, H. Shin, J. Stein, and R. M. Stulz. 2013. “Aligning Incentives at Systemically Important Financial Institutions: A Proposal by the Squam Lake Group.” Journal of Applied Corporate Finance 25, no. 4 (Fall): 37-40.
Bebchuk, L., and H. Spamann. 2010. “Regulating Bankers’ Pay.” Georgetown Law Journal 98: 247-87.
Bennett, R., L. Güntay, and H. Unal. 2015. “Inside Debt, Bank Default Risk, and Performance during the Crisis.” Journal of Financial Intermediation 24, no. 4 (October): 487-513.
Bolton, P., H. Mehran, and J. Shapiro. 2015. “Executive Compensation and Risk Taking.” Review of Finance 19, no. 6 (October): 2139-81.
Brownlees, C., and R. Engle. 2010. “Volatility, Correlation, and Tails for Systemic Risk Measurement.” Unpublished paper, New York University.
Calomiris, C., F. Heider, and M. Hoerova. 2015. “A Theory of Bank Liquidity Requirements.” Columbia Business School Research Paper no. 14-39.
Diamond, D. W., and P. H. Dybvig. 1983. “Bank Runs, Deposit Insurance, and Liquidity.” Journal of Political Economy 91, no. 3 (June): 401-19.
Edmans, A., and Q. Liu. 2011. “Inside Debt.” Review of Finance 15, no. 1 (January): 75-102.
Flannery, M. J. 2005. “No Pain, No Gain: Effecting Market Discipline via Reverse Convertible Debentures.” In H. S. Scott, ed., Capital Adequacy beyond Basel: Banking, Securities, and Insurance. Oxford: Oxford University Press.
Frydman, C., and D. Jenter. 2010. “CEO Compensation.” Annual Review of Financial Economics 2, December: 75-102.
Jensen, M. C., and W. H. Meckling. 1976. “Theory of the Firm: Managerial Behavior, Agency Costs, and Ownership Structure.” Journal of Financial Economics 3, no. 4 (October): 305-60.
Mehran, H. 2008. “Compensation and Risk Management.” Unpublished paper, Federal Reserve Bank of New York.
Murphy, K. J. 1999. “Executive Compensation.” In O. Ashenfelter and D. Card, eds., Handbook of Labor Economics. Amsterdam: North-Holland.
Squam Lake Working Group on Financial Regulation. 2009. “An Expedited Resolution Mechanism for Distressed Financial Firms: Regulatory Hybrid Securities.” Council on Foreign Relations technical report.
Sundaram, R. K., and D. L. Yermack. 2007. “Pay Me Later: Inside Debt and Its Role in Managerial Compensation.” Journal of Finance 62, no. 4 (August): 1551-88.
Wei, C., and D. L. Yermack. 2011. “Investor Reactions to CEO Inside Debt Incentives.” Review of Financial Studies 24, no. 11 (April): 3813-40.
The views expressed are those of the authors and do not necessarily reflect the position of the Federal Reserve Bank of New York or the Federal Reserve System. The Federal Reserve Bank of New York provides no warranty, express or implied, as to the accuracy, timeliness, completeness, merchantability, or fitness for any particular purpose of any information contained in documents produced and provided by the Federal Reserve Bank of New York in any form or manner whatsoever.
FRBNY Economic Policy Review / August 2016 85
by the recent JPMorgan Chase London Whale fiasco, these bank corporate governance issues pose an ongoing risk to the financial markets. Hence, bank corporate governance in the post-crisis era warrants careful review.
That governance problems can arise in banks is well understood (Levine 2004; Bebchuk and Spamann 2010; de Haan and Vlahu 2013; Adams and Mehran 2008, revised 2011; Calomiris and Carlson 2014). What may not be appreciated, however, is the degree to which the unique features of banking complicate both the role of the board and its governance effectiveness. In an earlier paper (Macey and O’Hara 2003), we reviewed the different models of corporate governance, with a particular focus on the duties that board members owe to different constituencies. We argued that these unique features of banks dictated a heightened “duty of care” for bank directors.1 We discussed the various legal cases defining the duty of care for directors, and how the courts have vacillated in their application of these duties owed by
1 The duty of care is the obligation to make reasonable, fully informed decisions and more generally to manage the corporation with the care that a reasonable person would use in the management of her own business and affairs.
1. Introduction
Legislation and regulation, particularly laws and regulations related to corporate finance and financial markets, tend to follow crisis. The myriad corporate scandals in the previous decade led to a heightened awareness of the role played by corporate governance, so it is hardly surprising that corporate governance has been the focus of regulation for some time now. In the wake of Enron, Tyco, and other high-profile failures, the Sarbanes-Oxley Act of 2002 focused on the internal controls of firms and the risks that poor governance imposed on the market. In the aftermath of the recent financial crisis, the Dodd-Frank Wall Street Reform and Consumer Protection Act unleashed a plethora of changes for markets that involved restrictions on what banks can do, who can regulate them, and how they should be liquidated, as well as mortgage and insurance reform and consumer protection initiatives.
Surprisingly, the duties required of bank directors per se were not a focus of specific attention in either act. We believe the role that bank corporate governance issues played in the financial crisis is not inconsequential and that, as suggested
Bank Corporate Governance: A Proposal for the Post-Crisis World
Jonathan Macey and Maureen O’Hara
Jonathan Macey is the Sam Harris Professor of Corporate Law, Corporate Finance, and Securities Regulation at Yale University; Maureen O’Hara is the Robert W. Purcell Professor of Finance at the Johnson Graduate School of Management, Cornell University.
[email protected] [email protected]
The authors thank William Bratton, Doron Levit, Hamid Mehran, Christian Opp, Michael Wachter, and seminar participants at the Wharton–Penn Law School Institute for Law and Economics seminar for helpful comments. Certain of the themes and arguments in this article have been introduced and extended in “Vertical and Horizontal Problems in Financial Regulation and Corporate Governance,” in A. Demirgüç-Kunt, D. D. Evanoff, and G. G. Kaufman, eds., The Future of Large, Internationally Active Banks (Hackensack, N.J.: World Scientific Publishing Co., 2016). The views expressed in this article are those of the authors and do not necessarily reflect the position of the Federal Reserve Bank of New York or the Federal Reserve System.
To view the authors’ disclosure statements, visit https://www.newyorkfed.org /research/author_disclosure/ad_epr_2016_post-crisis-world_macey.html.

86 A Proposal for the Post-Crisis World
directors. Since then, a lot has changed with respect to banking structure and practice, but little has changed with respect to the duties and obligations of bank directors. This inertia with respect to bank directors is all the more puzzling given that Dodd-Frank explicitly addressed the externalities imposed by individual banks on the financial system yet imposed no additional requirements on bank directors to make them responsible for limiting such risks.2
In this article, we propose a new paradigm for bank corporate governance in the post-crisis world. We argue that bank directors should face heightened requirements owing to the increased risk that individual banks pose for the financial system. Our thesis is that the greater complexity and opacity
of banks, and the increased challenges in monitoring these complex institutions, require greater expertise on the part of bank directors. We propose new “banking expert” and “banking literacy” requirements for bank directors akin to the “financial expert” requirements imposed on audit committees by Sarbanes-Oxley. As we argue, these requirements would mandate a higher level of competence for bank directors, consistent with the greater knowledge required to understand and to oversee today’s more complex financial institutions.
It has been argued that large, complex financial institutions are now simply too large to govern—that “too big to fail” is “too big to exist.” This may be true, but before we throw in the towel on the corporate form of bank organization in favor of some regulator-based form of control, we think it makes sense to try to craft a more relevant corporate governance standard for
2 On February 18, 2014, the Board of Governors of the Federal Reserve System approved a final rule implementing the provisions of Section 165 of Dodd-Frank. Under the final rule, U.S. bank holding companies (BHCs) and foreign banking organizations (FBOs) with at least $50 billion in total consolidated assets will be subject to heightened capital, liquidity, risk management, and stress testing requirements, effective January 1, 2015, for BHCs and July 1, 2016, for FBOs. The final rule was available at http://www.federalreserve.gov/newsevents/press/bcreg/bcreg20140218a1.pdf, but as of May 19, 2014, it was no longer available at that site. As noted in Section 3.1 of this article, Section 165(h) of Dodd-Frank requires the formation of risk committees of boards of directors at publicly traded bank holding companies and companies designated by the Financial Stability Oversight Council as systemically important nonbank financial firms.
banks. Similarly, it has been argued that mendacity is to blame for the myriad scandals in banking—that bank management, and presumably bank directors, are somehow not sufficiently motivated to “do the right thing.” This, in turn, results in a culture problem in banking that leads to bad behavior. While acknowledging the importance of cultural reforms in banking, we argue that operating and monitoring a complex financial institution is extremely difficult, and that one solution to better bank management lies in better bank corporate governance. Our proposals here are a step in that direction.
This article is organized as follows. In the next section, we draw on earlier work as well as lessons learned from the JPMorgan London Whale debacle to talk about how gover-nance problems arise in banks and why these problems differ from those arising in other firms. We discuss how the growing complexity of banks creates a new set of governance problems, and how recent structural changes such as dual boards have contributed to governance failures in banking. In Section 3, we consider how these corporate governance problems have traditionally been dealt with in banks, and we discuss recent approaches taken in the United States and other countries to make bank corporate governance more effective. In Section 4, we set out our alternative approach for bank corporate gover-nance. We argue that bank directors should meet professional standards, as opposed to the amateur standards that apply to other corporate directors. We propose even more rigorous standards for members of bank risk committees, recognizing that failures in bank risk management impose significant costs on the financial system and on the economy more generally.
2. Bank Corporate Governance: Why Is It So Difficult?
Generally speaking, the problem of corporate governance stems from agency problems that emerge when the residual claims on a firm’s income take the form of shares of stock that are mostly owned by people who are not involved in the management or operations of the company (Berle and Means 1932; Jensen and Meckling 1976). In order to ameliorate agency costs, over time corporate law has developed the general rule that fiduciary duties should be owed exclusively to shareholders (Macey 1999). The justification for making shareholders the exclusive beneficiaries of the fiduciary duties owed by managers and directors is based on the fact that creditors, as fixed claimants, can safeguard their investments through a combination of pricing and the imposi-tion of contractual protections such as conversion rights or put options (Macey and Miller 1993).
We propose new “banking expert” and
“banking literacy” requirements for bank
directors akin to the “financial expert”
requirements imposed on audit
committees by Sarbanes-Oxley.

FRBNY Economic Policy Review / August 2016 87
In our earlier article on corporate governance problems in banks (Macey and O’Hara 2003), we argued that banks are different from other firms and that the economic policies that justify making shareholders the exclusive beneficiaries of fiduciary duties do not apply with the same force to banks that they do to other types of corporations, such as manufacturing or technology companies.3 We believe these difficulties have only increased in the past decade, with the result being that banks in the post-crisis era face even greater corporate gov-ernance difficulties. Specifically, we believe that a variety of features unique to banks make them more risky, fragile, and difficult to monitor and control than other firms (Macey and O’Hara 2003, 97).
2.1 Asset Structure and Liquidity Creation by Banks
First, because of their unusual capital structures, banks have a unique role in generating liquidity for the economy. It is well known that banks’ balance sheets are highly leveraged (Bebchuk and Spamann 2010; Flannery 1994), with fixed-claim creditors supplying 90 percent or more of the funding that banks require to operate. Moreover, these fixed-claim liabilities gen-erally are available to creditors (depositors) on demand, while on the asset side of the balance sheet, banks’ loans and other assets have longer maturities.
The development of increasingly robust secondary markets and banks’ ability to securitize assets has enabled banks to move assets off of their balance sheets, but this process has not led to a reduction in the size of banks’ balance sheets: banks tend to grow rather than shrink even as they securitize more of their assets. Because a bank’s more transparent and liquid assets tend to be sold either outright or as part of a pool of securitized financial assets, what is left on its balance sheet is generally the more opaque and idiosyncratic assets. Arguably, these evolutionary developments in capital markets have led to a secular deterioration, rather than to an improvement in the transparency and liquidity of bank assets.
The phenomenon of simultaneously holding transparent, liquid liabilities on the one hand and illiquid, opaque assets on the other enables banks to serve the vital economic role of cre-ating liquidity (Diamond and Dybvig 1983). However, to create liquidity, banks must lend the funds that they receive from deposits and other short-term liabilities, and, consequently, banks keep only a small fraction of funds as reserves to satisfy depositors’ demands for liquidity. This asset transformation
3 The discussion here is also reviewed in Macey and O’Hara 2016.
process results in a situation in which no bank has sufficient funds on hand to satisfy the demands of depositors if a signifi-cant number demand payment simultaneously.
The mismatch in the liquidity characteristics and term structure of banks’ assets leads to bank runs and other systemic problems in the financial system. With greater than a third of U.S. bank liabilities uninsured, rational uninsured depositors
(and claimants) will try to be among the first to withdraw before other nimble creditors deplete the banks’ assets. Thus, bank depositors, unlike creditors in other companies, are in a situation closely akin to the classic prisoner’s dilemma. This prisoner’s dilemma can lead to failures in solvent banks because the need for liquidity in the event of a run or panic can lead to fire-sale liquidations of assets, thereby spreading problems to heretofore solvent banks. For bank directors, the need to manage such liquidity risks is fundamental to a bank’s survival.
2.2 Deposit Insurance, Moral Hazard, and the Conflict between Fixed Claimants and Equity Claimants
The existence of federally sponsored deposit insurance means that banks can continue to attract liquidity to fund their operations even after they are insolvent. Thus, unlike other sorts of companies, it is virtually impossible for feder-ally insured banks to become insolvent in the “equitable” sense of being unable to pay their debts as they come due in the ordinary course of business.4 Federal insurance elimi-nates the market forces that starve nonfinancial firms of cash. The federal government has attempted to replace these market forces with regulatory requirements, including
4 In bankruptcy law and practice, there are two types of insolvency. Insolvency in the balance sheet sense means that the value of a company’s liabilities is greater than the value of its assets. Insolvency in the equity sense means that the firm is unable to pay its debts as they come due in the ordinary course of business (Jurinski 2003, 33).
Unlike other sorts of companies, it is
virtually impossible for federally insured
banks to become insolvent in the
“equitable” sense of being unable to pay
their debts as they come due in the
ordinary course of business.

88 A Proposal for the Post-Crisis World
capital requirements and rules regarding the “prompt resolution” of financially distressed banks. Nevertheless, it seems clear that the well-established tenet of corporate finance that there is a conflict between fixed claimants and shareholders is, as we previously observed, “raised to a new dimension in the banking context” (Macey and O’Hara 2003, 98). In banking, neither creditors nor capital markets have incentives to negotiate for protections against risky, “bet-the-bank” investment strategies or to demand compen-sation for such risk in the form of higher interest payments.
Bebchuk and Spamann (2010) argue that these agency conflicts manifest particularly in problems with bank exec-utive compensation. They make the intriguing point that governance reforms aimed at aligning compensation with shareholder interests—such as say-on-pay votes, use of restricted stock, and increased director independence—fail in banks because shareholders also benefit from bank management taking on excessive risk. This raises the disturbing specter that bank directors are in fact doing their jobs—but that their jobs do not include adequately recognizing the sys-temic risks that banks pose for the financial system.
2.3 Monitoring and Loyalty Problems: The London Whale
The moral hazard caused by deposit insurance coupled with imperfections in the regulatory system leads not only to excessive risk taking by banks but also to an industrywide reduction in levels of monitoring within the firm, resulting in a higher incidence of large losses and bank failures caused by fraud.5 The high incidence of fraud is attributable both to the lack of monitoring by creditors and to the highly liquid form of banks’ assets, which makes it easy to divert bank assets to private use relative to less liquid assets such as factories and equipment.
Shareholder incentives to prevent fraud and self-dealing through monitoring exist in banks as they do in other types of companies. As in these other types of companies, however, “such monitoring is notoriously ineffective in many cases because individual shareholders rarely have
5 See remarks of R. L. Clarke in Comptroller of the Currency News Release no. NR 88-5 (1988, 6) noting that fraud and self-dealing were “apparent” in as many as one-third of the bank failures that occurred during the 1980s. See also Jackson and Symons (1999, 152), citing a study by the U.S. General Accounting Office on bank failures in 1990 and 1991 that reported that in slightly more than 60 percent of these failures (175 out of 286), insider lending was a “contributing factor.”
sufficient incentives to engage in monitoring because of collective-action problems” (Macey and O’Hara 2003, 98).
Perhaps no event illustrates the endemic monitoring and other corporate governance problems in the context of the banking industry more clearly than the London Whale trading loss debacle.6 The U.S. Securities and Exchange
Commission charged JPMorgan Chase with misstating financial results and lacking effective internal controls to detect and prevent its traders’ fraudulent overvaluing of investments to conceal hundreds of millions of dollars in trading losses.7 In the wake of this case, Mary Jo White, the new chair of the SEC, deployed her marquee policy to require admissions of wrongdoing in certain “egregious” cases.8
The SEC’s lawsuit against JPMorgan charged the company with violating provisions of Sarbanes-Oxley relating to corpo-rate governance and disclosure. In particular, Sarbanes-Oxley requires public companies to maintain disclosure controls and procedures that ensure that important information reaches the appropriate persons so that timely decisions can be made regarding disclosure in public filings.9 Also at issue were JPMorgan’s alleged violations of SEC regulations requiring corporate managers to evaluate on a quarterly basis the effec-tiveness of the company’s disclosure controls and procedures and to disclose management’s conclusion regarding their effectiveness in its quarterly filings.10 The SEC also alleged that even after JPMorgan announced a trading loss of
6 Kevin LaCroix, “A Closer Look at JPMorgan’s $920 Million ‘London Whale’ Regulatory Settlements,” The D and O Diary, September 20, 2013, available at http://www.dandodiary.com/2013/09/articles/securities-litigation/ a-closer-look-at-jp-morgans-920-million-london-whale-regulatory-settlements.7 SEC, Order Instituting Cease-And-Desist Proceedings Pursuant to Section 21C of the Securities Exchange Act of 1934, Making Findings, and Imposing a Cease-and-Desist Order, available at http://www.sec.gov/litigation/admin/2013/34-70458.pdf .8 See Bruce Carton, “SEC to Require Admissions of Wrongdoing in Settlements of Egregious Cases,” Compliance Week, June 19, 2013.9 SEC Order. Such requirements on internal accounting controls are intended to “provide reasonable assurances that transactions are recorded as necessary to permit preparation of reliable financial statements.”10 SEC Order.
Perhaps no event illustrates the endemic
monitoring and other corporate
governance problems in the context of
the banking industry more clearly than
the London Whale trading loss debacle.

FRBNY Economic Policy Review / August 2016 89
approximately $2 billion on May 10, 2012, the full extent of the trading losses that occurred during the first quarter of 2012 was not detected and reported.11 This failure resulted, in part, from the ineffectiveness of internal control functions within the bank’s Chief Investment Office, which was known as the Valuation Control Group (CIO-VCG).12
Within banks, valuation control units are a critical part of internal controls because they monitor and control for the accuracy of valuations of the financial assets acquired and held by traders and other market professionals within the firm. From a corporate governance perspective, it is obvious that a valuation control group must be independent of the trading desks it monitors in order to be effective. The consequences of a corporate governance failure in this respect are severe because such failures risk both the inaccu-rate valuation of the bank’s assets as well as the material misstatement of the bank’s financial condition in its public filings. In the case of JPMorgan, the SEC found that JPMorgan’s CIO-VCG was “unequipped to cope with the size and complexity of the credit derivatives” that were the principal assets in the bank’s synthetic credit portfolio (SCP).13 As of March 31, 2012, the SCP contained 132 trading positions with a net notional amount of approxi- mately $157 billion.14
The SEC also found that the CIO-VCG “did not function as an effective internal control” during the relevant time period because the CIO-VCG was “understaffed, insuffi-ciently supervised, and did not adequately document its actual price-testing policies.”15 Perhaps more disturbingly, it appeared to the SEC that the price-testing methodology used by CIO-VCG “was subjective and insufficiently inde-pendent from the SCP traders, which enabled the traders to improperly influence the VCG process.”16 In addition, during the first quarter of 2012, CIO-VCG failed to esca-late to CIO and JPMorgan management significant
11 SEC Order.12 SEC Order.13 The SCP was invested in two primary index groups: CDX, a group of North American and emerging markets indexes, and iTraxx, a group of European and Asian indexes. Some indexes referenced companies considered to be investment grade and others referenced companies considered to be high-yield (which generally means that their credit risk is viewed as higher). Investors in CDX and iTraxx indexes, including CIO, can be “long” risk, which is equivalent to being a seller of CDS protection, or “short” risk, which is equivalent to being a buyer of CDS protection. See Annex A to SEC Cease-and-Desist Order.14 Annex A to SEC Order.15 SEC Order, 2.16 SEC Order, 2.
information that management required in order to make informed decisions about disclosure of the firm’s financial results for the first quarter of 2012. As a result, JPMorgan did not in a timely fashion detect or effectively challenge questionable valuations by the SCP traders as the portfo-lio’s losses accumulated in the first quarter of 2012, leading the bank to publicly misstate its financial results for that period.
Another significant corporate governance failure was inadequate communication between JPMorgan’s senior management and the audit committee of JPMorgan’s board
of directors. JPMorgan senior management initiated reviews of the CIO-VCG’s work after learning of significant disputes between the bank and its counterparties about the value of the assets held in the synthetic credit portfolio. From these reviews, the bank’s management learned that there were problems with the CIO-VCG’s price testing and “an undue amount of subjectivity” in its control function. Contrary to the requirements of Sarbanes-Oxley, however, JPMorgan’s management did not inform the audit committee or the bank’s board of directors that it was aware of significant deficiencies or material weaknesses in the firm’s internal control over financial reporting. As the SEC observed in its order, this information must be passed along to the board by management to enable “the Audit Committee to fulfill its oversight role and help to assure the integrity and accuracy of information.”
The internal problems were egregious. For example, when losses were incurred on the traditionally profitable SCP in the first quarter of 2012, the senior SCP trader instructed other SCP traders to stop reporting losses to CIO manage-ment unless there was a market-moving event that could easily explain the losses. At least one SCP trader changed his daily marking methodology for the SCP and began assigning values at the point in the bid-offer spread that
Within banks, valuation control units are a
critical part of internal controls because
they monitor and control for the accuracy
of valuations of the financial assets
acquired and held by traders and
other[s] . . . within the firm. . . . It is
obvious that a valuation control group
must be independent of the trading desks
it monitors in order to be effective.

90 A Proposal for the Post-Crisis World
resulted in the highest valuations of the SCP positions, a valuation technique inconsistent with Generally Accepted Accounting Principles (GAAP). 17 Things got much worse when this trader even began valuing assets at prices that were completely “outside every dealer’s bid and offer received that day” and thereby “intentionally understated mark-to-market losses in the SCP.”18
In JPMorgan’s $200 million settlement of the SEC’s enforcement action against it, the bank acknowledged
significant corporate governance failures. For example, the bank admitted that significant facts learned in the course of the various internal reviews were not shared in meetings and calls among the participants in such reviews. As a result, these facts were not escalated to JPMorgan senior management or communicated to the audit committee of the board in a timely fashion.19 Also apparently missing in action was the bank’s risk committee, which was not kept informed of what was clearly a gaping hole in the bank’s risk management process.
The Board of Governors of the Federal Reserve System (the Fed) joined the SEC in suing and settling with JPMorgan Chase & Co., the registered bank holding company that owns and controls the bank.20 The Fed’s order did raise these deficiencies in risk management and
17 Annex A to SEC Order, 2. Under applicable accounting rules, the positions in the synthetic credit portfolio had to be marked “within the bid-ask spread” at the point that is “most representative of fair value in the circumstances,” with a particular emphasis on the price at which the traders could reasonably expect to transact. GAAP also allows for the use of midmarket pricing “as a practical expedient for fair value measurements within a bid-ask spread.”18 Annex A to SEC Order, 3.19 Annex A to SEC Order, 11.20 In addition to the SEC’s enforcement action, the Office of the Comptroller of the Currency, which regulates the national bank subsidiaries of the holding company, and the U.K. Financial Conduct Authority filed lawsuits against JPMorgan Chase, N.A., the bank subsidiary of JPMorgan.
oversight, in addition to concerns with the governance, finance, and internal audit functions of the company.21
As we argued in Macey and O’Hara (2003), the mismatch between the maturity and liquidity characteristics of banks’ assets and liabilities, banks’ unusually high leverage, and the moral hazard caused by such institutional features as the Fed’s discount window, deposit insurance, and the expectation of bailouts largely defined the unique corporate governance problems experienced by banks.22 These characteristics remain, but the JPMorgan London Whale debacle underscores an important new dimension of bank corporate governance problems: The opacity of bank activities, combined with the complexity of risk management activities involving the valua-tion and control of complex asset positions, creates significant monitoring difficulties for directors.23
Thus, a large part of the problem with JPMorgan appears to be that the firm’s directors lacked the special expertise neces-sary to evaluate the nature and quality of the information they were getting (or not getting) from managers (Pozen 2010). JPMorgan was not by any means the only financial institution whose board lacked sufficient industry and financial markets expertise. When Citibank teetered on the brink of insolvency, requiring a massive federal bailout, its board was “filled with luminaries from many walks of life—It boasted directors from a chemical company, a telecom giant, and a liberal arts university, for example. Yet in early 2008, only one of the independent directors had ever worked at a financial services firm—and that person was concurrently the CEO of a large entertain-ment firm” (Pozen 2010).
2.4 Dual Boards and the Oversight of Banks
Yet another governance challenge arises from the unique struc-ture of banks, which are largely controlled by holding companies. With the conversion of Goldman Sachs and Morgan Stanley to bank holding companies and financial holding companies during
21 Board of Governors of the Federal Reserve System Order of Assessment of a Civil Money Penalty Issued upon Consent Pursuant to the Federal Deposit Insurance Act, as Amended, September 19, 2013, http://www.federalreserve .gov/newsevents/press/enforcement/enf20130919a.pdf. 22 See Calomiris and Carlson (2014) for a discussion of the factors leading to bank corporate governance issues in the era predating deposit insurance. 23 See also Mehran, Morrison, and Shapiro (2011), who make similar complexity and opacity arguments in their analysis of governance problems in the financial crisis.
The opacity of bank activities, combined
with the complexity of risk management
activities involving the valuation and
control of complex asset positions,
creates significant monitoring difficulties
for directors.
FRBNY Economic Policy Review / August 2016 91
the financial crisis,24 every major bank in the United States is now organized as some form of bank holding company (BHC). A BHC is defined as a “company that owns and/or controls one or more U.S. banks or one that owns, or has controlling interest in, one or more banks. A bank holding company may also own another bank holding company, which in turn owns or controls a bank; the company at the top of the ownership chain is called the top holder.”25
Bank holding companies are, by definition, involved in the business of banking. In fact, bank holding companies are limited by law to activities that are “so closely related to banking as to be a proper incident thereto.”26 Because the BHC controls the bank, the monitoring and control of risk must take place at multiple levels. From a regulatory perspective, the Federal Reserve “is responsible for regulating and supervising bank holding compa-nies, even if the bank owned by the holding company is under the primary supervision of a different federal agency,” namely, the Office of the Comptroller of the Currency (OCC) or the Federal Deposit Insurance Corporation (FDIC).27 When assessing a BHC, however, the Fed will “work cooperatively” with the func-tional regulator of the subsidiary bank “to address information gaps or indications of weakness or risk identified in a supervised BHC subsidiary that are material to the Federal Reserve’s under-standing or assessment” of the BHC.28 This structure of
24 Goldman Sachs Group, Inc., a Delaware corporation, has operated as a bank holding company and a financial holding company since September 2008. It is regulated by the Board of Governors of the Federal Reserve System. Its U.S. depository institution subsidiary, Goldman Sachs Bank USA, is a New York State-chartered bank. Morgan Stanley has operated as a bank holding company and financial holding company under the Bank Holding Company Act since September 2008. It is regulated by the Board of Governors of the Federal Reserve System. See http://www.morganstanley .com/about/press/articles/6933.html. 25 Under § 2020.1.3.1 of the Bank Holding Company Act of 1956, administered by the Federal Deposit Insurance Corporation (FDIC), a bank holding company is defined as “any company which has control over any bank or over any company that is or becomes a bank holding company by virtue of this Act.” A company is defined as having control over a bank or over any company if
a. the company directly or indirectly or acting through one or more other persons owns, controls, or has power to vote 25 per centum or more of any class of voting securities of the bank or company;
b. the company controls in any manner the election of a majority of the directors or trustees of the bank or company; or
c. the Board determines, after notice and opportunity for hearing, that the company directly or indirectly exercises a controlling influence over the management or policies of the bank or company.
26 Bank Holding Company Act. 27 National Information Center, All Institution Types Defined. Available at http://www.ffiec.gov/nicpubweb/Content/HELP/Institution Type Description.htm. 28 The Board of Governors’ Division of Banking Supervision and Regulation,
Bank Holding Company Supervision Manual, § 1050.1.4.1.1 (2011).
supervision acknowledges that bank holding companies wield control over the banks they hold.
From a governance perspective, the holding company’s board inevitably exerts control over the banks within the holding company structure, particularly where, as is often the case, the directors of the bank holding company also sit as officers and directors of the bank. As such, it is each holding company director’s duty to control risk down to the level of the banks the BHC holds.29 This means that the directors of holding companies, like the directors of the banks themselves, must be involved in the governance, risk-management, and monitoring and oversight of the banks and bank affiliates within the holding company structure. The formal corporate separateness of BHCs and the banks they control does not release holding company directors from responsibility for the actions of their subsidiary banks even if some directors are on the board of a BHC but not on the board of the bank.30
Howell Jackson has observed that holding companies and the banks they own and control are not truly separate as a practical matter:
Within bank holding companies, there is a natural tendency of management to centralize decision-making power and resources in the parent bank or BHC. It is doubtful that manage ment would leave the bank and nonbank subsidiaries free to make the important business decisions as to activities, reinvestment of profits, and new markets. It is more likely that there would be significant centralization of decision making at the parent-company level, with management deciding what products and markets will be focused upon and how profits will be reallocated.31 (Jackson 1994)
Jackson also argues that this interrelatedness of banks and BHCs has increased over time:
Until twenty years ago [or twenty years prior to the publication of this article by Professor Jackson in 1994], financial holding companies . . . had relatively few affirmative obligations with respect to their regulated subsidiaries. . . . Over the past two decades however, financial holding companies have become increasingly embroiled in the regulatory supervision of subsidiary financial institutions. (Jackson 1994; interpolation ours)
29 For further discussion, see Bai (2011). 30 See, for example, Ellul and Yerramilli (2010, revised 2011) for a discussion of BHC directors’ crucial role in risk management of the entire organization. 31 See also Jackson and Symons (1999, 304).

92 A Proposal for the Post-Crisis World
Jackson posits that this increased interrelatedness re-flects a regulatory push to “transfer front-line supervisory responsibility from governmental agencies to financial holding companies,” a push prompted by the fact that “not only are financial holding companies apt to be more profi-cient than government officials in evaluating institutional behavior, but holding companies also can monitor risks at a lower cost than government agencies, because holding companies already have substantial information about their regulated subsidiaries as a result of ordinary managerial activities” (Jackson 1994, 513).
The Fed evaluates bank holding companies’ directors and senior executives based on their ability to identify, measure, and control risk, which includes those risks posed by the underlying banks. Thus, the Fed essentially treats bank holding companies and their bank affiliates as so in-extricably linked that, when evaluating BHCs, it analyzes the consolidated organization’s financial strength and risks. Additionally, the Fed can examine a bank holding company’s subsidiaries directly to “inform itself of the systems for monitoring and controlling risks to such depository institutions” (Macey, Miller, and Carnell 2001, 458).
Since both the holding company and the bank have boards of directors, a natural question is what role should each board play? Thomas C. Baxter, Jr., general counsel and executive vice president of the Legal Group at the Federal Reserve Bank of New York, addresses this point:
We want the governing body of the holding company to perform two critical functions. First, we want it to understand the risks to the “enterprise,” meaning the risks in all of the company’s constituent parts. Second, we want the holding company to take reasonable steps to manage those risks and keep them within acceptable limits. . . . As I see it, the public interest in the bank subsidiary is protected by a panoply of prudential laws and regulations. The ownership interest of the holding company in the bank is protected by the holding company’s ability to control the bank’s board of directors. (Baxter 2003, 1-3; emphasis added)
From both a regulatory perspective and a corporate governance perspective, bank safety and soundness is paramount. The well-known “source of strength” doctrine requires that bank holding companies provide financial support to their banking subsidiaries. In particular, § 225.142 of the Bank Holding Company Act provides that “in supervising the activities of bank holding companies, the Board has adopted and continues to follow the principle that bank holding companies should serve as a source of
strength for their subsidiary banks.” This notion pervades the BHCs’ corporate governance and directly impacts the relationship between the BHCs and their subsidiaries.
It is our contention that the Fed’s BHC regulations, the principles of corporate governance developed here, and basic concerns about systemic risk and bank safety all indicate that bank holding company officers and directors have fi-
duciary obligations that guide—and when necessary, trump—corporate form. Fiduciary duties flow not only to shareholders of the holding company but also to the corporate organization itself. Thus, the responsibility for bank safety and soundness must be shouldered both by holding company direc-tors and officers and by the directors and officers of their subsidiaries, particularly their bank subsidiaries.
Less clear, however, is how the shared responsibility between the holding company board and the bank board should work in practice in the post-crisis environment. On the one hand, it clearly makes no sense to say that bank holding company officers and directors can ignore issues of safety and soundness that affect their subsidiary banks on the grounds that they are fiduciaries of a different corporate entity, namely the holding company. On the other hand, the notion that the duties and obligations of holding company officers and directors and bank officers and directors are identical and wholly duplicative also appears problematic. To see why, consider the perspective of the OCC, the main regulator of nationally chartered banks, on its expectation for the sub-sidiary bank’s directors. The OCC argues that, “for its part, the primary duty of the subsidiary bank’s board of directors is to protect the bank.”32 This may be the view of the OCC, but it is inconsistent with the duties of the directors of bank holding companies, which require that directors of holding companies—like directors of other firms—maximize value for shareholders.
32 Office of the Comptroller of the Currency, The Director’s Book, October 2010 (reprinted September 2013), 26.
It is our contention that the Fed’s BHC
regulations, the principles of corporate
governance developed here, and basic
concerns about systemic risk and bank
safety all indicate that bank holding
company officers and directors have
fiduciary obligations that guide—and
when necessary, trump—corporate form.

FRBNY Economic Policy Review / August 2016 93
Unlike banks, bank holding companies are, from a state-law point of view, garden-variety corporations, with garden-variety fiduciary duties that are owed exclusively to shareholders. Not only are they subject to the same corporate gov-ernance rules as other companies, but also, unlike banks, which receive charters either from the OCC (national banks) or state bank regulators (state banks), holding companies are chartered by the same state chartering authorities as any other nonbank. For example, Citigroup, which owns a national bank, is chartered in the state of Delaware,33 as are Morgan Stanley34 and Goldman Sachs.35 Thus, there is a significant obstacle to making safety and soundness the primary duty of bank holding company directors or of bank holding companies. And these holding companies determine who sits on the boards of directors of the banks they own or control.
The problem is simple to describe. Because they are consid-ered to be directors of garden-variety corporations, holding company directors (and bank directors too, for that matter), ostensibly have no obligation to mitigate risk, but rather are tasked with maximizing the value of the companies on whose boards they sit. This rule makes perfect sense in the context of nonfinancial corporations, whose failure poses no systemic risk and whose shareholders can eliminate the firm-specific risk of the companies’ business activities easily and cheaply through diversification.
However, the federal government, if not the state govern-ments, wants banks and bank holding companies to refrain from engaging in excessive risk taking. Thus, bank holding company directors are pulled in opposite directions by the legal rules that govern their behavior. On the one hand, as estab-lished in this section, it is the clear policy of federal banking regulators, particularly the Fed, that holding companies—especially large holding companies whose operations pose systemic risks—should focus primarily on issues of safety and soundness. On the other hand, the state laws that impose fidu-ciary duties on the directors of all corporations, both banks and nonbanks, require all such directors to maximize the value of the firm, even if doing so causes the company to assume considerable risk. And, because of the low cost of leverage for federally insured banks and for systemically important fi-nancial institutions of all kinds, these fiduciary duties will channel directors toward tolerating, if not actively encouraging, risky capital structures and risky investment practices.
33 See Certificate of Incorporation of Citigroup, available at: http://www.citigroup.com/citi/investor/data/citigroup_rci.pdf.34 See Certificate of Incorporation of Morgan Stanley, available at: http://www.morganstanley.com/about/company/governance/certcomp.html.35 See Certificate of Incorporation of Goldman Sachs, available at: http://www.goldmansachs.com/investor-relations/corporate-governance/ corporate-governance-documents/re-stated-certificate.pdf.
One way to reconcile the apparent deep inconsistency between the fiduciary obligation of bank and bank holding company directors to maximize returns and their statutory and regulatory obligations to promote safety is to prioritize these conflicting dictates. The regulatory and statutory obligations come first. Managers and directors can only maximize profits to the extent that doing so does not conflict with relevant legal rules and regulations. As the influential American Law Institute Principles of Corporate Governance make clear, a corporation “is obliged, to the same extent as a natural person, to act within the boundaries set by law.”36 Or as Milton Friedman admonished, corporations are obligated “to make as much money as possible while
conforming to the basic rules of the society, both those embodied in law and those embodied in ethical custom.”37
In our view, the fact that banks and their officers and directors can only maximize profits within the limits of applicable law and regulations is an extremely important feature of the corporate governance landscape. Establishing and maintaining this hierarchy, however, does not resolve entirely the tension between profit maximization and the regulatory and social goals of achieving safer and sounder financial institutions. The reason is that, as we have seen over the past several decades, financial institutions still have latitude to engage in excessive risk taking even after they have complied with the law.
For example, banks must comply with the relevant rules regarding the maintenance of certain capital levels. But even after complying with such rules, banks have ample room to maneuver. For instance, they can, and do, invest in the risk-iest assets within a particular risk-weighting class. They also look for loopholes in regulations such as the Volcker Rule in order to squeeze the highest returns they can for their shareholders; of course, this quest for the highest returns involves risk, which is not something that regulators are interested in maximizing.
But the fiduciary duty to maximize profits is not the only obstacle to reaching the goal of incentivizing managers and directors of financial institutions to focus as intensely on keeping
36 American Law Institute, Principles of Corporate Governance, Section 2.01(b).37 Milton Friedman, “The Social Responsibility of Business Is to Increase Its Profits,” The New York Times Magazine, September 13, 1970.
Bank holding company directors are
pulled in opposite directions by the legal
rules that govern their behavior.
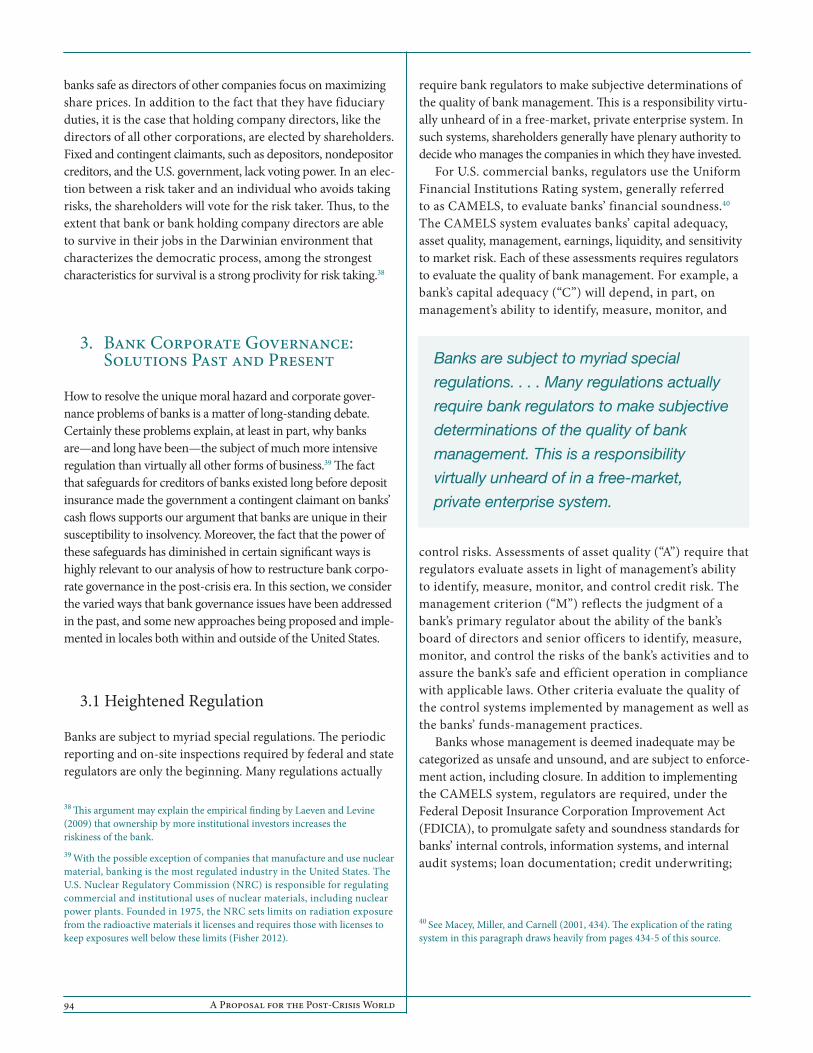
94 A Proposal for the Post-Crisis World
banks safe as directors of other companies focus on maximizing share prices. In addition to the fact that they have fiduciary duties, it is the case that holding company directors, like the directors of all other corporations, are elected by shareholders. Fixed and contingent claimants, such as depositors, nondepositor creditors, and the U.S. government, lack voting power. In an elec-tion between a risk taker and an individual who avoids taking risks, the shareholders will vote for the risk taker. Thus, to the extent that bank or bank holding company directors are able to survive in their jobs in the Darwinian environment that characterizes the democratic process, among the strongest characteristics for survival is a strong proclivity for risk taking.38
3. Bank Corporate Governance: Solutions Past and Present
How to resolve the unique moral hazard and corporate gover-nance problems of banks is a matter of long-standing debate. Certainly these problems explain, at least in part, why banks are—and long have been—the subject of much more intensive regulation than virtually all other forms of business.39 The fact that safeguards for creditors of banks existed long before deposit insurance made the government a contingent claimant on banks’ cash flows supports our argument that banks are unique in their susceptibility to insolvency. Moreover, the fact that the power of these safeguards has diminished in certain significant ways is highly relevant to our analysis of how to restructure bank corpo-rate governance in the post-crisis era. In this section, we consider the varied ways that bank governance issues have been addressed in the past, and some new approaches being proposed and imple-mented in locales both within and outside of the United States.
3.1 Heightened Regulation
Banks are subject to myriad special regulations. The periodic reporting and on-site inspections required by federal and state regulators are only the beginning. Many regulations actually
38 This argument may explain the empirical finding by Laeven and Levine (2009) that ownership by more institutional investors increases the riskiness of the bank.39 With the possible exception of companies that manufacture and use nuclear material, banking is the most regulated industry in the United States. The U.S. Nuclear Regulatory Commission (NRC) is responsible for regulating commercial and institutional uses of nuclear materials, including nuclear power plants. Founded in 1975, the NRC sets limits on radiation exposure from the radioactive materials it licenses and requires those with licenses to keep exposures well below these limits (Fisher 2012).
require bank regulators to make subjective determinations of the quality of bank management. This is a responsibility virtu-ally unheard of in a free-market, private enterprise system. In such systems, shareholders generally have plenary authority to decide who manages the companies in which they have invested.
For U.S. commercial banks, regulators use the Uniform Financial Institutions Rating system, generally referred to as CAMELS, to evaluate banks’ financial soundness.40 The CAMELS system evaluates banks’ capital adequacy, asset quality, management, earnings, liquidity, and sensitivity to market risk. Each of these assessments requires regulators to evaluate the quality of bank management. For example, a bank’s capital adequacy (“C”) will depend, in part, on management’s ability to identify, measure, monitor, and
control risks. Assessments of asset quality (“A”) require that regulators evaluate assets in light of management’s ability to identify, measure, monitor, and control credit risk. The management criterion (“M”) reflects the judgment of a bank’s primary regulator about the ability of the bank’s board of directors and senior officers to identify, measure, monitor, and control the risks of the bank’s activities and to assure the bank’s safe and efficient operation in compliance with applicable laws. Other criteria evaluate the quality of the control systems implemented by management as well as the banks’ funds-management practices.
Banks whose management is deemed inadequate may be categorized as unsafe and unsound, and are subject to enforce-ment action, including closure. In addition to implementing the CAMELS system, regulators are required, under the Federal Deposit Insurance Corporation Improvement Act (FDICIA), to promulgate safety and soundness standards for banks’ internal controls, information systems, and internal audit systems; loan documentation; credit underwriting;
40 See Macey, Miller, and Carnell (2001, 434). The explication of the rating system in this paragraph draws heavily from pages 434-5 of this source.
Banks are subject to myriad special
regulations. . . . Many regulations actually
require bank regulators to make subjective
determinations of the quality of bank
management. This is a responsibility
virtually unheard of in a free-market,
private enterprise system.

FRBNY Economic Policy Review / August 2016 95
interest rate exposure; asset growth; compensation, fees, and benefits; and asset quality, earnings, and stock valuation.41
Bank regulators also have the power to remove officers and directors, to ban these persons from ever working for a bank, and to impose civil monetary penalties against a banking in-stitution and its affiliates. So-called prompt corrective-action powers allow regulators to regulate every significant opera-tional aspect of a bank.42 This oversight means that corporate governance is no longer the ambit of the bank’s owners, but rather is conducted through an odd (at least relative to other firms) shared-custody arrangement with the regulators.
There are clearly problems with this hybrid approach. As ob-served previously, replacing private sector creditors with public sector regulators as the first line of defense against bank fraud and self-dealing creates two problems. First, private sector cred-itors have stronger incentives than public sector regulators to monitor closely for fraud and self-dealing because the creditors’ own money is on the line, while the regulators’ money is not. Unlike regulators, private sector creditors will monitor until the losses avoided from such monitoring equal the marginal cost of such activity. Second, because of the lack of private sector
market discipline, insufficient incentives exist for bankers to develop mechanisms for providing depositors and creditors with credible assurances that they will refrain from fraudulent activities (Macey and O’Hara 2003, 98-99).
These difficulties may explain why even embedding regula-tors in the bank has not proved effective. Rather than reporting to an office in a government building, embedded regulators work inside the private sector institutions to which they have been assigned. At JPMorgan Chase, approximately forty examiners from the Federal Reserve Bank of New York and seventy examiners from the OCC were embedded in the bank at the time of the London Whale episode. Yet, the trading losses from that episode were not monitored by embedded regula-tors because the regulators did not embed any examiners in the unit’s offices in either London or New York. Instead, the
41 12 U.S.C. § 1831p-1.42 As a practical matter, the FDIC’s power to revoke a bank’s deposit insurance conveys similar power.
unit was examined periodically by embedded examiners from other offices of the firm.
The relative lack of oversight of JPMorgan’s Chief Investment Office by the legion of regulators embedded in the bank ap-parently was the result of a lack of understanding of what the office did. Generally speaking, banks’ investment offices, known as Treasury units, restrict their activities to hedging and making low-risk, short-term investments with cash on hand. In contrast, the Treasury unit at JPMorgan had a portfo-lio of almost $400 billion. Far from limiting itself to hedging, the unit had become a profit center that made large bets and claimed to have recorded $5 billion in profit over the three years through 2011.43 This episode strongly suggests that there are limits to the efficacy of embedded regulators in curtailing risk in the bank.
Section 165(h) of Dodd-Frank requires the Fed to issue regulations requiring systemically important financial institu-tions (SIFIs) and publicly traded bank holding companies to establish risk committees. Risk committees must have a formal written charter approved by the board of directors, must meet regularly, and must fully document their meetings and their risk management decisions. The specific responsibility of a SIFI’s risk committee is to oversee:
an enterprise-wide risk management framework, which will vary based on [the SIFI’s] complexity, size, and inherent level of risk posed to the U.S. financial system. This framework would include (1) risk limitations appropriate to each business line of the company; (2) appropriate policies and procedures for risk management governance, practices, and infrastructure; (3) processes and systems for identifying and reporting risks; (4) monitoring compliance and implementing timely corrective actions; and (5) integrating risk management and control objectives with management’s goals and the company’s compensation structure.44
These risk committees must take responsibility for the oversight of enterprise-wide risk management practices of the company, have at least one director with expertise in risk management, and be chaired by an independent director. Risk committees face certain procedural requirements.
43 These standards would also apply to insured federal savings associations and to insured federal branches of foreign banks with average total consolidated assets of $50 billion or more. See Silver-Greenberg and Protess (2012).44 Paul Hastings LLP Global Banking and Payment Systems Practice, “Federal Reserve Unveils Proposal on Dodd-Frank Enhanced Prudential Requirements and Early Remediation Requirements,” January 2012, available at http://www.paulhastings.com/Resources/Upload/Publications/2082.pdf (accessed May 19, 2014).
Dodd-Frank requires the Fed to issue
regulations requiring systemically
important financial institutions (SIFIs) and
publicly traded bank holding companies
to establish risk committees.

96 A Proposal for the Post-Crisis World
In order for a director to qualify as independent, the company must indicate in its securities filings that the director satisfies the independence requirements established by the exchange on which the company’s securities are listed. For companies whose shares are not publicly traded in the United States, the proposed rule provides that “the director is independent only if the company demonstrates to the satisfaction of the Federal Reserve that such director would qualify as an independent director under the listing standards of a securities exchange, if the company were publicly traded on such an exchange.” Other specific requirements for risk committees are that they must report directly to the firm’s board of directors, and not be a part of any other committee of the board, such as the audit committee. The director of the risk committee must not be an employee of the bank holding company and must not have been an officer or employee of the bank holding company during the previous three years. It
would seem appropriate for the members of the risk committee, including the director of the risk committee, also to be members of the board of directors of the bank. Of course, the director of the risk committee would have to be an independent board member of the holding company, because employees of the holding company are prohibited from serving on the risk committee. Overlap between board members of the holding company and the subsidiary bank will ensure that information flows freely from the subsidiary to the parent and that the local knowledge and expertise of parent-company directors and officers are available to the bank.
In addition to requiring that bank holding companies and SIFIs have risk committees, Section 165(h) of Dodd-Frank states that the boards of directors of such companies must appoint a chief risk officer (CRO) to develop and maintain risk-management practices for the entire firm. Specifically, the CRO is responsible for (1) allocating responsibility for monitor-ing and compliance with delegated risk limits; (2) establishing appropriate policies and procedures for risk management gover-nance, practices, and controls; (3) developing processes and systems for identifying and reporting risks; (4) monitoring and testing these controls; and (5) ensuring that risk management issues are effectively resolved in a timely manner. The CRO’s risk management expertise should be appropriate to the company’s
capital structure, complexity, activities, and size. Additionally, this officer would report directly to the risk committee and CEO and have a compensation structure designed to provide an objective assessment of the risks taken by the company.45
Further, with respect to requirements on boards of direc-tors, on January 16, 2014, the OCC proposed minimum standards for the design and implementation of risk gover-nance frameworks by large insured national banks, and minimum standards for boards of directors in overseeing the frameworks’ design and implementation.46 The OCC also pro-posed a new statute authorizing the agency to prescribe operational and managerial standards for national banks and federal savings associations.47 This proposal represents a new, and remarkably detailed, regulatory mandate regarding bank governance activities and responsibilities.
In its request for public comments on its proposed minimum standards, the OCC observed that “since large banks are often one of several legal entities under a complex parent company, each bank’s board must ensure that the bank does not function simply as a booking entity for its parent, and that parent-company decisions do not jeopardize the safety and soundness of the bank. This often requires separate and focused governance and risk management practices.”48
The OCC proposal articulates several other expectations. These include the expectation that large institutions have a “well-defined personnel management program that ensures appropriate staffing levels, provides for orderly succession, and provides for compensation tools to appropriately motivate and retain talent, [and] that does not encourage imprudent risk taking,”49 and a requirement that institutions define and communicate “an acceptable risk appetite across the organization, including measures that address the amount of capital, earn-ings, or liquidity that may be at risk on a firmwide basis, the amount of risk that may be taken in each line of business, and
45 Paul Hastings LLP Global Banking and Payment Systems Practice, “Federal Reserve Unveils Proposal,” Insights, January 5, 2012, available at http://www.paulhastings.com/publications-items/details/?id =9629de69-2334-6428-811c-ff00004cbded.46 Office of the Comptroller of the Currency, “OCC Guidelines Establishing Heightened Standards for Certain Large Insured National Banks, Insured Federal Savings Associations, and Insured Federal Branches; Integration of 12 CFR Parts 30 and 170.” 79 Federal Register, Part VI, 54517-49; 12 CFR Parts 30, 168, and 170 (September 11, 2014). The guidelines would be issued and enforceable under Section 39 of the Federal Deposit Insurance Act, which authorizes the OCC to prescribe safety and soundness standards. 12 U.S.C. § 1831p-1.47 OCC Guidelines, 5.48 OCC Guidelines, 5.49 OCC Guidelines, 5.
Overlap between board members of the
holding company and the subsidiary bank
will ensure that information flows freely
from the subsidiary to the parent.

FRBNY Economic Policy Review / August 2016 97
the amount of risk that may be taken in each key risk category monitored by the institution.”50
Additionally, the OCC “expects institutions to have reliable oversight programs, including the development and mainte-nance of strong audit and risk management functions. This expectation involves institutions comparing the performance of their audit and risk management functions to the OCC’s standards and leading industry practices and taking appropri-ate action to address material gaps.”51 The OCC proposal also “focuses on the board of directors’ willingness to provide a credible challenge to bank management’s decision-making and thus requests independent directors to acquire a thorough understanding of an institution’s risk profile and to use this information to ask probing questions of management and to ensure that senior management prudently addresses risks.”52
A bank can use its parent company’s risk governance profile to satisfy the OCC’s new guidelines if the parent’s risk profile is substantially the same as its own risk profile.53 If not, the bank must come up with its own risk governance framework. A bank may, in consultation with OCC examiners, use components of its parent’s risk governance framework but should ensure that the risk profile of the bank is easily distinguished and separate from that of its parent for risk management and supervisory re-porting purposes, and that the bank’s safety and soundness is not jeopardized by decisions made by the parent’s board of directors and management.54
The OCC’s guidelines also set out minimum standards for the design and implementation of banks’ frameworks for risk management. Every bank would have to establish and adhere to a formal, written framework that covers: (1) credit risk, (2) interest rate risk, (3) liquidity risk, (4) price risk, (5) operational risk, (6) compliance risk, (7) strategic risk, and (8) reputation risk. Each bank’s framework must also account for the risks to the bank’s earnings, capital, liquidity, and reputation that arise from all of its activities.
50 OCC Guidelines, 5.51 OCC Guidelines, 5-6.52 OCC Guidelines, 6.53 The risk profiles of a parent company and a bank would be considered substantially the same if, as of the most recent quarter-end Federal Financial Institutions Examination Council Consolidated Report of Condition and Income, or Call Report, the following conditions are met: (1) the bank’s average total consolidated assets represent 95 percent or more of the parent company’s average total consolidated assets; (2) the bank’s total assets under management represent 95 percent or more of the parent company’s total assets under management; and (3) the bank’s total off-balance-sheet exposures represent 95 percent or more of the parent company’s total off-balance-sheet exposures (“OCC Guidelines,” 11).54 “OCC Guidelines,” 11.
The OCC identifies three “lines of defense” for bank risk: front-line units, independent risk management, and internal audit. The three units should remain independent of one another. The bank’s board of directors and its CEO retain sub-stantial responsibility for risk management. But, as a law firm with substantial experience in representing banks before the OCC has observed, “if adopted as proposed, the Guidelines’ detailed requirements regarding roles, responsibilities, and reporting structures would represent a significantly enhanced level of regulatory intervention into bank management and internal processes.”55
The OCC’s proposed guidelines impose specific risk-management-related responsibilities on the CEO and new standards for banks’ boards of directors.56 These board standards stipulate that:
1. Each member of the bank’s board of directors has a duty to oversee the bank’s compliance with safe and sound banking practices. Consistent with this duty, the board of directors should ensure that the bank establishes and implements an effective risk governance framework that meets the minimum standards described in these guidelines. The board of directors or the board’s risk committee should approve any changes to the risk governance framework.
2. The bank’s board of directors actively oversees the bank’s risk-taking activities and holds management accountable for adhering to the risk governance framework. In providing active oversight, the board of directors should question, challenge, and when necessary, oppose recommendations and decisions made by management that could cause the bank’s risk profile to exceed its risk appetite or jeopardize the safety and soundness of the bank.
3. When carrying out his or her duties, each member of the board of directors should exercise sound, independent judgment.
55 Sullivan and Cromwell, LLP, “Heightened Risk Governance Standards for Banks and Bank Boards of Directors: Proposed OCC ‘Guidelines’ Would Establish Heightened Standards for Large National Banks’ Risk Governance Frameworks and Boards of Directors, and Accelerate Trends of Regulatory Involvement and Reliance on Enforcement,” January 21, 2014, at 2, available at https://www.sullcrom.com/files/Publication/5a0f2ae7-09cf-4f18-a9be -5910c9775b0b/Presentation/PublicationAttachment/559b34e5-b3b6 -43a1-ac66-619e6d61d4e6/SC_Publication_Heightened_Risk_Governance _Standards_for_Banks_and_Bank_Boards_of_Directors.pdf.56 Under the OCC guidelines, the CEO is responsible for developing a strategic plan of at least three years that includes a comprehensive assessment of risks to the bank during the time period covered by the plan, along with an explanation of how the bank will update the framework to account for changes in the bank’s risk profile. The strategic plan must be approved by the bank’s board of directors and reviewed, updated, and approved to reflect changes in the bank’s risk profile or operating environment. The CEO is also required to oversee the day-to-day activities of the chief risk executive and the chief accounting executive.

98 A Proposal for the Post-Crisis World
4. At least two members of the board of directors should not be members of (either) the bank’s management or the parent company’s management.57
5. The board of directors should establish and adhere to a formal, ongoing training program for independent directors. This program should include training on (a) complex products, services, lines of business, and risks that have a significant impact on the bank; (b) laws, regulations, and supervisory requirements applicable to the bank; and (c) other topics identified by the board of directors.58
6. The bank’s board of directors should conduct an annual self-assessment that includes an evaluation of its effectiveness in meeting the standards for directors contained in section III of the OCC guidelines.59
The OCC’s proposed rule posits that “one of the primary fiduciary duties of a Bank’s Board is to ensure that the institu-tion operates in a safe and sound manner.” As Sullivan and Cromwell’s memorandum points out,
This statement is troublesome in multiple respects. First, it provides that the Board has an obligation to “ensure” a result, which is a standard that is beyond existing law and often achievability. Second, there may be an implicit suggestion that this “fiduciary duty” is owed to someone, e.g., the OCC, other than the shareholder(s). Third, the statement suggests that there is a separate fiduciary duty beyond the two widely recognized duties of loyalty and care.60
The OCC also asserts that boards of directors of national banks “must ensure . . . that parent company decisions and ‘complex banking structures’ do not jeopardize the safety and soundness of the bank.”61 This is a strange assertion in light of the fact that it is the Fed, and not the OCC, that regulates the
57 The OCC requests comment regarding the composition of a bank’s board, including whether the minimum number of two independent directors required under the guidelines is the appropriate number, whether there are other standards the OCC should consider to ensure the board’s composition is adequate to provide effective oversight of the bank, and whether there is value in requiring the bank to maintain its own risk committee and other committees, as opposed to permitting the bank’s board to leverage the parent’s board committees.58 This requirement is along the lines of a policy suggested by Acharya et al. (2009) that independent board members be educated in the operational details and complex procedures of large complex financial institutions.59 “OCC Guidelines,” 75-8.60 Sullivan and Cromwell, 11.61 “OCC Guidelines,” 75.
parent companies of banks. Given this fact, it is not clear how this could be accomplished.”62
The OCC’s proposed guidelines represent the most complete articulation to date of the expectations that regulators have for bank directors with regard to ensuring the safety and soundness of banks. These guidelines raise more questions than they answer. In particular, there is no indication of where profit maxi-mization fits into the OCC’s vision of bank corporate governance. Even more significantly, there is no indication of how the com-peting duties and responsibilities of bank and holding company directors are to be reconciled. In other words, as so often is the case, the regulations purport to compel behavior without taking into account the incentives of the regulated officers and directors. This is particularly relevant in light of the fact that officers and di-rectors of banks likely are interested in such things as promotions, compensation, and continued tenure in their jobs—and it is the holding companies, not the OCC, that controls these matters.
3.2 Multiple Liability for Bank Shareholders
The system of double and sometimes triple liability for bank shareholders was an ingenious device for dealing with banks’ moral hazard and balance sheet instability. In the late nine-teenth century, decades before deposit insurance was introduced, states imposed double, triple, and, in the cases of New Hampshire and Pennsylvania, even unlimited “joint and several liability”63 on bank shareholders. These state laws pre-vented the issuance of corporate charters to banks whose shareholders did not agree to pay up to the amount of their original investment into the estate of the bank if it ever should become insolvent. The National Bank Act of 1863 extended this liability regime to shareholders in national banks, requir-ing that “each shareholder shall be liable to the amount of the par value of the shares held by him, in addition to the amount invested in such shares.”64
The historical system of multiple liability for bank share-holders did more than protect depositors and other creditors from the consequences of bank failure ex post. It also had the effect of reducing moral hazard ex ante because shareholders, who controlled banks’ boards of directors, realized that they would be personally liable for much, if not all, of the negative
62 Sullivan and Cromwell, 11.63 Joint and several liability is a liability designation in civil cases that provides that all defendants are responsible individually, as well as collectively, for 100 percent of the damages. Successful plaintiffs in cases in which joint and several liability is imposed may elect to collect the entire judgment from a single party, or from multiple parties in various amounts.64 National Banking Act of 1863, Ch. 58, 12 Stat. 665.

FRBNY Economic Policy Review / August 2016 99
consequences of excessive risk taking. And multiple liability worked to stem depositors’ losses in the Great Depression, despite the very large number of bank failures.65 In other words, shareholders, not depositors, internalized the costs of bank failures before the Banking Act of 1933 initiated de jure deposit insurance for all deposit accounts under the statutory
limit (currently $250,000).66 Deposit insurance made the pre-Depression multiple liability regimes unnecessary from the point of view of many depositors. On the supply side, the credit enhancement for depositors provided by multiple liability was replaced by the credit enhancement provided by deposit insurance. As a result, banks no longer faced the same demand for a mechanism to signal that they would keep moral hazard in check. By 1935, the federal and state multiple liability regimes had been eliminated.67
To a very large extent, all of the modern banking regula-tions that we observe, including capital requirements, reserve requirements, enhanced supervision, embedded regulators, and prompt intervention, have arisen because much of the cost of bank failure has shifted from bank shareholders to bank regulators.
3.3 Capital and Liquidity Requirements
In general, there are no laws requiring companies to main-tain any particular level of capital as a protective cushion for creditors and other constituencies. Of course, this is not the case in banking. Capital requirements of various sorts,
65 During the period of the Great Depression (1929-1933), although 9,000 banks failed or suspended operations, depositor losses amounted to only $1.3 billion, a figure that pales in comparison to the $85 billion in losses borne by holders of common and preferred stock over the same timeframe (Friedman and Schwartz 1963, 440). During the Depression era, the number of banks in the United States fell from 24,633 to 15,015, a decline of 39 percent. The 5,712 banks that failed during this time had total deposits of $1.6 billion. Total losses to depositors were $565 million, which was 1 percent of average deposits during this period (Calomiris 2013, 166).66 Macey and O’Hara (2003, 100).67 Macey and O’Hara (2003, 100).
including simple limits on overall leverage and various forms of risk-based capital rules, are a standard feature of bank regulation. The purpose of these capital requirements is to reduce the probability of failure and to reduce moral hazard by forcing bank shareholders to bear a larger share of the losses experienced by the claimants on the cash flows of distressed firms.
Along with most observers, we are of the view that re-quiring appropriate levels of capital is critical to achieving a safe and sound banking system. Unfortunately, we also believe, for several reasons, that reasonably stringent bank capital requirements, while important, are only part of a properly functioning regulatory and governance system. Among our concerns about relying too heavily on bank capital requirements to avoid the financial meltdowns associ-ated with banking crises is that “banks can respond to higher capital requirements in ways that make them less rather than more safe.”68 For example, banks avoid com plying with the spirit of higher capital requirements by selling risky assets to “off-balance-sheet” entities, such as Structured Investment Vehicles (SIVs) and Variable Interest Entities (VIEs). Banks also can limit the effectiveness of higher capital requirements by investing in increasingly risky assets. Doing this increases the expected returns on whatever new levels of capital are required. This strategy is effective because risk weightings are distributed among rather crude categories of assets and often do not adequately reflect the true risk of the assets in a particular risk-weighting category, either because the chosen weights are wrong or because the categories are too broad.69
Another problem with bank capital requirements is that capital levels do not adjust at nearly the same speed at which assets can deteriorate. Many examples from the 2008 financial crisis illustrate this observation, as financial firms that were considered well-capitalized became insolvent in days, some-times in mere hours. During the financial crisis, a number of financial institutions saw their capital levels, as expressed as Tier 1 common equity, erode by more than 500 basis points.70 A study by the Federal Reserve has shown that even the higher proposed levels of capital used in the Basel III rules, which establish a minimum Tier 1 common equity plus the conserva-tion buffer of 7 percent for most banks and 8 to 9.5 percent for systemically important financial institutions, would not have been sufficient for some banks.71
68 Elliott (2010, 17).69 Hoenig (2013).70 Rosengren (2013, Figure 1).71 Rosengren (2013).
To a very large extent, all of the
modern banking regulations that we
observe . . . have arisen because much
of the cost of bank failure has shifted
from bank shareholders to bank regulators.

100 A Proposal for the Post-Crisis World
Thus, bank capital requirements need to be set in coordina-tion with other regulations and with a good system of supervision and examinations, ideally aided by transparent accounting that allows the capital markets and ratings agen-cies to form their own judgments about the true riskiness of the activities of the banks. Simply put, “high capital levels alone are not enough.”72
Bank liquidity requirements raise similar issues. The OCC, the Board of Governors of the Federal Reserve System, and the FDIC recently issued a notice of proposed rulemaking that would impose a quantitative liquidity requirement consistent with the liquidity coverage ratio established by the Basel Committee on Banking Supervision.73 The liquidity coverage ratio proposal would apply to specified financial companies with $250 billion or more in total consolidated assets or $10 billion or more in on-balance-sheet foreign exposure; to systemically important nonbank financial institutions; and to banking subsidiaries of one of these companies that have assets of $10 billion or more. The purpose of the proposed liquidity coverage ratio is to strengthen the liquidity risk management of the companies to which it applies by requiring them to keep certain levels of high-quality liquid assets in order to meet the proposed rule’s quantitative liquidity standard. The quantitative liquidity standard is the ratio of a company’s high-quality liquid assets to its projected net cash outflows over a thirty-day period. A company would have to cal-culate and maintain a liquidity coverage ratio equal to or greater than 1.0 on each business day.74
In our view, the proposed liquidity requirements, like the capital ratios discussed above, are not a panacea for the broad societal externalities created by bank crises. While liquidity is important, liquidity does not measure solvency. It measures only the ability of a firm to meet its short-term, immediate require-ments for cash. Still more is needed.
3.4 Enhanced Duty of Care
Another important way that bank regulation and bank corpo-rate governance standards differ from those of other types of corporations is that bank directors have historically been held
72 Rosengren (2013).73 See Federal Reserve, “Notice of Proposed Rulemaking,” available at http://www.regulations.gov/#!documentDetail;D=FRS-2013-0354-0001. 74 “Liquidity Coverage Ratio: Liquidity Risk Measurement, Standards, and Monitoring” (PDF): See “Basel III: International Framework for Liquidity Risk Measurement, Standards, and Monitoring,” December 2010, available at http://www.bis.org/publ/bcbs188.pdf , and “Basel III: The Liquidity Coverage Ratio and Liquidity Risk Monitoring Tools,” January 2013, available at http://www.bis.org/publ/bcbs238.pdf .
to higher standards than other directors.75 Specifically, the fidu-ciary duty of care, which is the duty to make reasonable, fully informed decisions and to engage in the levels of monitoring and oversight of risk that are sufficient to the particular needs of the business, has been enforced more strictly against bank di-rectors than directors of other companies. Courts attribute their tougher enforcement of directors’ duties to the fact that “banks are charged with serving the public interest, not just the inter-ests of the shareholders.”76
It is highly significant, in our view, that courts have histori-cally held directors of banks not merely to the standard to which they held other corporate directors, but to a higher stan-dard that encompassed the concept of professionalism. Courts would, for example, impose personal liability on bank directors who approved transactions that were deemed to be “so improvi-dent, so risky, so unusual and unnecessary as to be contrary to fundamental conceptions of prudent banking practices.”77 Requiring bank directors to conform to prudent banking prac-tices brought the standards for bank directors close to the standards imposed on professionals such as doctors and engi-neers. These professionals must perform their functions to the standards generally held by those in their profession.
In contrast, in the corporate world in general, directors and officers are required to act and to make decisions in the same manner as a reasonable person would believe appropriate under similar circumstances.78 Put simply, directors of most U.S. corporations are held to the same negligence standard as people participating in any amateur activity, such as recre-ational golf or pleasure driving. Conduct that meets the standards expected of nonprofessionals is all that is required.
As noted above, this low standard for director conduct stands in sharp contrast to the conduct required of professionals. The Financial Institutions Reform, Recovery, and Enforcement Act of 1989 (FIRREA)79 formally eliminated from U.S. common law the notion of higher standards for bank directors:
A director or officer of an insured depository institution may be held personally liable for monetary damages . . . for gross negligence, including any similar conduct or conduct that demonstrates a greater disregard of a duty of care (than gross negligence) including intentional
75 Macey and O’Hara (2003, 111).76 Macey and O’Hara (2003, 111).77 Litwin v. Allen, 25 N.Y.S. 2d 667 (1940).78 Model Business Corporation Act, § 8.30(b). 79 12 U.S.C. § 1821(k).

FRBNY Economic Policy Review / August 2016 101
tortious conduct, as such terms are defined and determined under applicable State law.80
By affirming that bank directors need only meet the standard of gross negligence for personal liability, FIRREA removed a potentially effective mechanism for incentivizing bank directors to consider the risk posed by banks to the greater financial system. We will return to this issue in the next section, but we note for now that the notion that U.S. bank directors could (and should) face higher burdens than other directors has long antecedents.
3.5 Global Approaches—Duty of Trust and Strict Liability
Outside the United States, bank directors have faced significantly higher burdens, with some jurisdictions viewing bank failures as a criminal offense on the part of directors. Brazil, for example, holds banks’ executives and directors personally liable for the debts of failed institutions even when no fault is proven.81 The U.K. government, following on the recommendation of the Parliamentary Commission on Banking Standards, recently introduced a new criminal offense for reckless misconduct in the management of a bank. This criminal liability would apply to both executive and non-executive directors of a bank.82 The maximum sentence for the offense is seven years in prison, an unlimited fine, or both.
The notion that “reckless management” is a crime is rather alien to the U.S. perspective that business failure is not a criminal offense but rather a natural, albeit unfortunate, outcome of busi-ness judgment in an uncertain world. In our view, criminalizing bank failure is not a viable approach to resolving the difficulties of bank corporate governance. It does, however, change the calculus for bank directors with respect to the acceptable level of risk for a financial institution.
A similar change in calculus can arise from the concept found in Germany, Switzerland, and Austria called Untreue. This “breach of trust” is defined as “a derogation of duty that causes real harm to the institution,” and it has been the basis for charges against bankers at WestLB, BayernLB, HSH Nordbank,
80 12 U.S.C. § 1821(k).81 “Prosecuting Bankers: Blind Justice,” The Economist, May 4, 2013.82 HM Treasury, “Financial Services (Banking Reform) Bill, Government Amendments: Criminal Sanctions,” October 2013, available at https://www .gov.uk/government/uploads/system/uploads/attachment_data/file/245758/HoL_Policy_Brief_-_Criminal_Sanctions.pdf.
and Sal. Oppenheim.83 Indeed, the chief executive officer of WestLB paid a fine of 150,000 euros to settle charges relating to breach of trust. More intriguing are the cases involving board members of these failed financial institutions. The management board of the German bank HSH Nordbank went on trial for breach of trust stemming from risk man-agement failures relating to a collateralized debt obligation (CDO) and other off-balance-sheet activities that resulted in the bank having to be bailed out to the tune of 30 billion euros.84 This case, which represented the first time German prosecutors had tried to blame an entire board for a bank’s failure, ended in an acquittal for all defendants.85 Similarly, seven former directors of Landesbank Baden-Württemberg, or LBBW, Germany’s largest public sector lender, were charged with breach of trust in connection with moving risky assets to special purpose vehicles allegedly to hide the riskiness of the bank. This case ended in settlement, with the directors of LBBW agreeing to make contributions to charity in lieu of fines.86
In the United States, bank directors and managers can be criminally prosecuted for fraud and for violating federal securities laws or provisions of those laws, and such was the fate that befell more than 800 bankers jailed in the aftermath of the savings-and-loan crisis. But pursuing such cases, particularly against bank directors, is notoriously difficult owing to the challenge of linking wrongdoing to those actually running the bank.87 The rarity of this outcome means that bank director behavior is unlikely to be affected.
What is clear from this review is that corporate gover-nance problems are remarkably resilient. While some approaches have been more successful than others, in general even the most extreme outside constraints have failed to resolve bank governance problems. In our view, this suggests that it would be wise to use a new approach, one that explicitly recognizes the inherent difficulty of man-aging and controlling risk in the post-crisis era.
83 HM Treasury, “Financial Services Bill.” 84 This duty of trust does not just attach to financial firms. Board members of the German firm Mannesmann were also charged with Untreue in connection with that firm’s takeover by Vodaphone last year. See “Breach of Trust? German Corporate Governance is Literally on Trial,” The Economist, February 20, 2013.85 For details on this verdict, see http://www.dw.com/en/hsh-nordbank -executives-acquitted-for-financial-crisis-wrongdoing/a-17769276. 86 “German Court Closes LBBW Bank Case with Settlement,” Reuters, April 24, 2014, available at http://www.reuters.com/article/ lbbw-courts-idUSL6N0NG3BF20140424.87 “Prosecuting Bankers: Blind Justice,” The Economist.

102 A Proposal for the Post-Crisis World
4. Bank Governance in the Post-Crisis World: A Proposal
Several factors suggest that it may be time to impose a more rig-orous standard on the directors of certain financial institutions, particularly those institutions deemed to be systemically import-ant by regulatory authorities. The fact that an institution is systemically important seems to us reason enough to expect di-rectors of such institutions to be able to perform their functions at the level of other directors at comparable financial institutions. The vast complexity not only of the businesses of banking and finance but also of the laws and regulations that govern financial institutions, particularly in the wake of Dodd-Frank, provide ad-ditional support for the argument that bank directors should be held to higher standards than the amateur standard that governs directors generally. Our proposal here is particularly relevant for directors of bank holding companies, who currently face no special requirements as to qualifications.88
While our proposal that bank directors should have special expertise is new, the idea that corporate directors in general should have special expertise is not new, though the idea has not been well developed in the literature. Some scholars define the term “professional director” simply as a director who serves on multiple boards and adduce evidence that board membership of such professional directors correlates with improved performance for the companies on whose boards those directors serve.89 Others use the term “professional” to refer to the particular, industry-specific expertise that certain directors have.90 We use the term in the latter sense.
Among the earliest and most persuasive arguments for requir-ing corporate directors to have substantial industry-specific expertise was made by Yale law professor and future Supreme Court Justice William O. Douglas. Douglas (1934) argued that experts on the board “would be invaluable . . . in determining the course of conduct for the managers” and would be “better quali-fied to determine financial and commercial policy.” For these reasons, Douglas argued that outside experts on boards of
88 Interestingly, directors of subsidiary banks do face additional requirements. For example, the OCC notes in The Director’s Book that “In addition to the citizenship and residency requirements contained in 12 USC 72, the qualifications of a candidate seeking to become a member of the board of directors of a national bank include (1) basic knowledge of the banking industry, the financial regulatory system, and the laws and regulations that govern the operation of the institution; (2) willingness to put the interests of the bank ahead of personal interests; (3) willingness to avoid conflicts of interest; (4) knowledge of the communities served by the bank; (5) background, knowledge, and experience in business or another discipline to facilitate oversight of the bank; and (6) willingness and ability to commit the time necessary to prepare for and regularly attend board and committee meetings (Office of the Comptroller of the Currency 2010, 4).89 Keys and Li (2005).90 Pozen (2010).
directors “should have a position of dominance and power on the board” so that they could “make their directive influence effective” by means of their “real power over executive management.” In arguing for directors with sufficient industry expertise, Robert Pozen has observed,
Lack of expertise among directors is a perennial problem. Most directors of large companies struggle to properly understand the business. Today’s companies are engaged in wide-ranging operations, do business in far-flung locations with global partners, and operate within complex political and economic environments. Some businesses, retailing, for one, are relatively easy to fathom, but others—aircraft manufacture, drug discovery, financial services, and tele communications, for instance—are technically very challenging. I remember catching up with a friend who had served for many years as an independent director of a technology company. The CEO had suddenly resigned, and my friend was asked to step in. “I thought I knew a lot about the company, but boy, was I wrong,” he told me. “The knowledge gaps between the directors and the executives are huge.” (Pozen 2010)
Just as the idea that some directors should be held to higher standards is not alien to the academic literature, neither is it new to policymakers. As noted above, Dodd-Frank requires that at least one of the members of the risk committees of BHCs and SIFIs must have risk management experience commensurate with the firm’s capital structure, risk profile, complexity, size, and activ-ities. The Sarbanes-Oxley Act explicitly set higher requirements for qualified audit committees by requiring all members to be in-dependent and at least one member to be a “financial expert” as defined by SEC rules.91 Indeed, one of the motivations behind Sarbanes-Oxley was to strengthen audit committees to “avoid future auditing breakdowns,” which were contributing to a loss of confidence in the integrity of U.S. companies and markets.92 Our argument here is that the failure of risk management at financial
91 An “audit committee financial expert” is defined as a person who has the following attributes: (1) an understanding of generally accepted accounting principles and financial statements; (2) the ability to assess the general application of such principles in connection with the accounting for estimates, accruals and reserves; (3) experience preparing, auditing, analyzing or evaluating financial statements that present a breadth and level of complexity of accounting issues that are generally comparable to the breadth and complexity of issues that can reasonably be expected to be raised by the registrant’s financial statements, or experience actively supervising one or more persons engaged in such activities; (4) an understanding of internal controls and procedures for financial reporting; and (5) an understanding of audit committee functions.” See Trautman (2013).92 See Senate Report No.107-205, as cited in Tsacoumis, Bess, and Sappington (2003).

FRBNY Economic Policy Review / August 2016 103
institutions, particularly systemically important ones, can lead to outcomes of even greater consequence, and that current steps are insufficient to address the magnitude of the problem of excessive risk taking by financial institutions.
How might such a system work? We suggest a two-part struc-ture involving differential standards for both bank risk committee members and bank directors. With respect to risk committee members, we note that risk management of a complex financial institution is not something easily grasped by a typical corporate director; it instead requires specialized expertise. Indeed, the shareholder advisory services ISS and Glass Lewis both recom-mended voting against the members of JPMorgan Chase’s Risk Committee, citing their lack of risk management experience. We believe that risk management committees should be composed only of individuals who can demonstrate expertise in evaluating and monitoring the risk control systems of a bank. Allowing “amateur hour” with respect to this oversight function at large complex financial institutions is simply irresponsible in post- crisis financial markets.
Such individuals, whom we will call “banking experts,” would have acquired, either through experience or education, the skills needed to monitor the risk management functions of the bank. For smaller financial institutions, the expertise re-quired might be more limited, given that risk management at such institutions generally involves less complex methodologies (such as gap analysis, liquidity monitoring, and the like). For large, complex financial institutions, the needed skill set will be larger, requiring familiarity with risk modeling, valuation of complex derivatives, synthetic asset replication, hedging strategies, and so on. The specific qualifications for being a banking expert could be modeled after those required of audit committee financial experts.
Second, we also propose higher professional standards for bank directors. As we have argued in this article, bank corporate governance weaknesses pose an ongoing threat to the financial system. While heightened oversight of banks is surely called for, such oversight will be successful only to the extent that the direc-tors of financial institutions have both the incentives and the experience and skill required to be successful in carrying out their oversight responsibilities. At a minimum, we believe bank direc-tors should be “banking literate,” where such literacy is defined as an understanding of the basic functions of banking, the nature of risk in complex financial organizations, and the complex regulatory structure defining banking. Such literacy, which would be a prerequisite for becoming a director, could be acquired through experience or through education.
We suspect that some may object to these proposals on the grounds that if having more qualified directors was valuable, then bank shareholders would demand this on their own. Alternatively, others may argue that if higher requirements are
desirable for banks, then perhaps they should be required of firms more generally. We think the response to both objections is actually the same: banks are different from other firms. As we have argued, bank shareholders do not have properly aligned incentives to limit bank risk, so externally imposed require-ments may be necessary. Other firms can adequately address corporate governance deficiencies internally, so requiring higher standards for all corporate directors is unnecessary.
Another objection to our proposal involves a more subtle point about bank risk taking. There is empirical research that indicates that banks with more knowledgeable directors are more likely to take on greater risk than other banks. One could argue that our proposal could actually exacerbate the risk-taking problem at banks rather than ameliorate it because our proposal would place more knowledgeable directors on boards. We have two responses to this. First, ignorance is not a good strategy for risk control—relying on directors’ lack of knowledge to restrain risk is surely not a formula for a safe and sound banking system. We completely agree, however, that knowledge alone is not sufficient to achieve the goal of safety and soundness in banking. In addition to knowledge and competence, there must also be a culture within banks that considers prudent banking to be a way of life rather than an oxymoron. Culture starts at the top, so efforts by regulators to highlight the importance of cultural issues within banks should be viewed as fully compatible with our proposals to improve corporate governance in banking.
Finally, a legitimate concern is that our proposal would cause the demand for qualified bank directors to exceed the supply. We acknowledge that it will take time and effort to groom enough competent directors for all of the import-ant financial firms in the economy. But if better directors result in creating better banks, then the returns to searching for, educating, and empowering those directors will pay off for all concerned.
5. Conclusion
Who will control large, complex financial institutions? Without better corporate governance, the answer may be the regulators—or no one at all. In this article, we have set out the myriad problems connected with bank corporate governance and noted how these seem to have taken on even greater complexity in the post-crisis world. We have argued that bank governance needs to change to reflect the realities of complex financial organizations. Our proposal to impose higher professional standards on bank directors and risk committee members is a first step in that direction.

104 A Proposal for the Post-Crisis World
References
Acharya, V., J. N. Carpenter, X. Gabaix, K. John, M. Richardson, M. G. Subrahmanyam, R. K. Sundaram, and E. Zemel. 2009. “Corporate Governance in the Modern Financial Sector.” In V. Acharya and M. Richardson, eds., Restoring Financial Stability. Hoboken, N.J.: Wiley Finance.
Adams, R., and H. Mehran. 2008, revised 2011. “Corporate Performance, Board Structure, and Their Determinants in the Banking Industry.” Federal Reserve Bank of New York Staff Reports, no. 330.
Bai, G. 2011. “Asset Opacity and CEO Compensation of Bank Holding Companies.” Paper presented at the 2011 Financial Management Association Annual Meeting, Session 099: Managerial Compensation and Financial Institutions, January 12.
Bainbridge, S. 2011. “A Corporation’s Obligation to Obey the Law.” ProfessorBainbridge.com: Stephen Bainbridge’s Journal of Law, Politics, and Culture, March 28. Available at http://www .professorbainbridge.com/professorbainbridgecom/2011/03/ a-corporations-obligation-to-obey-the-law.html.
Baxter, T. C., Jr. 2003. “Governing the Financial or Bank Holding Company: How Legal Infrastructure Can Facilitate Consolidated Risk Management.” Remarks presented at the October 25, 2002, Puerto Rico Bankers Association conference “Financial Transparency and Corporate Governance of Financial Institutions after the Sarbanes-Oxley Act of 2002,” San Juan, Puerto Rico. Federal Reserve Bank of New York Current Issues in Economics and Finance 9, no. 3 (March).
Bebchuk, L. A., and H. Spamann. 2010. “Regulating Bankers’ Pay.” Georgetown Law Journal 98, no. 2: 247–87.
Berle, A. A. and G. C. Means. 1932. The Modern Corporation and Private Property. New York: Macmillan.
Calomiris, C. W. 2013. “The Political Lessons of Depression-Era Banking Reform.” In N. Crafts and P. Fearon, eds., The Great Depression of the 1930s: Lessons for Today. Oxford: Oxford University Press.
Calomiris, C. W., and Carlson, M. 2014. “Corporate Governance and Risk Management at Unprotected Banks: National Banks in the 1890s.” NBER Working Paper no. 19806, January.
Clarke, R. L. 1988. “Remarks.” Comptroller of the Currency News Release NR 88-5, the Exchequer Club, Washington, D.C. January 10, p. 6.
de Haan, J., and R. Vlahu. 2013. “Corporate Governance of Banks: A Survey.” De Nederlandsche Bank Working Paper no. 386 (July).
Diamond, D., and P. Dybvig. 1983. “Bank Runs, Deposit Insurance, and Liquidity.” Journal of Political Economy 91, no. 3 (June): 401-19.
Douglas, W. O. 1934. “Directors Who Do Not Direct.” Harvard Law Review 47, no. 8 (June): 1305-34.
Elliott, D. J. 2010. “A Primer on Bank Capital.” Brookings Institution Research Paper, January 28. Available at http://www.brookings .edu/research/papers/2010/01/29-capital-elliott.
Ellul, A., and V. Yerramilli. 2010, revised 2011. “Stronger Risk Controls, Lower Risk: Evidence from U.S. Bank Holding Companies.” AXA Working Paper Series no. 1, Discussion Paper no. 646 (January). ISSN 0956-8549-646.
Fisher, E., ed. 2012. Nuclear Regulation in the U.S.: A Short History. Hauppauge, N.Y.: Nova Science.
Flannery, M. J. 1994. “Debt Maturity and Deadweight Cost of Leverage: Optimally Financing Banking Firms.” American Economic Review 84, no. 1: 320-31.
Friedman, M., and A. Schwartz. 1963. A Monetary History of the United States, 1867-1960. Princeton, N.J.: Princeton University Press.
Hoenig, T. 2013. “Basel III Capital: A Well-Intended Illusion.” Federal Deposit Insurance Corporation, Speeches and Testimony, April 9.

FRBNY Economic Policy Review / August 2016 105
References (Continued)
The views expressed are those of the authors and do not necessarily reflect the position of the Federal Reserve Bank of New York or the Federal Reserve System. The Federal Reserve Bank of New York provides no warranty, express or implied, as to the accuracy, timeliness, completeness, merchantability, or fitness for any particular purpose of any information contained in documents produced and provided by the Federal Reserve Bank of New York in any form or manner whatsoever.
Jackson, H. E. 1994. “The Expanding Obligations of Financial Holding Companies.” Harvard Law Review 107, no. 3 (January): 507-619.
Jackson, H. E., and E. L. Symons, Jr. 1999. Regulation of Financial Institutions. St. Paul, Minn.: West Publishing Company.
Jensen, M. C., and W. H. Meckling. 1976. “Theory of the Firm: Managerial Behavior, Agency Costs, and Ownership Structure.” Journal of Financial Economics 3, no. 4 (October): 305-60.
Jurinski, J. J. 2003. How to File for Bankruptcy. New York: Barron’s.
Keys, P. Y., and J. Li. 2005. “Evidence on the Market for Professional Directors.” Journal of Financial Research 28, no. 4: 575-89.
Laeven, L. and R. Levine. 2009. “Bank Governance, Regulation and Risk Taking.” Journal of Financial Economics 93, no. 2 (August): 259-75.
Levine, R. 2004. “The Corporate Governance of Banks: A Concise Discussion of Concepts and Evidence.” World Bank Policy Research Working Paper 3404, September.
Macey, J. R. 1999. “Fiduciary Duties as Residual Claims: Obligations to Nonshareholder Constituencies from a Theory of the Firm Perspective.” Cornell Law Review 84, no. 5: 1266-81.
Macey, J. R., and G. P. Miller. 1993. “Corporate Stakeholders: A Contractual Perspective.” University of Toronto Law Journal 43, no. 3: 401-20.
Macey, J. R., G. P. Miller, and R. S. Carnell. 2001. Banking Law and Regulation. New York: Aspen Publishers, April.
Macey, J. R., and M. O’Hara. 2003. “The Corporate Governance of Banks.” Federal Reserve Bank of New York Economic Policy Review 9, no. 1 (April): 91-107.
Macey, J. R., and M. O’Hara. 2016. “Vertical and Horizontal Problems in Financial Regulation and Corporate Governance.” In A. Demirgüç-Kunt, D. D. Evanoff, and G. G. Kaufman, eds., The Future of Large, Internationally Active Banks. Hackensack, N.J.: World Scientific Publishing Co.
Mehran, H., A. Morrison, and J. Shapiro. 2011. “Corporate Governance and Banks: What Have We Learned from the Financial Crisis?” Federal Reserve Bank of New York Staff Reports, no. 502, June.
Office of the Comptroller of the Currency. 2010, reprinted 2013. The Director’s Book. p. 26.
Pozen, R. 2010. “The Big Idea: The Case for Professional Boards.” Harvard Business Review, December. Available at http://hbr .org/2010/12/the-big-idea-the-case-for-professional-boards/ar/6.
Rosengren, E. S. 2013. “Bank Capital: Lessons from the U.S. Financial Crisis.” Speech at the Bank for International Settlements Forum on Key Regulatory and Supervisory Issues in a Basel III World, February 25.
Silver-Greenberg, J., and B. Protess. 2012. “Bank Regulators under Scrutiny in JPMorgan Loss.” New York Times, May 25. Available at http://www.nytimes.com/2012/05/26/business/ regulators-role-at-jpmorgan-scrutinized.html?_r=3&hp&.
Tsacoumis, S., S. R. Bess, and B. A. Sappington. 2003. “The Sarbanes-Oxley Act: Rewriting Audit Committee Governance.” International Bar Association, Business Law International 4, no. 3 (September): 212-25.
Trautman, L. J. 2013. “Who Qualifies as an Audit Committee Financial Expert under SEC Regulations and NYSE Rules?” DePaul Business and Commercial Law Journal 11, Winter 2013.

1. Introduction
We review the recent corporate governance literature that examines the role of financial reporting in resolving agency conflicts among a firm’s managers, directors, and capital providers.1 We view governance as the set of contracts that help align managers’ interests with those of shareholders, and we focus on the central role of information asymmetry in agency conflicts between these parties. In terms of the firm-specific information hierarchy, the literature typically views management as the most informed, followed by outside directors, then shareholders. We discuss research that examines the role of financial reporting in alleviating these information asymmetries and the role that financial reporting plays in the design and structure of incentive and monitoring mechanisms to improve the credibility and transparency of information.
Most of this research is large-sample and does not pay
1 Certainly, financial reporting provides valuable information in other contracting relationships beyond those involving capital providers (suppliers, customers, auditors, regulators, tax authorities, etc.). In this article, we confine our discussion to contracts involving capital providers for three reasons: (1) they are a major focal point in the literature, (2) the literature on agency conflicts between managers and capital providers constitutes a natural, interconnected subset of articles that lends itself to a relatively cohesive discussion, and (3) we wish to keep the scope of our review manageable.
particular attention to industry-specific characteristics that may influence a firm’s governance structure. For example, the firm-specific governance structure and financial reporting systems of financial institutions and other regulated industries are expected to be endogenously designed. The design is also expected to be conditional on (in other words, take into account) the existence of certain external monitoring mechanisms (for example, regulatory oversight and constraints), which may either substitute for or complement internal mechanisms, such as the board. Similarly, the rationale for regulation in certain industries (for example, the existence of natural monopolies) is also expected to influence firms’ governance structures. These and other differences between firms in different industries suggest that inferences drawn from studies spanning multiple industries may not necessarily hold for specific industries or research set-tings.2 The same point can also be made about extrapolating inferences drawn from U.S. firms to their international counter-parts. Different countries have their own (often unique) laws, regulations, and institutions that influence the design, operation, and efficacy of a firm’s governance mechanisms as well as the output of its financial reporting system.
2 Further underscoring this concern, it is not uncommon for governance studies to exclude firms that belong to historically regulated industries, such as financial institutions and utilities.
FRBNY Economic Policy Review / August 2016 107
Christopher S. Armstrong, Wayne R. Guay, Hamid Mehran, and Joseph P. Weber
The Role of Financial Reporting and Transparency in Corporate Governance
Christopher S. Armstrong is an associate professor of accounting and Wayne R. Guay the Yageo Professor of Accounting at the Wharton School of the University of Pennsylvania; Hamid Mehran is an assistant vice president at the Federal Reserve Bank of New York; Joseph P. Weber is the George Maverick Bunker Professor of Management and a professor of accounting at the MIT Sloan School of Management.
[email protected] [email protected] [email protected] [email protected]
This article draws on Armstrong, Guay, and Weber (2010). The authors are grateful to Douglas Diamond for helpful discussions. The views expressed are those of the authors and do not necessarily reflect the position of the Federal Reserve Bank of New York or the Federal Reserve System.
To view the authors’ disclosure statements, visit https://www.newyorkfed.org/research/author_disclosure/ad_epr_2016_role-of-financial-reporting _armstrong.html

108 Financial Reporting and Transparency in Corporate Governance
We also highlight the distinction between formal and informal contracting relationships, and discuss how both play an important role in shaping a firm’s overall governance structure and information environment. Formal contracts, such as written employment agreements, are often quite narrow in scope and are typically relatively straightforward to analyze. Informal contracts, govern implicit multiperiod relationships that allow contracting parties to engage in a broad set of activities for which a formal contract is either impractical or infeasible. For example, the complexity of the responsibilities and obligations of a firm’s chief executive officer make it diffi-cult to draft a complete state-contingent contract with the board that specifies appropriate actions under every possible scenario the firm could face. Consequently, although some CEOs have formal employment contracts, these contracts are necessarily incomplete and relatively narrow in scope. As a result, the board and the CEO develop informal rules and understandings that guide their behavior over time.
Much of the governance literature emphasizes informal contracting based on signaling, reputation, and certain incentive structures. The general conclusion in this literature is that financial reporting is valuable because contracts can be more efficient when the parties commit themselves to a more transparent information environment.
Another key theme of this article is that a firm’s gover-nance structure and its information environment evolve together over time to resolve agency conflicts. That is, certain governance mechanisms and financial reporting attributes work more efficiently within certain operating environments. Consequently, one should not necessarily expect to see every firm converge to a single dominant type of corporate governance structure or compensation contract, or to adopt a similar financial reporting system. Instead, one should expect to observe heterogeneity in these mechanisms that is related to differences in firms’ economic characteristics. In our opinion, the corporate governance literature seems to be unduly burdened by the normative notion that certain governance structures can be categorically labeled as “good” or “bad.”3
In Section 2, we briefly discuss the general nature of con-tracts related to governance and the properties of financial reporting that are relevant to various governance structures. Section 3 discusses the role of information asymmetry and credible commitment to transparent financial reporting in corporate governance. In Section 4, we discuss the relation-ship of regulatory supervision and oversight to the governance
3 Governance structures frequently characterized as categorically (or unconditionally) bad include a board with a high proportion of inside directors, a CEO who also serves as chairman of the board, a CEO with relatively low equity incentives, and relatively weak shareholder rights.
structure of firms in the banking and financial services sectors. We also discuss how certain governance mechanisms can facilitate the production of information and enhance transparency, which may in turn contribute to financial stabil-ity. Section 5 provides brief concluding remarks.
2. The Role of Financial Reporting in Corporate Governance
We view corporate governance as the subset of a firm’s contracts—both formal and informal—that help align the interests of managers with those of shareholders. Therefore, corporate governance consists of the mechanisms by which shareholders ensure that the interests of the board of directors and management are aligned with their own.4 We also view this definition to be broad enough to encompass all of the firm’s contracts that assist in aligning the incentives of the firm’s shareholders, directors, and managers. For example, when a firm’s creditors have the right to monitor the firm’s financial reporting, those creditors may help align the interests of managers and shareholders; therefore, a debt contract that allows such monitoring could constitute a governance mechanism.
Corporate governance research typically focuses on one of two types of agency problems that give rise to a conflict of interest between managers and shareholders. The first type arises when the interests of the board of directors and shareholders are assumed to be aligned (that is, the board is composed of individuals who make decisions that are in the best interest of shareholders), but the interests of management are not aligned with those of the board and shareholders. Research on this type of conflict includes studies that examine executive compensation plans, incen-tive structures, and other monitoring mechanisms used to ensure that managers act in the interest of shareholders.5
The second type of agency problem arises when the interests of the board and management are assumed to be aligned with each other (that is, the board is composed of directors who are beholden to the CEO), but their interests are not completely aligned with the interests of sharehold-ers. Research on this type of conflict includes studies on
4 This definition is broadly consistent with the views of authors such as Jensen (1993), Mehran (1995), Shleifer and Vishny (1997), Core, Holthausen, and Larcker (1999), Holderness (2003), and Core, Guay, and Larcker (2003). 5 See, for example, Ahmed and Duellman (2007), Carcello and Neal (2003), and Francis and Martin (2010).

FRBNY Economic Policy Review / August 2016 109
board independence, entrenched CEOs, and shareholder actions to influence, challenge, or overturn board decisions (such as shareholder proxy contests, class action lawsuits, and “say-on-pay” proposals).6
Corporate governance mechanisms that have the potential to reduce these agency conflicts include both formal and informal contracts. Formal contracts—including corporate
charters, employment contracts, exchange listing require-ments (such as board independence rules), and executive stock ownership guidelines—constrain the contracting parties’ behavior and specify certain responsibilities and requirements in the event of certain foreseeable contingen-cies. These contracts, however, tend to be relatively narrow in scope. Informal contracts constitute a broad set of unwritten or implicit arrangements that allow the contracting parties to engage in activities that would otherwise be either pro-hibitively costly or infeasible to memorialize in a formal contract. Many important governance functions are carried out via informal contracts. Boards establish reputations regarding their independence from management, their expertise in advising management, and their work ethic. Reputations develop over time, in part on the basis of board characteristics such as the proportion of inside versus outside directors, the size of the board, the expertise of directors, and the number of board meetings, as well as by the consistency of the board’s decision-making processes and its stewardship of shareholder value. As we explain below, various attributes of a firm’s financial reporting play a key role in both formal contracts (in part because these contracts are sometimes based on financial reporting numbers) and informal con-tracts (because of the importance of financial reporting and credible disclosure in establishing reputations and sustaining working relationships).
A key objective of this article is to highlight the important role that financial reporting plays in reducing the infor-mational advantage of managers over outside directors, shareholders, and other stakeholders (for example, regulators).
6 See, for example, Klein (2002b), Zhao and Chen (2008), and Duchin, Matsusaka, and Ozbas (2010).
Managers typically have better firm-specific information than outside directors and shareholders, but they are not always expected to truthfully report information that is detrimen-tal to their personal interests, such as information about poor performance or their consumption of private benefits (Verrecchia 2001).
Boards, which largely consist of outside directors, and shareholders, are therefore typically assumed to be at an infor-mational disadvantage when monitoring managers. Jensen describes these informational problems as follows:
Serious information problems limit the effectiveness of board members in the typical large corporation. For example, the CEO almost always determines the agenda and the information given to the board. This limitation on information severely hinders the ability of even highly talented board members to contribute effectively to the monitoring and evaluation of the CEO and the company’s strategy. (1993, 864)
Indeed, in the absence of information asymmetries, boards would likely be able to mitigate many, if not most, agency conflicts with managers. The reason is that boards retain con-siderable discretion to discipline managers and could therefore take immediate action upon receiving new information. Thus, one potential role for financial reporting is to provide outside directors and shareholders with relevant and reliable infor-mation to facilitate their mutual monitoring of management and, in the case of shareholders, their monitoring of directors. Further, to the extent that financial reporting serves to reduce information asymmetries, one expects to observe correspond-ing variation in the governance mechanisms that are associated with financial reporting characteristics.
3. The Role of Information in Structuring Corporate Boards
The board of directors plays a key role in monitoring management and in constructing mechanisms that align managers’ objectives with shareholders’ interests. A large body of theoretical and empirical literature examines the role of boards in performing two broad functions: (1) advising senior management, which requires expertise and firm-specific knowledge, and (2) monitoring senior management, which additionally requires independence from management.7 The ways in which boards are structured
7 For example, see Fama and Jensen (1983), Raheja (2005), Boone et al. (2007), Drymiotes (2007), Lehn, Patro, and Zhao (2009), Linck, Netter, and Yang (2008), and Harris and Raviv (2008).
Corporate governance consists of the
mechanisms by which shareholders
ensure that the interests of the board of
directors and management are aligned
with their own.
110 Financial Reporting and Transparency in Corporate Governance
to achieve these goals—especially the latter—has been the subject of considerable research, with the distinction between outside and inside directors being the most commonly examined dimension of board structure.
Corporate boards typically consist of both outside and inside directors.8 For example, in a broad sample of U.S. firms that were publicly traded between 1990 and 2004, Linck, Netter, and Yang (2008) found 67 percent to be the median percentage of outside directors on a board. Outside directors are typically experienced professionals, such as CEOs and executives of other firms, former politicians and regulators, university deans and presidents, and successful entrepreneurs. The value of having outside directors on the board derives, in part, from their broad expertise in areas such as business strategy, finance, marketing, operations, and organizational structure. Further, outside directors can bring an independence that carries with it an expectation of superior objectivity in monitoring management’s behavior. Their diligence in this respect may stem partially from the monetary incentives associated with serving as a director (Yermack 2004), but possibly even more important may be their desire to enhance, cultivate, and protect their significant personal reputational capital.
Inside directors, who are typically executives of the firm, can facilitate effective decision making because they are a valuable source of firm-specific information about constraints and opportunities (see, for example, Raheja [2005], Harris and Raviv [2008], and Adams, Hermalin, and Weisbach [2010]). As Jensen and Meckling (1992) note, the allocation of decision (or control) rights within an organization is a fundamental building block of organizational structure. And because it can be costly to transfer information within the corporate hierarchy, it can be efficient to assign decision rights to the individuals who possess the information necessary to best make decisions, even in the face of agency conflicts (Aghion and Tirole 1997). In addition to their decision-making responsibilities, inside directors can also be particularly helpful in educating outside directors about the firm’s activities (Fama and Jensen 1983). Inside directors, who typically hold relatively large amounts of the firm’s stock and options, as
8 Pursuant to Item 470(a) of Regulation S-K of the U.S. Securities and Exchange Commission, firms must disclose whether each director is “independent” within the definition prescribed by the exchange on which the firm’s shares are traded. Directors are typically classified as insiders, outsiders, and affiliates (or gray directors). Insiders are current employees of the firm, such as the CEO, CFO, president, and vice presidents. Outsiders have no affiliation with the firm beyond their membership on its board of directors. Affiliates are former employees of the firm, relatives of its CEO, or those who engage in significant transactions and business relationships with the firm as defined by Items 404(a) and (b) of the regulation. Directors on interlocking boards are also considered to be affiliated, where interlocking boards are defined by Item 402(j)(3)(ii) as “those situations in which an inside director serves on a non-inside director’s board.”
well as have their human capital tied to the firm, may also have stronger incentives than outside directors to exert effort and to maximize shareholder value.
At the same time, however, inside directors are potentially conflicted in their incentives to monitor because of their lack of independence from the CEO and a desire to protect their own
private benefits.9 Further, even though well-informed outside directors are likely to be more effective in advising the CEO, insiders may be reluctant to share their information if it will be used to interfere with the CEO’s strategic decisions (Adams and Ferreira 2007). This scenario is particularly true if the information could be used to discipline the executives or to curtail their private benefits.
Holmstrom (2005, 711-2) provides a succinct charac-terization of the issues related to information flow between management and outside directors:
Getting information requires a trusting relationship with management. If the board becomes overly inquisitive and starts questioning everything that the management does, it will quickly be shut out of the most critical information flow—the tacit information that comes forward when management trusts that the board understands how to relate to this information and how to use it. Management will keep information to itself if it fears excessive board intervention. A smart board will let management have its freedom in exchange for the information that such trust engenders. Indeed, as long as management does not have to be concerned with excessive intervention, it wants to keep the board informed in case adverse events are encountered. Having an ill-informed board is also bad for management, since the risk of capricious intervention or dismissal increases.
9 However, see Drymiotes (2007) for a situation in which an increase in the number of inside directors might actually improve the efficiency of the board’s monitoring role. In his model, outside directors have an incentive to shirk their monitoring duties and to shortchange the CEO with respect to his performance ex post. Inside directors, who represent the CEO’s interests, can commit themselves to expending monitoring effort ex post, thereby increasing the CEO’s incentive to exert productive effort.
Outside directors can bring an
independence that carries with it an
expectation of superior objectivity in
monitoring management’s behavior.

FRBNY Economic Policy Review / August 2016 111
Thus, a key advantage of inside directors is also a key disadvantage of outside directors: the differential cost and dif-ficulty of obtaining adequate information with which to make decisions. Such information transfer between insiders and outsiders is not trivial, and it is the focus of much of the liter-ature on corporate governance. Outside directors are typically busy individuals who already have other demands on their time. It is unrealistic to expect that an outside director can or will invest the time and effort necessary to become as well informed as the firm’s executives. Further compounding these informational problems is the fact that outside directors must largely rely on the executives they are monitoring and advising to provide them with the information necessary to facilitate effective corporate governance, although auditors, regulators, analysts, the media, and other information intermediaries may also assist outside directors in this regard.
Bushman et al. (2004, 179) summarize the trade-offs in choosing the relative proportion of inside and outside direc-tors on a board:
An important question of board composition concerns the ideal combination of outside and inside members. Outsiders are more independent of a firm’s CEO, but are potentially less informed regarding firm projects than insiders. Insiders are better informed regarding firm projects, but have potentially distorted incentives deriving from their lack of independence from the firm’s CEO.
Thus, a board composed entirely of insiders may not be effective because of the potential for allowing managerial entrenchment. Conversely, a board with no insiders may not be effective if the directors have a limited understanding of the firm with no way to remediate this informational dis-advantage. Although researchers have advanced a variety of hypotheses related to the optimal mix of inside and outside directors (Hermalin and Weisbach 2003; Adams, Hermalin, and Weisbach 2010), we focus our discussion on those related to the information environment. In general, these information-based hypotheses predict that when outside directors face greater information acquisition and processing costs, they will be less effective advisors and monitors, and are less likely to be invited to sit on boards.
Regarding the board’s advisory role, a common prediction is that in firms with significant investment opportunities and complex investments—such as substantial research and development (R&D), and intangible assets—considerable firm-specific knowledge may be necessary to effectively advise management. In these situations, the informational advantage that insiders have over outsiders may impede
the advisory role of outside directors and lead to a greater proportion of inside directors (see, Coles, Daniel, and Naveen [2008]).
With respect to the board’s monitoring and oversight responsibilities, hypotheses frequently emphasize that the firm’s operations and information environment influence the monitoring costs and benefits of certain board structures. Specifically, it has been argued that firms in more uncertain business environments—such as high-growth firms with substantial investment in R&D, intangible assets, and earnings and stock price volatility—are more difficult (that is, costly) to monitor, in large part because of greater information asymmetries between managers and outside directors (see, for example, Demsetz and Lehn [1985]; Gillan, Hartzell, and Starks [2006]; and Coles, Daniel, and Naveen [2008]). Because it is costly for outside directors to acquire and process the information necessary to effectively monitor managers, firms characterized by greater information asymmetry between managers and outsiders are predicted to have a higher propor-tion of inside directors.
A growing body of empirical literature examines the relation between information processing costs and board structure.10 Information acquisition and processing costs are
generally thought to increase with information asymmetry, where information asymmetry (and monitoring difficulty in general) is typically measured using proxies such as the market-to-book ratio (or Tobin’s Q), R&D expenditures, stock-return volatility, firm size, number of analysts, analyst forecast dispersion, and the magnitude of analyst forecast errors.
Across a variety of research designs and samples, empirical evidence generally supports the idea that the proportion of outside directors is lower at firms with greater information asymmetry between insiders and outsiders, and at firms where idiosyncratic (that is, firm-specific) knowledge is more likely to be important (see, for example, Linck, Netter, and Yang [2008]; Lehn, Patro, and Zhao [2009]; and Cai, Qian, and
10 See, for example, Boone et al. (2007), Coles, Daniel, and Naveen (2008), Linck, Netter, and Yang (2008), Lehn, Patro, and Zhao (2009), and Cai, Qian, and Liu (2009).
It is unrealistic to expect that an outside
director can or will invest the time and
effort necessary to become as well
informed as the firm’s executives.

112 Financial Reporting and Transparency in Corporate Governance
Liu [2009]). Although the empirical evidence is largely con-sistent, establishing the direction of causality of this relation is more elusive.
A recent study by Armstrong, Core, and Guay (2014) attempts to discern the direction of causality by examining regulatory requirements that require certain firms to increase their proportion of outside directors. They find evidence that a mandatory increase in the proportion of outside directors is associated with a decrease in information asymmetry, as measured by an increase in the frequency and precision of management forecasts and an increase in coverage by financial
analysts. Armstrong, Core, and Guay (2014) interpret their results as evidence that firms can and do alter certain aspects of their transparency to accommodate the information demands of independent directors.
In a related study, Duchin, Matsusaka, and Ozbas (2010) find that regulations that increase the proportion of outside directors resulted in lower firm performance when information acquisition costs are high. In other words, because some firms optimally have a smaller proportion of independent directors, regulators should use caution when considering whether to require firms to decrease insider representation on their boards.
The results of these studies are inconsistent with the view often articulated by researchers that boards with a higher percentage of outside directors facilitate better gover-nance by acting to ensure lower information asymmetry with management. The results instead suggest that firms’ inherent information transparency, which is largely dictated by char-acteristics of their operating environment, drives the choice regarding the optimal proportion of outside directors.
Another aspect of board structure that has received attention in the literature is the CEO’s role on the board— particularly whether the CEO is also the chairman of the board, as is currently the case for about 60 percent of the firms in the Standard & Poor’s 500 index. Brickley, Coles, and Jarrell (1997) argue that the prospect of becoming the chair-man of the board acts as an incentive mechanism for CEOs, suggesting that more successful and talented CEOs are more likely to be awarded chairmanship of the board. A prediction more closely related to our discussion is that because CEOs typically have the most detailed firm-specific information,
CEOs are more likely to be delegated greater control at firms with greater information asymmetry between insiders and outsiders (Brickley, Coles, and Linck 1999).
Some studies also predict that the CEO’s ability influences the evolution of board independence. In particular, CEOs with superior ability and a history of strong performance may acquire significant bargaining power, which they can use to surround themselves with loyal directors, thereby reducing the independence of the board (Hermalin and Weisbach 1998). At the same time, shareholders may decide that more board independence is necessary to monitor a powerful CEO, particularly when information asymmetry has the potential to lead to agency conflicts (although the feasibility of structuring a strong independent board in this situation is an empirical question). Collectively, these CEO-related hypotheses do not lead to an unambiguous prediction about the relation between information transparency and the combined roles of CEO and chairman. Accordingly, it may not be surprising that Linck, Netter, and Yang (2008) fail to find a significant relation between information asymmetry and the incidence of the combined roles of CEO and chairman.
Even if we accept the premise that outside directors require high-quality information to perform their monitor-ing and advisory roles, they are unlikely to know precisely the extent of their information disadvantage; hence they must rely on credible commitment mechanisms to ensure that the information environment is transparent. That raises the question of how managers can credibly pledge to truthfully convey (or how they can be compelled by outside directors, shareholders, and other parties to so convey) their private information about the firm’s activities and financial health. Leuz and Verrecchia (2000) provide a lucid discus-sion of the important distinction between a commitment to disclosure and voluntary disclosure. The former is an ex ante decision to provide information regardless of its content, whereas the latter is an ex post decision of whether to provide information after observing its content. The authors discuss a commitment to disclosure in the context of a firm’s cost of capital, but their arguments translate to the governance setting, in which boards require mechanisms to compel managers to disclose information regardless of whether doing so is in the managers’ interests.
The accounting literature on board structure has identified several mechanisms that entail a commitment to transparent financial reporting, including:
• committing to report timely financial accounting information in general (for example, earnings timeliness);
CEOs are more likely to be delegated
greater control at firms with greater
information asymmetry between
insiders and outsiders.
FRBNY Economic Policy Review / August 2016 113
• making a more specific commitment to report information about losses in a timely manner (for example, conservative financial reporting);
• hiring a high-quality auditor who reports to an independent audit committee;
• inviting financially sophisticated outsiders to sit on the board, and;
• maintaining or encouraging the monitoring efforts of more active investors.
3.1 Timeliness of Financial Reports
Bushman et al. (2004) note that outside directors require timely information to assist them in carrying out their monitoring and advising responsibilities, and timely financial reporting in general, and the timely reporting of earnings in particular, have the potential to help satisfy these informational demands. However, the authors discuss the difficulty in formulating a prediction with respect to the relation between the timely reporting of earnings and board structure. On one hand, the foregoing theoretical arguments suggest that outside directors are likely to be less effective at a firm that has not made a commitment to reduce information asymmetry between insiders and outsiders. Thus, one might expect to find a positive relation between the proportion of outside directors and timely financial reporting (as a proxy for low information asymmetry).11 On the other hand, Bushman et al. also argue that low transparency can increase the scope for agency conflicts between shareholders and managers, thereby necessitating a greater proportion of outside directors to monitor management in situations where earnings are less timely.
With regard to the latter argument, it is instructive to consider how outside directors can be effective monitors in the face of low transparency. One possibility might be that low transparency is “correctable” and that outside directors will work to improve transparency so that they can more effectively monitor and advise management. If
11 Financial accounting properties such as earnings timeliness may or may not be good proxies for information asymmetry between managers and outside directors. Earnings timeliness is likely to be influenced by both firm- and industry-specific characteristics as well as by manager-specific characteristics. Thus, low earnings timeliness does not necessarily imply that a company has substantial information asymmetry between managers and outside directors. For example, even when managers are doing their best to convey their private information, they may be unable to credibly convey relevant and reliable information about their firm through the financial reporting process if their firm is growing fast in an uncertain business environment.
this were true, however, the negative relation between earn-ings timeliness and outside directors should be temporary (observed only until the outside directors correct the transparency problems). Possibly as a result of these con-flicting forces, Bushman et al. (2004) fail to find a significant relation between earnings timeliness and the proportion of outside directors.
3.2 Conservative Financial Reporting
Ahmed and Duellman (2007) also recognize the tension that outside directors require high-quality timely information to effectively monitor and advise managers, but, at the same time, that managers may have incentives to distort or conceal their private information. In contrast to the focus of Bushman et al. on the overall timeliness of earnings, Ahmed and Duellman emphasize the timeliness with which “bad news” is reported. Bad news can reasonably be viewed as central to the informational conflict between management and outside parties (including outside directors), as it will paint management’s performance in an unfavorable light. (See, for example, discussions by Watts [2003]; Ball and Shivakumar [2005]; and Kothari, Shu, and Wysocki [2009].)
In the accounting literature, the term “conservatism” is ascribed to the property of accounting reports that subjects bad news to a lower verification standard than good news and thus provides more timely recognition of bad news than good news in earnings. The more timely recognition of bad news is achieved through a variety of reporting rules and choices that commit managers to recognize and disclose difficult-to-verify information about losses more quickly than information about gains. For example, a decline in the value of inventory, goodwill, and other long-lived assets is recognized in a timely manner (such as recording an impairment charge), but a com-mensurate increase in value is recognized only when it is easy to verify—typically when there is an external arm’s-length sale or exchange. Thus, it seems reasonable to characterize conser-vatism as the set of financial accounting rules and conventions that facilitate more complete and timely corporate disclosure by committing managers to report bad news sooner than it might otherwise surface (Guay and Verrecchia 2007).
Notwithstanding issues related to the measurement of conservatism, which are not unique to their paper, Ahmed and Duellman (2007) find that the degree of conservatism in accounting earnings is greater for firms with a higher proportion of outside directors. This result is consistent with the hypothesis that timely recognition of bad news aids these directors in carrying out their monitoring and advisory roles.

114 Financial Reporting and Transparency in Corporate Governance
This result does not, however, speak to the direction of cau-sality. Thus, shareholders may choose to appoint more outside directors when the firm’s accounting is relatively more conser-vative (thus providing the timely information outside directors require to effectively govern); or instead, outside directors may facilitate the timely recognition of bad news through their efforts to elicit such information from management.
3.3 The Audit Committee of the Board of Directors
Outside directors on the audit committee are likely to bring greater independence in monitoring management’s financial reporting activities and, like outside directors in general, they are thought to require more information transparency to fulfill their responsibilities. However, regardless of their efforts, outside directors on the audit committee are unlikely to understand the firm’s financial reporting process as well as inside directors do.
Klein (2002a, b) examines hypotheses similar to those in Bushman et al. (2004) but in the context of outside directors on the audit committee rather than on the board as a whole. Klein (2002a) predicts and finds that more complex firms, and firms with greater uncertainty and growth opportunities, are less likely to have outside directors on the audit committee. This result is consistent with outside directors being asked to serve only in set-tings where there is sufficient information transparency to allow them to effectively fulfill their advising and monitoring roles.
Klein (2002b) and Krishnan (2005) document that the proportion of outside directors on the audit committee is negatively related to the incidence of internal control prob-lems, as publicly disclosed on U.S. Securities and Exchange Commission (SEC) Form 8-K when a change of auditor occurred. The results in these two papers are consistent with outside directors having both an incentive and the ability to monitor the financial reporting process, and with outside directors curtailing earnings management that is not in shareholders’ interests. However an alternative interpretation, which is also consistent with the collective evidence, is that management and shareholders recognize the need for their corporate financial reporting process to be transparent when they invite more outside directors to sit on the board (or that outside directors will agree to join the board only when the firm has made a commitment to transparent financial reporting). This alternative interpretation emphasizes shareholders’, and potentially management’s, incentives to proactively mitigate agency conflicts that arise when financial reporting is not transparent. Empirical evidence also indicates
that shareholders recognize the difficulties that directors face in monitoring the financial reporting process and provide greater remuneration to audit committee members when monitoring demands are greater.12
3.4 Adding Outside Financial Experts to the Board
In the wake of several high-profile accounting scandals in the early 2000s and the passage of stricter disclosure rules in the Sarbanes-Oxley Act of 2002, the role of financial experts on boards of directors became a timely issue in accounting research. Financial experts are thought to have better capabilities with respect to monitoring and advising on financial reporting and disclosure issues than their non-expert counterparts.
Although we are not aware of a well-accepted definition of “financial expert” in the academic literature on corpo-rate governance, it seems intuitive that a director with a background in public accounting, auditing, or financial oper-ations—such as a chief financial officer (CFO), controller, or treasurer—would possess financial expertise.13 However, the Sarbanes-Oxley Act uses a broader definition of how a direc-tor can obtain financial expertise. The definition includes, for example, experience in managing individuals who carry out financial reporting and financial operations. As a result, the Sarbanes-Oxley definition of “financial expert” includes individuals such as CEOs and company presidents who do not necessarily have expertise in analyzing financial reports or accounting practices.
In the absence of regulatory requirements, a firm will presumably invite a financial expert to sit on its board for one of the following reasons: (1) management requires advice on corporate finance or financial reporting strategy, (2) man-agement wants to credibly commit itself to more intense monitoring of corporate finance or financial reporting strate-gies, or (3) shareholders (for example, blockholders) pressure or require management to add an expert to the board because of concerns about insufficient monitoring. In the first case, an outside financial expert can perform an advisory role only if the firm’s financial reporting and information environment
12 Engel, Hayes, and Wang (2003).13 In the SEC’s Regulation S-K, Item 401, the qualifications of an audit committee financial expert include an understanding of accounting standards and financial statements; an ability to assess the general application of accounting principles; experience in preparing, auditing, or analyzing financial statements; an understanding of internal control over financial reporting; and an understanding of audit committee functions.

FRBNY Economic Policy Review / August 2016 115
are transparent. Thus, one might expect a positive relation between information transparency and the presence of finan-cial experts on the board. In the second and third cases, an outside financial expert may be asked to sit on the board when the firm’s financial reporting and information environment are not sufficiently transparent and additional monitoring and advice from a financial expert will make it more so. In this scenario, one might expect to observe a negative relation between information transparency and the presence of financial experts that becomes positive over time as a result of a financial expert’s actions to increase transparency. Thus, in cross-sectional tests, one could find a negative, positive, or no relation between information transparency and the presence of financial experts on the board.
Empirical research on these hypotheses is mixed but generally supports the prediction of a positive—although not necessarily causal—relation between information transparency and the presence of financial experts on the board. Xie, Davidson, and DaDalt (2003) show that board and audit committee members with corporate or financial expertise are associated with lower discretionary
accruals (which the authors assume are used by managers to reduce transparency). Agrawal and Chadha (2005) find that the frequency of an earnings restatement is lower in companies with an outside financial expert director on either the board or the audit committee. In addition, Farber (2005) finds that firms subject to an SEC enforce-ment action have fewer financial experts on their audit committees. And Krishnan (2005) and Hoitash, Hoitash, and Bedard (2009) show that the financial expertise of audit committee members is negatively related to the inci-dence of internal control problems.
When interpreting the results of these studies, it is important to note that a positive relation between the presence of a financial expert on the board and transpar-ency in financial reporting does not necessarily imply
that financial experts cause greater transparency. Having a financial expert on the board may improve transparency, but instead it can also signal that a firm’s financial report-ing practices are of high quality. In particular, financial experts will presumably investigate the firm’s financial reporting practices before agreeing to sit on the board and will do so only if the financial reporting practices are deemed to be of acceptable quality. In addition—or perhaps simultaneously—having a financial expert sit on the board can signal that management is committed to transparent financial reporting practices and is actively seeking advice and monitoring to achieve this objective. (Of course, the financial expert may be reluctant to accept a position that requires significant effort to ensure or establish transpar-ency.) In work consistent with this signaling hypothesis, DeFond, Hann, and Hu (2005) find a positive stock price reaction when a director with accounting expertise is appointed to the audit committee, although this result is not found for nonaccounting experts who meet the broader Sarbanes-Oxley definition of a financial expert (see also Engel [2005]).
In a related vein, recent research examines the role of the CFO in transparent financial reporting. The CFO is a key individual with substantial decision-making authority over financial reporting, and therefore it seems reasonable to predict that a fastidious CFO with appropriate incentives could have a positive influence on the quality of financial reporting.14 Bedard, Hoitash, and Hoitash (2014) provide evidence of higher financial reporting quality when the CFO holds a seat on the board of directors. This finding suggests either that board membership of CFOs enables other directors to better monitor the financial reporting process or that high-quality financial reporting is indica-tive of a high-quality CFO who is likely to be valuable on the board. Li, Sun, and Ettredge (2010) find that firms with internal control weaknesses as defined in Sarbanes-Oxley (sec. 404) have CFOs with lesser professional qualifications, and that newly hired CFOs with greater qualifications are associated with improvements in auditor opinions about internal control weaknesses.
14 As evidence supporting the incentives of CFOs to maintain high-quality financial reporting systems, Hoitash, Hoitash, and Johnstone (2012) and Wang (2010) document that CFOs of firms with weak internal controls receive lower compensation. Further, Wang (2010) and Li, Sun, and Ettredge (2010) show that CFOs of firms with internal control weaknesses experience a higher rate of forced turnover.
Empirical research on these
hypotheses is mixed but generally
supports the prediction of a
positive—although not necessarily
causal—relation between information
transparency and the presence of
financial experts on the board.

116 Financial Reporting and Transparency in Corporate Governance
3.5 Outside Directors as a Mechanism to Mitigate Agency Conflicts with Creditors and Other Contracting Parties
A number of recent papers explore the notion that in addition to mitigating agency costs between managers and shareholders, outside directors can also help resolve agency conflicts between managers (acting on behalf of shareholders) and other stakeholders, such as creditors, employees, customers, and suppliers. Outside directors may do so given their reputational capital, which may temper their willingness to follow managers in taking ex post opportunistic actions—including financial reporting decisions—that benefit managers and shareholders but are detrimental to other stakeholders (see, for example, Fama and Jensen [1983], Gerety and Lehn [1997], and Srinivasan [2005]).
Further, outside directors and other external parties have many of the same informational demands. For example, firms that use transparent financial reporting to credibly convey timely and reliable information to outside directors can simul-taneously convey this information to external stakeholders and contracting parties. At the same time, inside directors, most of whom are executives with substantial equity ownership, may have difficulty convincing stakeholders that management will not distort financial reports when it is in management’s interest to do so. Thus, while outside directors are commonly viewed as champions of shareholders’ interests in their monitoring of managers, it may be that outside directors are also more willing, ex post, to take actions that are counter to sharehold-ers’ interests when such actions conflict with the interests of other contracting parties.15 This, of course, does not mean that outside directors are ex ante detrimental to shareholders. Rather, shareholders may maximize value ex ante by commit-ting to constitute a board that will internalize other contracting parties’ interests ex post, thereby reducing agency conflicts and contracting costs with these other parties.
15 Adding to the richness of this perspective is the legal view that directors are generally regarded as having a primary fiduciary responsibility to shareholders rather than to the firm’s other contracting parties. Huebner and McCullough (2008) note that in 2007 the Delaware Supreme Court summarized the duties of directors as follows: “It is well established that the directors owe their fiduciary obligations to the corporation and its shareholders. While shareholders rely on directors acting as fiduciaries to protect their interests, creditors are afforded protection through contractual agreements, fraud and fraudulent conveyance law, implied covenants of good faith and fair dealing, bankruptcy law, general commercial law and other sources of creditor rights. Delaware courts have traditionally been reluctant to expand existing fiduciary duties. Accordingly, ‘the general rule is that directors do not owe creditors duties beyond the relevant contractual terms.’ ” (North American Catholic Educational Programming Foundation, Inc. v. Gheewalla, 930 A.2d 92 [Del. 2007])
Carcello and Neal (2000, 2003) allude to this role for outside directors by arguing that outside directors take actions to protect the independence of the auditor and the integrity of the financial reporting system even when it might not be in shareholders’ interests to do so. Bhojraj and Sengupta (2003) explicitly examine the role of outside directors in reducing agency conflicts with creditors. They document that firms are able to borrow at lower rates when they have a higher proportion of outside directors on the board. Anderson, Mansi, and Reeb (2004) also find this rela-tion between the cost of debt and overall board independence, as well as a negative relation between the independence of the audit committee and the cost of debt.
These results are consistent with two non-mutually exclusive explanations. One is that causality runs from outside directors to the cost of debt: The independence and personal reputational concerns of outside directors induce them to monitor and constrain managers’ ability to engage in self-interested actions. If these self-interested actions are detrimental to either the value of the firm as a whole or to the value of creditors’ claims in particular, the proportion of outside directors is expected to be negatively related to the cost of debt. The second possibility is that because outside directors require timely information to effectively monitor and advise management, firms that are more informationally transparent are able to attract a greater proportion of outside directors to sit on the board. And if a more transparent information environment facilitates less costly contracting with creditors, one again expects to find that the proportion of outside directors is negatively related to the cost of debt. (Note, however, that this latter possibility does not imply that outside directors cause a lower cost of debt.)
3.6 Active Investors
Jensen (1993, 867) discusses the merits of active investors as a governance mechanism:
Active investors are individuals or institutions that simultaneously hold large debt and/or equity positions in a company and actively participate in its strategic direction. Active investors are important to a well-functioning governance system because they have the financial interest and independence to view firm management and policies in an unbiased way. They have the incentives to buck the system to correct problems early rather than late when the problems are obvious but difficult to correct.

FRBNY Economic Policy Review / August 2016 117
To make efficient investing decisions, active investors require timely and reliable information that enables them to monitor management’s actions and to participate in the firm’s strategic direction. Further, as Jensen (1993) notes, active investors have the financial incentives and clout to influence
management’s decisions regarding the timeliness and reliabil-ity of the information conveyed to outsiders. These arguments suggest that information transparency and the presence of active investors are complementary and should therefore be positively correlated.
In an alternative hypothesis, proposed by Demsetz and Lehn (1985) and Bushman et al. (2004), active investors and other effective monitors are most valuable in situations with relatively low information transparency, which leads to a negative relation between transparency and the presence of active investors. Shleifer and Vishny (1997) offer a competing view, suggesting that investors with a relatively large share of a company’s equity or debt (blockholders) can influence management and secure private benefits at the expense of diffuse shareholders and creditors. And if timely and reliable disclosures constrain the ability of blockholders to secure such private benefits, one expects a negative relation between blockholders and information transparency. Therefore, determining the direction of causality of the negative relation between active investors and information transparency may require further tests. Specifically, do active investors gravitate to low transparency firms because that is where their monitor-ing ability is most valuable? Or do these investors instead seek firms with low transparency in an attempt to secure private benefits to the detriment of diffuse shareholders? Perhaps reflecting an amalgamation of these conflicting effects, the empirical evidence is mixed on the relation between various types of active investors and the degree of informa-tion transparency.16
16 See Bushman et al. (2004), Farber (2005), Agrawal and Chadra (2005), Bhojraj and Sengupta (2003), and Ashbaugh, Collins, and LaFond (2006).
Active investors also operate in the market for corporate control, where active investors may choose to acquire a controlling interest in a firm in an attempt to resolve extreme agency conflicts. Ferreira, Ferreira, and Raposo (2011) empha-size the role of the information environment in facilitating the market for corporate control as an alternative to board monitoring. They find that price informativeness, measured by the probability of informed trade, is negatively associated with board independence, and that this result is stronger for firms with more institutional investors and greater exposure to the market for corporate control. These findings suggest that liquid markets with informative security prices can facilitate monitoring by investors, which can sometimes substitute for monitoring by outside directors.
The role of financial reporting in facilitating activity in the market for corporate control has recently gained atten-tion from researchers seeking to understand how potential acquirers obtain the information necessary to make efficient investment decisions. Zhao and Chen (2008) advance a so-called quiet-life hypothesis to explain why weakening the market for corporate control might be associated with greater transparency in financial reporting. They argue that when managers are protected from discipline from the market for corporate control, there is less reason to engage in earnings management to distort the information environment. In a finding consistent with this hypothesis, they show that firms with staggered (or classified) boards, which make a hostile takeover more difficult, have a lower incidence of accounting fraud and smaller absolute abnormal accruals. In a related paper, Armstrong, Balakrishnan, and Cohen (2012) find that firms improved the quality of their financial reporting follow-ing the passage of state antitakeover laws, which weakened the efficacy of the market for corporate control.
3.7 The Difficulty in Identifying “Good” and “Bad” Governance
Underlying our discussion of financial reporting and agency problems is the broad notion that contracting costs and frictions limit the extent to which contracting parties can mitigate these agency problems. The cost of transferring the relevant financial and nonfinancial information to outside directors and shareholders is one such friction. The costs and benefits of transferring information between managers, directors, and shareholders differ across firms, industries, and countries, as well as over time; so one should expect firm-, industry-, and country-specific variation, as well as time-series variation in governance mechanisms. In other
Active investors have the financial
incentives and clout to influence
management’s decisions regarding the
timeliness and reliability of the information
conveyed to outsiders.
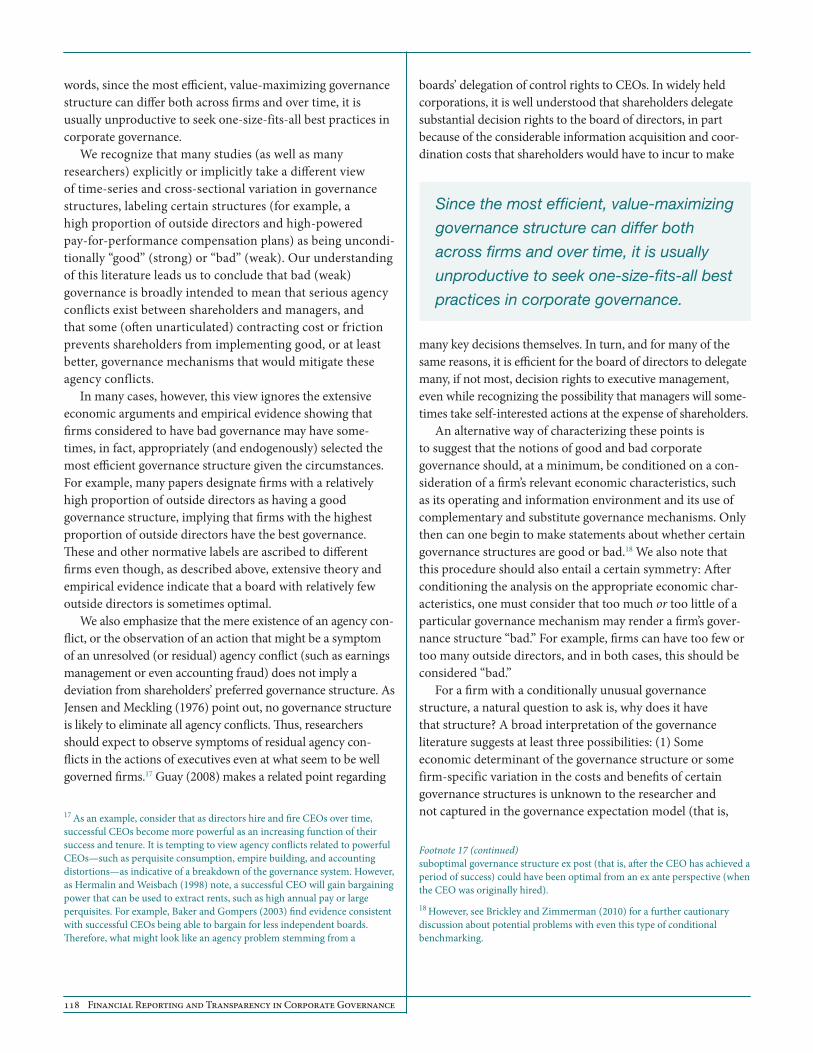
118 Financial Reporting and Transparency in Corporate Governance
words, since the most efficient, value-maximizing governance structure can differ both across firms and over time, it is usually unproductive to seek one-size-fits-all best practices in corporate governance.
We recognize that many studies (as well as many researchers) explicitly or implicitly take a different view of time-series and cross-sectional variation in governance structures, labeling certain structures (for example, a high proportion of outside directors and high-powered pay-for-performance compensation plans) as being uncondi-tionally “good” (strong) or “bad” (weak). Our understanding of this literature leads us to conclude that bad (weak) governance is broadly intended to mean that serious agency conflicts exist between shareholders and managers, and that some (often unarticulated) contracting cost or friction prevents shareholders from implementing good, or at least better, governance mechanisms that would mitigate these agency conflicts.
In many cases, however, this view ignores the extensive economic arguments and empirical evidence showing that firms considered to have bad governance may have some-times, in fact, appropriately (and endogenously) selected the most efficient governance structure given the circumstances. For example, many papers designate firms with a relatively high proportion of outside directors as having a good governance structure, implying that firms with the highest proportion of outside directors have the best governance. These and other normative labels are ascribed to different firms even though, as described above, extensive theory and empirical evidence indicate that a board with relatively few outside directors is sometimes optimal.
We also emphasize that the mere existence of an agency con-flict, or the observation of an action that might be a symptom of an unresolved (or residual) agency conflict (such as earnings management or even accounting fraud) does not imply a deviation from shareholders’ preferred governance structure. As Jensen and Meckling (1976) point out, no governance structure is likely to eliminate all agency conflicts. Thus, researchers should expect to observe symptoms of residual agency con-flicts in the actions of executives even at what seem to be well governed firms.17 Guay (2008) makes a related point regarding
17 As an example, consider that as directors hire and fire CEOs over time, successful CEOs become more powerful as an increasing function of their success and tenure. It is tempting to view agency conflicts related to powerful CEOs—such as perquisite consumption, empire building, and accounting distortions—as indicative of a breakdown of the governance system. However, as Hermalin and Weisbach (1998) note, a successful CEO will gain bargaining power that can be used to extract rents, such as high annual pay or large perquisites. For example, Baker and Gompers (2003) find evidence consistent with successful CEOs being able to bargain for less independent boards. Therefore, what might look like an agency problem stemming from a
boards’ delegation of control rights to CEOs. In widely held corporations, it is well understood that shareholders delegate substantial decision rights to the board of directors, in part because of the considerable information acquisition and coor-dination costs that shareholders would have to incur to make
many key decisions themselves. In turn, and for many of the same reasons, it is efficient for the board of directors to delegate many, if not most, decision rights to executive management, even while recognizing the possibility that managers will some-times take self-interested actions at the expense of shareholders.
An alternative way of characterizing these points is to suggest that the notions of good and bad corporate governance should, at a minimum, be conditioned on a con-sideration of a firm’s relevant economic characteristics, such as its operating and information environment and its use of complementary and substitute governance mechanisms. Only then can one begin to make statements about whether certain governance structures are good or bad.18 We also note that this procedure should also entail a certain symmetry: After conditioning the analysis on the appropriate economic char-acteristics, one must consider that too much or too little of a particular governance mechanism may render a firm’s gover-nance structure “bad.” For example, firms can have too few or too many outside directors, and in both cases, this should be considered “bad.”
For a firm with a conditionally unusual governance structure, a natural question to ask is, why does it have that structure? A broad interpretation of the governance literature suggests at least three possibilities: (1) Some economic determinant of the governance structure or some firm-specific variation in the costs and benefits of certain governance structures is unknown to the researcher and not captured in the governance expectation model (that is,
Footnote 17 (continued) suboptimal governance structure ex post (that is, after the CEO has achieved a period of success) could have been optimal from an ex ante perspective (when the CEO was originally hired).18 However, see Brickley and Zimmerman (2010) for a further cautionary discussion about potential problems with even this type of conditional benchmarking.
Since the most efficient, value-maximizing
governance structure can differ both
across firms and over time, it is usually
unproductive to seek one-size-fits-all best
practices in corporate governance.

FRBNY Economic Policy Review / August 2016 119
certain variables are omitted from the model). (2) Economic frictions prevent shareholders at some firms from instituting the desired (“good”) governance structure, or alternatively the frictions slow down the process (recognizing that it can take time for shareholders and boards to learn about evolving governance structures). (3) Shareholders behave heuristically or irrationally and do not attempt to implement governance mechanisms that maximize shareholder value.
The first of these possibilities was the focus of our forego-ing discussion, and we emphasize that research has already shown that financial reporting characteristics are important determinants of governance structures. We encourage researchers to ensure that their governance models are appro-priately specified and incorporate these determinants. The third possibility may be relevant, but the heuristic/irrational perspective is beyond the scope of this article.19 It is the second possibility, that frictions inhibit the adoption of certain governance structures, that warrants further discussion.
If shareholders recognize that certain governance structures are better (that is, more efficient) than the existing struc-tures—which seems to be the case if one accepts the common argument that good and bad governance structures can be identified with relative ease—it begs the question, what are these frictions that prevent shareholders from making adjust-ments, and how do they vary across firms and over time?
To begin, we suggest that the stage of a firm’s life cycle is likely to be important in explaining observed governance practices. Early in their life cycle, most firms are closely held, with equity ownership concentrated among entrepreneurs, venture capitalists, private equity firms, or other institutional and sophisticated investors. These owners have strong incen-tives to implement an optimal governance structure to ensure that they maximize the price at which they eventually sell their claims to outside investors. Further, at this stage of devel-opment, the selection of governance structures may be less hampered by frictions—including regulations—that exist in widely held firms (although there may be frictions stemming from the process by which owners learn about the merits of alternative firm-specific governance structures). Over time, however, firms change. Closely held firms become widely held, creating a variety of frictions, informational demands, and free-rider problems with respect to adjusting governance structures. Growing firms mature. Firms that originally had
19 For researchers who view heuristic or irrational behavior as a probable explanation for observed governance structures, frictions in the market for corporate control seem to be a fruitful area for research. That is, if groups of irrational shareholders persist in controlling firms with suboptimal governance structures, an obvious question is, what are the frictions that prevent a well-functioning market for corporate control from acting as a correction mechanism?
difficulty conveying information related to their operating strategy and potential for creating value find that financial reporting systems and other disclosure mechanisms are better able to reduce informational asymmetries between managers and outside investors.
We encourage researchers not only to identify and quantify the costs and frictions that prevent or impede firms from adjusting their governance structures, but also to examine how these frictions vary cross-sectionally and over time. The determinants of cross-sectional variation in frictions are likely to include organizational structure, ownership structure, information asymmetry between managers and shareholders, and geography. An example of the influence of geography is provided by Knyazeva, Knyazeva, and Masulis (2013), who show that firms located near smaller pools of pro-spective directors have fewer independent directors and less-experienced directors overall and that this friction can be costly. Similarly, John, Knyazeva, and Knyazeva (2008) argue that the geographic distance between a firm’s headquarters and its investors affects the firm’s information environment which, in turn, affects the firm’s dividend policies.
4. Governance in Banks and Other Financial Intermediaries
In this section, we discuss how some of the key concepts developed in the previous section apply to banks and other financial intermediaries. We place a particular emphasis on how certain features that are unique to financial institutions—and banks in particular—influence their governance structures. In the course of our discussion, we also highlight some important aspects of financial institutions’ governance that have not been examined in the academic research that was the focus of our earlier discussion. Much of the research on the governance of nonfinancial firms abstracts away from the influence of regulations.
In the financial services sector, however, regulatory over-sight is an integral part of bank operations. Consequently, regulatory oversight and compliance play a prominent role in the governance of banks. In addition, much of the regulatory supervision that is unique to banks takes the form of regu-lators communicating with and gathering information from directors who are largely out of sight to external parties such as equity and credit analysts.
Ultimately, the set of governance mechanisms found in banks is likely to reflect not only those mechanisms implemented by shareholders to resolve agency conflicts with directors and managers, but also those instituted by

120 Financial Reporting and Transparency in Corporate Governance
bank regulators to serve the interests of various public constituencies. Banks are thus beholden to a larger set of stakeholders—many of whom may have disparate objectives and incentives that can conflict with those of the banks’ man-agers, directors, and shareholders. The more complex set of agency conflicts that arise in banks pose additional challenges for researchers. For example, regulatory capital requirements often constrain the assets and investments of financial institutions. The shadow cost of these and other regulatory constraints can be high in certain cases, such as when banks attempt to make acquisitions and divestitures (such as selling off branches), or when regulators evaluate a bank’s compliance with statutes.20
The presumed objective of many laws, regulations, and oversight—whether explicit or implicit, observed or unob-served—is the public’s interest in safe and sound financial institutions. The public’s interest in the soundness of the banking system stems from banks being unique financial intermediaries in the economy, as well as being insured depos-itory institutions. Banks provide liquidity as well as access to the U.S. payment system. The recent financial crisis serves as a reminder that the failure of a large, interconnected financial institution can rapidly propagate throughout the financial system and can result in far-reaching adverse effects on the domestic and global economy. Although the public expects safety, investors demand performance, which necessarily entails taking risks. The tension between these two objectives is a ripe topic for future research.
A related challenge for researchers—especially during the last three decades—has been to understand what is special about banks and other financial institutions in the evolving economic, political, and regulatory landscape (and in the context of the theory of the firm). That challenge also applies to understanding the structure of financial firms and their conduct in response to deregulation and subsequent reregula-tion.21 A better understanding of these issues is important for effective and informed public policy.
20 For example, under the Community Reinvestment Act (CRA), regulators are required to consider a bank’s record of providing credit to low- and moderate-income neighborhoods and individuals when considering the bank’s application for a merger or acquisition. Building on this idea, Bostic et al. (2005) test the hypothesis that banks contemplating mergers or acquisitions act strategically by increasing their lending to low- and moderate-income individuals to influence regulators. Bostic et al. find evidence that is consistent with this type of strategic behavior. Thus, the dynamic interaction between banks and regulators makes it difficult to generalize some of the findings from earlier studies on governance, board structure, and conduct (such as evidence on economies of scale and cost efficiency in banking).21 For example, the Riegle-Neal Interstate Banking and Branching Efficiency Act of 1994, which eliminated restrictions on interstate banking and branching; the 1999 Gramm-Leach-Bliley Act, which repealed the
The evolving nature of banking, regulation, and the public’s expectations for safe financial institutions adds an addi-tional layer of complexity when examining the governance and information environments of these institutions. Some of the more pressing questions that need to be addressed are given below:
• Are the internal and informal governance mechanisms of banks a substitute for, or a complement to, supervision and regulation?
• Should boards—whose mandate is to ensure effective internal governance of a financial firm—consider bank regulators as partners or adversaries? Similarly, should regulators consider bank boards to be their partners? If so, what are the potential benefits and costs of such a relationship?
• What economic models could shed light on issues such as delegation of authority, assignment of responsibility, and design of incentive-compatible tasks?
To help frame these and other important questions, we highlight several unique features of bank governance that have been emphasized in banking studies.
4.1 What Is Different about the Governance of Banks and What Governance Structure Is Most Efficient?
Earlier research has documented a number of prominent differences between the governance structures of financial and nonfinancial institutions. For example, relative to their nonfinancial counterparts, banks tend to have larger boards, more outside directors and more committees, less equity-based compensation and insider ownership, less block ownership by institutions, and more CEOs who also serve as chairman of the board.22 These differences do not necessarily imply that these are efficient arrangements for the financial stability of the banking system. They may be transitory, and the optimal governance structure for shareholders may deviate from the structure that would be optimal from a social welfare perspective.
Footnote 21 (continued) 1933 Glass-Steagall Act; and in the wake of the global financial crisis, the 2010 Dodd-Frank Act, which imposed extensive regulations on banks.22 See, for example, Adams and Mehran (2003), Hayes et al. (2004), Core and Guay (2010), Adams and Mehran (2012), and Mehran, Morison, and Shapiro (2012).

FRBNY Economic Policy Review / August 2016 121
Moreover, previous evidence on structure gathered in periods when bank bailouts were expected, may well have become outdated because of subsequent regulatory reforms in the Dodd-Frank Act and elsewhere. Those reforms may have moderated expectations about the likelihood of future bailouts and increased expectations about the likelihood of “orderly resolutions” of distressed financial institutions. It is therefore possible, and perhaps even likely, that financial institutions will alter their governance structures going forward, either volun-tarily or by law. Indeed, early evidence from 2014 proxy filings (Form DEF-14A) with the Securities and Exchange Commission
suggests that the number of banks choosing to have a standing risk committee at the board level has risen.
The Dodd-Frank Act’s introduction of so-called living wills and its explicit prohibition against future bailouts are two of the law’s key elements that are likely to influence the dynamics of governance mechanisms. We conjecture that these regulatory changes are likely to affect stakeholders’ perceptions of the risk associated with banks and may also affect banks’ cost of capital. Consistent with this idea, Mehran and Mollineaux (2012) discuss how the new regulations affect equity analysts’ risk perceptions. In particular, they argue that banks are likely to enhance their voluntary disclosure and pro-actively seek ways to ensure that they pass the annual stress test of capital adequacy required under Dodd-Frank. These actions should, in turn, expand the information available to bank stakeholders, including investors, as we note below.
We also suggest that annual stress testing, one of the more conspicuous aspects of recent reforms, may provide different incentives for financial institutions’ various stakeholders. The test is likely to both reduce the incentive for informa-tion production by analysts (Mehran 2010; Goldstein and Sapra 2013) and enhance management’s incentives to make voluntary disclosures. Regarding the second point, just as firms that expect to miss earnings targets frequently make preemptive announcements, banks may benefit from pro-actively disclosing negative information about their capital conditions before regulators release the news after their
annual review.23 In doing so, management can influence how stakeholders interpret the negative test results and potentially ameliorate the negative consequences the firm may face in the equity and credit markets. Further, regular voluntary disclosures could be perceived by investors as a commitment to transparency (the benefits of which are discussed in Guay and Verrecchia [2007]) and as an indication of a cooperative relationship between management and regulators.
4.2 Banks’ Information Environment and Opacity
The efficacy of capital markets in monitoring the health and riskiness of financial institutions is an important research question—particularly in the wake of the recent financial crisis. Extant research that compares the transparency of banks with that of nonfinancial firms provides mixed results.24 For example, Morgan (2002) examines bond analyst ratings and finds that the dispersion of ratings is larger for banks than for other firms. He interprets this finding as supporting the notion that banks’ assets are “opaque.” In contrast, Flannery, Kwan, and Nimalendran (2004) report that banks and nonfinancial firms have equity bid-ask spreads of similar magnitude; the authors, in general, do not find empirical support for the notion that banks are more opaque than nonfinancial firms.
Other research examines whether security prices of banks react differently to news about corporate developments and financial condition than do securities prices of nonfinancial firms. One potential reason for a differential reaction is the influence of bank regulators on both bank strategic decisions and bank disclosure. For example, investors may differentially react to equity issuances, given that banks typically issue equity to maintain regulatory capital, whereas nonfinancial firms tend to do so to fund investment opportunities. The reactions to news about poor financial health may also differ because of investor uncertainty about the regulatory response to the news—for example, regulators may intercede on the bank’s behalf, or prevent or require certain corrective actions, or suppress or encourage certain disclosures. The results from
23 At the same time, firms may also have incentives to strategically time their disclosure of negative information. For example, if it is likely to reduce the price a firm expects to receive from a pending sale, then it may delay disclosure until the sale is completed.24 See Beatty and Liao (2014) and Bushman (2014) for a comprehensive review of the literature on financial reporting and transparency in financial institutions.
The Dodd-Frank Act’s introduction of
so-called living wills and its explicit
prohibition against future bailouts are
two of the law’s key elements that
are likely to influence the dynamics of
governance mechanisms.

122 Financial Reporting and Transparency in Corporate Governance
this literature are generally mixed. The main finding is that the market reaction is more pronounced for firms that face larger information asymmetries.25
Flannery, Kwan, and Nimalendran (2013) extend these ideas, examining whether the greater opacity of banks relative to nonfinancial firms varies with the state of the economy. Their results indicate that although banks and other firms exhibit similar degrees of opacity during periods of stability, banks are relatively more opaque during financial crises, where opacity is measured using bid-ask spreads and the price impact of trades. These results raise a question about the roles of managers, investors, creditors, and regulators in influencing transparency at various points in time. The following scenario discusses and illustrates these roles and the incentives that the various parties face.
Suppose that three parties are involved in the production of information in the banking sector: bank managers, equity and credit analysts, and regulators. Now consider each party’s incentives for information disclosure.
• Bank managers: Bank management is expected to be reluctant to release timely bad news if it perceives that its disclosure could result in a shift of its control rights to regulators, creditors, or other stakeholders. Thus, bad news might be concealed from regulators, which would make early discovery of problems harder for regulators. Bad news would also likely reach other stakeholders relatively late. Thus, the amount of managements’ adverse private information could be large during normal times and even larger during times of crisis.
• Analysts: Given the asymmetric nature of the payoffs to equity and debt securities, equity analysts are likely to be more active than credit analysts in their coverage of a firm when its equity price is high. Conversely, when the equity price is low, equity analysts are likely to be relatively passive and credit analysts relatively active. In fact, many firms are unlikely to have equity analyst coverage in the six months prior to their bankruptcy filings (Mehran and Peristiani 2006), while credit analysts may begin to devote effort to valuing the assets-in-place in anticipation of a sell-off or other forms of restructuring. However, credit analysts have less of an incentive to evaluate banks in financial distress because of their expectation of regulatory supervision and intervention as well as the potential for a bailout.
25 See, for example, Ryan (2012) for an overall review of this literature on market reactions to news; Cornett et al. (2014) regarding news of stock issuances; and Gupta, Harris, and Mehran (2015) for news of mergers and acquisitions.
• Regulators: It is not clear whether regulators strategically time the release of bad news about banks. Moreover, the size of potential losses may be uncertain at the time that regulators disclose this information to stakeholders. With later disclosure, the effect on security prices might be large.
The foregoing description of each party’s incentives may evolve in light of recent banking reforms, such as living wills. If the reforms improve the value of information and consequently enhance the incentive for its production, banks’ security prices may become more informative about growth and risk under a wider range of circumstances. Further research on this topic would be helpful for the effective regu-lation of banks.
4.3 Bank Governance during Financial Distress
An important challenge for bank stakeholders is preventing financial distress and, if it should arise, localizing and containing any adverse consequences. Potential defaults and subsequent runs by creditors and fire sales of assets witnessed during the recent financial crisis are a reminder of the potential social costs associated with the distress and failure of systemically important financial institutions.26 The risk of such negative outcomes is largely due to the nature of banks’ assets and the relatively rapid speed at which the value of their assets can deteriorate. These features of the banking system can make workouts and bankruptcy more challenging.27 Similarly, governance changes in the face of financial distress, including replacing management and the board, can be more difficult in the banking sector, notwithstanding the view often expressed that banks should be held to a higher level of accountability.28 It will be interesting to see whether the Dodd-Frank resolution model that allows banks to fail will impose new discipline on banks’ choice of governance structures.
A related issue is management’s control of information in bad times and the potential for information asymmetry with respect to the board and regulators. As we indicated
26 Firms with substantial intangible assets, including financial institutions, are likely to be especially vulnerable to negative news about their financial health and viability.27 See Skeel (2015) for further discussion.28 A potential exception might be government-assisted acquisitions, which occurred in a few cases during the recent financial crisis.

FRBNY Economic Policy Review / August 2016 123
earlier, in difficult times, CEOs are more likely to withhold bad news about their poor performance or news that could otherwise be detrimental to their interests. This incentive may be particularly pronounced for bank managers if they perceive that the information could result in a loss of control rights to regulators and other stakeholders. In addition, if managers privately know that their bank is in distress, their expectation of a bailout—whether justified or not—may provide them with strong risk-taking incentives: they would benefit from the upside, but would be at least somewhat protected on the downside (although their assessment could be complicated by marketwide shocks and correlated risks). Alternatively, manag-ers’ personal costs of taking action are particularly high during times of financial distress, this could dampen their incentives, especially if the benefits accrue largely to other stakeholders.
The foregoing discussion highlights the fact that management typically has more information than the board, and that the information disparity is expected to be more pronounced during bad times—particularly when the information is firm-specific rather than related to market and industry conditions. Thus, the board and regulators are likely to be at their greatest informa-tional disadvantage relative to management when shareholders and the public are most in need of well-informed directors. This issue is of vital importance in the financial services industry, where timely decision making is crucial during crises because of the potentially systemic effects of these decisions.
4.4 Considerations for Improving Information Flow
As highlighted above, information flow between insiders and outside stakeholders is an important component of efficient governance for all institutions. We now discuss several mechanisms with which financial institutions could increase the flow of timely information to outsiders. Modifying governance structures to achieve a desired result entails both costs and benefits that warrant careful evaluation. The following measures seem well worth considering.
Separating the Positions of CEO and Board ChairA number of studies highlight the benefits and costs of splitting the roles of CEO and board chair. A potential benefit of an independent board chair is an incentive to accurately disclose timely information to regulators, especially information that may help avert large losses to stakeholders. An alternative to separating the CEO and chair positions is providing a strong
lead director who can act as a check on the information flow from management. If the change is initiated from the regulatory side, the authorities could provide flexibility by requiring that the board either separate the roles of CEO and board chair or publicly explain why it chose not to do so.
Succession PlanningIdentifying successors to replace key individuals in the executive management team (including the CEO and CFO), should the need arise, is likely to contribute to an effective transition and a smoother flow of information. Although succession planning can generate tension between the incumbent executives and their designated replacements, the incumbents should recognize that they may be replaced under some eventuality, and thus their objective might be to avoid the realization of those situations. Moreover, some executives may not be able to execute their duties or may be forced to step down quickly because of unanticipated events. Naming and training potential replacements before a crisis strikes ensures continuity in the flow of information to stakeholders. Furthermore, a credible replacement could assist regulators and the board in the event that they need to quickly replace the CEO of a distressed institution. (The question of who knows the bank’s assets and could manage the bank if the management of a large institution were to be terminated was a widely discussed issue during the financial crisis.)
Identifying a credible replacement may also incentivize incumbent CEOs to work harder and smarter, and may also reduce their appetite for risk. In addition, potential successors (assuming they are internal candidates) are likely to commu-nicate serious problems to the board because it increases the likelihood of their becoming CEO; delaying the disclosure of current problems may adversely affect their personal rep-utation and remuneration if the information is subsequently released during their tenure. Again, regulators may consider requiring financial institutions to either publicly disclose, or privately disclose to regulators, a viable and ongoing succes-sion plan for certain executive offices.
Information Sharing with Supervisors Regulators and managers can be encouraged to work together as a team to identify and address nascent issues.29 As noted earlier, bank insiders generally know about problems before regulators do and have a much better understanding of
29 See Harris and Raviv (2014) for an alternative approach to providing incentives for sharing bad news with regulators.

124 Financial Reporting and Transparency in Corporate Governance
firm-specific deficiencies and vulnerabilities. A regulatory system could be developed that rewards bank managers who inform regulators in a timely manner about bad news concerning their firm or industry. For example, information that is shared sooner could command a larger reward (or entail a lesser punishment).30 Rewarding the prompt disclosure of bad information can be justified on the grounds that it promotes cooperation with regulators.31 Further, it could reduce the likelihood of incurring even larger social costs from bank failures and possibly widespread market failure. Regulators could induce competition for early disclosure by rewarding banks that share information both with regulators and each other.
Sharing the Results of Director Peer Assessments and Board Self-Evaluations with Regulators
Peer assessments can arguably provide valuable information about the performance of specific directors and, ultimately, about the efficacy of the board as a whole. Directors are likely to differ in their reputation risk, which can lead to negative selection, whereby less reputable or less competent directors remain on the board while superior directors do not seek additional terms. Peer assessment, board self-evaluation, and sharing those results with regulators can facilitate the removal of ineffective directors, which benefits the remaining directors and other stakeholders.
Encouraging Activists in the Credit Market Adams and Mehran (2003) argue that equity blockholders are relatively more passive in the banking industry because of the constraining effects of regulation on blockholders’ actions. Consequently, the potential benefits of activist investor
30 For some evidence, see “Financial Crime: Unsettling Settlements,” The Economist, May 23, 2015.31 Alternatively, rewarding the disclosure of bad news can be more formally justified by appeal to the mechanism design literature and the requirement that truth-telling be incentive compatible.
involvement that have been documented in nonfinancial firms that are either in financial distress or troubled by inefficiencies associated with large agency problems are less likely to be available to financial institutions. However, bank creditors remain a potential source of greater activism. Mehran and Mollineaux (2012) find that bank creditors tend to be highly concentrated among large institutions. In a regulatory regime without bailouts, prices of debt securities at issuance are more likely to reflect default probability. Anticipating relatively large losses in the event of financial distress, creditors could become more proactive monitors, as argued by Shleifer and Vishny (1997).
5. Conclusion
We review the recent corporate governance literature that examines the role of financial reporting in resolving agency conflicts among a firm’s managers, directors, and shareholders. Although most of the research we review is large-sample and not specific to a particular industry, we transpose several arguments in this literature to consider the firm-specific governance structures and financial reporting systems of financial institutions.
Financial reporting plays an important role in reducing the information asymmetries that exist between managers and both outside directors and shareholders. Our discussion highlights the distinction between formal and informal con-tracting relationships and shows how both help shape a firm’s overall governance structure and information environment. We stress that a firm’s governance structure and its informa-tion environment evolve together over time to resolve agency conflicts. Consequently, we expect to observe different gover-nance structures and financial reporting choices in different economic environments.
In the financial sector, the observed bank governance structures are likely the result of not only endogenous design, but also the existence of certain external monitoring mecha-nisms, including regulators. These may partly substitute for internal monitoring mechanisms, and they may evolve to serve the interests of shareholders and other stakeholders.

FRBNY Economic Policy Review / August 2016 125
ReferencesReferences
Adams, R. B., and D. Ferreira. 2007. “A Theory of Friendly Boards.” Journal of Finance 62, no. 1 (February): 217-50.
Adams, R. B., B. E. Hermalin, and M. S. Weisbach. 2010. “The Role of Boards of Directors in Corporate Governance: A Conceptual Framework and Survey.” Journal of Economic Literature 48, no. 1 (March): 58-107.
Adams, R., and H. Mehran. 2003. “Is Corporate Governance Different for Bank Holding Companies?” Federal Reserve Bank of New York Economic Policy Review 9, no. 1 (April): 123-42.
———. 2012. “Bank Board Structure and Performance: Evidence for Large Bank Holding Companies.” Journal of Financial Intermediation 21, no. 2 (April): 243-67.
Aghion, P., and J. Tirole. 1997. “Formal and Real Authority in Organizations.” Journal of Political Economy 105, no. 1 (February): 1-29.
Agrawal, A., and S. Chadha. 2005. “Corporate Governance and Accounting Scandals.” Journal of Law and Economics 48, no. 2 (October): 371-406.
Ahmed, A. S., and S. Duellman. 2007. “Accounting Conservatism and Board of Director Characteristics: An Empirical Analysis.” Journal of Accounting and Economics 43, no. 2-3 (July): 411-37.
Anderson, R. C., S. A. Mansi, and D. M. Reeb. 2004. “Board Characteristics, Accounting Report Integrity, and the Cost of Debt.” Journal of Accounting and Economics 37, no. 3 (September): 315-42.
Armstrong, C. S., K. Balakrishnan, and D. Cohen. 2012. “Corporate Governance and the Information Environment: Evidence from State Antitakeover Laws.” Journal of Accounting and Economics 53, no. 1-2 (February-April): 185-204.
Armstrong, C. S., J. E. Core, and W. R. Guay. 2014. “Do Independent Directors Cause Improvements in Firm Transparency?” Journal of Financial Economics 113, no. 3 (September): 383-403.
Armstrong, C. S., W. R. Guay, and J. P. Weber. 2010. “The Role of Information and Financial Reporting in Corporate Governance and Debt Contracting.” Journal of Accounting and Economics 50, no. 2-3 (December): 179-234.
Ashbaugh-Skaife, H., D. W. Collins, and R. LaFond. 2006. “The Effects of Corporate Governance on Firms’ Credit Ratings.” Journal of Accounting and Economics 42, no. 1-2 (October): 203-43.
Baker, M., and P. A. Gompers. 2003. “The Determinants of Board Structure at the Initial Public Offering.” Journal of Law and Economics 46, no. 2 (October): 569-98.
Ball, R., and L. Shivakumar. 2005. “Earnings Quality in UK Private Firms: Comparative Loss Recognition Timeliness.” Journal of Accounting and Economics 39, no. 1 (February): 83-128.
Beatty, A., and S. Liao. 2014. “Financial Accounting in the Banking Industry: A Review of the Empirical Literature.” Journal of Accounting and Economics 58, no. 2-3 (November-December): 339-83.
Bedard, J., R. Hoitash, and U. Hoitash. 2014. “Chief Financial Officers as Inside Directors.” Contemporary Accounting Research 31, no. 3 (Fall): 787-817.
Bhojraj, S., and P. Sengupta. 2003. “Effects of Corporate Governance on Bond Ratings and Yields: The Role of Institutional Investors and Outside Directors.” Journal of Business 76, no. 3 (July): 455-75.
Boone, A., L. C. Field, J. M. Karpoff, and C. G. Raheja. 2007. “The Determinants of Corporate Board Size and Composition: An Empirical Analysis.” Journal of Financial Economics 85, no. 1 (July): 66-101.
Bostic, R., H. Mehran, A. Paulson, and M. Saidenberg. 2005. “Regulatory Incentives and Consolidation: The Case of Commercial Bank Mergers and the Community Reinvestment Act.” B.E. Journal of Economic Analysis and Policy 5, no. 1 (April): 1-27.
Brickley, J. A., J. L. Coles, and G. Jarrell. 1997. “Leadership Structure: Separating the CEO and Chairman of the Board.” Journal of Corporate Finance 3, no. 3 (June): 189-220.
Brickley, J. A., J. S. Link, and J. L. Coles. 1999. “What Happens to CEOs after They Retire? New Evidence on Career Concerns, Horizon Problems, and CEO Incentives.” Journal of Financial Economics 52, no. 3 (June): 341-77.
Brickley, J. A., and J. L. Zimmerman. 2010. “Corporate Governance Myths: Comments on Armstrong, Guay, and Weber.” Journal of Accounting and Economics 50, no. 2-3 (December): 235-45.

126 Financial Reporting and Transparency in Corporate Governance
Bushman, R. M. 2014. “Thoughts on Financial Accounting and the Banking Industry.” Journal of Accounting and Economics 58, no. 2-3 (November-December): 384-95.
Bushman, R., Q. Chen, E. Engel, and A. Smith. 2004. “Financial Accounting Information, Organizational Complexity, and Corporate Governance Systems.” Journal of Accounting and Economics 37, no. 2 (June): 167-201.
Cai, J., Y. Qian, and Y. Liu. 2009. “Information Asymmetry and Corporate Governance.” Drexel College of Business Research Paper no. 2008-02. Available at http://dx.doi .org/10.2139/ssrn.1082589.
Carcello, J., and T. Neal. 2000. “Audit Committee Composition and Auditor Reporting.” Accounting Review 75, no. 4 (October): 453-67.
———. 2003. “Audit Committee Characteristics and Auditor Dismissals Following ‘New’ Going-Concern Reports.” Accounting Review 78, no. 1 (January): 95-117.
Coles, J. L., N. D. Daniel, and L. Naveen. 2008. “Boards: Does One Size Fit All?” Journal of Financial Economics 87, no. 2 (February): 329-56.
Core, J. E., and W. R. Guay. 2010. “Is There a Case for Regulating Executive Pay in the Financial Services Industry?” In Y. Fuchita, R. Herring, and R. Litan, eds., After the Crash: The Future of Finance, 115-40. Washington: Brookings Institution Press.
Core, J. E., W. R. Guay, and D. F. Larcker. 2003. “Executive Equity Compensation and Incentives: A Survey.” Federal Reserve Bank of New York Economic Policy Review 9, no. 1 (April): 27-50.
Core, J. E., R. W. Holthausen, and D. F. Larcker. 1999. “Corporate Governance, Chief Executive Officer Compensation, and Firm Performance.” Journal of Financial Economics 51, no. 3 (March): 371-406.
Cornett, M. M., H. Mehran, K. Pan, M. Phan, and C. Wei. 2014. “CDS and Equity Market Reactions to Stock Issuances in the U.S. Financial Industry: Evidence from the 2002-13 Period.” Federal Reserve Bank of New York Staff Reports, no. 697.
DeFond, M. L., R. N. Hann, and X. Hu. 2005. “Does the Market Value Financial Expertise on Audit Committees of Boards of Directors?” Journal of Accounting Research 43, no. 2 (May): 153-93.
Demsetz, H., and K. Lehn. 1985. “The Structure of Corporate Ownership: Causes and Consequences.” Journal of Political Economy 93, no. 6 (December): 1155-77.
Drymiotes, G. 2007. “The Monitoring Role of Insiders.” Journal of Accounting and Economics 44, no. 3 (December): 359-77.
Duchin, R., J. G. Matsusaka, and O. Ozbas. 2010. “When Are Outside Directors Effective?” Journal of Financial Economics 96, no. 2 (May): 195-214.
Engel, E. 2005. “Discussion of ‘Does the Market Value Financial Expertise on Audit Committees of Boards of Directors?’” Journal of Accounting Research 43, no. 2 (May): 195-204.
Engel, E., R. M. Hayes, and X. Wang. 2003. “CEO Turnover and Properties of Accounting Information.” Journal of Accounting and Economics 36, nos. 1-3 (December):197-226.
Fama, E., and M. Jensen. 1983. “Separation of Ownership and Control.” Journal of Law and Economics 26, no. 2 (June): 301-25.
Farber, D. 2005. “Restoring Trust after Fraud: Does Corporate Governance Matter?” Accounting Review 80, no. 2 (April): 539-61.
Ferreira, D., M. A. Ferreira, and C. C. Raposo. 2011. “Board Structure and Price Informativeness.” Journal of Financial Economics 99, no. 3 (March): 523-45.
Flannery, M. J., S. H. Kwan, and M. Nimalendran. 2004. “Market Evidence on the Opaqueness of Banking Firms’ Assets.” Journal of Financial Economics 71, no. 3 (March): 419-60.
———. 2013. “The 2007-09 Financial Crisis and Bank Opaqueness.” Journal of Financial Intermediation 22, no. 1 (January): 55-84.
Francis, J. R., and X. Martin. 2010. “Acquisition Profitability and Timely Loss Recognition.” Journal of Accounting and Economics 49, nos. 1-2 (February): 161-78.
References (Continued)

FRBNY Economic Policy Review / August 2016 127
Gerety, M., and K. Lehn. 1997. “The Causes and Consequences of Accounting Fraud.” Managerial and Decision Economics 18, nos. 7-8 (November-December): 587-99.
Gillan, S., J. C. Hartzell, and L. T. Starks. 2006. “Tradeoffs in Corporate Governance: Evidence from Board Structures and Charter Provisions.” University of Texas at Austin, June. Available at http://ssrn.com/abstract=917544.
Goldstein, I., and H. Sapra. 2014. “Should Banks’ Stress Test Results be Disclosed? An Analysis of the Costs and Benefits.” Foundations and Trends in Finance 8, no. 1 (March): 1-54.
Guay, W. R. 2008. “Conservative Financial Reporting, Debt Covenants, and the Agency Costs of Debt.” Journal of Accounting and Economics 45, nos. 2-3 (August): 175-80.
Guay, W., and R. Verrecchia. 2007. “Conservative Disclosure.” Unpublished paper, University of Pennsylvania, June. Available at http://ssrn.com/abstract=995562.
Gupta, A., R. Harris, and H. Mehran. 2015. “M&A Performance in the Financial Services Industry.” Unpublished paper, Federal Reserve Bank of New York.
Harris, M., and A. Raviv. 2008. “A Theory of Board Control and Size.” Review of Financial Studies 21, no. 4 (July): 1797-1832.
———. 2014. “How to Get Banks to Take Less Risk and Disclose Bad News.” Journal of Financial Intermediation 23, no. 4 (October): 437-70.
Hayes, R., H. Mehran, and S. Schaefer. 2004. “Determinants of Board Committee Structures and Incentives.” Unpublished paper, Federal Reserve Bank of New York.
Hermalin, B. E., and M. S. Weisbach. 1998. “Endogenously Chosen Boards of Directors and Their Monitoring of the CEO.” American Economic Review 88, no. 1 (March): 96-118.
———. 2003. “Boards of Directors as an Endogenously Determined Institution: A Survey of the Economic Literature.” Federal Reserve Bank of New York Economic Policy Review 9 (April): 7-26.
Hoitash, U., R. Hoitash, and J. Bedard. 2009. “Corporate Governance and Internal Control over Financial Reporting: A Comparison of Regulatory Regimes.” Accounting Review 84, no. 3 (May): 839-67.
Hoitash, R., U. Hoitash, and K. Johnstone. 2012. “Internal Control Material Weaknesses and CFO Compensation.” Contemporary Accounting Research 29, no. 3 (September): 768-803.
Holderness, C. G. 2003. “A Survey of Blockholders and Corporate Control.” Federal Reserve Bank of New York Economic Policy Review 9, no. 1 (April): 51-64.
Holmstrom, B. 2005. “Pay without Performance and the Managerial Power Hypothesis: A Comment.” Journal of Corporation Law 30, no. 4 (Summer): 703-13.
Huebner, M., and H. McCullough. 2008. “The Fiduciary Duties of Directors of Troubled U.S. Companies: Emerging Clarity.” In International Comparative Legal Guides, Corporate Recovery and Insolvency 2008. London, Global Legal Group.
Jensen, M. 1993. “The Modern Industrial Revolution, Exit, and the Failure of Internal Control Systems.” Journal of Finance 48, no. 3 (July): 831-80.
Jensen, M., and W. Meckling. 1976. “Theory of the Firm: Managerial Behavior, Agency Costs, and Ownership Structure.” Journal of Financial Economics 3, no. 4 (October): 305-60.
———. 1992. “Specific and General Knowledge, and Organizational Structure.” In L. Werin and H. Wijkander, eds., Contract Economics, 251-74. Oxford: Blackwell.
John, K., A. Knyazeva, and D. Knyazeva. 2008. “Do Shareholders Care about Geography?” Unpublished paper, University of Rochester, September. Available at http://www.efmaefm .org/0EFMAMEETINGS/EFMA%20ANNUAL%20MEETINGS/2009-Milan/papers/EFMA2009_0488_fullpaper.pdf.
Klein, A. 2002a. “Economic Determinants of Audit Committee Independence.” Accounting Review 77, no. 3 (April): 435-52.
———. 2002b. “Audit Committee, Board of Director Characteristics, and Earnings Management.” Journal of Accounting and Economics 33, no. 3 (August): 375-400.
Knyazeva, A., D. Knyazeva, and R. Masulis. 2013. “The Supply of Corporate Directors and Board Independence.” Review of Financial Studies 26, no. 6: 1561-605.
References (Continued)

128 Financial Reporting and Transparency in Corporate Governance
Kothari, S. P., S. Shu, and P. D. Wysocki. 2009. “Do Managers Withhold Bad News?” Journal of Accounting Research 47, no. 1 (March): 241-76.
Krishnan, J. 2005. “Audit Committee Quality and Internal Control: An Empirical Analysis.” Accounting Review 80, no. 2 (April): 649-75.
Lehn, K., S. Patro, and M. Zhao. 2009. “Determinants of the Size and Composition of US Corporate Boards: 1935-2000.” Financial Management 38, no. 4 (Winter): 747-80.
Leuz, C., and R. Verrecchia. 2000. “The Economic Consequences of Increased Disclosure. In “Studies on Accounting Information and the Economics of the Firm,” supplement, Journal of Accounting Research 38: 91-124.
Li, C., L. Sun, and M. Ettredge. 2010. “Financial Executive Qualifications, Financial Executive Turnover, and Adverse SOX 404 Opinions.” Journal of Accounting and Economics 50, no. 1 (May): 93-110.
Linck, J., J. Netter, and T. Yang. 2008. “The Determinants of Board Structure.” Journal of Financial Economics 87, no. 2: 308-28.
Mehran, H. 1995. “Executive Compensation Structure, Ownership, and Firm Performance.” Journal of Financial Economics 38, no. 2 (June): 163-84.
———. 2010. “The Effect of Disclosure on Information Production by Analysts.” Memo, Federal Reserve Bank of New York.
Mehran, H., and L. Mollineaux. 2012. “The Corporate Governance of Financial Institutions.” Annual Review of Financial Economics 4 (October): 215-32.
Mehran, H., A. Morison, and J. Shapiro. 2012. “Corporate Governance and Banks: What Have We Learned from the Financial Crisis?” In M. Dewatripont and X. Freixas, eds., The Crisis Aftermath: New Regulatory Paradigms, 11-44. London: Center for Economic and Policy Research.
Mehran, H., and S. Peristiani. 2006. “Analysts Following and Financial Distress.” Memo, Federal Reserve Bank of New York.
Raheja, C. 2005. “Determinants of Board Size and Composition: A Theory of Corporate Boards.” Journal of Financial and Quantitative Analysis 40, no. 2 (June): 283-306.
Ryan, S. G. 2012. “Financial Reporting for Financial Instruments.” Foundations and Trends in Accounting 6, no. 3-4: 187-354.
Shleifer, A., and R. Vishny. 1997. “A Survey of Corporate Governance.” Journal of Finance 52, no. 2 (June): 737-83.
Skeel, D. 2015. “The New Synthesis of Bank Regulation and Bankruptcy in the Dodd-Frank Era.” University of Pennsylvania Institute for Law and Economics Research Paper, no. 15-22.
Srinivasan, S. 2005. “Consequences of Financial Reporting Failure for Outside Directors: Evidence from Accounting Restatements and Audit Committee Members.” Journal of Accounting Research 43, no. 2 (May): 291-334.
Verrecchia, R. E. 2001. “Essays on Disclosure.” Journal of Accounting and Economics 32, no. 1-3: 97-180.
Wang, X. 2010. “Increased Disclosure Requirements and Corporate Governance Decisions: Evidence from Chief Financial Officers in the Pre- and Post-Sarbanes-Oxley Periods.” Journal of Accounting Research 48, no. 4 (September): 885-920.
Watts, R. 2003. “Conservatism in Accounting, Part I: Explanations and Implications.” Accounting Horizons 17, no. 3: 207-21.
Xie, B., W. Davidson, and P. J. DaDalt. 2003. “Earnings Management and Corporate Governance: The Role of the Board and the Audit Committee.” Journal of Corporate Finance 9, no. 3 (June): 295-316.
Yermack, D. 2004. “Remuneration, Retention, and Reputation Incentives for Outside Directors.” Journal of Finance 59, no. 5 (October): 2281-308.
Zhao, Y., and K. H. Chen. 2008. “Staggered Boards and Earnings Management.” Accounting Review 83, no. 5 (September): 1347-81.
References (Continued)
The views expressed are those of the authors and do not necessarily reflect the position of the Federal Reserve Bank of New York or the Federal Reserve System. The Federal Reserve Bank of New York provides no warranty, express or implied, as to the accuracy, timeliness, completeness, merchantability, or fitness for any particular purpose of any information contained in documents produced and provided by the Federal Reserve Bank of New York in any form or manner whatsoever.

FRBNY Economic Policy Review / August 2016 129
Robert M. Bushman is the Forensic Accounting Distinguished Professor and Area Chair of Accounting at the Kenan-Flagler Business School, University of North Carolina at Chapel Hill.
The author thanks Hamid Mehran, Brad Hendricks, Christopher Williams, and Jianxin (Donny) Zhao for helpful comments, and the Kenan-Flagler Business School, University of North Carolina at Chapel Hill. The views expressed in this article are those of the author and do not necessarily reflect the position of the Federal Reserve Bank of New York or the Federal Reserve System.
The author declares that he has no relevant or material financial interests that relate to the research described in this article.
Robert M. Bushman
An important unresolved issue is the extent to which bank transparency promotes or undermines bank stability. A large theory literature explores bank transparency and how it affects the risk profile of individual banks and the financial system as a whole. Overall, this literature finds that while credible public information about individual banks can enhance the ability of regulators and market participants to monitor and exert discipline on banks’ behavior, there are also endogenous costs associated with transparency that can be detrimental to the banking system.
Consider the positive effects of transparency. Transpar-ency plays a fundamental corporate governance role in all industries, supporting monitoring by boards of directors, outside investors, and regulators, as well as the exercise of investor rights granted by existing laws. Credible, publicly available information is used to assess and reward the actions and performance of top executives and is incorpo-rated into the design of incentive compensation contracts and decisions about when to fire executives (Bushman and Smith 2001; Armstrong, Guay, and Weber 2010). For banks, however, the role of information transcends the classic governance objective of aligning the behavior of executives with the interests of shareholders. Banks face distinctive gov-ernance challenges because they must balance the demands of being value-maximizing entities with those of serving the public interest (Mehran and Mollineaux 2012; Mehran, Morrison, and Shapiro 2011). High leverage combined with
Transparency, Accounting Discretion, and Bank Stability
1. Introduction
Bank transparency can be defined as the availability to outside stakeholders of relevant, reliable information about the periodic performance, financial position, business model, governance, and risks of banks. Outside stakeholders include depositors, investors, borrowers, counterparties, regulators, policymakers, and competitors. Transparency is the joint output of a multifac-eted system whose component parts collectively produce, gather, and validate information and disseminate that information to participants outside the bank. Components include mandated, publicly available accounting information; information inter-mediaries such as financial analysts, credit rating agencies, and the media; and supervisory disclosures (including stress-test disclosures), banks’ voluntary disclosures, and information transmitted by securities prices (Bushman and Smith 2003; Bushman, Piotroski, and Smith 2004). While access to informa-tion is a necessary condition for transparency, transparency also relies on the active efforts of information receivers, as dictated by their incentives to gather, interpret, and incorporate available information into decision-making processes (see, for example, Freixas and Laux [2012]; Mehran and Mollineaux [2012]).1
1 For example, a high likelihood that explicit or implicit government guarantees will come into play if a bank gets into trouble can dampen the incentives of market participants to gather and process information (see, for example, Nier and Baumann [2006]; Furlong and Williams [2006]).

130 Transparency, Accounting Discretion, and Bank Stability
subsidized deposit insurance, government guarantees, and bank opacity creates motives and opportunities for risk taking that can be optimal from the point of view of shareholders, given limited liability, but not from that of the economy as a whole if it raises systemic risk through an increased probability of failure.2
For example, Anginer et al. (2014) find that for an international sample of banks, shareholder-friendly corporate governance is positively associated with bank insolvency risk and, consistent with increased risk taking, is also associated with a higher valua-tion of the implicit insurance provided by the financial safety net. Also consistent with a conflict between firm-level governance and bank stability concerns are the findings of Fahlenbrach and Stulz (2011) that during the financial crisis of 2007-08, the price per-
formance of bank shares was worse for banks in which the CEO’s incentives were better aligned with shareholders’ interests ex ante.
The banking literature suggests that, in addition to supporting corporate governance mechanisms, transparency can promote bank stability by enhancing the market discipline of banks’ risk-taking decisions (see, for example, Rochet [1992]; Blum [2002]; Cordella and Yeyati [1998]). Transparency can also limit regulatory forbearance by providing a basis for market participants to exert pressure on bank supervisors to intervene promptly in troubled banks (Rochet 2005). Market discipline can operate through the direct influence that market participants exert on a bank’s risk-taking behavior. For example, transparency may enhance ex ante discipline as bank managers anticipate that informed investors will quickly discern increased risk taking and demand higher yields on their investments. Market discipline can also operate through regulatory intervention triggered by market signals, such as the price movements of bank securities (see, for example, Stephanou [2010]; Flannery [2001]).
Beyond market discipline, transparency can mitigate indiscriminate panic and rollover risk by reducing the
2 For more extensive discussions of what makes banks special in terms of corporate governance, see Laeven (2013) and Adams and Mehran (2003; 2008, revised 2011).
uncertainty of depositors and other short-term lenders about the solvency of individual banks (Ratnovski 2013; Gorton and Huang 2006). For example, it has been posited that recent bank liquidity crises were caused by increased uncertainty over banks’ solvency as assessed by participants in wholesale funding markets (Shin 2009; Goldsmith-Pinkham and Yorulmazer 2010; Huang and Ratnovski 2011). Transparency can also reduce the financing frictions imposed on banks seeking to raise capital in response to negative balance sheet shocks (Bushman and Williams 2015; Beatty and Liao 2011). The existence of financing frictions driven by asymmetric information underpins theories of monetary policy trans-mission through a bank lending channel (Kashyap and Stein 1995, 2000) and capital-crunch theories suggesting that regu-latory capital concerns cause banks to restrict lending during economic downturns (Bernanke and Lown 1991; Bolton and Freixas 2006; Van den Heuvel 2009).3
On the negative side, theory holds that transparency can lead to inefficient bank runs driven by coordination failures (Morris and Shin 2002; Chen and Hasan 2006); create repu-tational contagion when disclosure of a bank’s failure causes creditors in other banks to lose confidence in the bank regula-tor’s competence (Morrison and White 2013); adversely affect incentives of bank managers and lead them to make inefficient investment decisions (Goldstein and Sapra 2014); restrict interbank risk-sharing arrangements (Goldstein and Leitner 2013); and undermine banks’ ability to produce private money (Gorton 2013; Dang et al. 2014).
The tension between positive and negative effects of transparency is usefully illustrated in the context of the Dang et al. (2014) model. In the model, an important aspect of the benefits provided by banks is their ability to conceal informa-tion about the performance of firms to whom they have made loans and discourage the collection of information by outsid-ers. This suppression of information allows banks to provide risk-sharing benefits to depositors that cannot be achieved by a full-information capital market mechanism. Dang et al. (2014) do not consider agency problems and assume that banks act to maximize overall surplus in the economy. However, opacity is not free. While opacity provides positive benefits for liquid-ity and risk sharing, banks also face significant agency and governance problems in which opacity can dampen outside discipline on the decision making of bank executives. Why
3 Granja (2013) suggests another benefit of bank transparency, showing that disclosure requirements mitigate information asymmetries in the auctions for failed banks. Specifically, Granja finds that, when failed banks are subject to more comprehensive disclosure requirements, regulators incur lower costs of closing a bank and retain a lower portion of the failed bank’s assets, while bidders that are geographically more distant are more likely to participate in the bidding for the failed bank.
High leverage combined with subsidized
deposit insurance, government
guarantees, and bank opacity creates
motives and opportunities for risk taking
that can be optimal from the point of view
of shareholders . . . but not from that
of the economy as a whole.

FRBNY Economic Policy Review / August 2016 131
would depositors put their money in a bank if there is no transparency to ensure the accountability of bank managers? Dang et al. (2014) observe that to support the benefits of opacity, the government examines and regulates banks for which, significantly, bank regulators often keep the results of their examinations confidential (for example, DeYoung et al. [2001]).4 But this practice raises a number of important issues. Who monitors the regulators? What role does public informa-tion play in supporting the public’s trust in the regulators and regulatory processes? To what extent does public information inform the regulatory oversight process? What incremental benefits does transparency—operating through corporate governance mechanisms, market discipline, and reduced financing frictions—contribute to bank stability?
The conflicting views on transparency revealed in the theory literature create a demand for empirical research that can provide insights into the nature of transparency and when, where, and how it positively or negatively affects banks and the banking system. However, bank transparency is a subtle construct that emerges as an indirect output from the interaction of disclosure and incentives of both bank managers and market participants. This complexity raises a number of empirical challenges. In this regard, financial accounting information is an integral component of trans-parency and as such is a powerful point of entry for empirical investigation into the nature of bank transparency and its economic consequences.
Publicly disclosed financial statements represent a textured quantitative depiction of the financial position and perfor-mance of individual banks. The value of financial accounting information derives in part from its emphasis on the reporting of objective, verifiable, firm-specific information. The empha-sis on verifiable outcomes produces a rich set of variables that can support a wide range of enforceable contractual arrange-ments and that form a basis on which outsiders can monitor and discipline the actions and statements of insiders. While diverse information about banks emanates piecemeal from many different sources, banks’ financial statements provide a global, integrated representation of the financial position and performance of a banking entity and, as such, provide a frame of reference for interpreting information signals from a variety of other sources.5 Accounting information can also
4 This idea of secret keeping is reflected in the recent debate over how much information bank regulators should disclose about individual banks under the new stress-testing regimes (see, for example, Goldstein and Sapra [2014]).5 This is illustrated by the finding in Peristiani, Morgan, and Savino (2010, revised 2013) that the market had largely deciphered on its own which banks would have capital gaps before regulatory stress-test results were revealed, but that the market was informed by the size of the gap revealed by the stress-test disclosures.
provide a basis for building public trust in the regulatory process because statements and disclosures by bank super-visors can be assessed relative to the economics depicted in banks’ financial statements. Furthermore, the prospect that credible financial information will be disclosed in the future can discipline the voluntary disclosures of bank managers today by allowing for the ultimate confirmation of managers’ statements (Ball 2001; Gigler and Hemmer 1998).
The connection between accounting information and transparency is complex. A bank’s financial statements provide a depiction of reality, not reality itself. The properties of trans-parency derive from how closely a bank’s true underlying fundamentals map into reported accounting numbers. While the accounting rules themselves are a crucial determinant of
bank transparency, the application of accounting rules to specific economic situations often allows substantial scope for privately informed bank managers to exercise their own judgment. Accounting discretion is a double-edged sword. On the one hand, discretion creates scope for informational bene-fits by facilitating incorporation of private information into banks’ accounting reports. On the other hand, it increases the potential for opportunistic accounting behavior by managers that can degrade bank transparency. A lack of transparency can induce investor uncertainty about banks’ intrinsic value, weaken market discipline over risk-taking behavior, and provide opportunities for banks to suppress negative informa-tion that could generate future concerns over capital adequacy when ultimately revealed. Thus, an important research objec-tive is to better understand the relationship between accounting choices and bank transparency, and between transparency and bank stability.
In the remainder of this article, I discuss key insights from recent research that investigates the relationship between bank transparency, as viewed through the lens of financial accounting, and bank stability, and provide suggestions for
The connection between accounting
information and transparency is
complex. A bank’s financial statements
provide a depiction of reality, not reality
itself. The properties of transparency
derive from how closely a bank’s true
underlying fundamentals map into
reported accounting numbers.

132 Transparency, Accounting Discretion, and Bank Stability
future research.6 I will emphasize the role that managerial discretion over accounting decisions plays in influencing bank stability through two distinct accounting channels: bank transparency and the role of accounting numbers as numerical inputs into the calculations of regulatory ratios such as bank capital ratios.
The article is organized as follows. Section 2 describes the role of accounting rules and managerial discretion in determining the properties of bank transparency. Section 3 provides an overview of the literature on accounting discre-tion in banking and then focuses on accounting policy choices that delay the recognition of expected loan losses in banks’ reported profits. It includes discussion of recent empirical research on the influence of delayed loan loss recognition on bank transparency and stability. Research into the conse-quences of accounting discretion and transparency for market discipline of bank risk-taking behavior is discussed in Section 4. Section 5 considers the effects of accounting discretion on the downside tail risk of individual banks and codependence of such risk among banks, while Section 6 discusses recent research on relations among accounting discretion, bank transparency, and regulatory forbearance.
2. Financial Statements as a Depiction of Bank Reality: Rulever sus Discretion
Banks, like business firms in other industries, must attract outside funding in competitive capital markets, face compe-tition in product and labor markets, and deal with corporate governance issues deriving from managerial self-interest and asymmetric information. As a result, the role of trans-parency in banking is similar to that in any other industry. However, in other respects, banks are special and introduce additional considerations unique to the financial sector. It is often asserted that banks are inherently less transparent than nonfinancial firms (Morgan 2002; Flannery, Kwan, and Nimalendran 2004, 2013). An inherent lack of transparency is presumed to derive from the fact that banks’ investment decisions are based on private information that is not available to those outside the bank (for example, Diamond [1984]; Boyd and Prescott [1986]). Banks may also have incentives to suppress public information about their assets to support their role as liquidity providers (Gorton 2013; Dang et al. 2014).
6 This article is not intended to be a review of the large literature on financial accounting in the banking industry. For a more comprehensive discussion of accounting research in banking, I refer the reader to Beatty and Liao (2014) and Ryan (2012).
The fact that banks take on risks that are opaque and diffi-cult to verify raises concerns about excessive risk taking by individual banks and the contribution of individual banks to the risk of the financial system (see, for example, Financial Stability Forum [2009]; Brunnermeier et al. [2009]; Hanson, Kashyap, and Stein [2011]).
In addition, the role of banks as efficient allocators of scarce capital to the economy and as important providers of liquidity makes bank balance sheets special as well. Consider the balance sheet of a bank or the aggregate balance sheet of the entire banking system. Distinct from most other industries, the balance sheet itself represents the productive output of the banking business. The asset side represents the supply of bank financing to the
real economy and is the product of private information collection, delegated monitoring activities, and capital allocation decisions. While it is common to view the right-hand side of the balance sheet in terms of capital structure, for banks, debt is a factor of production and is in some cases itself a key output that is used as money, whether as demand deposits, repurchase agreements, or as other forms of short-term debt (Gorton 2013), and as off-balance-sheet items such as lines of credit and loan commitments (Kashyap, Rajan, and Stein 2002). The bank balance sheet can also be conceptualized as a transmission mechanism that broadcasts economic shocks and monetary policies to the wider economy (see, for example, Kashyap and Stein [2000]). To the extent that the balance sheets of many banks are simultaneously vulnerable to the same downside risk exposures, negative economic shocks can cause banks to co-move, thus amplifying shocks across the entire economy (Adrian and Brunnermeier 2008, revised 2011; Acharya et al. 2015).
However, the true bank balance sheet is itself unobservable. What we actually observe is the accounting balance sheet, which is a quantitative depiction of a bank’s economic reality constructed through the application of managerial judgment and discretion to existing accounting rules. Given that regula-tors and investors make decisions based on what is observable,
Consider the balance sheet of a bank
or the aggregate balance sheet of the
entire banking system. Distinct from
most other industries, the balance sheet
itself represents the productive output
of the banking business.

FRBNY Economic Policy Review / August 2016 133
financial accounting exerts a potentially significant influence on outcomes in the banking sector.
The recent financial crisis focused a spotlight on the importance of the accounting rules governing fair values of assets and liabilities, asset securitizations, derivatives, repos, and loan loss provisioning. The recognition by regulators that accounting rules can fundamentally affect bank stability is reflected in proposals issued by the Financial Stability Forum (2009) and the U.S. Department of the Treasury (2009) rec-ommending that both the Financial Accounting Standards Board (FASB) and the International Accounting Standards Board (IASB) reevaluate fair-value accounting, accounting for loan losses, and hedge accounting, among other issues. However, accounting standard setters and bank regulators have different objectives. General-purpose financial reporting is concerned with providing information to those outside the firm to support a wide range of decision contexts and contractual arrangements.7 In contrast, prudential bank reg-ulation seeks to limit the frequency and cost of bank failures and to protect the financial system as a whole by limiting the frequency and cost of systemic crises (see, for example, Wall and Koch [2000]; Rochet [2005]).
Financial statements are shaped by the accounting rules governing how a number of complex transactions and events are mapped into accounting numbers. A flawed rule that produces a poor mapping between fundamentals and accounting numbers can introduce significant noise into banks’ financial statements. In this spirit, Barth and Landsman (2010) argue that the transparency of information associated with securitizations and derivatives was likely insufficient to allow investors to assess values and risks properly. The rules govern the recognition of quantities in the primary financial statements as well as quantities reported outside the financial statements in footnotes and in management discussions of operations and risks. For example, while accounting standards in the United States require disclosure of the fair values of all financial assets in the footnotes, only a fraction of the assets recognized in bank balance sheets is reflected at fair value. As of December 31, 2012, on average only 20 percent of banks’ total assets are recognized at fair value in reported balance sheets (Beatty and Liao 2014).
There is no consensus in the accounting literature about whether recognition versus disclosure of information affects users’ decisions. While one might presume that investors would view recognized and disclosed quantities identically,
7 For example, Financial Accounting Standards Board (2010, paragraph OB2) states, “The objective of general purpose financial reporting is to provide financial information about the reporting entity that is useful to existing and potential investors, lenders, and other creditors in making decisions about providing resources to the entity.”
investors may perceive differences in the reliability of recog-nized versus disclosed items, or face higher costs of processing information disclosed in footnotes (Beatty, Chamberlain, and Magliolo 1995; Barth, Clinch, and Shibano 2003; Ahmed, Kilic, and Lobo 2006). As a result, transparency, which derives from interactions between information and information pro-cessing by market participants, can be affected by the form in which information is disclosed.
While they are important, accounting rules are only part of the story. The complexity of the banking environ-ment together with private information possessed by bank managers creates a wide scope for judgment and discretion in accounting choices. For example, bank managers have discretion in valuing Level 3 assets (Song, Thomas, and Yi 2010; Altamuro and Zhang 2013), determining loan loss provisions and loan charge-offs (Ryan 2012), and timing the recognition of securities’ gains and losses (Beatty, Ke, and
Petroni 2002). However, discretion cuts two ways. To address information asymmetries between informed managers and less-informed outside stakeholders, bank managers may make accounting choices to convey their private information. Or they may opportunistically exploit accounting discretion to prop up reported earnings in response to downward pressure on bank profits and capital market or regulatory pressures. Opportunistic accounting choices can be driven by executive compensation issues, career motives, private benefits, and capital adequacy concerns (Beatty and Liao 2014, sec. 5).
The manipulation of accounting numbers by banks may be optimal from the perspective of shareholders, possibly at the expense of other stakeholders such as debt holders and taxpayers, or it may represent a corporate governance break-down from which managers seek to extract private benefits. For example, strategic reporting behavior can increase the gap between reported regulatory capital and the economic capital available to absorb unexpected losses. This may benefit shareholders by deterring regulatory intervention and allow-ing risk-shifting behavior while simultaneously increasing the risk of bank insolvency and potential costs to taxpayers and the economy. It is also possible that bank regulators permit or encourage opportunistic accounting choices to facilitate
Given that regulators and investors
make decisions based on what is
observable, financial accounting exerts
a potentially significant influence on
outcomes in the banking sector.
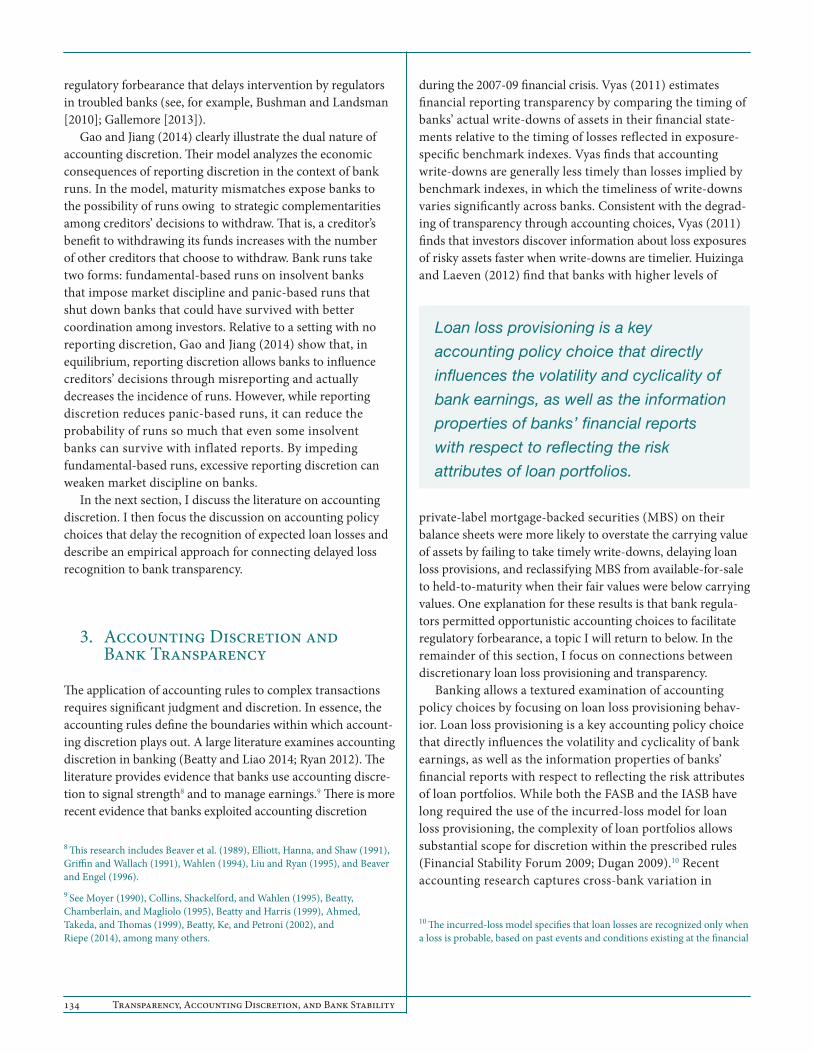
134 Transparency, Accounting Discretion, and Bank Stability
regulatory forbearance that delays intervention by regulators in troubled banks (see, for example, Bushman and Landsman [2010]; Gallemore [2013]).
Gao and Jiang (2014) clearly illustrate the dual nature of accounting discretion. Their model analyzes the economic consequences of reporting discretion in the context of bank runs. In the model, maturity mismatches expose banks to the possibility of runs owing to strategic complementarities among creditors’ decisions to withdraw. That is, a creditor’s benefit to withdrawing its funds increases with the number of other creditors that choose to withdraw. Bank runs take two forms: fundamental-based runs on insolvent banks that impose market discipline and panic-based runs that shut down banks that could have survived with better coordination among investors. Relative to a setting with no reporting discretion, Gao and Jiang (2014) show that, in equilibrium, reporting discretion allows banks to influence creditors’ decisions through misreporting and actually decreases the incidence of runs. However, while reporting discretion reduces panic-based runs, it can reduce the probability of runs so much that even some insolvent banks can survive with inflated reports. By impeding fundamental-based runs, excessive reporting discretion can weaken market discipline on banks.
In the next section, I discuss the literature on accounting discretion. I then focus the discussion on accounting policy choices that delay the recognition of expected loan losses and describe an empirical approach for connecting delayed loss recognition to bank transparency.
3. Accounting Discretion and Bank Transparency
The application of accounting rules to complex transactions requires significant judgment and discretion. In essence, the accounting rules define the boundaries within which account-ing discretion plays out. A large literature examines accounting discretion in banking (Beatty and Liao 2014; Ryan 2012). The literature provides evidence that banks use accounting discre-tion to signal strength8 and to manage earnings.9 There is more recent evidence that banks exploited accounting discretion
8 This research includes Beaver et al. (1989), Elliott, Hanna, and Shaw (1991), Griffin and Wallach (1991), Wahlen (1994), Liu and Ryan (1995), and Beaver and Engel (1996). 9 See Moyer (1990), Collins, Shackelford, and Wahlen (1995), Beatty, Chamberlain, and Magliolo (1995), Beatty and Harris (1999), Ahmed, Takeda, and Thomas (1999), Beatty, Ke, and Petroni (2002), and Riepe (2014), among many others.
during the 2007-09 financial crisis. Vyas (2011) estimates financial reporting transparency by comparing the timing of banks’ actual write-downs of assets in their financial state-ments relative to the timing of losses reflected in exposure- specific benchmark indexes. Vyas finds that accounting write-downs are generally less timely than losses implied by benchmark indexes, in which the timeliness of write-downs varies significantly across banks. Consistent with the degrad-ing of transparency through accounting choices, Vyas (2011) finds that investors discover information about loss exposures of risky assets faster when write-downs are timelier. Huizinga and Laeven (2012) find that banks with higher levels of
private-label mortgage-backed securities (MBS) on their balance sheets were more likely to overstate the carrying value of assets by failing to take timely write-downs, delaying loan loss provisions, and reclassifying MBS from available-for-sale to held-to-maturity when their fair values were below carrying values. One explanation for these results is that bank regula-tors permitted opportunistic accounting choices to facilitate regulatory forbearance, a topic I will return to below. In the remainder of this section, I focus on connections between discretionary loan loss provi sioning and transparency.
Banking allows a textured examination of accounting policy choices by focusing on loan loss provisioning behav-ior. Loan loss provisioning is a key accounting policy choice that directly influences the volatility and cyclicality of bank earnings, as well as the information properties of banks’ financial reports with respect to reflecting the risk attributes of loan portfolios. While both the FASB and the IASB have long required the use of the incurred-loss model for loan loss provisioning, the complexity of loan portfolios allows substantial scope for discretion within the prescribed rules (Financial Stability Forum 2009; Dugan 2009).10 Recent accounting research captures cross-bank variation in
10 The incurred-loss model specifies that loan losses are recognized only when a loss is probable, based on past events and conditions existing at the financial
Loan loss provisioning is a key
accounting policy choice that directly
influences the volatility and cyclicality of
bank earnings, as well as the information
properties of banks’ financial reports
with respect to reflecting the risk
attributes of loan portfolios.

FRBNY Economic Policy Review / August 2016 135
accounting policy choices by exploiting differences in the discretionary application of loan loss accounting rules across banks and across countries to estimate the extent to which banks delay expected loan loss recognition in current provisions (see, for example, Beatty and Liao [2011]; Bhat, Lee, and Ryan [2014]; Bushman and Williams [2012, 2015]; Nichols, Wahlen, and Wieland [2009]).
Conceptually, loan loss provisions and related loan loss reserves can be viewed as providing a cushion against expected losses, while bank capital is a buffer against unexpected losses (see, for example, Laeven and Majnoni [2003]). When banks opportunistically delay recognition of expected losses, a current expense is not recorded for some portion of losses expected to occur in the future. This has several implications. First, delayed loss recognition can mask a loan portfolio’s risk attributes and obscure the true capital cushion by mingling unrecognized expected losses together with capital available to buffer unexpected losses. Second, because unrecognized expected losses will be recognized on average in the future, delayed recognition creates an overhang of unrecognized expected losses that carry forward to the future. Loss overhangs can increase capital adequacy concerns during economic downturns by compromising the ability of loan loss reserves to cover both unexpected recessionary loan losses and loss overhangs from previous periods. Thus, delayed loss recognition can directly affect a bank’s ability to meet regulatory thresholds. Can delaying loss recognition also affect bank transparency?
Bushman and Williams (2015) hypothesize that delayed expected loss recognition is a manifestation of opportunistic loan-provisioning behavior that degrades bank transparency and increases investor uncertainty over banks’ fundamentals, especially during economy-wide crisis periods. To investigate this hypothesis, Bushman and Williams (2015) build on an extensive literature linking transparency to stock market illiquidity and illiquidity risk (see, for example, Amihud, Mendelson, and Pedersen [2005]). Illiquidity risk reflects how closely bank-level stock market illiquidity co-moves with aggregate market illiquidity and stock returns.11 Brunnermeier
statement date. Both the FASB and the IASB have developed new rules for financial instruments that will substantially change loan loss accounting. In general, the new rules drop the incurred-loss model and adopt a more forward-looking “expected loss” model that requires banks to recognize not only credit losses that have already occurred but also expected future losses. The FASB and IASB rules offer different approaches to implementing an expected loss framework. The question as to whether the new rules will increase or decrease the role of accounting discretion in loan loss accounting is a topic for future research. 11 See Pástor and Stambaugh (2003) and Lou and Sadka (2011) for alternative measures of illiquidity risk.
and Pedersen (2009) and Vayanos (2004) show that liquidity can dry up in crises when liquidity providers flee from assets with high levels of uncertainty about fundamental value. Brunnermeier and Pedersen (2009) argue that systematic shocks to the funding of liquidity providers can generate co-movement in liquidity across assets, particularly for stocks with greater uncertainty about intrinsic value. Further, Lang and Maffett (2011) empirically document that nonfinancial firms with lower transparency suffer greater increases in illiquidity risk during crisis periods. Thus, to the extent that delayed loss recognition degrades bank transparency, greater delays in loss recognition should be associated with greater bank illiquidity and greater illiquidity risk, with these associa-tions being stronger during crisis periods.
Consistent with this transparency hypothesis, Bushman and Williams (2015) find that delayed expected loss recogni-tion (DELR) is associated with higher stock market illiquidity and a higher correlation between bank-level illiquidity and aggregate banking sector illiquidity and market returns during recessions. While it has been documented that stock illiquidity in general significantly increases during economic recessions,12 Bushman and Williams (2015) show in a banking setting that recessionary increases in stock illiquidity and illiquidity risk are more severe for banks with high levels of DELR. This within-banking-sector analysis of DELR and illiquidity complements Flannery, Kwan, and Nimalendran (2013) across industry analysis showing that crises raise the adverse selection costs of trading bank shares relative to trading shares of nonbank control firms. The Flannery, Kwan, and Nimalendran (2013) results are consistent with the intensity of investors’ incentives to seek out information about banks increasing relatively more for banks than for nonbanks during crises, resulting in greater adverse selection issues for banks. While the Bushman and Williams (2015) results are also consistent with the assumption that bank
12 See Naes, Skjeltorp, and Ødegaard (2011) and Hameed, Kang, and Viswanathan (2010),
To the extent that delayed loss
recognition degrades bank transparency,
greater delays in loss recognition
should be associated with greater
bank illiquidity and greater illiquidity
risk, with these associations being
stronger during crisis periods.
Footnote 10 (continued)

136 Transparency, Accounting Discretion, and Bank Stability
investors become hungry for information during crises, their results suggest that bank opacity prevents investors from resolving uncertainty about a bank’s fundamentals and leads to increased illiquidity risk.
The Bushman and Williams (2015) results have impli-cations for the downside risk of individual banks and for codependence in downside risk among banks. First, illiquidity and illiquidity risk are associated with higher costs of equity financing.13 Higher equity financing frictions associated with delayed loss recognition can restrict access to new equity financing and thus exacerbate banks’ capital adequacy con-cerns by hampering efforts to replenish capital levels depleted by recessionary losses. Furthermore, while Bushman and Williams (2015) find a relation between DELR and equity financing frictions, diminished transparency may also affect the availability of credit funding and the terms demanded by creditors to supply such funding (see, for example, Kashyap and Stein [1995, 2000]; Hanson, Kashyap, and Stein [2011];Ratnovski [2013]). This is a potentially important issue for future research.
Because delayed expected loss recognition can increase illiquidity risk, it also has implications for systemic risk. Increased co-movement between bank-level illiquidity and banking-sector illiquidity and returns suggests that banks with high DELR will simultaneously face elevated financing frictions and potential capital inadequacy concerns when the banking sector is experiencing distress. In addition, bank opacity associated with DELR can reduce market dis-cipline over risk-taking behavior for high DELR banks as a group during a crisis period.
Finally, my discussion of opportunistic accounting discretion has focused heavily on delayed loan loss recog-nition. However, bank managers are likely to have other accounting levers to pull when faced with pressure on the bank (Beatty and Liao 2014). For example, Huizinga and Laeven (2012) show that during a crisis, banks with high MBS levels overstate the carrying value of their assets, delay loan loss provisions, and reclassify available-for-sale MBS as held-to-maturity. An interesting possibility for future research is to explicitly conceptualize bank accounting choices as a vector of distinct choices and seek to isolate clusters of correlated accounting behaviors that together affect overall bank transparency.
13 Acharya and Petersen (2005) decompose the capital asset pricing model (CAPM) beta to show that the cost of capital is a function of illiquidity levels and illiquidity risk. They provide evidence that U.S. stocks that maintain a relatively constant level of liquidity when overall markets become illiquid have a lower cost of capital because investors are willing to pay more for shares if they expect to be able to exit positions at a relatively low cost during these periods.
I turn next to a discussion of the consequences of account-ing discretion for market discipline of bank risk taking.
4. Transparency and Discipline of Bank Risk Taking
Market discipline can be conceptualized as a market-based incentive scheme in which investors in bank securities penal-ize banks for greater risk taking by demanding higher returns on their investments. A large literature examines market discipline in banking. The thrust of much of this research is to examine whether the prices of bank securities respond to changes in bank risk in a timely fashion.14 Acharya, Anginer, and Warburton (2015) show that while a positive relationship
exists between risk and credit spreads for medium and small institutions, the risk-to-spread relationship is significantly weaker for the largest institutions. They argue that large institutions pay a lower price for risk than other financial institutions owing to the too-big-to-fail notion, which holds that the government will not allow large financial institutions to fail if their failure would cause significant disruption to the financial system and economic activity. Berger and Turk-Ariss (2015) test whether discipline exerted by depositors decreased or increased during the recent crisis. They find that signif-icant depositor discipline existed prior to the crisis in both the United States and the European Union but that such discipline generally decreased during the crisis, consistent with government reactions dampening market discipline (for example, expanding deposit insurance coverage and rescu-ing troubled institutions).
The extent to which reported accounting numbers influence the intensity of market discipline is still an open question. Nier and Baumann (2006) use cross-country data to investigate whether factors associated with the strength of market discipline lead banks to choose higher capital buffers for given asset risk. They measure the strength of market
14 See, for example, Flannery, and Nikolova (2004).
Bank opacity associated with delayed
expected loss recognition (DELR) can
reduce market discipline over risk-taking
behavior for high DELR banks as a
group during a crisis period.

FRBNY Economic Policy Review / August 2016 137
discipline along three dimensions: how transparent a bank is with respect to its risk choices, the extent of the government safety net, and the proportion of uninsured liabilities on its balance sheet. They proxy for transparency by whether the bank is listed on a primary U.S. exchange or rated by a major rating agency, and by constructing an index based on whether a bank discloses in its financial reports information on eighteen categories of disclosure related to interest rate risk, credit risk, liquidity risk, market risk, and capital. Nier and Baumann (2006) provide evidence that stronger market discipline is associated with more complete risk disclosures, that uninsured liabilities lead to larger capital buffers, and that government safety nets result in lower capital buffers.
In a related study, Bushman and Williams (2012) use a large sample of banks from twenty-seven countries to investigate the implications of accounting discretion for risk discipline. They construct two country-level measures of accounting discretion. The first is delayed expected loss recog-nition as developed in the previous section of this article. The second measure captures the extent to which banks use loan loss provisions to smooth earnings by recognizing loan loss provisions that are positively correlated with pre-provision earnings. The banking literature posits that smoothing can mitigate the pro-cyclicality of the financial system by allowing a buildup in reserves when earnings are high and current losses are low, and a drawdown in reserves when earnings are low and current loan losses are high (see, for example, Borio, Furfine, and Lowe [2001]; Laeven and Majnoni [2003]; Bikker and Metzemakers [2005]). However, as with accounting discretion in general, discretionary provision smoothing may obscure the underlying risk attributes of a bank’s loan port-folio. Using two approaches, Bushman and Williams (2012) investigate the implications of greater delayed loan loss recog-nition and smoothing for the discipline of bank risk taking.
The first approach investigates how accounting discretion affects the sensitivity of changes in bank capital to changes in asset volatility.15 This analysis builds on the premise that greater outside discipline of risk taking will result in greater pressure on banks to increase capital in response to increases in risk. The concept that capital should increase with risk is a basic tenet of prudential bank regulation as reflected, for example, in the risk-weighted capital requirements in the Basel II Accord (Basel Committee on Banking Supervision 2006). Consistent with delayed expected loss recognition
15 Bushman and Williams (2012) focus on publicly traded banks and exploit the concept that a firm’s equity can be represented as a call option on the firm’s assets, where the strike price is the face value of debt. Using the face value of reported liabilities, the observed market value of equity, and the estimated standard deviation of stock returns, they derive an estimate of a bank’s asset volatility.
and smoothing reducing transparency and dampening dis-ciplinary pressure on bank risk taking, the analysis finds that changes in capital are significantly less sensitive to changes in bank risk in high DELR (smoothing) regimes than in low DELR (smoothing) regimes.
The second approach in Bushman and Williams (2012) investigates the relationship between delayed loan loss recognition (smoothing) and bank risk shifting. When a country provides deposit insurance, banks can shift risk onto the deposit insurer by increasing the risk of assets without simultaneously increasing capital enough to cushion the increased risk. Merton (1977) characterizes deposit guar-antees as a put option issued by a deposit guarantor. Risk shifting occurs when banks increase the value of the option without internalizing the full cost of the increased insurance. Countering banks’ incentives to shift risk, deposit insurers and uninsured creditors have incentives to monitor and discipline banks’ risk-taking behavior. The analysis in Bushman and Williams (2012) examines the relative strength of these com-peting forces and provides evidence that banks in high DELR (smoothing) regimes exhibit more risk shifting than banks in low DELR (smoothing) countries.
Bushman and Williams (2012) further find that the rela-tionship between accounting discretion and risk shifting is significantly more pronounced for banks with low capital. This is consistent with the finding that gains to banks’ share-holders from risk shifting increase as banks move closer to violating capital requirements. In effect, accounting discretion can affect bank risk and stability through multiple channels simultaneously. First, accounting discretion can reduce trans-parency, which facilitates risk-shifting behavior. Second, lower transparency increases the financing frictions that restrict the ability of the bank to replenish depleted capital levels. Finally, loss overhangs created by delayed loan loss recognition can increase capital inadequacy concerns during economic downturns by compromising the ability of loan loss reserves to cover both unexpected recessionary loan losses and loss overhangs from previous periods.
Next, I consider the effects of accounting discretion on the downside tail risk of individual banks and the codependence of downside tail risk among banks.

138 Transparency, Accounting Discretion, and Bank Stability
5. Accounting Discretion, Downside Risk of Individual Banks, and Systemic Risk
Recent research has begun to examine the relationship between accounting decisions and risk for individual banks and for the banking system. Baumann and Nier (2004) examine relations between a bank’s transparency and the volatility of its stock return using a constructed disclosure index similar to the one discussed in the previous section in the context of Nier and Baumann (2006). Baumann and Nier (2004) find that banks’ disclosure intensity is inversely related to measures of stock volatility. According to the empirical evidence provided in Ng and Roychowdhury (2014), the amount of loan loss allowances included in Tier 2 regulatory capital is positively associated with the risk of bank failures during the 2007 financial crisis. Further, they find that the positive association of loss allowances included in Tier 2 capital with bank failure risk is concentrated among cases in which the allowance add-backs to capital are likely to increase total regulatory capital. However, as noted by Beatty and Liao (2014, sec. 6.2.1), Ng and Roychowdhury (2014) do not con-sider the possibility of reverse causality, in which failing banks that recognize additional provisions may undertake excessive risk, hoping to resurrect their financial health.
Consider again the accounting policy choices that delay expected loss recognition. By affecting the accounting numbers used as quantitative inputs into regulatory calculations and degrading bank transparency, DELR can heighten capital adequacy concerns during crisis periods. The literature sug-gests a range of potential negative consequences of capital inadequacy or anticipation of capital adequacy concerns (for example, Van den Heuvel [2009]). These include increased incentives for risk-shifting activities (Bushman and Williams 2012); reduced bank lending (for example, Bernanke and Lown [1991]; Beatty and Liao [2011]); deleveraging through asset sales, potentially at fire-sale prices (for example, Hanson, Kashyap, and Stein [2011]); decreased probability of survival, competitive position, and market share (for example, Berger and Bouwman [2013]); and increased borrowing costs and decreased availability of credit (for example, Afonso, Kovner, and Schoar [2011]; Kashyap and Stein [1995, 2000]; Ratnovski [2013]). These negative consequences of capital inadequacy combined with increased financing frictions and risk-shifting incentives associated with higher DELR can expose banks to significant downside risk. The challenge is to devise research designs that reveal the connections between accounting policies and banks’ vulnerability to severe downside risk.
To address this issue, Bushman and Williams (2015) capture downside risk following an approach developed
by Adrian and Brunnermeier (2008, revised 2011). They estimate conditional, time-varying distributions over future equity returns and examine whether banks that delay loan loss recognition exhibit an increased likelihood of extreme negative outcomes. Using quantile regression, they estimate downside risk for each future time period as the value at risk (VaR) computed at the 1 percent quantile of the distribu-tion.16 They estimate VaR for both individual banks and the banking system as a whole.
Focusing first on the relationship between DELR and VaR estimated for each individual bank, Bushman and Williams (2015) find that higher delayed loss recognition is associated with significantly higher risk of severe drops in the market values of equity during crisis periods. It is useful to contrast these results with research showing that opacity is associated with the risk of an equity crash (Nier 2005; Hutton, Marcus, and Tehranian 2009; Cohen et al. 2014). Several of these papers build on the idea in Jin and Myers (2006) that if managers currently postpone the release of bad news, then later release of accumulated negative information causes stock price crashes. Bushman and Williams (2015) extend this liter-ature in several ways. First, they isolate a specific accounting policy in which banks explicitly delay recognition of losses, which results in the buildup of loss overhangs that threaten capital during economic downturns. Second, they find that a bank’s capital level conditions the association between DELR and downside risk, in which this association is significantly higher for banks with lower regulatory capital. This result suggests that delaying expected loss recognition involves more than just the recognition of accumulated losses, as in Jin and Myers (2006). What prevents banks from simply replenishing capital and mitigating downside risk? One possibility is that, as discussed earlier, higher DELR is associated with increased financing frictions that impede capital replenishment. Also, to the extent that DELR reflects reduced bank transparency, it can facilitate risk-shifting activities when capital levels are low and thus increase a bank’s exposure to severe negative outcomes during crisis periods.
It is also useful to contrast the Bushman and Williams (2015) result that a bank’s capital level conditions the association between delayed expected loss recognition and downside risk with Beatty and Liao (2011). They find that DELR increases the sensitivity of realized loan growth to bank capital during recessions, suggesting that DELR contributes to a “capital crunch” phenomenon in which capital concerns cause banks to contract
16 VaR represents a cutoff value in the lower tail of the distribution, indicating that a bank (the banking system) will experience a loss (for example, negative equity return) over the upcoming quarter of VaR or greater with 1 percent probability. More negative values of VaR indicate more severe downside tail risk in that there is more probability weight over extreme negative outcomes.

FRBNY Economic Policy Review / August 2016 139
lending. This finding suggests that accounting policy can have a nontrivial impact on the pro-cyclicality of the supply of bank lending. While reduced bank lending can negatively affect bank-dependent borrowers’ access to external financing, it is not clear what a decision to restrict new lending implies about a bank’s vulnerability to negative tail risk. In contrast to the focus on bank lending in Beatty and Liao (2011), Bushman and Williams (2015) focus on the effects of DELR on a bank’s vulnerability to severe tail risks, showing that the relationship between DELR and downside risk is magnified for firms with low capital. While increased vulnerability to risk can be related to lower lending volume, among other potential negative consequences of DELR, the Bushman and Williams (2015) result is robust to controlling for a bank’s loan growth. The influence of delayed loss recognition on down-side risk, therefore, likely reflects more than just short-term reductions in loan growth.
Bushman and Williams (2015) also examine the association between delayed expected loss recognition and systemic risk. Following the recent financial crisis, there has been consider-able interest in modeling and measuring systemic risk. There is no agreed-upon approach to this measurement (for example, Bisias et al. [2012]; Hansen [2014]). One important stream of literature exploits the high-frequency observability of banks’ equity prices to extract measures of systemic risk. Some papers in this stream use contingent claims analysis (for example, Gray, Merton, and Bodie [2008]; Gray and Jobst [2009]), while others focus on codependence in the tails of equity returns using reduced-form approaches (Acharya et al. 2015; Adrian and Brunnermeier 2008, revised 2011).17 Given that equity prices reflect the market’s expectations about banks’ future prospects, equity-based measures of bank tail risk reflect risk assessments deriving from a wide range of underlying sources of vulnerability. The focus on equity value is also beneficial because it reveals the market’s expectations about a bank’s (the banking system’s) capital level. For example, Acharya et al. (2015) use equity values to estimate a financial institution’s contribution to systemic risk by measuring its propensity to be undercapitalized when the system as a whole is undercapitalized, empirically showing that their measure possesses substantial power to predict emerging risks during the financial crisis of 2007-09.
Bushman and Williams (2015) estimate the level of risk codependence among banks following the approach devel-oped by Adrian and Brunnermeier (2008, revised 2011). In this approach, codependence is captured by using quantile
17 Correlation is a measure of linear codependence, in which the term codependence encompasses a wider range of relations that can exist between random variables. For example, the tail dependence of a pair of random variables describes their co-movements in the tails of the distributions.
regression to estimate the VaR of the distribution over aggre-gate banking system equity returns conditional on the VaR of an individual bank’s equity returns to derive the marginal contribution of each individual bank to system-wide risk. Bushman and Williams (2015) find that banks that delay expected loan loss recognition contribute more to the risk of severe drops in the equity value of the aggregate banking sector than banks that delay less. Bushman and Williams theorize that if a group of banks that for idiosyncratic reasons all significantly delay loss recognition in good times, then during crisis periods all group members will simultaneously face the consequences of increased capital inadequacy, financing frictions, and incentives to engage in risk-shifting activities. As a result, the downside risk of such banks will be highly correlated, creating systemic effects from banks acting as part of a herd.18 That is, DELR acts like a system-atic risk factor that delivers a negative shock to the entire group of DELR banks, thereby inflicting measurable pain on the entire banking system.
As just described, delayed expected loan loss recognition is significantly associated with the downside risk of individual banks and systemic risk. This factor raises the interesting question of what causes banks to differ in the extent of their DELR choices. DELR is not a time-invariant bank characteristic; it can vary over time for a given bank as pressure on bank managers to manage accounting numbers change. For example, Bushman and Williams (2015) demonstrate that there is significant within-bank variability in DELR by showing that their DELR-bank risk results are robust to including bank fixed effects. Thus, while banks’ accounting choices themselves are shown to have an effect on bank risk, the pressures on bank managers that under-pin these choices can come from a variety of time-varying
18 As noted by Adrian and Brunnermeier (2008, revised 2011), systemic risk can be created by banks that are so interconnected and large that they can cause negative risk spillover effects on others, as well as by institutions that are systemic as part of a herd where, for example, a group of one hundred institutions that act like clones can be as threatening to the system as a single large entity that has rolled up the one hundred individuals.
To the extent that DELR reflects
reduced bank transparency, it can
facilitate risk-shifting activities when
capital levels are low and thus increase
a bank’s exposure to severe negative
outcomes during crisis periods.

140 Transparency, Accounting Discretion, and Bank Stability
sources. Isolating underlying sources of pressure and under-standing how distinct sources of pressure differentially affect banks’ accounting and operational choices are important avenues for future research.
Along these lines, recent research has begun exploring sources of time-varying pressures on bank managers. Bushman, Hendricks, and Williams (2015) and Dou, Ryan, and Zou (2014) find that the extent to which banks delay loan loss recognition increases as the competition a bank faces intensi-fies. These papers exploit the process of bank deregulation to identify exogenous changes in bank competition.19 Bhat, Lee, and Ryan (2014) isolate two credit-risk modeling activities from disclosures in banks’ financial reports: 1) statistical analysis of
historical data on underwriting criteria, loan performance, and relevant economic variables; and 2) stress testing of credit losses to possible adverse future events. Bhat, Lee, and Ryan (2014) find that banks that rely more on statistical analysis of loan performance are timelier in recognizing losses in the pre-crisis boom period and late in the financial crisis, but less timely early in the financial crisis compared with those that use stress tests. Much more work can be done along these lines.
Also, opportunistic accounting choices in response to increased pressure on bank managers may be part of an overall pattern of behavior that includes real decisions as part of the configuration. That is, accounting choices may represent an integral element in multifaceted strategic responses to ever-shifting economic pressures on banks. This is potentially an interesting line of inquiry. For example, Bushman, Hendricks, and Williams (2015) show that increased competitive pressure is associated with lowered bank lending standards and shifting of revenue mixes toward noninterest sources, in addition to making opportunistic accounting choices. Bushman, Wang, and Williams (2014) also show that the frequency with which bank managers make opportunistic loan-provisioning decisions increases as the wedge between a
19 Burks et al. (2013) show that banks increase the issuance of firm-initiated press releases following a reduction in barriers to out-of-state branching.
dominant shareholder’s control and cash flow rights increases. But these are also the same situations when controlling share-holders are more likely to extract private benefits of control (for example, Caprio, Laeven, and Levine [2007]). That is, Bushman, Wang, and Williams (2014) provide evidence consistent with poor governance allowing controlling owners to manipulate loan loss provisions in order to conceal their expropriation activities.
6. Bank Transparency and Regulatory Forbearance
The notion that bank regulation should impose prompt cor-rective actions on troubled banks has long been part of bank regulatory discussions and is embedded both in the Basel I Accord and in the U.S. Federal Deposit Insurance Corpo-ration Improvement Act of 1991. However, regulators may practice forbearance by choosing not to intervene and close banks that they know to be unsound. The literature suggests a number of reasons why regulators may practice forbear-ance. These include political pressure (Mishkin 2000; Brown and Dinç 2005), loss of reputation (Boot and Thakor 1993; Mishkin 2000), or concerns that intervening in one bank can negatively affect the overall financial sector (Brown and Dinç 2011; Morrison and White 2013). The literature is mixed on the consequences of forbearance. On the one hand, failure to close a troubled bank may provide opportunities for bank managers to gamble for resurrection or continue existing risky behaviors, which can increase the ultimate cost of resolving the bank (Santomero and Hoffman 1998). However, for-bearance can also be a prudent regulatory choice if the bank recovers without costly intervention (Santomero and Hoffman 1998) or if closing a bank would spread problems to healthy institutions (Allen and Gale 2000; Morrison and White 2013).
While academics have examined incentives to engage in forbearance, little attention has been paid to a regulator’s ability to practice forbearance. One potential factor that can influence the regulators’ ability to practice forbearance is the opacity of banks’ information environments. Rochet (2004) and Decamps, Rochet, and Roger (2004) analytically show that market discipline can limit forbearance. If a bank’s investors believe that the bank is troubled (for example, if creditors refuse to roll over short-term debt), regulators may have no choice but to intervene. This suggests that a regulator’s ability to engage in forbearance is a function of monitoring by market participants (Rochet 2005). Opacity can enable forbearance by disguising the bank’s actual condition, making it difficult for market participants to assess the bank’s
While banks’ accounting choices
themselves are shown to have an effect on
bank risk, the pressures on bank managers
that underpin these choices can come
from a variety of time-varying sources.

FRBNY Economic Policy Review / August 2016 141
Accounting discretion and, more
generally, bank opacity can be used as
a direct tool for achieving forbearance
and can increase the ability of regulators
to practice forbearance.
solvency and pressure regulators for timely intervention (Bushman and Landsman 2010).
Skinner (2008) provides evidence that Japanese regulators altered financial accounting standards in a way that allowed troubled banks to appear well capitalized during Japan’s banking crisis in the late 1990s. Recent research suggests that opacity could enable regulators to engage in forbearance. Huizinga and Laeven (2012) find that banks with higher levels of private-label mortgage-backed securities were more likely to avoid timely write-downs of assets, delay loan loss provisions, and reclassify available-for-sale MBS as held-to-maturity when the fair values of these MBS were less than their amortized cost (see also Vyas [2011]). In a related paper, Bischof, Brüggemann, and Daske (2014) examine
whether banks exploited their discretion to reclassify financial assets to avoid hits to regulatory capital and achieve de facto regulatory forbearance. Specifically, in October 2008, the IASB introduced a reclassification option that enabled firms to reclassify financial assets that were previously recognized at fair value into alternative measurement categories. By reclas-sifying financial assets, a firm could avoid the recognition of unrealized fair-value losses in income and equity if the losses did not trigger an impairment write-down under amortized cost-accounting rules. Consistent with forbearance, Bischof, Brüggemann, and Daske (2014) find, among other things, that the risk of costly regulatory intervention and the lack of pru-dential filters for unrealized fair-value changes are positively associated with banks’ reclassification choices.
Gallemore (2013) measures opacity using delayed expected loss recognition and examines relations between opacity and various proxies for regulatory forbearance. Using a sample of U.S. commercial banks during the recent crisis, Gallemore (2013) finds that more opaque banks (that is, banks that delay loss recognition more extensively) experienced greater forbear-ance and were less likely to fail during the crisis. The positive association between opacity and forbearance is stronger when regulators’ incentives are stronger (as measured by bank con-nectedness) and outsiders’ incentives to monitor are stronger (as measured by the proportion of deposits that are uninsured). These results suggest that opacity enables regulators to forbear
on connected banks to prevent financial sector contagion and to disguise forbearance from uninsured creditors.
Concerns about regulatory forbearance and government financial support for large banks have received heightened attention from policymakers and regulators around the world. The emerging literature discussed in this section indicates that accounting discretion and, more generally, bank opacity can be used as a direct tool for achieving forbearance and can increase the ability of regulators to practice forbearance. Accounting discretion and opacity can affect regulatory for-bearance through at least two channels. First, they can operate through the channel of capital adequacy requirements. With or without the acquiescence of bank regulators, accounting can enable essentially insolvent banks to continue operating by propping up reported regulatory capital. Second, opacity can also increase the ability of regulators to practice forbear-ance by making it more difficult for market participants to exert pressure on bank supervisors to promptly intervene in troubled banks (Gallemore 2013).
7. Summary
An important concept in the theory of banking is transpar-ency. An important unresolved issue is the extent to which bank transparency promotes or undermines bank stability. A large theoretical literature explores bank transparency and how it affects the risk profile of individual banks and the financial system as a whole. Conflicting views on transparency revealed in this literature create a demand for empirical research that can provide insights into the nature of transparency and when, where, and how it positively or negatively affects banks and the banking system. Financial accounting information is an integral component of transpar-ency and, as such, is a powerful point of entry for empirical investigation into the nature of bank transparency and its economic consequences.
This article discusses key insights from recent research examining the relationship between bank transparency, viewed through the lens of financial accounting, and bank stability. The article focuses on the real consequences of accounting policy choices on individual banks’ downside tail risk, codependence of tail risk among banks, and regulatory forbearance. The article emphasizes the role played by managerial discretion over accounting deci-sions in influencing bank stability through two distinct accounting channels: bank transparency and the accounting numbers as numerical quantities.

142 Transparency, Accounting Discretion, and Bank Stability
The article synthesizes recent research showing that accounting policy choices can have a substantive influence on bank stability. Accounting policy choices can 1) exacerbate capital inadequacy concerns during economic downturns by compromising the ability of loan loss reserves to cover both unexpected recessionary loan losses and the buildup of unrecognized expected loss overhangs from previous periods; and 2) degrade transparency, which can increase financing frictions, inhibit market discipline of bank risk taking, and allow regulatory forbearance. Capital adequacy concerns combined with high financing frictions can increase bank
fragility, while capital inadequacy combined with weak market discipline can increase motives and opportunities for banks to engage in risk-shifting behavior. Furthermore, bank opacity, by supporting regulatory forbearance, can provide opportuni-ties for bank managers to gamble for resurrection or continue existing risky behaviors, which can increase the ultimate cost of resolving the bank. The article discusses recent evidence showing that accounting policy choices are significantly asso-ciated with a greater downside tail risk of individual banks and with greater systemic risk.

FRBNY Economic Policy Review / August 2016 143
References
Acharya, V., D. Anginer, and A. J. Warburton. 2015. “The End of Market Discipline? Investor Expectations of Implicit Govern-ment Guarantees.” Working paper, New York University Stern School of Business, Virginia Tech Pamplin College of Business, and Syracuse University Whitman School of Management and College of Law, March.
Acharya, V., and L. Pedersen. 2005. “Asset Pricing with Liquidity Risk.” w 77, no. 2 (August): 375-410.
Acharya, V., L. Pederson, T. Philippon, and M. Richardson. 2015. “Measuring Systemic Risk.” Working paper, New York University Stern School of Business, November.
Adams, R., and H. Mehran. 2003. “Is Corporate Governance Dif-ferent for Bank Holding Companies?” Federal Reserve Bank of New York Economic Policy Review 9, no. 1 (April): 123-42.
——— . 2008, revised 2011. “Corporate Performance, Board Structure, and Their Determinants in the Banking Industry.” Federal Reserve Bank of New York Staff Reports, no. 330.
Adrian, T., and M. Brunnermeier. 2008, revised 2011. “CoVaR.” Federal Reserve Bank of New York Staff Reports, no. 348.
Afonso, G., A. Kovner, and A. Schoar. 2011. “Stressed, Not Frozen: The Federal Funds Market in the Financial Crisis.” Journal of Finance 66, no. 4 (August): 1109-39.
Ahmed, A., E. Kilic, and G. Lobo. 2006. “Does Recognition versus Disclosure Matter? Evidence from Value-Relevance of Banks’ Recognized and Disclosed Derivative Financial Instruments.” Accounting Review 81 no. 3 (May): 567-88.
Ahmed, A., C. Takeda, and S. Thomas. 1999. “Bank Loan Loss Provisions: A Reexamination of Capital Management, Earnings Management, and Signaling Effects.” Journal of Accounting and Economics 28, no.1 (November): 1-26.
Allen, F., and D. Gale. 2000. “Financial Contagion.” Journal of Political Economy 108, no 1 (February): 1-33.
Altamuro, J., and H. Zhang. 2013. “The Financial Reporting of Fair Value Based on Managerial Inputs versus Market Inputs: Evidence from Mortgage Servicing Rights.” Review of Accounting Studies 18, no. 3 (September): 833-58.
Amihud, Y., H. Mendelson, and L. Pedersen. 2005. “Liquidity and Asset Prices.” Foundations and Trends in Finance 1, no. 4: 269-364.
Anginer, D., A. Demirgüç-Kunt, H. Huizinga, and K. Ma. 2014. “Corporate Governance and Bank Insolvency Risk: International Evidence.” European Banking Center Discussion Paper Series no. 2014-010, and CentER Discussion Papers, no. 2014-053.
Armstrong, C., W. Guay, and J. Weber. 2010. “The Role of Information and Financial Reporting in Corporate Governance and Debt Contracting.” Journal of Accounting and Economics 50, no. 2-3 (December): 179-234.
Ball, R. 2001. “Infrastructure Requirements for an Economically Efficient System of Public Financial Reporting and Disclosure.” Brookings–Wharton Papers on Financial Services, 127-69.
Barth, M., G. Clinch, and T. Shibano. 2003. “Market Effects of Recog-nition and Disclosure.” Journal of Accounting Research 41, no. 4 (September): 581-609.
Barth, M., and W. Landsman. 2010. “How Did Financial Reporting Contribute to the Financial Crisis?” European Accounting Review 19, no. 3: 399-423.
Basel Committee on Banking Supervision. 2006. International Convergence of Capital Measurement and Capital Standards: A Revised Framework—Comprehensive Version. Basel: Bank for International Settlements.
Baumann, U., and E. Nier. 2004. “Disclosure, Volatility, and Trans-parency: An Empirical Investigation into the Value of Bank Disclosure.” Federal Reserve Bank of New York Economic Policy Review 10, no. 2 (September): 31-45.
Beatty, A., S. Chamberlain, and J. Magliolo. 1995. “Managing Financial Reports of Commercial Banks: The Influence of Taxes, Regulatory Capital, and Earnings.” Journal of Accounting Research 33, no. 2 (Autumn): 231-61.
——— . 1996. “An Empirical Analysis of the Economic Implications of Fair Value Accounting for Investment Securities.” Journal of Accounting and Economics 22, no. 1-3 (August- December): 43-77. Conference Issue on Contemporary Financial Reporting Issues.

144 Transparency, Accounting Discretion, and Bank Stability
References (Continued)
Beatty, A., and D. Harris. 1999. “The Effects of Taxes, Agency Costs, and Information Asymmetry on Earnings Management: A Comparison of Public and Private Firms.” Review of Accounting Studies 4, no. 3 (December): 299-326.
Beatty, A., B. Ke, and K. Petroni. 2002. “Differential Earnings Man-agement to Avoid Earnings Declines and Losses across Publicly and Privately Held Banks.” Accounting Review 77, no. 3 (July): 547-70.
Beatty, A., and S. Liao. 2011. “Do Delays in Expected Loss Rec-ognition Affect Banks’ Willingness to Lend?” Journal of Accounting and Economics 52, no. 1 (June): 1-20.
——— . 2014. “Financial Accounting in the Banking Industry: A Review of the Empirical Literature.” Journal of Accounting and Economics 58, no. 2-3 (November-December): 339-83.
Beaver, W., C. Eger, S. Ryan, and M. Wolfson. 1989. “Financial Report-ing, Supplemental Disclosures, and Bank Share Prices.” Journal of Accounting Research 27, no. 2 (Autumn): 157-78.
Beaver, W., and E. Engel. 1996. “Discretionary Behavior with Respect to Allowances for Loan Losses and the Behavior of Security Prices.” Journal of Accounting and Economics 22, no. 1-3 (August-December): 177-206.
Berger, A. N., and C. H. S. Bouwman. 2013. “How Does Capital Affect Bank Performance during Financial Crises?” Journal of Finan-cial Economics 109, no. 1 (July):146-76.
Berger, A. N., and R. Turk-Ariss. 2015. “Do Depositors Discipline Banks and Did Government Actions during the Recent Crisis Reduce This Discipline? An International Perspective.” Journal of Financial Services Research 48, no. 2 (October): 103-26.
Bernanke, B., and C. Lown. 1991. “The Credit Crunch.” Brookings Papers on Economic Activity, no. 2: 205-47.
Bhat, G., J. A. Lee, and S. Ryan. 2014. “Using Loan Loss Indicators by Loan Type to Sharpen the Evaluation of the Determinants and Implications of Banks’ Loan Loss Accruals.” Working paper, Southern Methodist University, Florida State University, and New York University Stern School of Business, August.
Bikker, J. A., and P. A. J. Metzemakers. 2005. “Bank Provisioning Behaviour and Procyclicality.” Journal of International Financial Markets, Institutions, and Money 15, no. 2 (April): 141-57.
Bischof, J., U. Brüggemann, and H. Daske. 2014. “Fair Value Reclassi-fications of Financial Assets during the Financial Crisis.” Working paper, University of Mannheim and Humboldt University of Berlin, June.
Bisias, D., M. Flood, A. Lo, and S. Valavanis. 2012. “A Survey of Sys-temic Risk Analytics.” U.S. Department of the Treasury Office of Financial Research Working Paper no. 0001, January.
Blum, J. 2002. “Subordinated Debt, Market Discipline, and Banks’ Risk Taking.” Journal of Banking and Finance 26, no. 7 (July): 1427-41.
Bolton, P., and X. Freixas. 2006. “Corporate Finance and the Monetary Transmission Mechanism.” Review of Financial Studies 19, no. 3 (Autumn): 829-70.
Boot, A. W. A., and A. V. Thakor. 1993. “Self-Interested Bank Regula-tion.” American Economic Review 83, no. 2 (May): 206-12.
Borio, C., C. Furfine, and P. Lowe. 2001. “Procyclicality of the Finan-cial System and Financial Stability: Issues and Policy Options.” Bank for International Settlements (BIS) Papers, no. 1.
Boyd, J., and E. Prescott. 1986. “Financial Intermediary-Coalitions.” Journal of Economic Theory 38, no. 2 (April): 211-32.
Brown, C. O., and I. S. Dinç. 2005. “The Politics of Bank Failures: Evidence from Emerging Markets.” Quarterly Journal of Economics 120, no. 4 (November): 1413-44.
——— . 2011. “Too Many to Fail? Evidence of Regulatory Forbearance When the Banking Sector Is Weak.” Review of Financial Studies 24, no. 4 (April): 1378-1405.
Brunnermeier, M., A. Crockett, C. Goodhart, A. Persaud, and H. S. Shin. 2009. The Fundamental Principles of Financial Regulation. Geneva Reports on the World Economy 11. London: International Center for Monetary and Banking Studies.

FRBNY Economic Policy Review / August 2016 145
References (Continued)
Brunnermeier, M., and L. Pedersen. 2009. “Market Liquidity and Funding Liquidity.” Review of Financial Studies 22, no. 6 (June): 2201-38.
Burks, J., C. Cuny, J. Gerakos, and J. Granja. 2013. “Competition and Voluntary Disclosure: Evidence from Deregulation in the Banking Industry.” Chicago Booth School of Business Research Paper no. 12-29.
Bushman, R., B. Hendricks, and C. Williams. Forthcoming. “Bank Competition: Measurement, Decision-Making, and Risk-Taking.” Journal of Accounting Research.
Bushman, R., and W. Landsman. 2010. “The Pros and Cons of Regu-lating Corporate Reporting: A Critical Review of the Arguments.” Accounting and Business Research 40, no. 3: 259-73.
Bushman, R., J. Piotroski, and A. Smith. 2004. “What Determines Corporate Transparency?” Journal of Accounting Research 42, no. 2 (May): 207-52.
Bushman, R., and A. Smith. 2001. “Financial Accounting Informa-tion and Corporate Governance.” Journal of Accounting and Economics 32, no. 1-3 (December): 237-333.
——— . 2003. “Transparency, Financial Accounting Information, and Corporate Governance.” Federal Reserve Bank of New York Economic Policy Review 9, no. 1 (April): 65-87.
Bushman, R., Q. Wang, and C. Williams. 2014. “Governance, Compe-tition and Opportunistic Accounting Choices by Banks.” Working paper, University of North Carolina at Chapel Hill, University of Michigan, and the National University of Singapore.
Bushman, R., and C. Williams. 2012. “Accounting Discretion, Loan Loss Provisioning and Discipline of Banks’ Risk Taking.” Journal of Accounting and Economics 54, no. 1 (August): 1-18.
——— . 2015. “Delayed Expected Loss Recognition and the Risk Profile of Banks.” Journal of Accounting Research 53, no. 3 (June): 511-53.
Caprio, G., L. Laeven, and R. Levine. 2007. “Governance and Bank Valuation.” Journal of Financial Intermediation 16, no. 4 (October): 584-617.
Chen, Y., and I. Hasan. 2006. “The Transparency of the Banking System and the Efficiency of Information-Based Bank Runs.” Journal of Financial Intermediation 15, no. 3 (July): 307-31.
Cohen, L., M. Cornett, A. Marcus, and H. Tehranian. 2014. “Bank Earnings Management and Tail Risk during the Financial Crisis.” Journal of Money, Credit, and Banking 46, no. 1 (February): 171-97.
Collins, J., D. Shackelford, and J. Wahlen. 1995. “Bank Differences in the Coordination of Regulatory Capital, Earnings, and Taxes.” Journal of Accounting Research 33, no. 2 (Autumn): 263-91.
Cordella, T., and E. L. Yeyati. 1998. “Public Disclosure and Bank Fail-ures.” Centre for Economic Policy Research (CEPR) Discussion Paper no. 1886.
Dang, T., G. Gorton, B. Holmström, and G. Ordonez. 2014. “Banks as Secret Keepers.” NBER Working Paper no. 20255, June.
Decamps, J. P., J. C. Rochet, and B. Roger. 2004. “The Three Pillars of Basel II: Optimizing the Mix.” Journal of Financial Interme-diation 13, no. 2 (April): 132-55.
DeYoung, R., M. Flannery, W. Lang, and S. Sorescu. 2001. “The Infor-mation Content of Bank Exam Ratings and Subordinated Debt Prices.” Journal of Money, Credit, and Banking 33, no. 4 (November): 900-25.
Diamond, D. 1984. “Financial Intermediation and Delegated Moni-toring.” Review of Economic Studies 51, no. 3 (July): 393-414.
Dou, Y., S. Ryan, and Y. Zou. 2014. “The Effects of Credit Competi-tion on Banks’ Loan Loss Provision Timeliness.” Working paper, New York University.
Dugan, J. 2009. “Loan Loss Provisioning and Procyclicality.” Remarks delivered before the Institute of International Bankers, March 2.
Elliott, J., J. D. Hanna, and W. Shaw. 1991. “The Evaluation by the Financial Markets of Changes in Bank Loan Loss Reserve Levels.” Accounting Review 66, no. 4 (October): 847-61.
Fahlenbrach, R., and R. Stulz. 2011. “Bank CEO Incentives and the Credit Crisis.” Journal of Financial Economics 99, no. 1 (January): 11-26.

146 Transparency, Accounting Discretion, and Bank Stability
References (Continued)
Financial Accounting Standards Board. 2010. “Conceptual Framework for Financial Reporting.” Statement of Financial Accounting Concepts no. 8, September. Available at http://www .fasb.org/cs/ContentServer?pagename=FASB/Document_C/DocumentPage&cid=1176157498129.
Financial Stability Forum. 2009. Report of the Financial Stabil-ity Forum on Addressing Procyclicality in the Financial System. Available at http://www.financialstabilityboard.org/wp-content/uploads/r_0904a.pdf.
Flannery, M. 2001. “The Faces of ‘Market Discipline.’” Journal of Financial Services Research 20, no. 2/3 (October): 107-19.
Flannery, M., S. Kwan, and M. Nimalendran. 2004. “Market Evidence on the Opaqueness of Banking Firms’ Assets.” Journal of Financial Economics 71, no. 3 (March): 419-60.
——— . 2013. “The 2007-2009 Financial Crisis and Bank Opaque-ness.” Journal of Financial Intermediation 22, no. 1 (January): 55-84.
Flannery, M., and S. Nikolova. 2004. “Market Discipline of U.S. Financial Firms: Recent Evidence and Research Issues.” In C. Borio, W. C. Hunter, G. G. Kaufman, and K. Tsatsaronis, eds., Market Discipline across Countries and Industries, 87-100. Cambridge: MIT Press.
Flannery, M., and A Thakor. 2006. “Accounting, Transparency, and Bank Stability.” Journal of Financial Intermediation 15, no. 3 (July): 281-4.
Freixas, X., and C. Laux. 2012. “Disclosure, Transparency, and Market Discipline.” In M. Dewatripont and X. Freixas, eds., The Crisis Aftermath: New Regulatory Paradigms, 69-104. London: Centre for Economic Policy Research.
Furlong, F., and R. Williams. 2006. “Financial Market Signals and Banking Supervision: Are Current Practices Consistent with Research Findings?” Federal Reserve Bank of San Francisco Economic Review: 17-29.
Gallemore, J. 2013. “Does Bank Opacity Enable Regulatory Forbearance?” Working paper, University of North Carolina at Chapel Hill.
Gao, P., and X. Jiang. 2014. “Reporting Discretion, Market Dis-cipline, and Panic Runs.” Working paper, Booth School of Business, University of Chicago, and Fuqua School of Business, Duke University.
Gigler, F., and T. Hemmer. 1998. “On the Frequency, Quality, and Informational Role of Mandatory Financial Reports.” Journal of Accounting Research 36, no. 1 (Spring): 117-47.
Goldsmith-Pinkham, P., and T. Yorulmazer. 2010. “Liquidity, Bank Runs, and Bailouts: Spillover Effects during the Northern Rock Episode.” Journal of Financial Services Research 37, no. 2-3 (June): 83-98.
Goldstein, I., and Y. Leitner. 2013. “Stress Tests and Information Disclosure.” Federal Reserve Bank of Philadelphia Working Paper, no. 13-26, June.
Goldstein, I., and H. Sapra. 2014. “Should Banks’ Stress Test Results Be Disclosed? An Analysis of the Costs and Benefits.” Founda-tions and Trends in Finance 8, no. 1: 1-54.
Gorton, G. 2013. “The Development of Opacity in U.S. Banking.” NBER Working Paper no. w19540, October.
Gorton, G., and L. Huang. 2006. “Bank Panics and the Endogeneity of Central Banking.” Journal of Monetary Economics 53, no. 7 (October): 1613-29.
Granja, J. 2013. “The Relation between Bank Resolutions and Information Environment: Evidence from the Auctions for Failed Banks.” Journal of Accounting Research 51, no. 5 (December): 1031-70.
Gray, D., and A. Jobst. 2009.“Tail Dependence Measures of Systemic Risk Using Equity Options Data—Implications for Financial Stability.” Working paper, International Monetary Fund.
Gray, D., R. Merton, and Z. Bodie. 2008. “New Framework for Mea-suring and Managing Macrofinancial Risk and Financial Stability.” Harvard Business School Working Paper no. 09-015, August.
Griffin, P., and S. Wallach. 1991. “Latin American Lending by Major U.S. Banks: The Effects of Disclosures about Nonaccrual Loans and Loan Loss Provisions.” Accounting Review 66, no. 4 (October): 830-46.

FRBNY Economic Policy Review / August 2016 147
References (Continued)
Hameed, A., W. Kang, and S. Viswanathan. 2010. “Stock Market Declines and Liquidity.” Journal of Finance 65, no. 1 (February): 257-93.
Hansen, L. 2014. “Challenges in Identifying and Measuring Systemic Risk.” In M. K. Brunnermeier and A. Krishnamurthy, eds., Risk Topography: Systemic Risk and Macro Modeling, 15-30. NBER conference volume. Chicago: University of Chicago Press.
Hanson, S., A. Kashyap, and J. Stein. 2011. “A Macroprudential Approach to Financial Regulation.” Journal of Economic Per-spectives 25, no. 1 (Winter): 3-28.
Huang, R., and L. Ratnovski. 2011. “The Dark Side of Bank Wholesale Funding.” Journal of Financial Intermediation 20, no. 2 (April): 248-63.
Huizinga, H., and L. Laeven. 2012. “Bank Valuation and Accounting Discretion during a Financial Crisis.” Journal of Financial Economics 106, no. 3 (December): 614-34.
Hutton, A., A. J. Marcus, and H. Tehranian. 2009. “Opaque Financial Reports, R2, and Crash Risk.” Journal of Financial Eco- nomics 94, no. 1 (October): 67-86.
Jin, L., and S. C. Myers. 2006. “R2 around the World: New Theory and New Tests.” Journal of Financial Economics 79, no. 2 (February): 257-92.
Kashyap, A., R. Rajan, and J. Stein. 2002. “Banks as Liquidity Providers: An Explanation for the Coexistence of Lending and Deposit-Taking.” Journal of Finance 57, no. 1 (February): 33-73.
Kashyap, A., and J. Stein. 1995. “The Impact of Monetary Policy on Bank Balance Sheets.” Carnegie-Rochester Conference Series on Public Policy 42 (June): 151-95.
——— . 2000. “What Do a Million Observations on Banks Say about the Transmission of Monetary Policy?” American Economic Review 90, no. 3 (June): 407-28.
Laeven, L. 2013. “Corporate Governance: What’s Special about Banks?” Annual Review of Financial Economics 5 (November); 63-92.
Laeven, L., and G. Majnoni. 2003. “Loan Loss Provisioning and Eco-nomic Slowdowns: Too Much, Too Late?” Journal of Financial Intermediation 12, no. 2 (April): 178-97.
Lang, M., and M. Maffett. 2011. “Transparency and Liquidity Uncertainty in Crisis Periods.” Journal of Accounting and Economics 52, no. 2-3 (November): 101-25.
Liu, C., and S. Ryan. 1995. “The Effect of Bank Loan Portfolio Com-position on the Market Reaction to and Anticipation of Loan Loss Provisions.” Journal of Accounting Research 33, no. 1 (Spring): 77-94.
——— . 2006. “Income Smoothing over the Business Cycle: Changes in Banks’ Coordinated Management of Provisions for Loan Losses and Loan Charge-Offs from the Pre-1990 Bust to the 1990s Boom.” Accounting Review 81, no. 2 (March): 421-41.
Lou, X., and R. Sadka. 2011. “Liquidity Level or Liquidity Risk? Evidence from the Financial Crisis.” Financial Analysts Journal 67, no. 3 (May-June): 51-62.
Mehran, H., and L. Mollineaux. 2012. “Corporate Governance of Financial Institutions.” Annual Review of Financial Eco- nomics 4 (October): 215-32.
Mehran, H., A. Morrison, and J. Shapiro. 2011. “Corporate Governance and Banks: What Have We Learned from the Financial Crisis?” Federal Reserve Bank of New York Staff Reports, no. 502, June.
Merton, R. 1977. “An Analytic Derivation of the Cost of Deposit Insurance and Loan Guarantees.” Journal of Banking and Finance 1: 3-11.
Mishkin, F. S. 2000. “Prudential Supervision: Why Is It Important and What Are the Issues?” NBER Working Paper no. 7926, September.
Morgan, D. P. 2002. “Rating Banks: Risk and Uncertainty in an Opaque Industry.” American Economic Review 92, no. 4 (Sep-tember): 874-88.
Morris, S., and H. S. Shin. 2002. “Social Value of Public Information.” American Economic Review 92, no. 5 (December): 1521-34.

148 Transparency, Accounting Discretion, and Bank Stability
References (Continued)
Morrison, A. D., and L. White. 2013. “Reputational Contagion and Optimal Regulatory Forbearance.” Journal of Financial Eco-nomics 110, no. 3 (December): 642-58.
Moyer, S. 1990. “Capital Adequacy Ratio Regulations and Accounting Choices in Commercial Banks.” Journal of Accounting and Economics 13, no. 2 (July): 123-54.
Naes, R., J. Skjeltorp, and B. A. Ødegaard. 2011. “Stock Market Liquid-ity and the Business Cycle.” Journal of Finance 66, no. 1: 139-76.
Ng, J., and S. Roychowdhury. 2014. “Do Loan Loss Reserves Behave like Capital? Evidence from Recent Bank Failures.” Review of Accounting Studies 19, no. 3 (September): 1234-79.
Nichols, D. C., J. Wahlen, and M. Wieland. 2009. “Publicly Traded versus Privately Held: Implications for Conditional Conservatism in Bank Accounting.” Review of Accounting Studies 14, no. 1 (March): 88-122.
Nier, E. 2005. “Bank Stability and Transparency.” Journal of Finan-cial Stability 1, no. 3 (April): 342-54.
Nier, E., and U. Baumann. 2006. “Market Discipline, Disclosure, and Moral Hazard in Banking.” Journal of Financial Intermedia-tion 15, no. 3 (July): 332-61.
Pástor, L., and R. Stambaugh. 2003. “Liquidity Risk and Expected Stock Returns.” Journal of Political Economy 111, no. 3 (June): 642-85.
Peristiani, S., D. P. Morgan, and V. Savino. 2010, revised 2013. “The Information Value of the Stress Test and Bank Opacity.” Federal Reserve Bank of New York Staff Reports, no. 460.
Ratnovski, L. 2013. “Liquidity and Transparency in Bank Risk Man-agement.” Journal of Financial Intermediation 22, no. 3 (July): 422-39.
Riepe, Jan. 2014. “Capital Management without Earnings Man-agement: Disentangling the Managerial Reporting Incentives.” Working paper, Institute for Capital Markets and Corporate Finance, Munich School of Management, Ludwig-Maximil-ians-Universität München.
Rochet, J. C. 1992. “Capital Requirements and the Behaviour of Commercial Banks.” European Economic Review 36, no. 5 (June): 1137-70.
——— . 2004. “Rebalancing the Three Pillars of Basel II.” Federal Reserve Bank of New York Economic Policy Review 10, no. 2 (September): 7-21.
——— . 2005. “Prudential Policy.” Bank of Japan Monetary and Economic Studies 23, no. S-1 (October): 93-119.
Ryan, S. 2012. “Financial Reporting for Financial Instruments.” Foundations and Trends in Accounting 6, no. 3-4: 187-354.
Santomero, A. M., and P. Hoffman. 1998. “Problem Bank Resolution: Evaluating the Options.” Working paper, Wharton Financial Institutions Center.
Shin, H. S. 2009. “Reflections on Northern Rock: The Bank Run That Heralded the Global Financial Crisis.” Journal of Economic Perspectives 23, no. 1 (winter): 101-19.
Skinner, D. J. 2008. “The Rise of Deferred Tax Assets in Japan: The Role of Deferred Tax Accounting in the Japanese Banking Crisis.” Journal of Accounting and Economics 46, no. 2-3 (December): 218-39.
Song, C., W. Thomas, and H. Yi. 2010. “Value Relevance of FAS 157 Fair Value Hierarchy Information and the Impact of Corporate Governance Mechanisms.” Accounting Review 85, no. 4 (July): 1375-410.
Stephanou, C. 2010. “Rethinking Market Discipline in Banking: Lessons from the Financial Crisis.” World Bank Policy Research Working Paper no. 5227.
U.S. Department of the Treasury. 2009. “Financial Regulatory Reform, A New Foundation: Rebuilding Financial Supervision and Regulation.” Available at http://www.treasury.gov/initiatives/wsr/Documents/FinalReport_web.pdf.
Van den Heuvel, S. 2009. “The Bank Capital Channel of Monetary Policy.” Working paper, Board of Governors of the Federal Reserve System.
Vayanos, D. 2004. “Flight to Quality, Flight to Liquidity, and the Pricing of Risk.” NBER Working Paper no. 10327, February.

FRBNY Economic Policy Review / August 2016 149
References (Continued)
The views expressed are those of the author and do not necessarily reflect the position of the Federal Reserve Bank of New York or the Federal Reserve System. The Federal Reserve Bank of New York provides no warranty, express or implied, as to the accuracy, timeliness, completeness, merchantability, or fitness for any particular purpose of any information contained in documents produced and provided by the Federal Reserve Bank of New York in any form or manner whatsoever.
Vyas, D. 2011. “The Timeliness of Accounting Write-Downs by U.S. Financial Institutions during the Financial Crisis of 2007-2008.” Journal of Accounting Research 49, no. 3 (June): 823-60.
Wahlen, J. M. 1994. “The Nature of Information in Commercial Bank Loan Loss Disclosures.” Accounting Review 69, no. 3 (July): 455-78.
Wall, L., and T. Koch. 2000. “Bank Loan-Loss Accounting: A Review of Theoretical and Empirical Evidence.” Federal Reserve Bank of Atlanta Economic Review 85, no. 2 (second quarter): 1-19.

fact has prompted a range of proposals for enhanced public disclosure by banks. Many of these proposals have focused on disclosure of forward-looking risk information, such as value at risk (VaR) for trading portfolios or model-based estimates of credit risk exposure. In the words of a major international supervisory group, disclosure of VaR and other forward-looking risk measures is a means of providing “a more meaningful picture of the extent and nature of the financial risks a firm incurs, and of the efficacy of the firm’s risk management practices” (Multidisciplinary Working Group on Enhanced Disclosure 2001).
But to what extent does such information result in meaningful market discipline? Is risk taking or performance affected by the amount of information banks provide about their risk exposures and risk management systems? This article explores these questions by examining whether the amount of information disclosed by a sample of large U.S. bank holding companies (BHCs) affects the future risk-adjusted performance of those banking firms. We focus, in particular, on disclosures made in the banks’ annual reports about market risk in their trading activities. Following previous work on disclosure (Baumann and Nier 2004; Nier and Baumann 2006; Pérignon and Smith 2010; Zer 2014), we construct a market risk disclosure index and ask how differences in this index affect future performance.
1. Introduction
Market discipline has occupied an increasingly prominent position in discussions of the banking industry in recent years. Market discipline is the idea that the actions of shareholders, creditors, and counterparties of banking companies can influence the investment, operational, and risk-taking decisions of bank managers (Flannery 2001; Bliss and Flannery 2002). Bank supervisors have embraced market discipline as a complement to supervisory and regulatory tools for monitoring risk at individual banks and for limiting systemic risk in the banking system. For instance, the Basel Committee on Banking Supervision says “the provision of meaningful information about common risk metrics to market participants is a fundamental tenet of a sound banking system. It reduces information asymmetry and helps promote comparability of banks’ risk profiles” (Basel Committee on Banking Supervision 2015).1
For market discipline to be effective, market participants must have sufficient information to assess the current condition and future prospects of banking companies. This
1 The Basel II/III regulatory capital regime incorporates market discipline as the “third pillar,” along with minimum capital standards and supervisory oversight (Basel Committee on Banking Supervision 2004).
FRBNY Economic Policy Review / August 2016 151
Beverly Hirtle
Public Disclosure and Risk-Adjusted Performance at Bank Holding Companies
The author thanks Sarita Subramanian, Matthew Botsch, Ging Cee Ng, Peter Hull, Vitaly Bord, Eric McKay, and Bryan Yang for excellent research assistance in constructing the data set used in this article and Robert DeYoung, Mark Flannery, Donald Morgan, Christophe Pérignon, Philip Strahan, and Til Schuermann for helpful comments and suggestions. The views expressed in this article are those of the author and do not necessarily reflect the views of the Federal Reserve Bank of New York or the Federal Reserve System.
The author declares that she has no relevant or material financial interests that relate to the research described in this article.
Beverly Hirtle is a senior vice president at the Federal Reserve Bank of New York.
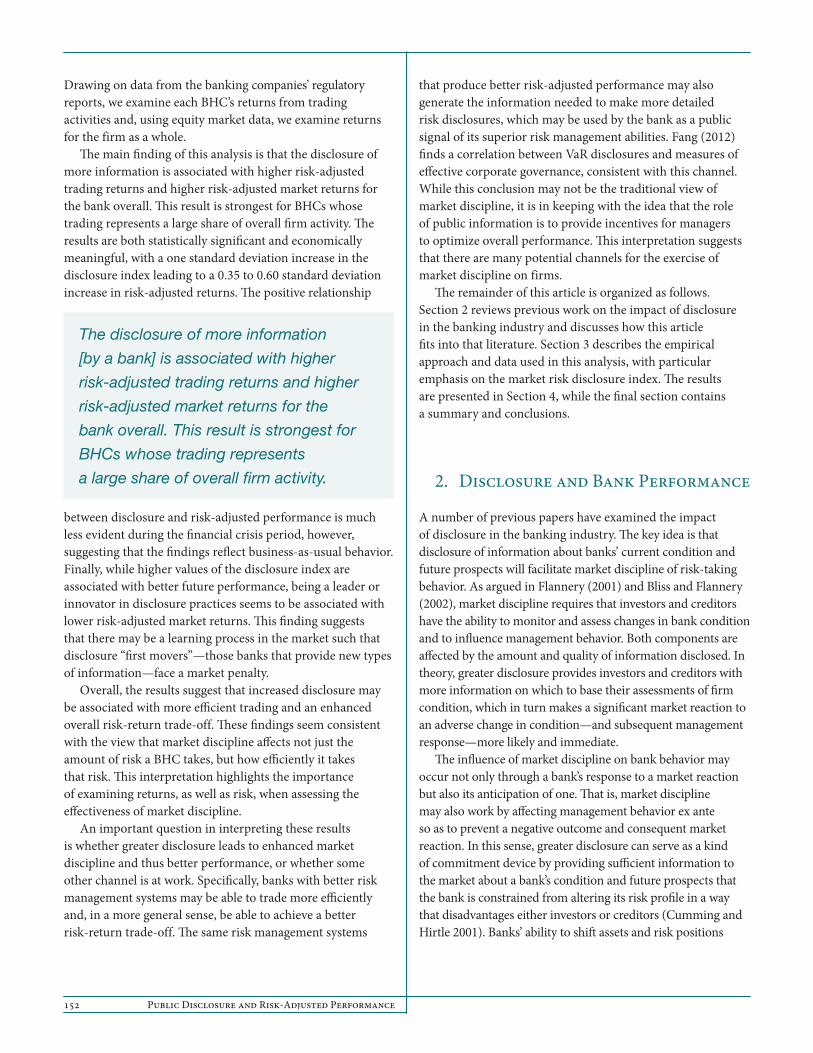
152 Public Disclosure and Risk-Adjusted Performance
Drawing on data from the banking companies’ regulatory reports, we examine each BHC’s returns from trading activities and, using equity market data, we examine returns for the firm as a whole.
The main finding of this analysis is that the disclosure of more information is associated with higher risk-adjusted trading returns and higher risk-adjusted market returns for the bank overall. This result is strongest for BHCs whose trading represents a large share of overall firm activity. The results are both statistically significant and economically meaningful, with a one standard deviation increase in the disclosure index leading to a 0.35 to 0.60 standard deviation increase in risk-adjusted returns. The positive relationship
between disclosure and risk-adjusted performance is much less evident during the financial crisis period, however, suggesting that the findings reflect business-as-usual behavior. Finally, while higher values of the disclosure index are associated with better future performance, being a leader or innovator in disclosure practices seems to be associated with lower risk-adjusted market returns. This finding suggests that there may be a learning process in the market such that disclosure “first movers”—those banks that provide new types of information—face a market penalty.
Overall, the results suggest that increased disclosure may be associated with more efficient trading and an enhanced overall risk-return trade-off. These findings seem consistent with the view that market discipline affects not just the amount of risk a BHC takes, but how efficiently it takes that risk. This interpretation highlights the importance of examining returns, as well as risk, when assessing the effectiveness of market discipline.
An important question in interpreting these results is whether greater disclosure leads to enhanced market discipline and thus better performance, or whether some other channel is at work. Specifically, banks with better risk management systems may be able to trade more efficiently and, in a more general sense, be able to achieve a better risk-return trade-off. The same risk management systems
that produce better risk-adjusted performance may also generate the information needed to make more detailed risk disclosures, which may be used by the bank as a public signal of its superior risk management abilities. Fang (2012) finds a correlation between VaR disclosures and measures of effective corporate governance, consistent with this channel. While this conclusion may not be the traditional view of market discipline, it is in keeping with the idea that the role of public information is to provide incentives for managers to optimize overall performance. This interpretation suggests that there are many potential channels for the exercise of market discipline on firms.
The remainder of this article is organized as follows. Section 2 reviews previous work on the impact of disclosure in the banking industry and discusses how this article fits into that literature. Section 3 describes the empirical approach and data used in this analysis, with particular emphasis on the market risk disclosure index. The results are presented in Section 4, while the final section contains a summary and conclusions.
2. Disclosure and Bank Performance
A number of previous papers have examined the impact of disclosure in the banking industry. The key idea is that disclosure of information about banks’ current condition and future prospects will facilitate market discipline of risk-taking behavior. As argued in Flannery (2001) and Bliss and Flannery (2002), market discipline requires that investors and creditors have the ability to monitor and assess changes in bank condition and to influence management behavior. Both components are affected by the amount and quality of information disclosed. In theory, greater disclosure provides investors and creditors with more information on which to base their assessments of firm condition, which in turn makes a significant market reaction to an adverse change in condition—and subsequent management response—more likely and immediate.
The influence of market discipline on bank behavior may occur not only through a bank’s response to a market reaction but also its anticipation of one. That is, market discipline may also work by affecting management behavior ex ante so as to prevent a negative outcome and consequent market reaction. In this sense, greater disclosure can serve as a kind of commitment device by providing sufficient information to the market about a bank’s condition and future prospects that the bank is constrained from altering its risk profile in a way that disadvantages either investors or creditors (Cumming and Hirtle 2001). Banks’ ability to shift assets and risk positions
The disclosure of more information
[by a bank] is associated with higher
risk-adjusted trading returns and higher
risk-adjusted market returns for the
bank overall. This result is strongest for
BHCs whose trading represents
a large share of overall firm activity.

FRBNY Economic Policy Review / August 2016 153
quickly has been cited as one of the key sources of opaqueness in the banking industry (Meyers and Rajan 1998). In fact, several studies have found evidence of greater opaqueness at banks with higher shares of liquid assets, including, espe-cially, trading positions (Morgan 2002; Iannotta 2006; Hirtle 2006).2 In a related vein, Bushman and Williams (2012) find that loan loss provisioning practices intended to smooth earnings inhibit risk-taking discipline by making banks more opaque to outsiders.
Underlying much of this discussion is the idea that greater disclosure and enhanced market discipline will lead to reductions in bank risk. Enhanced market discipline would mean that the costs of increased risk would be more fully borne by the bank and would therefore presumably play a larger role in its risk-taking decisions. More risk-sensitive market prices could also provide signals to regulators that might induce or influence supervisory action (Flannery 2001). While greater disclosure is likely to lead to a reduction in bank risk, it might also have some offsetting negative outcomes. More information reduces the likelihood that the bank would face an excessive (undeserved) risk premium or that market prices would overreact to news about the firm because of uncertainty about its true condition and prospects—an effect that could lower the bank’s funding costs and increase the range of viable (positive net present value) investments, some of which could be riskier than its current portfolio. The net impact of all of these influences is an empirical question.
Most of the previous empirical work on market discipline has focused on how disclosure affects bank risk taking. For instance, several papers examine market price reaction to changes in bank condition or to differences in risk profiles across banks. Some of these papers have found that bond spreads increase with bank risk exposure, especially following the early 1990s reforms associated with the Federal Deposit Insurance Corporation Improvement Act. Morgan and Stiroh (2001) find that banks with riskier assets (such as trading assets) pay higher credit spreads on newly issued bonds. Similarly, Covitz, Hancock, and Kwast (2004a, 2004b) and Jagtiani, Kaufman, and Lemieux (2002) find evidence that subordinated debt spreads increase with banking company risk. In related work, Goyal (2005) finds that riskier banks are more likely to have restrictive debt covenants in their publicly issued debt. However, more recent work (Balasubramnian and Cyree 2011; Acharya, Anginer, and Warburton 2014; Santos 2014) suggests that the bonds of the largest banking companies are less sensitive to risk than bonds issued by smaller BHCs, presumably because
2 In contrast, Flannery, Kwan, and Nimalendran (2004) find no evidence that bank assets are more opaque than the assets of nonfinancial firms.
the larger firms are regarded by market participants as “too big to fail.” These papers call into question the efficacy of market discipline, at least for the very largest and most complex bank holding companies.
In a somewhat different vein, several papers have examined the impact of disclosure on risk taking using equity trading characteristics—such as bid-ask spreads or price volatility—as proxies for risk.3 Many of these studies focus on nonfinancial firms (for example, Bushee and Noe [2000]; Luez and Verrecchia [2000]; Linsmeier et al. [2002]), but some examine the link between disclosure and market volatility in the banking industry. Baumann and Nier (2004) and Nier and
Baumann (2006) construct a disclosure index based on the number of balance sheet and income statement items reported by a cross-country sample of banks. They find that stock price volatility decreases and capital buffers increase as the amount of information disclosed increases, consistent with the idea that greater disclosure enhances market discipline. Zer (2014) constructs a disclosure index using balance sheet information from BHC 10-K filings submitted to the U.S. Securities and Exchange Commission and shows that BHCs with higher values of the index have lower option-implied default proba-bilities and stock price volatility.
Fewer papers have examined the relationship between disclosure and performance—that is, whether banking companies that disclose more information have better subsequent operating or stock market performance. Several papers have examined this relationship for nonfinancial firms. Eugster and Wagner (2011) construct an index of voluntary disclosure by Swiss companies and demonstrate that firms with higher voluntary disclosure have higher abnormal stock returns, though this effect is
3 Using a very different approach, Kwan (2004) examines the impact of market discipline on bank risk taking by comparing the risk profiles of publicly traded and non-publicly traded bank holding companies. He finds that publicly traded banks take more risk than non-publicly traded institutions, which he interprets as being contrary to market discipline.
Greater disclosure can serve as a kind
of commitment device by providing
sufficient information to the market about
a bank’s condition and future prospects
that the bank is constrained from altering
its risk profile in a way that disadvantages
either investors or creditors.

154 Public Disclosure and Risk-Adjusted Performance
evident predominantly for more opaque companies. Barth, Konchitchki, and Landsman (2013) find that firms with more transparent earnings have a lower cost of capital.
In the banking industry, Ellul and Yerramilli (2013) find that banks with stronger risk management have higher operating profits (return on assets) and stock return performance. While that paper focuses on risk management rather than disclosure per se, it measures risk management strength based on an index constructed from 10-K filings—an approach similar to the one used in this article and others focusing on disclosure. Ellul and Yerramilli is also relevant because risk management and disclosure are linked, in that enhanced risk management systems generate the kind of forward-looking risk information disclosed by some BHCs. Consistent with this idea, Fang (2012) finds a positive correlation between the amount of information
BHCs disclose about value at risk and measures of effective corporate governance. Fang also finds that more disclosure is correlated with a lower cost of capital, when cost of capital is measured using equity analyst forecasts.
The analysis in this article is complementary to previous work on disclosure in that it examines the impact of enhanced disclosure on both operating and stock market performance for large U.S. bank holding companies. In particular, it investigates whether enhanced disclosure is associated with higher subsequent risk-adjusted performance. The analysis thus assesses whether disclosure affects the efficiency of risk taking, rather than whether enhanced disclosure is associated with higher or lower risk per se. As noted above, the theoretical relationship between disclosure and risk taking is not straightforward and there likely is considerable endogeneity between disclosure and
Table1Basic Statistics of the Regression Sample
Performance Variables Mean Median Standard Deviation Minimum Maximum
Risk-adjusted trading return 3.063 2.330 3.033 -5.428 21.501Risk-adjusted market return 0.083 0.082 0.138 -0.333 0.0371Alpha 0.046 0.025 0.483 -1.992 4.034
Disclosure Variables
Disclosure leader 0.072 0 0.260 0 1Aggregate disclosure index 5.769 5 4.653 0 15First principal component 0.014 -0.650 2.660 -3.018 5.692
BHC Characteristics
Asset size 415.2 169.7 573.3 25.1 2457.9Risk-weighted assets divided by total assets 0.758 0.795 0.174 0.309 1.144Common equity divided by total assets 8.271 8.248 1.950 3.235 15.696Trading assets divided by total assets 0.073 0.029 0.103 0.001 0.490Noninterest income divided by operating
income0.524 0.466 0.160 0.018 0.996
Revenue source concentration 0.406 0.404 0.063 0.249 0.654
Sources: Federal Reserve Board, Consolidated Financial Statements of Bank Holding Companies (FR Y-9C data); Center for Research in Security Prices (CRSP); Securities and Exchange Commission EDGAR database; company websites.
Notes: The sample consists of 293 annual observations for a sample of thirty-six bank holding companies with trading assets exceeding $1 billion (in 2013 dollars) at some point between 1994 and 2012. BHC characteristics and trading revenue data are from the Federal Reserve Y-9C reports. Disclosure data are from the BHCs’ annual reports. Market price data are from CRSP. Risk-adjusted trading return is annual trading revenue divided by the annual standard deviation of quarterly trading revenue. Risk-adjusted market returns is the annual average of weekly equity price returns divided by the standard deviation of weekly returns. Alpha is the intercept term from a three-factor market return model using Fama-French factors. Trading return is annual trading revenue divided by trading assets. Market return is the annual average of weekly equity price returns. Disclosure leader is a dummy variable that indicates whether a BHC is the only one to report a given disclosure item in a given year. Aggregate disclosure index is the value of the market risk disclosure index. First principal component is the first principal component of the eighteen individual data items that comprise the aggregate index.
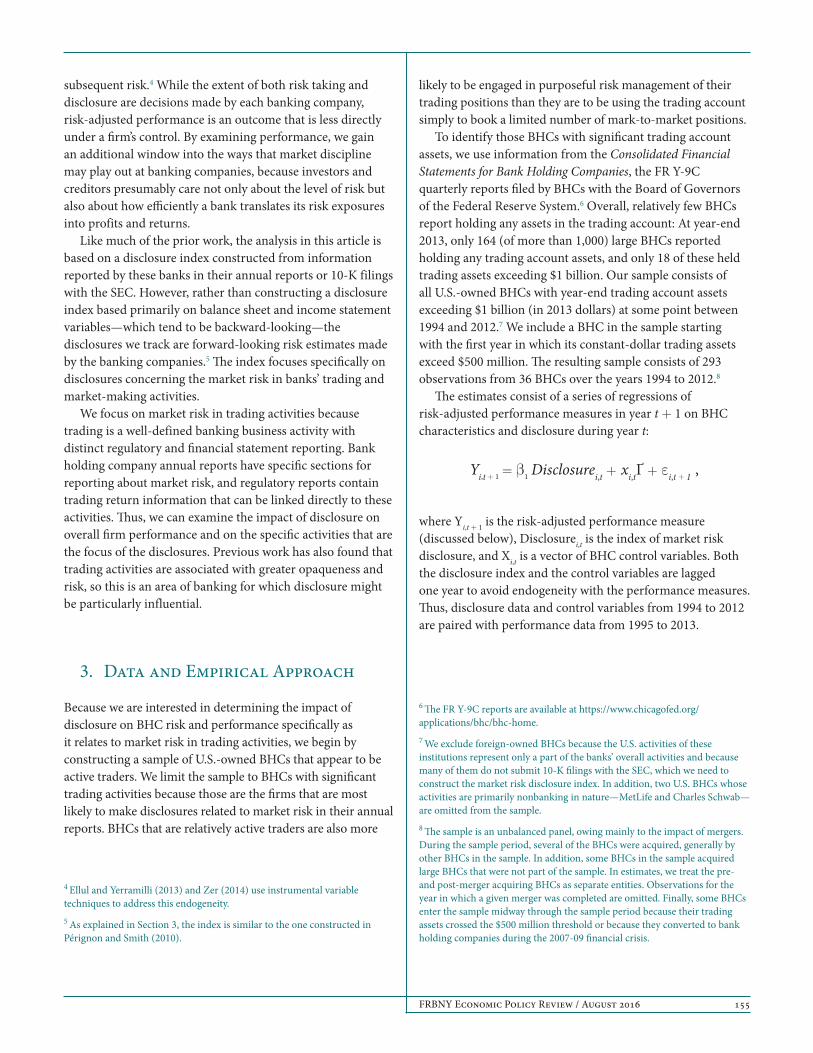
FRBNY Economic Policy Review / August 2016 155
subsequent risk.4 While the extent of both risk taking and disclosure are decisions made by each banking company, risk-adjusted performance is an outcome that is less directly under a firm’s control. By examining performance, we gain an additional window into the ways that market discipline may play out at banking companies, because investors and creditors presumably care not only about the level of risk but also about how efficiently a bank translates its risk exposures into profits and returns.
Like much of the prior work, the analysis in this article is based on a disclosure index constructed from information reported by these banks in their annual reports or 10-K filings with the SEC. However, rather than constructing a disclosure index based primarily on balance sheet and income statement variables—which tend to be backward-looking—the disclosures we track are forward-looking risk estimates made by the banking companies.5 The index focuses specifically on disclosures concerning the market risk in banks’ trading and market-making activities.
We focus on market risk in trading activities because trading is a well-defined banking business activity with distinct regulatory and financial statement reporting. Bank holding company annual reports have specific sections for reporting about market risk, and regulatory reports contain trading return information that can be linked directly to these activities. Thus, we can examine the impact of disclosure on overall firm performance and on the specific activities that are the focus of the disclosures. Previous work has also found that trading activities are associated with greater opaqueness and risk, so this is an area of banking for which disclosure might be particularly influential.
3. Data and Empirical Approach
Because we are interested in determining the impact of disclosure on BHC risk and performance specifically as it relates to market risk in trading activities, we begin by constructing a sample of U.S.-owned BHCs that appear to be active traders. We limit the sample to BHCs with significant trading activities because those are the firms that are most likely to make disclosures related to market risk in their annual reports. BHCs that are relatively active traders are also more
4 Ellul and Yerramilli (2013) and Zer (2014) use instrumental variable techniques to address this endogeneity.5 As explained in Section 3, the index is similar to the one constructed in Pérignon and Smith (2010).
likely to be engaged in purposeful risk management of their trading positions than they are to be using the trading account simply to book a limited number of mark-to-market positions.
To identify those BHCs with significant trading account assets, we use information from the Consolidated Financial Statements for Bank Holding Companies, the FR Y-9C quarterly reports filed by BHCs with the Board of Governors of the Federal Reserve System.6 Overall, relatively few BHCs report holding any assets in the trading account: At year-end 2013, only 164 (of more than 1,000) large BHCs reported holding any trading account assets, and only 18 of these held trading assets exceeding $1 billion. Our sample consists of all U.S.-owned BHCs with year-end trading account assets exceeding $1 billion (in 2013 dollars) at some point between 1994 and 2012.7 We include a BHC in the sample starting with the first year in which its constant-dollar trading assets exceed $500 million. The resulting sample consists of 293 observations from 36 BHCs over the years 1994 to 2012.8
The estimates consist of a series of regressions of risk-adjusted performance measures in year t + 1 on BHC characteristics and disclosure during year t:
Yi,t + 1 = β1 Disclosurei,t + xi,tҐ + εi,t + 1 ,
where Yi,t + 1 is the risk-adjusted performance measure (discussed below), Disclosurei,t is the index of market risk disclosure, and Xi,t is a vector of BHC control variables. Both the disclosure index and the control variables are lagged one year to avoid endogeneity with the performance measures. Thus, disclosure data and control variables from 1994 to 2012 are paired with performance data from 1995 to 2013.
6 The FR Y-9C reports are available at https://www.chicagofed.org/applications/bhc/bhc-home. 7 We exclude foreign-owned BHCs because the U.S. activities of these institutions represent only a part of the banks’ overall activities and because many of them do not submit 10-K filings with the SEC, which we need to construct the market risk disclosure index. In addition, two U.S. BHCs whose activities are primarily nonbanking in nature—MetLife and Charles Schwab—are omitted from the sample.8 The sample is an unbalanced panel, owing mainly to the impact of mergers. During the sample period, several of the BHCs were acquired, generally by other BHCs in the sample. In addition, some BHCs in the sample acquired large BHCs that were not part of the sample. In estimates, we treat the pre- and post-merger acquiring BHCs as separate entities. Observations for the year in which a given merger was completed are omitted. Finally, some BHCs enter the sample midway through the sample period because their trading assets crossed the $500 million threshold or because they converted to bank holding companies during the 2007-09 financial crisis.

156 Public Disclosure and Risk-Adjusted Performance
The control variables include measures of institution size (the log of assets), risk profile (the ratio of risk-weighted assets to total assets and the ratio of common equity to total assets), revenue composition (noninterest income as a share of operating income), and revenue concentration (Herfindahl-Hirschman Indexes based on sources of revenue9). The regressions also include the ratio of trading assets to total assets as a measure of the extent of the institution’s trading activities. All BHC data are from the Y-9C reports. The regressions also include BHC fixed effects and year dummies. Table 1 reports the basic statistics of the regression data set.
The key variables in the estimates are the measures of risk-adjusted performance and the market risk disclosure index. The risk-adjusted performance measures are based on two distinct sets of information. The first is derived from accounting data on BHCs’ trading activities. Specifically, BHC regulatory reports contain information on quarterly trading revenues: the gains and losses on
9 The revenue concentration index is based on the shares of net interest income, fiduciary income, deposit service charges, trading revenue, and other noninterest income in overall operating income. Stiroh (2006) shows that revenue concentration is a significant determinant of BHC equity price volatility.
the firms’ trading activities, including commission, fee, and spread income. We collect trading performance data from the first quarter of 1995 to the fourth quarter of 2013. Using these data, we calculate quarterly trading return as trading revenue in a quarter as a percentage of beginning-of-quarter trading assets. Trading volatility is then calculated as the standard deviation of quarterly trading return within a year, and trading return is calculated as the annual average of quarterly trading return. Finally, we compute risk-adjusted trading return as trading return divided by trading volatility (essentially, the trading revenue “Sharpe ratio”). Since this measure reflects risk and return on the BHCs’ trading activities, it is tied directly to the disclosure information covered in the market risk disclosure index.
The second set of measures is derived from firmwide equity prices. Specifically, we use stock return data from the University of Chicago’s Center for Research in Security Prices (CRSP) for the BHCs in our sample. For each year between 1995 and 2013, we cumulate daily returns from CRSP to form weekly returns, and then calculate annual average weekly returns, expressed at an annual rate. We also calculate the standard deviation of weekly returns within each year, and generate risk-adjusted market returns as the ratio of average returns to the standard deviation of returns. As a second measure of risk-adjusted market performance, we include in the data set the “alpha” (intercept term) from the three-factor Fama-French model, where the model is estimated annually for each BHC using weekly return data and risk factors.
Basic statistics for all of the risk and performance measures are reported in Table 1.
The market risk disclosure index is the other key variable in the analysis. As explained above, this index captures the amount of information that banks disclose about their forward-looking estimates of market risk exposure in their annual reports or 10-K filings with the SEC.10 The index covers eighteen specific types of information that BHCs could provide in their filings, primarily related to their value-at-risk (VaR) estimates.
Value at risk is a very commonly used measure of market risk exposure from trading activities. VaR is an estimate of a particular percentile of the trading return distribution, assuming that trading positions are fixed for a specified holding period. VaR estimates made by banks in the sample are typically based on a one-day holding period, generally at
10 We used the SEC’s EDGAR database to access the 10-K filings. The EDGAR database is available at: http://www.sec.gov/edgar.shtml.
Table 2 The Market Risk Disclosure Index
Category Data Items
Overall value at risk (VaR) Holding period and confidence intervalAnnual average VaRYear-end VaRMinimum VaR over the yearMaximum VaR over the yearVaR limit (dollar amount)Histogram of daily VaR
VaR by risk type Annual average VaR by risk typeYear-end VaR by risk typeMinimum VaR by risk typeMaximum VaR by risk type
Backtesting Chart of daily trading profit and loss versus daily VaRNumber of days that losses exceeded VaR
Returns distribution Histogram of daily trading profit and lossLargest daily loss
Stress testing Mention that stress tests are doneDescribe the stress tests qualitatively
Report stress test results
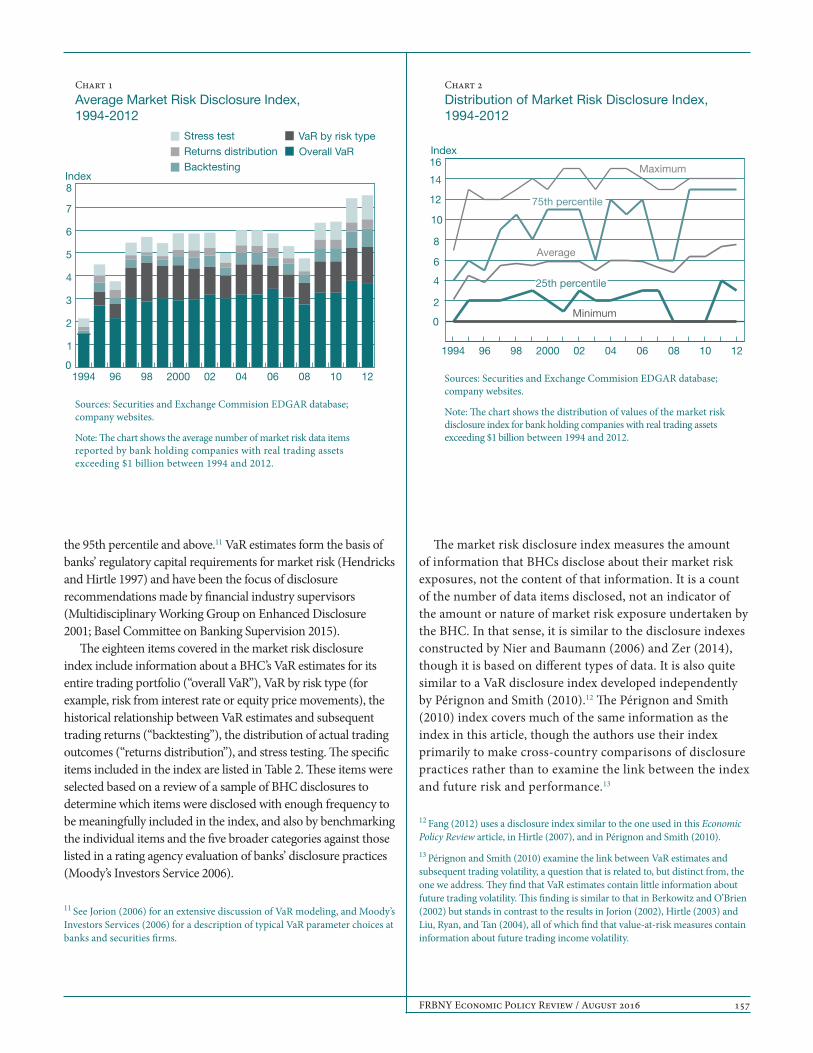
FRBNY Economic Policy Review / August 2016 157
the 95th percentile and above.11 VaR estimates form the basis of banks’ regulatory capital requirements for market risk (Hendricks and Hirtle 1997) and have been the focus of disclosure recommendations made by financial industry supervisors (Multidisciplinary Working Group on Enhanced Disclosure 2001; Basel Committee on Banking Supervision 2015).
The eighteen items covered in the market risk disclosure index include information about a BHC’s VaR estimates for its entire trading portfolio (“overall VaR”), VaR by risk type (for example, risk from interest rate or equity price movements), the historical relationship between VaR estimates and subsequent trading returns (“backtesting”), the distribution of actual trading outcomes (“returns distribution”), and stress testing. The specific items included in the index are listed in Table 2. These items were selected based on a review of a sample of BHC disclosures to determine which items were disclosed with enough frequency to be meaningfully included in the index, and also by benchmarking the individual items and the five broader categories against those listed in a rating agency evaluation of banks’ disclosure practices (Moody’s Investors Service 2006).
11 See Jorion (2006) for an extensive discussion of VaR modeling, and Moody’s Investors Services (2006) for a description of typical VaR parameter choices at banks and securities firms.
The market risk disclosure index measures the amount of information that BHCs disclose about their market risk exposures, not the content of that information. It is a count of the number of data items disclosed, not an indicator of the amount or nature of market risk exposure undertaken by the BHC. In that sense, it is similar to the disclosure indexes constructed by Nier and Baumann (2006) and Zer (2014), though it is based on different types of data. It is also quite similar to a VaR disclosure index developed independently by Pérignon and Smith (2010).12 The Pérignon and Smith (2010) index covers much of the same information as the index in this article, though the authors use their index primarily to make cross-country comparisons of disclosure practices rather than to examine the link between the index and future risk and performance.13
12 Fang (2012) uses a disclosure index similar to the one used in this Economic Policy Review article, in Hirtle (2007), and in Pérignon and Smith (2010).13 Pérignon and Smith (2010) examine the link between VaR estimates and subsequent trading volatility, a question that is related to, but distinct from, the one we address. They find that VaR estimates contain little information about future trading volatility. This finding is similar to that in Berkowitz and O’Brien (2002) but stands in contrast to the results in Jorion (2002), Hirtle (2003) and Liu, Ryan, and Tan (2004), all of which find that value-at-risk measures contain information about future trading income volatility.
Sources: Securities and Exchange Commision EDGAR database; company websites.
Note: �e chart shows the average number of market risk data items reported by bank holding companies with real trading assets exceeding $1 billion between 1994 and 2012.
0
1
2
3
4
5
6
7
8
121008060402200098961994
Stress testReturns distributionBacktesting
VaR by risk typeOverall VaR
Chart 1Average Market Risk Disclosure Index, 1994-2012
Index
Sources: Securities and Exchange Commision EDGAR database; company websites.
Note: �e chart shows the distribution of values of the market risk disclosure index for bank holding companies with real trading assets exceeding $1 billion between 1994 and 2012.
0
2
4
6
8
10
12
14
16
Minimum
Average
Maximum
Chart 2Distribution of Market Risk Disclosure Index, 1994-2012
Index
121008060402200098961994
75th percentile
25th percentile

158 Public Disclosure and Risk-Adjusted Performance
Chart 1 shows the average value of the market risk disclosure index between 1994 and 2012. The average value of the index increases from just over 2 in 1994 to nearly 8 in 2012. Most of this increase occurs during the early part of the sample, between 1994 and 1998.
The growth through 1998 reflects two significant regulatory developments. First, following the international agreement in Basel, U.S. risk-based capital guidelines were amended in 1998 to incorporate minimum regulatory capital requirements for market risk in trading activities, with the requirements taking full effect in January of that year (Hendricks and Hirtle 1997). The market risk capital charge introduced through this amendment is based on the output of banks’ internal VaR models, and the need to comply with the new capital requirements spurred the development of value-at-risk models in the banking industry. On a separate track, SEC Financial Reporting Release (FRR) 48 required all public firms with material market risk exposure to make enhanced quantitative and qualitative disclosures about these risks, starting in 1997 (U.S. Securities and Exchange Commission 1997). FRR 48
included three options for forward-looking, quantitative market risk disclosures, one of which was value at risk.14 Together, these two regulatory developments spurred disclosure of VaR estimates and related information.
Chart 1 shows the average value of the market risk disclosure index, but the average masks considerable diversity across BHCs in the sample. Chart 2 illustrates the range of disclosure index values by year. Specifically, the chart shows the minimum and maximum values of the index by year and the 25th and 75th percentiles, along with the averages reported in Chart 1. The maximum value of the index grows from 7 in 1994 to 15 in the mid-2000s, falls back to 13, and then settles at 14 near the end of the sample period. At least one BHC in each year reported no market risk information (in other words, generated an index value of zero). As the average value of the disclosure
14 The Pérignon and Smith (2006) index also grows through 1998, and the authors cite the influence of FRR 48 in this finding for the U.S. banks in their sample. See Roulstone (1999) for an assessment of the impact of FRR 48 on nonfinancial firms.
Chart 3Disclosure Index for Large BHCs
Citigroup
Bank of New York
Goldman Sachs
Morgan Stanley
BB&T
Bank of America
FleetBoston
Mellon Financial
Countrywide
BNY Mellon
J.P. Morgan
Northern Trust
Fifth Third
Bank One
JPMorgan Chase
PNC
First Horizon
Bankers Trust
KeyCorp
Regions Financial
SunTrustState Street
1994 97 2000 03 06 09 12 1994 97 2000 03 06 09 121994 97 2000 03 06 09 121994 97 2000 03 06 09 12 1994 97 2000 03 06 09 12
U.S. Bancorp Wachovia Wells Fargo
0
10
20
0
10
20
0
10
20
0
10
20
0
10
20
0
10
20
0
10
20
Sources: Securities and Exchange Commision EDGAR database; company websites.
Notes: �e chart includes bank holding companies (BHCs) with trading assets greater than $1 billion for at least four years between 1994 and 2012. �e data re�ect the BHCs’ corporate identities in 2012 or the last year in which they are in the sample, with no adjustments for mergers.

FRBNY Economic Policy Review / August 2016 159
index increases, the dispersion within the sample BHCs grows. The interquartile range (25th to 75th percentile) more than doubles over the sample period, owing mainly to growing differentiation in the top half of the distribution after 1998. Over the full period, the distance between “top reporting” BHCs and those nearer to the average widened considerably.
Chart 3 shows the market risk disclosure index at the individual BHC level. The BHCs shown in the chart are those that are in the sample for at least four years, traced backward from the BHCs’ corporate identity at the end of the sample period without adjusting for mergers. Not surprisingly given the average results, the index tends to increase over the sample period at the individual BHC level. The typical pattern is for the index to rise in steps over time, though there are certainly cases in which the index declines.
On a cross-sectional basis, the index tends to be higher at larger BHCs and at BHCs with more trading activity, on both an absolute and relative level. Table 3 reports the correlation between the value of the market risk disclosure index and real (2013 dollar) assets, trading assets, and trading asset share, where values are averaged across the years that a BHC is in the sample. Reading down the first column of the table, the correlation coefficients between the disclosure index and the measures of BHC and trading activity scale are large and positive.
Finally, Table 4 reports the frequency with which the individual data items in the market risk disclosure index are reported. The first column reports the frequency
across all observations between 1994 and 2012, while the next two columns report the frequency at the beginning and end of the sample period. The most commonly reported data element is the holding period and confidence interval of the VaR estimate, reported for about 75 percent of the BHC-year observations. This data item is a close proxy for whether a BHC disclosed any information about VaR at all. About 30 percent of the observations include some information about VaR by risk type, while information about backtesting and the distribution of returns is reported in 10 to 35 percent of the observations. About 40 percent of the observations indicate that the BHC does some kind of stress testing, but only a tiny share—less than 2 percent—report the results of these efforts. As a comparison of the columns with data from 1994 and 2012 makes clear, the frequency of reporting increased over the span of the sample period for nearly every data item.
In the regressions, we use the overall market risk disclosure index as the baseline measure of disclosure, but we also construct the first principal component of the cross-sectional variation in reporting of the eighteen individual data items in the index. The basic index is a simple linear weighting (sum) of the individual elements. The first principal component provides an alternate linear combination, with weights that reflect the common variation across BHC-year observations. It captures about 40 percent of this variation, suggesting a meaningful common component of reporting across the individual data items. Finally, we create an indicator variable
Table 3Correlation between Market Risk Disclosure Index and BHC Asset Size and Trading Activity
Market Risk Disclosure Index
Average Real Assets
Average Real Trading Assets
Average Trading Assets Divided by Total Assets
Market risk disclosure index 1.000
Average real assets 0.627 1.000(0.000)
Average real trading assets 0.653 0.881 1.000(0.000) (0.000)
Average trading assets divided by total assets 0.605 0.464 0.705 1.000(0.000) (0.000) (0.000)
Sources: Federal Reserve Board, Consolidated Financial Statements of Bank Holding Companies (FR Y-9C data); Securities and Exchange Commission EDGAR database; company websites.
Notes: Figures in the table reflect average values for the thirty-six bank holding companies that have trading assets of more than $1 billion at some point between 1994 and 2012. Total assets and trading assets are in 2013 dollars and are averaged across the years that a BHC is in the sample. P-values are shown in parentheses.

160 Public Disclosure and Risk-Adjusted Performance
if a given BHC is the only one in the sample to disclose a particular data item in a particular year (“disclosure leader”), to assess the impact of innovations in disclosure practice.15
4. Disclosure and Risk-Adjusted Performance
Table 5 presents the basic results of the estimates relating market risk disclosure to subsequent risk-adjusted returns on trading activities and for the firm as a whole. The first set of columns of
15 The typical pattern is that once one BHC discloses a particular kind of information, others follow in subsequent years. In that sense, BHCs that are the only ones to report an item in a given year are leaders or innovators.
the table present the results for risk-adjusted market returns, the second set of columns present the results for alpha, and the final set of columns contain the results for trading returns.
The estimates uniformly suggest that increased disclosure is associated with higher risk-adjusted returns, both for trading activities and for the BHC as a whole. The coefficients on the aggregate market risk disclosure index and the first principal component variable are positive and statistically significant in each specification. Aside from being statistically significant, the results are economically important: An increase of one standard deviation in the disclosure index or the first principal components measure is associated with a 0.35 to 0.45 standard deviation increase in risk-adjusted market returns and alpha and a 0.50 to 0.60 standard deviation increase in risk-adjusted trading returns.
Table 4Frequency of Individual Data Items in the Market Risk Disclosure Index
Data Item Share of Observations
Overall Value at Risk All Observations 1994 2012
Holding period and confidence interval 0.749 0.538 0.737Annual average VaR 0.624 0.308 0.789Year-end VaR 0.475 0.154 0.474Minimum VaR over the year 0.488 0.154 0.737Maximum VaR over the year 0.536 0.231 0.789VaR limit (dollar amount) 0.115 0.000 0.053Histogram of daily VaR 0.058 0.076 0.105
VaR by Risk TypeAnnual average VaR by risk type 0.342 0.000 0.421Year-end VaR by risk type 0.217 0.000 0.316Minimum VaR by risk type 0.315 0.000 0.421Maximum VaR by risk type 0.319 0.000 0.421
BacktestingChart of daily profit and loss versus daily VaR 0.112 0.077 0.211Number of days losses exceeded VaR 0.349 0.077 0.579
Returns DistributionHistogram of daily profit and loss 0.220 0.154 0.368Largest daily loss 0.075 0.000 0.053
Stress TestingMention that stress tests are done 0.420 0.308 0.579Describe stress tests 0.231 0.077 0.473Report stress test results 0.017 0.000 0.000
Sources: Securities and Exchange Commission EDGAR database; company websites.
Notes: Figures are from1994 to 2012 10-K reports of the thirty-six bank holding companies in the market risk sample. These companies each have trading assets exceeding $1 billion (in 2013 dollars) at some point between 1994 and 2012.

Table 5Disclosure and Risk-Adjusted Returns
Disclosure VariablesRisk-Adjusted Market Return Alpha Risk-Adjusted Trading Return
Disclosure leader -0.058** -0.057* -0.193* -0.189 1.997* 2.050**(0.029) (0.029) (0.111) (0.114) (1.000) (0.972)
Aggregate disclosure index 0.010*** 0.044*** 0.332**(0.002) (0.013) (0.154)
First principal component 0.018*** 0.077*** 0.687**(0.004) (0.023) (0.307)
BHC CharacteristicsLog (asset size) -0.061*** -0.064*** -0.404*** -0.412*** 0.001 -0.165
(0.018) (0.019) (0.111) (0.116) (0.964) (0.926)
Risk-weighted assets divided by total assets -0.085 -0.072 -0.073 -0.014 7.322* 7.790**(0.098) (0.098) (0.716) (0.715) (3.789) (3.776)
Common equity divided by total assets -0.011** -0.011** -0.089*** -0.090*** 0.106 0.103(0.005) (0.005) (0.033) (0.033) (0.198) (0.194)
Trading assets divided by total assets -0.646** -0.652** -2.060* -2.084* 17.346 17.102(0.243) (0.245) (1.174) (1.175) (11.585) (11.553)
Noninterest income divided by operating income -0.060 -0.060 0.168 0.168 5.807** 5.771**(0.093) (0.093) (0.762) (0.763) (2.302) (2.303)
Revenue source concentration 0.089 0.084 0.141 0.113 14.656** 14.733**(0.146) (0.145) (0.941) (0.937) (6.343) (6.491)
Year fixed effects Yes Yes Yes Yes Yes Yes
BHC fixed effects Yes Yes Yes Yes Yes Yes
Number of observations 293 293 293 293 295 295
R-squared 0.781 0.781 0.314 0.313 0.177 0.186
P-Value: Disclosure Variables = 0? 0.000 0.000 0.000 0.000 0.021 0.017
Sources: Federal Reserve Board, Consolidated Financial Statements of Bank Holding Companies (FR Y-9C data); Center for Research in Security Prices (CRSP); Securities and Exchange Commission EDGAR database; company websites.
Notes: Risk-adjusted market return is the annual average of weekly equity price returns divided by the standard deviation of those returns. Alpha is the intercept term from a three-factor market return model using Fama-French factors. Risk-adjusted trading return is annual trading revenue divided by the annual standard deviation of quarterly trading revenue. BHC characteristics are from the Federal Reserve Y-9C reports. Disclosure information is from the BHCs’ annual reports. Stock data are from CRSP. Disclosure leader is a dummy variable indicating that a BHC is the only BHC to disclose a particular data item in a given year. Aggregate disclosure index is the market risk disclosure index. First principal component is based on the eighteen individual data items that comprise the aggregate index. The sample consists of all U.S.-owned BHCs that have trading assets greater than $1 billion (in 2013 dollars) at any time between 1994 and 2012, starting with the year that trading assets exceed $500 million. The regressions include BHC fixed effects and year dummy variables. Residuals are clustered at the BHC level.
* Significant at the 10 percent level.
** Significant at the 5 percent level.
*** Significant at the 1 percent level.
FRBNY Economic Policy Review / August 2016 161

162 Public Disclosure and Risk-Adjusted Performance
Table 6Disclosure and Risk-Adjusted Returns Omitting the Financial Crisis Period
Disclosure VariablesRisk-Adjusted Market Return Alpha Risk-Adjusted Trading Return
Disclosure leader -0.049 -0.047 -0.199 -0.192 1.741 1.823
(0.033) (0.033) (0.125) (0.128) (1.190) (1.163)
Aggregate disclosure index 0.010*** 0.040*** 0.302*(0.003) (0.014) (0.155)
First principal component 0.018*** 0.070*** 0.635**(0.005) (0.026) (0.308)
BHC CharacteristicsLog (asset size) -0.058** -0.060* -0.330** -0.337** -0.590 -0.737
(0.029) (0.030) (0.156) (0.164) (1.382) (1.341)
Risk-weighted assets divided by total assets
-0.022(0.116)
-0.009(0.115)
-0.174(0.638)
-0.123(0.636)
7.500**(3.483)
7.852**(3.483)
Common equity divided by total assets
-0.011*(0.006)
-0.011(0.006)
-0.043(0.031)
-0.043(0.032)
0.062(0.351)
0.071(0.337)
Trading assets divided by total assets -0.625** -0.631** -1.401 -1.417 25.188* 24.891*(0.242) (0.246) (1.067) (1.081) (13.429) (13.262)
Noninterest income divided by operating income
-0.109(0.109)
-0.109(0.108)
-0.466(0.603)
-0.464(0.603)
8.281***(2.771)
8.164***(2.708)
Revenue source concentration 0.149 0.140 0.273 0.231 13.418** 13.467**(0.193) (0.191) (0.807) (0.802) (6.174) (6.273)
Year fixed effects Yes Yes Yes Yes Yes Yes
BHC fixed effects Yes Yes Yes Yes Yes Yes
Number of observations 247 247 247 247 249 249
R-squared 0.782 0.783 0.424 0.424 0.160 0.170
P-Value: Disclosure Variables = 0? 0.000 0.000 0.002 0.002 0.070 0.057
Sources: Federal Reserve Board, Consolidated Financial Statements of Bank Holding Companies (FR Y-9C data); Center for Research in Security Prices (CRSP); Securities and Exchange Commission EDGAR database; company websites.
Notes: Risk-adjusted market return is the annual average of weekly equity price returns divided by the standard deviation of those returns. Alpha is the intercept term from a three-factor market return model using Fama-French factors. Risk-adjusted trading return is annual trading revenue divided by the annual standard deviation of quarterly trading revenue. BHC characteristics are from the Federal Reserve Y-9C reports. Disclosure information is from the BHCs’ annual reports. Stock data are from CRSP. Disclosure leader is a dummy variable indicating that a BHC is the only BHC to disclose a particular data item in a given year. Aggregate disclosure index is the market risk disclosure index. First principal component is based on the eighteen individual data items that comprise the aggregate index. The sample consists of all U.S.-owned BHCs that have trading assets greater than $1 billion (in 2013 dollars) at any time between 1994 and 2012, starting with the year that trading assets exceed $500 million. Observations for the years 2007, 2008, and 2009 are omitted. The regressions include BHC fixed effects and year dummy variables. Residuals are clustered at the BHC level.
* Significant at the 10 percent level.
** Significant at the 5 percent level.
*** Significant at the 1 percent level.

FRBNY Economic Policy Review / August 2016 163
The coefficient estimates on the disclosure leader variable (indicating that the BHC is the only company to disclose a particular index item in a given year) are less robust across specifications. The coefficients are negative and weakly statistically significant in the equations using the market-based measures, but positive and statistically significant in the equations for risk-adjusted trading returns. These results suggest that being a first mover in disclosure is associated with better risk-adjusted performance in the trading activities associated with the disclosure but is less strongly associated with market-based returns for the firm as a whole. One potential explanation for these seemingly inconsistent results is that there are learning costs for investors in understanding and putting into context new types of information.
The sample period for the performance data, 1995 to 2013, includes the 2007-09 financial crisis. Since the crisis was a period of extraordinary volatility in financial markets and for the banking sector, one question to ask is how does including this period in the sample affect the results. To explore the impact of the unusual market conditions during the financial crisis, we re-estimated the equations omitting observations from the peak crisis years, 2007 to 2009. These results are reported in Table 6.
On the whole, omitting the financial crisis period does not significantly alter the results concerning the relationship between disclosure and subsequent risk-adjusted performance. The coefficients on the disclosure variables continue to be positive and statistically significant, with little change in magnitude. The primary difference is that the disclosure leader variable no longer enters the equations with a statistically significant coefficient, though the signs and approximate size of the coefficients are similar to those in the basic results. Thus, the exceptional market and banking sector volatility during the financial crisis does not appear to be driving the overall results.
A related question is whether BHCs that disclosed more risk information experienced higher risk-adjusted returns during the financial crisis. The ideal way to answer this question would be to generate completely separate estimates for the crisis period, but this is not possible owing to limited annual observations. To provide some insight, however, we re-estimate the equations allowing the coefficients on the disclosure index variables to differ between the non-crisis and crisis periods (with the crisis period again defined as 2007 to 2009). Note that the disclosure leader variable is not estimated separately for the two time periods because there is insufficient variation during the crisis period to separately identify the impact. These results are reported in Table 7.
The results differ across the three measures of risk-adjusted performance. For risk-adjusted market returns, the coefficients on the disclosure index and the first principal components variables are positive and statistically significant in both
the crisis and non-crisis periods. The hypothesis that the coefficients are the same cannot be rejected (see the last row of the table, which reports p-values for tests of equality of the coefficients). In contrast, for alpha and for risk-adjusted trading returns, the coefficients are positive and statistically significant only during the non-crisis period. These findings suggest that BHCs that disclosed more trading risk information did not have better (or worse) risk-adjusted trading performance during the financial crisis, while the evidence about overall firm performance is mixed.
Overall, the results in Tables 5 to 7 suggest that increased market risk disclosure is associated with higher risk-adjusted returns. If this link is achieved through market discipline on trading activities, then we might expect that the effect would be stronger for BHCs that are more heavily engaged in trading. To explore this question, we examine results where the coefficients on the disclosure variables are allowed to differ between BHCs
that are “intense traders” and the rest of the sample. These results are shown in Table 8. “Intense traders” are defined as the ten BHCs in the sample with trading assets greater than or equal to $20 billion where trading assets represent at least 10 percent of total assets. Note that by construction, all BHCs in the sample have large trading accounts in absolute dollar terms, so this partition identifies not only BHCs with especially large trading portfolios but also BHCs for which trading represents a particularly large share of firmwide activity.16
As the results in Table 8 illustrate, a statistically significant relationship exists between disclosure and risk-adjusted returns for both intense traders and other large traders, but this relationship is more material for intense trading firms. In every case, the coefficient estimate for the intense traders is larger than that for the other large traders, though these differences are not always significant (see the last row of the table). The coefficient estimates suggest that an increase of one standard deviation in the disclosure index metrics is associated with a
16 “Intense traders” have trading assets that range between 11 and 42 percent of total assets (with a median of 18 percent), as compared to a range of 0.1 to 12.0 percent (with a median of 1.6 percent) for the other large traders in the sample.
BHCs that disclosed more trading risk
information did not have better (or worse)
risk-adjusted trading performance
[than those that disclosed less] during
the financial crisis.
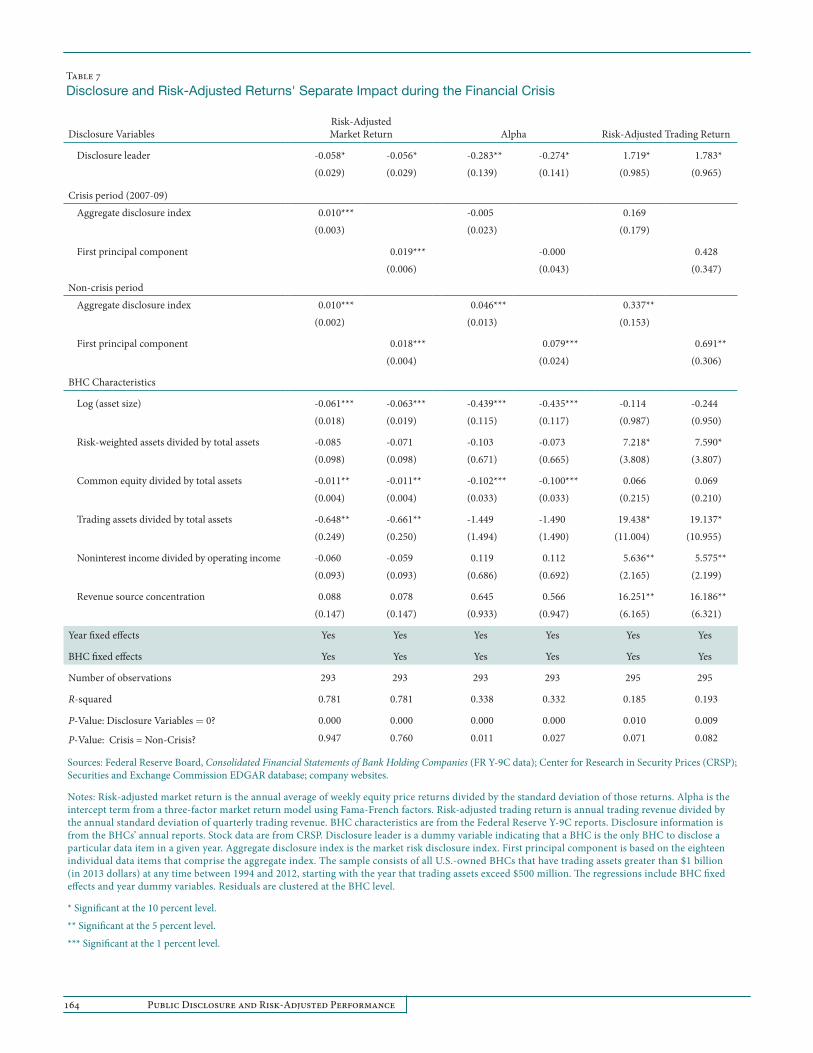
164 Public Disclosure and Risk-Adjusted Performance
Table 7Disclosure and Risk-Adjusted Returns' Separate Impact during the Financial Crisis
Disclosure VariablesRisk-Adjusted Market Return Alpha Risk-Adjusted Trading Return
Disclosure leader -0.058* -0.056* -0.283** -0.274* 1.719* 1.783*(0.029) (0.029) (0.139) (0.141) (0.985) (0.965)
Crisis period (2007-09)Aggregate disclosure index 0.010*** -0.005 0.169
(0.003) (0.023) (0.179)
First principal component 0.019*** -0.000 0.428(0.006) (0.043) (0.347)
Non-crisis periodAggregate disclosure index 0.010*** 0.046*** 0.337**
(0.002) (0.013) (0.153)
First principal component 0.018*** 0.079*** 0.691**(0.004) (0.024) (0.306)
BHC Characteristics
Log (asset size) -0.061*** -0.063*** -0.439*** -0.435*** -0.114 -0.244(0.018) (0.019) (0.115) (0.117) (0.987) (0.950)
Risk-weighted assets divided by total assets -0.085 -0.071 -0.103 -0.073 7.218* 7.590*(0.098) (0.098) (0.671) (0.665) (3.808) (3.807)
Common equity divided by total assets -0.011** -0.011** -0.102*** -0.100*** 0.066 0.069(0.004) (0.004) (0.033) (0.033) (0.215) (0.210)
Trading assets divided by total assets -0.648** -0.661** -1.449 -1.490 19.438* 19.137*(0.249) (0.250) (1.494) (1.490) (11.004) (10.955)
Noninterest income divided by operating income -0.060 -0.059 0.119 0.112 5.636** 5.575**(0.093) (0.093) (0.686) (0.692) (2.165) (2.199)
Revenue source concentration 0.088 0.078 0.645 0.566 16.251** 16.186**(0.147) (0.147) (0.933) (0.947) (6.165) (6.321)
Year fixed effects Yes Yes Yes Yes Yes Yes
BHC fixed effects Yes Yes Yes Yes Yes Yes
Number of observations 293 293 293 293 295 295
R-squared 0.781 0.781 0.338 0.332 0.185 0.193
P-Value: Disclosure Variables = 0? 0.000 0.000 0.000 0.000 0.010 0.009
P-Value: Crisis = Non-Crisis? 0.947 0.760 0.011 0.027 0.071 0.082
Sources: Federal Reserve Board, Consolidated Financial Statements of Bank Holding Companies (FR Y-9C data); Center for Research in Security Prices (CRSP); Securities and Exchange Commission EDGAR database; company websites.
Notes: Risk-adjusted market return is the annual average of weekly equity price returns divided by the standard deviation of those returns. Alpha is the intercept term from a three-factor market return model using Fama-French factors. Risk-adjusted trading return is annual trading revenue divided by the annual standard deviation of quarterly trading revenue. BHC characteristics are from the Federal Reserve Y-9C reports. Disclosure information is from the BHCs’ annual reports. Stock data are from CRSP. Disclosure leader is a dummy variable indicating that a BHC is the only BHC to disclose a particular data item in a given year. Aggregate disclosure index is the market risk disclosure index. First principal component is based on the eighteen individual data items that comprise the aggregate index. The sample consists of all U.S.-owned BHCs that have trading assets greater than $1 billion (in 2013 dollars) at any time between 1994 and 2012, starting with the year that trading assets exceed $500 million. The regressions include BHC fixed effects and year dummy variables. Residuals are clustered at the BHC level.
* Significant at the 10 percent level.
** Significant at the 5 percent level.
*** Significant at the 1 percent level.

FRBNY Economic Policy Review / August 2016 165
Table 8 Disclosure and Risk-Adjusted Returns by Extent of Trading Activity
Disclosure Variables Risk-Adjusted Market Return Alpha Risk-Adjusted Trading Return
Intense Traders
Disclosure leader -0.061 -0.062 -0.191 -0.201 4.203*** 4.000***(0.045) (0.045) (0.148) (0.148) (1.021) (0.980)
Aggregate disclosure index 0.015*** 0.070*** 0.436*(0.003) (0.026) (0.224)
First principal component 0.027*** 0.123*** 0.736*(0.005) (0.044) (0.399)
Other Large TradersDisclosure leader -0.035 -0.033 -0.094 -0.087 -0.557 -0.440
(0.034) (0.033) (0.115) (0.113) (1.132) (1.138)
Aggregate disclosure index 0.008*** 0.033*** 0.308*(0.002) (0.010) (0.169)
First principal component 0.013*** 0.054*** 0.685*(0.004) (0.018) (0.365)
BHC CharacteristicsLog (asset size) -0.058*** -0.059*** -0.387*** -0.388*** 0.106 -0.100
(0.019) (0.019) (0.117) (0.120) (0.963) (0.953)
Risk-weighted assets divided by total assets -0.071 -0.065 0.001 0.020 7.146* 7.438*(0.101) (0.101) (0.746) (0.747) (3.858) (3.801)
Common equity divided by total assets -0.011** -0.011** -0.088*** -0.089*** 0.098 0.093(0.005) (0.005) (0.032) (0.033) (0.198) (0.194)
Trading assets divided by total assets -0.580** -0.583** -1.734 -1.751 15.129 14.293(0.242) (0.244) (1.166) (1.164) (11.727) (11.593)
Noninterest income divided by operating income -0.039 -0.036 0.277 0.288 5.982** 5.675**(0.099) (0.100) (0.804) (0.809) (2.293) (2.286)
Revenue source concentration 0.115 0.105 0.271 0.212 14.589** 14.315**(0.153) (0.152) (0.976) (0.970) (6.432) (6.567)
Year fixed effects Yes Yes Yes Yes Yes YesBHC fixed effects Yes Yes Yes Yes Yes Yes
Number of observations 293 293 293 293 295 295
R-squared 0.783 0.784 0.318 0.318 0.191 0.199
P-Value: Disclosure Variables = 0? 0.000 0.000 0.003 0.003 0.002 0.001
P-Value: Intense = Other Large? 0.048 0.018 0.159 0.119 0.606 0.913
Sources: Federal Reserve Board, Consolidated Financial Statements of Bank Holding Companies (FR Y-9C data); Center for Research in Security Prices (CRSP); Securities and Exchange Commission EDGAR database; company websites.
Notes: Risk-adjusted market return is the annual average of weekly equity price returns divided by the standard deviation of those returns. Alpha is the intercept term from a three-factor market return model using Fama-French factors. Risk-adjusted trading return is annual trading revenue divided by the annual standard deviation of quarterly trading revenue. BHC characteristics are from the Federal Reserve Y-9C reports. Disclosure information is from the BHCs’ annual reports. Stock data are from CRSP. Disclosure leader is a dummy variable indicating that a BHC is the only BHC to disclose a particular data item in a given year. Aggregate disclosure index is the market risk disclosure index. First principal component is based on the eighteen individual data items that comprise the aggregate index. The sample consists of all U.S.-owned BHCs that have trading assets greater than $1 billion (in 2013 dollars) at any time between 1994 and 2012, starting with the year that trading assets exceed $500 million. Intense traders are those with trading account assets greater than 10 percent of total assets and greater than $20 billion in 2013 dollars, while other large traders are the remainder of the sample. The regressions include BHC fixed effects and year dummy variables. Residuals are clustered at the BHC level.
* Significant at the 10 percent level.
** Significant at the 5 percent level.
*** Significant at the 1 percent level.

166 Public Disclosure and Risk-Adjusted Performance
0.40 to 0.65 standard deviation increase in risk-adjusted returns for intense traders but just a 0.20 to 0.45 standard deviation increase for other large trading BHCs. Further, the impact of being a disclosure leader is evident only for the intense traders: These BHCs have higher risk-adjusted trading returns, whereas there is no significant impact from being a disclosure leader among the other larger traders. Thus, the impact of disclosure on risk-adjusted returns is much stronger for those firms with a concentration in trading activity.
Robustness One potential criticism of these findings is that the disclosure variables may be capturing unobserved characteristics of the BHCs’ trading portfolios. For instance, information on VaR by risk type is clearly more relevant for BHCs with trading positions that span multiple risk factors (such as interest rates, exchange rates, equity prices, or commodities) than for those with simple portfolios. Multi-risk-factor portfolios that span riskier or less widely held risk exposures, such as commodities, could have different risk-return characteristics than portfolios composed of positions exposed primarily to interest rates, which are held in nearly all trading portfolios. Alternatively, BHCs that report more information about stress testing may do so because they hold portfolios with “tail risk” that would not necessarily be realized in annual risk-adjusted returns (that is, risk-adjusted returns could be overstated because “tail risk” is not captured) but for which stress testing is an important risk management tool. It could be, therefore, that the disclosure variables are capturing differences in underlying risk and return across BHCs rather than the impact of differential disclosure practices.
We performed a series of robustness checks to assess this concern. First, the specification includes BHC fixed effects, so any differences in risk-adjusted returns across BHCs that are related to permanent differences in disclosure should be absorbed by those controls. As a further check, we repeated the regressions including additional variables to control for the composition of BHCs’ trading activity. In particular, BHC regulatory reports contain information on trading revenues derived from different types of risk factors, such as interest rates, exchange rates, equity prices, and commodity prices. Nearly all of the BHCs in the sample (91 percent) report trading revenue from interest rate and foreign exchange positions, but fewer report revenue from equity- or commodity-based positions (64 percent and 48 percent, respectively). We re-estimated the regression including dummy variables to capture the impact of these less common trading risk factors. Regulatory reports also
include information on the different types of securities held in the trading account, and we estimated a second alternative specification with variables that captured the composition of trading positions based on these data.17 Since this information is available only beginning in 1995, we excluded observations from 1994 from these estimates.
As a final test, we used a measure of the trading portfolio risk: the BHC’s market risk capital requirement (scaled by trading account assets). As detailed above, minimum regulatory capital requirements for market risk are based on BHCs’ internal VaR estimates. In that sense, they are related to the information disclosed in public financial statements about market risk exposure. Unfortunately, market risk capital data are available only beginning in 1998, when the market risk capital requirements were first imposed, and even in the years since then, some BHCs in our sample were not subject to the requirements in every sample year.18 Overall, the sample size is reduced by about a third when the market risk capital requirement is included as a control variable.
Results of the estimates including these three sets of additional control variables are reported in Tables 9A, 9B, and 9C, respectively. Including the additional control variables does not change the basic results. There continues to be a positive relationship between disclosure and risk-adjusted returns, though, as before, this relationship is stronger for the market-based measures than it is for accounting-based trading returns. The coefficients on the additional control variables are jointly statistically significant in most of the specifications, especially for the market-based return measures. The most consistent result is that higher market risk exposure, as measured by the ratio of market risk capital to trading assets, is associated with lower risk-adjusted returns (see Table 9C). The variables controlling for trading risk factors (commodity- and equity-based revenue) tend to have the least explanatory power, though the results suggest that equity-based revenue is associated with higher risk-adjusted market returns (but lower risk-adjusted trading returns).
17 The specification included variables reflecting the share of trading account assets composed of U.S. Treasury and agency securities, state and local government securities, mortgage-backed securities, other debt securities, trading positions held in foreign offices, revaluation gains on derivatives positions, and other trading account assets. 18 Only banks and bank holding companies with trading account assets exceeding $1 billion or 10 percent of total assets are subject to the market risk capital requirement. In addition, supervisors have the option to exempt a bank or BHC that would otherwise be subject to the requirements if its trading risk is shown to be minimal, or to require a bank or BHC to be subject to the requirements if it has significant trading risk, even if it is below the numerical thresholds (Hendricks and Hirtle 1997).

FRBNY Economic Policy Review / August 2016 167
Risk-Adjusted Performance and Market Discipline
The finding that increased disclosure is associated with higher future risk-adjusted performance suggests that BHCs that disclose more information face a better risk-return trade-off. This finding is consistent with a broad interpretation of market discipline. Much discussion of market discipline has focused on the idea that market participants are concerned primarily about risk, so that enhanced disclosure serves mainly to discipline bank managers in terms of risk taking. However,
it is reasonable to assume that investors, creditors, and other stakeholders might also be concerned with efficient risk taking and the relationship between risk and return. In this broader interpretation, enhanced disclosure facilitates market discipline not merely by affecting risk but by making risk taking and trading activities more efficient and productive.
A related point is that the link between greater disclosure and better performance may not necessarily stem from the impact of market discipline as traditionally defined. Specifically, the same risk management systems that produce
Table 9, Panel a Robustness Check—Control for Trading Risk Factors
Disclosure Variables Risk-Adjusted Market Return Alpha Risk-Adjusted Trading Return
Disclosure leader -0.060** -0.059* -0.194* -0.190 1.982** 2.038**(0.029) (0.030) (0.112) (0.114) (0.988) (0.957)
Aggregate disclosure index 0.010*** 0.042*** 0.363**(0.003) (0.014) (0.155)
First principal component 0.018*** 0.076*** 0.720**(0.004) (0.025) (0.307)
Additional Control VariablesRisk Factor Dummy Variables
Equity-based revenue 0.039** 0.041** 0.146 0.155 -1.323* -1.250*(0.018) (0.017) (0.144) (0.143) (0.731) (0.714)
Commodity-based revenue -0.018 -0.017 -0.013 -0.009 -0.397 -0.398(0.023) (0.023) (0.128) (0.129) (0.686) (0.694)
BHC CharacteristicsLog (asset size) -0.065*** -0.067*** -0.405*** -0.413*** -0.096 -0.250
(0.016) (0.017) (0.108) (0.112) (0.769) (0.752)
Risk-weighted assets divided by total assets -0.133 -0.122 -0.226 -0.178 8.450** 8.879**(0.098) (0.098) (0.702) (0.701) (3.672) (3.696)
Common equity divided by total assets -0.010* -0.010* -0.083** -0.082** 0.028 0.030(0.005) (0.005) (0.031) (0.032) (0.205) (0.202)
Trading assets divided by total assets -0.633*** -0.638*** -1.956 -1.971 15.779 15.613(0.235) (0.237) (1.191) (1.192) (11.595) (11.582)
Noninterest income divided by operating income -0.073 -0.074 0.114 0.109 6.330*** 6.271***(0.091) (0.091) (0.765) (0.765) (2.096) (2.082)
Revenue source concentration 0.088 0.086 0.162 0.145 14.181** 14.193**(0.148) (0.147) (0.915) (0.909) (6.472) (6.579)
Year fixed effects Yes Yes Yes Yes Yes YesBHC fixed effects Yes Yes Yes Yes Yes Yes
Number of observations 293 293 293 293 295 295
R-squared 0.786 0.787 0.319 0.319 0.192 0.201
P-Value: Disclosure Variables = 0? 0.000 0.000 0.001 0.001 0.014 0.013

Table 9, panel bRobustness Check—Control for Trading Portfolio Composition
Disclosure Variables Risk-Adjusted Market Return Alpha Risk-Adjusted Trading Return
Disclosure leader -0.052 -0.051 -0.173 -0.169 1.318 1.320(0.031) (0.032) (0.114) (0.117) (1.010) (0.968)
Aggregate disclosure index 0.009*** 0.048*** 0.283
(0.003) (0.015) (0.175)
First principal component 0.016*** 0.086*** 0.611*(0.005) (0.028) (0.353)
Additional Control VariablesTrading Portfolio Asset Shares
Treasury and agency securities 0.083 0.082 0.253 0.246 -0.178 -0.263(0.059) (0.059) (0.319) (0.318) (2.528) (2.458)
State and local government securities 0.160* 0.159* 0.769 0.766 -3.250 -3.564(0.087) (0.088) (0.622) (0.628) (3.131) (3.204)
Mortgage-backed securities 0.129*** 0.127*** 0.465* 0.457* -1.750 -1.834(0.036) (0.038) (0.259) (0.268) (2.479) (2.376)
Other debt securities 0.081 0.085 0.995 1.017 -4.866 -4.643(0.079) (0.079) (0.926) (0.930) (3.011) (2.988)
Derivatives revaluation gains 0.050* 0.050* 0.066 0.064 -0.429 -0.492(0.027) (0.027) (0.150) (0.149) (1.258) (1.253)
BHC CharacteristicsLog (asset size) -0.070*** -0.071*** -0.469*** -0.476*** 0.278 0.119
(0.017) (0.017) (0.111) (0.116) (1.013) (0.985)
Risk-weighted assets divided by total assets -0.075 -0.064 0.036 0.091 6.622 6.987*(0.096) (0.095) (0.687) (0.686) (4.097) (4.099)
Common equity divided by total assets -0.012** -0.012** -0.102** -0.102** 0.113 0.110(0.005) (0.005) (0.040) (0.040) (0.246) (0.242)
Trading assets divided by total assets -0.534** -0.543** -2.407* -2.451* 18.258 17.550(0.254) (0.254) (1.236) (1.225) (13.203) (13.146)
Noninterest income divided by operating income -0.044 -0.045 0.344 0.339 4.651* 4.608*(0.078) (0.078) (0.688) (0.690) (2.481) (2.499)
Revenue source concentration 0.066 0.062 0.393 0.368 9.344 9.559(0.140) (0.139) (0.968) (0.967) (6.364) (6.505)
Year fixed effects Yes Yes Yes Yes Yes YesBHC fixed effects Yes Yes Yes Yes Yes Yes
Number of observations 280 280 280 280 282 282
R-squared 0.777 0.777 0.340 0.340 0.174 0.182
P-Value: Disclosure Variables = 0? 0.001 0.000 0.001 0.002 0.123 0.101
168 Public Disclosure and Risk-Adjusted Performance

FRBNY Economic Policy Review / August 2016 169
Table 9, panel cRobustness Check—Control for Market Risk Exposure
Disclosure Variables Risk-Adjusted Market Return Alpha Risk-Adjusted Trading Return
Disclosure leader -0.109*** -0.104*** -0.390*** -0.350*** 0.602 0.675(0.024) (0.026) (0.132) (0.125) (1.584) (1.473)
Aggregate disclosure index 0.010** 0.072*** 0.297(0.004) (0.020) (0.197)
First principal component 0.018** 0.122*** 0.578(0.007) (0.035) (0.393)
Additional Control VariablesMarket Risk Exposure
Market risk capital divided by trading assets -0.085** -0.080** -0.468** -0.434** -2.554 -2.435(0.035) (0.035) (0.195) (0.197) (1.647) (1.569)
BHC CharacteristicsLog (asset size) -0.082*** -0.082*** -0.629*** -0.623*** -0.206 -0.262
(0.029) (0.030) (0.164) (0.169) (1.082) (1.061)
Risk-weighted assets divided by total assets 0.015 0.025 0.849 0.916 8.971** 9.337**(0.099) (0.101) (0.709) (0.720) (3.912) (3.883)
Common equity divided by total assets -0.009* -0.009* -0.104*** -0.103*** 0.112 0.110(0.005) (0.005) (0.034) (0.035) (0.263) (0.259)
Trading assets divided by total assets -0.799** -0.795** -3.038* -3.004* 11.608 11.449(0.336) (0.337) (1.712) (1.715) (17.558) (17.517)
Noninterest income divided by operating income -0.108 -0.106 0.084 0.096 4.455** 4.523**(0.101) (0.101) (0.791) (0.795) (1.847) (1.888)
Revenue source concentration 0.020 0.010 0.871 0.793 18.829** 18.905**(0.186) (0.186) (1.213) (1.217) (7.155) (7.264)
Year fixed effects Yes Yes Yes Yes Yes YesBHC fixed effects Yes Yes Yes Yes Yes Yes
Number of observations 198 198 198 198 199 199
R-squared 0.779 0.779 0.332 0.329 0.216 0.220
P-Value: Disclosure Variables = 0? 0.000 0.000 0.000 0.000 0.175 0.168
Sources: Federal Reserve Board, Consolidated Financial Statements of Bank Holding Companies (FR Y-9C data); Center for Research in Security Prices (CRSP); Securities and Exchange Commission EDGAR database; company websites.
Notes: Risk-adjusted market return is the annual average of weekly equity price returns divided by the standard deviation of those returns. Alpha is the intercept term from a three-factor market return model using Fama-French factors. Risk-adjusted trading return is annual trading revenue divided by the annual standard deviation of quarterly trading revenue. BHC characteristics are from the Federal Reserve Y-9C reports. Disclosure information is from the BHCs’ annual reports. Stock data are from CRSP. Disclosure leader is a dummy variable indicating that a BHC is the only BHC to disclose a particular data item in a given year. Aggregate disclosure index is the market risk disclosure index. First principal component is based on the eighteen individual data items that comprise the aggregate index. The sample consists of all U.S.-owned BHCs that have trading assets greater than $1 billion (in 2013 dollars) at any time between 1994 and 2012, starting with the year that trading assets exceed $500 million. The regressions include BHC fixed effects and year dummy variables. Residuals are clustered at the BHC level.
* Significant at the 10 percent level.
** Significant at the 5 percent level.
*** Significant at the 1 percent level.
170 Public Disclosure and Risk-Adjusted Performance
better risk-adjusted performance may also generate the information needed to make more detailed risk disclosures, which may be used by the bank as a public signal of its superior risk management abilities. Fang (2012) finds evidence broadly consistent with this hypothesis, as he documents a contemporaneous correlation between enhanced value-at-risk disclosure and corporate governance characteristics. In this view, enhanced disclosure is a by-product of better performance, rather than a cause. That said, enhanced disclosure nonetheless provides market participants with important information about the bank that could influence investor actions, which seems consistent with a broad view of market discipline.
One last interesting finding concerns bank holding companies that are “first movers” in disclosure, in the sense of being the first to disclose a particular type of information. These firms appear to have lower future risk-adjusted market returns, but higher risk-adjusted trading returns. This finding suggests that there may be learning costs for investors in assessing and putting into context new types of information about risk. To the extent that this is the case, policymakers advocating new and innovative disclosures should also consider the role that the public sector could play in educating investors and market analysts about these new disclosures. This outreach could reduce any negative market reaction to unfamiliar information and thus better align the incentives of firms and policymakers about enhanced disclosure.
5. Summary and Conclusion
Disclosure plays an important role in market discipline because market participants need to have meaningful information on which to base their judgments of risk
and performance. Disclosure is particularly important in the banking industry, given that outsiders generally view banks as being opaque. As a result, banking supervisors and other public sector officials have encouraged banking companies to engage in enhanced disclosure, particularly of forward-looking estimates of risk. This article aims to assess whether these kinds of disclosures provide useful information to market participants that can help foster market discipline.
In particular, the article examines disclosures related to market risk in trading and market-making activities. The key variable is an index of market risk disclosure that captures the amount of market risk information banking companies disclose in their annual reports. The index is constructed for a sample of BHCs with significant trading activities over the years 1994 to 2012. The article estimates the extent to which this disclosure affects future risk-adjusted returns on trading activities and returns for the BHC overall, as proxied by the firm’s equity price behavior.
The main findings are that increases in disclosure are associated with higher risk-adjusted returns, both for trading activities and for the firm overall. These results are economically meaningful as well as statistically significant. The findings are robust to alternative specifications that include additional controls for the composition of the BHCs’ trading portfolios and the sources of trading revenue, and are stronger for BHCs whose trading activity represents a larger share of firmwide activity. The results are not driven by the 2007-09 financial crisis and, in fact, the relationship between disclosure and risk-adjusted performance appears to be significantly weaker during the crisis period. Overall, the results suggest that as disclosure increases, BHCs experience an improved risk-return trade-off.

FRBNY Economic Policy Review / August 2016 171
References
Acharya, V. V., D. Anginer, and A. J. Warburton. 2014. “The End of Market Discipline? Investor Expectations of Implicit Government Guarantees.” Available at http://ssrn.com/abstract=1961656 or http://dx.doi.org/10.2139/ssrn.1961656.
Balasubramnian, B., and K. B. Cyree. 2011. “Market Discipline of Banks: Why Are Yield Spreads on Bank-Issued Subordinated Notes and Debentures Not Sensitive to Bank Risks?” Journal of Banking and Finance 35, no. 1 (January): 21-35.
Barth, M. E., Y. Konchitchki, and W. R. Landsman. 2013. “Cost of Capital and Earnings Transparency.” Journal of Accounting and Economics 55, nos. 2-3 (April-May): 206-24.
Basel Committee on Banking Supervision. 2004. “International Convergence of Capital Measurement and Capital Standards: A Revised Framework.” Bank for International Settlements.
———. 2015. “Standards: Revised Pillar 3 Disclosure Requirements.” Bank for International Settlements. Available at http://www.bis .org/bcbs/publ/d309.pdf.
Baumann, U., and E. Nier. 2004. “Disclosure, Volatility, and Transparency: An Empirical Investigation into the Value of Bank Disclosure.” Federal Reserve Bank of New York Economic Policy Review 10, no. 2 (September): 31-45.
Berkowitz, J., and J. O’Brien. 2002. “How Accurate Are Value-at-Risk Models at Commercial Banks?” Journal of Finance 57, no. 3 (June): 1093-111.
Bliss, R. R., and M. J. Flannery. 2002. “Market Discipline in the Governance of U.S. Bank Holding Companies: Monitoring vs. Influencing.” European Finance Review 6, no. 3: 361-95.
Bushee, B. J., and C. P. Noe. 2000. “Corporate Disclosure Practices, Institutional Investors, and Stock Return Volatility.” Journal of Accounting Research 38, Supplement: 171-202.
Bushman, R. M., and C. D. Williams. 2012. “Accounting Discretion, Loan Loss Provisioning, and Discipline of Banks’ Risk-Taking.” Journal of Accounting and Economics 54, no. 1 (August): 1-18.
Covitz, D. M., D. Hancock, and M. L. Kwast. 2004a. “A Reconsideration of the Risk Sensitivity of U.S. Banking Organization Subordinated Debt Spreads: A Sample Selection Approach.” Federal Reserve Bank of New York Economic Policy Review 10, no. 2 (September): 73-92.
———. 2004b. “Market Discipline in Banking Reconsidered: The Roles of Funding Manager Decisions and Deposit Insurance Reform.” Board of Governors of the Federal Reserve System Finance and Economics Discussion Series, no. 2004-53, August.
Cumming, C. M., and B. J. Hirtle. 2001. “The Challenges of Risk Management in Diversified Financial Companies.” Federal Reserve Bank of New York Economic Policy Review 7, no. 1 (March): 1-17.
Ellul, A., and V. Yerramilli. 2013. “Stronger Risk Controls, Lower Risks: Evidence from U.S. Bank Holding Companies.” Journal of Finance 68, no. 5 (October): 1757-803.
Eugster, F., and A. F. Wagner. 2011, revised 2015. “When and How Is Voluntary Disclosure Quality Reflected in Equity Prices?” Swiss Finance Institute Research Paper Series, no. 11-25.
Fang, X. 2012. “Informativeness of Value-at-Risk Disclosure in the Banking Industry.” Unpublished paper. Available at http://ssrn.com/abstract=1982936.
Flannery, M. J. 2001. “The Faces of ‘Market Discipline.’” Journal of Financial Services Research 20, no. 2-3 (October): 107-19.
Flannery, M. J., S. H. Kwan, and M. Nimalendran. 2004. “Market Evidence on the Opaqueness of Banking Firms’ Assets.” Journal of Financial Economics 71, no. 3 (March): 419-60.
Goyal, V. K. 2005. “Market Discipline of Bank Risk: Evidence from Subordinated Debt Contracts.” Journal of Financial Intermediation 14, no. 3 (July): 318-50.
Hendricks, D., and B. Hirtle. 1997. “Bank Capital Requirements for Market Risk: The Internal Models Approach.” Federal Reserve Bank of New York Economic Policy Review 3, no. 4 (December): 1-12.

172 Public Disclosure and Risk-Adjusted Performance
References (Continued)
Hirtle, B. 2003. “What Market Risk Capital Reporting Tells Us About Bank Risk.” Federal Reserve Bank of New York Economic Policy Review 9, no. 3 (September): 37-54.
———. 2006. “Stock Market Reaction to Financial Statement Certification by Bank Holding Company CEOs.” Journal of Money, Credit, and Banking 38, no. 5 (August): 1263-91.
———. 2007, revised 2015. “Public Disclosure, Risk, and Performance at Bank Holding Companies.” Federal Reserve Bank of New York Staff Reports, no. 293.
Iannotta, G. 2006. “Testing for Opaqueness in the European Banking Industry: Evidence from Bond Rating Spreads.” Journal of Financial Services Research 30, no. 3 (December): 287-309.
Jagtiani, J., G. Kaufman, and C. Lemieux. 2002. “The Effect of Credit Risk on Bank and Bank Holding Company Bond Yields: Evidence from the Post-FDICIA Period.” Journal of Financial Research 25, no. 4 (December): 559-75.
Jorion, P. 2002. “How Informative Are Value-at-Risk Disclosures?” Accounting Review 77, no. 4 (October): 911-31.
———. 2006. Value at Risk: The New Benchmark for Managing Financial Risk. Third Edition. New York: McGraw-Hill.
Kwan, S. 2004. “Testing the Strong-Form of Market Discipline: The Effects of Public Market Signals on Bank Risk.” Federal Reserve Bank of San Francisco Working Paper, no. 2004-19, May.
Leuz, C., and R. E. Verrecchia. 2000. “The Economic Consequences of Increased Disclosure.” Journal of Accounting Research 38 (Supplement): 91-124.
Linsmeier, T. J., D. B. Thornton, M. Venkatachalam, and M. Welker. 2002. “The Effect of Mandated Market Risk Disclosures on Trading Volume Sensitivity to Interest Rate, Exchange Rate, and Commodity Price Movements.” The Accounting Review 77, no. 2 (April): 343-77.
Liu, C., S. G. Ryan, and H. Tan. 2004. “How Banks’ Value-at-Risk Disclosures Predict Their Total and Priced Risk: Effects of Bank Technical Sophistication and Learning over Time.” Review of Accounting Studies 9, no. 2 (June): 265-94.
Meyers, S. C., and R. G. Rajan. 1998. “The Paradox of Liquidity.” Quarterly Journal of Economics 113, no. 3 (August): 733-71.
Moody’s Investors Service. 2006. “Risk Disclosures of Banks and Securities Firms.” May 12.
Morgan, D. P. 2002. “Rating Banks: Risk and Uncertainty in an Opaque Industry.” American Economic Review 92, no. 4 (September): 874-88.
Morgan, D. P., and K. J. Stiroh. 2001. “Market Discipline of Banks: The Asset Test.” Journal of Financial Services Research 20, no. 2-3 (October): 195-208.
Multidisciplinary Working Group on Enhanced Disclosure. 2001. “Final Report to the Basel Committee on Banking Supervision, Committee on the Global Financial System of the G-10 Central Banks, International Association of Insurance Supervisors, and International Organization of Securities Commissions.” Bank for International Settlements.
Nier, E., and U. Baumann. 2006. “Market Discipline, Disclosure, and Moral Hazard in Banking.” Journal of Financial Intermediation 15, no. 3 (July): 332-61.
Pérignon, C., and D. R. Smith. 2010. “The Level and Quality of Value-at-Risk Disclosure by Commercial Banks.” Journal of Banking and Finance 34, no. 2 (February): 362-77.
Roulstone, D. T. 1999. “Effect of SEC Financial Reporting Release No. 48 on Derivative and Market Risk Disclosures.” Accounting Horizons 13, no. 4 (December): 343-63.
Santos, J. 2014. “Evidence from the Bond Market on Banks’ ‘Too-Big-to-Fail’ Subsidy.” Federal Reserve Bank of New York Economic Policy Review 20, no. 2 (December): 29-39.
Stiroh, K. 2006. “New Evidence on the Determinants of Bank-Specific Risk.” Journal of Financial Services Research 30, no. 3 (December): 237-63.

FRBNY Economic Policy Review / August 2016 173
References (Continued)
U.S. Securities and Exchange Commission. 1997. “Disclosure of Accounting Policies for Derivatives Financial Instruments and Derivatives Commodity Instruments and Disclosure of Quantitative and Qualitative Information about Market Risk Inherent in Derivative Financial Instruments, Other Financial Instruments, and Derivative Commodity Instruments.” Financial Report Release no. 48. January 31. http://www.sec .gov/rules/final/33-7386.txt
Zer, I. 2013, revised 2015. “Disclosure Practices and Option-Implied Probability of Default.” Unpublished paper. Available at http://ssrn.com/abstract=2335717 or http://dx.doi.org/10.2139/ ssrn.2335717.
The views expressed are those of the author and do not necessarily reflect the position of the Federal Reserve Bank of New York or the Federal Reserve System. The Federal Reserve Bank of New York provides no warranty, express or implied, as to the accuracy, timeliness, completeness, merchantability, or fitness for any particular purpose of any information contained in documents produced and provided by the Federal Reserve Bank of New York in any form or manner whatsoever.

FRBNY Economic Policy Review / August 2016 175
The articles in this volume analyze the role of corporate culture and governance in the banking industry. The
authors take a variety of approaches to the topic, summa-rizing and synthesizing the literature, providing case studies to illustrate key issues, and developing a framework for understanding the importance of culture and governance to risk management and financial stability. Numerous questions remain, however. Many are asked in the articles themselves, while additional areas of inquiry are detailed below.
A prerequisite to establishing an effective culture and proper governance in financial firms is the ability to identify and explain weaknesses in the structure and behavior of organizations. To conduct such an assessment, a two-pronged approach is essential. Purely data-driven analysis can help us distinguish between competing causal models, but qualitative analysis can stretch the boundary of possible explanations. Therefore, instead of limiting research to the analysis of large data sets, I advocate qualitative research that would explore the relative importance of the right outcome versus the right process—whether knowing what is done (the outcome) is ultimately as important as understanding how and why it is done (the process). If we don’t understand the process, there can be no learning, which hinders our ability to avoid future crises. Further, I recommend research into directors’ under-standing of governance in relation to their own role, as well as the ways in which their understanding evolved as a result of their unique experiences at the helm of institutions during the crisis. Still, like quantitative analysis, qualitative research tells only half the story; it can shed light on the unknown—illu-minating what we didn’t know we didn’t know—but it cannot test hypotheses. Therefore, it is important to draw upon the strengths of both approaches for a complementary combina-tion of exploration and analysis.
Governance Questions
1. How can more detailed governance proxies and the inclusion of private banks in our research add to our knowledge of governance and our ability as regulators to spot dysfunctional firms?
2. How are board and governance structures differ-ent for public and private banks?
3. How do governance structures differ across legal categories of incorporation (for example, S- and C-corporations or mutual holding companies)?
4. How well do proxies for S- and C-corporations predict failure? Do they have more or less explan-atory power over time? And across institutions?
5. What drives changes in governance structure over time? What are the implications of these changes for the performance and risk appe-tites of firms?
6. How closely do regulators’ assumptions about the role of directors track with what is actually reported by directors?
7. According to the law, the boards of banking firms are shareholders’ first line of defense. Is this expectation realistic, particularly for financial firms? How can board oversight be improved?
8. An important channel in governance is share-holder activism. Why is there so little activism in the banking industry? Is activism desirable even if it produces asset volatility and instability in management? If so, how might activism be encouraged?
Hamid Mehran
Appendix to the Volume: Questions for Further Research

176 Questions for Further Research
9. If activism is so weak, shouldn’t the punishments for abuse be imposed on management rather than on the firm (stockholders)? If so, should we worry about the labor market for management?
10. Is there a role for creditor activism in the banking sector—for example, with the introduction of bail-in-able debt? Should creditor activism be encouraged?
11. It has been suggested that corporations focus on the short term in response to exogenous forces such as pressure by institutional investors. How should banks respond to these kinds of external demands as their governance is shaped by market forces (as well as supervisory guidelines)?
12. Some observers argue that banks should focus on long-term value rather than short-term returns. What is long-term value in the banking context given the maturity terms of bank assets and liabilities?
13. If long-term objectives and value can be defined, then what employee compensation structure could support those objectives?
Survey of Directors
Input from individuals who were directors of banks during the crisis could add insights. Without asking these questions of directors themselves, we cannot identify problems in motivation or reasoning. However, by conducting surveys of directors, we would be able to ask questions that are strictly unanswerable with current data, such as:
1. How much heterogeneity is there in risk appetite among directors and firms?
2. How do directors think about managing risk, and where do they believe the biggest problems lie?
3. In the period before the crisis, did the firm take risks that in hindsight were unmanageable but that had previously been calculated, reported, and approved by the board? If so, what incorrect assumptions were made about the character of the risk? If not, where was the breakdown in the gover-nance structure that allowed the risk to be taken?
4. What could directors have done to avert distress or failure? What kept them from doing so at the time?
5. Given their experience during a time of distress, what would directors have done differently?
6. What recommendations do directors of firms that survived the crisis have for boards of financial institutions today?
Supervisory Questions
Regulators approach governance as a means of protecting the public from downside risk to institutions and catastrophic loss to the financial system as a whole. However, it remains unclear how directors of different institutions conduct their internal risk/return analysis. From the regulatory vantage point—from outside the firm—if we observe ex post that firms took on what was revealed to be excessive risk, it is difficult to know whether the governance structure of the firm was just not strong enough to withstand the pressure of a few risky indi-viduals, or whether that structure was carefully calibrated for the firm to take large gambles. I outline below a few questions for supervisory consideration.
1. When setting regulatory best practices and encouraging firms to improve governance, should regulators focus on outcomes or processes?
2. What kinds of governance processes are in place at the bank, and are they board- or CEO-directed?
3. How can governance processes reveal the state of governance within a firm? How do supervisors decide that bank governance is ineffective?
4. How could supervisory interaction with the board identify potential problems and types of weaknesses in board oversight? What questions need to be raised by supervisors in order to achieve this result?
5. How do we determine where the disconnect lies between final outcomes that are considered “good” and processes that are not?
6. What board procedures should regulators encourage to make firms better governed?
7. How would regulators like directors to perceive their interaction with the board, and how would regulators like directors to weigh various consid-erations as they make particular decisions?

FRBNY Economic Policy Review / August 2016 177
Culture Questions
1. Is culture different in the financial services indus-try? Is there a higher incidence of abuse, fraud, and inadequate risk management in financial firms than in firms in other industries?
2. If so, what are the contributing factors? Asset structure? Asset opacity? Labor market issues and self-selection? Reward structure? Others?
3. In light of the effect of abuse on financial stability, should banks and banking firm employees face a more severe punishment (monetary, legal, or both) for abuse than nonfinancial institutions and their employees?
4. Can a higher level of disclosure and transpar-ency improve culture? Should we promote this increased transparency, even though the decision to increase transparency is one that would be dif-ficult for banks to unmake in the future without repercussions?
5. How can regulators improve the flow of informa-tion within banking firms—from management to the board, for example?
6. How can we induce a culture of cooperation with regulators, such as the sharing of information in real time?
7. How do we define a good culture and how do we know when we see it? What are the attributes of a good culture?
8. How can culture be changed? What would be the evidence of such a change?
9. Equilibrium between governance and culture at a firm is the outcome of market forces as well as regulatory forces. What should regulators do to improve bank cultures? How do we know when we are going too far?
10. Is culture priced?
11. What evidence exists regarding the influence of the law, supervisory recommendations, and regulatory guidelines on culture?
12. How can we encourage a culture of partnership at banks when the different divisions that make up the bank act independently of one another, and division employees are loyal to their cohorts?
13. What is the “right” relationship between firms and their regulators?
14. What outcomes in a bank can be affected by culture?
15. Can human resource policies regarding the hiring, promotion, and firing of employees be used to influence culture?
16. Can management oversight and organizational elements change or improve culture?
17. Can oversight functions improve culture? What practices or approaches—by the risk or legal functions, for example—improve culture?

Federal Reserve Bank of New YorkEconomic Policy Review
Economic Policy Review articles may be reproduced for educational or training purposes, provided they are reprinted in full; include credit to the author(s), the publication, and the Bank; and include the publication’s disclaimer.
©2016 The Federal Reserve Bank of New York
Library of Congress Card Number: 77-646559
To sign up for alerts about new Federal Reserve Bank of New York publications, visit www.newyorkfed.org/research.
Follow us on Twitter: @NYFedResearch