Embed Size (px)
Citation preview

Behavioral Network Science
Networked LifeCIS 112
Spring 2009Prof. Michael Kearns

Background and Motivation
• Network Science: Structure, Dynamics and Behavior– sociology, economics, computer science, biology…– network universals and generative models– empirical studies: network is given, hard to explore alternatives
• Navigation and the Six Degrees– Travers & Milgram Watts, Kleinberg– distributed all-pairs shortest paths– what about other problems?
• Behavioral Economics and Game Theory– human rationality in the lab– typically subjects in pairs
Overview
• Human-subject experiments at the intersection of CS, economics, and network science• Subjects simultaneously participate in groups of ~ 36 people• Subjects sit at networked workstations• Each subject controls some simple property of a single vertex in some underlying network• Subjects have only* local views of the activity: state of their own and neighboring vertices• Subjects have (real) financial incentive to solve their “piece” of a collective (global) problem• Simple example: graph coloring
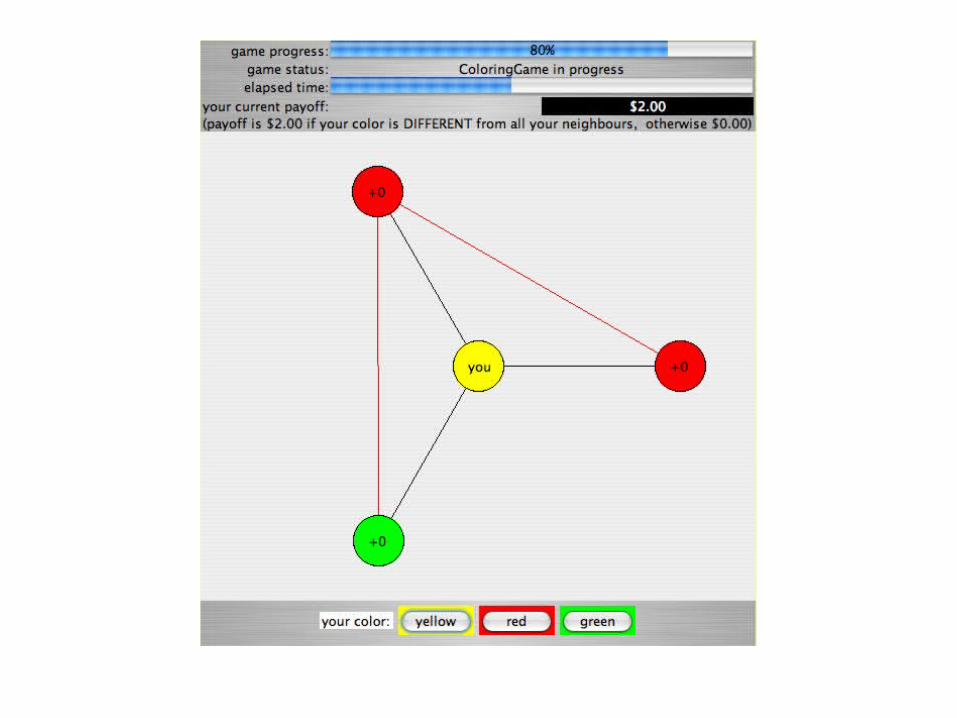
– choose a color for your vertex from fixed set– paid iff your color differs from all neighbors when time expires– max welfare solutions = optimal colorings
• Across many experiments, have deliberately varied network structure and problem/game– networks: inspired by models from network science (small worlds, preferential attachment, etc.)– problems: chosen for diversity (cooperative v. competitive) and (centralized) computational difficulty
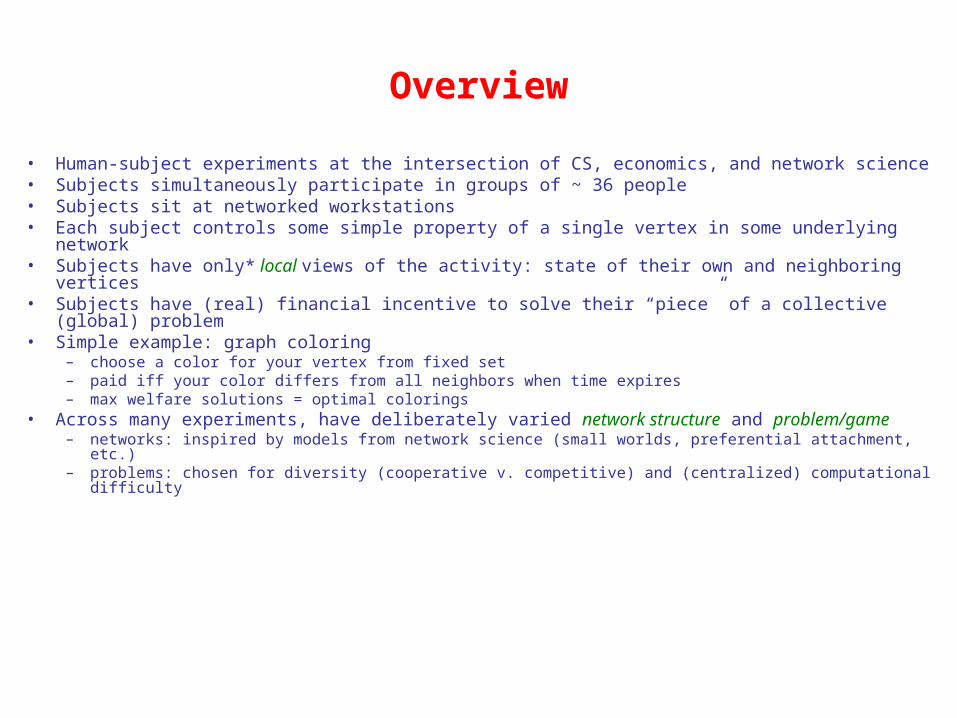
Experiments to Date• Graph Coloring (Jan 2006; Feb 2007)
– player controls: color of vertex; number of choices = chromatic number– payoffs: $2 if different color from all neighbors, else 0– max welfare states: optimal colorings– centralized computation: hard even if approximations are allowed
• Consensus (Feb 2007)– player controls: color of vertex from 9 choices– payoffs: $2 if same color as all neighbors, else 0– max welfare states: global consensus of color– centralized computation: trivial
• Independent Set (Mar 2007)– player controls: decision to be a “King” or a “Pawn”; variant with King side payments allowed– payoffs: $1/minute for Solo King; $0.50/minute for Pawn; 0 for Conflicted King; continuous accumulation– max welfare states: maximum independent sets– centralized computation: hard even if approximations are allowed
• Exchange Economy (Apr 2007)– player controls: limit orders offering to exchange goods– payoffs: proportional to the amount of the other good obtained– max welfare states: market clearing equilibrium– centralized computation: at the limit of tractability (LP used as a subroutine)
• Biased Voting (May 2008)– player controls: color of vertex, red or blue– payoffs: only paid if global consensus reached; competing incentives in population– max welfare states: all-red or all-blue– centralized computation: trivial
• March/April 2009…

Graph Coloring January 2006

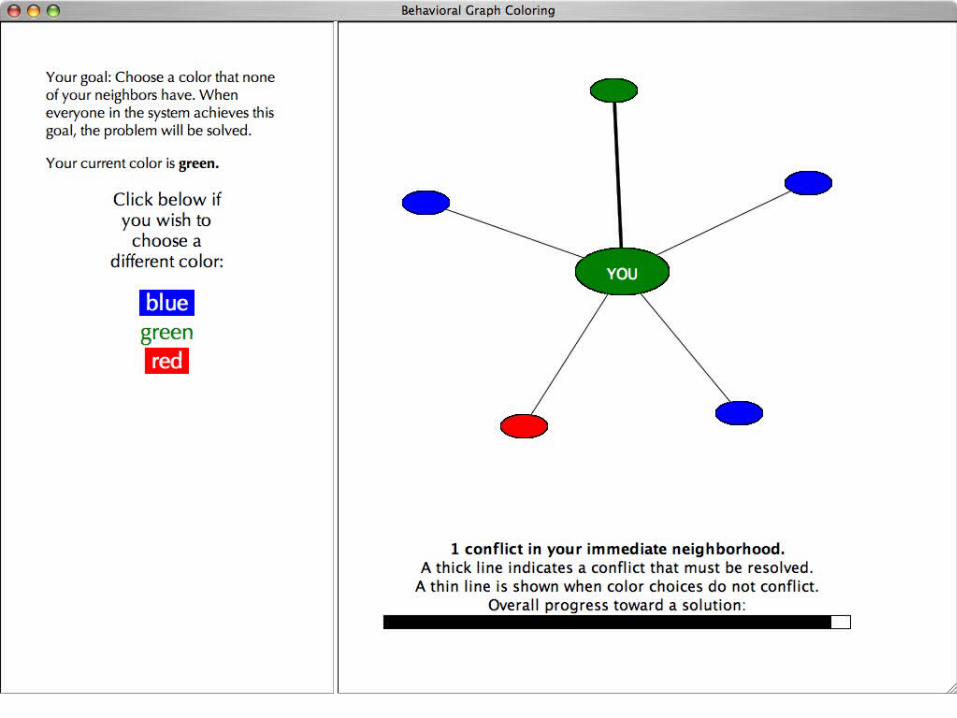
(Behavioral) Graph Coloring
• Undirected graph; imagine a person “playing” each vertex• Finite vocabulary of colors; each person picks a color• Goal: no pair connected by an edge have the same color• Computationally well-understood and challenging…
– no efficient centralized algorithm known (exponential scaling)
– strong evidence for computational intractability (NP-hard)
– even extremely weak approximations are just as hard
• …Yet simple and locally verifiable
solved not solved

The Experiments: Overview
• Designed and built a system for distributed graph coloring• Designed specific sequence of experiments• Obtained human subjects review (IRB) approval• Recruited human subjects (n = 38, two sessions)• Ran experiments!• Analyzed findings

Experimental Design Variables
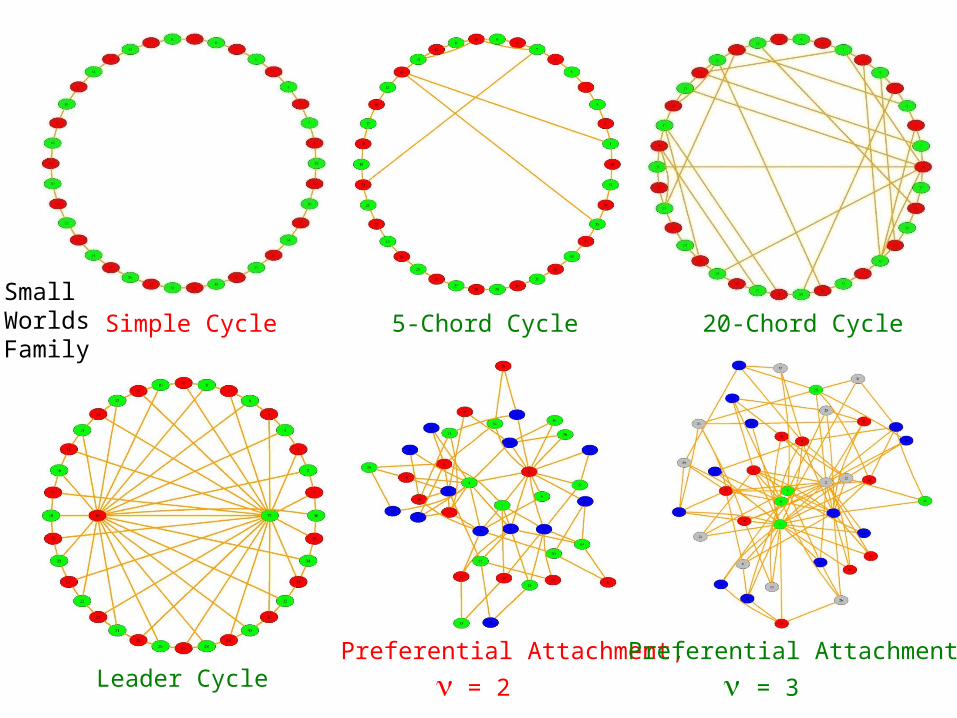
• Network Structure– six different topologies – inspired by recent generative models
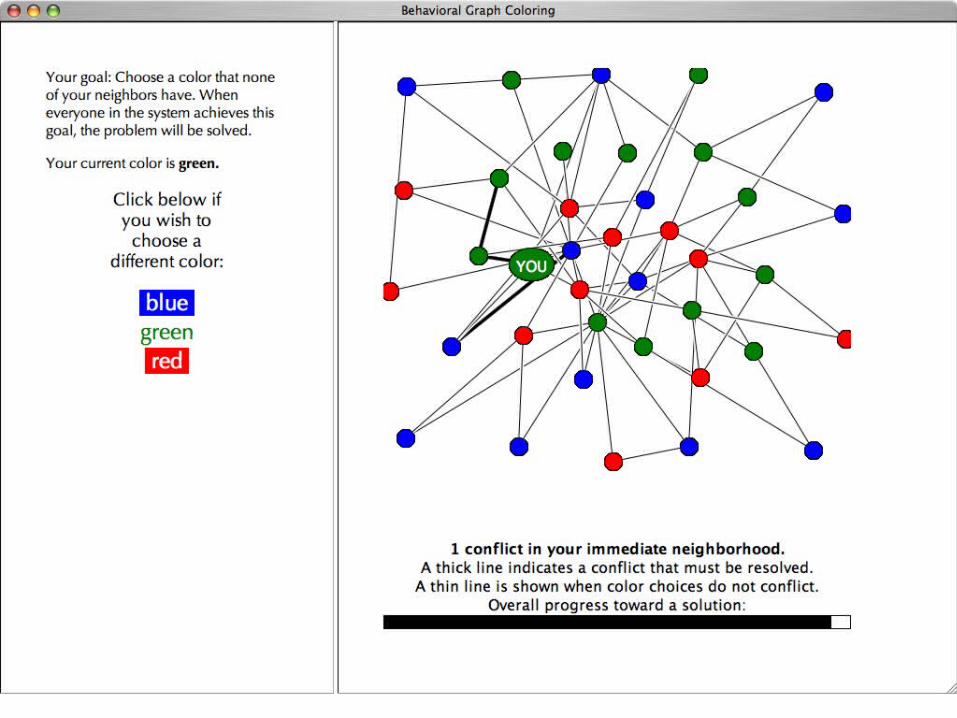
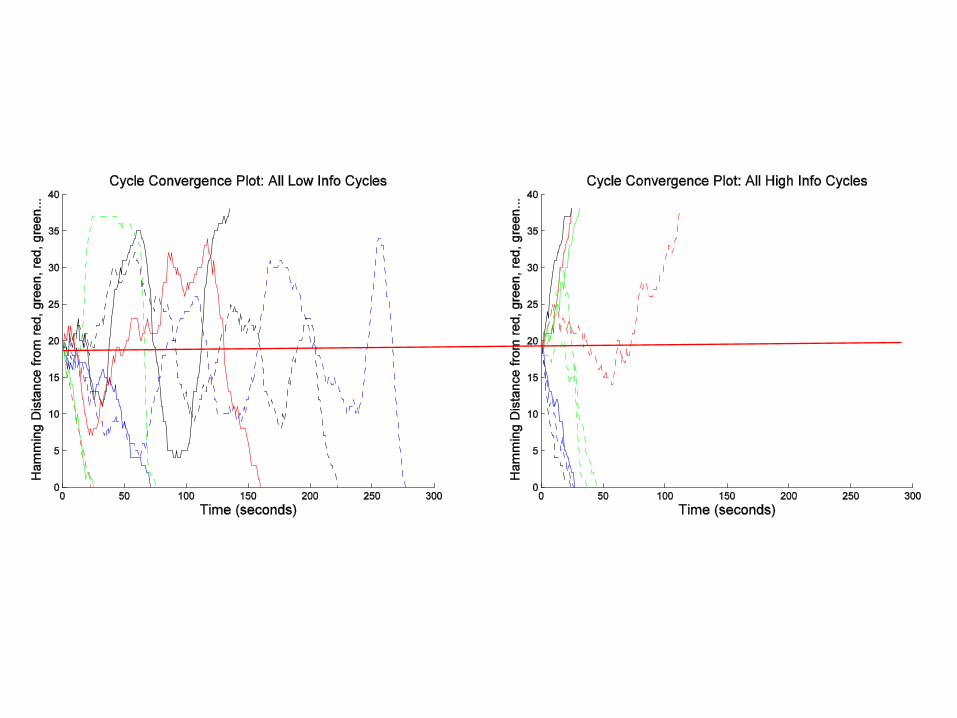
• Information View– three different views
• Incentive Scheme– two different mechanisms
• Design space: 6 x 3 x 2 = 36 combinations• Ran all 36 of them (+2)

Research Questions
• Can large groups of people solve these problems at all?• What role does network structure play?
– information view, incentives?• What behavioral heuristics do individuals adopt?• Can we do collective modeling and prediction?
– some interesting machine learning challenges
Choices of Network Structure

SmallWorldsFamily
Simple Cycle 5-Chord Cycle 20-Chord Cycle
Leader CyclePreferential Attachment,
= 2
Preferential Attachment,
= 3

Choices of Information Views

Choices of Incentive Schemes
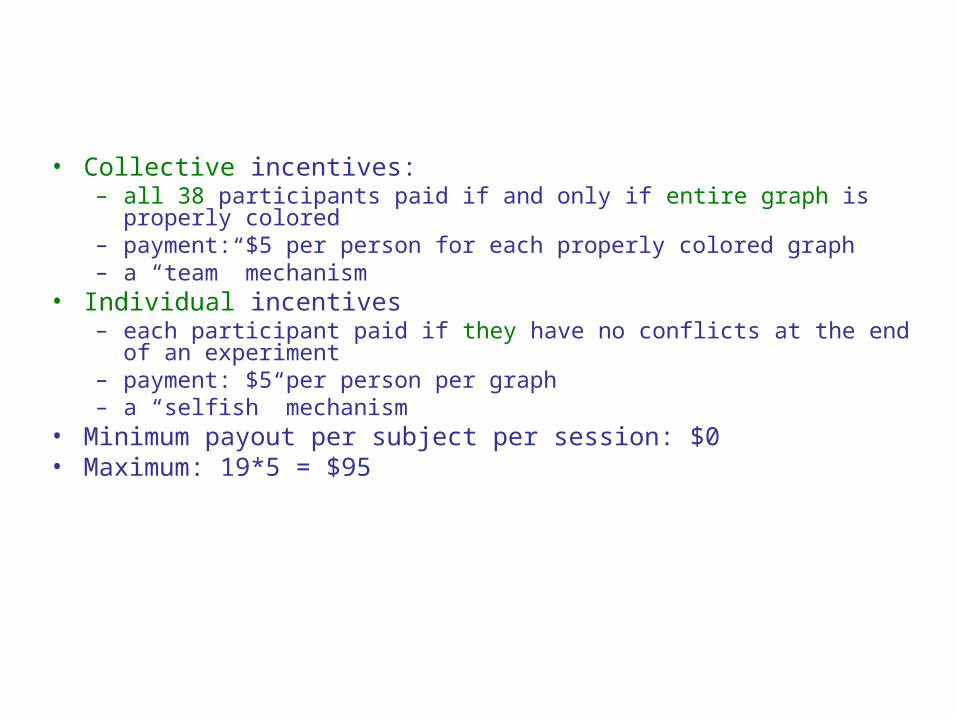
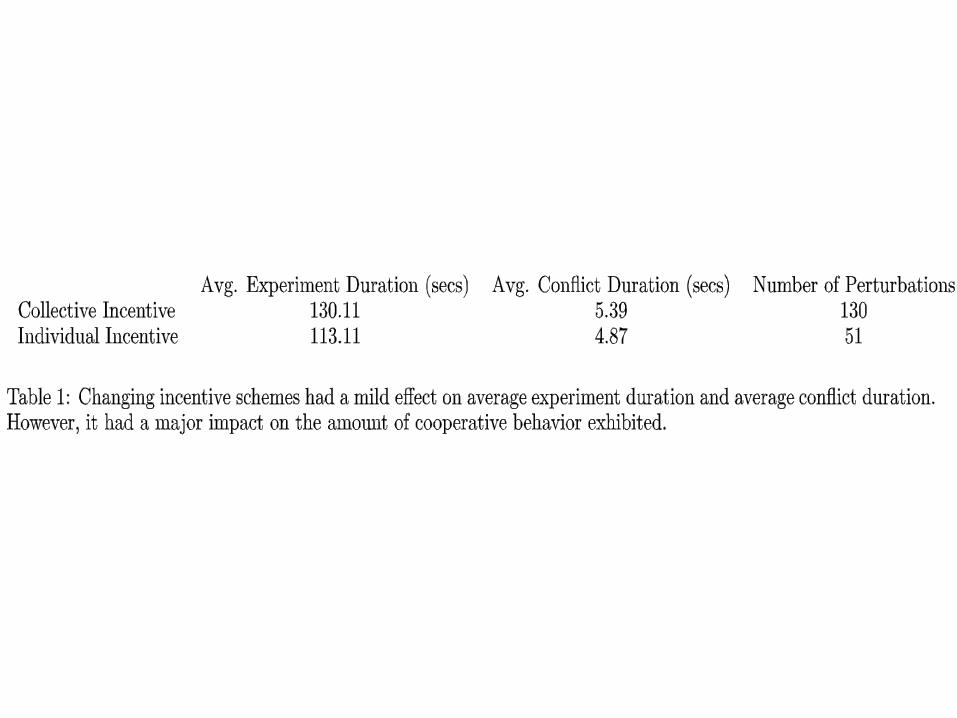
• Collective incentives:– all 38 participants paid if and only if entire graph is properly colored– payment: $5 per person for each properly colored graph– a “team” mechanism
• Individual incentives– each participant paid if they have no conflicts at the end of an experiment– payment: $5 per person per graph– a “selfish” mechanism
• Minimum payout per subject per session: $0• Maximum: 19*5 = $95

The Experiments: Some Details
• 5 minute (300 second) time limit for each experiment• Population demographics: Penn CSE 112 students• Handout and intro lecture to establish understanding• Intro and exit surveys• No communication allowed except through system• Experiments performed Jan 24 & 25, 2006
– Spring 2005: CSE 112 paper & pencil face-to-face experiments– Sep 2005: system launch, first controlled experiments
• Jan 24 session: collective incentives; Jan 25 session: individual incentives• Randomized order of 18 experiments within each session• First experiment repeated as last to give 19 total per session


The Results:Overview
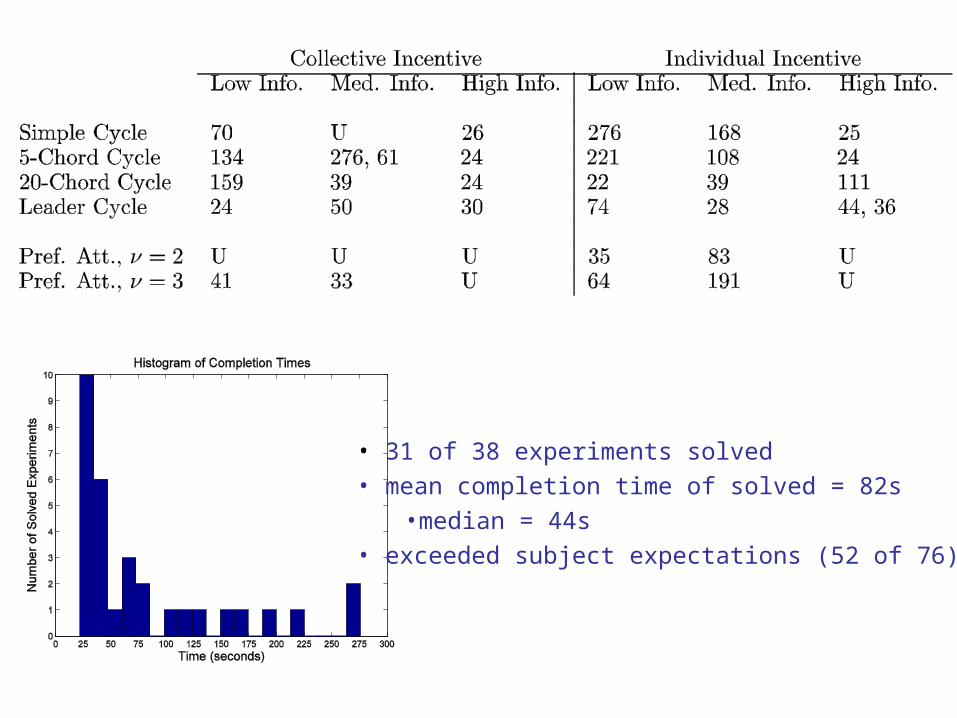
• 31 of 38 experiments solved
• mean completion time of solved = 82s
•median = 44s
• exceeded subject expectations (52 of 76)
Effects of Network Structure

Colors required
Min. degree
Max. degree
Avg. degree
S.D. Avg. distance
Avg. duration & fraction solved
Distributed heuristic
Simple cycle
2 2 2 2 0 9.76 144.17 5/6 378
5-chord cycle
2 2 4 2.26 0.60 5.63 121.14 7/7 687
20-chord cycle
2 2 7 3.05 1.01 3.34 65.67 6/6 8265
Leader cycle
2 3 19 3.84 3.62 2.31 40.86 7/7 8797
Pref. att., newlinks=2
3 2 13 3.84 2.44 2.63 219.67 2/6 1744
Pref. att., newlinks=3
4 3 22 5.68 4.22 2.08 154.83 4/6 4703
• smaller diameter better performance• preferential attachment much harder than cycle-based• distributed heuristic gives reverse ordering
SmallWorldsFamily
Simple Cycle 5-Chord Cycle 20-Chord Cycle
Leader CyclePreferential Attachment,
= 2
Preferential Attachment,
= 3
Effects of Information View


Effects of Incentive Scheme
Towards Behavioral Modeling
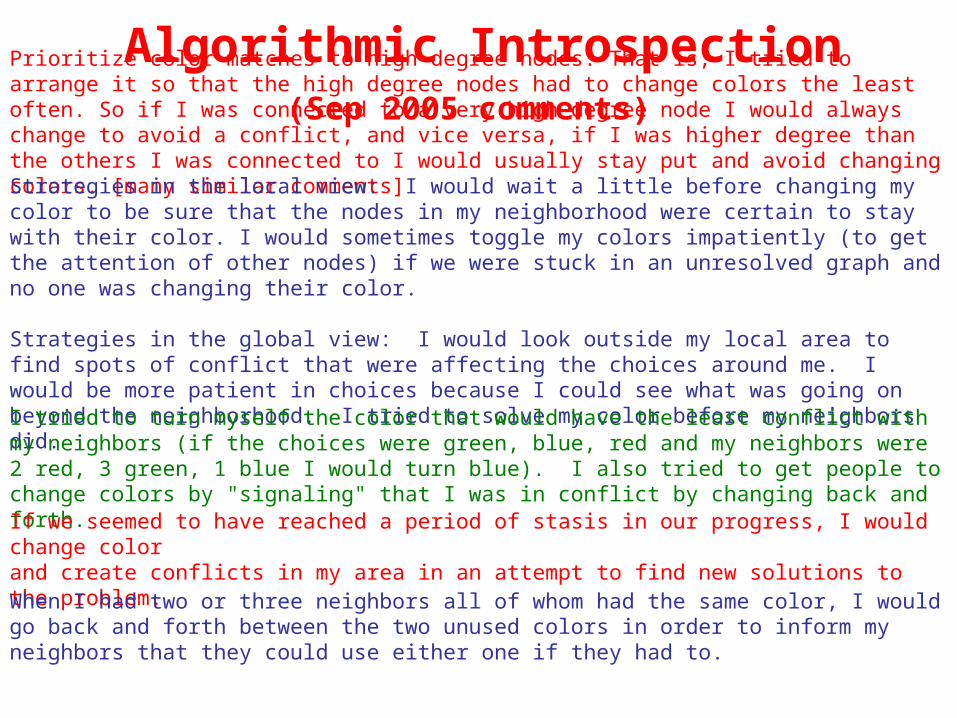
Prioritize color matches to high degree nodes. That is, I tried to arrange it so that the high degree nodes had to change colors the least often. So if I was connected to a very high degree node I would always change to avoid a conflict, and vice versa, if I was higher degree than the others I was connected to I would usually stay put and avoid changing colors. [many similar comments]
Strategies in the local view: I would wait a little before changing my color to be sure that the nodes in my neighborhood were certain to stay with their color. I would sometimes toggle my colors impatiently (to get the attention of other nodes) if we were stuck in an unresolved graph and no one was changing their color.
Strategies in the global view: I would look outside my local area to find spots of conflict that were affecting the choices around me. I would be more patient in choices because I could see what was going on beyond the neighborhood. I tried to solve my color before my neighbors did.
I tried to turn myself the color that would have the least conflict with my neighbors (if the choices were green, blue, red and my neighbors were 2 red, 3 green, 1 blue I would turn blue). I also tried to get people to change colors by "signaling" that I was in conflict by changing back and forth.
If we seemed to have reached a period of stasis in our progress, I would change colorand create conflicts in my area in an attempt to find new solutions to the problem.
When I had two or three neighbors all of whom had the same color, I would go back and forth between the two unused colors in order to inform my neighbors that they could use either one if they had to.
Algorithmic Introspection(Sep 2005 comments)
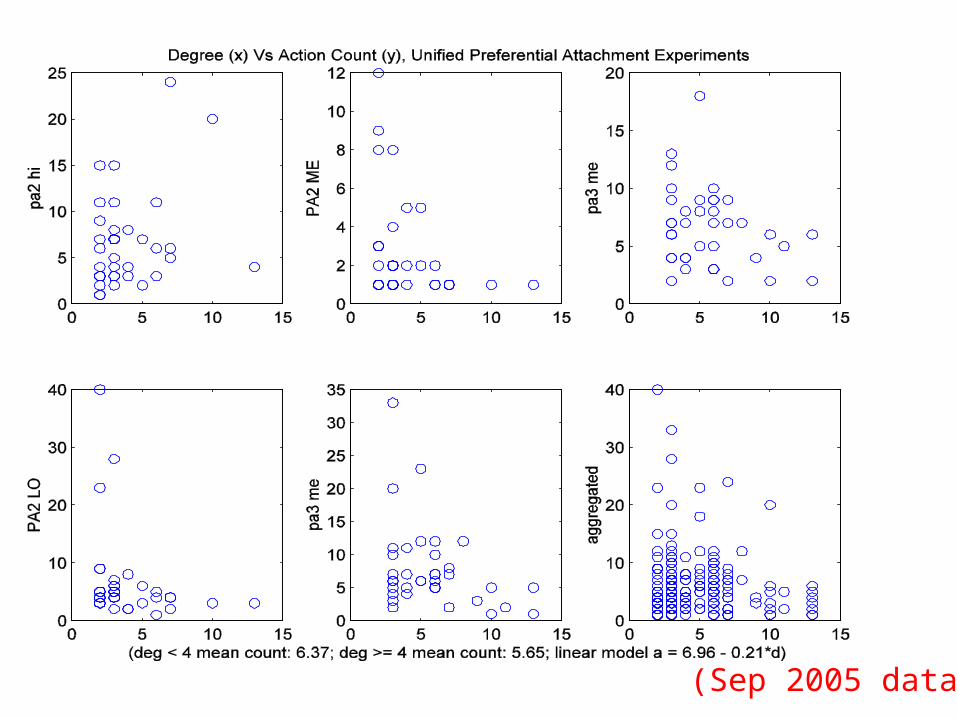
(Sep 2005 data)

signaling behaviors

Graph Coloring and Consensus February 2007

Network Formation Model• Single parameter p (a probability)• p=0: a chain of 6 cliques of size 6 each (see figure)• p>0: each intra-clique edge is “rewired” with probability p:
– first flip p-biased coin to decide whether to rewire– if rewiring, choose one of the endpoints to “keep” the edge– then choose new random destination vertex from entire graph
• Values of p used: 0, 0.1, 0.2, 0.4, 0.6 1.0• Three trials for each value of p; different random network for each trial• Move from “clan” topology to random graphs
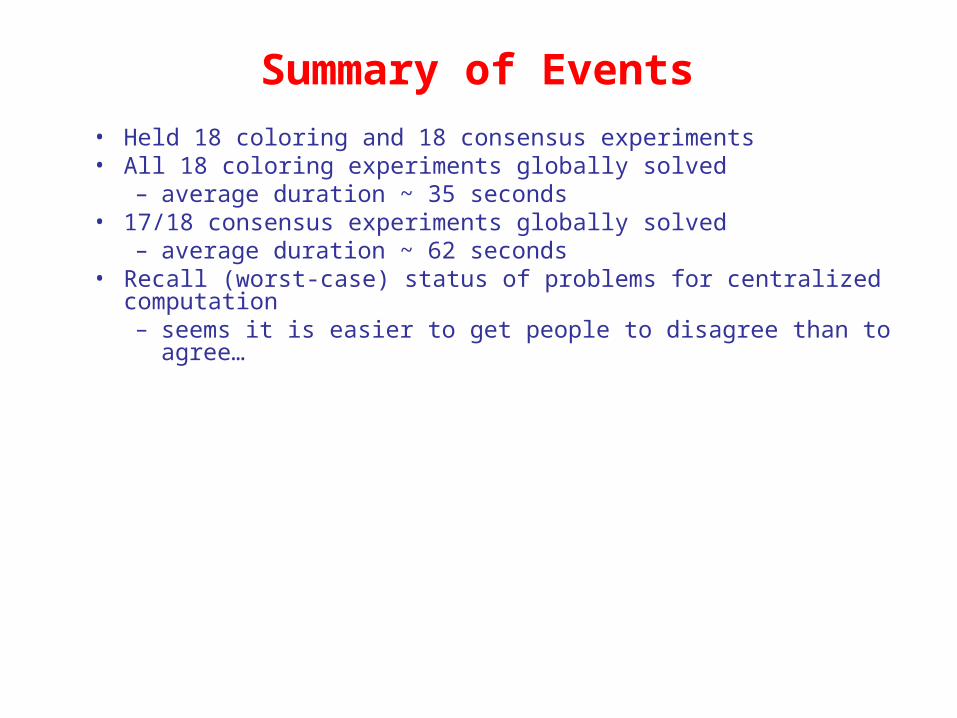
Summary of Events
• Held 18 coloring and 18 consensus experiments• All 18 coloring experiments globally solved
– average duration ~ 35 seconds• 17/18 consensus experiments globally solved
– average duration ~ 62 seconds• Recall (worst-case) status of problems for centralized computation
– seems it is easier to get people to disagree than to agree…

• large p: easier for consensus• large p: harder for coloring (cf. Jan 2006 experiments)• small-p vs large-p performance statistically significant
Influence of Structure
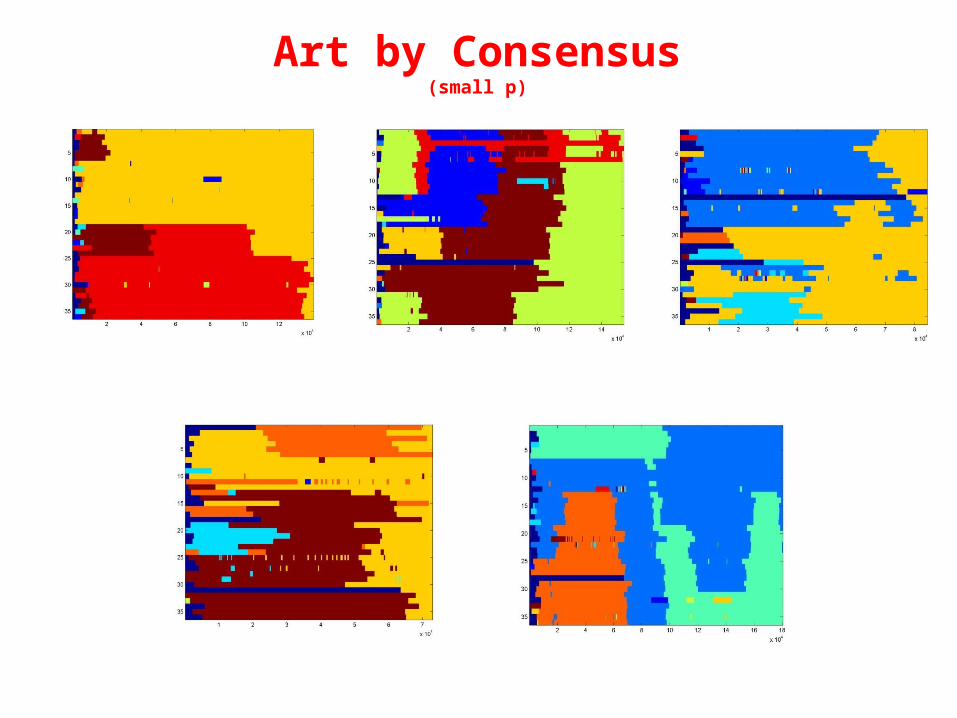
Art by Consensus(small p)
Independent Set (a.k.a. “Kings and Pawns”) March 2007

• without side payments • with side payments

Chain of 6-CliquesIsolated Pairs Rewired Chain P.A. Tree
Dense P.A. Erdos-Renyi Bipartite
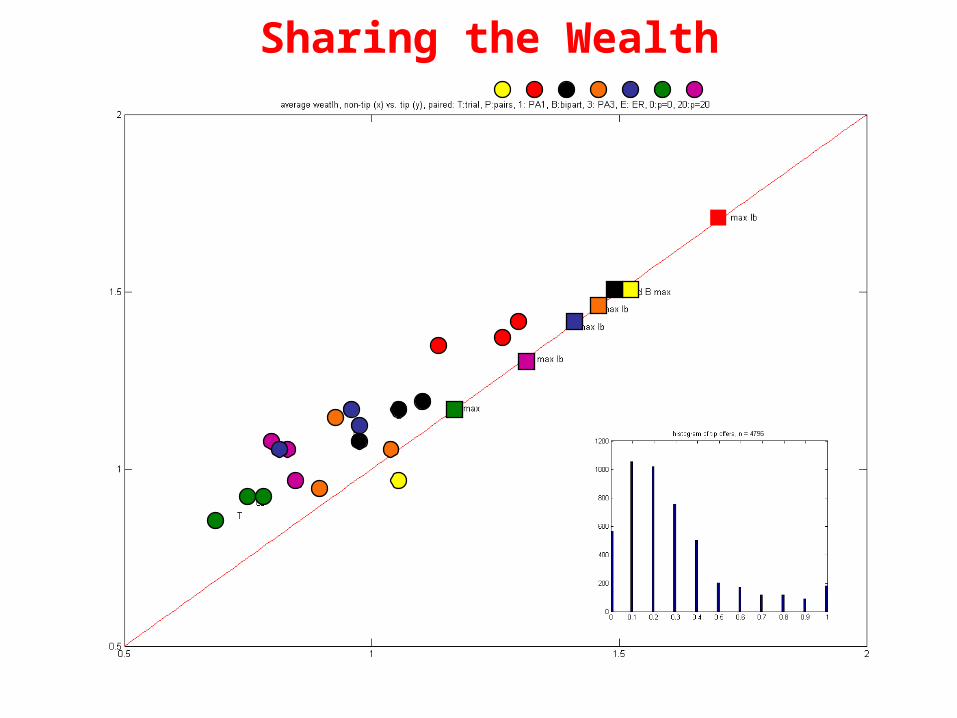
Sharing the Wealth

Biased Voting in Networks:The “Democratic Primary Game”
May 2008
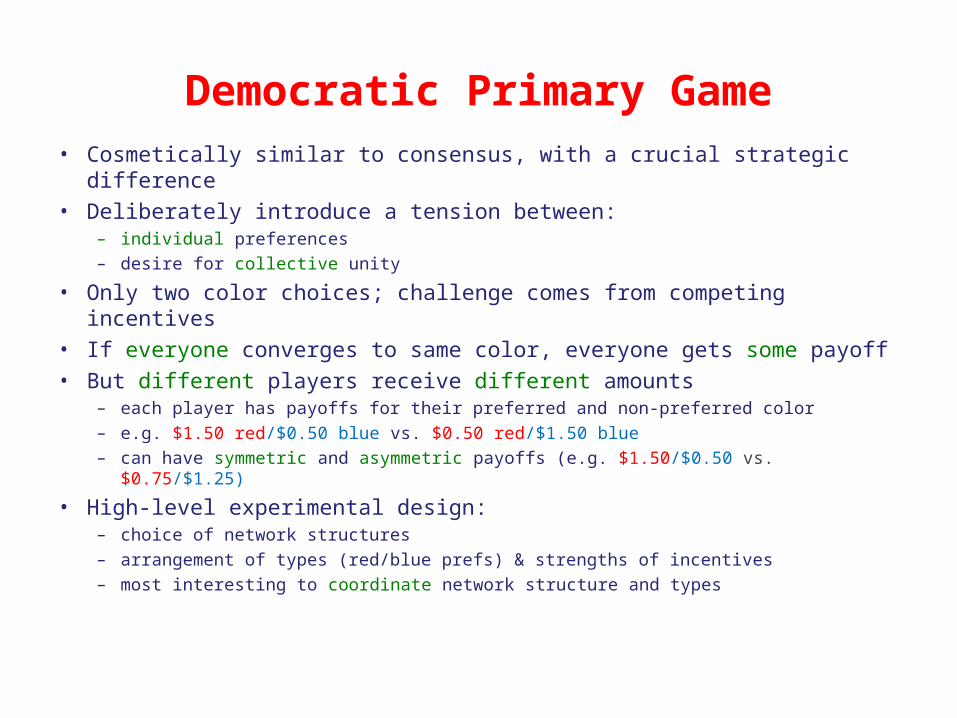
Democratic Primary Game
• Cosmetically similar to consensus, with a crucial strategic difference• Deliberately introduce a tension between:
– individual preferences– desire for collective unity
• Only two color choices; challenge comes from competing incentives• If everyone converges to same color, everyone gets some payoff• But different players receive different amounts
– each player has payoffs for their preferred and non-preferred color– e.g. $1.50 red/$0.50 blue vs. $0.50 red/$1.50 blue– can have symmetric and asymmetric payoffs (e.g. $1.50/$0.50 vs. $0.75/$1.25)
• High-level experimental design:– choice of network structures– arrangement of types (red/blue prefs) & strengths of incentives– most interesting to coordinate network structure and types


Cohesion: Erdos-Renyi Cohesion: Preferential Attachment Minority Power: Preferential Attachment
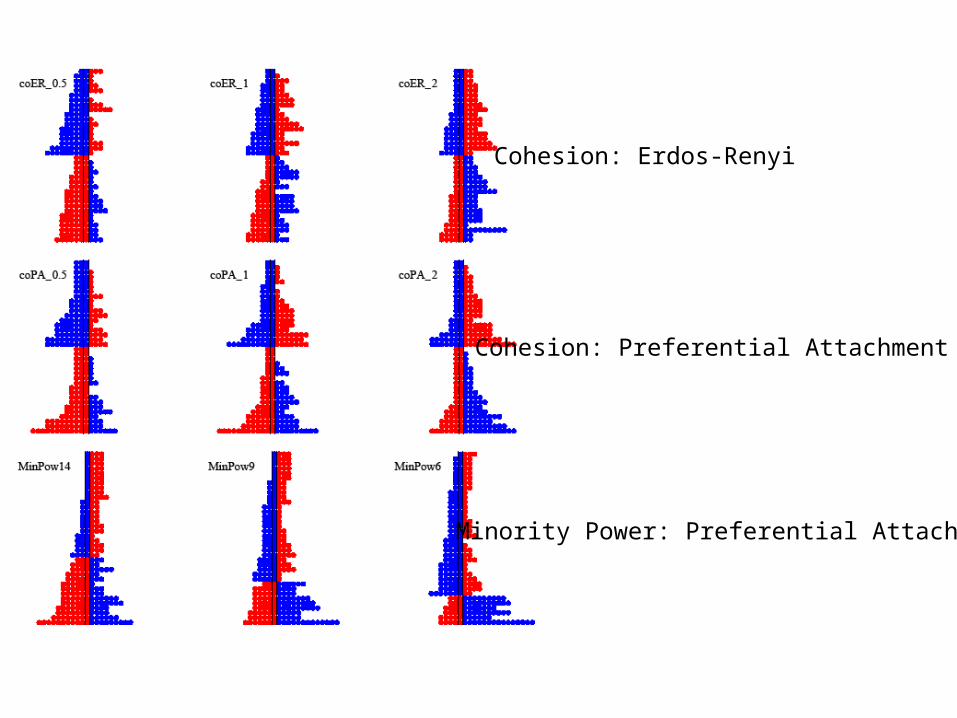
Cohesion: Erdos-Renyi
Cohesion: Preferential Attachment
Minority Power: Preferential Attachment

Summary of Findings
• 55/81 experiments reached global consensus in 1 minute allowed– mean of successful ~ 44s
• Effects of network structure:– Cohesion harder than Minority Power: 31/54 Cohesion, 24/27 Minority Power– all 24 successful Minority Powers converge to minority preference!– Cohesion P.A. (20/27) easier than Cohesion E-R (11/27)– overall, P.A. easier than E-R (contrast w/coloring)– within Cohesion, increased inter-group communication helps
• some notable exceptions…
• Effects of incentives:– asymmetric beats weak symmetric beats strong symmetric– the value of “extremists”
• Remarks on “obviousness” in hindsight

Cohesion: Erdos-Renyi
Cohesion: Preferential Attachment
Minority Power: Preferential Attachment

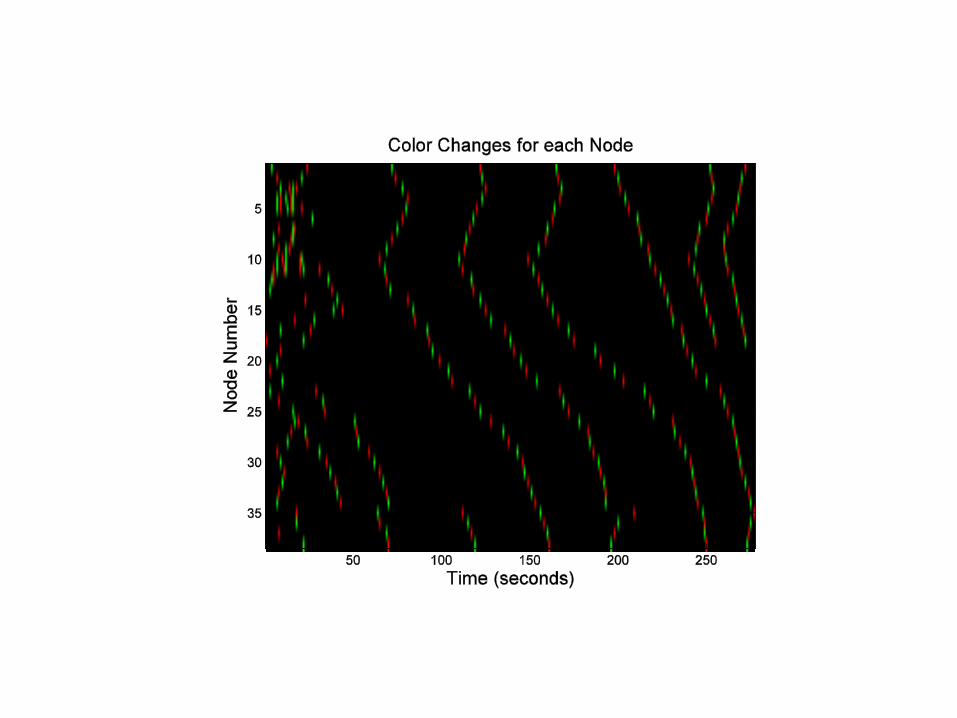
Summarizing the Dynamics

Effects of “Personality”va
lue
fraction < value
• no player infinitely stubborn: acquiesced 28 to 40 times of 55
• only 30 total instances of defying all neighbors as time expired in 26 failures
• social virtue of “tasteful” stubbornness
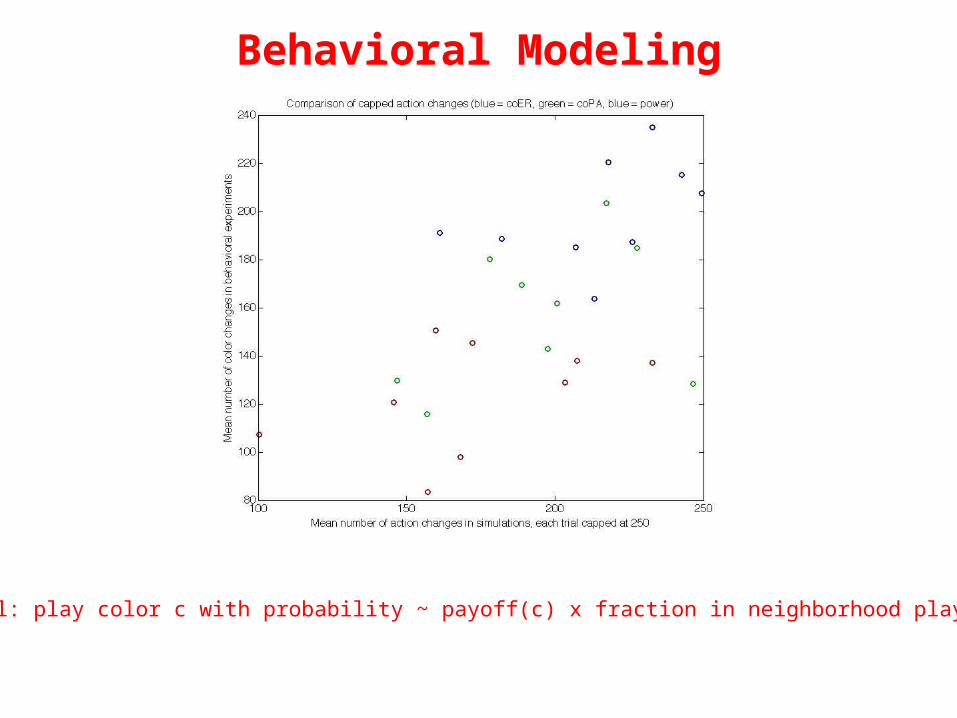
Behavioral Modeling
model: play color c with probability ~ payoff(c) x fraction in neighborhood playing c
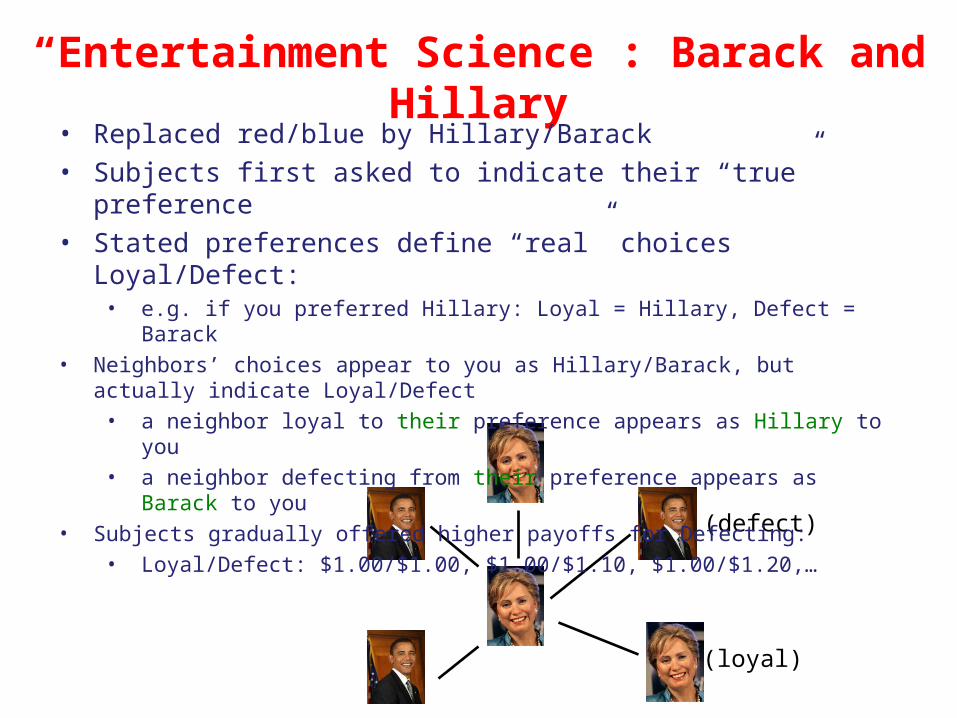
“Entertainment Science”: Barack and Hillary
(defect)
(loyal)
• Replaced red/blue by Hillary/Barack• Subjects first asked to indicate their “true” preference• Stated preferences define “real” choices Loyal/Defect:
• e.g. if you preferred Hillary: Loyal = Hillary, Defect = Barack• Neighbors’ choices appear to you as Hillary/Barack, but actually indicate Loyal/Defect
• a neighbor loyal to their preference appears as Hillary to you• a neighbor defecting from their preference appears as Barack to you
• Subjects gradually offered higher payoffs for Defecting:• Loyal/Defect: $1.00/$1.00, $1.00/$1.10, $1.00/$1.20,…

How Much Does A Vote Cost?
• blue: no choice; green: Loyal; crimson: Defect
• Loyal/Defect = 1/1: 2.7 seconds to Loyal
• Loyal/Defect = 1/1.10: no convergence
• Loyal/Defect = 1/1.20: 4.7 seconds to Defect
• Answer: 20 cents.