Embed Size (px)
Citation preview
Mapping Five Sites
1 of 47
Behavioral Mapping of Residentsrsquo Activity in Five Residential Style Care Centers for Elderly
Persons Diagnosed with Dementia Small Differences in Sites Can Affect Behaviors
Doris L Milke PhD1 Researcher CapitalCare Edmonton Area and Adjunct Associate Professor
Faculty of Rehabilitation Medicine Faculty of Nursing and Department of Psychology University
of Alberta Edmonton AB
Charles H M Beck PhD2 Professor Emeritus Department of Psychology University of Alberta
Edmonton AB
Stefani Danes RA AIA LEED AP Perkins Eastman Pittsburgh PA3
and
James Leask BA4 CapitalCare Edmonton Area Edmonton AB
Acknowledgements
The research was partially supported by an Alzheimer Care Research Grant awarded by a joint
committee of the University of Alberta Edmonton AB and CapitalCare Edmonton AB to D Milke
as principal investigator The researchers thank the staff of the five centers for their efforts and the
residents and families for their participation
1 Senior Researcher CapitalCare Edmonton Area 9113-144 Ave Edmonton AB Canada T5E 6K2 and Adjunct
Associate Professor Faculty of Rehabilitation Medicine Rehabilitation Research Centre 3-62 Corbett Hall University of
Alberta Edmonton AB T6G 2G4 dorismilkecapitalcarenet Tel 1-780-496-2579 Fax 1-780-472-6699 2 Department of Psychology University of Alberta Edmonton AB T6G 2E9 cbeckualbertaca Tel 1-780-437-2317
3 Perkins Eastman 1199 Liberty Ave Pittsburgh PA 15222 Danespeapccom
4 Research Associate CapitalCare Edmonton Area 9113-144 Ave Edmonton AB Canada T5E 6K2
jamesleaskcapitalcarenet Tel 1-780-496-2578 Fax 1-780-472-6699
Mapping Five Sites
2 of 47
Abstract
The principal purpose of the study was to investigate the daylong patterns of activity of
residents and staff in five similar care centres for persons with Alzheimerrsquos disease The Therapeutic
Environment Assessment Scale provided an architectural basis for assessing the significance of
activity data gathered through behavior mapping Slight architectural differences contributed to
effects that were large and enduring producing as much as a 50 differences between sites in the
portion of residents involved Taken together the results suggest that resident status use patterns
and architectural design details of a homelike residential setting have significant effects on the daily
activities of residents
Key words dementia physical environment long-term care residential care assisted living
TESS-2+ direct observation behavior mapping
Mapping Five Sites
3 of 47
Introduction
Residential care settings have become an accepted goal for many healthcare organizations
They satisfy the preferences of elderly clients for homelike surroundings in familiar residential
neighborhoods and help make long-term care centers function like a home rather than a hospital
(Imamoğlu 2007 Verbeek van Rossum Zwakhalen Kempen amp Hamers 2009) They have become
an integral part of the culture change movement as American healthcare seeks to improve residentsrsquo
quality of life The physical environment is one of the three core domains of culture change although
a recent survey shows that very few care centers have altered their physical environment to support
culture change (Doty Koren amp Sturla 2008) Thus the design of such residential centers is apt to
gain importance
Little is known however about the daylong patterns of activity of residents and staff in these
residential facilities and how the buildings shape them Some interest in such observation has been
shown recently (Calkins Meehan amp Lipstreuer 1999 Edelman Fulton Kuhn amp Chang 2005
Gold 1991 Kuhn Kasayka amp Lechner 2002 Margulis 2003 Mathew and Sloane 1991 Milke
2003 Milke Clark amp Bucknell 2000 Schwarz Chaudhury amp Tofle 2004 Sloane et al 2005
Zimmerman et al 2005) Earlier research established that residentsrsquo levels of activity are a concern
in nursing homes Gottesman and Bourestom (1974) observed activity in 40 nursing homes during
peak daylight hours finding residents were engaged in no or passive activity for 56 of the time
observed For 23 of the time they were involved in personal care with television and socializing
together consuming another 20 of their time Over all observations residents were in contact with
another person for only 17 of the time Ice reprised that study in 2002 by observing 27 nursing
home residents She also found residents spent 65 of their time doing little or nothing even though
Mapping Five Sites
4 of 47
the setting had a creative activities department Only 12 of time was spent in social activities (Ice
2002) Ice also gathered data on the activity level of healthy elders and found their time was spent
quite differently 17 in passive activities and 38 in socialexpressive activities Another study
with healthy elders found they spent 40 in passive activities and 28 in socialexpressive activities
(Harper 1998) These studies with healthy elders suggest that the inactive behavior observed in
nursing homes residents does not match the pattern of healthy elders
More critically it is not known what exactly about the design of a residential care center
makes it function like a home rather than a hospital With new designs of residential care settings
being presented regularly (eg wwwHDC08com httpwwwedraorg) an underlying assumption
appears to be that small variations in their architectural design will have little effect on resident and
staff activity This assumption and the dearth of literature with detailed information on the behavioral
patterns of use of residential-style facilities resulted in a lack of any explicit hypotheses as to what
we would find and prompted us to undertake the present descriptive study The principal purpose of
the study was to investigate the daylong patterns of activity of residents and staff in five similar
specially designed sites for the care of persons with Alzheimerrsquos disease The most salient difference
between the five sites was that two were designed with two 20-capacity housing units and three were
designed with three 12-capacity units Accordingly much of the data presentation is focused on that
feature The Therapeutic Environment Assessment Scale provided an architectural basis for assessing
the significance of activity data gathered through behavior mapping and provided a linkage with the
findings of studies using this as a standardized instrument We now present evidence that small
design differences can have large effects on resident patterns of room occupancy and on their
activities
Mapping Five Sites
5 of 47
Methods
Participants
The five residential care sites considered in the present study were designed for the care of
persons diagnosed with dementia and all were based on the pioneer site the well-investigated and
well-known architectural design of Woodside Place (WDS) in Oakmont PA (Deely Klingensmith
amp Silverman 1995 DiMotta Dubney Hoglund amp Kershner 1993 DiMotta amp Hoglund 2000
Hoglund amp Ledewitz 1999 McAllister amp Silverman 1999 Saxton Silverman Ricci Keane amp
Deely 1998 Silverman et al 1995) Of the four other sites two were located in Edmonton AB
McConnell Place North (MPN) and McConnell Place West (MPW) and one site in each of Cohoes
NY Marjorie Doyle Rockwell Place (MDR) and Mt Lebanon PA Asbury Place (ASB) Perkins
Eastman Architects designed three sites The WDS blueprints were purchased by CapitalCare to
build Canadian sites and the architectural firm of Cohos Evamy adapted them making adjustments to
accommodate the weather and site-specific land features in Edmonton AB The five sites can be
considered variations on a theme
Generic data on residents staff and volunteers were obtained from site administration
records A total of 184 elderly residents (35-40 per site) all but one of who had a primary diagnosis
of dementia were living in the facilities at the time of the study The average Mini-Mental State
Examination (MMSE) score (Folstein Folstein amp McHugh 1975) across sites was 132 + 15
(M+SE) and specific within site means were 122 ASB 153 MDR and MPN 161 MPW and 84
WDS On average the percent of males at the centres was 240 + 66 range 11-31 Discharge criteria
relating to mobility and sociability common across the sites included loss of mobility requiring
maximum assistance with activities of daily living unable to participate in activities unmanageable
incontinence and risk to self or others The total staff employed at the five sites (22-43 per site) was
197 The number of direct care staff that residents were likely to encounter (full-time and full-time
equivalents of part time care supervisors (LPNs) and caregivers) ranged from 19 to 28 across sites
Mapping Five Sites
6 of 47
for a mean of 234+28 The reported daytime ratio of residents to care staff was 51 at WDS and
MDR and 61 at MPN MPW and ASB This ratio continued most of the evening dropping at night
to 91 at WDS 121 at MPN and MPW and 131 at MDR and ASB
Procedures
Environmental Survey
The Therapeutic Environment Screening Scalendash2+ Revised was used to assess general design
features (subsequently referred to as TESS-2+) The scale is an observational checklist that is used to
describe the ability of the physical environment of a long-term care institutional setting to address the
therapeutic goals of nursing home and residential care residents with dementia (Lawton Weisman
Sloane amp Calkins 1997) A number of versions were in circulation The TESS-2+ was used in the
National Institute on Aging (NIA) (1993) special care unit collaborative studies Current formats are
for nursing homes (TESS-NH Sloane et al 2005
httppsychsocgerontologyjournalsorgcgicontentabstract572S69) and residential care settings
(TESS-NHRC
httpwwwuncedudeptstessnhpdf_filesTess20NHRC20Revised201_14_02pdf) The 37-
item TESS-2+ checklist consists of discrete items measuring a range of environmental domains such
as exit control maintenance and safety (listed in the first column of Table 2) as well as three global
evaluative ratings staff interaction resident involvement in activities and physical environmental
atmosphere Psychometric properties include interrater reliability for TESS-2+ items ranging from
67 to 100 agreement (Sloane et al 1998) The items on the TESS-2+ can be considered to point
out areas where a site meets best practice standards for dementia design The TESS-2+ data were
expected to provide an assessment of the physical differences in the five sites and thus a potentially
useful set of measures for understanding differences in the use of the five facilities
Mapping Five Sites
7 of 47
Data Collection and Analysis
We collected information on principal characteristics relating to physical features staff
volunteers residents and care programming retrospectively from site records of April and May of
1998 The assessment of physical features included a review of floor plans and records of
maintenance requests On-site observation was done to complete the TESS-2+ The interrater
reliability of TESS-2+ ratings was assured by prior tests of the agreement between observers
Although an observer typically uses the scale to assess a dementia unit in a nursing home in this
study the assessment was of the five small purpose-designed settings (the third author completed the
TESS for ASB MDR and WDS the first and second authors did MPN and MPW) During the NIA
studies the scale was used not only for special care units but also some entire sites (Sloane et al
2002) and Slaughter Calkins Eliasziw and Reimer (2006) found this version of the TESS useful to
distinguish between purpose-built dementia care facilities and traditional care facilities
The Special Care Unit Environmental Quality Scale (SCUEQS) was used to score the
TESS-2+ using a method previously described (Sloane et al 2002 Lawton et al 2000) The 18-item
SCUEQS subscale derived from the TESS-2+ was determined to be a robust measure of overall
environmental quality during the NIA studies Scores can range between 0 and 41 with 41 being a
better environment for persons with dementia Internal consistency of this scale was measured using
Cronbach coefficient alpha (α 5082) (Sloane et al 1998) In addition using a method developed by
Slaughter et al (2006) a composite score the Composite Above Average Quality Score (CAAQS)
was calculated using all items from the TESS-2+ A value of 1 was assigned if the rating for the
center was above the middle of the range for the item (ie midpoints are shown in column four of
Table 2) and if equal to or below the midpoint the assigned score was 0 For each cluster of centres
(the 20 capacity houses of ASB and MRD and the 12 capacity houses of MPN MPW and WDS) the
resulting binary scores representing each of the 14 domains in the TESS-2+ were summed and a
percentage of 14 was calculated to facilitate comparison with the data of Slaughter et al (2006) This
Mapping Five Sites
8 of 47
number represents the percentage of domains that were above average in quality for the site Group
means were then used to compare results on the SCUEQS and the CAAQS for the 20-capacity and
the 12-capacity sites
Behavior Mapping
The principal method of behavioral mapping used place-centered instantaneous scans which
provides systematic samples of behaviors This is one of the least intrusive methods for direct
observation (Lehrner 1979) During behavioral mapping the observer at set intervals quickly notes
the activity of people within an area and moves on to other areas These scans are much less invasive
than continuous observation and with momentary scans interobserver reliability is inherently better
Often observation is considered the gold standard for collecting behavioral data but there is a
concern that the presence of an observer influences the behavior (typically to more socially
acceptable behavior) During scans the observer quickly passes through the spaces of interest
allowing very little time for those present to adjust their activity
The data were collected by on-site staff familiar with facility routines following instructions
in a procedure manual written by the first author Thus the collection of data across sites followed a
standardized methodology including the use of common behavioral categories common floor-plan
notation preprinted checklist sheets trained paid observers and time-locked sampling Approval for
direct observation as described was obtained appropriate to each jurisdiction Observers learned
mutually exclusive and comprehensive definitions a standard procedure for ethogramatic checklists
for nine categories of behaviors On each of two days at each site they directly observed activities of
persons in public areas following a systematic protocol Every hour over 14 hours they toured public
spaces noting the subjectrsquos group (resident staff family others) and the type time and location of
the activity (Martin amp Bateson 1987 Sommer and Sommer 1986) Information was written upon
copies of site floor plans The identity of individuals was not recorded General activity categories
included just sitting (inactively) activities of daily living (ADLs eg self-care grooming washing
Mapping Five Sites
9 of 47
eating taking medications) light housekeeping leisure disruptive behavior walking watching and
miscellaneous behaviors Communication was indicated as an independent action because it could
occur concurrently with any of the activity categories
Information about activities at each of the five sites included a description and schedule of
daily and special occasion events for residents average attendance of residents at programmed events
of each type the procedures for intervening when problem behaviors arose definition of problem
behaviors and the average weekly incidence of problem behaviors (not presented) The interpretation
of data from Behavior Mapping benefited from this information
Sampling and Data Analysis
Behavioral mapping included all care staff volunteers family members residents and others
over a two-weekday period in early June at each site except at MDR where data collection was on
two sunny days in September that were comparable to June weather Observations were made each
hour between 0730 and 2130 hours for a total of 15 scans per day They were conducted in all public
spaces at each site excluding rooms bathing rooms toilets and bedrooms as well as areas used
exclusively by staff Two observers were trained at each site to collect the data to a criterion of at
least 85 agreement on location person and behavioral categories Behavior observations were
collated by site by activity and time-of-day format
Results
Floor Plan Comparisons
Building orientation varied across sites as did the views of outdoor gardens (floor plans in
Fig 1-5) Table 1 lists some of the most salient similarities and differences between the sites
Each building had residential wings referred to as houses with residentially scaled rooms
linked by a common area shared by all houses (Figures 1-5) The common areas in all sites included
Mapping Five Sites
10 of 47
a great room a fireplace seating area at least one activity or craft room a family or private dining
room and a beauty salon
Insert Figures 1-5 and Table 1 about here
Overall the floor plans of ASB and MDR were very similar as were the plans of the other
three centers MPN MPW and WDS In the latter three centres the houses were equivalent to the
three parallel wings flanked by courtyards that is outdoor spaces with natural green elements and a
view to the sky Each wing was self-contained each had a kitchen livingdining room and laundry
and a room for bathing or showering Each wing had a central hallway with bedrooms running its
length on either side accommodating 12 residents ASB and MDR floor plans had two perpendicular
housing areas comprised of two parallel wings The architects viewed this design as four houses each
accommodating 10 residents Each bedroom hallway and one living area was considered a house and
a pair of houses was viewed as sharing a kitchen The kitchen was planned as a hub for staff assigned
to the two bedroom hallways and a place to locate a staff-buddy for a task (DiMotta amp Hoglund
2000) However at ASB for example the arrangement of furniture with glider-rocking chairs
arranged primarily in one dining-living space and tables placed in the dining-living area on the other
side of the kitchen suggested that more than the kitchen was being shared and that these common
rooms were being used as a continuous space for all 20 residents to share In gathering data from
management and staff there was no evidence that staff and residents were treating a particular
dining-living room as being the domain of just one hallway of residents Moreover ASB staff said
residents housed in bedrooms along one hall were frequently found in the other bedroom hall
Mealtime seating varied for breakfast lunch and dinner but the variation was not related to
Mapping Five Sites
11 of 47
residentsrsquo home hallway Consequently each U-shaped housing area in ASB and MDR was
considered a house for the purposes of this study
House kitchens differed across sites At ASB and MPW these were large country kitchens
but at other sites the kitchens were small At WDS kitchens were designated as ldquoserveriesrdquo Some
sites had activity areas or rooms in the common areas In the fireplace seating area adjacent to
WDSrsquos country kitchen (but not within the country kitchen) were a large dining table and matching
chairs An open wall above a bar-type counter allowed items to be passed from the country kitchen
This made the space more flexible because it was not viewed as a special events venue like the
enclosed private dining rooms in the other four centers It also encouraged various activities to be
conducted on this dining table that were not scheduled for the common areas in the other centers
Table 1 supplements this descriptive comparison
The common features included floor plans designed for small group living (houses of 12 or
20) in self-contained houses with spaces for cooking eating bathing and gatherings bedroom
hallways that are short by facility standards (yet long for family dwellings) a variety of common
spaces and informal staff workspaces but no formal nursing stations (Table1) Differences in
general design between sites were also in quantitative measures for example the number of beds
ranged from 36 to 40 the number of public rooms ranged from 11 to 17 (Table 1) and most striking
the seating capacity in public rooms varied from 165 to 232 (Table 1) with ASB and MDR having
somewhat less capacity than MPN and MPW Inspection of floor plans showing chair location (data
not shown) revealed that the differences in numbers of seats between sites were principally in the
houses kitchen and livingdining areas implying that the site differences in these floor plan areas
were relevant
Mapping Five Sites
12 of 47
Therapeutic Environment Screening Scale
Environmental characteristics were described using the 38-item Therapeutic Environment
Screening Scale (TESS-2+) Designees at each site filled out the form after training by one of the
authors of the study who was experienced in using the scale Interrater agreement was assured by
comparing interpretations and ratings consensus was reached on any issues related to scoring
Interrater reliability for TESS-2+ items had ranged from 67 to 100 agreement (Sloane et al
1998) There were no significant differences in the mean domain scores between the sites that had
12-capacity houses and those with 20-capacity houses (Table 2) The findings are presented by
grouping the items into two types of goals and domains those associated with the general site design
that may be more architecturally based and those more aligned with interior design site operations
and providing care
Insert Table 2 about here
General Design The scores related to the therapeutic goals and domains for building design
were similar across sites reflecting the implementation of the basic Woodside building model
(Table 2 Exit control Orientation and cuing Privacy and Functional ability Physical
attractiveness) All sites in this study had strategies for exit control (Table 2 2andash2h) WDS had both
alarms and keypad-locks on external exits while the other sites had keypad-locks MPN and MPW
had a reception desk at the front entrance as a clerk-observation post At ASB and MPW the external
exits were partially disguised at the other sites they were not (Table 2 3a 3b)
Mapping Five Sites
13 of 47
Orientation and cuing is related to residentsrsquo personal safety and self-awareness thus the
photos and names beside the bedrooms doorways which all sites used are important (Table 2 27
28 29) as in the ldquotip of the tongue phenomenonrdquo they need a cue to retrieve the memory (Zeisel
1998) An open interior plan that allows residents to see into public rooms is an optimal way finding
strategy for persons with dementia all sites employed this The strategic location of cues and
personal items can also aid way finding Although institutional-style directional signage is eschewed
on restroom doors for example both graphics and labels are advised Open floor plans often require
few signs MDR had the most signs and MPW used the fewest graphics and signs with other sites
having intermediate numbers (Table 2 19 20) Large windows that provide natural exterior views
(Table 2 4) are not only attractive they are another tactic that serves way finding and also provides
seasonal orientation in the latitudes of these five sites The entrances of residentsrsquo bedrooms were
personalized at all sites (Table 2 27 28 29) Redundancy is recommended and a greater variety of
items were used at ASB MDR WDS and MPN than at MPW for this purpose
All five sites scored well on supporting functional ability (Table 2 16 17 18) that is either
slowing decline or stimulating improvement which is something for which sites designed for
dementia have been associated (Benson Cameron Humback Servino amp Gambert 1987 Greene
Asp amp Crane 1985 Innes amp Surr 2001 McCracken amp Fitzwater 1989 Rabig Thomas Kane
Cutler amp McAlilly 2006 Rule Milke Dobbs 1992 Silverman et al 1995 Skea amp Lindesay 1996
Warren 1998)
Interior Design and Approach to Care The first goal of this type is safety security and
health with domains (besides exit control discussed above) of Maintenance Cleanliness Lack of
odors and Safety (of floors) A second goal is Stimulation and a third is Socialization Slaughter et
al (2006) viewed these as basic requirements and found no significant differences in these goals
when comparing the 6 special care facilities (bungalows) with the 45 units in traditional institutional
facilities so it is not surprising that the same was true for these highly similar sites
Mapping Five Sites
14 of 47
Stimulation domains include Lighting Tactile and Visual stimulation as well as Quietness
Both sensory deprivation and over-stimulation are viewed as problems (Brawley 1997 Day
Carreon amp Stump 2000 Cronin-Golumb 1995) According to Zeisel Hyde amp Levkoff (1994)
appropriate levels of stimulation results from having a site with a high sensory comprehension
ranking so not necessarily the overall calmest setting but rather one with a moderate amount of
sensory input that residents can understand Ambient lighting was considered good in all sites with
minimal glare from a number of reflecting surfaces such as picture windows and French doors (Table
2 21) Lighting was evenly distributed and levels were considered ample (Table 2 22 23) with the
exception of MPN Ambient auditory noise was not deemed a problem whether considering type or
level of noise (Table 2 24 25) The general availability of things to touch in common areas such as
those that invite handling or folding was somewhat less at ASB and MDR than at other sites
Overall ratings of home likeness and the individuality of residentsrsquo appearance were
consistently good but the general atmosphere influenced by residentsrsquo lower overall levels of
participation in activities and a less positive rating for staff interactions with residents resulted in
MDR scoring lower that other sites (Table 2 15 31 32 36) WDS scored in the mid-range on
residentsrsquo involvement but as indicated above its residents had much lower MMSE scores At all
sites personal pictures or mementos were in most residentsrsquo bedrooms However such items were
not present in common rooms at MDR
The mean SCUEQS scores (Table 2) which summarized a subset of the TESS-2+ items
were not significantly different between the sites that had 12-capacity houses and those with 20-
capacity houses The SCUEQS had been derived for the NIA studies of special care units and was
considered by experts to measure important aspect of the physical environment and serve as a
reliable measure for differentiating better nursing units and assessing the overall environmental
quality (Sloane et al 2002) The results appear to justify the architectsrsquo design decisions that resulted
in two hallways of 10 residents sharing the large kitchen and the living-dining rooms Slaughter et al
Mapping Five Sites
15 of 47
(2006) devised another composite score the Composite Above Average Quality Score (CAAQS)
which they found to be more sensitive than the SCUEQS The CAAQS represents the percentage of
domains that were above average in quality It revealed a difference between the sites with 12-
capacity houses (857) and those with 20-capacity houses (786) that was not shown by the
SCUEQS but the difference was not significant
Behavioral Mapping
Reliability The number and category (staff family or resident) of persons observed at each location
was recorded on floor plans in successive behavior scans one hour apart over the course of two
days Interobserver reliability of the scans was assessed at each site Cohenrsquos kappa a measure of
agreement between observers has a range from 0 no agreement to 100 total agreement Fleiss
(1981) characterized a kappa of 4 to 6 as fair 6 to 75 as good and over 75 as excellent There was
good agreement on average between two independent observers on the identification of behaviors
observed Kappa mean (SD) 0851 (04) and excellent agreement on identification of people being
scanned as residents staff family or others kappa mean (SD) 0732 (07)
Observations Fifteen observation periods or scans per day were conducted one per hour during
the two days of observation Examination of the within-site data revealed that the only differences
were day differences in specific scans related to the occurrence of special events eg barbecues
Consequently the data were collapsed across days A scan of about 10 minutes in duration was
required to count people in all public areas Observers minimized the possibility of counting the same
person in more than one room during a scan by following a preplanned path through the building and
working quickly Counts of sightings of staff family and volunteers and residents by hour in each
Mapping Five Sites
16 of 47
area of each site were summed over the two-day period of observation To assist the description of
the findings resident data were subsequently adjusted to show the mean percent of residents at a site
who were observed per scan per day and to show the percent of scans in which residents were
involved in a particular activity or seen in a particular room or area
Staff and Family Observations of staff and family are presented without data as these were
ancillary to the principal focus on residents Staff were seen most often in the house kitchens or
diningliving rooms across all sites except WDS At WDS staff were seen in the kitchens but
seldom in the diningliving rooms In all three sites with 12-capacity houses the central house was a
hub of staff activity with nearly twice as many staff seen in that kitchen (or an adjacent room which
was the dining room in MPN and MPW but was a hallway in WDS) as in the kitchens of the houses
on either side WDS staff were also seen in the seating area outside the great room nearly as much as
in the house kitchens Residents were seldom engaged in an activity when staff were not around eg
see Figure 6 for MPN This is not surprising because persons with Alzheimer disease lose their
ability to initiate activities (Colling 1999 Lee et al 2006) Others have shown that appropriate
environments are not sufficient residents with this disease need activities and all five sites employed
activity coordinators (Grant 1998 Van Haitsma Lawton amp Kleban 2000 Voelkl 2006)
Insert Figure 6 about here
Family members were at some sites as early as 830 am and as late as 930 pm although at
MPN all visits except one were in the afternoon ASB had a family meeting increasing the number
Mapping Five Sites
17 of 47
of sightings of family members to 42 (19 were associated with the meeting) The numbers of
sightings of family members over the two days of observation at other sites were WDS ndash 27 MPN ndash
23 and MDR and MPN ndash 12 each
Insert Tables 3 and 4 about here
Resident Locations Direct observation revealed a pattern of use that was unexpected and not
evident in TESS results Overall resident sightings were at least 25 higher at WDS than at the
other four sites (Table 3) The number of sightings in the common areas of WDS was over 60
greater than those at any other site (Table 3) Residents were most frequently seen in the area just
outside the great room (Table 4) By contrast at all other sites residents spent more time (60 of
sightings) in their houses (Table 4) ASB where residents spent 80 of their time in their houses
represented the extreme in this regard with the other sites being intermediate between ASB and WDS
(Table 4) Differences did not appear to align with whether the houses were of 20- or 12-capacity At
all sites residents were seen most frequently in the common areas outside of the houses with the
common hallways the great room and fireplace seating area accounting for decreasing numbers of
residents in that order (Table 4) however a stylist in the ASB beauty salon drew a crowd showing
how an occasional event can change behavior patterns At the sites with 12-capacity houses and
television rooms those rooms were popular and drew as many residents as the fireplace area
The large percent (396) of residents seen in common areas at WDS was attributable to
sightings in the common hallway and fireplace seating area next to the School House (Figure 5
Table 4) All residents could be gathered in the area which was slightly larger than the great room
Mapping Five Sites
18 of 47
observers noted a continuous round of activities involving groups of varying sizes No other site used
this area as intensely At WDS a day program brought in 8 additional residents and several staff who
ran activities that attracted some residents (discussions newspaper reading crafts) Observers were
asked not to count persons associated with the day program in their tally but the heavy use of the
central space and the day program activities presented there had some influence ASB and MDR also
had day programs that used separate spaces for that purpose so program participants were not seen
Chairs lining the walls in this area of WDS augmenting seating arrangements in front of and on
either side of the fireplace as well as oversized displays of small snapshots on several walls resulted
in an institutional appearance Local lore attributes the lineup of chairs to residents who initiated it
shortly after move-in Staff moved chairs back where the interior designers located them but
residents would pull them back across the corridor in a line until staff gave up
Site differences in the use of the great room were noteworthy ASB appeared to use it only
for church services on a regular basis with ldquoaudience-seatingrdquo left in place from day-to-day
Possibly this was because this great room was relatively distant from the houses (Figure 1) In WDS
MPN and MPW great room seating was rearranged throughout the day to accommodate numerous
events MPN and MPW used the great room like a town hall holding events such as afternoon teas
dances and musical entertainment At MDR small numbers of residents were in the great room
throughout the day but no large gatherings were seen
Within sites the sightings of residents in the houses were distributed fairly evenly across the
houses (Figures 1-5 Table 3) Residents were most often seen in the living-dining rooms and as
noted above staff were most often seen in the adjacent kitchens The exception was WDS where the
house design did not provide a good line of sight for staff between the kitchens and the living-dining
rooms (Figures 4 amp 5) Staff at all other sites could work in kitchens and keep an eye on residents
WDS staff actively encouraged residents to leave dining rooms after a meal and join activities in the
central area likely for two reasons because activities were not planned for the houses and because
Mapping Five Sites
19 of 47
staff working in the houses could not easily monitor a resident who remained in the house living-
dining room WDS staff were rarely seen in the housesrsquo living-dining rooms The School House the
centre house accounted for the majority of residents observed across all houses This kitchen
adjacent to the highly used area just outside the Great Room provided a relatively good monitoring
station for the house and activities in the common areas At WDS mealtimes two common areas
were used residents who needed substantial assistance with meals were often fed in the craft room
and a high-functioning group ate at the dining table alongside the fireplace seating
In the houses at other sites most sightings of residents were in the diningliving room areas
Fewer were in the kitchen and fewer still in the house hallways (Table 3) At MDR only one area
adjacent to the kitchen was devoted to dining and almost no residents were seen in kitchens The
same was not true at ASB where approximately the same proportions of residents were seen in the
shared kitchens as in each of the living-dining rooms on either side (Table 3 sums all four living-
dining rooms) However at ASB the numbers were likely from residents moving between the two
diningliving rooms and passing through the kitchens (Figure 1) because residents were rarely
engaged in the type of tasks encouraged at MPN and MPW (ie handling dishes setting tables etc
to encourage maintenance of their functional abilities Figure 7) Interestingly the highly similar sites
found different ways to use their spaces and different approaches to activities
ASB MPW and WDS held barbecues during the days of observation (Table 3) This meant
the residentsrsquo presence in the kitchen and dining areas was reduced at those meals Accordingly for
comparison across sites dining area sightings were adjusted by adding mealtime sightings in the
courtyards The peak periods for resident sightings were during the midday lunch (1130-1330) and
evening meals (1630-1830) (Table 5) Even so sightings of residents at mealtimes were only 66-
80 of occupancy indicating eight to ten residents were not seen at mealtimes in public areas at
most sites (Table 5) The exception was WDS where sightings indicated nearly all residents were
observed in public areas at mealtimes (Table 5) although WDS residents did not gather in the house
Mapping Five Sites
20 of 47
dining areas for the noon meal With most activities occurring in the core of the building WDS was
flexible about meal arrangements serving meals where residents were located such as the area
outside the great room on an activity room Residents were not required to return to their own houses
to eat They could join day program residents and eat in the common area or join residents in another
house One group of women was known for asking to eat together on their own in the common area
WDS also led other sites in the number of residents observed at other times of the day (Table 5) The
differences were especially marked in the afternoon between meals (1330-1630) and the period
after the evening meal (1830-2130) This suggests that WDS staff may have been viewing the
central areas like they would the central areas of a unit in a nursing home on dementia units staff
often prefer that residents stay in view and not return to their rooms
Resident Activity The observed activity patterns were surprising considering high levels of
resident inactivity reported for nursing home residents (Gottesman amp Bourestom 1974 Ice 2002)
Gottesman and Bourestomrsquos (1974) observations in 40 nursing homes revealed that residents spent
56 of their time during peak daylight hours engaged in no activity or passive activity In that study
residents were involved in personal care television and socializing for 43 of the time Ice (2002)
reprised the Gottesman and Bourestom study and found residents spent 65 of their time doing little
or nothing with only 12 in social activities (Ice 2002) In the present study observations of Just
Sitting and Watching were expected to measure levels of passive behaviors Residents in the five
sites appeared to be engaged in ADLs and Leisure for greater amounts of time than in Just Sitting
and Watching (although small amounts of napping as passive behavior were coded as
Miscellaneous) but this was not significant (Figure 7) Chi-square analysis using phi coefficients
found that residents at WDS engaged significantly less in ADLs than residents in other centres
(plt00001) residents at ASB MPN amp WDS were engaged less in leisure (plt005 each) ASB
Mapping Five Sites
21 of 47
residents were engaged less in Just Sitting (plt00005) and residents were observed Watching less at
MDR MPN amp MPW (plt00005 each) Leisure was the most frequently observed activity for MDR
MPN and MPW the second most frequent at ASB and the third at WDS Recreational activities
both planned and informal activities were considered to be Leisure thus watching TV or waiting to
be served at a coffee party were both coded as being Leisure (persons who were within the group and
actively attending to events but not actively engaged at the moment were coded as Leisure too and
this was distinguished from Watching which was defined as ldquoattending to activities or interactions of
others from a distance such as from a doorway watching a streetrdquo)
Insert Figure 7 about here
The ADLs were the second most frequently seen activity for MDR MPN and MPW and the
third for ASB but were seen much less at WDS The majority of ADLs across sites occurred at meal
times indicating they involved dining (ASB 570 MDR 590 MPN 758 MPW 736 but
WDS 422) The low percent of time spent by WDS residents on ADLs during the evening meal
time (42) agrees with the low number of sightings in the dining area at that time (385 of max)
It appears that WDS residents sat watched and walked but did not spend much time eating
(Figure 7) In contrast previous research at MPN and MPW has found mealtimes to be the longest
duration behavior Scans needed to be one hour apart to avoid seeing meals on two consecutive scans
and oversampling the behavior (Milke et al 2000)
Work that is tasks such as housekeeping and cooking were not seen at either of the sites
with 20-capacity houses but this is the only difference evident when compared with the 12-capacity
Mapping Five Sites
22 of 47
houses Compared to other sites MPN and MPW residents engaged in moderate proportions of all
behaviors (Figure 7) Residents at WDS spent proportionately less time on ADLs light
housekeeping and Leisure and more time at Walking Watching and Just Sitting Chi-square
analysis using phi coefficients showed that residents were observed Walking significantly less at
MDR (plt 005) residents at ASB and MDR engaged significantly less in Work and there were no
significant differences between sites in Miscellaneous activities (Figure 7)
Observersrsquo Notes
Some large differences were found in the care programs across sites Observersrsquo notes
indicated that at MPN and MPW residents were encouraged to be involved in the daily routine of the
facility and direct care staff ate meals with residents This strategy was said to stimulate conversation
and provide residents with a model for appropriate behavior Staff played the role of ldquomotherrdquo rising
to find an item in the kitchen and keeping an eye on food consumption Managers at MPN and MPW
considered this role an essential component of care At ASB MDR and WDS there was no evidence
of such a role
Most cooking was done in facility kitchens away from areas that residents could access This
tended to result in the house kitchens being treated more like institutional serveries Fridges mainly
contained large juice jugs and prepared snacks However at MPW and MPN when a resident opened
the fridge door the door was full of condiments and casseroles it looked just like home because of
an effort to keep institutional sized packages to a minimum These two sites used their kitchens quite
differently than the other three sites At MPN and MPW all breakfasts and snacks were prepared in
the houses each day by direct care staff On four weekdays lunches also were prepared Residents
were invited to participate in some of the chopping slicing and mixing which was considered an
essential component of the care program When meals were delivered from nearby facility kitchens
staff decanted items into family-size serving bowls They added condiments and poured drinks
Mapping Five Sites
23 of 47
serving the meals much like those prepared in-house Although residents helping with meal
preparation appeared to be limited to MPN and MPW staff records indicated additional forms of
daily and special occasion activities occurred at all sites Daily activities included easy tasks eg
folding laundry and exercises at all five sites discussion groups at MDR and WDS religious
activities at ASB MPN and MPW musicsinging at ASB MPW and WDS movies at ASB and
grooming at all sites except WDS
Outdoor courtyards were accessible to residents on the observation days at all sites The
barbecue meal at MPW drew the highest number of residents outside but from mid-morning until
early evening residents were seen on the patios or walkways This was true at every site except
MDR where few ventured outside (data not presented)
Disruptive behaviors were seen only at ASB where at 730 am 230 pm and 430 pm a
single resident was disruptive Whether this was the same or different resident is not known the
identity of persons was not recorded This accounted for only 03 of all behaviors seen at ASB (and
was not shown on Figure 7)
Discussion
The TESS-2+scale results clearly indicated that the pioneering WDS site and the four sites
modeled on it met best practice standards in many areas These include the ratings for global site
assessment overall configuration of self-contained living arrangements with adjacent common
spaces informal workspaces for staff and accessible outdoor green spaces walking paths and
maintenance More pertinent to the present study there were no significant differences between the
sites that had 12-capacity houses and those with 20-capacity houses on any TESS items the NIA
subscale of overall environmental quality (SCUEQS) or CAAQS the composite score devised by
Mapping Five Sites
24 of 47
Slaughter et al (2006) Sites with 20-capacity houses did not look substantially different from sites
with 12-capacity houses according to the scale
Behavioral Mapping
A principal finding from behavioral mapping was the amount of time residents were found
engaged in leisure activity at all five sites Leisure was the most frequently observed activity for
MDR MPN and MPW the second most frequent at ASB and the third at WDS The level of
participation in meaningful activities is considered an important measure of residentsrsquo quality of life
(Gonzalez-Salvador et al 2000 Zimmerman et al 2005) Although the extent of engagement is
typically measured in more focused and intensive ways the fact that observers saw residents who
were alert and watching an activity is meaningful because observers were asked to distinguish
whether the resident was ldquojust sittingrdquo or ldquowatchingrdquo if that was the extent of the involvement When
percentages of time spent in Leisure are combined with Activities of Daily Living following the lead
of Gottesman and Bourestom (1974) who combined personal care television and socializing the
results in this study are ASB 468 MDR 701 MPN 471 and MPW 483 All percentages
total are better than the 1974 studyrsquos 43 Only WDS with 261 was substantially worse and that
was largely because so little time was devoted to the evening meal Ice (2002) studying one site had
found only 12 of time spent in social activities however little time was spent Just Sitting or
Watching For the five sites in this study total percentages of these inactive behaviors are ASB
316 MDR 171 MPN 229 MPW 176 and WDS 402 which are all substantially
different than Gottesman and Bourestomrsquos finding of 56 of time engaged in no activity or passive
activity or the 65 seen by (Ice 2002)
Surprisingly the five sites differed in the percent of maximum possible number of sightings
of residents observed in public areas per scan per day ranging from 49 at MDR to 80 at WDS
This range of 38 difference between the lowest and highest sites is considerable The traditional
concern of staff is that residents who stay in their rooms miss out on socialization and planned
Mapping Five Sites
25 of 47
activities (Grade 1976 Hogden 1985) The public areas most frequented by WDS residents were the
fireplace area and the common hallway area At most sites if the residents were not observed in the
common areas it would be likely that they were in the house areas This was confirmed in the other
principal finding that the percent of maximum possible sightings in the house areas was lowest for
WDS at 25 and highest at ASB at 50 At ASB residents spent 80 of their time in their two
houses At WDS they were encouraged to spend their time in the common areas and they did The
houses were used very differently at the two sites and this may have been because the architects who
were very involved in both sites made it evident that they were intended to be used differently
However the use of communal spaces often has little to do with the intended purpose Lawton
(1970) reports that in 10 observational rounds of a facility a total of 13 people were observed in the
nine social rooms on the nine floors while 79 were counted in the main floor social room where
arrivals and departures could be observed Similarly areas around nursing stations and elevators
frequently draw residents (Lawton 1970 Lawton 1977 Snyder 1980)
A number of factors can be ruled out in the search for unique characteristics of WDS that
could have contributed to the above findings The first factor is the reliability of the observers It is
unlikely that the differences were due to variability in the observational skillsprocedures of the
observers because of the high level of agreement in the assessment of interobserver reliability and
because all observers followed the same protocol in collecting the data The observersrsquo reliability was
also attested to by the similarity of the data within sites across the two days of data collection The
second factor is the general floor plan WDS shared the same basic floor plan with MPN and MPW a
building footprint like the capital letter E So it is unlikely that the gross outer shape of the floor plan
was relevant The third more general factor is related to the inter-site comparability of the TESS-2+
data These data indicate that the five sites were remarkably similar in general and internal design
features WDS has ratings on all measures that were comparable to one or more of the other sites
Mapping Five Sites
26 of 47
including potentially relevant measures such as the presence of homelike features the degree of
interaction with staff and residentsrsquo involvement in activities
There are however a number of other factors that may be relevant to understanding the
WDS data WDS was the only site in which meals were served in the common areas as well as in the
house dining rooms Congruently as already noted the highest number of resident sightings at WDS
was in the common areas (fireplace and common hallway) and most of these common area sightings
were in the common areas of WDS adjacent to the central area of the three houses Importantly these
were the only common areas with a direct line of sight to the central hall and kitchen of the central
house (School House) Staff notes indicated that the number of meal servings from the central house
kitchen was twice as high as that of the kitchens of the other two houses at WDS Again there is
congruence resident sightings in the central house dining room although low relative to central
common areas were twice as high as in the dining rooms of the other two houses at WDS It is also
relevant that staff used all parts of the central common area for activity programming Thus it seems
probable that several factors including the internal floor plan meal service and activity
programming made the central common areas of WDS a multiuse area which resulted in high
number of resident sightings though out the day with peaks at meal times It is worth asking whether
WDS staff would have used the central common area so intensely if the house kitchens had been
aligned with the dining rooms providing staff with oversight as in MPN and MPW
These observations could also explain another WDS anomaly that is the low number
of residents seen to be engaged in ADL activities at meal times compared to other sites If the
lower-functioning residents at WDS engaged in other activities in the central common areas
perhaps abandoning a meal to walk or sit elsewhere that could result in fewer observations
of eating during the mealtime Conversely it could mean that it would be more likely that
Mapping Five Sites
27 of 47
other activities (ie watching walking sitting and leisure activities) would be seen during
meal times which was the case in WDS
Finally the unique features of the WDS resident sighting data may have been related to the
greater degree of dementia (lower than average MMSE scores) of WDS residents The average
MMSE scores at other sites were 50 to 100 higher indicating less severe symptoms than the
average WDS score Congruently WDS had relatively high levels of sightings of sitting watching
and walking behavior and the highest number of pacing incidents Thus it is possible that the
differences in degree of dementia between sites and the related differences in levels of ambulation
made it more likely that WDS residents would leave their rooms and therefore WDS residents would
be sighted most frequently in the common areas of the WDS facility
It is important to note that no substantial differences were found between the 20-capacity
and 12-capacity houses that is in the mean domain scores of the TESS which was used to describe
environmental characteristics Scores were much the same across the five sites The TESS has goals
and domains aligned with the general site design which are more architecturally based and those
best aligned with interior design site operations and providing care
The architects might have thought their design at ASB and MDR would result in a small care
group of 10 and that residents along each bedroom hall would form a household but this did not
happen The residents in the 20-capacity houses did not form a 20-resident cluster either instead they
formed small groups for eating and activities Therefore other factors such as early or late rising or
naturally-formed friendships may be a greater influence than bedroom proximity The addition of
eight more residents per house might be anticipated to lead to crowding in the housesrsquo living-dining
areas or some other notable difference However crowding was not evident in the 20-capacity
houses In fact WDS gatherings in the common areas were more apt to be viewed as crowds
Mapping Five Sites
28 of 47
Observations indicated there that Disruptive Behavior often attributed to crowding was rare It
occurred in only one site and therefore could not be associated with a particular design
These observational results combined with the TESS results have broad implications for
future studies The first implication is methodological and the second is empirical Methodologically
the combination of architectural and behavioral measures in studies of facilities for the elderly
highlights the advantages over methodologies that employ only behavioral measures eg Dementia
Care Mapping (Brooker 2005 Fulton Edelman amp Kuhn 2006 Sloane Brooker Cohen et al
2007) and over studies that rely on client interviews (Kane 2003) Empirically 20 residents in a
house is approaching the size of dementia units in some nursing homes The present study revealed
that the main difference seen in the operation of the 12-resident house and the 20-resident house
design was that the latter appeared to hold more activities within the house raising questions about
the value and need for those common spaces whereas the former made more use of the common
spaces for activities In this way behavior was affected by the house design and by the way that staff
chose to organize activities
Mapping Five Sites
29 of 47
References
Benson D M Cameron D Humbach E Servino L amp Gambert S R (1987) Establishment and
impact of a dementia unit within the nursing home Journal of the American Geriatrics Society
35 319-323
Brawley E C (1997) Designing for Alzheimerrsquos disease Strategies for creating better care
environments New York Wiley
Brooker D (2005) Dementia Care Mapping A review of the research literature The Gerontologist
45 Special Issue I 11ndash18
Calkins M P Meehan R A amp Lipstreuer E (1999) Creekview Its history and evaluation
Kirtland OH IDEAS Inc
Colling K B (1999) Passive behaviors in Alzheimer disease A descriptive analysis American
Journal of Alzheimers Disease and Other Dementias 14 27-40
Cronin-Golumb A (1995) Vision in Alzheimerrsquos disease The Gerontologist 35 370-376
Day K Carreon D amp Stump C (2000) The therapeutic design of environments for people with
dementia A review of the empirical research The Gerontologist 40 397-416
Deely B Klingensmith L amp Silverman M (1995) Developing a residential Alzheimers facility
Focus on Geriatric Care and Rehabilitation 8(7) 1-8
DiMotta S Dubney B M Hoglund J D amp Kershner C (1993) Long-term care design Blazing
new territory - code reform and beyond Journal of Healthcare Design 5 197-203
DiMotta S amp Hoglund J D (2000) Woodside Place A residential care model for the Alzheimerrsquos
and dementia resident Symposium on Healthcare Design Anaheim CA Center for Healthcare
Design
Mapping Five Sites
30 of 47
Doty M M Koren M J amp Sturla E L (2008) Culture change in nursing homes How far have
we come Findings from The Commonwealth Fund 2007 National Survey of Nursing Homes
New York The Commonwealth Fund
Edelman P Fulton B R Kuhn D amp Chang C H (2005) A comparison of three methods of
measuring dementia-specific quality of life Perspectives of residents staff and observers The
Gerontologist 45 27-36
Fleiss J L (1981) Statistical methods for rates and proportions (2nd ed) New York John Wiley amp
Son
Folstein M F Folstein S E amp McHugh P R (1975) Mini-Mental State a practical method for
grading the cognitive state of patients for the clinician Journal of Geriatric Research 12 189-
198
Fulton B R Edelman P amp Kuhn D (2006) Streamlined models of dementia care mapping
Aging amp Mental Health 10 343-351
Gold D T (1991) A descriptive typology of dementia units In P D Sloane amp L J Mathew (Eds)
Dementia units in long-term care (pp 50-61) Baltimore Johns Hopkins University Press
Gonzalez-Salvador T Lyketsos C G Baker A Hovanec L Roques C Brandt J et al (2000)
Quality of Life in dementia patients in long-term care International Journal of Geriatric
Psychiatry 15 181-189
Gottesman L E amp Bourestom N C (1974) Why nursing homes do what they do The
Gerontologist 14 501-506
Grade B L (1976) A study of the entry crisis to a nursing home Unpublished masterrsquos thesis
University of Wisconsin Milwaukee
Grant L A (1998) Beyond the dichotomy An empirical typology of Alzheimerrsquos care in nursing
homes Research on Aging 20 569-592
Mapping Five Sites
31 of 47
Greene J A Asp J amp Crane N (1985) Specialized management of the Alzheimerrsquos disease
patient Does it make a difference A preliminary progress report Journal of the Tennessee
Medical Association 78 559-563
Harper G J (1998) Stress and adaptation among elders in life care communities Unpublished
doctoral dissertation Ohio State University Columbus
Hogden K M (1985) Leisurerecreation needs of hospitalized elderly A task force report
Activities Adaptation amp Aging 7 53-65
Hoglund D J amp Ledewitz S D (1999) Designing to meet the needs of people with Alzheimerrsquos
disease In B Schwarz amp R Brent (Eds) Aging autonomy and architecture Advances in
assisted living (pp 229-261) Baltimore John Hopkins University Press
Ice G H (2002) Daily life in a nursing home has it changed in 25 years Journal of Aging Studies
16 345-359
Imamoğlu Ccedil (2007) Assisted living as a new place schema A comparison with homes and nursing
homes Environment and Behavior 39 246-268
Innes A amp Surr C (2001) Measuring the well-being of people with dementia living in formal care
settings The use of Dementia Care Mapping Aging and Mental Health 5 258-268
Kane R A (2003) Definition measurement and correlates of quality of life in nursing homes
Toward a reasonable practice research and policy agenda The Gerontologist 43 Special
Issue II 28ndash36
Kuhn D Kasayka R E amp Lechner C (2002) Behavioral observations and quality life among
persons with dementia in 10 assisted living facilities American Journal of Alzheimerrsquos Disease
and Other Dementias 17 291-298
Lawton M P (1970) Ecology and aging In L A Pastaland amp D H Carson (Eds) The spatial
behavior of older people (pp 41-67) Ann Arbor MI University of Michigan Press
Mapping Five Sites
32 of 47
Lawton M P (1977) The impact of the environment on aging and behavior In K W Schaie (Ed)
Handbook of the Psychology of Aging (pp 276-301) New York Van Nostrand Reinhold
Lawton M P Weisman G D Sloane P amp Calkins M (1997) Assessing environments for older
people with chronic illness Journal of Mental Health and Aging 3 83-100
Lawton M P Weisman G D Sloane P Norris-Baker C Calkins M amp Zimmerman S I
(2000) Professional Environmental Assessment Procedure for special care units for elders with
dementing illness and its relationship to the Therapeutic Environment Screening Schedule
Alzheimer Disease and Associated Disorders 14 28ndash38
Lee M Madden V Mason K Rice S Wyburd J amp Hobson S (2006) Occupational
engagement and adaptation in adults with dementia A preliminary investigation Physical and
Occupational Therapy in Geriatrics 25 63-81
Lehrner P N (1979) Handbook of ethological methods New York Garland STMP
Margulis S T (2003) Privacy as a social issue and behavioral concept Journal of Social Issues 59
243-261
Martin P amp Bateson P (1987) Measuring behaviour An introductory guide New York
Cambridge University Press
Mathew L J amp Sloane P D (1991) Organizing and staffing dementia units In P D Sloane amp L
J Mathew (Eds) Dementia units in long-term care (pp 101-127) Baltimore Johns Hopkins
University Press
McAllister C L amp Silverman M A (1999) Community formation and community roles among
persons with Alzheimerrsquos disease A comparative study of experience in a residential
Alzheimerrsquos facility and a traditional nursing home Qualitative Health Research 9 65-85
McCracken A L amp Fitzwater E (1989) The right environment for Alzheimerrsquos Geriatric
Nursing 10 293-294
Mapping Five Sites
33 of 47
Milke D L (2003) Iterative post-occupancy evaluations of the McConnell Place North design
[Abstract] Proceedings of the 56th Annual Scientific Meeting of the Gerontological Society of
America 43 48 San Diego CA
Milke D L Clark C amp Bucknell M (2000) Assessing the adequacy of residential lighting in two
care centres for persons with Alzheimerrsquos Disease using the new age-adjusted North American
illumination recommendations (Research Report) Ottawa Ontario Canada Canada Mortgage
and Housing Corporation
National Institute on Aging Coordinating Center (1993) NIA collaborative studies special care units
for Alzheimers disease Manual of procedures Davis CA Northern California Alzheimers
Disease Center University of California
Rabig J Thomas W Kane R A Cutler L J amp McAlilly S (2006) Radical redesign of nursing
homes Applying the Green House concept in Tupelo Mississippi The Gerontologist 46 533-
539
Rule B G Milke D L amp Dobbs A R (1992) Design of institutions Cognitive functioning and
social interactions of the aged resident Journal of Applied Gerontology 11 475-488
Saxton J Silverman M Ricci E Keane C amp Deely B (1998) Maintenance of mobility in
residents of an Alzheimer special care facility International Psychogeriatrics 10 213-224
Schwarz B Chaudhury H amp Tofle R B (2004) Effect of design interventions on a dementia care
setting American Journal of Alzheimers Disease and Other Dementias 19 172-176
Silverman M Ricci E Saxton J Ledewitz S McAllister C amp Keane C (1995) Woodside
Place The first three years of a residential Alzheimerrsquos facility (Vols 1-2) Oakmont PA
Presbyterian Senior Care
Skea D amp Lindesay J (1996) An evaluation of two models of long-term residential care for
elderly people with dementia International Journal of Geriatric Psychiatry 11 233-241
Mapping Five Sites
34 of 47
Slaughter S Calkins M Eliasziw M amp Reimer M (2006) Measuring physical and social
environments in nursing homes for people with middle- to late-stage dementia Journal of the
American Geriatrics Society 54 1436-1441
Sloane P D Brooker D Cohen L Douglass C Edelman P Fulton B R et al (2007)
Dementia Care Mapping as a research tool International Journal of Geriatric Psychiatry 22
580-589
Sloane P D Mitchell M Priesser J S Phillips C Commander C amp Burker E (1998)
Environmental correlates of resident agitation in Alzheimerrsquos disease special care units Journal
of the American Geriatric Society 46 862ndash869
Sloane P D Mitchell C M Weisman G Zimmerman S Foley K M L Lynn M et al
(2002) The Therapeutic Environment Screening Survey for Nursing Homes (TESS-NH) An
observational instrument for assessing the physical environment of institutional settings for
persons with dementia Journals of Gerontology Series B Psychological Sciences and Social
Sciences 57B(Suppl 2) S69-S78
Sloane P D Zimmerman S Williams C S Reed P S Gill KS amp Preisser J S (2005)
Evaluating the quality of life of long-term care residents with dementia The Gerontologist 45
37-49
Snyder L G (1980) An exploratory study of patterns of social interaction organization and facility
design in three nursing homes In J Hendricks (Ed) Institutionalization and Alternative Futures
(pp 68-80) Farmingdale NY Baywood Pub Co
Sommer R amp Sommer B B (1986) A practical guide to behavioral research Tools and
techniques (2nd ed) New York Oxford
Van Haitsma K Lawton M P amp Kleban M H (2000) Does segregation help or hinder
Examining the role of heterogeneity in behavioral and emotional aspects of quality of life for
Mapping Five Sites
35 of 47
persons with cognitive impairment in the nursing home Research and Practice in Alzheimerrsquos
Disease 4 163-177
Verbeek H van Rossum E Zwakhalen S M G Kempen G I J M amp Hamers J P H (2009)
Small homelike care environments for older people with dementia A literature review
International Psychogeriatrics 21 252-264
Voelkl J E (2006) Therapeutic environments in nursing homes Fostering residents meaningful
activity engagement Activities Directors Quarterly for Alzheimers and Other Dementia
Patients 7(3) 35-44
Warren S (Ed) (1998) Innovative dementia care McConnell Place North evaluation (Research
Report) Edmonton Alberta Canada Evaluating Programs of Innovative Continuing Care
Zeisel J (1998) The Hearthstone health environments case study Journal of Healthcare Design
Proceedings from the Symposium on Healthcare Design San Francisco CA National
Symposium on Healthcare Design Inc
Zeisel J Hyde J amp Levkoff S (1994) Best practices An environment-behavior (E-B) model for
Alzheimer special care units American Journal of Alzheimerrsquos Care and Related Disorders and
Research and Care 9(2) 4-21
Zimmerman S Sloane P D Williams C S Reed P S Preisser J S Eckert J K et al (2005)
Dementia care and quality of life in assisted living and nursing homes The Gerontologist 45
133-146
Mapping Five Sites
36 of 47
Table 1 Comparison of Architectural Features Across Five Sites
Feature ASB MDR MPN MPW WDS
Total facility square footage 23040 sq ft 27308 sq fta 24750 sq ft 23864 sq ft 21540 sq ft
Size of administration area (offices conference reception etc but not service or employee spaces)
960 sq ft (No entry hall)
1584 sq ft day program offices and program space
1675 sq ft 1629 sq ft 972 sq ft (No entry hall)
Staff (lunch) room 16rsquo x 18rsquo 6rsquo11rdquo x 6rsquo2rdquo 158rsquo x 16rsquo 138rsquo x 16rsquo 95rsquo x 30rsquo (plus)b
Treatment or examination room
No Yes In daycare area
No No Yes In central
areac
Medications storage Central medication cart
Medication room Medication room per house
Medication room per house
Central medication cart
Location of meal preparation
Facility kitchen in administration area
Facility kitchen in administration area
Adjacent nursing home (see house kitchen)
Adjacent nursing home (see house kitchen)
Facility kitchen in administration area
Use of house kitchen Servery snacks Servery snacks Meal preparation for all breakfasts and some lunches servery
Meal preparation for all breakfasts and some lunches servery
Servery snacks
Family dining room or central country kitchen usage
Small group activities family functions by reservation
Small group activities family functions by reservation
Small group meetings Great Room party food preparation family functions by reservation
Small group meetings Great Room party food preparation family functions by reservation
Small group activities family functions by reservation
Houses and capacity 2 20 2 20 3 12 3 12 3 12
Private tubroom Two off the central hallway
Two off the central hallway
One located in each house
One located in each house
None
Private shower areas One per 10 residents located in each wing of each house
One per 10 residents located in each wing of each house
One per resident located in each resident room with the one shared bedroom having a shared shower
One per resident located in each resident room with the one shared bedroom having a shared shower
One per 12 residents located in each house
Resident room doors Split door Split door Split door Regular Split door
Inventory of public rooms and seating capacity (includes all alcoves that can be used for seating and seating areas near exits)
15 165
17 176
15 232
13 219
14 182
Variety and appearance of outdoor Area
2 small (little greenery) 1 medium (mixed hardgreen surfaces) and a large courtyardmdashvery appealing
2 small (much greenery) 1 medium (mixed hardgreen surfaces) 2 large courtyards (1 mixed hardgreen surfaces 1 green) mdash very appealing
3 small (much greenery) 1 large (mostly green courtyard mdash very appealing
3 small (much greenery) and 1 large (mostly green courtyard mdash very appealing
1 small (much greenery) 1 medium (mostly green) and 1 large (mostly green) courtyard mdash very appealing
a Does not include researchteaching wing Total for entire floor space is 40382 sq ft b Room at WDS was not intended as a lounge ie a retreat from work to professionalize the care staff role it was to serve as a place to read and discuss work At other
sites the lunch room also served as a lounge c Room was intended as a multi-purpose room
Mapping Five Sites
37 of 47
Table 2 Therapeutic Environment Screening Scale Items for Goal and Domain Possible Range
Midpoint and Mean in Each Group
Therapeutic Goal and Domain
Item Numbers Range Mid-point ASB amp MDR
20-Capacity Houses MPN MPW amp WDS
12-Capacity Houses
ASB MDR Site Scores
Mean MPN MPW WDS Site Scores
Mean
Safetysecurityhealth
Exit control 2a 2b 2c 2d 2e 2g
2h 3a 3b 0-11 55 2 1 15 1 2 2 17
Maintenance 7b1Dagger 7b2Dagger 7b3Dagger 7b4Dagger 0-8 40 8 8 80 8 8 80
Cleanliness 7a1Dagger 7a2Dagger 7a3 7a4 0-8 40 8 8 80 7 8 8 77
Lack of odorsℓ 9aDagger 9bDagger 0-4 20 4 3 35 4 4 4 40
Safetyℓ 7c1 7c2Dagger 7c3 7c4 8 0-10 60 10 10 100 10 10 10 100
Orientationcuing 19 20ф 27a 27bcDagger
27d 27e 27f 28 29 0-17 85 1212 120 11 9 12 107
Privacycontrol
Privacy 30a 30b 30c 30d 0-4 20 0 0 0 1 2 0 10
Functional ability 16 17a 17b 18Dagger 0-7 35 7 7 70 7 7 7 70
Stimulation
Lighting 21 22a 22bDagger 22cDagger
23a 23b 23c 0-14 70 13 13 130 11 14 13 127
Tactilevisual
stimulation 34 35Dagger 37b 0-16 80 10 6 80 15 14 11 133
Quietness 24a 24b 24c 24d
24eDagger 24f 24g 25 26 0-25 125 21 21 210 19 20 23 207
Physical attractiveness
4a1 4a2 4b1 4b2
4c1 4c2 4d1 4d2 37c 0-34 140 16 15 155 15 16 16 157
Socialization
Homelike
environment 15Dagger 31Dagger 32 0-9 45 9 9 90 9 9 9 90
Resident
appearance 36Dagger
0-2 10 2 2 20 2 2 20
SCUEQS 0-41 - 41 39 40 39 4141 40
CAAQS sect 0-100 - 786 857
Large means represent better physical environment
Dagger Items used to compute the 18-item Special Care Environmental Quality Scale (SCUEQS) 27b and 27c were treated as a single item and item 15 was
misnumbered in the TESS-2+ Revised version (as item 13) ф Item 20 is the percentage of common rooms with signsgraphics floor plans in all sites allowed a view into common rooms (scored as zero) ℓ An item was unintentionally omitted from the TESS-2+ scoring form (10 in Odors and 11 in Safety) sect Composite Above Average Quality Score (CAAQS) represents the percentage of TESS-2+ domains that were above average in quality
Mapping Five Sites
38 of 47
Table 3 Percent of Resident Population Who Were Observed During Behavior Scans
at Each Site in Particular Areasa
AreaSite 20-Capacity Houses 12-Capacity Houses
ASB MDR MPN MPW WDS
Total Areas 608 493 511 564 803
Total Common Areas 62 158 169 200 511
Total Outdoor Areas 46 02 11 56 38
Total House Areas 500 333 331 311 254
House 1 259 168 115 69 62
House 2 241 165 108 128 123
House 3 108 114 69
House Kitchen 149 08 75 53 49
House LivingDining Room 324 278 236 232 200 a Resident data were adjusted to show the mean percent of residents at a site who were observed per scan per day Note Total Areas is the sum of the following Total Common Total Outdoor and Total House Total House Areas is the sum of Houses 1 House 2 and House 3 House Kitchen and LivingDining Rooms are summed across houses Blank cells indicate that the question was not applicable
Mapping Five Sites
39 of 47
Table 4 Percent of Resident Population Who Were Observed During Behavior Scans
at Each Site in Particular Common Areasa
Location 20-Capacity Houses 12-Capacity Houses ASB MDR MPN MPW WDS
Great Room 07 75 94 91 64
Fireplace Seating Area 22 69 43 13 106
ActivityCraft Room 04 47 00 02 10
TV Room ndash ndash 43 64 58
Other TV Area ndash ndash 11 39 ndash
Common Area Hallway Seating 37 108 138 143 396
Music Room ndash ndash 00 ndash 00
Garden Room ndash ndash 00 ndash 04
Beauty Salon 39 12 00 00 00
Family Dining RoomCountry Kitchen 00 09 00 00 00
Total 109 320 329 352 638 a Resident data were adjusted to show the mean percent of residents at a site who were observed per scan per day Note Dashes indicate that residents were not observed in these areas
Mapping Five Sites
40 of 47
Table 5 Percent of Resident Population Who Were Observed During Behavior Scans
at Each Site at Particular Times of Day
Time of Day 20-Capacity Houses 12-Capacity Houses
ASB MDR MPN MPW WDS
Before Lunch 541 360 386 475 654
Lunch 805 663 667 722 1000
Between Meals 657 530 506 589 963
Supper 765 738 744 744 922
After Supper 50 390 447 469 740 a Resident data were adjusted to show the mean percent of residents at a site who were observed per scan per day Note Before Lunch (4 scans-730-1030) Lunch (2 scans-1130 amp 1230) Between Meals (3 scans-1330 to 1530) Supper (2 scans-1630 amp 1730) After Supper (4 scans-1830 to 2130)
Mapping Five Sites
41 of 47
Figure 1 Floor plan of Asbury Place Mt Lebanon PA
Mapping Five Sites
42 of 47
Figure 2 Floor plan of Marjorie Doyle Rockwell Center Cohoes NY
Mapping Five Sites
43 of 47
Figure 3 Floor plan of McConnell Place North Edmonton AB
Mapping Five Sites
44 of 47
Figure 4 Floor plan of McConnell Place West Edmonton AB
Mapping Five Sites
45 of 47
Figure 5 Floor plan of Woodside Place Oakmont PA
Mapping Five Sites
46 of 47
Figure 6
McConnell Place Northordf Residentsrsquo Activities When Alone and in the Presence of Staff
ordf The average MMSE score was 153 at MPN higher than the average across sites 132 + 15 (M+SE) MPN residents appeared not to initiate activities when alone
0
5
10
15
20
25
30
35
40
Alone Day 1 With Staff Day 1 Alone Day 2 With Staff Day 2
Nu
mb
er R
esid
ents
Arts amp Crafts
Chores
CookingBaking
Eating
Exercising
Games
Grooming
Lg Activity Grp
Music Event
Reading
Sm Interaction
Walking
Watching
Watching TV
Other
Mapping Five Sites
47 of 47
Figure 7
Percent of Scans in Which Residents at Each Site Engaged in Particular Behaviors
0
10
20
30
40
50
60
70
80
90
100
ASB MDR MPN MPW WDS
Misc
Just Sit
Watch
Walk
Leisure
Work
ADLs

Mapping Five Sites
3 of 47
Introduction
Residential care settings have become an accepted goal for many healthcare organizations
They satisfy the preferences of elderly clients for homelike surroundings in familiar residential
neighborhoods and help make long-term care centers function like a home rather than a hospital
(Imamoğlu 2007 Verbeek van Rossum Zwakhalen Kempen amp Hamers 2009) They have become
an integral part of the culture change movement as American healthcare seeks to improve residentsrsquo
quality of life The physical environment is one of the three core domains of culture change although
a recent survey shows that very few care centers have altered their physical environment to support
culture change (Doty Koren amp Sturla 2008) Thus the design of such residential centers is apt to
gain importance
Little is known however about the daylong patterns of activity of residents and staff in these
residential facilities and how the buildings shape them Some interest in such observation has been
shown recently (Calkins Meehan amp Lipstreuer 1999 Edelman Fulton Kuhn amp Chang 2005
Gold 1991 Kuhn Kasayka amp Lechner 2002 Margulis 2003 Mathew and Sloane 1991 Milke
2003 Milke Clark amp Bucknell 2000 Schwarz Chaudhury amp Tofle 2004 Sloane et al 2005
Zimmerman et al 2005) Earlier research established that residentsrsquo levels of activity are a concern
in nursing homes Gottesman and Bourestom (1974) observed activity in 40 nursing homes during
peak daylight hours finding residents were engaged in no or passive activity for 56 of the time
observed For 23 of the time they were involved in personal care with television and socializing
together consuming another 20 of their time Over all observations residents were in contact with
another person for only 17 of the time Ice reprised that study in 2002 by observing 27 nursing
home residents She also found residents spent 65 of their time doing little or nothing even though
Mapping Five Sites
4 of 47
the setting had a creative activities department Only 12 of time was spent in social activities (Ice
2002) Ice also gathered data on the activity level of healthy elders and found their time was spent
quite differently 17 in passive activities and 38 in socialexpressive activities Another study
with healthy elders found they spent 40 in passive activities and 28 in socialexpressive activities
(Harper 1998) These studies with healthy elders suggest that the inactive behavior observed in
nursing homes residents does not match the pattern of healthy elders
More critically it is not known what exactly about the design of a residential care center
makes it function like a home rather than a hospital With new designs of residential care settings
being presented regularly (eg wwwHDC08com httpwwwedraorg) an underlying assumption
appears to be that small variations in their architectural design will have little effect on resident and
staff activity This assumption and the dearth of literature with detailed information on the behavioral
patterns of use of residential-style facilities resulted in a lack of any explicit hypotheses as to what
we would find and prompted us to undertake the present descriptive study The principal purpose of
the study was to investigate the daylong patterns of activity of residents and staff in five similar
specially designed sites for the care of persons with Alzheimerrsquos disease The most salient difference
between the five sites was that two were designed with two 20-capacity housing units and three were
designed with three 12-capacity units Accordingly much of the data presentation is focused on that
feature The Therapeutic Environment Assessment Scale provided an architectural basis for assessing
the significance of activity data gathered through behavior mapping and provided a linkage with the
findings of studies using this as a standardized instrument We now present evidence that small
design differences can have large effects on resident patterns of room occupancy and on their
activities
Mapping Five Sites
5 of 47
Methods
Participants
The five residential care sites considered in the present study were designed for the care of
persons diagnosed with dementia and all were based on the pioneer site the well-investigated and
well-known architectural design of Woodside Place (WDS) in Oakmont PA (Deely Klingensmith
amp Silverman 1995 DiMotta Dubney Hoglund amp Kershner 1993 DiMotta amp Hoglund 2000
Hoglund amp Ledewitz 1999 McAllister amp Silverman 1999 Saxton Silverman Ricci Keane amp
Deely 1998 Silverman et al 1995) Of the four other sites two were located in Edmonton AB
McConnell Place North (MPN) and McConnell Place West (MPW) and one site in each of Cohoes
NY Marjorie Doyle Rockwell Place (MDR) and Mt Lebanon PA Asbury Place (ASB) Perkins
Eastman Architects designed three sites The WDS blueprints were purchased by CapitalCare to
build Canadian sites and the architectural firm of Cohos Evamy adapted them making adjustments to
accommodate the weather and site-specific land features in Edmonton AB The five sites can be
considered variations on a theme
Generic data on residents staff and volunteers were obtained from site administration
records A total of 184 elderly residents (35-40 per site) all but one of who had a primary diagnosis
of dementia were living in the facilities at the time of the study The average Mini-Mental State
Examination (MMSE) score (Folstein Folstein amp McHugh 1975) across sites was 132 + 15
(M+SE) and specific within site means were 122 ASB 153 MDR and MPN 161 MPW and 84
WDS On average the percent of males at the centres was 240 + 66 range 11-31 Discharge criteria
relating to mobility and sociability common across the sites included loss of mobility requiring
maximum assistance with activities of daily living unable to participate in activities unmanageable
incontinence and risk to self or others The total staff employed at the five sites (22-43 per site) was
197 The number of direct care staff that residents were likely to encounter (full-time and full-time
equivalents of part time care supervisors (LPNs) and caregivers) ranged from 19 to 28 across sites
Mapping Five Sites
6 of 47
for a mean of 234+28 The reported daytime ratio of residents to care staff was 51 at WDS and
MDR and 61 at MPN MPW and ASB This ratio continued most of the evening dropping at night
to 91 at WDS 121 at MPN and MPW and 131 at MDR and ASB
Procedures
Environmental Survey
The Therapeutic Environment Screening Scalendash2+ Revised was used to assess general design
features (subsequently referred to as TESS-2+) The scale is an observational checklist that is used to
describe the ability of the physical environment of a long-term care institutional setting to address the
therapeutic goals of nursing home and residential care residents with dementia (Lawton Weisman
Sloane amp Calkins 1997) A number of versions were in circulation The TESS-2+ was used in the
National Institute on Aging (NIA) (1993) special care unit collaborative studies Current formats are
for nursing homes (TESS-NH Sloane et al 2005
httppsychsocgerontologyjournalsorgcgicontentabstract572S69) and residential care settings
(TESS-NHRC
httpwwwuncedudeptstessnhpdf_filesTess20NHRC20Revised201_14_02pdf) The 37-
item TESS-2+ checklist consists of discrete items measuring a range of environmental domains such
as exit control maintenance and safety (listed in the first column of Table 2) as well as three global
evaluative ratings staff interaction resident involvement in activities and physical environmental
atmosphere Psychometric properties include interrater reliability for TESS-2+ items ranging from
67 to 100 agreement (Sloane et al 1998) The items on the TESS-2+ can be considered to point
out areas where a site meets best practice standards for dementia design The TESS-2+ data were
expected to provide an assessment of the physical differences in the five sites and thus a potentially
useful set of measures for understanding differences in the use of the five facilities
Mapping Five Sites
7 of 47
Data Collection and Analysis
We collected information on principal characteristics relating to physical features staff
volunteers residents and care programming retrospectively from site records of April and May of
1998 The assessment of physical features included a review of floor plans and records of
maintenance requests On-site observation was done to complete the TESS-2+ The interrater
reliability of TESS-2+ ratings was assured by prior tests of the agreement between observers
Although an observer typically uses the scale to assess a dementia unit in a nursing home in this
study the assessment was of the five small purpose-designed settings (the third author completed the
TESS for ASB MDR and WDS the first and second authors did MPN and MPW) During the NIA
studies the scale was used not only for special care units but also some entire sites (Sloane et al
2002) and Slaughter Calkins Eliasziw and Reimer (2006) found this version of the TESS useful to
distinguish between purpose-built dementia care facilities and traditional care facilities
The Special Care Unit Environmental Quality Scale (SCUEQS) was used to score the
TESS-2+ using a method previously described (Sloane et al 2002 Lawton et al 2000) The 18-item
SCUEQS subscale derived from the TESS-2+ was determined to be a robust measure of overall
environmental quality during the NIA studies Scores can range between 0 and 41 with 41 being a
better environment for persons with dementia Internal consistency of this scale was measured using
Cronbach coefficient alpha (α 5082) (Sloane et al 1998) In addition using a method developed by
Slaughter et al (2006) a composite score the Composite Above Average Quality Score (CAAQS)
was calculated using all items from the TESS-2+ A value of 1 was assigned if the rating for the
center was above the middle of the range for the item (ie midpoints are shown in column four of
Table 2) and if equal to or below the midpoint the assigned score was 0 For each cluster of centres
(the 20 capacity houses of ASB and MRD and the 12 capacity houses of MPN MPW and WDS) the
resulting binary scores representing each of the 14 domains in the TESS-2+ were summed and a
percentage of 14 was calculated to facilitate comparison with the data of Slaughter et al (2006) This
Mapping Five Sites
8 of 47
number represents the percentage of domains that were above average in quality for the site Group
means were then used to compare results on the SCUEQS and the CAAQS for the 20-capacity and
the 12-capacity sites
Behavior Mapping
The principal method of behavioral mapping used place-centered instantaneous scans which
provides systematic samples of behaviors This is one of the least intrusive methods for direct
observation (Lehrner 1979) During behavioral mapping the observer at set intervals quickly notes
the activity of people within an area and moves on to other areas These scans are much less invasive
than continuous observation and with momentary scans interobserver reliability is inherently better
Often observation is considered the gold standard for collecting behavioral data but there is a
concern that the presence of an observer influences the behavior (typically to more socially
acceptable behavior) During scans the observer quickly passes through the spaces of interest
allowing very little time for those present to adjust their activity
The data were collected by on-site staff familiar with facility routines following instructions
in a procedure manual written by the first author Thus the collection of data across sites followed a
standardized methodology including the use of common behavioral categories common floor-plan
notation preprinted checklist sheets trained paid observers and time-locked sampling Approval for
direct observation as described was obtained appropriate to each jurisdiction Observers learned
mutually exclusive and comprehensive definitions a standard procedure for ethogramatic checklists
for nine categories of behaviors On each of two days at each site they directly observed activities of
persons in public areas following a systematic protocol Every hour over 14 hours they toured public
spaces noting the subjectrsquos group (resident staff family others) and the type time and location of
the activity (Martin amp Bateson 1987 Sommer and Sommer 1986) Information was written upon
copies of site floor plans The identity of individuals was not recorded General activity categories
included just sitting (inactively) activities of daily living (ADLs eg self-care grooming washing
Mapping Five Sites
9 of 47
eating taking medications) light housekeeping leisure disruptive behavior walking watching and
miscellaneous behaviors Communication was indicated as an independent action because it could
occur concurrently with any of the activity categories
Information about activities at each of the five sites included a description and schedule of
daily and special occasion events for residents average attendance of residents at programmed events
of each type the procedures for intervening when problem behaviors arose definition of problem
behaviors and the average weekly incidence of problem behaviors (not presented) The interpretation
of data from Behavior Mapping benefited from this information
Sampling and Data Analysis
Behavioral mapping included all care staff volunteers family members residents and others
over a two-weekday period in early June at each site except at MDR where data collection was on
two sunny days in September that were comparable to June weather Observations were made each
hour between 0730 and 2130 hours for a total of 15 scans per day They were conducted in all public
spaces at each site excluding rooms bathing rooms toilets and bedrooms as well as areas used
exclusively by staff Two observers were trained at each site to collect the data to a criterion of at
least 85 agreement on location person and behavioral categories Behavior observations were
collated by site by activity and time-of-day format
Results
Floor Plan Comparisons
Building orientation varied across sites as did the views of outdoor gardens (floor plans in
Fig 1-5) Table 1 lists some of the most salient similarities and differences between the sites
Each building had residential wings referred to as houses with residentially scaled rooms
linked by a common area shared by all houses (Figures 1-5) The common areas in all sites included
Mapping Five Sites
10 of 47
a great room a fireplace seating area at least one activity or craft room a family or private dining
room and a beauty salon
Insert Figures 1-5 and Table 1 about here
Overall the floor plans of ASB and MDR were very similar as were the plans of the other
three centers MPN MPW and WDS In the latter three centres the houses were equivalent to the
three parallel wings flanked by courtyards that is outdoor spaces with natural green elements and a
view to the sky Each wing was self-contained each had a kitchen livingdining room and laundry
and a room for bathing or showering Each wing had a central hallway with bedrooms running its
length on either side accommodating 12 residents ASB and MDR floor plans had two perpendicular
housing areas comprised of two parallel wings The architects viewed this design as four houses each
accommodating 10 residents Each bedroom hallway and one living area was considered a house and
a pair of houses was viewed as sharing a kitchen The kitchen was planned as a hub for staff assigned
to the two bedroom hallways and a place to locate a staff-buddy for a task (DiMotta amp Hoglund
2000) However at ASB for example the arrangement of furniture with glider-rocking chairs
arranged primarily in one dining-living space and tables placed in the dining-living area on the other
side of the kitchen suggested that more than the kitchen was being shared and that these common
rooms were being used as a continuous space for all 20 residents to share In gathering data from
management and staff there was no evidence that staff and residents were treating a particular
dining-living room as being the domain of just one hallway of residents Moreover ASB staff said
residents housed in bedrooms along one hall were frequently found in the other bedroom hall
Mealtime seating varied for breakfast lunch and dinner but the variation was not related to
Mapping Five Sites
11 of 47
residentsrsquo home hallway Consequently each U-shaped housing area in ASB and MDR was
considered a house for the purposes of this study
House kitchens differed across sites At ASB and MPW these were large country kitchens
but at other sites the kitchens were small At WDS kitchens were designated as ldquoserveriesrdquo Some
sites had activity areas or rooms in the common areas In the fireplace seating area adjacent to
WDSrsquos country kitchen (but not within the country kitchen) were a large dining table and matching
chairs An open wall above a bar-type counter allowed items to be passed from the country kitchen
This made the space more flexible because it was not viewed as a special events venue like the
enclosed private dining rooms in the other four centers It also encouraged various activities to be
conducted on this dining table that were not scheduled for the common areas in the other centers
Table 1 supplements this descriptive comparison
The common features included floor plans designed for small group living (houses of 12 or
20) in self-contained houses with spaces for cooking eating bathing and gatherings bedroom
hallways that are short by facility standards (yet long for family dwellings) a variety of common
spaces and informal staff workspaces but no formal nursing stations (Table1) Differences in
general design between sites were also in quantitative measures for example the number of beds
ranged from 36 to 40 the number of public rooms ranged from 11 to 17 (Table 1) and most striking
the seating capacity in public rooms varied from 165 to 232 (Table 1) with ASB and MDR having
somewhat less capacity than MPN and MPW Inspection of floor plans showing chair location (data
not shown) revealed that the differences in numbers of seats between sites were principally in the
houses kitchen and livingdining areas implying that the site differences in these floor plan areas
were relevant
Mapping Five Sites
12 of 47
Therapeutic Environment Screening Scale
Environmental characteristics were described using the 38-item Therapeutic Environment
Screening Scale (TESS-2+) Designees at each site filled out the form after training by one of the
authors of the study who was experienced in using the scale Interrater agreement was assured by
comparing interpretations and ratings consensus was reached on any issues related to scoring
Interrater reliability for TESS-2+ items had ranged from 67 to 100 agreement (Sloane et al
1998) There were no significant differences in the mean domain scores between the sites that had
12-capacity houses and those with 20-capacity houses (Table 2) The findings are presented by
grouping the items into two types of goals and domains those associated with the general site design
that may be more architecturally based and those more aligned with interior design site operations
and providing care
Insert Table 2 about here
General Design The scores related to the therapeutic goals and domains for building design
were similar across sites reflecting the implementation of the basic Woodside building model
(Table 2 Exit control Orientation and cuing Privacy and Functional ability Physical
attractiveness) All sites in this study had strategies for exit control (Table 2 2andash2h) WDS had both
alarms and keypad-locks on external exits while the other sites had keypad-locks MPN and MPW
had a reception desk at the front entrance as a clerk-observation post At ASB and MPW the external
exits were partially disguised at the other sites they were not (Table 2 3a 3b)
Mapping Five Sites
13 of 47
Orientation and cuing is related to residentsrsquo personal safety and self-awareness thus the
photos and names beside the bedrooms doorways which all sites used are important (Table 2 27
28 29) as in the ldquotip of the tongue phenomenonrdquo they need a cue to retrieve the memory (Zeisel
1998) An open interior plan that allows residents to see into public rooms is an optimal way finding
strategy for persons with dementia all sites employed this The strategic location of cues and
personal items can also aid way finding Although institutional-style directional signage is eschewed
on restroom doors for example both graphics and labels are advised Open floor plans often require
few signs MDR had the most signs and MPW used the fewest graphics and signs with other sites
having intermediate numbers (Table 2 19 20) Large windows that provide natural exterior views
(Table 2 4) are not only attractive they are another tactic that serves way finding and also provides
seasonal orientation in the latitudes of these five sites The entrances of residentsrsquo bedrooms were
personalized at all sites (Table 2 27 28 29) Redundancy is recommended and a greater variety of
items were used at ASB MDR WDS and MPN than at MPW for this purpose
All five sites scored well on supporting functional ability (Table 2 16 17 18) that is either
slowing decline or stimulating improvement which is something for which sites designed for
dementia have been associated (Benson Cameron Humback Servino amp Gambert 1987 Greene
Asp amp Crane 1985 Innes amp Surr 2001 McCracken amp Fitzwater 1989 Rabig Thomas Kane
Cutler amp McAlilly 2006 Rule Milke Dobbs 1992 Silverman et al 1995 Skea amp Lindesay 1996
Warren 1998)
Interior Design and Approach to Care The first goal of this type is safety security and
health with domains (besides exit control discussed above) of Maintenance Cleanliness Lack of
odors and Safety (of floors) A second goal is Stimulation and a third is Socialization Slaughter et
al (2006) viewed these as basic requirements and found no significant differences in these goals
when comparing the 6 special care facilities (bungalows) with the 45 units in traditional institutional
facilities so it is not surprising that the same was true for these highly similar sites
Mapping Five Sites
14 of 47
Stimulation domains include Lighting Tactile and Visual stimulation as well as Quietness
Both sensory deprivation and over-stimulation are viewed as problems (Brawley 1997 Day
Carreon amp Stump 2000 Cronin-Golumb 1995) According to Zeisel Hyde amp Levkoff (1994)
appropriate levels of stimulation results from having a site with a high sensory comprehension
ranking so not necessarily the overall calmest setting but rather one with a moderate amount of
sensory input that residents can understand Ambient lighting was considered good in all sites with
minimal glare from a number of reflecting surfaces such as picture windows and French doors (Table
2 21) Lighting was evenly distributed and levels were considered ample (Table 2 22 23) with the
exception of MPN Ambient auditory noise was not deemed a problem whether considering type or
level of noise (Table 2 24 25) The general availability of things to touch in common areas such as
those that invite handling or folding was somewhat less at ASB and MDR than at other sites
Overall ratings of home likeness and the individuality of residentsrsquo appearance were
consistently good but the general atmosphere influenced by residentsrsquo lower overall levels of
participation in activities and a less positive rating for staff interactions with residents resulted in
MDR scoring lower that other sites (Table 2 15 31 32 36) WDS scored in the mid-range on
residentsrsquo involvement but as indicated above its residents had much lower MMSE scores At all
sites personal pictures or mementos were in most residentsrsquo bedrooms However such items were
not present in common rooms at MDR
The mean SCUEQS scores (Table 2) which summarized a subset of the TESS-2+ items
were not significantly different between the sites that had 12-capacity houses and those with 20-
capacity houses The SCUEQS had been derived for the NIA studies of special care units and was
considered by experts to measure important aspect of the physical environment and serve as a
reliable measure for differentiating better nursing units and assessing the overall environmental
quality (Sloane et al 2002) The results appear to justify the architectsrsquo design decisions that resulted
in two hallways of 10 residents sharing the large kitchen and the living-dining rooms Slaughter et al
Mapping Five Sites
15 of 47
(2006) devised another composite score the Composite Above Average Quality Score (CAAQS)
which they found to be more sensitive than the SCUEQS The CAAQS represents the percentage of
domains that were above average in quality It revealed a difference between the sites with 12-
capacity houses (857) and those with 20-capacity houses (786) that was not shown by the
SCUEQS but the difference was not significant
Behavioral Mapping
Reliability The number and category (staff family or resident) of persons observed at each location
was recorded on floor plans in successive behavior scans one hour apart over the course of two
days Interobserver reliability of the scans was assessed at each site Cohenrsquos kappa a measure of
agreement between observers has a range from 0 no agreement to 100 total agreement Fleiss
(1981) characterized a kappa of 4 to 6 as fair 6 to 75 as good and over 75 as excellent There was
good agreement on average between two independent observers on the identification of behaviors
observed Kappa mean (SD) 0851 (04) and excellent agreement on identification of people being
scanned as residents staff family or others kappa mean (SD) 0732 (07)
Observations Fifteen observation periods or scans per day were conducted one per hour during
the two days of observation Examination of the within-site data revealed that the only differences
were day differences in specific scans related to the occurrence of special events eg barbecues
Consequently the data were collapsed across days A scan of about 10 minutes in duration was
required to count people in all public areas Observers minimized the possibility of counting the same
person in more than one room during a scan by following a preplanned path through the building and
working quickly Counts of sightings of staff family and volunteers and residents by hour in each
Mapping Five Sites
16 of 47
area of each site were summed over the two-day period of observation To assist the description of
the findings resident data were subsequently adjusted to show the mean percent of residents at a site
who were observed per scan per day and to show the percent of scans in which residents were
involved in a particular activity or seen in a particular room or area
Staff and Family Observations of staff and family are presented without data as these were
ancillary to the principal focus on residents Staff were seen most often in the house kitchens or
diningliving rooms across all sites except WDS At WDS staff were seen in the kitchens but
seldom in the diningliving rooms In all three sites with 12-capacity houses the central house was a
hub of staff activity with nearly twice as many staff seen in that kitchen (or an adjacent room which
was the dining room in MPN and MPW but was a hallway in WDS) as in the kitchens of the houses
on either side WDS staff were also seen in the seating area outside the great room nearly as much as
in the house kitchens Residents were seldom engaged in an activity when staff were not around eg
see Figure 6 for MPN This is not surprising because persons with Alzheimer disease lose their
ability to initiate activities (Colling 1999 Lee et al 2006) Others have shown that appropriate
environments are not sufficient residents with this disease need activities and all five sites employed
activity coordinators (Grant 1998 Van Haitsma Lawton amp Kleban 2000 Voelkl 2006)
Insert Figure 6 about here
Family members were at some sites as early as 830 am and as late as 930 pm although at
MPN all visits except one were in the afternoon ASB had a family meeting increasing the number
Mapping Five Sites
17 of 47
of sightings of family members to 42 (19 were associated with the meeting) The numbers of
sightings of family members over the two days of observation at other sites were WDS ndash 27 MPN ndash
23 and MDR and MPN ndash 12 each
Insert Tables 3 and 4 about here
Resident Locations Direct observation revealed a pattern of use that was unexpected and not
evident in TESS results Overall resident sightings were at least 25 higher at WDS than at the
other four sites (Table 3) The number of sightings in the common areas of WDS was over 60
greater than those at any other site (Table 3) Residents were most frequently seen in the area just
outside the great room (Table 4) By contrast at all other sites residents spent more time (60 of
sightings) in their houses (Table 4) ASB where residents spent 80 of their time in their houses
represented the extreme in this regard with the other sites being intermediate between ASB and WDS
(Table 4) Differences did not appear to align with whether the houses were of 20- or 12-capacity At
all sites residents were seen most frequently in the common areas outside of the houses with the
common hallways the great room and fireplace seating area accounting for decreasing numbers of
residents in that order (Table 4) however a stylist in the ASB beauty salon drew a crowd showing
how an occasional event can change behavior patterns At the sites with 12-capacity houses and
television rooms those rooms were popular and drew as many residents as the fireplace area
The large percent (396) of residents seen in common areas at WDS was attributable to
sightings in the common hallway and fireplace seating area next to the School House (Figure 5
Table 4) All residents could be gathered in the area which was slightly larger than the great room
Mapping Five Sites
18 of 47
observers noted a continuous round of activities involving groups of varying sizes No other site used
this area as intensely At WDS a day program brought in 8 additional residents and several staff who
ran activities that attracted some residents (discussions newspaper reading crafts) Observers were
asked not to count persons associated with the day program in their tally but the heavy use of the
central space and the day program activities presented there had some influence ASB and MDR also
had day programs that used separate spaces for that purpose so program participants were not seen
Chairs lining the walls in this area of WDS augmenting seating arrangements in front of and on
either side of the fireplace as well as oversized displays of small snapshots on several walls resulted
in an institutional appearance Local lore attributes the lineup of chairs to residents who initiated it
shortly after move-in Staff moved chairs back where the interior designers located them but
residents would pull them back across the corridor in a line until staff gave up
Site differences in the use of the great room were noteworthy ASB appeared to use it only
for church services on a regular basis with ldquoaudience-seatingrdquo left in place from day-to-day
Possibly this was because this great room was relatively distant from the houses (Figure 1) In WDS
MPN and MPW great room seating was rearranged throughout the day to accommodate numerous
events MPN and MPW used the great room like a town hall holding events such as afternoon teas
dances and musical entertainment At MDR small numbers of residents were in the great room
throughout the day but no large gatherings were seen
Within sites the sightings of residents in the houses were distributed fairly evenly across the
houses (Figures 1-5 Table 3) Residents were most often seen in the living-dining rooms and as
noted above staff were most often seen in the adjacent kitchens The exception was WDS where the
house design did not provide a good line of sight for staff between the kitchens and the living-dining
rooms (Figures 4 amp 5) Staff at all other sites could work in kitchens and keep an eye on residents
WDS staff actively encouraged residents to leave dining rooms after a meal and join activities in the
central area likely for two reasons because activities were not planned for the houses and because
Mapping Five Sites
19 of 47
staff working in the houses could not easily monitor a resident who remained in the house living-
dining room WDS staff were rarely seen in the housesrsquo living-dining rooms The School House the
centre house accounted for the majority of residents observed across all houses This kitchen
adjacent to the highly used area just outside the Great Room provided a relatively good monitoring
station for the house and activities in the common areas At WDS mealtimes two common areas
were used residents who needed substantial assistance with meals were often fed in the craft room
and a high-functioning group ate at the dining table alongside the fireplace seating
In the houses at other sites most sightings of residents were in the diningliving room areas
Fewer were in the kitchen and fewer still in the house hallways (Table 3) At MDR only one area
adjacent to the kitchen was devoted to dining and almost no residents were seen in kitchens The
same was not true at ASB where approximately the same proportions of residents were seen in the
shared kitchens as in each of the living-dining rooms on either side (Table 3 sums all four living-
dining rooms) However at ASB the numbers were likely from residents moving between the two
diningliving rooms and passing through the kitchens (Figure 1) because residents were rarely
engaged in the type of tasks encouraged at MPN and MPW (ie handling dishes setting tables etc
to encourage maintenance of their functional abilities Figure 7) Interestingly the highly similar sites
found different ways to use their spaces and different approaches to activities
ASB MPW and WDS held barbecues during the days of observation (Table 3) This meant
the residentsrsquo presence in the kitchen and dining areas was reduced at those meals Accordingly for
comparison across sites dining area sightings were adjusted by adding mealtime sightings in the
courtyards The peak periods for resident sightings were during the midday lunch (1130-1330) and
evening meals (1630-1830) (Table 5) Even so sightings of residents at mealtimes were only 66-
80 of occupancy indicating eight to ten residents were not seen at mealtimes in public areas at
most sites (Table 5) The exception was WDS where sightings indicated nearly all residents were
observed in public areas at mealtimes (Table 5) although WDS residents did not gather in the house
Mapping Five Sites
20 of 47
dining areas for the noon meal With most activities occurring in the core of the building WDS was
flexible about meal arrangements serving meals where residents were located such as the area
outside the great room on an activity room Residents were not required to return to their own houses
to eat They could join day program residents and eat in the common area or join residents in another
house One group of women was known for asking to eat together on their own in the common area
WDS also led other sites in the number of residents observed at other times of the day (Table 5) The
differences were especially marked in the afternoon between meals (1330-1630) and the period
after the evening meal (1830-2130) This suggests that WDS staff may have been viewing the
central areas like they would the central areas of a unit in a nursing home on dementia units staff
often prefer that residents stay in view and not return to their rooms
Resident Activity The observed activity patterns were surprising considering high levels of
resident inactivity reported for nursing home residents (Gottesman amp Bourestom 1974 Ice 2002)
Gottesman and Bourestomrsquos (1974) observations in 40 nursing homes revealed that residents spent
56 of their time during peak daylight hours engaged in no activity or passive activity In that study
residents were involved in personal care television and socializing for 43 of the time Ice (2002)
reprised the Gottesman and Bourestom study and found residents spent 65 of their time doing little
or nothing with only 12 in social activities (Ice 2002) In the present study observations of Just
Sitting and Watching were expected to measure levels of passive behaviors Residents in the five
sites appeared to be engaged in ADLs and Leisure for greater amounts of time than in Just Sitting
and Watching (although small amounts of napping as passive behavior were coded as
Miscellaneous) but this was not significant (Figure 7) Chi-square analysis using phi coefficients
found that residents at WDS engaged significantly less in ADLs than residents in other centres
(plt00001) residents at ASB MPN amp WDS were engaged less in leisure (plt005 each) ASB
Mapping Five Sites
21 of 47
residents were engaged less in Just Sitting (plt00005) and residents were observed Watching less at
MDR MPN amp MPW (plt00005 each) Leisure was the most frequently observed activity for MDR
MPN and MPW the second most frequent at ASB and the third at WDS Recreational activities
both planned and informal activities were considered to be Leisure thus watching TV or waiting to
be served at a coffee party were both coded as being Leisure (persons who were within the group and
actively attending to events but not actively engaged at the moment were coded as Leisure too and
this was distinguished from Watching which was defined as ldquoattending to activities or interactions of
others from a distance such as from a doorway watching a streetrdquo)
Insert Figure 7 about here
The ADLs were the second most frequently seen activity for MDR MPN and MPW and the
third for ASB but were seen much less at WDS The majority of ADLs across sites occurred at meal
times indicating they involved dining (ASB 570 MDR 590 MPN 758 MPW 736 but
WDS 422) The low percent of time spent by WDS residents on ADLs during the evening meal
time (42) agrees with the low number of sightings in the dining area at that time (385 of max)
It appears that WDS residents sat watched and walked but did not spend much time eating
(Figure 7) In contrast previous research at MPN and MPW has found mealtimes to be the longest
duration behavior Scans needed to be one hour apart to avoid seeing meals on two consecutive scans
and oversampling the behavior (Milke et al 2000)
Work that is tasks such as housekeeping and cooking were not seen at either of the sites
with 20-capacity houses but this is the only difference evident when compared with the 12-capacity
Mapping Five Sites
22 of 47
houses Compared to other sites MPN and MPW residents engaged in moderate proportions of all
behaviors (Figure 7) Residents at WDS spent proportionately less time on ADLs light
housekeeping and Leisure and more time at Walking Watching and Just Sitting Chi-square
analysis using phi coefficients showed that residents were observed Walking significantly less at
MDR (plt 005) residents at ASB and MDR engaged significantly less in Work and there were no
significant differences between sites in Miscellaneous activities (Figure 7)
Observersrsquo Notes
Some large differences were found in the care programs across sites Observersrsquo notes
indicated that at MPN and MPW residents were encouraged to be involved in the daily routine of the
facility and direct care staff ate meals with residents This strategy was said to stimulate conversation
and provide residents with a model for appropriate behavior Staff played the role of ldquomotherrdquo rising
to find an item in the kitchen and keeping an eye on food consumption Managers at MPN and MPW
considered this role an essential component of care At ASB MDR and WDS there was no evidence
of such a role
Most cooking was done in facility kitchens away from areas that residents could access This
tended to result in the house kitchens being treated more like institutional serveries Fridges mainly
contained large juice jugs and prepared snacks However at MPW and MPN when a resident opened
the fridge door the door was full of condiments and casseroles it looked just like home because of
an effort to keep institutional sized packages to a minimum These two sites used their kitchens quite
differently than the other three sites At MPN and MPW all breakfasts and snacks were prepared in
the houses each day by direct care staff On four weekdays lunches also were prepared Residents
were invited to participate in some of the chopping slicing and mixing which was considered an
essential component of the care program When meals were delivered from nearby facility kitchens
staff decanted items into family-size serving bowls They added condiments and poured drinks
Mapping Five Sites
23 of 47
serving the meals much like those prepared in-house Although residents helping with meal
preparation appeared to be limited to MPN and MPW staff records indicated additional forms of
daily and special occasion activities occurred at all sites Daily activities included easy tasks eg
folding laundry and exercises at all five sites discussion groups at MDR and WDS religious
activities at ASB MPN and MPW musicsinging at ASB MPW and WDS movies at ASB and
grooming at all sites except WDS
Outdoor courtyards were accessible to residents on the observation days at all sites The
barbecue meal at MPW drew the highest number of residents outside but from mid-morning until
early evening residents were seen on the patios or walkways This was true at every site except
MDR where few ventured outside (data not presented)
Disruptive behaviors were seen only at ASB where at 730 am 230 pm and 430 pm a
single resident was disruptive Whether this was the same or different resident is not known the
identity of persons was not recorded This accounted for only 03 of all behaviors seen at ASB (and
was not shown on Figure 7)
Discussion
The TESS-2+scale results clearly indicated that the pioneering WDS site and the four sites
modeled on it met best practice standards in many areas These include the ratings for global site
assessment overall configuration of self-contained living arrangements with adjacent common
spaces informal workspaces for staff and accessible outdoor green spaces walking paths and
maintenance More pertinent to the present study there were no significant differences between the
sites that had 12-capacity houses and those with 20-capacity houses on any TESS items the NIA
subscale of overall environmental quality (SCUEQS) or CAAQS the composite score devised by
Mapping Five Sites
24 of 47
Slaughter et al (2006) Sites with 20-capacity houses did not look substantially different from sites
with 12-capacity houses according to the scale
Behavioral Mapping
A principal finding from behavioral mapping was the amount of time residents were found
engaged in leisure activity at all five sites Leisure was the most frequently observed activity for
MDR MPN and MPW the second most frequent at ASB and the third at WDS The level of
participation in meaningful activities is considered an important measure of residentsrsquo quality of life
(Gonzalez-Salvador et al 2000 Zimmerman et al 2005) Although the extent of engagement is
typically measured in more focused and intensive ways the fact that observers saw residents who
were alert and watching an activity is meaningful because observers were asked to distinguish
whether the resident was ldquojust sittingrdquo or ldquowatchingrdquo if that was the extent of the involvement When
percentages of time spent in Leisure are combined with Activities of Daily Living following the lead
of Gottesman and Bourestom (1974) who combined personal care television and socializing the
results in this study are ASB 468 MDR 701 MPN 471 and MPW 483 All percentages
total are better than the 1974 studyrsquos 43 Only WDS with 261 was substantially worse and that
was largely because so little time was devoted to the evening meal Ice (2002) studying one site had
found only 12 of time spent in social activities however little time was spent Just Sitting or
Watching For the five sites in this study total percentages of these inactive behaviors are ASB
316 MDR 171 MPN 229 MPW 176 and WDS 402 which are all substantially
different than Gottesman and Bourestomrsquos finding of 56 of time engaged in no activity or passive
activity or the 65 seen by (Ice 2002)
Surprisingly the five sites differed in the percent of maximum possible number of sightings
of residents observed in public areas per scan per day ranging from 49 at MDR to 80 at WDS
This range of 38 difference between the lowest and highest sites is considerable The traditional
concern of staff is that residents who stay in their rooms miss out on socialization and planned
Mapping Five Sites
25 of 47
activities (Grade 1976 Hogden 1985) The public areas most frequented by WDS residents were the
fireplace area and the common hallway area At most sites if the residents were not observed in the
common areas it would be likely that they were in the house areas This was confirmed in the other
principal finding that the percent of maximum possible sightings in the house areas was lowest for
WDS at 25 and highest at ASB at 50 At ASB residents spent 80 of their time in their two
houses At WDS they were encouraged to spend their time in the common areas and they did The
houses were used very differently at the two sites and this may have been because the architects who
were very involved in both sites made it evident that they were intended to be used differently
However the use of communal spaces often has little to do with the intended purpose Lawton
(1970) reports that in 10 observational rounds of a facility a total of 13 people were observed in the
nine social rooms on the nine floors while 79 were counted in the main floor social room where
arrivals and departures could be observed Similarly areas around nursing stations and elevators
frequently draw residents (Lawton 1970 Lawton 1977 Snyder 1980)
A number of factors can be ruled out in the search for unique characteristics of WDS that
could have contributed to the above findings The first factor is the reliability of the observers It is
unlikely that the differences were due to variability in the observational skillsprocedures of the
observers because of the high level of agreement in the assessment of interobserver reliability and
because all observers followed the same protocol in collecting the data The observersrsquo reliability was
also attested to by the similarity of the data within sites across the two days of data collection The
second factor is the general floor plan WDS shared the same basic floor plan with MPN and MPW a
building footprint like the capital letter E So it is unlikely that the gross outer shape of the floor plan
was relevant The third more general factor is related to the inter-site comparability of the TESS-2+
data These data indicate that the five sites were remarkably similar in general and internal design
features WDS has ratings on all measures that were comparable to one or more of the other sites
Mapping Five Sites
26 of 47
including potentially relevant measures such as the presence of homelike features the degree of
interaction with staff and residentsrsquo involvement in activities
There are however a number of other factors that may be relevant to understanding the
WDS data WDS was the only site in which meals were served in the common areas as well as in the
house dining rooms Congruently as already noted the highest number of resident sightings at WDS
was in the common areas (fireplace and common hallway) and most of these common area sightings
were in the common areas of WDS adjacent to the central area of the three houses Importantly these
were the only common areas with a direct line of sight to the central hall and kitchen of the central
house (School House) Staff notes indicated that the number of meal servings from the central house
kitchen was twice as high as that of the kitchens of the other two houses at WDS Again there is
congruence resident sightings in the central house dining room although low relative to central
common areas were twice as high as in the dining rooms of the other two houses at WDS It is also
relevant that staff used all parts of the central common area for activity programming Thus it seems
probable that several factors including the internal floor plan meal service and activity
programming made the central common areas of WDS a multiuse area which resulted in high
number of resident sightings though out the day with peaks at meal times It is worth asking whether
WDS staff would have used the central common area so intensely if the house kitchens had been
aligned with the dining rooms providing staff with oversight as in MPN and MPW
These observations could also explain another WDS anomaly that is the low number
of residents seen to be engaged in ADL activities at meal times compared to other sites If the
lower-functioning residents at WDS engaged in other activities in the central common areas
perhaps abandoning a meal to walk or sit elsewhere that could result in fewer observations
of eating during the mealtime Conversely it could mean that it would be more likely that
Mapping Five Sites
27 of 47
other activities (ie watching walking sitting and leisure activities) would be seen during
meal times which was the case in WDS
Finally the unique features of the WDS resident sighting data may have been related to the
greater degree of dementia (lower than average MMSE scores) of WDS residents The average
MMSE scores at other sites were 50 to 100 higher indicating less severe symptoms than the
average WDS score Congruently WDS had relatively high levels of sightings of sitting watching
and walking behavior and the highest number of pacing incidents Thus it is possible that the
differences in degree of dementia between sites and the related differences in levels of ambulation
made it more likely that WDS residents would leave their rooms and therefore WDS residents would
be sighted most frequently in the common areas of the WDS facility
It is important to note that no substantial differences were found between the 20-capacity
and 12-capacity houses that is in the mean domain scores of the TESS which was used to describe
environmental characteristics Scores were much the same across the five sites The TESS has goals
and domains aligned with the general site design which are more architecturally based and those
best aligned with interior design site operations and providing care
The architects might have thought their design at ASB and MDR would result in a small care
group of 10 and that residents along each bedroom hall would form a household but this did not
happen The residents in the 20-capacity houses did not form a 20-resident cluster either instead they
formed small groups for eating and activities Therefore other factors such as early or late rising or
naturally-formed friendships may be a greater influence than bedroom proximity The addition of
eight more residents per house might be anticipated to lead to crowding in the housesrsquo living-dining
areas or some other notable difference However crowding was not evident in the 20-capacity
houses In fact WDS gatherings in the common areas were more apt to be viewed as crowds
Mapping Five Sites
28 of 47
Observations indicated there that Disruptive Behavior often attributed to crowding was rare It
occurred in only one site and therefore could not be associated with a particular design
These observational results combined with the TESS results have broad implications for
future studies The first implication is methodological and the second is empirical Methodologically
the combination of architectural and behavioral measures in studies of facilities for the elderly
highlights the advantages over methodologies that employ only behavioral measures eg Dementia
Care Mapping (Brooker 2005 Fulton Edelman amp Kuhn 2006 Sloane Brooker Cohen et al
2007) and over studies that rely on client interviews (Kane 2003) Empirically 20 residents in a
house is approaching the size of dementia units in some nursing homes The present study revealed
that the main difference seen in the operation of the 12-resident house and the 20-resident house
design was that the latter appeared to hold more activities within the house raising questions about
the value and need for those common spaces whereas the former made more use of the common
spaces for activities In this way behavior was affected by the house design and by the way that staff
chose to organize activities
Mapping Five Sites
29 of 47
References
Benson D M Cameron D Humbach E Servino L amp Gambert S R (1987) Establishment and
impact of a dementia unit within the nursing home Journal of the American Geriatrics Society
35 319-323
Brawley E C (1997) Designing for Alzheimerrsquos disease Strategies for creating better care
environments New York Wiley
Brooker D (2005) Dementia Care Mapping A review of the research literature The Gerontologist
45 Special Issue I 11ndash18
Calkins M P Meehan R A amp Lipstreuer E (1999) Creekview Its history and evaluation
Kirtland OH IDEAS Inc
Colling K B (1999) Passive behaviors in Alzheimer disease A descriptive analysis American
Journal of Alzheimers Disease and Other Dementias 14 27-40
Cronin-Golumb A (1995) Vision in Alzheimerrsquos disease The Gerontologist 35 370-376
Day K Carreon D amp Stump C (2000) The therapeutic design of environments for people with
dementia A review of the empirical research The Gerontologist 40 397-416
Deely B Klingensmith L amp Silverman M (1995) Developing a residential Alzheimers facility
Focus on Geriatric Care and Rehabilitation 8(7) 1-8
DiMotta S Dubney B M Hoglund J D amp Kershner C (1993) Long-term care design Blazing
new territory - code reform and beyond Journal of Healthcare Design 5 197-203
DiMotta S amp Hoglund J D (2000) Woodside Place A residential care model for the Alzheimerrsquos
and dementia resident Symposium on Healthcare Design Anaheim CA Center for Healthcare
Design
Mapping Five Sites
30 of 47
Doty M M Koren M J amp Sturla E L (2008) Culture change in nursing homes How far have
we come Findings from The Commonwealth Fund 2007 National Survey of Nursing Homes
New York The Commonwealth Fund
Edelman P Fulton B R Kuhn D amp Chang C H (2005) A comparison of three methods of
measuring dementia-specific quality of life Perspectives of residents staff and observers The
Gerontologist 45 27-36
Fleiss J L (1981) Statistical methods for rates and proportions (2nd ed) New York John Wiley amp
Son
Folstein M F Folstein S E amp McHugh P R (1975) Mini-Mental State a practical method for
grading the cognitive state of patients for the clinician Journal of Geriatric Research 12 189-
198
Fulton B R Edelman P amp Kuhn D (2006) Streamlined models of dementia care mapping
Aging amp Mental Health 10 343-351
Gold D T (1991) A descriptive typology of dementia units In P D Sloane amp L J Mathew (Eds)
Dementia units in long-term care (pp 50-61) Baltimore Johns Hopkins University Press
Gonzalez-Salvador T Lyketsos C G Baker A Hovanec L Roques C Brandt J et al (2000)
Quality of Life in dementia patients in long-term care International Journal of Geriatric
Psychiatry 15 181-189
Gottesman L E amp Bourestom N C (1974) Why nursing homes do what they do The
Gerontologist 14 501-506
Grade B L (1976) A study of the entry crisis to a nursing home Unpublished masterrsquos thesis
University of Wisconsin Milwaukee
Grant L A (1998) Beyond the dichotomy An empirical typology of Alzheimerrsquos care in nursing
homes Research on Aging 20 569-592
Mapping Five Sites
31 of 47
Greene J A Asp J amp Crane N (1985) Specialized management of the Alzheimerrsquos disease
patient Does it make a difference A preliminary progress report Journal of the Tennessee
Medical Association 78 559-563
Harper G J (1998) Stress and adaptation among elders in life care communities Unpublished
doctoral dissertation Ohio State University Columbus
Hogden K M (1985) Leisurerecreation needs of hospitalized elderly A task force report
Activities Adaptation amp Aging 7 53-65
Hoglund D J amp Ledewitz S D (1999) Designing to meet the needs of people with Alzheimerrsquos
disease In B Schwarz amp R Brent (Eds) Aging autonomy and architecture Advances in
assisted living (pp 229-261) Baltimore John Hopkins University Press
Ice G H (2002) Daily life in a nursing home has it changed in 25 years Journal of Aging Studies
16 345-359
Imamoğlu Ccedil (2007) Assisted living as a new place schema A comparison with homes and nursing
homes Environment and Behavior 39 246-268
Innes A amp Surr C (2001) Measuring the well-being of people with dementia living in formal care
settings The use of Dementia Care Mapping Aging and Mental Health 5 258-268
Kane R A (2003) Definition measurement and correlates of quality of life in nursing homes
Toward a reasonable practice research and policy agenda The Gerontologist 43 Special
Issue II 28ndash36
Kuhn D Kasayka R E amp Lechner C (2002) Behavioral observations and quality life among
persons with dementia in 10 assisted living facilities American Journal of Alzheimerrsquos Disease
and Other Dementias 17 291-298
Lawton M P (1970) Ecology and aging In L A Pastaland amp D H Carson (Eds) The spatial
behavior of older people (pp 41-67) Ann Arbor MI University of Michigan Press
Mapping Five Sites
32 of 47
Lawton M P (1977) The impact of the environment on aging and behavior In K W Schaie (Ed)
Handbook of the Psychology of Aging (pp 276-301) New York Van Nostrand Reinhold
Lawton M P Weisman G D Sloane P amp Calkins M (1997) Assessing environments for older
people with chronic illness Journal of Mental Health and Aging 3 83-100
Lawton M P Weisman G D Sloane P Norris-Baker C Calkins M amp Zimmerman S I
(2000) Professional Environmental Assessment Procedure for special care units for elders with
dementing illness and its relationship to the Therapeutic Environment Screening Schedule
Alzheimer Disease and Associated Disorders 14 28ndash38
Lee M Madden V Mason K Rice S Wyburd J amp Hobson S (2006) Occupational
engagement and adaptation in adults with dementia A preliminary investigation Physical and
Occupational Therapy in Geriatrics 25 63-81
Lehrner P N (1979) Handbook of ethological methods New York Garland STMP
Margulis S T (2003) Privacy as a social issue and behavioral concept Journal of Social Issues 59
243-261
Martin P amp Bateson P (1987) Measuring behaviour An introductory guide New York
Cambridge University Press
Mathew L J amp Sloane P D (1991) Organizing and staffing dementia units In P D Sloane amp L
J Mathew (Eds) Dementia units in long-term care (pp 101-127) Baltimore Johns Hopkins
University Press
McAllister C L amp Silverman M A (1999) Community formation and community roles among
persons with Alzheimerrsquos disease A comparative study of experience in a residential
Alzheimerrsquos facility and a traditional nursing home Qualitative Health Research 9 65-85
McCracken A L amp Fitzwater E (1989) The right environment for Alzheimerrsquos Geriatric
Nursing 10 293-294
Mapping Five Sites
33 of 47
Milke D L (2003) Iterative post-occupancy evaluations of the McConnell Place North design
[Abstract] Proceedings of the 56th Annual Scientific Meeting of the Gerontological Society of
America 43 48 San Diego CA
Milke D L Clark C amp Bucknell M (2000) Assessing the adequacy of residential lighting in two
care centres for persons with Alzheimerrsquos Disease using the new age-adjusted North American
illumination recommendations (Research Report) Ottawa Ontario Canada Canada Mortgage
and Housing Corporation
National Institute on Aging Coordinating Center (1993) NIA collaborative studies special care units
for Alzheimers disease Manual of procedures Davis CA Northern California Alzheimers
Disease Center University of California
Rabig J Thomas W Kane R A Cutler L J amp McAlilly S (2006) Radical redesign of nursing
homes Applying the Green House concept in Tupelo Mississippi The Gerontologist 46 533-
539
Rule B G Milke D L amp Dobbs A R (1992) Design of institutions Cognitive functioning and
social interactions of the aged resident Journal of Applied Gerontology 11 475-488
Saxton J Silverman M Ricci E Keane C amp Deely B (1998) Maintenance of mobility in
residents of an Alzheimer special care facility International Psychogeriatrics 10 213-224
Schwarz B Chaudhury H amp Tofle R B (2004) Effect of design interventions on a dementia care
setting American Journal of Alzheimers Disease and Other Dementias 19 172-176
Silverman M Ricci E Saxton J Ledewitz S McAllister C amp Keane C (1995) Woodside
Place The first three years of a residential Alzheimerrsquos facility (Vols 1-2) Oakmont PA
Presbyterian Senior Care
Skea D amp Lindesay J (1996) An evaluation of two models of long-term residential care for
elderly people with dementia International Journal of Geriatric Psychiatry 11 233-241
Mapping Five Sites
34 of 47
Slaughter S Calkins M Eliasziw M amp Reimer M (2006) Measuring physical and social
environments in nursing homes for people with middle- to late-stage dementia Journal of the
American Geriatrics Society 54 1436-1441
Sloane P D Brooker D Cohen L Douglass C Edelman P Fulton B R et al (2007)
Dementia Care Mapping as a research tool International Journal of Geriatric Psychiatry 22
580-589
Sloane P D Mitchell M Priesser J S Phillips C Commander C amp Burker E (1998)
Environmental correlates of resident agitation in Alzheimerrsquos disease special care units Journal
of the American Geriatric Society 46 862ndash869
Sloane P D Mitchell C M Weisman G Zimmerman S Foley K M L Lynn M et al
(2002) The Therapeutic Environment Screening Survey for Nursing Homes (TESS-NH) An
observational instrument for assessing the physical environment of institutional settings for
persons with dementia Journals of Gerontology Series B Psychological Sciences and Social
Sciences 57B(Suppl 2) S69-S78
Sloane P D Zimmerman S Williams C S Reed P S Gill KS amp Preisser J S (2005)
Evaluating the quality of life of long-term care residents with dementia The Gerontologist 45
37-49
Snyder L G (1980) An exploratory study of patterns of social interaction organization and facility
design in three nursing homes In J Hendricks (Ed) Institutionalization and Alternative Futures
(pp 68-80) Farmingdale NY Baywood Pub Co
Sommer R amp Sommer B B (1986) A practical guide to behavioral research Tools and
techniques (2nd ed) New York Oxford
Van Haitsma K Lawton M P amp Kleban M H (2000) Does segregation help or hinder
Examining the role of heterogeneity in behavioral and emotional aspects of quality of life for
Mapping Five Sites
35 of 47
persons with cognitive impairment in the nursing home Research and Practice in Alzheimerrsquos
Disease 4 163-177
Verbeek H van Rossum E Zwakhalen S M G Kempen G I J M amp Hamers J P H (2009)
Small homelike care environments for older people with dementia A literature review
International Psychogeriatrics 21 252-264
Voelkl J E (2006) Therapeutic environments in nursing homes Fostering residents meaningful
activity engagement Activities Directors Quarterly for Alzheimers and Other Dementia
Patients 7(3) 35-44
Warren S (Ed) (1998) Innovative dementia care McConnell Place North evaluation (Research
Report) Edmonton Alberta Canada Evaluating Programs of Innovative Continuing Care
Zeisel J (1998) The Hearthstone health environments case study Journal of Healthcare Design
Proceedings from the Symposium on Healthcare Design San Francisco CA National
Symposium on Healthcare Design Inc
Zeisel J Hyde J amp Levkoff S (1994) Best practices An environment-behavior (E-B) model for
Alzheimer special care units American Journal of Alzheimerrsquos Care and Related Disorders and
Research and Care 9(2) 4-21
Zimmerman S Sloane P D Williams C S Reed P S Preisser J S Eckert J K et al (2005)
Dementia care and quality of life in assisted living and nursing homes The Gerontologist 45
133-146
Mapping Five Sites
36 of 47
Table 1 Comparison of Architectural Features Across Five Sites
Feature ASB MDR MPN MPW WDS
Total facility square footage 23040 sq ft 27308 sq fta 24750 sq ft 23864 sq ft 21540 sq ft
Size of administration area (offices conference reception etc but not service or employee spaces)
960 sq ft (No entry hall)
1584 sq ft day program offices and program space
1675 sq ft 1629 sq ft 972 sq ft (No entry hall)
Staff (lunch) room 16rsquo x 18rsquo 6rsquo11rdquo x 6rsquo2rdquo 158rsquo x 16rsquo 138rsquo x 16rsquo 95rsquo x 30rsquo (plus)b
Treatment or examination room
No Yes In daycare area
No No Yes In central
areac
Medications storage Central medication cart
Medication room Medication room per house
Medication room per house
Central medication cart
Location of meal preparation
Facility kitchen in administration area
Facility kitchen in administration area
Adjacent nursing home (see house kitchen)
Adjacent nursing home (see house kitchen)
Facility kitchen in administration area
Use of house kitchen Servery snacks Servery snacks Meal preparation for all breakfasts and some lunches servery
Meal preparation for all breakfasts and some lunches servery
Servery snacks
Family dining room or central country kitchen usage
Small group activities family functions by reservation
Small group activities family functions by reservation
Small group meetings Great Room party food preparation family functions by reservation
Small group meetings Great Room party food preparation family functions by reservation
Small group activities family functions by reservation
Houses and capacity 2 20 2 20 3 12 3 12 3 12
Private tubroom Two off the central hallway
Two off the central hallway
One located in each house
One located in each house
None
Private shower areas One per 10 residents located in each wing of each house
One per 10 residents located in each wing of each house
One per resident located in each resident room with the one shared bedroom having a shared shower
One per resident located in each resident room with the one shared bedroom having a shared shower
One per 12 residents located in each house
Resident room doors Split door Split door Split door Regular Split door
Inventory of public rooms and seating capacity (includes all alcoves that can be used for seating and seating areas near exits)
15 165
17 176
15 232
13 219
14 182
Variety and appearance of outdoor Area
2 small (little greenery) 1 medium (mixed hardgreen surfaces) and a large courtyardmdashvery appealing
2 small (much greenery) 1 medium (mixed hardgreen surfaces) 2 large courtyards (1 mixed hardgreen surfaces 1 green) mdash very appealing
3 small (much greenery) 1 large (mostly green courtyard mdash very appealing
3 small (much greenery) and 1 large (mostly green courtyard mdash very appealing
1 small (much greenery) 1 medium (mostly green) and 1 large (mostly green) courtyard mdash very appealing
a Does not include researchteaching wing Total for entire floor space is 40382 sq ft b Room at WDS was not intended as a lounge ie a retreat from work to professionalize the care staff role it was to serve as a place to read and discuss work At other
sites the lunch room also served as a lounge c Room was intended as a multi-purpose room
Mapping Five Sites
37 of 47
Table 2 Therapeutic Environment Screening Scale Items for Goal and Domain Possible Range
Midpoint and Mean in Each Group
Therapeutic Goal and Domain
Item Numbers Range Mid-point ASB amp MDR
20-Capacity Houses MPN MPW amp WDS
12-Capacity Houses
ASB MDR Site Scores
Mean MPN MPW WDS Site Scores
Mean
Safetysecurityhealth
Exit control 2a 2b 2c 2d 2e 2g
2h 3a 3b 0-11 55 2 1 15 1 2 2 17
Maintenance 7b1Dagger 7b2Dagger 7b3Dagger 7b4Dagger 0-8 40 8 8 80 8 8 80
Cleanliness 7a1Dagger 7a2Dagger 7a3 7a4 0-8 40 8 8 80 7 8 8 77
Lack of odorsℓ 9aDagger 9bDagger 0-4 20 4 3 35 4 4 4 40
Safetyℓ 7c1 7c2Dagger 7c3 7c4 8 0-10 60 10 10 100 10 10 10 100
Orientationcuing 19 20ф 27a 27bcDagger
27d 27e 27f 28 29 0-17 85 1212 120 11 9 12 107
Privacycontrol
Privacy 30a 30b 30c 30d 0-4 20 0 0 0 1 2 0 10
Functional ability 16 17a 17b 18Dagger 0-7 35 7 7 70 7 7 7 70
Stimulation
Lighting 21 22a 22bDagger 22cDagger
23a 23b 23c 0-14 70 13 13 130 11 14 13 127
Tactilevisual
stimulation 34 35Dagger 37b 0-16 80 10 6 80 15 14 11 133
Quietness 24a 24b 24c 24d
24eDagger 24f 24g 25 26 0-25 125 21 21 210 19 20 23 207
Physical attractiveness
4a1 4a2 4b1 4b2
4c1 4c2 4d1 4d2 37c 0-34 140 16 15 155 15 16 16 157
Socialization
Homelike
environment 15Dagger 31Dagger 32 0-9 45 9 9 90 9 9 9 90
Resident
appearance 36Dagger
0-2 10 2 2 20 2 2 20
SCUEQS 0-41 - 41 39 40 39 4141 40
CAAQS sect 0-100 - 786 857
Large means represent better physical environment
Dagger Items used to compute the 18-item Special Care Environmental Quality Scale (SCUEQS) 27b and 27c were treated as a single item and item 15 was
misnumbered in the TESS-2+ Revised version (as item 13) ф Item 20 is the percentage of common rooms with signsgraphics floor plans in all sites allowed a view into common rooms (scored as zero) ℓ An item was unintentionally omitted from the TESS-2+ scoring form (10 in Odors and 11 in Safety) sect Composite Above Average Quality Score (CAAQS) represents the percentage of TESS-2+ domains that were above average in quality
Mapping Five Sites
38 of 47
Table 3 Percent of Resident Population Who Were Observed During Behavior Scans
at Each Site in Particular Areasa
AreaSite 20-Capacity Houses 12-Capacity Houses
ASB MDR MPN MPW WDS
Total Areas 608 493 511 564 803
Total Common Areas 62 158 169 200 511
Total Outdoor Areas 46 02 11 56 38
Total House Areas 500 333 331 311 254
House 1 259 168 115 69 62
House 2 241 165 108 128 123
House 3 108 114 69
House Kitchen 149 08 75 53 49
House LivingDining Room 324 278 236 232 200 a Resident data were adjusted to show the mean percent of residents at a site who were observed per scan per day Note Total Areas is the sum of the following Total Common Total Outdoor and Total House Total House Areas is the sum of Houses 1 House 2 and House 3 House Kitchen and LivingDining Rooms are summed across houses Blank cells indicate that the question was not applicable
Mapping Five Sites
39 of 47
Table 4 Percent of Resident Population Who Were Observed During Behavior Scans
at Each Site in Particular Common Areasa
Location 20-Capacity Houses 12-Capacity Houses ASB MDR MPN MPW WDS
Great Room 07 75 94 91 64
Fireplace Seating Area 22 69 43 13 106
ActivityCraft Room 04 47 00 02 10
TV Room ndash ndash 43 64 58
Other TV Area ndash ndash 11 39 ndash
Common Area Hallway Seating 37 108 138 143 396
Music Room ndash ndash 00 ndash 00
Garden Room ndash ndash 00 ndash 04
Beauty Salon 39 12 00 00 00
Family Dining RoomCountry Kitchen 00 09 00 00 00
Total 109 320 329 352 638 a Resident data were adjusted to show the mean percent of residents at a site who were observed per scan per day Note Dashes indicate that residents were not observed in these areas
Mapping Five Sites
40 of 47
Table 5 Percent of Resident Population Who Were Observed During Behavior Scans
at Each Site at Particular Times of Day
Time of Day 20-Capacity Houses 12-Capacity Houses
ASB MDR MPN MPW WDS
Before Lunch 541 360 386 475 654
Lunch 805 663 667 722 1000
Between Meals 657 530 506 589 963
Supper 765 738 744 744 922
After Supper 50 390 447 469 740 a Resident data were adjusted to show the mean percent of residents at a site who were observed per scan per day Note Before Lunch (4 scans-730-1030) Lunch (2 scans-1130 amp 1230) Between Meals (3 scans-1330 to 1530) Supper (2 scans-1630 amp 1730) After Supper (4 scans-1830 to 2130)
Mapping Five Sites
41 of 47
Figure 1 Floor plan of Asbury Place Mt Lebanon PA
Mapping Five Sites
42 of 47
Figure 2 Floor plan of Marjorie Doyle Rockwell Center Cohoes NY
Mapping Five Sites
43 of 47
Figure 3 Floor plan of McConnell Place North Edmonton AB
Mapping Five Sites
44 of 47
Figure 4 Floor plan of McConnell Place West Edmonton AB
Mapping Five Sites
45 of 47
Figure 5 Floor plan of Woodside Place Oakmont PA
Mapping Five Sites
46 of 47
Figure 6
McConnell Place Northordf Residentsrsquo Activities When Alone and in the Presence of Staff
ordf The average MMSE score was 153 at MPN higher than the average across sites 132 + 15 (M+SE) MPN residents appeared not to initiate activities when alone
0
5
10
15
20
25
30
35
40
Alone Day 1 With Staff Day 1 Alone Day 2 With Staff Day 2
Nu
mb
er R
esid
ents
Arts amp Crafts
Chores
CookingBaking
Eating
Exercising
Games
Grooming
Lg Activity Grp
Music Event
Reading
Sm Interaction
Walking
Watching
Watching TV
Other
Mapping Five Sites
47 of 47
Figure 7
Percent of Scans in Which Residents at Each Site Engaged in Particular Behaviors
0
10
20
30
40
50
60
70
80
90
100
ASB MDR MPN MPW WDS
Misc
Just Sit
Watch
Walk
Leisure
Work
ADLs
Mapping Five Sites
4 of 47
the setting had a creative activities department Only 12 of time was spent in social activities (Ice
2002) Ice also gathered data on the activity level of healthy elders and found their time was spent
quite differently 17 in passive activities and 38 in socialexpressive activities Another study
with healthy elders found they spent 40 in passive activities and 28 in socialexpressive activities
(Harper 1998) These studies with healthy elders suggest that the inactive behavior observed in
nursing homes residents does not match the pattern of healthy elders
More critically it is not known what exactly about the design of a residential care center
makes it function like a home rather than a hospital With new designs of residential care settings
being presented regularly (eg wwwHDC08com httpwwwedraorg) an underlying assumption
appears to be that small variations in their architectural design will have little effect on resident and
staff activity This assumption and the dearth of literature with detailed information on the behavioral
patterns of use of residential-style facilities resulted in a lack of any explicit hypotheses as to what
we would find and prompted us to undertake the present descriptive study The principal purpose of
the study was to investigate the daylong patterns of activity of residents and staff in five similar
specially designed sites for the care of persons with Alzheimerrsquos disease The most salient difference
between the five sites was that two were designed with two 20-capacity housing units and three were
designed with three 12-capacity units Accordingly much of the data presentation is focused on that
feature The Therapeutic Environment Assessment Scale provided an architectural basis for assessing
the significance of activity data gathered through behavior mapping and provided a linkage with the
findings of studies using this as a standardized instrument We now present evidence that small
design differences can have large effects on resident patterns of room occupancy and on their
activities
Mapping Five Sites
5 of 47
Methods
Participants
The five residential care sites considered in the present study were designed for the care of
persons diagnosed with dementia and all were based on the pioneer site the well-investigated and
well-known architectural design of Woodside Place (WDS) in Oakmont PA (Deely Klingensmith
amp Silverman 1995 DiMotta Dubney Hoglund amp Kershner 1993 DiMotta amp Hoglund 2000
Hoglund amp Ledewitz 1999 McAllister amp Silverman 1999 Saxton Silverman Ricci Keane amp
Deely 1998 Silverman et al 1995) Of the four other sites two were located in Edmonton AB
McConnell Place North (MPN) and McConnell Place West (MPW) and one site in each of Cohoes
NY Marjorie Doyle Rockwell Place (MDR) and Mt Lebanon PA Asbury Place (ASB) Perkins
Eastman Architects designed three sites The WDS blueprints were purchased by CapitalCare to
build Canadian sites and the architectural firm of Cohos Evamy adapted them making adjustments to
accommodate the weather and site-specific land features in Edmonton AB The five sites can be
considered variations on a theme
Generic data on residents staff and volunteers were obtained from site administration
records A total of 184 elderly residents (35-40 per site) all but one of who had a primary diagnosis
of dementia were living in the facilities at the time of the study The average Mini-Mental State
Examination (MMSE) score (Folstein Folstein amp McHugh 1975) across sites was 132 + 15
(M+SE) and specific within site means were 122 ASB 153 MDR and MPN 161 MPW and 84
WDS On average the percent of males at the centres was 240 + 66 range 11-31 Discharge criteria
relating to mobility and sociability common across the sites included loss of mobility requiring
maximum assistance with activities of daily living unable to participate in activities unmanageable
incontinence and risk to self or others The total staff employed at the five sites (22-43 per site) was
197 The number of direct care staff that residents were likely to encounter (full-time and full-time
equivalents of part time care supervisors (LPNs) and caregivers) ranged from 19 to 28 across sites
Mapping Five Sites
6 of 47
for a mean of 234+28 The reported daytime ratio of residents to care staff was 51 at WDS and
MDR and 61 at MPN MPW and ASB This ratio continued most of the evening dropping at night
to 91 at WDS 121 at MPN and MPW and 131 at MDR and ASB
Procedures
Environmental Survey
The Therapeutic Environment Screening Scalendash2+ Revised was used to assess general design
features (subsequently referred to as TESS-2+) The scale is an observational checklist that is used to
describe the ability of the physical environment of a long-term care institutional setting to address the
therapeutic goals of nursing home and residential care residents with dementia (Lawton Weisman
Sloane amp Calkins 1997) A number of versions were in circulation The TESS-2+ was used in the
National Institute on Aging (NIA) (1993) special care unit collaborative studies Current formats are
for nursing homes (TESS-NH Sloane et al 2005
httppsychsocgerontologyjournalsorgcgicontentabstract572S69) and residential care settings
(TESS-NHRC
httpwwwuncedudeptstessnhpdf_filesTess20NHRC20Revised201_14_02pdf) The 37-
item TESS-2+ checklist consists of discrete items measuring a range of environmental domains such
as exit control maintenance and safety (listed in the first column of Table 2) as well as three global
evaluative ratings staff interaction resident involvement in activities and physical environmental
atmosphere Psychometric properties include interrater reliability for TESS-2+ items ranging from
67 to 100 agreement (Sloane et al 1998) The items on the TESS-2+ can be considered to point
out areas where a site meets best practice standards for dementia design The TESS-2+ data were
expected to provide an assessment of the physical differences in the five sites and thus a potentially
useful set of measures for understanding differences in the use of the five facilities
Mapping Five Sites
7 of 47
Data Collection and Analysis
We collected information on principal characteristics relating to physical features staff
volunteers residents and care programming retrospectively from site records of April and May of
1998 The assessment of physical features included a review of floor plans and records of
maintenance requests On-site observation was done to complete the TESS-2+ The interrater
reliability of TESS-2+ ratings was assured by prior tests of the agreement between observers
Although an observer typically uses the scale to assess a dementia unit in a nursing home in this
study the assessment was of the five small purpose-designed settings (the third author completed the
TESS for ASB MDR and WDS the first and second authors did MPN and MPW) During the NIA
studies the scale was used not only for special care units but also some entire sites (Sloane et al
2002) and Slaughter Calkins Eliasziw and Reimer (2006) found this version of the TESS useful to
distinguish between purpose-built dementia care facilities and traditional care facilities
The Special Care Unit Environmental Quality Scale (SCUEQS) was used to score the
TESS-2+ using a method previously described (Sloane et al 2002 Lawton et al 2000) The 18-item
SCUEQS subscale derived from the TESS-2+ was determined to be a robust measure of overall
environmental quality during the NIA studies Scores can range between 0 and 41 with 41 being a
better environment for persons with dementia Internal consistency of this scale was measured using
Cronbach coefficient alpha (α 5082) (Sloane et al 1998) In addition using a method developed by
Slaughter et al (2006) a composite score the Composite Above Average Quality Score (CAAQS)
was calculated using all items from the TESS-2+ A value of 1 was assigned if the rating for the
center was above the middle of the range for the item (ie midpoints are shown in column four of
Table 2) and if equal to or below the midpoint the assigned score was 0 For each cluster of centres
(the 20 capacity houses of ASB and MRD and the 12 capacity houses of MPN MPW and WDS) the
resulting binary scores representing each of the 14 domains in the TESS-2+ were summed and a
percentage of 14 was calculated to facilitate comparison with the data of Slaughter et al (2006) This
Mapping Five Sites
8 of 47
number represents the percentage of domains that were above average in quality for the site Group
means were then used to compare results on the SCUEQS and the CAAQS for the 20-capacity and
the 12-capacity sites
Behavior Mapping
The principal method of behavioral mapping used place-centered instantaneous scans which
provides systematic samples of behaviors This is one of the least intrusive methods for direct
observation (Lehrner 1979) During behavioral mapping the observer at set intervals quickly notes
the activity of people within an area and moves on to other areas These scans are much less invasive
than continuous observation and with momentary scans interobserver reliability is inherently better
Often observation is considered the gold standard for collecting behavioral data but there is a
concern that the presence of an observer influences the behavior (typically to more socially
acceptable behavior) During scans the observer quickly passes through the spaces of interest
allowing very little time for those present to adjust their activity
The data were collected by on-site staff familiar with facility routines following instructions
in a procedure manual written by the first author Thus the collection of data across sites followed a
standardized methodology including the use of common behavioral categories common floor-plan
notation preprinted checklist sheets trained paid observers and time-locked sampling Approval for
direct observation as described was obtained appropriate to each jurisdiction Observers learned
mutually exclusive and comprehensive definitions a standard procedure for ethogramatic checklists
for nine categories of behaviors On each of two days at each site they directly observed activities of
persons in public areas following a systematic protocol Every hour over 14 hours they toured public
spaces noting the subjectrsquos group (resident staff family others) and the type time and location of
the activity (Martin amp Bateson 1987 Sommer and Sommer 1986) Information was written upon
copies of site floor plans The identity of individuals was not recorded General activity categories
included just sitting (inactively) activities of daily living (ADLs eg self-care grooming washing
Mapping Five Sites
9 of 47
eating taking medications) light housekeeping leisure disruptive behavior walking watching and
miscellaneous behaviors Communication was indicated as an independent action because it could
occur concurrently with any of the activity categories
Information about activities at each of the five sites included a description and schedule of
daily and special occasion events for residents average attendance of residents at programmed events
of each type the procedures for intervening when problem behaviors arose definition of problem
behaviors and the average weekly incidence of problem behaviors (not presented) The interpretation
of data from Behavior Mapping benefited from this information
Sampling and Data Analysis
Behavioral mapping included all care staff volunteers family members residents and others
over a two-weekday period in early June at each site except at MDR where data collection was on
two sunny days in September that were comparable to June weather Observations were made each
hour between 0730 and 2130 hours for a total of 15 scans per day They were conducted in all public
spaces at each site excluding rooms bathing rooms toilets and bedrooms as well as areas used
exclusively by staff Two observers were trained at each site to collect the data to a criterion of at
least 85 agreement on location person and behavioral categories Behavior observations were
collated by site by activity and time-of-day format
Results
Floor Plan Comparisons
Building orientation varied across sites as did the views of outdoor gardens (floor plans in
Fig 1-5) Table 1 lists some of the most salient similarities and differences between the sites
Each building had residential wings referred to as houses with residentially scaled rooms
linked by a common area shared by all houses (Figures 1-5) The common areas in all sites included
Mapping Five Sites
10 of 47
a great room a fireplace seating area at least one activity or craft room a family or private dining
room and a beauty salon
Insert Figures 1-5 and Table 1 about here
Overall the floor plans of ASB and MDR were very similar as were the plans of the other
three centers MPN MPW and WDS In the latter three centres the houses were equivalent to the
three parallel wings flanked by courtyards that is outdoor spaces with natural green elements and a
view to the sky Each wing was self-contained each had a kitchen livingdining room and laundry
and a room for bathing or showering Each wing had a central hallway with bedrooms running its
length on either side accommodating 12 residents ASB and MDR floor plans had two perpendicular
housing areas comprised of two parallel wings The architects viewed this design as four houses each
accommodating 10 residents Each bedroom hallway and one living area was considered a house and
a pair of houses was viewed as sharing a kitchen The kitchen was planned as a hub for staff assigned
to the two bedroom hallways and a place to locate a staff-buddy for a task (DiMotta amp Hoglund
2000) However at ASB for example the arrangement of furniture with glider-rocking chairs
arranged primarily in one dining-living space and tables placed in the dining-living area on the other
side of the kitchen suggested that more than the kitchen was being shared and that these common
rooms were being used as a continuous space for all 20 residents to share In gathering data from
management and staff there was no evidence that staff and residents were treating a particular
dining-living room as being the domain of just one hallway of residents Moreover ASB staff said
residents housed in bedrooms along one hall were frequently found in the other bedroom hall
Mealtime seating varied for breakfast lunch and dinner but the variation was not related to
Mapping Five Sites
11 of 47
residentsrsquo home hallway Consequently each U-shaped housing area in ASB and MDR was
considered a house for the purposes of this study
House kitchens differed across sites At ASB and MPW these were large country kitchens
but at other sites the kitchens were small At WDS kitchens were designated as ldquoserveriesrdquo Some
sites had activity areas or rooms in the common areas In the fireplace seating area adjacent to
WDSrsquos country kitchen (but not within the country kitchen) were a large dining table and matching
chairs An open wall above a bar-type counter allowed items to be passed from the country kitchen
This made the space more flexible because it was not viewed as a special events venue like the
enclosed private dining rooms in the other four centers It also encouraged various activities to be
conducted on this dining table that were not scheduled for the common areas in the other centers
Table 1 supplements this descriptive comparison
The common features included floor plans designed for small group living (houses of 12 or
20) in self-contained houses with spaces for cooking eating bathing and gatherings bedroom
hallways that are short by facility standards (yet long for family dwellings) a variety of common
spaces and informal staff workspaces but no formal nursing stations (Table1) Differences in
general design between sites were also in quantitative measures for example the number of beds
ranged from 36 to 40 the number of public rooms ranged from 11 to 17 (Table 1) and most striking
the seating capacity in public rooms varied from 165 to 232 (Table 1) with ASB and MDR having
somewhat less capacity than MPN and MPW Inspection of floor plans showing chair location (data
not shown) revealed that the differences in numbers of seats between sites were principally in the
houses kitchen and livingdining areas implying that the site differences in these floor plan areas
were relevant
Mapping Five Sites
12 of 47
Therapeutic Environment Screening Scale
Environmental characteristics were described using the 38-item Therapeutic Environment
Screening Scale (TESS-2+) Designees at each site filled out the form after training by one of the
authors of the study who was experienced in using the scale Interrater agreement was assured by
comparing interpretations and ratings consensus was reached on any issues related to scoring
Interrater reliability for TESS-2+ items had ranged from 67 to 100 agreement (Sloane et al
1998) There were no significant differences in the mean domain scores between the sites that had
12-capacity houses and those with 20-capacity houses (Table 2) The findings are presented by
grouping the items into two types of goals and domains those associated with the general site design
that may be more architecturally based and those more aligned with interior design site operations
and providing care
Insert Table 2 about here
General Design The scores related to the therapeutic goals and domains for building design
were similar across sites reflecting the implementation of the basic Woodside building model
(Table 2 Exit control Orientation and cuing Privacy and Functional ability Physical
attractiveness) All sites in this study had strategies for exit control (Table 2 2andash2h) WDS had both
alarms and keypad-locks on external exits while the other sites had keypad-locks MPN and MPW
had a reception desk at the front entrance as a clerk-observation post At ASB and MPW the external
exits were partially disguised at the other sites they were not (Table 2 3a 3b)
Mapping Five Sites
13 of 47
Orientation and cuing is related to residentsrsquo personal safety and self-awareness thus the
photos and names beside the bedrooms doorways which all sites used are important (Table 2 27
28 29) as in the ldquotip of the tongue phenomenonrdquo they need a cue to retrieve the memory (Zeisel
1998) An open interior plan that allows residents to see into public rooms is an optimal way finding
strategy for persons with dementia all sites employed this The strategic location of cues and
personal items can also aid way finding Although institutional-style directional signage is eschewed
on restroom doors for example both graphics and labels are advised Open floor plans often require
few signs MDR had the most signs and MPW used the fewest graphics and signs with other sites
having intermediate numbers (Table 2 19 20) Large windows that provide natural exterior views
(Table 2 4) are not only attractive they are another tactic that serves way finding and also provides
seasonal orientation in the latitudes of these five sites The entrances of residentsrsquo bedrooms were
personalized at all sites (Table 2 27 28 29) Redundancy is recommended and a greater variety of
items were used at ASB MDR WDS and MPN than at MPW for this purpose
All five sites scored well on supporting functional ability (Table 2 16 17 18) that is either
slowing decline or stimulating improvement which is something for which sites designed for
dementia have been associated (Benson Cameron Humback Servino amp Gambert 1987 Greene
Asp amp Crane 1985 Innes amp Surr 2001 McCracken amp Fitzwater 1989 Rabig Thomas Kane
Cutler amp McAlilly 2006 Rule Milke Dobbs 1992 Silverman et al 1995 Skea amp Lindesay 1996
Warren 1998)
Interior Design and Approach to Care The first goal of this type is safety security and
health with domains (besides exit control discussed above) of Maintenance Cleanliness Lack of
odors and Safety (of floors) A second goal is Stimulation and a third is Socialization Slaughter et
al (2006) viewed these as basic requirements and found no significant differences in these goals
when comparing the 6 special care facilities (bungalows) with the 45 units in traditional institutional
facilities so it is not surprising that the same was true for these highly similar sites
Mapping Five Sites
14 of 47
Stimulation domains include Lighting Tactile and Visual stimulation as well as Quietness
Both sensory deprivation and over-stimulation are viewed as problems (Brawley 1997 Day
Carreon amp Stump 2000 Cronin-Golumb 1995) According to Zeisel Hyde amp Levkoff (1994)
appropriate levels of stimulation results from having a site with a high sensory comprehension
ranking so not necessarily the overall calmest setting but rather one with a moderate amount of
sensory input that residents can understand Ambient lighting was considered good in all sites with
minimal glare from a number of reflecting surfaces such as picture windows and French doors (Table
2 21) Lighting was evenly distributed and levels were considered ample (Table 2 22 23) with the
exception of MPN Ambient auditory noise was not deemed a problem whether considering type or
level of noise (Table 2 24 25) The general availability of things to touch in common areas such as
those that invite handling or folding was somewhat less at ASB and MDR than at other sites
Overall ratings of home likeness and the individuality of residentsrsquo appearance were
consistently good but the general atmosphere influenced by residentsrsquo lower overall levels of
participation in activities and a less positive rating for staff interactions with residents resulted in
MDR scoring lower that other sites (Table 2 15 31 32 36) WDS scored in the mid-range on
residentsrsquo involvement but as indicated above its residents had much lower MMSE scores At all
sites personal pictures or mementos were in most residentsrsquo bedrooms However such items were
not present in common rooms at MDR
The mean SCUEQS scores (Table 2) which summarized a subset of the TESS-2+ items
were not significantly different between the sites that had 12-capacity houses and those with 20-
capacity houses The SCUEQS had been derived for the NIA studies of special care units and was
considered by experts to measure important aspect of the physical environment and serve as a
reliable measure for differentiating better nursing units and assessing the overall environmental
quality (Sloane et al 2002) The results appear to justify the architectsrsquo design decisions that resulted
in two hallways of 10 residents sharing the large kitchen and the living-dining rooms Slaughter et al
Mapping Five Sites
15 of 47
(2006) devised another composite score the Composite Above Average Quality Score (CAAQS)
which they found to be more sensitive than the SCUEQS The CAAQS represents the percentage of
domains that were above average in quality It revealed a difference between the sites with 12-
capacity houses (857) and those with 20-capacity houses (786) that was not shown by the
SCUEQS but the difference was not significant
Behavioral Mapping
Reliability The number and category (staff family or resident) of persons observed at each location
was recorded on floor plans in successive behavior scans one hour apart over the course of two
days Interobserver reliability of the scans was assessed at each site Cohenrsquos kappa a measure of
agreement between observers has a range from 0 no agreement to 100 total agreement Fleiss
(1981) characterized a kappa of 4 to 6 as fair 6 to 75 as good and over 75 as excellent There was
good agreement on average between two independent observers on the identification of behaviors
observed Kappa mean (SD) 0851 (04) and excellent agreement on identification of people being
scanned as residents staff family or others kappa mean (SD) 0732 (07)
Observations Fifteen observation periods or scans per day were conducted one per hour during
the two days of observation Examination of the within-site data revealed that the only differences
were day differences in specific scans related to the occurrence of special events eg barbecues
Consequently the data were collapsed across days A scan of about 10 minutes in duration was
required to count people in all public areas Observers minimized the possibility of counting the same
person in more than one room during a scan by following a preplanned path through the building and
working quickly Counts of sightings of staff family and volunteers and residents by hour in each
Mapping Five Sites
16 of 47
area of each site were summed over the two-day period of observation To assist the description of
the findings resident data were subsequently adjusted to show the mean percent of residents at a site
who were observed per scan per day and to show the percent of scans in which residents were
involved in a particular activity or seen in a particular room or area
Staff and Family Observations of staff and family are presented without data as these were
ancillary to the principal focus on residents Staff were seen most often in the house kitchens or
diningliving rooms across all sites except WDS At WDS staff were seen in the kitchens but
seldom in the diningliving rooms In all three sites with 12-capacity houses the central house was a
hub of staff activity with nearly twice as many staff seen in that kitchen (or an adjacent room which
was the dining room in MPN and MPW but was a hallway in WDS) as in the kitchens of the houses
on either side WDS staff were also seen in the seating area outside the great room nearly as much as
in the house kitchens Residents were seldom engaged in an activity when staff were not around eg
see Figure 6 for MPN This is not surprising because persons with Alzheimer disease lose their
ability to initiate activities (Colling 1999 Lee et al 2006) Others have shown that appropriate
environments are not sufficient residents with this disease need activities and all five sites employed
activity coordinators (Grant 1998 Van Haitsma Lawton amp Kleban 2000 Voelkl 2006)
Insert Figure 6 about here
Family members were at some sites as early as 830 am and as late as 930 pm although at
MPN all visits except one were in the afternoon ASB had a family meeting increasing the number
Mapping Five Sites
17 of 47
of sightings of family members to 42 (19 were associated with the meeting) The numbers of
sightings of family members over the two days of observation at other sites were WDS ndash 27 MPN ndash
23 and MDR and MPN ndash 12 each
Insert Tables 3 and 4 about here
Resident Locations Direct observation revealed a pattern of use that was unexpected and not
evident in TESS results Overall resident sightings were at least 25 higher at WDS than at the
other four sites (Table 3) The number of sightings in the common areas of WDS was over 60
greater than those at any other site (Table 3) Residents were most frequently seen in the area just
outside the great room (Table 4) By contrast at all other sites residents spent more time (60 of
sightings) in their houses (Table 4) ASB where residents spent 80 of their time in their houses
represented the extreme in this regard with the other sites being intermediate between ASB and WDS
(Table 4) Differences did not appear to align with whether the houses were of 20- or 12-capacity At
all sites residents were seen most frequently in the common areas outside of the houses with the
common hallways the great room and fireplace seating area accounting for decreasing numbers of
residents in that order (Table 4) however a stylist in the ASB beauty salon drew a crowd showing
how an occasional event can change behavior patterns At the sites with 12-capacity houses and
television rooms those rooms were popular and drew as many residents as the fireplace area
The large percent (396) of residents seen in common areas at WDS was attributable to
sightings in the common hallway and fireplace seating area next to the School House (Figure 5
Table 4) All residents could be gathered in the area which was slightly larger than the great room
Mapping Five Sites
18 of 47
observers noted a continuous round of activities involving groups of varying sizes No other site used
this area as intensely At WDS a day program brought in 8 additional residents and several staff who
ran activities that attracted some residents (discussions newspaper reading crafts) Observers were
asked not to count persons associated with the day program in their tally but the heavy use of the
central space and the day program activities presented there had some influence ASB and MDR also
had day programs that used separate spaces for that purpose so program participants were not seen
Chairs lining the walls in this area of WDS augmenting seating arrangements in front of and on
either side of the fireplace as well as oversized displays of small snapshots on several walls resulted
in an institutional appearance Local lore attributes the lineup of chairs to residents who initiated it
shortly after move-in Staff moved chairs back where the interior designers located them but
residents would pull them back across the corridor in a line until staff gave up
Site differences in the use of the great room were noteworthy ASB appeared to use it only
for church services on a regular basis with ldquoaudience-seatingrdquo left in place from day-to-day
Possibly this was because this great room was relatively distant from the houses (Figure 1) In WDS
MPN and MPW great room seating was rearranged throughout the day to accommodate numerous
events MPN and MPW used the great room like a town hall holding events such as afternoon teas
dances and musical entertainment At MDR small numbers of residents were in the great room
throughout the day but no large gatherings were seen
Within sites the sightings of residents in the houses were distributed fairly evenly across the
houses (Figures 1-5 Table 3) Residents were most often seen in the living-dining rooms and as
noted above staff were most often seen in the adjacent kitchens The exception was WDS where the
house design did not provide a good line of sight for staff between the kitchens and the living-dining
rooms (Figures 4 amp 5) Staff at all other sites could work in kitchens and keep an eye on residents
WDS staff actively encouraged residents to leave dining rooms after a meal and join activities in the
central area likely for two reasons because activities were not planned for the houses and because
Mapping Five Sites
19 of 47
staff working in the houses could not easily monitor a resident who remained in the house living-
dining room WDS staff were rarely seen in the housesrsquo living-dining rooms The School House the
centre house accounted for the majority of residents observed across all houses This kitchen
adjacent to the highly used area just outside the Great Room provided a relatively good monitoring
station for the house and activities in the common areas At WDS mealtimes two common areas
were used residents who needed substantial assistance with meals were often fed in the craft room
and a high-functioning group ate at the dining table alongside the fireplace seating
In the houses at other sites most sightings of residents were in the diningliving room areas
Fewer were in the kitchen and fewer still in the house hallways (Table 3) At MDR only one area
adjacent to the kitchen was devoted to dining and almost no residents were seen in kitchens The
same was not true at ASB where approximately the same proportions of residents were seen in the
shared kitchens as in each of the living-dining rooms on either side (Table 3 sums all four living-
dining rooms) However at ASB the numbers were likely from residents moving between the two
diningliving rooms and passing through the kitchens (Figure 1) because residents were rarely
engaged in the type of tasks encouraged at MPN and MPW (ie handling dishes setting tables etc
to encourage maintenance of their functional abilities Figure 7) Interestingly the highly similar sites
found different ways to use their spaces and different approaches to activities
ASB MPW and WDS held barbecues during the days of observation (Table 3) This meant
the residentsrsquo presence in the kitchen and dining areas was reduced at those meals Accordingly for
comparison across sites dining area sightings were adjusted by adding mealtime sightings in the
courtyards The peak periods for resident sightings were during the midday lunch (1130-1330) and
evening meals (1630-1830) (Table 5) Even so sightings of residents at mealtimes were only 66-
80 of occupancy indicating eight to ten residents were not seen at mealtimes in public areas at
most sites (Table 5) The exception was WDS where sightings indicated nearly all residents were
observed in public areas at mealtimes (Table 5) although WDS residents did not gather in the house
Mapping Five Sites
20 of 47
dining areas for the noon meal With most activities occurring in the core of the building WDS was
flexible about meal arrangements serving meals where residents were located such as the area
outside the great room on an activity room Residents were not required to return to their own houses
to eat They could join day program residents and eat in the common area or join residents in another
house One group of women was known for asking to eat together on their own in the common area
WDS also led other sites in the number of residents observed at other times of the day (Table 5) The
differences were especially marked in the afternoon between meals (1330-1630) and the period
after the evening meal (1830-2130) This suggests that WDS staff may have been viewing the
central areas like they would the central areas of a unit in a nursing home on dementia units staff
often prefer that residents stay in view and not return to their rooms
Resident Activity The observed activity patterns were surprising considering high levels of
resident inactivity reported for nursing home residents (Gottesman amp Bourestom 1974 Ice 2002)
Gottesman and Bourestomrsquos (1974) observations in 40 nursing homes revealed that residents spent
56 of their time during peak daylight hours engaged in no activity or passive activity In that study
residents were involved in personal care television and socializing for 43 of the time Ice (2002)
reprised the Gottesman and Bourestom study and found residents spent 65 of their time doing little
or nothing with only 12 in social activities (Ice 2002) In the present study observations of Just
Sitting and Watching were expected to measure levels of passive behaviors Residents in the five
sites appeared to be engaged in ADLs and Leisure for greater amounts of time than in Just Sitting
and Watching (although small amounts of napping as passive behavior were coded as
Miscellaneous) but this was not significant (Figure 7) Chi-square analysis using phi coefficients
found that residents at WDS engaged significantly less in ADLs than residents in other centres
(plt00001) residents at ASB MPN amp WDS were engaged less in leisure (plt005 each) ASB
Mapping Five Sites
21 of 47
residents were engaged less in Just Sitting (plt00005) and residents were observed Watching less at
MDR MPN amp MPW (plt00005 each) Leisure was the most frequently observed activity for MDR
MPN and MPW the second most frequent at ASB and the third at WDS Recreational activities
both planned and informal activities were considered to be Leisure thus watching TV or waiting to
be served at a coffee party were both coded as being Leisure (persons who were within the group and
actively attending to events but not actively engaged at the moment were coded as Leisure too and
this was distinguished from Watching which was defined as ldquoattending to activities or interactions of
others from a distance such as from a doorway watching a streetrdquo)
Insert Figure 7 about here
The ADLs were the second most frequently seen activity for MDR MPN and MPW and the
third for ASB but were seen much less at WDS The majority of ADLs across sites occurred at meal
times indicating they involved dining (ASB 570 MDR 590 MPN 758 MPW 736 but
WDS 422) The low percent of time spent by WDS residents on ADLs during the evening meal
time (42) agrees with the low number of sightings in the dining area at that time (385 of max)
It appears that WDS residents sat watched and walked but did not spend much time eating
(Figure 7) In contrast previous research at MPN and MPW has found mealtimes to be the longest
duration behavior Scans needed to be one hour apart to avoid seeing meals on two consecutive scans
and oversampling the behavior (Milke et al 2000)
Work that is tasks such as housekeeping and cooking were not seen at either of the sites
with 20-capacity houses but this is the only difference evident when compared with the 12-capacity
Mapping Five Sites
22 of 47
houses Compared to other sites MPN and MPW residents engaged in moderate proportions of all
behaviors (Figure 7) Residents at WDS spent proportionately less time on ADLs light
housekeeping and Leisure and more time at Walking Watching and Just Sitting Chi-square
analysis using phi coefficients showed that residents were observed Walking significantly less at
MDR (plt 005) residents at ASB and MDR engaged significantly less in Work and there were no
significant differences between sites in Miscellaneous activities (Figure 7)
Observersrsquo Notes
Some large differences were found in the care programs across sites Observersrsquo notes
indicated that at MPN and MPW residents were encouraged to be involved in the daily routine of the
facility and direct care staff ate meals with residents This strategy was said to stimulate conversation
and provide residents with a model for appropriate behavior Staff played the role of ldquomotherrdquo rising
to find an item in the kitchen and keeping an eye on food consumption Managers at MPN and MPW
considered this role an essential component of care At ASB MDR and WDS there was no evidence
of such a role
Most cooking was done in facility kitchens away from areas that residents could access This
tended to result in the house kitchens being treated more like institutional serveries Fridges mainly
contained large juice jugs and prepared snacks However at MPW and MPN when a resident opened
the fridge door the door was full of condiments and casseroles it looked just like home because of
an effort to keep institutional sized packages to a minimum These two sites used their kitchens quite
differently than the other three sites At MPN and MPW all breakfasts and snacks were prepared in
the houses each day by direct care staff On four weekdays lunches also were prepared Residents
were invited to participate in some of the chopping slicing and mixing which was considered an
essential component of the care program When meals were delivered from nearby facility kitchens
staff decanted items into family-size serving bowls They added condiments and poured drinks
Mapping Five Sites
23 of 47
serving the meals much like those prepared in-house Although residents helping with meal
preparation appeared to be limited to MPN and MPW staff records indicated additional forms of
daily and special occasion activities occurred at all sites Daily activities included easy tasks eg
folding laundry and exercises at all five sites discussion groups at MDR and WDS religious
activities at ASB MPN and MPW musicsinging at ASB MPW and WDS movies at ASB and
grooming at all sites except WDS
Outdoor courtyards were accessible to residents on the observation days at all sites The
barbecue meal at MPW drew the highest number of residents outside but from mid-morning until
early evening residents were seen on the patios or walkways This was true at every site except
MDR where few ventured outside (data not presented)
Disruptive behaviors were seen only at ASB where at 730 am 230 pm and 430 pm a
single resident was disruptive Whether this was the same or different resident is not known the
identity of persons was not recorded This accounted for only 03 of all behaviors seen at ASB (and
was not shown on Figure 7)
Discussion
The TESS-2+scale results clearly indicated that the pioneering WDS site and the four sites
modeled on it met best practice standards in many areas These include the ratings for global site
assessment overall configuration of self-contained living arrangements with adjacent common
spaces informal workspaces for staff and accessible outdoor green spaces walking paths and
maintenance More pertinent to the present study there were no significant differences between the
sites that had 12-capacity houses and those with 20-capacity houses on any TESS items the NIA
subscale of overall environmental quality (SCUEQS) or CAAQS the composite score devised by
Mapping Five Sites
24 of 47
Slaughter et al (2006) Sites with 20-capacity houses did not look substantially different from sites
with 12-capacity houses according to the scale
Behavioral Mapping
A principal finding from behavioral mapping was the amount of time residents were found
engaged in leisure activity at all five sites Leisure was the most frequently observed activity for
MDR MPN and MPW the second most frequent at ASB and the third at WDS The level of
participation in meaningful activities is considered an important measure of residentsrsquo quality of life
(Gonzalez-Salvador et al 2000 Zimmerman et al 2005) Although the extent of engagement is
typically measured in more focused and intensive ways the fact that observers saw residents who
were alert and watching an activity is meaningful because observers were asked to distinguish
whether the resident was ldquojust sittingrdquo or ldquowatchingrdquo if that was the extent of the involvement When
percentages of time spent in Leisure are combined with Activities of Daily Living following the lead
of Gottesman and Bourestom (1974) who combined personal care television and socializing the
results in this study are ASB 468 MDR 701 MPN 471 and MPW 483 All percentages
total are better than the 1974 studyrsquos 43 Only WDS with 261 was substantially worse and that
was largely because so little time was devoted to the evening meal Ice (2002) studying one site had
found only 12 of time spent in social activities however little time was spent Just Sitting or
Watching For the five sites in this study total percentages of these inactive behaviors are ASB
316 MDR 171 MPN 229 MPW 176 and WDS 402 which are all substantially
different than Gottesman and Bourestomrsquos finding of 56 of time engaged in no activity or passive
activity or the 65 seen by (Ice 2002)
Surprisingly the five sites differed in the percent of maximum possible number of sightings
of residents observed in public areas per scan per day ranging from 49 at MDR to 80 at WDS
This range of 38 difference between the lowest and highest sites is considerable The traditional
concern of staff is that residents who stay in their rooms miss out on socialization and planned
Mapping Five Sites
25 of 47
activities (Grade 1976 Hogden 1985) The public areas most frequented by WDS residents were the
fireplace area and the common hallway area At most sites if the residents were not observed in the
common areas it would be likely that they were in the house areas This was confirmed in the other
principal finding that the percent of maximum possible sightings in the house areas was lowest for
WDS at 25 and highest at ASB at 50 At ASB residents spent 80 of their time in their two
houses At WDS they were encouraged to spend their time in the common areas and they did The
houses were used very differently at the two sites and this may have been because the architects who
were very involved in both sites made it evident that they were intended to be used differently
However the use of communal spaces often has little to do with the intended purpose Lawton
(1970) reports that in 10 observational rounds of a facility a total of 13 people were observed in the
nine social rooms on the nine floors while 79 were counted in the main floor social room where
arrivals and departures could be observed Similarly areas around nursing stations and elevators
frequently draw residents (Lawton 1970 Lawton 1977 Snyder 1980)
A number of factors can be ruled out in the search for unique characteristics of WDS that
could have contributed to the above findings The first factor is the reliability of the observers It is
unlikely that the differences were due to variability in the observational skillsprocedures of the
observers because of the high level of agreement in the assessment of interobserver reliability and
because all observers followed the same protocol in collecting the data The observersrsquo reliability was
also attested to by the similarity of the data within sites across the two days of data collection The
second factor is the general floor plan WDS shared the same basic floor plan with MPN and MPW a
building footprint like the capital letter E So it is unlikely that the gross outer shape of the floor plan
was relevant The third more general factor is related to the inter-site comparability of the TESS-2+
data These data indicate that the five sites were remarkably similar in general and internal design
features WDS has ratings on all measures that were comparable to one or more of the other sites
Mapping Five Sites
26 of 47
including potentially relevant measures such as the presence of homelike features the degree of
interaction with staff and residentsrsquo involvement in activities
There are however a number of other factors that may be relevant to understanding the
WDS data WDS was the only site in which meals were served in the common areas as well as in the
house dining rooms Congruently as already noted the highest number of resident sightings at WDS
was in the common areas (fireplace and common hallway) and most of these common area sightings
were in the common areas of WDS adjacent to the central area of the three houses Importantly these
were the only common areas with a direct line of sight to the central hall and kitchen of the central
house (School House) Staff notes indicated that the number of meal servings from the central house
kitchen was twice as high as that of the kitchens of the other two houses at WDS Again there is
congruence resident sightings in the central house dining room although low relative to central
common areas were twice as high as in the dining rooms of the other two houses at WDS It is also
relevant that staff used all parts of the central common area for activity programming Thus it seems
probable that several factors including the internal floor plan meal service and activity
programming made the central common areas of WDS a multiuse area which resulted in high
number of resident sightings though out the day with peaks at meal times It is worth asking whether
WDS staff would have used the central common area so intensely if the house kitchens had been
aligned with the dining rooms providing staff with oversight as in MPN and MPW
These observations could also explain another WDS anomaly that is the low number
of residents seen to be engaged in ADL activities at meal times compared to other sites If the
lower-functioning residents at WDS engaged in other activities in the central common areas
perhaps abandoning a meal to walk or sit elsewhere that could result in fewer observations
of eating during the mealtime Conversely it could mean that it would be more likely that
Mapping Five Sites
27 of 47
other activities (ie watching walking sitting and leisure activities) would be seen during
meal times which was the case in WDS
Finally the unique features of the WDS resident sighting data may have been related to the
greater degree of dementia (lower than average MMSE scores) of WDS residents The average
MMSE scores at other sites were 50 to 100 higher indicating less severe symptoms than the
average WDS score Congruently WDS had relatively high levels of sightings of sitting watching
and walking behavior and the highest number of pacing incidents Thus it is possible that the
differences in degree of dementia between sites and the related differences in levels of ambulation
made it more likely that WDS residents would leave their rooms and therefore WDS residents would
be sighted most frequently in the common areas of the WDS facility
It is important to note that no substantial differences were found between the 20-capacity
and 12-capacity houses that is in the mean domain scores of the TESS which was used to describe
environmental characteristics Scores were much the same across the five sites The TESS has goals
and domains aligned with the general site design which are more architecturally based and those
best aligned with interior design site operations and providing care
The architects might have thought their design at ASB and MDR would result in a small care
group of 10 and that residents along each bedroom hall would form a household but this did not
happen The residents in the 20-capacity houses did not form a 20-resident cluster either instead they
formed small groups for eating and activities Therefore other factors such as early or late rising or
naturally-formed friendships may be a greater influence than bedroom proximity The addition of
eight more residents per house might be anticipated to lead to crowding in the housesrsquo living-dining
areas or some other notable difference However crowding was not evident in the 20-capacity
houses In fact WDS gatherings in the common areas were more apt to be viewed as crowds
Mapping Five Sites
28 of 47
Observations indicated there that Disruptive Behavior often attributed to crowding was rare It
occurred in only one site and therefore could not be associated with a particular design
These observational results combined with the TESS results have broad implications for
future studies The first implication is methodological and the second is empirical Methodologically
the combination of architectural and behavioral measures in studies of facilities for the elderly
highlights the advantages over methodologies that employ only behavioral measures eg Dementia
Care Mapping (Brooker 2005 Fulton Edelman amp Kuhn 2006 Sloane Brooker Cohen et al
2007) and over studies that rely on client interviews (Kane 2003) Empirically 20 residents in a
house is approaching the size of dementia units in some nursing homes The present study revealed
that the main difference seen in the operation of the 12-resident house and the 20-resident house
design was that the latter appeared to hold more activities within the house raising questions about
the value and need for those common spaces whereas the former made more use of the common
spaces for activities In this way behavior was affected by the house design and by the way that staff
chose to organize activities
Mapping Five Sites
29 of 47
References
Benson D M Cameron D Humbach E Servino L amp Gambert S R (1987) Establishment and
impact of a dementia unit within the nursing home Journal of the American Geriatrics Society
35 319-323
Brawley E C (1997) Designing for Alzheimerrsquos disease Strategies for creating better care
environments New York Wiley
Brooker D (2005) Dementia Care Mapping A review of the research literature The Gerontologist
45 Special Issue I 11ndash18
Calkins M P Meehan R A amp Lipstreuer E (1999) Creekview Its history and evaluation
Kirtland OH IDEAS Inc
Colling K B (1999) Passive behaviors in Alzheimer disease A descriptive analysis American
Journal of Alzheimers Disease and Other Dementias 14 27-40
Cronin-Golumb A (1995) Vision in Alzheimerrsquos disease The Gerontologist 35 370-376
Day K Carreon D amp Stump C (2000) The therapeutic design of environments for people with
dementia A review of the empirical research The Gerontologist 40 397-416
Deely B Klingensmith L amp Silverman M (1995) Developing a residential Alzheimers facility
Focus on Geriatric Care and Rehabilitation 8(7) 1-8
DiMotta S Dubney B M Hoglund J D amp Kershner C (1993) Long-term care design Blazing
new territory - code reform and beyond Journal of Healthcare Design 5 197-203
DiMotta S amp Hoglund J D (2000) Woodside Place A residential care model for the Alzheimerrsquos
and dementia resident Symposium on Healthcare Design Anaheim CA Center for Healthcare
Design
Mapping Five Sites
30 of 47
Doty M M Koren M J amp Sturla E L (2008) Culture change in nursing homes How far have
we come Findings from The Commonwealth Fund 2007 National Survey of Nursing Homes
New York The Commonwealth Fund
Edelman P Fulton B R Kuhn D amp Chang C H (2005) A comparison of three methods of
measuring dementia-specific quality of life Perspectives of residents staff and observers The
Gerontologist 45 27-36
Fleiss J L (1981) Statistical methods for rates and proportions (2nd ed) New York John Wiley amp
Son
Folstein M F Folstein S E amp McHugh P R (1975) Mini-Mental State a practical method for
grading the cognitive state of patients for the clinician Journal of Geriatric Research 12 189-
198
Fulton B R Edelman P amp Kuhn D (2006) Streamlined models of dementia care mapping
Aging amp Mental Health 10 343-351
Gold D T (1991) A descriptive typology of dementia units In P D Sloane amp L J Mathew (Eds)
Dementia units in long-term care (pp 50-61) Baltimore Johns Hopkins University Press
Gonzalez-Salvador T Lyketsos C G Baker A Hovanec L Roques C Brandt J et al (2000)
Quality of Life in dementia patients in long-term care International Journal of Geriatric
Psychiatry 15 181-189
Gottesman L E amp Bourestom N C (1974) Why nursing homes do what they do The
Gerontologist 14 501-506
Grade B L (1976) A study of the entry crisis to a nursing home Unpublished masterrsquos thesis
University of Wisconsin Milwaukee
Grant L A (1998) Beyond the dichotomy An empirical typology of Alzheimerrsquos care in nursing
homes Research on Aging 20 569-592
Mapping Five Sites
31 of 47
Greene J A Asp J amp Crane N (1985) Specialized management of the Alzheimerrsquos disease
patient Does it make a difference A preliminary progress report Journal of the Tennessee
Medical Association 78 559-563
Harper G J (1998) Stress and adaptation among elders in life care communities Unpublished
doctoral dissertation Ohio State University Columbus
Hogden K M (1985) Leisurerecreation needs of hospitalized elderly A task force report
Activities Adaptation amp Aging 7 53-65
Hoglund D J amp Ledewitz S D (1999) Designing to meet the needs of people with Alzheimerrsquos
disease In B Schwarz amp R Brent (Eds) Aging autonomy and architecture Advances in
assisted living (pp 229-261) Baltimore John Hopkins University Press
Ice G H (2002) Daily life in a nursing home has it changed in 25 years Journal of Aging Studies
16 345-359
Imamoğlu Ccedil (2007) Assisted living as a new place schema A comparison with homes and nursing
homes Environment and Behavior 39 246-268
Innes A amp Surr C (2001) Measuring the well-being of people with dementia living in formal care
settings The use of Dementia Care Mapping Aging and Mental Health 5 258-268
Kane R A (2003) Definition measurement and correlates of quality of life in nursing homes
Toward a reasonable practice research and policy agenda The Gerontologist 43 Special
Issue II 28ndash36
Kuhn D Kasayka R E amp Lechner C (2002) Behavioral observations and quality life among
persons with dementia in 10 assisted living facilities American Journal of Alzheimerrsquos Disease
and Other Dementias 17 291-298
Lawton M P (1970) Ecology and aging In L A Pastaland amp D H Carson (Eds) The spatial
behavior of older people (pp 41-67) Ann Arbor MI University of Michigan Press
Mapping Five Sites
32 of 47
Lawton M P (1977) The impact of the environment on aging and behavior In K W Schaie (Ed)
Handbook of the Psychology of Aging (pp 276-301) New York Van Nostrand Reinhold
Lawton M P Weisman G D Sloane P amp Calkins M (1997) Assessing environments for older
people with chronic illness Journal of Mental Health and Aging 3 83-100
Lawton M P Weisman G D Sloane P Norris-Baker C Calkins M amp Zimmerman S I
(2000) Professional Environmental Assessment Procedure for special care units for elders with
dementing illness and its relationship to the Therapeutic Environment Screening Schedule
Alzheimer Disease and Associated Disorders 14 28ndash38
Lee M Madden V Mason K Rice S Wyburd J amp Hobson S (2006) Occupational
engagement and adaptation in adults with dementia A preliminary investigation Physical and
Occupational Therapy in Geriatrics 25 63-81
Lehrner P N (1979) Handbook of ethological methods New York Garland STMP
Margulis S T (2003) Privacy as a social issue and behavioral concept Journal of Social Issues 59
243-261
Martin P amp Bateson P (1987) Measuring behaviour An introductory guide New York
Cambridge University Press
Mathew L J amp Sloane P D (1991) Organizing and staffing dementia units In P D Sloane amp L
J Mathew (Eds) Dementia units in long-term care (pp 101-127) Baltimore Johns Hopkins
University Press
McAllister C L amp Silverman M A (1999) Community formation and community roles among
persons with Alzheimerrsquos disease A comparative study of experience in a residential
Alzheimerrsquos facility and a traditional nursing home Qualitative Health Research 9 65-85
McCracken A L amp Fitzwater E (1989) The right environment for Alzheimerrsquos Geriatric
Nursing 10 293-294
Mapping Five Sites
33 of 47
Milke D L (2003) Iterative post-occupancy evaluations of the McConnell Place North design
[Abstract] Proceedings of the 56th Annual Scientific Meeting of the Gerontological Society of
America 43 48 San Diego CA
Milke D L Clark C amp Bucknell M (2000) Assessing the adequacy of residential lighting in two
care centres for persons with Alzheimerrsquos Disease using the new age-adjusted North American
illumination recommendations (Research Report) Ottawa Ontario Canada Canada Mortgage
and Housing Corporation
National Institute on Aging Coordinating Center (1993) NIA collaborative studies special care units
for Alzheimers disease Manual of procedures Davis CA Northern California Alzheimers
Disease Center University of California
Rabig J Thomas W Kane R A Cutler L J amp McAlilly S (2006) Radical redesign of nursing
homes Applying the Green House concept in Tupelo Mississippi The Gerontologist 46 533-
539
Rule B G Milke D L amp Dobbs A R (1992) Design of institutions Cognitive functioning and
social interactions of the aged resident Journal of Applied Gerontology 11 475-488
Saxton J Silverman M Ricci E Keane C amp Deely B (1998) Maintenance of mobility in
residents of an Alzheimer special care facility International Psychogeriatrics 10 213-224
Schwarz B Chaudhury H amp Tofle R B (2004) Effect of design interventions on a dementia care
setting American Journal of Alzheimers Disease and Other Dementias 19 172-176
Silverman M Ricci E Saxton J Ledewitz S McAllister C amp Keane C (1995) Woodside
Place The first three years of a residential Alzheimerrsquos facility (Vols 1-2) Oakmont PA
Presbyterian Senior Care
Skea D amp Lindesay J (1996) An evaluation of two models of long-term residential care for
elderly people with dementia International Journal of Geriatric Psychiatry 11 233-241
Mapping Five Sites
34 of 47
Slaughter S Calkins M Eliasziw M amp Reimer M (2006) Measuring physical and social
environments in nursing homes for people with middle- to late-stage dementia Journal of the
American Geriatrics Society 54 1436-1441
Sloane P D Brooker D Cohen L Douglass C Edelman P Fulton B R et al (2007)
Dementia Care Mapping as a research tool International Journal of Geriatric Psychiatry 22
580-589
Sloane P D Mitchell M Priesser J S Phillips C Commander C amp Burker E (1998)
Environmental correlates of resident agitation in Alzheimerrsquos disease special care units Journal
of the American Geriatric Society 46 862ndash869
Sloane P D Mitchell C M Weisman G Zimmerman S Foley K M L Lynn M et al
(2002) The Therapeutic Environment Screening Survey for Nursing Homes (TESS-NH) An
observational instrument for assessing the physical environment of institutional settings for
persons with dementia Journals of Gerontology Series B Psychological Sciences and Social
Sciences 57B(Suppl 2) S69-S78
Sloane P D Zimmerman S Williams C S Reed P S Gill KS amp Preisser J S (2005)
Evaluating the quality of life of long-term care residents with dementia The Gerontologist 45
37-49
Snyder L G (1980) An exploratory study of patterns of social interaction organization and facility
design in three nursing homes In J Hendricks (Ed) Institutionalization and Alternative Futures
(pp 68-80) Farmingdale NY Baywood Pub Co
Sommer R amp Sommer B B (1986) A practical guide to behavioral research Tools and
techniques (2nd ed) New York Oxford
Van Haitsma K Lawton M P amp Kleban M H (2000) Does segregation help or hinder
Examining the role of heterogeneity in behavioral and emotional aspects of quality of life for
Mapping Five Sites
35 of 47
persons with cognitive impairment in the nursing home Research and Practice in Alzheimerrsquos
Disease 4 163-177
Verbeek H van Rossum E Zwakhalen S M G Kempen G I J M amp Hamers J P H (2009)
Small homelike care environments for older people with dementia A literature review
International Psychogeriatrics 21 252-264
Voelkl J E (2006) Therapeutic environments in nursing homes Fostering residents meaningful
activity engagement Activities Directors Quarterly for Alzheimers and Other Dementia
Patients 7(3) 35-44
Warren S (Ed) (1998) Innovative dementia care McConnell Place North evaluation (Research
Report) Edmonton Alberta Canada Evaluating Programs of Innovative Continuing Care
Zeisel J (1998) The Hearthstone health environments case study Journal of Healthcare Design
Proceedings from the Symposium on Healthcare Design San Francisco CA National
Symposium on Healthcare Design Inc
Zeisel J Hyde J amp Levkoff S (1994) Best practices An environment-behavior (E-B) model for
Alzheimer special care units American Journal of Alzheimerrsquos Care and Related Disorders and
Research and Care 9(2) 4-21
Zimmerman S Sloane P D Williams C S Reed P S Preisser J S Eckert J K et al (2005)
Dementia care and quality of life in assisted living and nursing homes The Gerontologist 45
133-146
Mapping Five Sites
36 of 47
Table 1 Comparison of Architectural Features Across Five Sites
Feature ASB MDR MPN MPW WDS
Total facility square footage 23040 sq ft 27308 sq fta 24750 sq ft 23864 sq ft 21540 sq ft
Size of administration area (offices conference reception etc but not service or employee spaces)
960 sq ft (No entry hall)
1584 sq ft day program offices and program space
1675 sq ft 1629 sq ft 972 sq ft (No entry hall)
Staff (lunch) room 16rsquo x 18rsquo 6rsquo11rdquo x 6rsquo2rdquo 158rsquo x 16rsquo 138rsquo x 16rsquo 95rsquo x 30rsquo (plus)b
Treatment or examination room
No Yes In daycare area
No No Yes In central
areac
Medications storage Central medication cart
Medication room Medication room per house
Medication room per house
Central medication cart
Location of meal preparation
Facility kitchen in administration area
Facility kitchen in administration area
Adjacent nursing home (see house kitchen)
Adjacent nursing home (see house kitchen)
Facility kitchen in administration area
Use of house kitchen Servery snacks Servery snacks Meal preparation for all breakfasts and some lunches servery
Meal preparation for all breakfasts and some lunches servery
Servery snacks
Family dining room or central country kitchen usage
Small group activities family functions by reservation
Small group activities family functions by reservation
Small group meetings Great Room party food preparation family functions by reservation
Small group meetings Great Room party food preparation family functions by reservation
Small group activities family functions by reservation
Houses and capacity 2 20 2 20 3 12 3 12 3 12
Private tubroom Two off the central hallway
Two off the central hallway
One located in each house
One located in each house
None
Private shower areas One per 10 residents located in each wing of each house
One per 10 residents located in each wing of each house
One per resident located in each resident room with the one shared bedroom having a shared shower
One per resident located in each resident room with the one shared bedroom having a shared shower
One per 12 residents located in each house
Resident room doors Split door Split door Split door Regular Split door
Inventory of public rooms and seating capacity (includes all alcoves that can be used for seating and seating areas near exits)
15 165
17 176
15 232
13 219
14 182
Variety and appearance of outdoor Area
2 small (little greenery) 1 medium (mixed hardgreen surfaces) and a large courtyardmdashvery appealing
2 small (much greenery) 1 medium (mixed hardgreen surfaces) 2 large courtyards (1 mixed hardgreen surfaces 1 green) mdash very appealing
3 small (much greenery) 1 large (mostly green courtyard mdash very appealing
3 small (much greenery) and 1 large (mostly green courtyard mdash very appealing
1 small (much greenery) 1 medium (mostly green) and 1 large (mostly green) courtyard mdash very appealing
a Does not include researchteaching wing Total for entire floor space is 40382 sq ft b Room at WDS was not intended as a lounge ie a retreat from work to professionalize the care staff role it was to serve as a place to read and discuss work At other
sites the lunch room also served as a lounge c Room was intended as a multi-purpose room
Mapping Five Sites
37 of 47
Table 2 Therapeutic Environment Screening Scale Items for Goal and Domain Possible Range
Midpoint and Mean in Each Group
Therapeutic Goal and Domain
Item Numbers Range Mid-point ASB amp MDR
20-Capacity Houses MPN MPW amp WDS
12-Capacity Houses
ASB MDR Site Scores
Mean MPN MPW WDS Site Scores
Mean
Safetysecurityhealth
Exit control 2a 2b 2c 2d 2e 2g
2h 3a 3b 0-11 55 2 1 15 1 2 2 17
Maintenance 7b1Dagger 7b2Dagger 7b3Dagger 7b4Dagger 0-8 40 8 8 80 8 8 80
Cleanliness 7a1Dagger 7a2Dagger 7a3 7a4 0-8 40 8 8 80 7 8 8 77
Lack of odorsℓ 9aDagger 9bDagger 0-4 20 4 3 35 4 4 4 40
Safetyℓ 7c1 7c2Dagger 7c3 7c4 8 0-10 60 10 10 100 10 10 10 100
Orientationcuing 19 20ф 27a 27bcDagger
27d 27e 27f 28 29 0-17 85 1212 120 11 9 12 107
Privacycontrol
Privacy 30a 30b 30c 30d 0-4 20 0 0 0 1 2 0 10
Functional ability 16 17a 17b 18Dagger 0-7 35 7 7 70 7 7 7 70
Stimulation
Lighting 21 22a 22bDagger 22cDagger
23a 23b 23c 0-14 70 13 13 130 11 14 13 127
Tactilevisual
stimulation 34 35Dagger 37b 0-16 80 10 6 80 15 14 11 133
Quietness 24a 24b 24c 24d
24eDagger 24f 24g 25 26 0-25 125 21 21 210 19 20 23 207
Physical attractiveness
4a1 4a2 4b1 4b2
4c1 4c2 4d1 4d2 37c 0-34 140 16 15 155 15 16 16 157
Socialization
Homelike
environment 15Dagger 31Dagger 32 0-9 45 9 9 90 9 9 9 90
Resident
appearance 36Dagger
0-2 10 2 2 20 2 2 20
SCUEQS 0-41 - 41 39 40 39 4141 40
CAAQS sect 0-100 - 786 857
Large means represent better physical environment
Dagger Items used to compute the 18-item Special Care Environmental Quality Scale (SCUEQS) 27b and 27c were treated as a single item and item 15 was
misnumbered in the TESS-2+ Revised version (as item 13) ф Item 20 is the percentage of common rooms with signsgraphics floor plans in all sites allowed a view into common rooms (scored as zero) ℓ An item was unintentionally omitted from the TESS-2+ scoring form (10 in Odors and 11 in Safety) sect Composite Above Average Quality Score (CAAQS) represents the percentage of TESS-2+ domains that were above average in quality
Mapping Five Sites
38 of 47
Table 3 Percent of Resident Population Who Were Observed During Behavior Scans
at Each Site in Particular Areasa
AreaSite 20-Capacity Houses 12-Capacity Houses
ASB MDR MPN MPW WDS
Total Areas 608 493 511 564 803
Total Common Areas 62 158 169 200 511
Total Outdoor Areas 46 02 11 56 38
Total House Areas 500 333 331 311 254
House 1 259 168 115 69 62
House 2 241 165 108 128 123
House 3 108 114 69
House Kitchen 149 08 75 53 49
House LivingDining Room 324 278 236 232 200 a Resident data were adjusted to show the mean percent of residents at a site who were observed per scan per day Note Total Areas is the sum of the following Total Common Total Outdoor and Total House Total House Areas is the sum of Houses 1 House 2 and House 3 House Kitchen and LivingDining Rooms are summed across houses Blank cells indicate that the question was not applicable
Mapping Five Sites
39 of 47
Table 4 Percent of Resident Population Who Were Observed During Behavior Scans
at Each Site in Particular Common Areasa
Location 20-Capacity Houses 12-Capacity Houses ASB MDR MPN MPW WDS
Great Room 07 75 94 91 64
Fireplace Seating Area 22 69 43 13 106
ActivityCraft Room 04 47 00 02 10
TV Room ndash ndash 43 64 58
Other TV Area ndash ndash 11 39 ndash
Common Area Hallway Seating 37 108 138 143 396
Music Room ndash ndash 00 ndash 00
Garden Room ndash ndash 00 ndash 04
Beauty Salon 39 12 00 00 00
Family Dining RoomCountry Kitchen 00 09 00 00 00
Total 109 320 329 352 638 a Resident data were adjusted to show the mean percent of residents at a site who were observed per scan per day Note Dashes indicate that residents were not observed in these areas
Mapping Five Sites
40 of 47
Table 5 Percent of Resident Population Who Were Observed During Behavior Scans
at Each Site at Particular Times of Day
Time of Day 20-Capacity Houses 12-Capacity Houses
ASB MDR MPN MPW WDS
Before Lunch 541 360 386 475 654
Lunch 805 663 667 722 1000
Between Meals 657 530 506 589 963
Supper 765 738 744 744 922
After Supper 50 390 447 469 740 a Resident data were adjusted to show the mean percent of residents at a site who were observed per scan per day Note Before Lunch (4 scans-730-1030) Lunch (2 scans-1130 amp 1230) Between Meals (3 scans-1330 to 1530) Supper (2 scans-1630 amp 1730) After Supper (4 scans-1830 to 2130)
Mapping Five Sites
41 of 47
Figure 1 Floor plan of Asbury Place Mt Lebanon PA
Mapping Five Sites
42 of 47
Figure 2 Floor plan of Marjorie Doyle Rockwell Center Cohoes NY
Mapping Five Sites
43 of 47
Figure 3 Floor plan of McConnell Place North Edmonton AB
Mapping Five Sites
44 of 47
Figure 4 Floor plan of McConnell Place West Edmonton AB
Mapping Five Sites
45 of 47
Figure 5 Floor plan of Woodside Place Oakmont PA
Mapping Five Sites
46 of 47
Figure 6
McConnell Place Northordf Residentsrsquo Activities When Alone and in the Presence of Staff
ordf The average MMSE score was 153 at MPN higher than the average across sites 132 + 15 (M+SE) MPN residents appeared not to initiate activities when alone
0
5
10
15
20
25
30
35
40
Alone Day 1 With Staff Day 1 Alone Day 2 With Staff Day 2
Nu
mb
er R
esid
ents
Arts amp Crafts
Chores
CookingBaking
Eating
Exercising
Games
Grooming
Lg Activity Grp
Music Event
Reading
Sm Interaction
Walking
Watching
Watching TV
Other
Mapping Five Sites
47 of 47
Figure 7
Percent of Scans in Which Residents at Each Site Engaged in Particular Behaviors
0
10
20
30
40
50
60
70
80
90
100
ASB MDR MPN MPW WDS
Misc
Just Sit
Watch
Walk
Leisure
Work
ADLs

Mapping Five Sites
7 of 47
Data Collection and Analysis
We collected information on principal characteristics relating to physical features staff
volunteers residents and care programming retrospectively from site records of April and May of
1998 The assessment of physical features included a review of floor plans and records of
maintenance requests On-site observation was done to complete the TESS-2+ The interrater
reliability of TESS-2+ ratings was assured by prior tests of the agreement between observers
Although an observer typically uses the scale to assess a dementia unit in a nursing home in this
study the assessment was of the five small purpose-designed settings (the third author completed the
TESS for ASB MDR and WDS the first and second authors did MPN and MPW) During the NIA
studies the scale was used not only for special care units but also some entire sites (Sloane et al
2002) and Slaughter Calkins Eliasziw and Reimer (2006) found this version of the TESS useful to
distinguish between purpose-built dementia care facilities and traditional care facilities
The Special Care Unit Environmental Quality Scale (SCUEQS) was used to score the
TESS-2+ using a method previously described (Sloane et al 2002 Lawton et al 2000) The 18-item
SCUEQS subscale derived from the TESS-2+ was determined to be a robust measure of overall
environmental quality during the NIA studies Scores can range between 0 and 41 with 41 being a
better environment for persons with dementia Internal consistency of this scale was measured using
Cronbach coefficient alpha (α 5082) (Sloane et al 1998) In addition using a method developed by
Slaughter et al (2006) a composite score the Composite Above Average Quality Score (CAAQS)
was calculated using all items from the TESS-2+ A value of 1 was assigned if the rating for the
center was above the middle of the range for the item (ie midpoints are shown in column four of
Table 2) and if equal to or below the midpoint the assigned score was 0 For each cluster of centres
(the 20 capacity houses of ASB and MRD and the 12 capacity houses of MPN MPW and WDS) the
resulting binary scores representing each of the 14 domains in the TESS-2+ were summed and a
percentage of 14 was calculated to facilitate comparison with the data of Slaughter et al (2006) This
Mapping Five Sites
8 of 47
number represents the percentage of domains that were above average in quality for the site Group
means were then used to compare results on the SCUEQS and the CAAQS for the 20-capacity and
the 12-capacity sites
Behavior Mapping
The principal method of behavioral mapping used place-centered instantaneous scans which
provides systematic samples of behaviors This is one of the least intrusive methods for direct
observation (Lehrner 1979) During behavioral mapping the observer at set intervals quickly notes
the activity of people within an area and moves on to other areas These scans are much less invasive
than continuous observation and with momentary scans interobserver reliability is inherently better
Often observation is considered the gold standard for collecting behavioral data but there is a
concern that the presence of an observer influences the behavior (typically to more socially
acceptable behavior) During scans the observer quickly passes through the spaces of interest
allowing very little time for those present to adjust their activity
The data were collected by on-site staff familiar with facility routines following instructions
in a procedure manual written by the first author Thus the collection of data across sites followed a
standardized methodology including the use of common behavioral categories common floor-plan
notation preprinted checklist sheets trained paid observers and time-locked sampling Approval for
direct observation as described was obtained appropriate to each jurisdiction Observers learned
mutually exclusive and comprehensive definitions a standard procedure for ethogramatic checklists
for nine categories of behaviors On each of two days at each site they directly observed activities of
persons in public areas following a systematic protocol Every hour over 14 hours they toured public
spaces noting the subjectrsquos group (resident staff family others) and the type time and location of
the activity (Martin amp Bateson 1987 Sommer and Sommer 1986) Information was written upon
copies of site floor plans The identity of individuals was not recorded General activity categories
included just sitting (inactively) activities of daily living (ADLs eg self-care grooming washing
Mapping Five Sites
9 of 47
eating taking medications) light housekeeping leisure disruptive behavior walking watching and
miscellaneous behaviors Communication was indicated as an independent action because it could
occur concurrently with any of the activity categories
Information about activities at each of the five sites included a description and schedule of
daily and special occasion events for residents average attendance of residents at programmed events
of each type the procedures for intervening when problem behaviors arose definition of problem
behaviors and the average weekly incidence of problem behaviors (not presented) The interpretation
of data from Behavior Mapping benefited from this information
Sampling and Data Analysis
Behavioral mapping included all care staff volunteers family members residents and others
over a two-weekday period in early June at each site except at MDR where data collection was on
two sunny days in September that were comparable to June weather Observations were made each
hour between 0730 and 2130 hours for a total of 15 scans per day They were conducted in all public
spaces at each site excluding rooms bathing rooms toilets and bedrooms as well as areas used
exclusively by staff Two observers were trained at each site to collect the data to a criterion of at
least 85 agreement on location person and behavioral categories Behavior observations were
collated by site by activity and time-of-day format
Results
Floor Plan Comparisons
Building orientation varied across sites as did the views of outdoor gardens (floor plans in
Fig 1-5) Table 1 lists some of the most salient similarities and differences between the sites
Each building had residential wings referred to as houses with residentially scaled rooms
linked by a common area shared by all houses (Figures 1-5) The common areas in all sites included
Mapping Five Sites
10 of 47
a great room a fireplace seating area at least one activity or craft room a family or private dining
room and a beauty salon
Insert Figures 1-5 and Table 1 about here
Overall the floor plans of ASB and MDR were very similar as were the plans of the other
three centers MPN MPW and WDS In the latter three centres the houses were equivalent to the
three parallel wings flanked by courtyards that is outdoor spaces with natural green elements and a
view to the sky Each wing was self-contained each had a kitchen livingdining room and laundry
and a room for bathing or showering Each wing had a central hallway with bedrooms running its
length on either side accommodating 12 residents ASB and MDR floor plans had two perpendicular
housing areas comprised of two parallel wings The architects viewed this design as four houses each
accommodating 10 residents Each bedroom hallway and one living area was considered a house and
a pair of houses was viewed as sharing a kitchen The kitchen was planned as a hub for staff assigned
to the two bedroom hallways and a place to locate a staff-buddy for a task (DiMotta amp Hoglund
2000) However at ASB for example the arrangement of furniture with glider-rocking chairs
arranged primarily in one dining-living space and tables placed in the dining-living area on the other
side of the kitchen suggested that more than the kitchen was being shared and that these common
rooms were being used as a continuous space for all 20 residents to share In gathering data from
management and staff there was no evidence that staff and residents were treating a particular
dining-living room as being the domain of just one hallway of residents Moreover ASB staff said
residents housed in bedrooms along one hall were frequently found in the other bedroom hall
Mealtime seating varied for breakfast lunch and dinner but the variation was not related to
Mapping Five Sites
11 of 47
residentsrsquo home hallway Consequently each U-shaped housing area in ASB and MDR was
considered a house for the purposes of this study
House kitchens differed across sites At ASB and MPW these were large country kitchens
but at other sites the kitchens were small At WDS kitchens were designated as ldquoserveriesrdquo Some
sites had activity areas or rooms in the common areas In the fireplace seating area adjacent to
WDSrsquos country kitchen (but not within the country kitchen) were a large dining table and matching
chairs An open wall above a bar-type counter allowed items to be passed from the country kitchen
This made the space more flexible because it was not viewed as a special events venue like the
enclosed private dining rooms in the other four centers It also encouraged various activities to be
conducted on this dining table that were not scheduled for the common areas in the other centers
Table 1 supplements this descriptive comparison
The common features included floor plans designed for small group living (houses of 12 or
20) in self-contained houses with spaces for cooking eating bathing and gatherings bedroom
hallways that are short by facility standards (yet long for family dwellings) a variety of common
spaces and informal staff workspaces but no formal nursing stations (Table1) Differences in
general design between sites were also in quantitative measures for example the number of beds
ranged from 36 to 40 the number of public rooms ranged from 11 to 17 (Table 1) and most striking
the seating capacity in public rooms varied from 165 to 232 (Table 1) with ASB and MDR having
somewhat less capacity than MPN and MPW Inspection of floor plans showing chair location (data
not shown) revealed that the differences in numbers of seats between sites were principally in the
houses kitchen and livingdining areas implying that the site differences in these floor plan areas
were relevant
Mapping Five Sites
12 of 47
Therapeutic Environment Screening Scale
Environmental characteristics were described using the 38-item Therapeutic Environment
Screening Scale (TESS-2+) Designees at each site filled out the form after training by one of the
authors of the study who was experienced in using the scale Interrater agreement was assured by
comparing interpretations and ratings consensus was reached on any issues related to scoring
Interrater reliability for TESS-2+ items had ranged from 67 to 100 agreement (Sloane et al
1998) There were no significant differences in the mean domain scores between the sites that had
12-capacity houses and those with 20-capacity houses (Table 2) The findings are presented by
grouping the items into two types of goals and domains those associated with the general site design
that may be more architecturally based and those more aligned with interior design site operations
and providing care
Insert Table 2 about here
General Design The scores related to the therapeutic goals and domains for building design
were similar across sites reflecting the implementation of the basic Woodside building model
(Table 2 Exit control Orientation and cuing Privacy and Functional ability Physical
attractiveness) All sites in this study had strategies for exit control (Table 2 2andash2h) WDS had both
alarms and keypad-locks on external exits while the other sites had keypad-locks MPN and MPW
had a reception desk at the front entrance as a clerk-observation post At ASB and MPW the external
exits were partially disguised at the other sites they were not (Table 2 3a 3b)
Mapping Five Sites
13 of 47
Orientation and cuing is related to residentsrsquo personal safety and self-awareness thus the
photos and names beside the bedrooms doorways which all sites used are important (Table 2 27
28 29) as in the ldquotip of the tongue phenomenonrdquo they need a cue to retrieve the memory (Zeisel
1998) An open interior plan that allows residents to see into public rooms is an optimal way finding
strategy for persons with dementia all sites employed this The strategic location of cues and
personal items can also aid way finding Although institutional-style directional signage is eschewed
on restroom doors for example both graphics and labels are advised Open floor plans often require
few signs MDR had the most signs and MPW used the fewest graphics and signs with other sites
having intermediate numbers (Table 2 19 20) Large windows that provide natural exterior views
(Table 2 4) are not only attractive they are another tactic that serves way finding and also provides
seasonal orientation in the latitudes of these five sites The entrances of residentsrsquo bedrooms were
personalized at all sites (Table 2 27 28 29) Redundancy is recommended and a greater variety of
items were used at ASB MDR WDS and MPN than at MPW for this purpose
All five sites scored well on supporting functional ability (Table 2 16 17 18) that is either
slowing decline or stimulating improvement which is something for which sites designed for
dementia have been associated (Benson Cameron Humback Servino amp Gambert 1987 Greene
Asp amp Crane 1985 Innes amp Surr 2001 McCracken amp Fitzwater 1989 Rabig Thomas Kane
Cutler amp McAlilly 2006 Rule Milke Dobbs 1992 Silverman et al 1995 Skea amp Lindesay 1996
Warren 1998)
Interior Design and Approach to Care The first goal of this type is safety security and
health with domains (besides exit control discussed above) of Maintenance Cleanliness Lack of
odors and Safety (of floors) A second goal is Stimulation and a third is Socialization Slaughter et
al (2006) viewed these as basic requirements and found no significant differences in these goals
when comparing the 6 special care facilities (bungalows) with the 45 units in traditional institutional
facilities so it is not surprising that the same was true for these highly similar sites
Mapping Five Sites
14 of 47
Stimulation domains include Lighting Tactile and Visual stimulation as well as Quietness
Both sensory deprivation and over-stimulation are viewed as problems (Brawley 1997 Day
Carreon amp Stump 2000 Cronin-Golumb 1995) According to Zeisel Hyde amp Levkoff (1994)
appropriate levels of stimulation results from having a site with a high sensory comprehension
ranking so not necessarily the overall calmest setting but rather one with a moderate amount of
sensory input that residents can understand Ambient lighting was considered good in all sites with
minimal glare from a number of reflecting surfaces such as picture windows and French doors (Table
2 21) Lighting was evenly distributed and levels were considered ample (Table 2 22 23) with the
exception of MPN Ambient auditory noise was not deemed a problem whether considering type or
level of noise (Table 2 24 25) The general availability of things to touch in common areas such as
those that invite handling or folding was somewhat less at ASB and MDR than at other sites
Overall ratings of home likeness and the individuality of residentsrsquo appearance were
consistently good but the general atmosphere influenced by residentsrsquo lower overall levels of
participation in activities and a less positive rating for staff interactions with residents resulted in
MDR scoring lower that other sites (Table 2 15 31 32 36) WDS scored in the mid-range on
residentsrsquo involvement but as indicated above its residents had much lower MMSE scores At all
sites personal pictures or mementos were in most residentsrsquo bedrooms However such items were
not present in common rooms at MDR
The mean SCUEQS scores (Table 2) which summarized a subset of the TESS-2+ items
were not significantly different between the sites that had 12-capacity houses and those with 20-
capacity houses The SCUEQS had been derived for the NIA studies of special care units and was
considered by experts to measure important aspect of the physical environment and serve as a
reliable measure for differentiating better nursing units and assessing the overall environmental
quality (Sloane et al 2002) The results appear to justify the architectsrsquo design decisions that resulted
in two hallways of 10 residents sharing the large kitchen and the living-dining rooms Slaughter et al
Mapping Five Sites
15 of 47
(2006) devised another composite score the Composite Above Average Quality Score (CAAQS)
which they found to be more sensitive than the SCUEQS The CAAQS represents the percentage of
domains that were above average in quality It revealed a difference between the sites with 12-
capacity houses (857) and those with 20-capacity houses (786) that was not shown by the
SCUEQS but the difference was not significant
Behavioral Mapping
Reliability The number and category (staff family or resident) of persons observed at each location
was recorded on floor plans in successive behavior scans one hour apart over the course of two
days Interobserver reliability of the scans was assessed at each site Cohenrsquos kappa a measure of
agreement between observers has a range from 0 no agreement to 100 total agreement Fleiss
(1981) characterized a kappa of 4 to 6 as fair 6 to 75 as good and over 75 as excellent There was
good agreement on average between two independent observers on the identification of behaviors
observed Kappa mean (SD) 0851 (04) and excellent agreement on identification of people being
scanned as residents staff family or others kappa mean (SD) 0732 (07)
Observations Fifteen observation periods or scans per day were conducted one per hour during
the two days of observation Examination of the within-site data revealed that the only differences
were day differences in specific scans related to the occurrence of special events eg barbecues
Consequently the data were collapsed across days A scan of about 10 minutes in duration was
required to count people in all public areas Observers minimized the possibility of counting the same
person in more than one room during a scan by following a preplanned path through the building and
working quickly Counts of sightings of staff family and volunteers and residents by hour in each
Mapping Five Sites
16 of 47
area of each site were summed over the two-day period of observation To assist the description of
the findings resident data were subsequently adjusted to show the mean percent of residents at a site
who were observed per scan per day and to show the percent of scans in which residents were
involved in a particular activity or seen in a particular room or area
Staff and Family Observations of staff and family are presented without data as these were
ancillary to the principal focus on residents Staff were seen most often in the house kitchens or
diningliving rooms across all sites except WDS At WDS staff were seen in the kitchens but
seldom in the diningliving rooms In all three sites with 12-capacity houses the central house was a
hub of staff activity with nearly twice as many staff seen in that kitchen (or an adjacent room which
was the dining room in MPN and MPW but was a hallway in WDS) as in the kitchens of the houses
on either side WDS staff were also seen in the seating area outside the great room nearly as much as
in the house kitchens Residents were seldom engaged in an activity when staff were not around eg
see Figure 6 for MPN This is not surprising because persons with Alzheimer disease lose their
ability to initiate activities (Colling 1999 Lee et al 2006) Others have shown that appropriate
environments are not sufficient residents with this disease need activities and all five sites employed
activity coordinators (Grant 1998 Van Haitsma Lawton amp Kleban 2000 Voelkl 2006)
Insert Figure 6 about here
Family members were at some sites as early as 830 am and as late as 930 pm although at
MPN all visits except one were in the afternoon ASB had a family meeting increasing the number
Mapping Five Sites
17 of 47
of sightings of family members to 42 (19 were associated with the meeting) The numbers of
sightings of family members over the two days of observation at other sites were WDS ndash 27 MPN ndash
23 and MDR and MPN ndash 12 each
Insert Tables 3 and 4 about here
Resident Locations Direct observation revealed a pattern of use that was unexpected and not
evident in TESS results Overall resident sightings were at least 25 higher at WDS than at the
other four sites (Table 3) The number of sightings in the common areas of WDS was over 60
greater than those at any other site (Table 3) Residents were most frequently seen in the area just
outside the great room (Table 4) By contrast at all other sites residents spent more time (60 of
sightings) in their houses (Table 4) ASB where residents spent 80 of their time in their houses
represented the extreme in this regard with the other sites being intermediate between ASB and WDS
(Table 4) Differences did not appear to align with whether the houses were of 20- or 12-capacity At
all sites residents were seen most frequently in the common areas outside of the houses with the
common hallways the great room and fireplace seating area accounting for decreasing numbers of
residents in that order (Table 4) however a stylist in the ASB beauty salon drew a crowd showing
how an occasional event can change behavior patterns At the sites with 12-capacity houses and
television rooms those rooms were popular and drew as many residents as the fireplace area
The large percent (396) of residents seen in common areas at WDS was attributable to
sightings in the common hallway and fireplace seating area next to the School House (Figure 5
Table 4) All residents could be gathered in the area which was slightly larger than the great room
Mapping Five Sites
18 of 47
observers noted a continuous round of activities involving groups of varying sizes No other site used
this area as intensely At WDS a day program brought in 8 additional residents and several staff who
ran activities that attracted some residents (discussions newspaper reading crafts) Observers were
asked not to count persons associated with the day program in their tally but the heavy use of the
central space and the day program activities presented there had some influence ASB and MDR also
had day programs that used separate spaces for that purpose so program participants were not seen
Chairs lining the walls in this area of WDS augmenting seating arrangements in front of and on
either side of the fireplace as well as oversized displays of small snapshots on several walls resulted
in an institutional appearance Local lore attributes the lineup of chairs to residents who initiated it
shortly after move-in Staff moved chairs back where the interior designers located them but
residents would pull them back across the corridor in a line until staff gave up
Site differences in the use of the great room were noteworthy ASB appeared to use it only
for church services on a regular basis with ldquoaudience-seatingrdquo left in place from day-to-day
Possibly this was because this great room was relatively distant from the houses (Figure 1) In WDS
MPN and MPW great room seating was rearranged throughout the day to accommodate numerous
events MPN and MPW used the great room like a town hall holding events such as afternoon teas
dances and musical entertainment At MDR small numbers of residents were in the great room
throughout the day but no large gatherings were seen
Within sites the sightings of residents in the houses were distributed fairly evenly across the
houses (Figures 1-5 Table 3) Residents were most often seen in the living-dining rooms and as
noted above staff were most often seen in the adjacent kitchens The exception was WDS where the
house design did not provide a good line of sight for staff between the kitchens and the living-dining
rooms (Figures 4 amp 5) Staff at all other sites could work in kitchens and keep an eye on residents
WDS staff actively encouraged residents to leave dining rooms after a meal and join activities in the
central area likely for two reasons because activities were not planned for the houses and because
Mapping Five Sites
19 of 47
staff working in the houses could not easily monitor a resident who remained in the house living-
dining room WDS staff were rarely seen in the housesrsquo living-dining rooms The School House the
centre house accounted for the majority of residents observed across all houses This kitchen
adjacent to the highly used area just outside the Great Room provided a relatively good monitoring
station for the house and activities in the common areas At WDS mealtimes two common areas
were used residents who needed substantial assistance with meals were often fed in the craft room
and a high-functioning group ate at the dining table alongside the fireplace seating
In the houses at other sites most sightings of residents were in the diningliving room areas
Fewer were in the kitchen and fewer still in the house hallways (Table 3) At MDR only one area
adjacent to the kitchen was devoted to dining and almost no residents were seen in kitchens The
same was not true at ASB where approximately the same proportions of residents were seen in the
shared kitchens as in each of the living-dining rooms on either side (Table 3 sums all four living-
dining rooms) However at ASB the numbers were likely from residents moving between the two
diningliving rooms and passing through the kitchens (Figure 1) because residents were rarely
engaged in the type of tasks encouraged at MPN and MPW (ie handling dishes setting tables etc
to encourage maintenance of their functional abilities Figure 7) Interestingly the highly similar sites
found different ways to use their spaces and different approaches to activities
ASB MPW and WDS held barbecues during the days of observation (Table 3) This meant
the residentsrsquo presence in the kitchen and dining areas was reduced at those meals Accordingly for
comparison across sites dining area sightings were adjusted by adding mealtime sightings in the
courtyards The peak periods for resident sightings were during the midday lunch (1130-1330) and
evening meals (1630-1830) (Table 5) Even so sightings of residents at mealtimes were only 66-
80 of occupancy indicating eight to ten residents were not seen at mealtimes in public areas at
most sites (Table 5) The exception was WDS where sightings indicated nearly all residents were
observed in public areas at mealtimes (Table 5) although WDS residents did not gather in the house
Mapping Five Sites
20 of 47
dining areas for the noon meal With most activities occurring in the core of the building WDS was
flexible about meal arrangements serving meals where residents were located such as the area
outside the great room on an activity room Residents were not required to return to their own houses
to eat They could join day program residents and eat in the common area or join residents in another
house One group of women was known for asking to eat together on their own in the common area
WDS also led other sites in the number of residents observed at other times of the day (Table 5) The
differences were especially marked in the afternoon between meals (1330-1630) and the period
after the evening meal (1830-2130) This suggests that WDS staff may have been viewing the
central areas like they would the central areas of a unit in a nursing home on dementia units staff
often prefer that residents stay in view and not return to their rooms
Resident Activity The observed activity patterns were surprising considering high levels of
resident inactivity reported for nursing home residents (Gottesman amp Bourestom 1974 Ice 2002)
Gottesman and Bourestomrsquos (1974) observations in 40 nursing homes revealed that residents spent
56 of their time during peak daylight hours engaged in no activity or passive activity In that study
residents were involved in personal care television and socializing for 43 of the time Ice (2002)
reprised the Gottesman and Bourestom study and found residents spent 65 of their time doing little
or nothing with only 12 in social activities (Ice 2002) In the present study observations of Just
Sitting and Watching were expected to measure levels of passive behaviors Residents in the five
sites appeared to be engaged in ADLs and Leisure for greater amounts of time than in Just Sitting
and Watching (although small amounts of napping as passive behavior were coded as
Miscellaneous) but this was not significant (Figure 7) Chi-square analysis using phi coefficients
found that residents at WDS engaged significantly less in ADLs than residents in other centres
(plt00001) residents at ASB MPN amp WDS were engaged less in leisure (plt005 each) ASB
Mapping Five Sites
21 of 47
residents were engaged less in Just Sitting (plt00005) and residents were observed Watching less at
MDR MPN amp MPW (plt00005 each) Leisure was the most frequently observed activity for MDR
MPN and MPW the second most frequent at ASB and the third at WDS Recreational activities
both planned and informal activities were considered to be Leisure thus watching TV or waiting to
be served at a coffee party were both coded as being Leisure (persons who were within the group and
actively attending to events but not actively engaged at the moment were coded as Leisure too and
this was distinguished from Watching which was defined as ldquoattending to activities or interactions of
others from a distance such as from a doorway watching a streetrdquo)
Insert Figure 7 about here
The ADLs were the second most frequently seen activity for MDR MPN and MPW and the
third for ASB but were seen much less at WDS The majority of ADLs across sites occurred at meal
times indicating they involved dining (ASB 570 MDR 590 MPN 758 MPW 736 but
WDS 422) The low percent of time spent by WDS residents on ADLs during the evening meal
time (42) agrees with the low number of sightings in the dining area at that time (385 of max)
It appears that WDS residents sat watched and walked but did not spend much time eating
(Figure 7) In contrast previous research at MPN and MPW has found mealtimes to be the longest
duration behavior Scans needed to be one hour apart to avoid seeing meals on two consecutive scans
and oversampling the behavior (Milke et al 2000)
Work that is tasks such as housekeeping and cooking were not seen at either of the sites
with 20-capacity houses but this is the only difference evident when compared with the 12-capacity
Mapping Five Sites
22 of 47
houses Compared to other sites MPN and MPW residents engaged in moderate proportions of all
behaviors (Figure 7) Residents at WDS spent proportionately less time on ADLs light
housekeeping and Leisure and more time at Walking Watching and Just Sitting Chi-square
analysis using phi coefficients showed that residents were observed Walking significantly less at
MDR (plt 005) residents at ASB and MDR engaged significantly less in Work and there were no
significant differences between sites in Miscellaneous activities (Figure 7)
Observersrsquo Notes
Some large differences were found in the care programs across sites Observersrsquo notes
indicated that at MPN and MPW residents were encouraged to be involved in the daily routine of the
facility and direct care staff ate meals with residents This strategy was said to stimulate conversation
and provide residents with a model for appropriate behavior Staff played the role of ldquomotherrdquo rising
to find an item in the kitchen and keeping an eye on food consumption Managers at MPN and MPW
considered this role an essential component of care At ASB MDR and WDS there was no evidence
of such a role
Most cooking was done in facility kitchens away from areas that residents could access This
tended to result in the house kitchens being treated more like institutional serveries Fridges mainly
contained large juice jugs and prepared snacks However at MPW and MPN when a resident opened
the fridge door the door was full of condiments and casseroles it looked just like home because of
an effort to keep institutional sized packages to a minimum These two sites used their kitchens quite
differently than the other three sites At MPN and MPW all breakfasts and snacks were prepared in
the houses each day by direct care staff On four weekdays lunches also were prepared Residents
were invited to participate in some of the chopping slicing and mixing which was considered an
essential component of the care program When meals were delivered from nearby facility kitchens
staff decanted items into family-size serving bowls They added condiments and poured drinks
Mapping Five Sites
23 of 47
serving the meals much like those prepared in-house Although residents helping with meal
preparation appeared to be limited to MPN and MPW staff records indicated additional forms of
daily and special occasion activities occurred at all sites Daily activities included easy tasks eg
folding laundry and exercises at all five sites discussion groups at MDR and WDS religious
activities at ASB MPN and MPW musicsinging at ASB MPW and WDS movies at ASB and
grooming at all sites except WDS
Outdoor courtyards were accessible to residents on the observation days at all sites The
barbecue meal at MPW drew the highest number of residents outside but from mid-morning until
early evening residents were seen on the patios or walkways This was true at every site except
MDR where few ventured outside (data not presented)
Disruptive behaviors were seen only at ASB where at 730 am 230 pm and 430 pm a
single resident was disruptive Whether this was the same or different resident is not known the
identity of persons was not recorded This accounted for only 03 of all behaviors seen at ASB (and
was not shown on Figure 7)
Discussion
The TESS-2+scale results clearly indicated that the pioneering WDS site and the four sites
modeled on it met best practice standards in many areas These include the ratings for global site
assessment overall configuration of self-contained living arrangements with adjacent common
spaces informal workspaces for staff and accessible outdoor green spaces walking paths and
maintenance More pertinent to the present study there were no significant differences between the
sites that had 12-capacity houses and those with 20-capacity houses on any TESS items the NIA
subscale of overall environmental quality (SCUEQS) or CAAQS the composite score devised by
Mapping Five Sites
24 of 47
Slaughter et al (2006) Sites with 20-capacity houses did not look substantially different from sites
with 12-capacity houses according to the scale
Behavioral Mapping
A principal finding from behavioral mapping was the amount of time residents were found
engaged in leisure activity at all five sites Leisure was the most frequently observed activity for
MDR MPN and MPW the second most frequent at ASB and the third at WDS The level of
participation in meaningful activities is considered an important measure of residentsrsquo quality of life
(Gonzalez-Salvador et al 2000 Zimmerman et al 2005) Although the extent of engagement is
typically measured in more focused and intensive ways the fact that observers saw residents who
were alert and watching an activity is meaningful because observers were asked to distinguish
whether the resident was ldquojust sittingrdquo or ldquowatchingrdquo if that was the extent of the involvement When
percentages of time spent in Leisure are combined with Activities of Daily Living following the lead
of Gottesman and Bourestom (1974) who combined personal care television and socializing the
results in this study are ASB 468 MDR 701 MPN 471 and MPW 483 All percentages
total are better than the 1974 studyrsquos 43 Only WDS with 261 was substantially worse and that
was largely because so little time was devoted to the evening meal Ice (2002) studying one site had
found only 12 of time spent in social activities however little time was spent Just Sitting or
Watching For the five sites in this study total percentages of these inactive behaviors are ASB
316 MDR 171 MPN 229 MPW 176 and WDS 402 which are all substantially
different than Gottesman and Bourestomrsquos finding of 56 of time engaged in no activity or passive
activity or the 65 seen by (Ice 2002)
Surprisingly the five sites differed in the percent of maximum possible number of sightings
of residents observed in public areas per scan per day ranging from 49 at MDR to 80 at WDS
This range of 38 difference between the lowest and highest sites is considerable The traditional
concern of staff is that residents who stay in their rooms miss out on socialization and planned
Mapping Five Sites
25 of 47
activities (Grade 1976 Hogden 1985) The public areas most frequented by WDS residents were the
fireplace area and the common hallway area At most sites if the residents were not observed in the
common areas it would be likely that they were in the house areas This was confirmed in the other
principal finding that the percent of maximum possible sightings in the house areas was lowest for
WDS at 25 and highest at ASB at 50 At ASB residents spent 80 of their time in their two
houses At WDS they were encouraged to spend their time in the common areas and they did The
houses were used very differently at the two sites and this may have been because the architects who
were very involved in both sites made it evident that they were intended to be used differently
However the use of communal spaces often has little to do with the intended purpose Lawton
(1970) reports that in 10 observational rounds of a facility a total of 13 people were observed in the
nine social rooms on the nine floors while 79 were counted in the main floor social room where
arrivals and departures could be observed Similarly areas around nursing stations and elevators
frequently draw residents (Lawton 1970 Lawton 1977 Snyder 1980)
A number of factors can be ruled out in the search for unique characteristics of WDS that
could have contributed to the above findings The first factor is the reliability of the observers It is
unlikely that the differences were due to variability in the observational skillsprocedures of the
observers because of the high level of agreement in the assessment of interobserver reliability and
because all observers followed the same protocol in collecting the data The observersrsquo reliability was
also attested to by the similarity of the data within sites across the two days of data collection The
second factor is the general floor plan WDS shared the same basic floor plan with MPN and MPW a
building footprint like the capital letter E So it is unlikely that the gross outer shape of the floor plan
was relevant The third more general factor is related to the inter-site comparability of the TESS-2+
data These data indicate that the five sites were remarkably similar in general and internal design
features WDS has ratings on all measures that were comparable to one or more of the other sites
Mapping Five Sites
26 of 47
including potentially relevant measures such as the presence of homelike features the degree of
interaction with staff and residentsrsquo involvement in activities
There are however a number of other factors that may be relevant to understanding the
WDS data WDS was the only site in which meals were served in the common areas as well as in the
house dining rooms Congruently as already noted the highest number of resident sightings at WDS
was in the common areas (fireplace and common hallway) and most of these common area sightings
were in the common areas of WDS adjacent to the central area of the three houses Importantly these
were the only common areas with a direct line of sight to the central hall and kitchen of the central
house (School House) Staff notes indicated that the number of meal servings from the central house
kitchen was twice as high as that of the kitchens of the other two houses at WDS Again there is
congruence resident sightings in the central house dining room although low relative to central
common areas were twice as high as in the dining rooms of the other two houses at WDS It is also
relevant that staff used all parts of the central common area for activity programming Thus it seems
probable that several factors including the internal floor plan meal service and activity
programming made the central common areas of WDS a multiuse area which resulted in high
number of resident sightings though out the day with peaks at meal times It is worth asking whether
WDS staff would have used the central common area so intensely if the house kitchens had been
aligned with the dining rooms providing staff with oversight as in MPN and MPW
These observations could also explain another WDS anomaly that is the low number
of residents seen to be engaged in ADL activities at meal times compared to other sites If the
lower-functioning residents at WDS engaged in other activities in the central common areas
perhaps abandoning a meal to walk or sit elsewhere that could result in fewer observations
of eating during the mealtime Conversely it could mean that it would be more likely that
Mapping Five Sites
27 of 47
other activities (ie watching walking sitting and leisure activities) would be seen during
meal times which was the case in WDS
Finally the unique features of the WDS resident sighting data may have been related to the
greater degree of dementia (lower than average MMSE scores) of WDS residents The average
MMSE scores at other sites were 50 to 100 higher indicating less severe symptoms than the
average WDS score Congruently WDS had relatively high levels of sightings of sitting watching
and walking behavior and the highest number of pacing incidents Thus it is possible that the
differences in degree of dementia between sites and the related differences in levels of ambulation
made it more likely that WDS residents would leave their rooms and therefore WDS residents would
be sighted most frequently in the common areas of the WDS facility
It is important to note that no substantial differences were found between the 20-capacity
and 12-capacity houses that is in the mean domain scores of the TESS which was used to describe
environmental characteristics Scores were much the same across the five sites The TESS has goals
and domains aligned with the general site design which are more architecturally based and those
best aligned with interior design site operations and providing care
The architects might have thought their design at ASB and MDR would result in a small care
group of 10 and that residents along each bedroom hall would form a household but this did not
happen The residents in the 20-capacity houses did not form a 20-resident cluster either instead they
formed small groups for eating and activities Therefore other factors such as early or late rising or
naturally-formed friendships may be a greater influence than bedroom proximity The addition of
eight more residents per house might be anticipated to lead to crowding in the housesrsquo living-dining
areas or some other notable difference However crowding was not evident in the 20-capacity
houses In fact WDS gatherings in the common areas were more apt to be viewed as crowds
Mapping Five Sites
28 of 47
Observations indicated there that Disruptive Behavior often attributed to crowding was rare It
occurred in only one site and therefore could not be associated with a particular design
These observational results combined with the TESS results have broad implications for
future studies The first implication is methodological and the second is empirical Methodologically
the combination of architectural and behavioral measures in studies of facilities for the elderly
highlights the advantages over methodologies that employ only behavioral measures eg Dementia
Care Mapping (Brooker 2005 Fulton Edelman amp Kuhn 2006 Sloane Brooker Cohen et al
2007) and over studies that rely on client interviews (Kane 2003) Empirically 20 residents in a
house is approaching the size of dementia units in some nursing homes The present study revealed
that the main difference seen in the operation of the 12-resident house and the 20-resident house
design was that the latter appeared to hold more activities within the house raising questions about
the value and need for those common spaces whereas the former made more use of the common
spaces for activities In this way behavior was affected by the house design and by the way that staff
chose to organize activities
Mapping Five Sites
29 of 47
References
Benson D M Cameron D Humbach E Servino L amp Gambert S R (1987) Establishment and
impact of a dementia unit within the nursing home Journal of the American Geriatrics Society
35 319-323
Brawley E C (1997) Designing for Alzheimerrsquos disease Strategies for creating better care
environments New York Wiley
Brooker D (2005) Dementia Care Mapping A review of the research literature The Gerontologist
45 Special Issue I 11ndash18
Calkins M P Meehan R A amp Lipstreuer E (1999) Creekview Its history and evaluation
Kirtland OH IDEAS Inc
Colling K B (1999) Passive behaviors in Alzheimer disease A descriptive analysis American
Journal of Alzheimers Disease and Other Dementias 14 27-40
Cronin-Golumb A (1995) Vision in Alzheimerrsquos disease The Gerontologist 35 370-376
Day K Carreon D amp Stump C (2000) The therapeutic design of environments for people with
dementia A review of the empirical research The Gerontologist 40 397-416
Deely B Klingensmith L amp Silverman M (1995) Developing a residential Alzheimers facility
Focus on Geriatric Care and Rehabilitation 8(7) 1-8
DiMotta S Dubney B M Hoglund J D amp Kershner C (1993) Long-term care design Blazing
new territory - code reform and beyond Journal of Healthcare Design 5 197-203
DiMotta S amp Hoglund J D (2000) Woodside Place A residential care model for the Alzheimerrsquos
and dementia resident Symposium on Healthcare Design Anaheim CA Center for Healthcare
Design
Mapping Five Sites
30 of 47
Doty M M Koren M J amp Sturla E L (2008) Culture change in nursing homes How far have
we come Findings from The Commonwealth Fund 2007 National Survey of Nursing Homes
New York The Commonwealth Fund
Edelman P Fulton B R Kuhn D amp Chang C H (2005) A comparison of three methods of
measuring dementia-specific quality of life Perspectives of residents staff and observers The
Gerontologist 45 27-36
Fleiss J L (1981) Statistical methods for rates and proportions (2nd ed) New York John Wiley amp
Son
Folstein M F Folstein S E amp McHugh P R (1975) Mini-Mental State a practical method for
grading the cognitive state of patients for the clinician Journal of Geriatric Research 12 189-
198
Fulton B R Edelman P amp Kuhn D (2006) Streamlined models of dementia care mapping
Aging amp Mental Health 10 343-351
Gold D T (1991) A descriptive typology of dementia units In P D Sloane amp L J Mathew (Eds)
Dementia units in long-term care (pp 50-61) Baltimore Johns Hopkins University Press
Gonzalez-Salvador T Lyketsos C G Baker A Hovanec L Roques C Brandt J et al (2000)
Quality of Life in dementia patients in long-term care International Journal of Geriatric
Psychiatry 15 181-189
Gottesman L E amp Bourestom N C (1974) Why nursing homes do what they do The
Gerontologist 14 501-506
Grade B L (1976) A study of the entry crisis to a nursing home Unpublished masterrsquos thesis
University of Wisconsin Milwaukee
Grant L A (1998) Beyond the dichotomy An empirical typology of Alzheimerrsquos care in nursing
homes Research on Aging 20 569-592
Mapping Five Sites
31 of 47
Greene J A Asp J amp Crane N (1985) Specialized management of the Alzheimerrsquos disease
patient Does it make a difference A preliminary progress report Journal of the Tennessee
Medical Association 78 559-563
Harper G J (1998) Stress and adaptation among elders in life care communities Unpublished
doctoral dissertation Ohio State University Columbus
Hogden K M (1985) Leisurerecreation needs of hospitalized elderly A task force report
Activities Adaptation amp Aging 7 53-65
Hoglund D J amp Ledewitz S D (1999) Designing to meet the needs of people with Alzheimerrsquos
disease In B Schwarz amp R Brent (Eds) Aging autonomy and architecture Advances in
assisted living (pp 229-261) Baltimore John Hopkins University Press
Ice G H (2002) Daily life in a nursing home has it changed in 25 years Journal of Aging Studies
16 345-359
Imamoğlu Ccedil (2007) Assisted living as a new place schema A comparison with homes and nursing
homes Environment and Behavior 39 246-268
Innes A amp Surr C (2001) Measuring the well-being of people with dementia living in formal care
settings The use of Dementia Care Mapping Aging and Mental Health 5 258-268
Kane R A (2003) Definition measurement and correlates of quality of life in nursing homes
Toward a reasonable practice research and policy agenda The Gerontologist 43 Special
Issue II 28ndash36
Kuhn D Kasayka R E amp Lechner C (2002) Behavioral observations and quality life among
persons with dementia in 10 assisted living facilities American Journal of Alzheimerrsquos Disease
and Other Dementias 17 291-298
Lawton M P (1970) Ecology and aging In L A Pastaland amp D H Carson (Eds) The spatial
behavior of older people (pp 41-67) Ann Arbor MI University of Michigan Press
Mapping Five Sites
32 of 47
Lawton M P (1977) The impact of the environment on aging and behavior In K W Schaie (Ed)
Handbook of the Psychology of Aging (pp 276-301) New York Van Nostrand Reinhold
Lawton M P Weisman G D Sloane P amp Calkins M (1997) Assessing environments for older
people with chronic illness Journal of Mental Health and Aging 3 83-100
Lawton M P Weisman G D Sloane P Norris-Baker C Calkins M amp Zimmerman S I
(2000) Professional Environmental Assessment Procedure for special care units for elders with
dementing illness and its relationship to the Therapeutic Environment Screening Schedule
Alzheimer Disease and Associated Disorders 14 28ndash38
Lee M Madden V Mason K Rice S Wyburd J amp Hobson S (2006) Occupational
engagement and adaptation in adults with dementia A preliminary investigation Physical and
Occupational Therapy in Geriatrics 25 63-81
Lehrner P N (1979) Handbook of ethological methods New York Garland STMP
Margulis S T (2003) Privacy as a social issue and behavioral concept Journal of Social Issues 59
243-261
Martin P amp Bateson P (1987) Measuring behaviour An introductory guide New York
Cambridge University Press
Mathew L J amp Sloane P D (1991) Organizing and staffing dementia units In P D Sloane amp L
J Mathew (Eds) Dementia units in long-term care (pp 101-127) Baltimore Johns Hopkins
University Press
McAllister C L amp Silverman M A (1999) Community formation and community roles among
persons with Alzheimerrsquos disease A comparative study of experience in a residential
Alzheimerrsquos facility and a traditional nursing home Qualitative Health Research 9 65-85
McCracken A L amp Fitzwater E (1989) The right environment for Alzheimerrsquos Geriatric
Nursing 10 293-294
Mapping Five Sites
33 of 47
Milke D L (2003) Iterative post-occupancy evaluations of the McConnell Place North design
[Abstract] Proceedings of the 56th Annual Scientific Meeting of the Gerontological Society of
America 43 48 San Diego CA
Milke D L Clark C amp Bucknell M (2000) Assessing the adequacy of residential lighting in two
care centres for persons with Alzheimerrsquos Disease using the new age-adjusted North American
illumination recommendations (Research Report) Ottawa Ontario Canada Canada Mortgage
and Housing Corporation
National Institute on Aging Coordinating Center (1993) NIA collaborative studies special care units
for Alzheimers disease Manual of procedures Davis CA Northern California Alzheimers
Disease Center University of California
Rabig J Thomas W Kane R A Cutler L J amp McAlilly S (2006) Radical redesign of nursing
homes Applying the Green House concept in Tupelo Mississippi The Gerontologist 46 533-
539
Rule B G Milke D L amp Dobbs A R (1992) Design of institutions Cognitive functioning and
social interactions of the aged resident Journal of Applied Gerontology 11 475-488
Saxton J Silverman M Ricci E Keane C amp Deely B (1998) Maintenance of mobility in
residents of an Alzheimer special care facility International Psychogeriatrics 10 213-224
Schwarz B Chaudhury H amp Tofle R B (2004) Effect of design interventions on a dementia care
setting American Journal of Alzheimers Disease and Other Dementias 19 172-176
Silverman M Ricci E Saxton J Ledewitz S McAllister C amp Keane C (1995) Woodside
Place The first three years of a residential Alzheimerrsquos facility (Vols 1-2) Oakmont PA
Presbyterian Senior Care
Skea D amp Lindesay J (1996) An evaluation of two models of long-term residential care for
elderly people with dementia International Journal of Geriatric Psychiatry 11 233-241
Mapping Five Sites
34 of 47
Slaughter S Calkins M Eliasziw M amp Reimer M (2006) Measuring physical and social
environments in nursing homes for people with middle- to late-stage dementia Journal of the
American Geriatrics Society 54 1436-1441
Sloane P D Brooker D Cohen L Douglass C Edelman P Fulton B R et al (2007)
Dementia Care Mapping as a research tool International Journal of Geriatric Psychiatry 22
580-589
Sloane P D Mitchell M Priesser J S Phillips C Commander C amp Burker E (1998)
Environmental correlates of resident agitation in Alzheimerrsquos disease special care units Journal
of the American Geriatric Society 46 862ndash869
Sloane P D Mitchell C M Weisman G Zimmerman S Foley K M L Lynn M et al
(2002) The Therapeutic Environment Screening Survey for Nursing Homes (TESS-NH) An
observational instrument for assessing the physical environment of institutional settings for
persons with dementia Journals of Gerontology Series B Psychological Sciences and Social
Sciences 57B(Suppl 2) S69-S78
Sloane P D Zimmerman S Williams C S Reed P S Gill KS amp Preisser J S (2005)
Evaluating the quality of life of long-term care residents with dementia The Gerontologist 45
37-49
Snyder L G (1980) An exploratory study of patterns of social interaction organization and facility
design in three nursing homes In J Hendricks (Ed) Institutionalization and Alternative Futures
(pp 68-80) Farmingdale NY Baywood Pub Co
Sommer R amp Sommer B B (1986) A practical guide to behavioral research Tools and
techniques (2nd ed) New York Oxford
Van Haitsma K Lawton M P amp Kleban M H (2000) Does segregation help or hinder
Examining the role of heterogeneity in behavioral and emotional aspects of quality of life for
Mapping Five Sites
35 of 47
persons with cognitive impairment in the nursing home Research and Practice in Alzheimerrsquos
Disease 4 163-177
Verbeek H van Rossum E Zwakhalen S M G Kempen G I J M amp Hamers J P H (2009)
Small homelike care environments for older people with dementia A literature review
International Psychogeriatrics 21 252-264
Voelkl J E (2006) Therapeutic environments in nursing homes Fostering residents meaningful
activity engagement Activities Directors Quarterly for Alzheimers and Other Dementia
Patients 7(3) 35-44
Warren S (Ed) (1998) Innovative dementia care McConnell Place North evaluation (Research
Report) Edmonton Alberta Canada Evaluating Programs of Innovative Continuing Care
Zeisel J (1998) The Hearthstone health environments case study Journal of Healthcare Design
Proceedings from the Symposium on Healthcare Design San Francisco CA National
Symposium on Healthcare Design Inc
Zeisel J Hyde J amp Levkoff S (1994) Best practices An environment-behavior (E-B) model for
Alzheimer special care units American Journal of Alzheimerrsquos Care and Related Disorders and
Research and Care 9(2) 4-21
Zimmerman S Sloane P D Williams C S Reed P S Preisser J S Eckert J K et al (2005)
Dementia care and quality of life in assisted living and nursing homes The Gerontologist 45
133-146
Mapping Five Sites
36 of 47
Table 1 Comparison of Architectural Features Across Five Sites
Feature ASB MDR MPN MPW WDS
Total facility square footage 23040 sq ft 27308 sq fta 24750 sq ft 23864 sq ft 21540 sq ft
Size of administration area (offices conference reception etc but not service or employee spaces)
960 sq ft (No entry hall)
1584 sq ft day program offices and program space
1675 sq ft 1629 sq ft 972 sq ft (No entry hall)
Staff (lunch) room 16rsquo x 18rsquo 6rsquo11rdquo x 6rsquo2rdquo 158rsquo x 16rsquo 138rsquo x 16rsquo 95rsquo x 30rsquo (plus)b
Treatment or examination room
No Yes In daycare area
No No Yes In central
areac
Medications storage Central medication cart
Medication room Medication room per house
Medication room per house
Central medication cart
Location of meal preparation
Facility kitchen in administration area
Facility kitchen in administration area
Adjacent nursing home (see house kitchen)
Adjacent nursing home (see house kitchen)
Facility kitchen in administration area
Use of house kitchen Servery snacks Servery snacks Meal preparation for all breakfasts and some lunches servery
Meal preparation for all breakfasts and some lunches servery
Servery snacks
Family dining room or central country kitchen usage
Small group activities family functions by reservation
Small group activities family functions by reservation
Small group meetings Great Room party food preparation family functions by reservation
Small group meetings Great Room party food preparation family functions by reservation
Small group activities family functions by reservation
Houses and capacity 2 20 2 20 3 12 3 12 3 12
Private tubroom Two off the central hallway
Two off the central hallway
One located in each house
One located in each house
None
Private shower areas One per 10 residents located in each wing of each house
One per 10 residents located in each wing of each house
One per resident located in each resident room with the one shared bedroom having a shared shower
One per resident located in each resident room with the one shared bedroom having a shared shower
One per 12 residents located in each house
Resident room doors Split door Split door Split door Regular Split door
Inventory of public rooms and seating capacity (includes all alcoves that can be used for seating and seating areas near exits)
15 165
17 176
15 232
13 219
14 182
Variety and appearance of outdoor Area
2 small (little greenery) 1 medium (mixed hardgreen surfaces) and a large courtyardmdashvery appealing
2 small (much greenery) 1 medium (mixed hardgreen surfaces) 2 large courtyards (1 mixed hardgreen surfaces 1 green) mdash very appealing
3 small (much greenery) 1 large (mostly green courtyard mdash very appealing
3 small (much greenery) and 1 large (mostly green courtyard mdash very appealing
1 small (much greenery) 1 medium (mostly green) and 1 large (mostly green) courtyard mdash very appealing
a Does not include researchteaching wing Total for entire floor space is 40382 sq ft b Room at WDS was not intended as a lounge ie a retreat from work to professionalize the care staff role it was to serve as a place to read and discuss work At other
sites the lunch room also served as a lounge c Room was intended as a multi-purpose room
Mapping Five Sites
37 of 47
Table 2 Therapeutic Environment Screening Scale Items for Goal and Domain Possible Range
Midpoint and Mean in Each Group
Therapeutic Goal and Domain
Item Numbers Range Mid-point ASB amp MDR
20-Capacity Houses MPN MPW amp WDS
12-Capacity Houses
ASB MDR Site Scores
Mean MPN MPW WDS Site Scores
Mean
Safetysecurityhealth
Exit control 2a 2b 2c 2d 2e 2g
2h 3a 3b 0-11 55 2 1 15 1 2 2 17
Maintenance 7b1Dagger 7b2Dagger 7b3Dagger 7b4Dagger 0-8 40 8 8 80 8 8 80
Cleanliness 7a1Dagger 7a2Dagger 7a3 7a4 0-8 40 8 8 80 7 8 8 77
Lack of odorsℓ 9aDagger 9bDagger 0-4 20 4 3 35 4 4 4 40
Safetyℓ 7c1 7c2Dagger 7c3 7c4 8 0-10 60 10 10 100 10 10 10 100
Orientationcuing 19 20ф 27a 27bcDagger
27d 27e 27f 28 29 0-17 85 1212 120 11 9 12 107
Privacycontrol
Privacy 30a 30b 30c 30d 0-4 20 0 0 0 1 2 0 10
Functional ability 16 17a 17b 18Dagger 0-7 35 7 7 70 7 7 7 70
Stimulation
Lighting 21 22a 22bDagger 22cDagger
23a 23b 23c 0-14 70 13 13 130 11 14 13 127
Tactilevisual
stimulation 34 35Dagger 37b 0-16 80 10 6 80 15 14 11 133
Quietness 24a 24b 24c 24d
24eDagger 24f 24g 25 26 0-25 125 21 21 210 19 20 23 207
Physical attractiveness
4a1 4a2 4b1 4b2
4c1 4c2 4d1 4d2 37c 0-34 140 16 15 155 15 16 16 157
Socialization
Homelike
environment 15Dagger 31Dagger 32 0-9 45 9 9 90 9 9 9 90
Resident
appearance 36Dagger
0-2 10 2 2 20 2 2 20
SCUEQS 0-41 - 41 39 40 39 4141 40
CAAQS sect 0-100 - 786 857
Large means represent better physical environment
Dagger Items used to compute the 18-item Special Care Environmental Quality Scale (SCUEQS) 27b and 27c were treated as a single item and item 15 was
misnumbered in the TESS-2+ Revised version (as item 13) ф Item 20 is the percentage of common rooms with signsgraphics floor plans in all sites allowed a view into common rooms (scored as zero) ℓ An item was unintentionally omitted from the TESS-2+ scoring form (10 in Odors and 11 in Safety) sect Composite Above Average Quality Score (CAAQS) represents the percentage of TESS-2+ domains that were above average in quality
Mapping Five Sites
38 of 47
Table 3 Percent of Resident Population Who Were Observed During Behavior Scans
at Each Site in Particular Areasa
AreaSite 20-Capacity Houses 12-Capacity Houses
ASB MDR MPN MPW WDS
Total Areas 608 493 511 564 803
Total Common Areas 62 158 169 200 511
Total Outdoor Areas 46 02 11 56 38
Total House Areas 500 333 331 311 254
House 1 259 168 115 69 62
House 2 241 165 108 128 123
House 3 108 114 69
House Kitchen 149 08 75 53 49
House LivingDining Room 324 278 236 232 200 a Resident data were adjusted to show the mean percent of residents at a site who were observed per scan per day Note Total Areas is the sum of the following Total Common Total Outdoor and Total House Total House Areas is the sum of Houses 1 House 2 and House 3 House Kitchen and LivingDining Rooms are summed across houses Blank cells indicate that the question was not applicable
Mapping Five Sites
39 of 47
Table 4 Percent of Resident Population Who Were Observed During Behavior Scans
at Each Site in Particular Common Areasa
Location 20-Capacity Houses 12-Capacity Houses ASB MDR MPN MPW WDS
Great Room 07 75 94 91 64
Fireplace Seating Area 22 69 43 13 106
ActivityCraft Room 04 47 00 02 10
TV Room ndash ndash 43 64 58
Other TV Area ndash ndash 11 39 ndash
Common Area Hallway Seating 37 108 138 143 396
Music Room ndash ndash 00 ndash 00
Garden Room ndash ndash 00 ndash 04
Beauty Salon 39 12 00 00 00
Family Dining RoomCountry Kitchen 00 09 00 00 00
Total 109 320 329 352 638 a Resident data were adjusted to show the mean percent of residents at a site who were observed per scan per day Note Dashes indicate that residents were not observed in these areas
Mapping Five Sites
40 of 47
Table 5 Percent of Resident Population Who Were Observed During Behavior Scans
at Each Site at Particular Times of Day
Time of Day 20-Capacity Houses 12-Capacity Houses
ASB MDR MPN MPW WDS
Before Lunch 541 360 386 475 654
Lunch 805 663 667 722 1000
Between Meals 657 530 506 589 963
Supper 765 738 744 744 922
After Supper 50 390 447 469 740 a Resident data were adjusted to show the mean percent of residents at a site who were observed per scan per day Note Before Lunch (4 scans-730-1030) Lunch (2 scans-1130 amp 1230) Between Meals (3 scans-1330 to 1530) Supper (2 scans-1630 amp 1730) After Supper (4 scans-1830 to 2130)
Mapping Five Sites
41 of 47
Figure 1 Floor plan of Asbury Place Mt Lebanon PA
Mapping Five Sites
42 of 47
Figure 2 Floor plan of Marjorie Doyle Rockwell Center Cohoes NY
Mapping Five Sites
43 of 47
Figure 3 Floor plan of McConnell Place North Edmonton AB
Mapping Five Sites
44 of 47
Figure 4 Floor plan of McConnell Place West Edmonton AB
Mapping Five Sites
45 of 47
Figure 5 Floor plan of Woodside Place Oakmont PA
Mapping Five Sites
46 of 47
Figure 6
McConnell Place Northordf Residentsrsquo Activities When Alone and in the Presence of Staff
ordf The average MMSE score was 153 at MPN higher than the average across sites 132 + 15 (M+SE) MPN residents appeared not to initiate activities when alone
0
5
10
15
20
25
30
35
40
Alone Day 1 With Staff Day 1 Alone Day 2 With Staff Day 2
Nu
mb
er R
esid
ents
Arts amp Crafts
Chores
CookingBaking
Eating
Exercising
Games
Grooming
Lg Activity Grp
Music Event
Reading
Sm Interaction
Walking
Watching
Watching TV
Other
Mapping Five Sites
47 of 47
Figure 7
Percent of Scans in Which Residents at Each Site Engaged in Particular Behaviors
0
10
20
30
40
50
60
70
80
90
100
ASB MDR MPN MPW WDS
Misc
Just Sit
Watch
Walk
Leisure
Work
ADLs
Mapping Five Sites
9 of 47
eating taking medications) light housekeeping leisure disruptive behavior walking watching and
miscellaneous behaviors Communication was indicated as an independent action because it could
occur concurrently with any of the activity categories
Information about activities at each of the five sites included a description and schedule of
daily and special occasion events for residents average attendance of residents at programmed events
of each type the procedures for intervening when problem behaviors arose definition of problem
behaviors and the average weekly incidence of problem behaviors (not presented) The interpretation
of data from Behavior Mapping benefited from this information
Sampling and Data Analysis
Behavioral mapping included all care staff volunteers family members residents and others
over a two-weekday period in early June at each site except at MDR where data collection was on
two sunny days in September that were comparable to June weather Observations were made each
hour between 0730 and 2130 hours for a total of 15 scans per day They were conducted in all public
spaces at each site excluding rooms bathing rooms toilets and bedrooms as well as areas used
exclusively by staff Two observers were trained at each site to collect the data to a criterion of at
least 85 agreement on location person and behavioral categories Behavior observations were
collated by site by activity and time-of-day format
Results
Floor Plan Comparisons
Building orientation varied across sites as did the views of outdoor gardens (floor plans in
Fig 1-5) Table 1 lists some of the most salient similarities and differences between the sites
Each building had residential wings referred to as houses with residentially scaled rooms
linked by a common area shared by all houses (Figures 1-5) The common areas in all sites included
Mapping Five Sites
10 of 47
a great room a fireplace seating area at least one activity or craft room a family or private dining
room and a beauty salon
Insert Figures 1-5 and Table 1 about here
Overall the floor plans of ASB and MDR were very similar as were the plans of the other
three centers MPN MPW and WDS In the latter three centres the houses were equivalent to the
three parallel wings flanked by courtyards that is outdoor spaces with natural green elements and a
view to the sky Each wing was self-contained each had a kitchen livingdining room and laundry
and a room for bathing or showering Each wing had a central hallway with bedrooms running its
length on either side accommodating 12 residents ASB and MDR floor plans had two perpendicular
housing areas comprised of two parallel wings The architects viewed this design as four houses each
accommodating 10 residents Each bedroom hallway and one living area was considered a house and
a pair of houses was viewed as sharing a kitchen The kitchen was planned as a hub for staff assigned
to the two bedroom hallways and a place to locate a staff-buddy for a task (DiMotta amp Hoglund
2000) However at ASB for example the arrangement of furniture with glider-rocking chairs
arranged primarily in one dining-living space and tables placed in the dining-living area on the other
side of the kitchen suggested that more than the kitchen was being shared and that these common
rooms were being used as a continuous space for all 20 residents to share In gathering data from
management and staff there was no evidence that staff and residents were treating a particular
dining-living room as being the domain of just one hallway of residents Moreover ASB staff said
residents housed in bedrooms along one hall were frequently found in the other bedroom hall
Mealtime seating varied for breakfast lunch and dinner but the variation was not related to
Mapping Five Sites
11 of 47
residentsrsquo home hallway Consequently each U-shaped housing area in ASB and MDR was
considered a house for the purposes of this study
House kitchens differed across sites At ASB and MPW these were large country kitchens
but at other sites the kitchens were small At WDS kitchens were designated as ldquoserveriesrdquo Some
sites had activity areas or rooms in the common areas In the fireplace seating area adjacent to
WDSrsquos country kitchen (but not within the country kitchen) were a large dining table and matching
chairs An open wall above a bar-type counter allowed items to be passed from the country kitchen
This made the space more flexible because it was not viewed as a special events venue like the
enclosed private dining rooms in the other four centers It also encouraged various activities to be
conducted on this dining table that were not scheduled for the common areas in the other centers
Table 1 supplements this descriptive comparison
The common features included floor plans designed for small group living (houses of 12 or
20) in self-contained houses with spaces for cooking eating bathing and gatherings bedroom
hallways that are short by facility standards (yet long for family dwellings) a variety of common
spaces and informal staff workspaces but no formal nursing stations (Table1) Differences in
general design between sites were also in quantitative measures for example the number of beds
ranged from 36 to 40 the number of public rooms ranged from 11 to 17 (Table 1) and most striking
the seating capacity in public rooms varied from 165 to 232 (Table 1) with ASB and MDR having
somewhat less capacity than MPN and MPW Inspection of floor plans showing chair location (data
not shown) revealed that the differences in numbers of seats between sites were principally in the
houses kitchen and livingdining areas implying that the site differences in these floor plan areas
were relevant
Mapping Five Sites
12 of 47
Therapeutic Environment Screening Scale
Environmental characteristics were described using the 38-item Therapeutic Environment
Screening Scale (TESS-2+) Designees at each site filled out the form after training by one of the
authors of the study who was experienced in using the scale Interrater agreement was assured by
comparing interpretations and ratings consensus was reached on any issues related to scoring
Interrater reliability for TESS-2+ items had ranged from 67 to 100 agreement (Sloane et al
1998) There were no significant differences in the mean domain scores between the sites that had
12-capacity houses and those with 20-capacity houses (Table 2) The findings are presented by
grouping the items into two types of goals and domains those associated with the general site design
that may be more architecturally based and those more aligned with interior design site operations
and providing care
Insert Table 2 about here
General Design The scores related to the therapeutic goals and domains for building design
were similar across sites reflecting the implementation of the basic Woodside building model
(Table 2 Exit control Orientation and cuing Privacy and Functional ability Physical
attractiveness) All sites in this study had strategies for exit control (Table 2 2andash2h) WDS had both
alarms and keypad-locks on external exits while the other sites had keypad-locks MPN and MPW
had a reception desk at the front entrance as a clerk-observation post At ASB and MPW the external
exits were partially disguised at the other sites they were not (Table 2 3a 3b)
Mapping Five Sites
13 of 47
Orientation and cuing is related to residentsrsquo personal safety and self-awareness thus the
photos and names beside the bedrooms doorways which all sites used are important (Table 2 27
28 29) as in the ldquotip of the tongue phenomenonrdquo they need a cue to retrieve the memory (Zeisel
1998) An open interior plan that allows residents to see into public rooms is an optimal way finding
strategy for persons with dementia all sites employed this The strategic location of cues and
personal items can also aid way finding Although institutional-style directional signage is eschewed
on restroom doors for example both graphics and labels are advised Open floor plans often require
few signs MDR had the most signs and MPW used the fewest graphics and signs with other sites
having intermediate numbers (Table 2 19 20) Large windows that provide natural exterior views
(Table 2 4) are not only attractive they are another tactic that serves way finding and also provides
seasonal orientation in the latitudes of these five sites The entrances of residentsrsquo bedrooms were
personalized at all sites (Table 2 27 28 29) Redundancy is recommended and a greater variety of
items were used at ASB MDR WDS and MPN than at MPW for this purpose
All five sites scored well on supporting functional ability (Table 2 16 17 18) that is either
slowing decline or stimulating improvement which is something for which sites designed for
dementia have been associated (Benson Cameron Humback Servino amp Gambert 1987 Greene
Asp amp Crane 1985 Innes amp Surr 2001 McCracken amp Fitzwater 1989 Rabig Thomas Kane
Cutler amp McAlilly 2006 Rule Milke Dobbs 1992 Silverman et al 1995 Skea amp Lindesay 1996
Warren 1998)
Interior Design and Approach to Care The first goal of this type is safety security and
health with domains (besides exit control discussed above) of Maintenance Cleanliness Lack of
odors and Safety (of floors) A second goal is Stimulation and a third is Socialization Slaughter et
al (2006) viewed these as basic requirements and found no significant differences in these goals
when comparing the 6 special care facilities (bungalows) with the 45 units in traditional institutional
facilities so it is not surprising that the same was true for these highly similar sites
Mapping Five Sites
14 of 47
Stimulation domains include Lighting Tactile and Visual stimulation as well as Quietness
Both sensory deprivation and over-stimulation are viewed as problems (Brawley 1997 Day
Carreon amp Stump 2000 Cronin-Golumb 1995) According to Zeisel Hyde amp Levkoff (1994)
appropriate levels of stimulation results from having a site with a high sensory comprehension
ranking so not necessarily the overall calmest setting but rather one with a moderate amount of
sensory input that residents can understand Ambient lighting was considered good in all sites with
minimal glare from a number of reflecting surfaces such as picture windows and French doors (Table
2 21) Lighting was evenly distributed and levels were considered ample (Table 2 22 23) with the
exception of MPN Ambient auditory noise was not deemed a problem whether considering type or
level of noise (Table 2 24 25) The general availability of things to touch in common areas such as
those that invite handling or folding was somewhat less at ASB and MDR than at other sites
Overall ratings of home likeness and the individuality of residentsrsquo appearance were
consistently good but the general atmosphere influenced by residentsrsquo lower overall levels of
participation in activities and a less positive rating for staff interactions with residents resulted in
MDR scoring lower that other sites (Table 2 15 31 32 36) WDS scored in the mid-range on
residentsrsquo involvement but as indicated above its residents had much lower MMSE scores At all
sites personal pictures or mementos were in most residentsrsquo bedrooms However such items were
not present in common rooms at MDR
The mean SCUEQS scores (Table 2) which summarized a subset of the TESS-2+ items
were not significantly different between the sites that had 12-capacity houses and those with 20-
capacity houses The SCUEQS had been derived for the NIA studies of special care units and was
considered by experts to measure important aspect of the physical environment and serve as a
reliable measure for differentiating better nursing units and assessing the overall environmental
quality (Sloane et al 2002) The results appear to justify the architectsrsquo design decisions that resulted
in two hallways of 10 residents sharing the large kitchen and the living-dining rooms Slaughter et al
Mapping Five Sites
15 of 47
(2006) devised another composite score the Composite Above Average Quality Score (CAAQS)
which they found to be more sensitive than the SCUEQS The CAAQS represents the percentage of
domains that were above average in quality It revealed a difference between the sites with 12-
capacity houses (857) and those with 20-capacity houses (786) that was not shown by the
SCUEQS but the difference was not significant
Behavioral Mapping
Reliability The number and category (staff family or resident) of persons observed at each location
was recorded on floor plans in successive behavior scans one hour apart over the course of two
days Interobserver reliability of the scans was assessed at each site Cohenrsquos kappa a measure of
agreement between observers has a range from 0 no agreement to 100 total agreement Fleiss
(1981) characterized a kappa of 4 to 6 as fair 6 to 75 as good and over 75 as excellent There was
good agreement on average between two independent observers on the identification of behaviors
observed Kappa mean (SD) 0851 (04) and excellent agreement on identification of people being
scanned as residents staff family or others kappa mean (SD) 0732 (07)
Observations Fifteen observation periods or scans per day were conducted one per hour during
the two days of observation Examination of the within-site data revealed that the only differences
were day differences in specific scans related to the occurrence of special events eg barbecues
Consequently the data were collapsed across days A scan of about 10 minutes in duration was
required to count people in all public areas Observers minimized the possibility of counting the same
person in more than one room during a scan by following a preplanned path through the building and
working quickly Counts of sightings of staff family and volunteers and residents by hour in each
Mapping Five Sites
16 of 47
area of each site were summed over the two-day period of observation To assist the description of
the findings resident data were subsequently adjusted to show the mean percent of residents at a site
who were observed per scan per day and to show the percent of scans in which residents were
involved in a particular activity or seen in a particular room or area
Staff and Family Observations of staff and family are presented without data as these were
ancillary to the principal focus on residents Staff were seen most often in the house kitchens or
diningliving rooms across all sites except WDS At WDS staff were seen in the kitchens but
seldom in the diningliving rooms In all three sites with 12-capacity houses the central house was a
hub of staff activity with nearly twice as many staff seen in that kitchen (or an adjacent room which
was the dining room in MPN and MPW but was a hallway in WDS) as in the kitchens of the houses
on either side WDS staff were also seen in the seating area outside the great room nearly as much as
in the house kitchens Residents were seldom engaged in an activity when staff were not around eg
see Figure 6 for MPN This is not surprising because persons with Alzheimer disease lose their
ability to initiate activities (Colling 1999 Lee et al 2006) Others have shown that appropriate
environments are not sufficient residents with this disease need activities and all five sites employed
activity coordinators (Grant 1998 Van Haitsma Lawton amp Kleban 2000 Voelkl 2006)
Insert Figure 6 about here
Family members were at some sites as early as 830 am and as late as 930 pm although at
MPN all visits except one were in the afternoon ASB had a family meeting increasing the number
Mapping Five Sites
17 of 47
of sightings of family members to 42 (19 were associated with the meeting) The numbers of
sightings of family members over the two days of observation at other sites were WDS ndash 27 MPN ndash
23 and MDR and MPN ndash 12 each
Insert Tables 3 and 4 about here
Resident Locations Direct observation revealed a pattern of use that was unexpected and not
evident in TESS results Overall resident sightings were at least 25 higher at WDS than at the
other four sites (Table 3) The number of sightings in the common areas of WDS was over 60
greater than those at any other site (Table 3) Residents were most frequently seen in the area just
outside the great room (Table 4) By contrast at all other sites residents spent more time (60 of
sightings) in their houses (Table 4) ASB where residents spent 80 of their time in their houses
represented the extreme in this regard with the other sites being intermediate between ASB and WDS
(Table 4) Differences did not appear to align with whether the houses were of 20- or 12-capacity At
all sites residents were seen most frequently in the common areas outside of the houses with the
common hallways the great room and fireplace seating area accounting for decreasing numbers of
residents in that order (Table 4) however a stylist in the ASB beauty salon drew a crowd showing
how an occasional event can change behavior patterns At the sites with 12-capacity houses and
television rooms those rooms were popular and drew as many residents as the fireplace area
The large percent (396) of residents seen in common areas at WDS was attributable to
sightings in the common hallway and fireplace seating area next to the School House (Figure 5
Table 4) All residents could be gathered in the area which was slightly larger than the great room
Mapping Five Sites
18 of 47
observers noted a continuous round of activities involving groups of varying sizes No other site used
this area as intensely At WDS a day program brought in 8 additional residents and several staff who
ran activities that attracted some residents (discussions newspaper reading crafts) Observers were
asked not to count persons associated with the day program in their tally but the heavy use of the
central space and the day program activities presented there had some influence ASB and MDR also
had day programs that used separate spaces for that purpose so program participants were not seen
Chairs lining the walls in this area of WDS augmenting seating arrangements in front of and on
either side of the fireplace as well as oversized displays of small snapshots on several walls resulted
in an institutional appearance Local lore attributes the lineup of chairs to residents who initiated it
shortly after move-in Staff moved chairs back where the interior designers located them but
residents would pull them back across the corridor in a line until staff gave up
Site differences in the use of the great room were noteworthy ASB appeared to use it only
for church services on a regular basis with ldquoaudience-seatingrdquo left in place from day-to-day
Possibly this was because this great room was relatively distant from the houses (Figure 1) In WDS
MPN and MPW great room seating was rearranged throughout the day to accommodate numerous
events MPN and MPW used the great room like a town hall holding events such as afternoon teas
dances and musical entertainment At MDR small numbers of residents were in the great room
throughout the day but no large gatherings were seen
Within sites the sightings of residents in the houses were distributed fairly evenly across the
houses (Figures 1-5 Table 3) Residents were most often seen in the living-dining rooms and as
noted above staff were most often seen in the adjacent kitchens The exception was WDS where the
house design did not provide a good line of sight for staff between the kitchens and the living-dining
rooms (Figures 4 amp 5) Staff at all other sites could work in kitchens and keep an eye on residents
WDS staff actively encouraged residents to leave dining rooms after a meal and join activities in the
central area likely for two reasons because activities were not planned for the houses and because
Mapping Five Sites
19 of 47
staff working in the houses could not easily monitor a resident who remained in the house living-
dining room WDS staff were rarely seen in the housesrsquo living-dining rooms The School House the
centre house accounted for the majority of residents observed across all houses This kitchen
adjacent to the highly used area just outside the Great Room provided a relatively good monitoring
station for the house and activities in the common areas At WDS mealtimes two common areas
were used residents who needed substantial assistance with meals were often fed in the craft room
and a high-functioning group ate at the dining table alongside the fireplace seating
In the houses at other sites most sightings of residents were in the diningliving room areas
Fewer were in the kitchen and fewer still in the house hallways (Table 3) At MDR only one area
adjacent to the kitchen was devoted to dining and almost no residents were seen in kitchens The
same was not true at ASB where approximately the same proportions of residents were seen in the
shared kitchens as in each of the living-dining rooms on either side (Table 3 sums all four living-
dining rooms) However at ASB the numbers were likely from residents moving between the two
diningliving rooms and passing through the kitchens (Figure 1) because residents were rarely
engaged in the type of tasks encouraged at MPN and MPW (ie handling dishes setting tables etc
to encourage maintenance of their functional abilities Figure 7) Interestingly the highly similar sites
found different ways to use their spaces and different approaches to activities
ASB MPW and WDS held barbecues during the days of observation (Table 3) This meant
the residentsrsquo presence in the kitchen and dining areas was reduced at those meals Accordingly for
comparison across sites dining area sightings were adjusted by adding mealtime sightings in the
courtyards The peak periods for resident sightings were during the midday lunch (1130-1330) and
evening meals (1630-1830) (Table 5) Even so sightings of residents at mealtimes were only 66-
80 of occupancy indicating eight to ten residents were not seen at mealtimes in public areas at
most sites (Table 5) The exception was WDS where sightings indicated nearly all residents were
observed in public areas at mealtimes (Table 5) although WDS residents did not gather in the house
Mapping Five Sites
20 of 47
dining areas for the noon meal With most activities occurring in the core of the building WDS was
flexible about meal arrangements serving meals where residents were located such as the area
outside the great room on an activity room Residents were not required to return to their own houses
to eat They could join day program residents and eat in the common area or join residents in another
house One group of women was known for asking to eat together on their own in the common area
WDS also led other sites in the number of residents observed at other times of the day (Table 5) The
differences were especially marked in the afternoon between meals (1330-1630) and the period
after the evening meal (1830-2130) This suggests that WDS staff may have been viewing the
central areas like they would the central areas of a unit in a nursing home on dementia units staff
often prefer that residents stay in view and not return to their rooms
Resident Activity The observed activity patterns were surprising considering high levels of
resident inactivity reported for nursing home residents (Gottesman amp Bourestom 1974 Ice 2002)
Gottesman and Bourestomrsquos (1974) observations in 40 nursing homes revealed that residents spent
56 of their time during peak daylight hours engaged in no activity or passive activity In that study
residents were involved in personal care television and socializing for 43 of the time Ice (2002)
reprised the Gottesman and Bourestom study and found residents spent 65 of their time doing little
or nothing with only 12 in social activities (Ice 2002) In the present study observations of Just
Sitting and Watching were expected to measure levels of passive behaviors Residents in the five
sites appeared to be engaged in ADLs and Leisure for greater amounts of time than in Just Sitting
and Watching (although small amounts of napping as passive behavior were coded as
Miscellaneous) but this was not significant (Figure 7) Chi-square analysis using phi coefficients
found that residents at WDS engaged significantly less in ADLs than residents in other centres
(plt00001) residents at ASB MPN amp WDS were engaged less in leisure (plt005 each) ASB
Mapping Five Sites
21 of 47
residents were engaged less in Just Sitting (plt00005) and residents were observed Watching less at
MDR MPN amp MPW (plt00005 each) Leisure was the most frequently observed activity for MDR
MPN and MPW the second most frequent at ASB and the third at WDS Recreational activities
both planned and informal activities were considered to be Leisure thus watching TV or waiting to
be served at a coffee party were both coded as being Leisure (persons who were within the group and
actively attending to events but not actively engaged at the moment were coded as Leisure too and
this was distinguished from Watching which was defined as ldquoattending to activities or interactions of
others from a distance such as from a doorway watching a streetrdquo)
Insert Figure 7 about here
The ADLs were the second most frequently seen activity for MDR MPN and MPW and the
third for ASB but were seen much less at WDS The majority of ADLs across sites occurred at meal
times indicating they involved dining (ASB 570 MDR 590 MPN 758 MPW 736 but
WDS 422) The low percent of time spent by WDS residents on ADLs during the evening meal
time (42) agrees with the low number of sightings in the dining area at that time (385 of max)
It appears that WDS residents sat watched and walked but did not spend much time eating
(Figure 7) In contrast previous research at MPN and MPW has found mealtimes to be the longest
duration behavior Scans needed to be one hour apart to avoid seeing meals on two consecutive scans
and oversampling the behavior (Milke et al 2000)
Work that is tasks such as housekeeping and cooking were not seen at either of the sites
with 20-capacity houses but this is the only difference evident when compared with the 12-capacity
Mapping Five Sites
22 of 47
houses Compared to other sites MPN and MPW residents engaged in moderate proportions of all
behaviors (Figure 7) Residents at WDS spent proportionately less time on ADLs light
housekeeping and Leisure and more time at Walking Watching and Just Sitting Chi-square
analysis using phi coefficients showed that residents were observed Walking significantly less at
MDR (plt 005) residents at ASB and MDR engaged significantly less in Work and there were no
significant differences between sites in Miscellaneous activities (Figure 7)
Observersrsquo Notes
Some large differences were found in the care programs across sites Observersrsquo notes
indicated that at MPN and MPW residents were encouraged to be involved in the daily routine of the
facility and direct care staff ate meals with residents This strategy was said to stimulate conversation
and provide residents with a model for appropriate behavior Staff played the role of ldquomotherrdquo rising
to find an item in the kitchen and keeping an eye on food consumption Managers at MPN and MPW
considered this role an essential component of care At ASB MDR and WDS there was no evidence
of such a role
Most cooking was done in facility kitchens away from areas that residents could access This
tended to result in the house kitchens being treated more like institutional serveries Fridges mainly
contained large juice jugs and prepared snacks However at MPW and MPN when a resident opened
the fridge door the door was full of condiments and casseroles it looked just like home because of
an effort to keep institutional sized packages to a minimum These two sites used their kitchens quite
differently than the other three sites At MPN and MPW all breakfasts and snacks were prepared in
the houses each day by direct care staff On four weekdays lunches also were prepared Residents
were invited to participate in some of the chopping slicing and mixing which was considered an
essential component of the care program When meals were delivered from nearby facility kitchens
staff decanted items into family-size serving bowls They added condiments and poured drinks
Mapping Five Sites
23 of 47
serving the meals much like those prepared in-house Although residents helping with meal
preparation appeared to be limited to MPN and MPW staff records indicated additional forms of
daily and special occasion activities occurred at all sites Daily activities included easy tasks eg
folding laundry and exercises at all five sites discussion groups at MDR and WDS religious
activities at ASB MPN and MPW musicsinging at ASB MPW and WDS movies at ASB and
grooming at all sites except WDS
Outdoor courtyards were accessible to residents on the observation days at all sites The
barbecue meal at MPW drew the highest number of residents outside but from mid-morning until
early evening residents were seen on the patios or walkways This was true at every site except
MDR where few ventured outside (data not presented)
Disruptive behaviors were seen only at ASB where at 730 am 230 pm and 430 pm a
single resident was disruptive Whether this was the same or different resident is not known the
identity of persons was not recorded This accounted for only 03 of all behaviors seen at ASB (and
was not shown on Figure 7)
Discussion
The TESS-2+scale results clearly indicated that the pioneering WDS site and the four sites
modeled on it met best practice standards in many areas These include the ratings for global site
assessment overall configuration of self-contained living arrangements with adjacent common
spaces informal workspaces for staff and accessible outdoor green spaces walking paths and
maintenance More pertinent to the present study there were no significant differences between the
sites that had 12-capacity houses and those with 20-capacity houses on any TESS items the NIA
subscale of overall environmental quality (SCUEQS) or CAAQS the composite score devised by
Mapping Five Sites
24 of 47
Slaughter et al (2006) Sites with 20-capacity houses did not look substantially different from sites
with 12-capacity houses according to the scale
Behavioral Mapping
A principal finding from behavioral mapping was the amount of time residents were found
engaged in leisure activity at all five sites Leisure was the most frequently observed activity for
MDR MPN and MPW the second most frequent at ASB and the third at WDS The level of
participation in meaningful activities is considered an important measure of residentsrsquo quality of life
(Gonzalez-Salvador et al 2000 Zimmerman et al 2005) Although the extent of engagement is
typically measured in more focused and intensive ways the fact that observers saw residents who
were alert and watching an activity is meaningful because observers were asked to distinguish
whether the resident was ldquojust sittingrdquo or ldquowatchingrdquo if that was the extent of the involvement When
percentages of time spent in Leisure are combined with Activities of Daily Living following the lead
of Gottesman and Bourestom (1974) who combined personal care television and socializing the
results in this study are ASB 468 MDR 701 MPN 471 and MPW 483 All percentages
total are better than the 1974 studyrsquos 43 Only WDS with 261 was substantially worse and that
was largely because so little time was devoted to the evening meal Ice (2002) studying one site had
found only 12 of time spent in social activities however little time was spent Just Sitting or
Watching For the five sites in this study total percentages of these inactive behaviors are ASB
316 MDR 171 MPN 229 MPW 176 and WDS 402 which are all substantially
different than Gottesman and Bourestomrsquos finding of 56 of time engaged in no activity or passive
activity or the 65 seen by (Ice 2002)
Surprisingly the five sites differed in the percent of maximum possible number of sightings
of residents observed in public areas per scan per day ranging from 49 at MDR to 80 at WDS
This range of 38 difference between the lowest and highest sites is considerable The traditional
concern of staff is that residents who stay in their rooms miss out on socialization and planned
Mapping Five Sites
25 of 47
activities (Grade 1976 Hogden 1985) The public areas most frequented by WDS residents were the
fireplace area and the common hallway area At most sites if the residents were not observed in the
common areas it would be likely that they were in the house areas This was confirmed in the other
principal finding that the percent of maximum possible sightings in the house areas was lowest for
WDS at 25 and highest at ASB at 50 At ASB residents spent 80 of their time in their two
houses At WDS they were encouraged to spend their time in the common areas and they did The
houses were used very differently at the two sites and this may have been because the architects who
were very involved in both sites made it evident that they were intended to be used differently
However the use of communal spaces often has little to do with the intended purpose Lawton
(1970) reports that in 10 observational rounds of a facility a total of 13 people were observed in the
nine social rooms on the nine floors while 79 were counted in the main floor social room where
arrivals and departures could be observed Similarly areas around nursing stations and elevators
frequently draw residents (Lawton 1970 Lawton 1977 Snyder 1980)
A number of factors can be ruled out in the search for unique characteristics of WDS that
could have contributed to the above findings The first factor is the reliability of the observers It is
unlikely that the differences were due to variability in the observational skillsprocedures of the
observers because of the high level of agreement in the assessment of interobserver reliability and
because all observers followed the same protocol in collecting the data The observersrsquo reliability was
also attested to by the similarity of the data within sites across the two days of data collection The
second factor is the general floor plan WDS shared the same basic floor plan with MPN and MPW a
building footprint like the capital letter E So it is unlikely that the gross outer shape of the floor plan
was relevant The third more general factor is related to the inter-site comparability of the TESS-2+
data These data indicate that the five sites were remarkably similar in general and internal design
features WDS has ratings on all measures that were comparable to one or more of the other sites
Mapping Five Sites
26 of 47
including potentially relevant measures such as the presence of homelike features the degree of
interaction with staff and residentsrsquo involvement in activities
There are however a number of other factors that may be relevant to understanding the
WDS data WDS was the only site in which meals were served in the common areas as well as in the
house dining rooms Congruently as already noted the highest number of resident sightings at WDS
was in the common areas (fireplace and common hallway) and most of these common area sightings
were in the common areas of WDS adjacent to the central area of the three houses Importantly these
were the only common areas with a direct line of sight to the central hall and kitchen of the central
house (School House) Staff notes indicated that the number of meal servings from the central house
kitchen was twice as high as that of the kitchens of the other two houses at WDS Again there is
congruence resident sightings in the central house dining room although low relative to central
common areas were twice as high as in the dining rooms of the other two houses at WDS It is also
relevant that staff used all parts of the central common area for activity programming Thus it seems
probable that several factors including the internal floor plan meal service and activity
programming made the central common areas of WDS a multiuse area which resulted in high
number of resident sightings though out the day with peaks at meal times It is worth asking whether
WDS staff would have used the central common area so intensely if the house kitchens had been
aligned with the dining rooms providing staff with oversight as in MPN and MPW
These observations could also explain another WDS anomaly that is the low number
of residents seen to be engaged in ADL activities at meal times compared to other sites If the
lower-functioning residents at WDS engaged in other activities in the central common areas
perhaps abandoning a meal to walk or sit elsewhere that could result in fewer observations
of eating during the mealtime Conversely it could mean that it would be more likely that
Mapping Five Sites
27 of 47
other activities (ie watching walking sitting and leisure activities) would be seen during
meal times which was the case in WDS
Finally the unique features of the WDS resident sighting data may have been related to the
greater degree of dementia (lower than average MMSE scores) of WDS residents The average
MMSE scores at other sites were 50 to 100 higher indicating less severe symptoms than the
average WDS score Congruently WDS had relatively high levels of sightings of sitting watching
and walking behavior and the highest number of pacing incidents Thus it is possible that the
differences in degree of dementia between sites and the related differences in levels of ambulation
made it more likely that WDS residents would leave their rooms and therefore WDS residents would
be sighted most frequently in the common areas of the WDS facility
It is important to note that no substantial differences were found between the 20-capacity
and 12-capacity houses that is in the mean domain scores of the TESS which was used to describe
environmental characteristics Scores were much the same across the five sites The TESS has goals
and domains aligned with the general site design which are more architecturally based and those
best aligned with interior design site operations and providing care
The architects might have thought their design at ASB and MDR would result in a small care
group of 10 and that residents along each bedroom hall would form a household but this did not
happen The residents in the 20-capacity houses did not form a 20-resident cluster either instead they
formed small groups for eating and activities Therefore other factors such as early or late rising or
naturally-formed friendships may be a greater influence than bedroom proximity The addition of
eight more residents per house might be anticipated to lead to crowding in the housesrsquo living-dining
areas or some other notable difference However crowding was not evident in the 20-capacity
houses In fact WDS gatherings in the common areas were more apt to be viewed as crowds
Mapping Five Sites
28 of 47
Observations indicated there that Disruptive Behavior often attributed to crowding was rare It
occurred in only one site and therefore could not be associated with a particular design
These observational results combined with the TESS results have broad implications for
future studies The first implication is methodological and the second is empirical Methodologically
the combination of architectural and behavioral measures in studies of facilities for the elderly
highlights the advantages over methodologies that employ only behavioral measures eg Dementia
Care Mapping (Brooker 2005 Fulton Edelman amp Kuhn 2006 Sloane Brooker Cohen et al
2007) and over studies that rely on client interviews (Kane 2003) Empirically 20 residents in a
house is approaching the size of dementia units in some nursing homes The present study revealed
that the main difference seen in the operation of the 12-resident house and the 20-resident house
design was that the latter appeared to hold more activities within the house raising questions about
the value and need for those common spaces whereas the former made more use of the common
spaces for activities In this way behavior was affected by the house design and by the way that staff
chose to organize activities
Mapping Five Sites
29 of 47
References
Benson D M Cameron D Humbach E Servino L amp Gambert S R (1987) Establishment and
impact of a dementia unit within the nursing home Journal of the American Geriatrics Society
35 319-323
Brawley E C (1997) Designing for Alzheimerrsquos disease Strategies for creating better care
environments New York Wiley
Brooker D (2005) Dementia Care Mapping A review of the research literature The Gerontologist
45 Special Issue I 11ndash18
Calkins M P Meehan R A amp Lipstreuer E (1999) Creekview Its history and evaluation
Kirtland OH IDEAS Inc
Colling K B (1999) Passive behaviors in Alzheimer disease A descriptive analysis American
Journal of Alzheimers Disease and Other Dementias 14 27-40
Cronin-Golumb A (1995) Vision in Alzheimerrsquos disease The Gerontologist 35 370-376
Day K Carreon D amp Stump C (2000) The therapeutic design of environments for people with
dementia A review of the empirical research The Gerontologist 40 397-416
Deely B Klingensmith L amp Silverman M (1995) Developing a residential Alzheimers facility
Focus on Geriatric Care and Rehabilitation 8(7) 1-8
DiMotta S Dubney B M Hoglund J D amp Kershner C (1993) Long-term care design Blazing
new territory - code reform and beyond Journal of Healthcare Design 5 197-203
DiMotta S amp Hoglund J D (2000) Woodside Place A residential care model for the Alzheimerrsquos
and dementia resident Symposium on Healthcare Design Anaheim CA Center for Healthcare
Design
Mapping Five Sites
30 of 47
Doty M M Koren M J amp Sturla E L (2008) Culture change in nursing homes How far have
we come Findings from The Commonwealth Fund 2007 National Survey of Nursing Homes
New York The Commonwealth Fund
Edelman P Fulton B R Kuhn D amp Chang C H (2005) A comparison of three methods of
measuring dementia-specific quality of life Perspectives of residents staff and observers The
Gerontologist 45 27-36
Fleiss J L (1981) Statistical methods for rates and proportions (2nd ed) New York John Wiley amp
Son
Folstein M F Folstein S E amp McHugh P R (1975) Mini-Mental State a practical method for
grading the cognitive state of patients for the clinician Journal of Geriatric Research 12 189-
198
Fulton B R Edelman P amp Kuhn D (2006) Streamlined models of dementia care mapping
Aging amp Mental Health 10 343-351
Gold D T (1991) A descriptive typology of dementia units In P D Sloane amp L J Mathew (Eds)
Dementia units in long-term care (pp 50-61) Baltimore Johns Hopkins University Press
Gonzalez-Salvador T Lyketsos C G Baker A Hovanec L Roques C Brandt J et al (2000)
Quality of Life in dementia patients in long-term care International Journal of Geriatric
Psychiatry 15 181-189
Gottesman L E amp Bourestom N C (1974) Why nursing homes do what they do The
Gerontologist 14 501-506
Grade B L (1976) A study of the entry crisis to a nursing home Unpublished masterrsquos thesis
University of Wisconsin Milwaukee
Grant L A (1998) Beyond the dichotomy An empirical typology of Alzheimerrsquos care in nursing
homes Research on Aging 20 569-592
Mapping Five Sites
31 of 47
Greene J A Asp J amp Crane N (1985) Specialized management of the Alzheimerrsquos disease
patient Does it make a difference A preliminary progress report Journal of the Tennessee
Medical Association 78 559-563
Harper G J (1998) Stress and adaptation among elders in life care communities Unpublished
doctoral dissertation Ohio State University Columbus
Hogden K M (1985) Leisurerecreation needs of hospitalized elderly A task force report
Activities Adaptation amp Aging 7 53-65
Hoglund D J amp Ledewitz S D (1999) Designing to meet the needs of people with Alzheimerrsquos
disease In B Schwarz amp R Brent (Eds) Aging autonomy and architecture Advances in
assisted living (pp 229-261) Baltimore John Hopkins University Press
Ice G H (2002) Daily life in a nursing home has it changed in 25 years Journal of Aging Studies
16 345-359
Imamoğlu Ccedil (2007) Assisted living as a new place schema A comparison with homes and nursing
homes Environment and Behavior 39 246-268
Innes A amp Surr C (2001) Measuring the well-being of people with dementia living in formal care
settings The use of Dementia Care Mapping Aging and Mental Health 5 258-268
Kane R A (2003) Definition measurement and correlates of quality of life in nursing homes
Toward a reasonable practice research and policy agenda The Gerontologist 43 Special
Issue II 28ndash36
Kuhn D Kasayka R E amp Lechner C (2002) Behavioral observations and quality life among
persons with dementia in 10 assisted living facilities American Journal of Alzheimerrsquos Disease
and Other Dementias 17 291-298
Lawton M P (1970) Ecology and aging In L A Pastaland amp D H Carson (Eds) The spatial
behavior of older people (pp 41-67) Ann Arbor MI University of Michigan Press
Mapping Five Sites
32 of 47
Lawton M P (1977) The impact of the environment on aging and behavior In K W Schaie (Ed)
Handbook of the Psychology of Aging (pp 276-301) New York Van Nostrand Reinhold
Lawton M P Weisman G D Sloane P amp Calkins M (1997) Assessing environments for older
people with chronic illness Journal of Mental Health and Aging 3 83-100
Lawton M P Weisman G D Sloane P Norris-Baker C Calkins M amp Zimmerman S I
(2000) Professional Environmental Assessment Procedure for special care units for elders with
dementing illness and its relationship to the Therapeutic Environment Screening Schedule
Alzheimer Disease and Associated Disorders 14 28ndash38
Lee M Madden V Mason K Rice S Wyburd J amp Hobson S (2006) Occupational
engagement and adaptation in adults with dementia A preliminary investigation Physical and
Occupational Therapy in Geriatrics 25 63-81
Lehrner P N (1979) Handbook of ethological methods New York Garland STMP
Margulis S T (2003) Privacy as a social issue and behavioral concept Journal of Social Issues 59
243-261
Martin P amp Bateson P (1987) Measuring behaviour An introductory guide New York
Cambridge University Press
Mathew L J amp Sloane P D (1991) Organizing and staffing dementia units In P D Sloane amp L
J Mathew (Eds) Dementia units in long-term care (pp 101-127) Baltimore Johns Hopkins
University Press
McAllister C L amp Silverman M A (1999) Community formation and community roles among
persons with Alzheimerrsquos disease A comparative study of experience in a residential
Alzheimerrsquos facility and a traditional nursing home Qualitative Health Research 9 65-85
McCracken A L amp Fitzwater E (1989) The right environment for Alzheimerrsquos Geriatric
Nursing 10 293-294
Mapping Five Sites
33 of 47
Milke D L (2003) Iterative post-occupancy evaluations of the McConnell Place North design
[Abstract] Proceedings of the 56th Annual Scientific Meeting of the Gerontological Society of
America 43 48 San Diego CA
Milke D L Clark C amp Bucknell M (2000) Assessing the adequacy of residential lighting in two
care centres for persons with Alzheimerrsquos Disease using the new age-adjusted North American
illumination recommendations (Research Report) Ottawa Ontario Canada Canada Mortgage
and Housing Corporation
National Institute on Aging Coordinating Center (1993) NIA collaborative studies special care units
for Alzheimers disease Manual of procedures Davis CA Northern California Alzheimers
Disease Center University of California
Rabig J Thomas W Kane R A Cutler L J amp McAlilly S (2006) Radical redesign of nursing
homes Applying the Green House concept in Tupelo Mississippi The Gerontologist 46 533-
539
Rule B G Milke D L amp Dobbs A R (1992) Design of institutions Cognitive functioning and
social interactions of the aged resident Journal of Applied Gerontology 11 475-488
Saxton J Silverman M Ricci E Keane C amp Deely B (1998) Maintenance of mobility in
residents of an Alzheimer special care facility International Psychogeriatrics 10 213-224
Schwarz B Chaudhury H amp Tofle R B (2004) Effect of design interventions on a dementia care
setting American Journal of Alzheimers Disease and Other Dementias 19 172-176
Silverman M Ricci E Saxton J Ledewitz S McAllister C amp Keane C (1995) Woodside
Place The first three years of a residential Alzheimerrsquos facility (Vols 1-2) Oakmont PA
Presbyterian Senior Care
Skea D amp Lindesay J (1996) An evaluation of two models of long-term residential care for
elderly people with dementia International Journal of Geriatric Psychiatry 11 233-241
Mapping Five Sites
34 of 47
Slaughter S Calkins M Eliasziw M amp Reimer M (2006) Measuring physical and social
environments in nursing homes for people with middle- to late-stage dementia Journal of the
American Geriatrics Society 54 1436-1441
Sloane P D Brooker D Cohen L Douglass C Edelman P Fulton B R et al (2007)
Dementia Care Mapping as a research tool International Journal of Geriatric Psychiatry 22
580-589
Sloane P D Mitchell M Priesser J S Phillips C Commander C amp Burker E (1998)
Environmental correlates of resident agitation in Alzheimerrsquos disease special care units Journal
of the American Geriatric Society 46 862ndash869
Sloane P D Mitchell C M Weisman G Zimmerman S Foley K M L Lynn M et al
(2002) The Therapeutic Environment Screening Survey for Nursing Homes (TESS-NH) An
observational instrument for assessing the physical environment of institutional settings for
persons with dementia Journals of Gerontology Series B Psychological Sciences and Social
Sciences 57B(Suppl 2) S69-S78
Sloane P D Zimmerman S Williams C S Reed P S Gill KS amp Preisser J S (2005)
Evaluating the quality of life of long-term care residents with dementia The Gerontologist 45
37-49
Snyder L G (1980) An exploratory study of patterns of social interaction organization and facility
design in three nursing homes In J Hendricks (Ed) Institutionalization and Alternative Futures
(pp 68-80) Farmingdale NY Baywood Pub Co
Sommer R amp Sommer B B (1986) A practical guide to behavioral research Tools and
techniques (2nd ed) New York Oxford
Van Haitsma K Lawton M P amp Kleban M H (2000) Does segregation help or hinder
Examining the role of heterogeneity in behavioral and emotional aspects of quality of life for
Mapping Five Sites
35 of 47
persons with cognitive impairment in the nursing home Research and Practice in Alzheimerrsquos
Disease 4 163-177
Verbeek H van Rossum E Zwakhalen S M G Kempen G I J M amp Hamers J P H (2009)
Small homelike care environments for older people with dementia A literature review
International Psychogeriatrics 21 252-264
Voelkl J E (2006) Therapeutic environments in nursing homes Fostering residents meaningful
activity engagement Activities Directors Quarterly for Alzheimers and Other Dementia
Patients 7(3) 35-44
Warren S (Ed) (1998) Innovative dementia care McConnell Place North evaluation (Research
Report) Edmonton Alberta Canada Evaluating Programs of Innovative Continuing Care
Zeisel J (1998) The Hearthstone health environments case study Journal of Healthcare Design
Proceedings from the Symposium on Healthcare Design San Francisco CA National
Symposium on Healthcare Design Inc
Zeisel J Hyde J amp Levkoff S (1994) Best practices An environment-behavior (E-B) model for
Alzheimer special care units American Journal of Alzheimerrsquos Care and Related Disorders and
Research and Care 9(2) 4-21
Zimmerman S Sloane P D Williams C S Reed P S Preisser J S Eckert J K et al (2005)
Dementia care and quality of life in assisted living and nursing homes The Gerontologist 45
133-146
Mapping Five Sites
36 of 47
Table 1 Comparison of Architectural Features Across Five Sites
Feature ASB MDR MPN MPW WDS
Total facility square footage 23040 sq ft 27308 sq fta 24750 sq ft 23864 sq ft 21540 sq ft
Size of administration area (offices conference reception etc but not service or employee spaces)
960 sq ft (No entry hall)
1584 sq ft day program offices and program space
1675 sq ft 1629 sq ft 972 sq ft (No entry hall)
Staff (lunch) room 16rsquo x 18rsquo 6rsquo11rdquo x 6rsquo2rdquo 158rsquo x 16rsquo 138rsquo x 16rsquo 95rsquo x 30rsquo (plus)b
Treatment or examination room
No Yes In daycare area
No No Yes In central
areac
Medications storage Central medication cart
Medication room Medication room per house
Medication room per house
Central medication cart
Location of meal preparation
Facility kitchen in administration area
Facility kitchen in administration area
Adjacent nursing home (see house kitchen)
Adjacent nursing home (see house kitchen)
Facility kitchen in administration area
Use of house kitchen Servery snacks Servery snacks Meal preparation for all breakfasts and some lunches servery
Meal preparation for all breakfasts and some lunches servery
Servery snacks
Family dining room or central country kitchen usage
Small group activities family functions by reservation
Small group activities family functions by reservation
Small group meetings Great Room party food preparation family functions by reservation
Small group meetings Great Room party food preparation family functions by reservation
Small group activities family functions by reservation
Houses and capacity 2 20 2 20 3 12 3 12 3 12
Private tubroom Two off the central hallway
Two off the central hallway
One located in each house
One located in each house
None
Private shower areas One per 10 residents located in each wing of each house
One per 10 residents located in each wing of each house
One per resident located in each resident room with the one shared bedroom having a shared shower
One per resident located in each resident room with the one shared bedroom having a shared shower
One per 12 residents located in each house
Resident room doors Split door Split door Split door Regular Split door
Inventory of public rooms and seating capacity (includes all alcoves that can be used for seating and seating areas near exits)
15 165
17 176
15 232
13 219
14 182
Variety and appearance of outdoor Area
2 small (little greenery) 1 medium (mixed hardgreen surfaces) and a large courtyardmdashvery appealing
2 small (much greenery) 1 medium (mixed hardgreen surfaces) 2 large courtyards (1 mixed hardgreen surfaces 1 green) mdash very appealing
3 small (much greenery) 1 large (mostly green courtyard mdash very appealing
3 small (much greenery) and 1 large (mostly green courtyard mdash very appealing
1 small (much greenery) 1 medium (mostly green) and 1 large (mostly green) courtyard mdash very appealing
a Does not include researchteaching wing Total for entire floor space is 40382 sq ft b Room at WDS was not intended as a lounge ie a retreat from work to professionalize the care staff role it was to serve as a place to read and discuss work At other
sites the lunch room also served as a lounge c Room was intended as a multi-purpose room
Mapping Five Sites
37 of 47
Table 2 Therapeutic Environment Screening Scale Items for Goal and Domain Possible Range
Midpoint and Mean in Each Group
Therapeutic Goal and Domain
Item Numbers Range Mid-point ASB amp MDR
20-Capacity Houses MPN MPW amp WDS
12-Capacity Houses
ASB MDR Site Scores
Mean MPN MPW WDS Site Scores
Mean
Safetysecurityhealth
Exit control 2a 2b 2c 2d 2e 2g
2h 3a 3b 0-11 55 2 1 15 1 2 2 17
Maintenance 7b1Dagger 7b2Dagger 7b3Dagger 7b4Dagger 0-8 40 8 8 80 8 8 80
Cleanliness 7a1Dagger 7a2Dagger 7a3 7a4 0-8 40 8 8 80 7 8 8 77
Lack of odorsℓ 9aDagger 9bDagger 0-4 20 4 3 35 4 4 4 40
Safetyℓ 7c1 7c2Dagger 7c3 7c4 8 0-10 60 10 10 100 10 10 10 100
Orientationcuing 19 20ф 27a 27bcDagger
27d 27e 27f 28 29 0-17 85 1212 120 11 9 12 107
Privacycontrol
Privacy 30a 30b 30c 30d 0-4 20 0 0 0 1 2 0 10
Functional ability 16 17a 17b 18Dagger 0-7 35 7 7 70 7 7 7 70
Stimulation
Lighting 21 22a 22bDagger 22cDagger
23a 23b 23c 0-14 70 13 13 130 11 14 13 127
Tactilevisual
stimulation 34 35Dagger 37b 0-16 80 10 6 80 15 14 11 133
Quietness 24a 24b 24c 24d
24eDagger 24f 24g 25 26 0-25 125 21 21 210 19 20 23 207
Physical attractiveness
4a1 4a2 4b1 4b2
4c1 4c2 4d1 4d2 37c 0-34 140 16 15 155 15 16 16 157
Socialization
Homelike
environment 15Dagger 31Dagger 32 0-9 45 9 9 90 9 9 9 90
Resident
appearance 36Dagger
0-2 10 2 2 20 2 2 20
SCUEQS 0-41 - 41 39 40 39 4141 40
CAAQS sect 0-100 - 786 857
Large means represent better physical environment
Dagger Items used to compute the 18-item Special Care Environmental Quality Scale (SCUEQS) 27b and 27c were treated as a single item and item 15 was
misnumbered in the TESS-2+ Revised version (as item 13) ф Item 20 is the percentage of common rooms with signsgraphics floor plans in all sites allowed a view into common rooms (scored as zero) ℓ An item was unintentionally omitted from the TESS-2+ scoring form (10 in Odors and 11 in Safety) sect Composite Above Average Quality Score (CAAQS) represents the percentage of TESS-2+ domains that were above average in quality
Mapping Five Sites
38 of 47
Table 3 Percent of Resident Population Who Were Observed During Behavior Scans
at Each Site in Particular Areasa
AreaSite 20-Capacity Houses 12-Capacity Houses
ASB MDR MPN MPW WDS
Total Areas 608 493 511 564 803
Total Common Areas 62 158 169 200 511
Total Outdoor Areas 46 02 11 56 38
Total House Areas 500 333 331 311 254
House 1 259 168 115 69 62
House 2 241 165 108 128 123
House 3 108 114 69
House Kitchen 149 08 75 53 49
House LivingDining Room 324 278 236 232 200 a Resident data were adjusted to show the mean percent of residents at a site who were observed per scan per day Note Total Areas is the sum of the following Total Common Total Outdoor and Total House Total House Areas is the sum of Houses 1 House 2 and House 3 House Kitchen and LivingDining Rooms are summed across houses Blank cells indicate that the question was not applicable
Mapping Five Sites
39 of 47
Table 4 Percent of Resident Population Who Were Observed During Behavior Scans
at Each Site in Particular Common Areasa
Location 20-Capacity Houses 12-Capacity Houses ASB MDR MPN MPW WDS
Great Room 07 75 94 91 64
Fireplace Seating Area 22 69 43 13 106
ActivityCraft Room 04 47 00 02 10
TV Room ndash ndash 43 64 58
Other TV Area ndash ndash 11 39 ndash
Common Area Hallway Seating 37 108 138 143 396
Music Room ndash ndash 00 ndash 00
Garden Room ndash ndash 00 ndash 04
Beauty Salon 39 12 00 00 00
Family Dining RoomCountry Kitchen 00 09 00 00 00
Total 109 320 329 352 638 a Resident data were adjusted to show the mean percent of residents at a site who were observed per scan per day Note Dashes indicate that residents were not observed in these areas
Mapping Five Sites
40 of 47
Table 5 Percent of Resident Population Who Were Observed During Behavior Scans
at Each Site at Particular Times of Day
Time of Day 20-Capacity Houses 12-Capacity Houses
ASB MDR MPN MPW WDS
Before Lunch 541 360 386 475 654
Lunch 805 663 667 722 1000
Between Meals 657 530 506 589 963
Supper 765 738 744 744 922
After Supper 50 390 447 469 740 a Resident data were adjusted to show the mean percent of residents at a site who were observed per scan per day Note Before Lunch (4 scans-730-1030) Lunch (2 scans-1130 amp 1230) Between Meals (3 scans-1330 to 1530) Supper (2 scans-1630 amp 1730) After Supper (4 scans-1830 to 2130)
Mapping Five Sites
41 of 47
Figure 1 Floor plan of Asbury Place Mt Lebanon PA
Mapping Five Sites
42 of 47
Figure 2 Floor plan of Marjorie Doyle Rockwell Center Cohoes NY
Mapping Five Sites
43 of 47
Figure 3 Floor plan of McConnell Place North Edmonton AB
Mapping Five Sites
44 of 47
Figure 4 Floor plan of McConnell Place West Edmonton AB
Mapping Five Sites
45 of 47
Figure 5 Floor plan of Woodside Place Oakmont PA
Mapping Five Sites
46 of 47
Figure 6
McConnell Place Northordf Residentsrsquo Activities When Alone and in the Presence of Staff
ordf The average MMSE score was 153 at MPN higher than the average across sites 132 + 15 (M+SE) MPN residents appeared not to initiate activities when alone
0
5
10
15
20
25
30
35
40
Alone Day 1 With Staff Day 1 Alone Day 2 With Staff Day 2
Nu
mb
er R
esid
ents
Arts amp Crafts
Chores
CookingBaking
Eating
Exercising
Games
Grooming
Lg Activity Grp
Music Event
Reading
Sm Interaction
Walking
Watching
Watching TV
Other
Mapping Five Sites
47 of 47
Figure 7
Percent of Scans in Which Residents at Each Site Engaged in Particular Behaviors
0
10
20
30
40
50
60
70
80
90
100
ASB MDR MPN MPW WDS
Misc
Just Sit
Watch
Walk
Leisure
Work
ADLs

Mapping Five Sites
10 of 47
a great room a fireplace seating area at least one activity or craft room a family or private dining
room and a beauty salon
Insert Figures 1-5 and Table 1 about here
Overall the floor plans of ASB and MDR were very similar as were the plans of the other
three centers MPN MPW and WDS In the latter three centres the houses were equivalent to the
three parallel wings flanked by courtyards that is outdoor spaces with natural green elements and a
view to the sky Each wing was self-contained each had a kitchen livingdining room and laundry
and a room for bathing or showering Each wing had a central hallway with bedrooms running its
length on either side accommodating 12 residents ASB and MDR floor plans had two perpendicular
housing areas comprised of two parallel wings The architects viewed this design as four houses each
accommodating 10 residents Each bedroom hallway and one living area was considered a house and
a pair of houses was viewed as sharing a kitchen The kitchen was planned as a hub for staff assigned
to the two bedroom hallways and a place to locate a staff-buddy for a task (DiMotta amp Hoglund
2000) However at ASB for example the arrangement of furniture with glider-rocking chairs
arranged primarily in one dining-living space and tables placed in the dining-living area on the other
side of the kitchen suggested that more than the kitchen was being shared and that these common
rooms were being used as a continuous space for all 20 residents to share In gathering data from
management and staff there was no evidence that staff and residents were treating a particular
dining-living room as being the domain of just one hallway of residents Moreover ASB staff said
residents housed in bedrooms along one hall were frequently found in the other bedroom hall
Mealtime seating varied for breakfast lunch and dinner but the variation was not related to
Mapping Five Sites
11 of 47
residentsrsquo home hallway Consequently each U-shaped housing area in ASB and MDR was
considered a house for the purposes of this study
House kitchens differed across sites At ASB and MPW these were large country kitchens
but at other sites the kitchens were small At WDS kitchens were designated as ldquoserveriesrdquo Some
sites had activity areas or rooms in the common areas In the fireplace seating area adjacent to
WDSrsquos country kitchen (but not within the country kitchen) were a large dining table and matching
chairs An open wall above a bar-type counter allowed items to be passed from the country kitchen
This made the space more flexible because it was not viewed as a special events venue like the
enclosed private dining rooms in the other four centers It also encouraged various activities to be
conducted on this dining table that were not scheduled for the common areas in the other centers
Table 1 supplements this descriptive comparison
The common features included floor plans designed for small group living (houses of 12 or
20) in self-contained houses with spaces for cooking eating bathing and gatherings bedroom
hallways that are short by facility standards (yet long for family dwellings) a variety of common
spaces and informal staff workspaces but no formal nursing stations (Table1) Differences in
general design between sites were also in quantitative measures for example the number of beds
ranged from 36 to 40 the number of public rooms ranged from 11 to 17 (Table 1) and most striking
the seating capacity in public rooms varied from 165 to 232 (Table 1) with ASB and MDR having
somewhat less capacity than MPN and MPW Inspection of floor plans showing chair location (data
not shown) revealed that the differences in numbers of seats between sites were principally in the
houses kitchen and livingdining areas implying that the site differences in these floor plan areas
were relevant
Mapping Five Sites
12 of 47
Therapeutic Environment Screening Scale
Environmental characteristics were described using the 38-item Therapeutic Environment
Screening Scale (TESS-2+) Designees at each site filled out the form after training by one of the
authors of the study who was experienced in using the scale Interrater agreement was assured by
comparing interpretations and ratings consensus was reached on any issues related to scoring
Interrater reliability for TESS-2+ items had ranged from 67 to 100 agreement (Sloane et al
1998) There were no significant differences in the mean domain scores between the sites that had
12-capacity houses and those with 20-capacity houses (Table 2) The findings are presented by
grouping the items into two types of goals and domains those associated with the general site design
that may be more architecturally based and those more aligned with interior design site operations
and providing care
Insert Table 2 about here
General Design The scores related to the therapeutic goals and domains for building design
were similar across sites reflecting the implementation of the basic Woodside building model
(Table 2 Exit control Orientation and cuing Privacy and Functional ability Physical
attractiveness) All sites in this study had strategies for exit control (Table 2 2andash2h) WDS had both
alarms and keypad-locks on external exits while the other sites had keypad-locks MPN and MPW
had a reception desk at the front entrance as a clerk-observation post At ASB and MPW the external
exits were partially disguised at the other sites they were not (Table 2 3a 3b)
Mapping Five Sites
13 of 47
Orientation and cuing is related to residentsrsquo personal safety and self-awareness thus the
photos and names beside the bedrooms doorways which all sites used are important (Table 2 27
28 29) as in the ldquotip of the tongue phenomenonrdquo they need a cue to retrieve the memory (Zeisel
1998) An open interior plan that allows residents to see into public rooms is an optimal way finding
strategy for persons with dementia all sites employed this The strategic location of cues and
personal items can also aid way finding Although institutional-style directional signage is eschewed
on restroom doors for example both graphics and labels are advised Open floor plans often require
few signs MDR had the most signs and MPW used the fewest graphics and signs with other sites
having intermediate numbers (Table 2 19 20) Large windows that provide natural exterior views
(Table 2 4) are not only attractive they are another tactic that serves way finding and also provides
seasonal orientation in the latitudes of these five sites The entrances of residentsrsquo bedrooms were
personalized at all sites (Table 2 27 28 29) Redundancy is recommended and a greater variety of
items were used at ASB MDR WDS and MPN than at MPW for this purpose
All five sites scored well on supporting functional ability (Table 2 16 17 18) that is either
slowing decline or stimulating improvement which is something for which sites designed for
dementia have been associated (Benson Cameron Humback Servino amp Gambert 1987 Greene
Asp amp Crane 1985 Innes amp Surr 2001 McCracken amp Fitzwater 1989 Rabig Thomas Kane
Cutler amp McAlilly 2006 Rule Milke Dobbs 1992 Silverman et al 1995 Skea amp Lindesay 1996
Warren 1998)
Interior Design and Approach to Care The first goal of this type is safety security and
health with domains (besides exit control discussed above) of Maintenance Cleanliness Lack of
odors and Safety (of floors) A second goal is Stimulation and a third is Socialization Slaughter et
al (2006) viewed these as basic requirements and found no significant differences in these goals
when comparing the 6 special care facilities (bungalows) with the 45 units in traditional institutional
facilities so it is not surprising that the same was true for these highly similar sites
Mapping Five Sites
14 of 47
Stimulation domains include Lighting Tactile and Visual stimulation as well as Quietness
Both sensory deprivation and over-stimulation are viewed as problems (Brawley 1997 Day
Carreon amp Stump 2000 Cronin-Golumb 1995) According to Zeisel Hyde amp Levkoff (1994)
appropriate levels of stimulation results from having a site with a high sensory comprehension
ranking so not necessarily the overall calmest setting but rather one with a moderate amount of
sensory input that residents can understand Ambient lighting was considered good in all sites with
minimal glare from a number of reflecting surfaces such as picture windows and French doors (Table
2 21) Lighting was evenly distributed and levels were considered ample (Table 2 22 23) with the
exception of MPN Ambient auditory noise was not deemed a problem whether considering type or
level of noise (Table 2 24 25) The general availability of things to touch in common areas such as
those that invite handling or folding was somewhat less at ASB and MDR than at other sites
Overall ratings of home likeness and the individuality of residentsrsquo appearance were
consistently good but the general atmosphere influenced by residentsrsquo lower overall levels of
participation in activities and a less positive rating for staff interactions with residents resulted in
MDR scoring lower that other sites (Table 2 15 31 32 36) WDS scored in the mid-range on
residentsrsquo involvement but as indicated above its residents had much lower MMSE scores At all
sites personal pictures or mementos were in most residentsrsquo bedrooms However such items were
not present in common rooms at MDR
The mean SCUEQS scores (Table 2) which summarized a subset of the TESS-2+ items
were not significantly different between the sites that had 12-capacity houses and those with 20-
capacity houses The SCUEQS had been derived for the NIA studies of special care units and was
considered by experts to measure important aspect of the physical environment and serve as a
reliable measure for differentiating better nursing units and assessing the overall environmental
quality (Sloane et al 2002) The results appear to justify the architectsrsquo design decisions that resulted
in two hallways of 10 residents sharing the large kitchen and the living-dining rooms Slaughter et al
Mapping Five Sites
15 of 47
(2006) devised another composite score the Composite Above Average Quality Score (CAAQS)
which they found to be more sensitive than the SCUEQS The CAAQS represents the percentage of
domains that were above average in quality It revealed a difference between the sites with 12-
capacity houses (857) and those with 20-capacity houses (786) that was not shown by the
SCUEQS but the difference was not significant
Behavioral Mapping
Reliability The number and category (staff family or resident) of persons observed at each location
was recorded on floor plans in successive behavior scans one hour apart over the course of two
days Interobserver reliability of the scans was assessed at each site Cohenrsquos kappa a measure of
agreement between observers has a range from 0 no agreement to 100 total agreement Fleiss
(1981) characterized a kappa of 4 to 6 as fair 6 to 75 as good and over 75 as excellent There was
good agreement on average between two independent observers on the identification of behaviors
observed Kappa mean (SD) 0851 (04) and excellent agreement on identification of people being
scanned as residents staff family or others kappa mean (SD) 0732 (07)
Observations Fifteen observation periods or scans per day were conducted one per hour during
the two days of observation Examination of the within-site data revealed that the only differences
were day differences in specific scans related to the occurrence of special events eg barbecues
Consequently the data were collapsed across days A scan of about 10 minutes in duration was
required to count people in all public areas Observers minimized the possibility of counting the same
person in more than one room during a scan by following a preplanned path through the building and
working quickly Counts of sightings of staff family and volunteers and residents by hour in each
Mapping Five Sites
16 of 47
area of each site were summed over the two-day period of observation To assist the description of
the findings resident data were subsequently adjusted to show the mean percent of residents at a site
who were observed per scan per day and to show the percent of scans in which residents were
involved in a particular activity or seen in a particular room or area
Staff and Family Observations of staff and family are presented without data as these were
ancillary to the principal focus on residents Staff were seen most often in the house kitchens or
diningliving rooms across all sites except WDS At WDS staff were seen in the kitchens but
seldom in the diningliving rooms In all three sites with 12-capacity houses the central house was a
hub of staff activity with nearly twice as many staff seen in that kitchen (or an adjacent room which
was the dining room in MPN and MPW but was a hallway in WDS) as in the kitchens of the houses
on either side WDS staff were also seen in the seating area outside the great room nearly as much as
in the house kitchens Residents were seldom engaged in an activity when staff were not around eg
see Figure 6 for MPN This is not surprising because persons with Alzheimer disease lose their
ability to initiate activities (Colling 1999 Lee et al 2006) Others have shown that appropriate
environments are not sufficient residents with this disease need activities and all five sites employed
activity coordinators (Grant 1998 Van Haitsma Lawton amp Kleban 2000 Voelkl 2006)
Insert Figure 6 about here
Family members were at some sites as early as 830 am and as late as 930 pm although at
MPN all visits except one were in the afternoon ASB had a family meeting increasing the number
Mapping Five Sites
17 of 47
of sightings of family members to 42 (19 were associated with the meeting) The numbers of
sightings of family members over the two days of observation at other sites were WDS ndash 27 MPN ndash
23 and MDR and MPN ndash 12 each
Insert Tables 3 and 4 about here
Resident Locations Direct observation revealed a pattern of use that was unexpected and not
evident in TESS results Overall resident sightings were at least 25 higher at WDS than at the
other four sites (Table 3) The number of sightings in the common areas of WDS was over 60
greater than those at any other site (Table 3) Residents were most frequently seen in the area just
outside the great room (Table 4) By contrast at all other sites residents spent more time (60 of
sightings) in their houses (Table 4) ASB where residents spent 80 of their time in their houses
represented the extreme in this regard with the other sites being intermediate between ASB and WDS
(Table 4) Differences did not appear to align with whether the houses were of 20- or 12-capacity At
all sites residents were seen most frequently in the common areas outside of the houses with the
common hallways the great room and fireplace seating area accounting for decreasing numbers of
residents in that order (Table 4) however a stylist in the ASB beauty salon drew a crowd showing
how an occasional event can change behavior patterns At the sites with 12-capacity houses and
television rooms those rooms were popular and drew as many residents as the fireplace area
The large percent (396) of residents seen in common areas at WDS was attributable to
sightings in the common hallway and fireplace seating area next to the School House (Figure 5
Table 4) All residents could be gathered in the area which was slightly larger than the great room
Mapping Five Sites
18 of 47
observers noted a continuous round of activities involving groups of varying sizes No other site used
this area as intensely At WDS a day program brought in 8 additional residents and several staff who
ran activities that attracted some residents (discussions newspaper reading crafts) Observers were
asked not to count persons associated with the day program in their tally but the heavy use of the
central space and the day program activities presented there had some influence ASB and MDR also
had day programs that used separate spaces for that purpose so program participants were not seen
Chairs lining the walls in this area of WDS augmenting seating arrangements in front of and on
either side of the fireplace as well as oversized displays of small snapshots on several walls resulted
in an institutional appearance Local lore attributes the lineup of chairs to residents who initiated it
shortly after move-in Staff moved chairs back where the interior designers located them but
residents would pull them back across the corridor in a line until staff gave up
Site differences in the use of the great room were noteworthy ASB appeared to use it only
for church services on a regular basis with ldquoaudience-seatingrdquo left in place from day-to-day
Possibly this was because this great room was relatively distant from the houses (Figure 1) In WDS
MPN and MPW great room seating was rearranged throughout the day to accommodate numerous
events MPN and MPW used the great room like a town hall holding events such as afternoon teas
dances and musical entertainment At MDR small numbers of residents were in the great room
throughout the day but no large gatherings were seen
Within sites the sightings of residents in the houses were distributed fairly evenly across the
houses (Figures 1-5 Table 3) Residents were most often seen in the living-dining rooms and as
noted above staff were most often seen in the adjacent kitchens The exception was WDS where the
house design did not provide a good line of sight for staff between the kitchens and the living-dining
rooms (Figures 4 amp 5) Staff at all other sites could work in kitchens and keep an eye on residents
WDS staff actively encouraged residents to leave dining rooms after a meal and join activities in the
central area likely for two reasons because activities were not planned for the houses and because
Mapping Five Sites
19 of 47
staff working in the houses could not easily monitor a resident who remained in the house living-
dining room WDS staff were rarely seen in the housesrsquo living-dining rooms The School House the
centre house accounted for the majority of residents observed across all houses This kitchen
adjacent to the highly used area just outside the Great Room provided a relatively good monitoring
station for the house and activities in the common areas At WDS mealtimes two common areas
were used residents who needed substantial assistance with meals were often fed in the craft room
and a high-functioning group ate at the dining table alongside the fireplace seating
In the houses at other sites most sightings of residents were in the diningliving room areas
Fewer were in the kitchen and fewer still in the house hallways (Table 3) At MDR only one area
adjacent to the kitchen was devoted to dining and almost no residents were seen in kitchens The
same was not true at ASB where approximately the same proportions of residents were seen in the
shared kitchens as in each of the living-dining rooms on either side (Table 3 sums all four living-
dining rooms) However at ASB the numbers were likely from residents moving between the two
diningliving rooms and passing through the kitchens (Figure 1) because residents were rarely
engaged in the type of tasks encouraged at MPN and MPW (ie handling dishes setting tables etc
to encourage maintenance of their functional abilities Figure 7) Interestingly the highly similar sites
found different ways to use their spaces and different approaches to activities
ASB MPW and WDS held barbecues during the days of observation (Table 3) This meant
the residentsrsquo presence in the kitchen and dining areas was reduced at those meals Accordingly for
comparison across sites dining area sightings were adjusted by adding mealtime sightings in the
courtyards The peak periods for resident sightings were during the midday lunch (1130-1330) and
evening meals (1630-1830) (Table 5) Even so sightings of residents at mealtimes were only 66-
80 of occupancy indicating eight to ten residents were not seen at mealtimes in public areas at
most sites (Table 5) The exception was WDS where sightings indicated nearly all residents were
observed in public areas at mealtimes (Table 5) although WDS residents did not gather in the house
Mapping Five Sites
20 of 47
dining areas for the noon meal With most activities occurring in the core of the building WDS was
flexible about meal arrangements serving meals where residents were located such as the area
outside the great room on an activity room Residents were not required to return to their own houses
to eat They could join day program residents and eat in the common area or join residents in another
house One group of women was known for asking to eat together on their own in the common area
WDS also led other sites in the number of residents observed at other times of the day (Table 5) The
differences were especially marked in the afternoon between meals (1330-1630) and the period
after the evening meal (1830-2130) This suggests that WDS staff may have been viewing the
central areas like they would the central areas of a unit in a nursing home on dementia units staff
often prefer that residents stay in view and not return to their rooms
Resident Activity The observed activity patterns were surprising considering high levels of
resident inactivity reported for nursing home residents (Gottesman amp Bourestom 1974 Ice 2002)
Gottesman and Bourestomrsquos (1974) observations in 40 nursing homes revealed that residents spent
56 of their time during peak daylight hours engaged in no activity or passive activity In that study
residents were involved in personal care television and socializing for 43 of the time Ice (2002)
reprised the Gottesman and Bourestom study and found residents spent 65 of their time doing little
or nothing with only 12 in social activities (Ice 2002) In the present study observations of Just
Sitting and Watching were expected to measure levels of passive behaviors Residents in the five
sites appeared to be engaged in ADLs and Leisure for greater amounts of time than in Just Sitting
and Watching (although small amounts of napping as passive behavior were coded as
Miscellaneous) but this was not significant (Figure 7) Chi-square analysis using phi coefficients
found that residents at WDS engaged significantly less in ADLs than residents in other centres
(plt00001) residents at ASB MPN amp WDS were engaged less in leisure (plt005 each) ASB
Mapping Five Sites
21 of 47
residents were engaged less in Just Sitting (plt00005) and residents were observed Watching less at
MDR MPN amp MPW (plt00005 each) Leisure was the most frequently observed activity for MDR
MPN and MPW the second most frequent at ASB and the third at WDS Recreational activities
both planned and informal activities were considered to be Leisure thus watching TV or waiting to
be served at a coffee party were both coded as being Leisure (persons who were within the group and
actively attending to events but not actively engaged at the moment were coded as Leisure too and
this was distinguished from Watching which was defined as ldquoattending to activities or interactions of
others from a distance such as from a doorway watching a streetrdquo)
Insert Figure 7 about here
The ADLs were the second most frequently seen activity for MDR MPN and MPW and the
third for ASB but were seen much less at WDS The majority of ADLs across sites occurred at meal
times indicating they involved dining (ASB 570 MDR 590 MPN 758 MPW 736 but
WDS 422) The low percent of time spent by WDS residents on ADLs during the evening meal
time (42) agrees with the low number of sightings in the dining area at that time (385 of max)
It appears that WDS residents sat watched and walked but did not spend much time eating
(Figure 7) In contrast previous research at MPN and MPW has found mealtimes to be the longest
duration behavior Scans needed to be one hour apart to avoid seeing meals on two consecutive scans
and oversampling the behavior (Milke et al 2000)
Work that is tasks such as housekeeping and cooking were not seen at either of the sites
with 20-capacity houses but this is the only difference evident when compared with the 12-capacity
Mapping Five Sites
22 of 47
houses Compared to other sites MPN and MPW residents engaged in moderate proportions of all
behaviors (Figure 7) Residents at WDS spent proportionately less time on ADLs light
housekeeping and Leisure and more time at Walking Watching and Just Sitting Chi-square
analysis using phi coefficients showed that residents were observed Walking significantly less at
MDR (plt 005) residents at ASB and MDR engaged significantly less in Work and there were no
significant differences between sites in Miscellaneous activities (Figure 7)
Observersrsquo Notes
Some large differences were found in the care programs across sites Observersrsquo notes
indicated that at MPN and MPW residents were encouraged to be involved in the daily routine of the
facility and direct care staff ate meals with residents This strategy was said to stimulate conversation
and provide residents with a model for appropriate behavior Staff played the role of ldquomotherrdquo rising
to find an item in the kitchen and keeping an eye on food consumption Managers at MPN and MPW
considered this role an essential component of care At ASB MDR and WDS there was no evidence
of such a role
Most cooking was done in facility kitchens away from areas that residents could access This
tended to result in the house kitchens being treated more like institutional serveries Fridges mainly
contained large juice jugs and prepared snacks However at MPW and MPN when a resident opened
the fridge door the door was full of condiments and casseroles it looked just like home because of
an effort to keep institutional sized packages to a minimum These two sites used their kitchens quite
differently than the other three sites At MPN and MPW all breakfasts and snacks were prepared in
the houses each day by direct care staff On four weekdays lunches also were prepared Residents
were invited to participate in some of the chopping slicing and mixing which was considered an
essential component of the care program When meals were delivered from nearby facility kitchens
staff decanted items into family-size serving bowls They added condiments and poured drinks
Mapping Five Sites
23 of 47
serving the meals much like those prepared in-house Although residents helping with meal
preparation appeared to be limited to MPN and MPW staff records indicated additional forms of
daily and special occasion activities occurred at all sites Daily activities included easy tasks eg
folding laundry and exercises at all five sites discussion groups at MDR and WDS religious
activities at ASB MPN and MPW musicsinging at ASB MPW and WDS movies at ASB and
grooming at all sites except WDS
Outdoor courtyards were accessible to residents on the observation days at all sites The
barbecue meal at MPW drew the highest number of residents outside but from mid-morning until
early evening residents were seen on the patios or walkways This was true at every site except
MDR where few ventured outside (data not presented)
Disruptive behaviors were seen only at ASB where at 730 am 230 pm and 430 pm a
single resident was disruptive Whether this was the same or different resident is not known the
identity of persons was not recorded This accounted for only 03 of all behaviors seen at ASB (and
was not shown on Figure 7)
Discussion
The TESS-2+scale results clearly indicated that the pioneering WDS site and the four sites
modeled on it met best practice standards in many areas These include the ratings for global site
assessment overall configuration of self-contained living arrangements with adjacent common
spaces informal workspaces for staff and accessible outdoor green spaces walking paths and
maintenance More pertinent to the present study there were no significant differences between the
sites that had 12-capacity houses and those with 20-capacity houses on any TESS items the NIA
subscale of overall environmental quality (SCUEQS) or CAAQS the composite score devised by
Mapping Five Sites
24 of 47
Slaughter et al (2006) Sites with 20-capacity houses did not look substantially different from sites
with 12-capacity houses according to the scale
Behavioral Mapping
A principal finding from behavioral mapping was the amount of time residents were found
engaged in leisure activity at all five sites Leisure was the most frequently observed activity for
MDR MPN and MPW the second most frequent at ASB and the third at WDS The level of
participation in meaningful activities is considered an important measure of residentsrsquo quality of life
(Gonzalez-Salvador et al 2000 Zimmerman et al 2005) Although the extent of engagement is
typically measured in more focused and intensive ways the fact that observers saw residents who
were alert and watching an activity is meaningful because observers were asked to distinguish
whether the resident was ldquojust sittingrdquo or ldquowatchingrdquo if that was the extent of the involvement When
percentages of time spent in Leisure are combined with Activities of Daily Living following the lead
of Gottesman and Bourestom (1974) who combined personal care television and socializing the
results in this study are ASB 468 MDR 701 MPN 471 and MPW 483 All percentages
total are better than the 1974 studyrsquos 43 Only WDS with 261 was substantially worse and that
was largely because so little time was devoted to the evening meal Ice (2002) studying one site had
found only 12 of time spent in social activities however little time was spent Just Sitting or
Watching For the five sites in this study total percentages of these inactive behaviors are ASB
316 MDR 171 MPN 229 MPW 176 and WDS 402 which are all substantially
different than Gottesman and Bourestomrsquos finding of 56 of time engaged in no activity or passive
activity or the 65 seen by (Ice 2002)
Surprisingly the five sites differed in the percent of maximum possible number of sightings
of residents observed in public areas per scan per day ranging from 49 at MDR to 80 at WDS
This range of 38 difference between the lowest and highest sites is considerable The traditional
concern of staff is that residents who stay in their rooms miss out on socialization and planned
Mapping Five Sites
25 of 47
activities (Grade 1976 Hogden 1985) The public areas most frequented by WDS residents were the
fireplace area and the common hallway area At most sites if the residents were not observed in the
common areas it would be likely that they were in the house areas This was confirmed in the other
principal finding that the percent of maximum possible sightings in the house areas was lowest for
WDS at 25 and highest at ASB at 50 At ASB residents spent 80 of their time in their two
houses At WDS they were encouraged to spend their time in the common areas and they did The
houses were used very differently at the two sites and this may have been because the architects who
were very involved in both sites made it evident that they were intended to be used differently
However the use of communal spaces often has little to do with the intended purpose Lawton
(1970) reports that in 10 observational rounds of a facility a total of 13 people were observed in the
nine social rooms on the nine floors while 79 were counted in the main floor social room where
arrivals and departures could be observed Similarly areas around nursing stations and elevators
frequently draw residents (Lawton 1970 Lawton 1977 Snyder 1980)
A number of factors can be ruled out in the search for unique characteristics of WDS that
could have contributed to the above findings The first factor is the reliability of the observers It is
unlikely that the differences were due to variability in the observational skillsprocedures of the
observers because of the high level of agreement in the assessment of interobserver reliability and
because all observers followed the same protocol in collecting the data The observersrsquo reliability was
also attested to by the similarity of the data within sites across the two days of data collection The
second factor is the general floor plan WDS shared the same basic floor plan with MPN and MPW a
building footprint like the capital letter E So it is unlikely that the gross outer shape of the floor plan
was relevant The third more general factor is related to the inter-site comparability of the TESS-2+
data These data indicate that the five sites were remarkably similar in general and internal design
features WDS has ratings on all measures that were comparable to one or more of the other sites
Mapping Five Sites
26 of 47
including potentially relevant measures such as the presence of homelike features the degree of
interaction with staff and residentsrsquo involvement in activities
There are however a number of other factors that may be relevant to understanding the
WDS data WDS was the only site in which meals were served in the common areas as well as in the
house dining rooms Congruently as already noted the highest number of resident sightings at WDS
was in the common areas (fireplace and common hallway) and most of these common area sightings
were in the common areas of WDS adjacent to the central area of the three houses Importantly these
were the only common areas with a direct line of sight to the central hall and kitchen of the central
house (School House) Staff notes indicated that the number of meal servings from the central house
kitchen was twice as high as that of the kitchens of the other two houses at WDS Again there is
congruence resident sightings in the central house dining room although low relative to central
common areas were twice as high as in the dining rooms of the other two houses at WDS It is also
relevant that staff used all parts of the central common area for activity programming Thus it seems
probable that several factors including the internal floor plan meal service and activity
programming made the central common areas of WDS a multiuse area which resulted in high
number of resident sightings though out the day with peaks at meal times It is worth asking whether
WDS staff would have used the central common area so intensely if the house kitchens had been
aligned with the dining rooms providing staff with oversight as in MPN and MPW
These observations could also explain another WDS anomaly that is the low number
of residents seen to be engaged in ADL activities at meal times compared to other sites If the
lower-functioning residents at WDS engaged in other activities in the central common areas
perhaps abandoning a meal to walk or sit elsewhere that could result in fewer observations
of eating during the mealtime Conversely it could mean that it would be more likely that
Mapping Five Sites
27 of 47
other activities (ie watching walking sitting and leisure activities) would be seen during
meal times which was the case in WDS
Finally the unique features of the WDS resident sighting data may have been related to the
greater degree of dementia (lower than average MMSE scores) of WDS residents The average
MMSE scores at other sites were 50 to 100 higher indicating less severe symptoms than the
average WDS score Congruently WDS had relatively high levels of sightings of sitting watching
and walking behavior and the highest number of pacing incidents Thus it is possible that the
differences in degree of dementia between sites and the related differences in levels of ambulation
made it more likely that WDS residents would leave their rooms and therefore WDS residents would
be sighted most frequently in the common areas of the WDS facility
It is important to note that no substantial differences were found between the 20-capacity
and 12-capacity houses that is in the mean domain scores of the TESS which was used to describe
environmental characteristics Scores were much the same across the five sites The TESS has goals
and domains aligned with the general site design which are more architecturally based and those
best aligned with interior design site operations and providing care
The architects might have thought their design at ASB and MDR would result in a small care
group of 10 and that residents along each bedroom hall would form a household but this did not
happen The residents in the 20-capacity houses did not form a 20-resident cluster either instead they
formed small groups for eating and activities Therefore other factors such as early or late rising or
naturally-formed friendships may be a greater influence than bedroom proximity The addition of
eight more residents per house might be anticipated to lead to crowding in the housesrsquo living-dining
areas or some other notable difference However crowding was not evident in the 20-capacity
houses In fact WDS gatherings in the common areas were more apt to be viewed as crowds
Mapping Five Sites
28 of 47
Observations indicated there that Disruptive Behavior often attributed to crowding was rare It
occurred in only one site and therefore could not be associated with a particular design
These observational results combined with the TESS results have broad implications for
future studies The first implication is methodological and the second is empirical Methodologically
the combination of architectural and behavioral measures in studies of facilities for the elderly
highlights the advantages over methodologies that employ only behavioral measures eg Dementia
Care Mapping (Brooker 2005 Fulton Edelman amp Kuhn 2006 Sloane Brooker Cohen et al
2007) and over studies that rely on client interviews (Kane 2003) Empirically 20 residents in a
house is approaching the size of dementia units in some nursing homes The present study revealed
that the main difference seen in the operation of the 12-resident house and the 20-resident house
design was that the latter appeared to hold more activities within the house raising questions about
the value and need for those common spaces whereas the former made more use of the common
spaces for activities In this way behavior was affected by the house design and by the way that staff
chose to organize activities
Mapping Five Sites
29 of 47
References
Benson D M Cameron D Humbach E Servino L amp Gambert S R (1987) Establishment and
impact of a dementia unit within the nursing home Journal of the American Geriatrics Society
35 319-323
Brawley E C (1997) Designing for Alzheimerrsquos disease Strategies for creating better care
environments New York Wiley
Brooker D (2005) Dementia Care Mapping A review of the research literature The Gerontologist
45 Special Issue I 11ndash18
Calkins M P Meehan R A amp Lipstreuer E (1999) Creekview Its history and evaluation
Kirtland OH IDEAS Inc
Colling K B (1999) Passive behaviors in Alzheimer disease A descriptive analysis American
Journal of Alzheimers Disease and Other Dementias 14 27-40
Cronin-Golumb A (1995) Vision in Alzheimerrsquos disease The Gerontologist 35 370-376
Day K Carreon D amp Stump C (2000) The therapeutic design of environments for people with
dementia A review of the empirical research The Gerontologist 40 397-416
Deely B Klingensmith L amp Silverman M (1995) Developing a residential Alzheimers facility
Focus on Geriatric Care and Rehabilitation 8(7) 1-8
DiMotta S Dubney B M Hoglund J D amp Kershner C (1993) Long-term care design Blazing
new territory - code reform and beyond Journal of Healthcare Design 5 197-203
DiMotta S amp Hoglund J D (2000) Woodside Place A residential care model for the Alzheimerrsquos
and dementia resident Symposium on Healthcare Design Anaheim CA Center for Healthcare
Design
Mapping Five Sites
30 of 47
Doty M M Koren M J amp Sturla E L (2008) Culture change in nursing homes How far have
we come Findings from The Commonwealth Fund 2007 National Survey of Nursing Homes
New York The Commonwealth Fund
Edelman P Fulton B R Kuhn D amp Chang C H (2005) A comparison of three methods of
measuring dementia-specific quality of life Perspectives of residents staff and observers The
Gerontologist 45 27-36
Fleiss J L (1981) Statistical methods for rates and proportions (2nd ed) New York John Wiley amp
Son
Folstein M F Folstein S E amp McHugh P R (1975) Mini-Mental State a practical method for
grading the cognitive state of patients for the clinician Journal of Geriatric Research 12 189-
198
Fulton B R Edelman P amp Kuhn D (2006) Streamlined models of dementia care mapping
Aging amp Mental Health 10 343-351
Gold D T (1991) A descriptive typology of dementia units In P D Sloane amp L J Mathew (Eds)
Dementia units in long-term care (pp 50-61) Baltimore Johns Hopkins University Press
Gonzalez-Salvador T Lyketsos C G Baker A Hovanec L Roques C Brandt J et al (2000)
Quality of Life in dementia patients in long-term care International Journal of Geriatric
Psychiatry 15 181-189
Gottesman L E amp Bourestom N C (1974) Why nursing homes do what they do The
Gerontologist 14 501-506
Grade B L (1976) A study of the entry crisis to a nursing home Unpublished masterrsquos thesis
University of Wisconsin Milwaukee
Grant L A (1998) Beyond the dichotomy An empirical typology of Alzheimerrsquos care in nursing
homes Research on Aging 20 569-592
Mapping Five Sites
31 of 47
Greene J A Asp J amp Crane N (1985) Specialized management of the Alzheimerrsquos disease
patient Does it make a difference A preliminary progress report Journal of the Tennessee
Medical Association 78 559-563
Harper G J (1998) Stress and adaptation among elders in life care communities Unpublished
doctoral dissertation Ohio State University Columbus
Hogden K M (1985) Leisurerecreation needs of hospitalized elderly A task force report
Activities Adaptation amp Aging 7 53-65
Hoglund D J amp Ledewitz S D (1999) Designing to meet the needs of people with Alzheimerrsquos
disease In B Schwarz amp R Brent (Eds) Aging autonomy and architecture Advances in
assisted living (pp 229-261) Baltimore John Hopkins University Press
Ice G H (2002) Daily life in a nursing home has it changed in 25 years Journal of Aging Studies
16 345-359
Imamoğlu Ccedil (2007) Assisted living as a new place schema A comparison with homes and nursing
homes Environment and Behavior 39 246-268
Innes A amp Surr C (2001) Measuring the well-being of people with dementia living in formal care
settings The use of Dementia Care Mapping Aging and Mental Health 5 258-268
Kane R A (2003) Definition measurement and correlates of quality of life in nursing homes
Toward a reasonable practice research and policy agenda The Gerontologist 43 Special
Issue II 28ndash36
Kuhn D Kasayka R E amp Lechner C (2002) Behavioral observations and quality life among
persons with dementia in 10 assisted living facilities American Journal of Alzheimerrsquos Disease
and Other Dementias 17 291-298
Lawton M P (1970) Ecology and aging In L A Pastaland amp D H Carson (Eds) The spatial
behavior of older people (pp 41-67) Ann Arbor MI University of Michigan Press
Mapping Five Sites
32 of 47
Lawton M P (1977) The impact of the environment on aging and behavior In K W Schaie (Ed)
Handbook of the Psychology of Aging (pp 276-301) New York Van Nostrand Reinhold
Lawton M P Weisman G D Sloane P amp Calkins M (1997) Assessing environments for older
people with chronic illness Journal of Mental Health and Aging 3 83-100
Lawton M P Weisman G D Sloane P Norris-Baker C Calkins M amp Zimmerman S I
(2000) Professional Environmental Assessment Procedure for special care units for elders with
dementing illness and its relationship to the Therapeutic Environment Screening Schedule
Alzheimer Disease and Associated Disorders 14 28ndash38
Lee M Madden V Mason K Rice S Wyburd J amp Hobson S (2006) Occupational
engagement and adaptation in adults with dementia A preliminary investigation Physical and
Occupational Therapy in Geriatrics 25 63-81
Lehrner P N (1979) Handbook of ethological methods New York Garland STMP
Margulis S T (2003) Privacy as a social issue and behavioral concept Journal of Social Issues 59
243-261
Martin P amp Bateson P (1987) Measuring behaviour An introductory guide New York
Cambridge University Press
Mathew L J amp Sloane P D (1991) Organizing and staffing dementia units In P D Sloane amp L
J Mathew (Eds) Dementia units in long-term care (pp 101-127) Baltimore Johns Hopkins
University Press
McAllister C L amp Silverman M A (1999) Community formation and community roles among
persons with Alzheimerrsquos disease A comparative study of experience in a residential
Alzheimerrsquos facility and a traditional nursing home Qualitative Health Research 9 65-85
McCracken A L amp Fitzwater E (1989) The right environment for Alzheimerrsquos Geriatric
Nursing 10 293-294
Mapping Five Sites
33 of 47
Milke D L (2003) Iterative post-occupancy evaluations of the McConnell Place North design
[Abstract] Proceedings of the 56th Annual Scientific Meeting of the Gerontological Society of
America 43 48 San Diego CA
Milke D L Clark C amp Bucknell M (2000) Assessing the adequacy of residential lighting in two
care centres for persons with Alzheimerrsquos Disease using the new age-adjusted North American
illumination recommendations (Research Report) Ottawa Ontario Canada Canada Mortgage
and Housing Corporation
National Institute on Aging Coordinating Center (1993) NIA collaborative studies special care units
for Alzheimers disease Manual of procedures Davis CA Northern California Alzheimers
Disease Center University of California
Rabig J Thomas W Kane R A Cutler L J amp McAlilly S (2006) Radical redesign of nursing
homes Applying the Green House concept in Tupelo Mississippi The Gerontologist 46 533-
539
Rule B G Milke D L amp Dobbs A R (1992) Design of institutions Cognitive functioning and
social interactions of the aged resident Journal of Applied Gerontology 11 475-488
Saxton J Silverman M Ricci E Keane C amp Deely B (1998) Maintenance of mobility in
residents of an Alzheimer special care facility International Psychogeriatrics 10 213-224
Schwarz B Chaudhury H amp Tofle R B (2004) Effect of design interventions on a dementia care
setting American Journal of Alzheimers Disease and Other Dementias 19 172-176
Silverman M Ricci E Saxton J Ledewitz S McAllister C amp Keane C (1995) Woodside
Place The first three years of a residential Alzheimerrsquos facility (Vols 1-2) Oakmont PA
Presbyterian Senior Care
Skea D amp Lindesay J (1996) An evaluation of two models of long-term residential care for
elderly people with dementia International Journal of Geriatric Psychiatry 11 233-241
Mapping Five Sites
34 of 47
Slaughter S Calkins M Eliasziw M amp Reimer M (2006) Measuring physical and social
environments in nursing homes for people with middle- to late-stage dementia Journal of the
American Geriatrics Society 54 1436-1441
Sloane P D Brooker D Cohen L Douglass C Edelman P Fulton B R et al (2007)
Dementia Care Mapping as a research tool International Journal of Geriatric Psychiatry 22
580-589
Sloane P D Mitchell M Priesser J S Phillips C Commander C amp Burker E (1998)
Environmental correlates of resident agitation in Alzheimerrsquos disease special care units Journal
of the American Geriatric Society 46 862ndash869
Sloane P D Mitchell C M Weisman G Zimmerman S Foley K M L Lynn M et al
(2002) The Therapeutic Environment Screening Survey for Nursing Homes (TESS-NH) An
observational instrument for assessing the physical environment of institutional settings for
persons with dementia Journals of Gerontology Series B Psychological Sciences and Social
Sciences 57B(Suppl 2) S69-S78
Sloane P D Zimmerman S Williams C S Reed P S Gill KS amp Preisser J S (2005)
Evaluating the quality of life of long-term care residents with dementia The Gerontologist 45
37-49
Snyder L G (1980) An exploratory study of patterns of social interaction organization and facility
design in three nursing homes In J Hendricks (Ed) Institutionalization and Alternative Futures
(pp 68-80) Farmingdale NY Baywood Pub Co
Sommer R amp Sommer B B (1986) A practical guide to behavioral research Tools and
techniques (2nd ed) New York Oxford
Van Haitsma K Lawton M P amp Kleban M H (2000) Does segregation help or hinder
Examining the role of heterogeneity in behavioral and emotional aspects of quality of life for
Mapping Five Sites
35 of 47
persons with cognitive impairment in the nursing home Research and Practice in Alzheimerrsquos
Disease 4 163-177
Verbeek H van Rossum E Zwakhalen S M G Kempen G I J M amp Hamers J P H (2009)
Small homelike care environments for older people with dementia A literature review
International Psychogeriatrics 21 252-264
Voelkl J E (2006) Therapeutic environments in nursing homes Fostering residents meaningful
activity engagement Activities Directors Quarterly for Alzheimers and Other Dementia
Patients 7(3) 35-44
Warren S (Ed) (1998) Innovative dementia care McConnell Place North evaluation (Research
Report) Edmonton Alberta Canada Evaluating Programs of Innovative Continuing Care
Zeisel J (1998) The Hearthstone health environments case study Journal of Healthcare Design
Proceedings from the Symposium on Healthcare Design San Francisco CA National
Symposium on Healthcare Design Inc
Zeisel J Hyde J amp Levkoff S (1994) Best practices An environment-behavior (E-B) model for
Alzheimer special care units American Journal of Alzheimerrsquos Care and Related Disorders and
Research and Care 9(2) 4-21
Zimmerman S Sloane P D Williams C S Reed P S Preisser J S Eckert J K et al (2005)
Dementia care and quality of life in assisted living and nursing homes The Gerontologist 45
133-146
Mapping Five Sites
36 of 47
Table 1 Comparison of Architectural Features Across Five Sites
Feature ASB MDR MPN MPW WDS
Total facility square footage 23040 sq ft 27308 sq fta 24750 sq ft 23864 sq ft 21540 sq ft
Size of administration area (offices conference reception etc but not service or employee spaces)
960 sq ft (No entry hall)
1584 sq ft day program offices and program space
1675 sq ft 1629 sq ft 972 sq ft (No entry hall)
Staff (lunch) room 16rsquo x 18rsquo 6rsquo11rdquo x 6rsquo2rdquo 158rsquo x 16rsquo 138rsquo x 16rsquo 95rsquo x 30rsquo (plus)b
Treatment or examination room
No Yes In daycare area
No No Yes In central
areac
Medications storage Central medication cart
Medication room Medication room per house
Medication room per house
Central medication cart
Location of meal preparation
Facility kitchen in administration area
Facility kitchen in administration area
Adjacent nursing home (see house kitchen)
Adjacent nursing home (see house kitchen)
Facility kitchen in administration area
Use of house kitchen Servery snacks Servery snacks Meal preparation for all breakfasts and some lunches servery
Meal preparation for all breakfasts and some lunches servery
Servery snacks
Family dining room or central country kitchen usage
Small group activities family functions by reservation
Small group activities family functions by reservation
Small group meetings Great Room party food preparation family functions by reservation
Small group meetings Great Room party food preparation family functions by reservation
Small group activities family functions by reservation
Houses and capacity 2 20 2 20 3 12 3 12 3 12
Private tubroom Two off the central hallway
Two off the central hallway
One located in each house
One located in each house
None
Private shower areas One per 10 residents located in each wing of each house
One per 10 residents located in each wing of each house
One per resident located in each resident room with the one shared bedroom having a shared shower
One per resident located in each resident room with the one shared bedroom having a shared shower
One per 12 residents located in each house
Resident room doors Split door Split door Split door Regular Split door
Inventory of public rooms and seating capacity (includes all alcoves that can be used for seating and seating areas near exits)
15 165
17 176
15 232
13 219
14 182
Variety and appearance of outdoor Area
2 small (little greenery) 1 medium (mixed hardgreen surfaces) and a large courtyardmdashvery appealing
2 small (much greenery) 1 medium (mixed hardgreen surfaces) 2 large courtyards (1 mixed hardgreen surfaces 1 green) mdash very appealing
3 small (much greenery) 1 large (mostly green courtyard mdash very appealing
3 small (much greenery) and 1 large (mostly green courtyard mdash very appealing
1 small (much greenery) 1 medium (mostly green) and 1 large (mostly green) courtyard mdash very appealing
a Does not include researchteaching wing Total for entire floor space is 40382 sq ft b Room at WDS was not intended as a lounge ie a retreat from work to professionalize the care staff role it was to serve as a place to read and discuss work At other
sites the lunch room also served as a lounge c Room was intended as a multi-purpose room
Mapping Five Sites
37 of 47
Table 2 Therapeutic Environment Screening Scale Items for Goal and Domain Possible Range
Midpoint and Mean in Each Group
Therapeutic Goal and Domain
Item Numbers Range Mid-point ASB amp MDR
20-Capacity Houses MPN MPW amp WDS
12-Capacity Houses
ASB MDR Site Scores
Mean MPN MPW WDS Site Scores
Mean
Safetysecurityhealth
Exit control 2a 2b 2c 2d 2e 2g
2h 3a 3b 0-11 55 2 1 15 1 2 2 17
Maintenance 7b1Dagger 7b2Dagger 7b3Dagger 7b4Dagger 0-8 40 8 8 80 8 8 80
Cleanliness 7a1Dagger 7a2Dagger 7a3 7a4 0-8 40 8 8 80 7 8 8 77
Lack of odorsℓ 9aDagger 9bDagger 0-4 20 4 3 35 4 4 4 40
Safetyℓ 7c1 7c2Dagger 7c3 7c4 8 0-10 60 10 10 100 10 10 10 100
Orientationcuing 19 20ф 27a 27bcDagger
27d 27e 27f 28 29 0-17 85 1212 120 11 9 12 107
Privacycontrol
Privacy 30a 30b 30c 30d 0-4 20 0 0 0 1 2 0 10
Functional ability 16 17a 17b 18Dagger 0-7 35 7 7 70 7 7 7 70
Stimulation
Lighting 21 22a 22bDagger 22cDagger
23a 23b 23c 0-14 70 13 13 130 11 14 13 127
Tactilevisual
stimulation 34 35Dagger 37b 0-16 80 10 6 80 15 14 11 133
Quietness 24a 24b 24c 24d
24eDagger 24f 24g 25 26 0-25 125 21 21 210 19 20 23 207
Physical attractiveness
4a1 4a2 4b1 4b2
4c1 4c2 4d1 4d2 37c 0-34 140 16 15 155 15 16 16 157
Socialization
Homelike
environment 15Dagger 31Dagger 32 0-9 45 9 9 90 9 9 9 90
Resident
appearance 36Dagger
0-2 10 2 2 20 2 2 20
SCUEQS 0-41 - 41 39 40 39 4141 40
CAAQS sect 0-100 - 786 857
Large means represent better physical environment
Dagger Items used to compute the 18-item Special Care Environmental Quality Scale (SCUEQS) 27b and 27c were treated as a single item and item 15 was
misnumbered in the TESS-2+ Revised version (as item 13) ф Item 20 is the percentage of common rooms with signsgraphics floor plans in all sites allowed a view into common rooms (scored as zero) ℓ An item was unintentionally omitted from the TESS-2+ scoring form (10 in Odors and 11 in Safety) sect Composite Above Average Quality Score (CAAQS) represents the percentage of TESS-2+ domains that were above average in quality
Mapping Five Sites
38 of 47
Table 3 Percent of Resident Population Who Were Observed During Behavior Scans
at Each Site in Particular Areasa
AreaSite 20-Capacity Houses 12-Capacity Houses
ASB MDR MPN MPW WDS
Total Areas 608 493 511 564 803
Total Common Areas 62 158 169 200 511
Total Outdoor Areas 46 02 11 56 38
Total House Areas 500 333 331 311 254
House 1 259 168 115 69 62
House 2 241 165 108 128 123
House 3 108 114 69
House Kitchen 149 08 75 53 49
House LivingDining Room 324 278 236 232 200 a Resident data were adjusted to show the mean percent of residents at a site who were observed per scan per day Note Total Areas is the sum of the following Total Common Total Outdoor and Total House Total House Areas is the sum of Houses 1 House 2 and House 3 House Kitchen and LivingDining Rooms are summed across houses Blank cells indicate that the question was not applicable
Mapping Five Sites
39 of 47
Table 4 Percent of Resident Population Who Were Observed During Behavior Scans
at Each Site in Particular Common Areasa
Location 20-Capacity Houses 12-Capacity Houses ASB MDR MPN MPW WDS
Great Room 07 75 94 91 64
Fireplace Seating Area 22 69 43 13 106
ActivityCraft Room 04 47 00 02 10
TV Room ndash ndash 43 64 58
Other TV Area ndash ndash 11 39 ndash
Common Area Hallway Seating 37 108 138 143 396
Music Room ndash ndash 00 ndash 00
Garden Room ndash ndash 00 ndash 04
Beauty Salon 39 12 00 00 00
Family Dining RoomCountry Kitchen 00 09 00 00 00
Total 109 320 329 352 638 a Resident data were adjusted to show the mean percent of residents at a site who were observed per scan per day Note Dashes indicate that residents were not observed in these areas
Mapping Five Sites
40 of 47
Table 5 Percent of Resident Population Who Were Observed During Behavior Scans
at Each Site at Particular Times of Day
Time of Day 20-Capacity Houses 12-Capacity Houses
ASB MDR MPN MPW WDS
Before Lunch 541 360 386 475 654
Lunch 805 663 667 722 1000
Between Meals 657 530 506 589 963
Supper 765 738 744 744 922
After Supper 50 390 447 469 740 a Resident data were adjusted to show the mean percent of residents at a site who were observed per scan per day Note Before Lunch (4 scans-730-1030) Lunch (2 scans-1130 amp 1230) Between Meals (3 scans-1330 to 1530) Supper (2 scans-1630 amp 1730) After Supper (4 scans-1830 to 2130)
Mapping Five Sites
41 of 47
Figure 1 Floor plan of Asbury Place Mt Lebanon PA
Mapping Five Sites
42 of 47
Figure 2 Floor plan of Marjorie Doyle Rockwell Center Cohoes NY
Mapping Five Sites
43 of 47
Figure 3 Floor plan of McConnell Place North Edmonton AB
Mapping Five Sites
44 of 47
Figure 4 Floor plan of McConnell Place West Edmonton AB
Mapping Five Sites
45 of 47
Figure 5 Floor plan of Woodside Place Oakmont PA
Mapping Five Sites
46 of 47
Figure 6
McConnell Place Northordf Residentsrsquo Activities When Alone and in the Presence of Staff
ordf The average MMSE score was 153 at MPN higher than the average across sites 132 + 15 (M+SE) MPN residents appeared not to initiate activities when alone
0
5
10
15
20
25
30
35
40
Alone Day 1 With Staff Day 1 Alone Day 2 With Staff Day 2
Nu
mb
er R
esid
ents
Arts amp Crafts
Chores
CookingBaking
Eating
Exercising
Games
Grooming
Lg Activity Grp
Music Event
Reading
Sm Interaction
Walking
Watching
Watching TV
Other
Mapping Five Sites
47 of 47
Figure 7
Percent of Scans in Which Residents at Each Site Engaged in Particular Behaviors
0
10
20
30
40
50
60
70
80
90
100
ASB MDR MPN MPW WDS
Misc
Just Sit
Watch
Walk
Leisure
Work
ADLs
Mapping Five Sites
11 of 47
residentsrsquo home hallway Consequently each U-shaped housing area in ASB and MDR was
considered a house for the purposes of this study
House kitchens differed across sites At ASB and MPW these were large country kitchens
but at other sites the kitchens were small At WDS kitchens were designated as ldquoserveriesrdquo Some
sites had activity areas or rooms in the common areas In the fireplace seating area adjacent to
WDSrsquos country kitchen (but not within the country kitchen) were a large dining table and matching
chairs An open wall above a bar-type counter allowed items to be passed from the country kitchen
This made the space more flexible because it was not viewed as a special events venue like the
enclosed private dining rooms in the other four centers It also encouraged various activities to be
conducted on this dining table that were not scheduled for the common areas in the other centers
Table 1 supplements this descriptive comparison
The common features included floor plans designed for small group living (houses of 12 or
20) in self-contained houses with spaces for cooking eating bathing and gatherings bedroom
hallways that are short by facility standards (yet long for family dwellings) a variety of common
spaces and informal staff workspaces but no formal nursing stations (Table1) Differences in
general design between sites were also in quantitative measures for example the number of beds
ranged from 36 to 40 the number of public rooms ranged from 11 to 17 (Table 1) and most striking
the seating capacity in public rooms varied from 165 to 232 (Table 1) with ASB and MDR having
somewhat less capacity than MPN and MPW Inspection of floor plans showing chair location (data
not shown) revealed that the differences in numbers of seats between sites were principally in the
houses kitchen and livingdining areas implying that the site differences in these floor plan areas
were relevant
Mapping Five Sites
12 of 47
Therapeutic Environment Screening Scale
Environmental characteristics were described using the 38-item Therapeutic Environment
Screening Scale (TESS-2+) Designees at each site filled out the form after training by one of the
authors of the study who was experienced in using the scale Interrater agreement was assured by
comparing interpretations and ratings consensus was reached on any issues related to scoring
Interrater reliability for TESS-2+ items had ranged from 67 to 100 agreement (Sloane et al
1998) There were no significant differences in the mean domain scores between the sites that had
12-capacity houses and those with 20-capacity houses (Table 2) The findings are presented by
grouping the items into two types of goals and domains those associated with the general site design
that may be more architecturally based and those more aligned with interior design site operations
and providing care
Insert Table 2 about here
General Design The scores related to the therapeutic goals and domains for building design
were similar across sites reflecting the implementation of the basic Woodside building model
(Table 2 Exit control Orientation and cuing Privacy and Functional ability Physical
attractiveness) All sites in this study had strategies for exit control (Table 2 2andash2h) WDS had both
alarms and keypad-locks on external exits while the other sites had keypad-locks MPN and MPW
had a reception desk at the front entrance as a clerk-observation post At ASB and MPW the external
exits were partially disguised at the other sites they were not (Table 2 3a 3b)
Mapping Five Sites
13 of 47
Orientation and cuing is related to residentsrsquo personal safety and self-awareness thus the
photos and names beside the bedrooms doorways which all sites used are important (Table 2 27
28 29) as in the ldquotip of the tongue phenomenonrdquo they need a cue to retrieve the memory (Zeisel
1998) An open interior plan that allows residents to see into public rooms is an optimal way finding
strategy for persons with dementia all sites employed this The strategic location of cues and
personal items can also aid way finding Although institutional-style directional signage is eschewed
on restroom doors for example both graphics and labels are advised Open floor plans often require
few signs MDR had the most signs and MPW used the fewest graphics and signs with other sites
having intermediate numbers (Table 2 19 20) Large windows that provide natural exterior views
(Table 2 4) are not only attractive they are another tactic that serves way finding and also provides
seasonal orientation in the latitudes of these five sites The entrances of residentsrsquo bedrooms were
personalized at all sites (Table 2 27 28 29) Redundancy is recommended and a greater variety of
items were used at ASB MDR WDS and MPN than at MPW for this purpose
All five sites scored well on supporting functional ability (Table 2 16 17 18) that is either
slowing decline or stimulating improvement which is something for which sites designed for
dementia have been associated (Benson Cameron Humback Servino amp Gambert 1987 Greene
Asp amp Crane 1985 Innes amp Surr 2001 McCracken amp Fitzwater 1989 Rabig Thomas Kane
Cutler amp McAlilly 2006 Rule Milke Dobbs 1992 Silverman et al 1995 Skea amp Lindesay 1996
Warren 1998)
Interior Design and Approach to Care The first goal of this type is safety security and
health with domains (besides exit control discussed above) of Maintenance Cleanliness Lack of
odors and Safety (of floors) A second goal is Stimulation and a third is Socialization Slaughter et
al (2006) viewed these as basic requirements and found no significant differences in these goals
when comparing the 6 special care facilities (bungalows) with the 45 units in traditional institutional
facilities so it is not surprising that the same was true for these highly similar sites
Mapping Five Sites
14 of 47
Stimulation domains include Lighting Tactile and Visual stimulation as well as Quietness
Both sensory deprivation and over-stimulation are viewed as problems (Brawley 1997 Day
Carreon amp Stump 2000 Cronin-Golumb 1995) According to Zeisel Hyde amp Levkoff (1994)
appropriate levels of stimulation results from having a site with a high sensory comprehension
ranking so not necessarily the overall calmest setting but rather one with a moderate amount of
sensory input that residents can understand Ambient lighting was considered good in all sites with
minimal glare from a number of reflecting surfaces such as picture windows and French doors (Table
2 21) Lighting was evenly distributed and levels were considered ample (Table 2 22 23) with the
exception of MPN Ambient auditory noise was not deemed a problem whether considering type or
level of noise (Table 2 24 25) The general availability of things to touch in common areas such as
those that invite handling or folding was somewhat less at ASB and MDR than at other sites
Overall ratings of home likeness and the individuality of residentsrsquo appearance were
consistently good but the general atmosphere influenced by residentsrsquo lower overall levels of
participation in activities and a less positive rating for staff interactions with residents resulted in
MDR scoring lower that other sites (Table 2 15 31 32 36) WDS scored in the mid-range on
residentsrsquo involvement but as indicated above its residents had much lower MMSE scores At all
sites personal pictures or mementos were in most residentsrsquo bedrooms However such items were
not present in common rooms at MDR
The mean SCUEQS scores (Table 2) which summarized a subset of the TESS-2+ items
were not significantly different between the sites that had 12-capacity houses and those with 20-
capacity houses The SCUEQS had been derived for the NIA studies of special care units and was
considered by experts to measure important aspect of the physical environment and serve as a
reliable measure for differentiating better nursing units and assessing the overall environmental
quality (Sloane et al 2002) The results appear to justify the architectsrsquo design decisions that resulted
in two hallways of 10 residents sharing the large kitchen and the living-dining rooms Slaughter et al
Mapping Five Sites
15 of 47
(2006) devised another composite score the Composite Above Average Quality Score (CAAQS)
which they found to be more sensitive than the SCUEQS The CAAQS represents the percentage of
domains that were above average in quality It revealed a difference between the sites with 12-
capacity houses (857) and those with 20-capacity houses (786) that was not shown by the
SCUEQS but the difference was not significant
Behavioral Mapping
Reliability The number and category (staff family or resident) of persons observed at each location
was recorded on floor plans in successive behavior scans one hour apart over the course of two
days Interobserver reliability of the scans was assessed at each site Cohenrsquos kappa a measure of
agreement between observers has a range from 0 no agreement to 100 total agreement Fleiss
(1981) characterized a kappa of 4 to 6 as fair 6 to 75 as good and over 75 as excellent There was
good agreement on average between two independent observers on the identification of behaviors
observed Kappa mean (SD) 0851 (04) and excellent agreement on identification of people being
scanned as residents staff family or others kappa mean (SD) 0732 (07)
Observations Fifteen observation periods or scans per day were conducted one per hour during
the two days of observation Examination of the within-site data revealed that the only differences
were day differences in specific scans related to the occurrence of special events eg barbecues
Consequently the data were collapsed across days A scan of about 10 minutes in duration was
required to count people in all public areas Observers minimized the possibility of counting the same
person in more than one room during a scan by following a preplanned path through the building and
working quickly Counts of sightings of staff family and volunteers and residents by hour in each
Mapping Five Sites
16 of 47
area of each site were summed over the two-day period of observation To assist the description of
the findings resident data were subsequently adjusted to show the mean percent of residents at a site
who were observed per scan per day and to show the percent of scans in which residents were
involved in a particular activity or seen in a particular room or area
Staff and Family Observations of staff and family are presented without data as these were
ancillary to the principal focus on residents Staff were seen most often in the house kitchens or
diningliving rooms across all sites except WDS At WDS staff were seen in the kitchens but
seldom in the diningliving rooms In all three sites with 12-capacity houses the central house was a
hub of staff activity with nearly twice as many staff seen in that kitchen (or an adjacent room which
was the dining room in MPN and MPW but was a hallway in WDS) as in the kitchens of the houses
on either side WDS staff were also seen in the seating area outside the great room nearly as much as
in the house kitchens Residents were seldom engaged in an activity when staff were not around eg
see Figure 6 for MPN This is not surprising because persons with Alzheimer disease lose their
ability to initiate activities (Colling 1999 Lee et al 2006) Others have shown that appropriate
environments are not sufficient residents with this disease need activities and all five sites employed
activity coordinators (Grant 1998 Van Haitsma Lawton amp Kleban 2000 Voelkl 2006)
Insert Figure 6 about here
Family members were at some sites as early as 830 am and as late as 930 pm although at
MPN all visits except one were in the afternoon ASB had a family meeting increasing the number
Mapping Five Sites
17 of 47
of sightings of family members to 42 (19 were associated with the meeting) The numbers of
sightings of family members over the two days of observation at other sites were WDS ndash 27 MPN ndash
23 and MDR and MPN ndash 12 each
Insert Tables 3 and 4 about here
Resident Locations Direct observation revealed a pattern of use that was unexpected and not
evident in TESS results Overall resident sightings were at least 25 higher at WDS than at the
other four sites (Table 3) The number of sightings in the common areas of WDS was over 60
greater than those at any other site (Table 3) Residents were most frequently seen in the area just
outside the great room (Table 4) By contrast at all other sites residents spent more time (60 of
sightings) in their houses (Table 4) ASB where residents spent 80 of their time in their houses
represented the extreme in this regard with the other sites being intermediate between ASB and WDS
(Table 4) Differences did not appear to align with whether the houses were of 20- or 12-capacity At
all sites residents were seen most frequently in the common areas outside of the houses with the
common hallways the great room and fireplace seating area accounting for decreasing numbers of
residents in that order (Table 4) however a stylist in the ASB beauty salon drew a crowd showing
how an occasional event can change behavior patterns At the sites with 12-capacity houses and
television rooms those rooms were popular and drew as many residents as the fireplace area
The large percent (396) of residents seen in common areas at WDS was attributable to
sightings in the common hallway and fireplace seating area next to the School House (Figure 5
Table 4) All residents could be gathered in the area which was slightly larger than the great room
Mapping Five Sites
18 of 47
observers noted a continuous round of activities involving groups of varying sizes No other site used
this area as intensely At WDS a day program brought in 8 additional residents and several staff who
ran activities that attracted some residents (discussions newspaper reading crafts) Observers were
asked not to count persons associated with the day program in their tally but the heavy use of the
central space and the day program activities presented there had some influence ASB and MDR also
had day programs that used separate spaces for that purpose so program participants were not seen
Chairs lining the walls in this area of WDS augmenting seating arrangements in front of and on
either side of the fireplace as well as oversized displays of small snapshots on several walls resulted
in an institutional appearance Local lore attributes the lineup of chairs to residents who initiated it
shortly after move-in Staff moved chairs back where the interior designers located them but
residents would pull them back across the corridor in a line until staff gave up
Site differences in the use of the great room were noteworthy ASB appeared to use it only
for church services on a regular basis with ldquoaudience-seatingrdquo left in place from day-to-day
Possibly this was because this great room was relatively distant from the houses (Figure 1) In WDS
MPN and MPW great room seating was rearranged throughout the day to accommodate numerous
events MPN and MPW used the great room like a town hall holding events such as afternoon teas
dances and musical entertainment At MDR small numbers of residents were in the great room
throughout the day but no large gatherings were seen
Within sites the sightings of residents in the houses were distributed fairly evenly across the
houses (Figures 1-5 Table 3) Residents were most often seen in the living-dining rooms and as
noted above staff were most often seen in the adjacent kitchens The exception was WDS where the
house design did not provide a good line of sight for staff between the kitchens and the living-dining
rooms (Figures 4 amp 5) Staff at all other sites could work in kitchens and keep an eye on residents
WDS staff actively encouraged residents to leave dining rooms after a meal and join activities in the
central area likely for two reasons because activities were not planned for the houses and because
Mapping Five Sites
19 of 47
staff working in the houses could not easily monitor a resident who remained in the house living-
dining room WDS staff were rarely seen in the housesrsquo living-dining rooms The School House the
centre house accounted for the majority of residents observed across all houses This kitchen
adjacent to the highly used area just outside the Great Room provided a relatively good monitoring
station for the house and activities in the common areas At WDS mealtimes two common areas
were used residents who needed substantial assistance with meals were often fed in the craft room
and a high-functioning group ate at the dining table alongside the fireplace seating
In the houses at other sites most sightings of residents were in the diningliving room areas
Fewer were in the kitchen and fewer still in the house hallways (Table 3) At MDR only one area
adjacent to the kitchen was devoted to dining and almost no residents were seen in kitchens The
same was not true at ASB where approximately the same proportions of residents were seen in the
shared kitchens as in each of the living-dining rooms on either side (Table 3 sums all four living-
dining rooms) However at ASB the numbers were likely from residents moving between the two
diningliving rooms and passing through the kitchens (Figure 1) because residents were rarely
engaged in the type of tasks encouraged at MPN and MPW (ie handling dishes setting tables etc
to encourage maintenance of their functional abilities Figure 7) Interestingly the highly similar sites
found different ways to use their spaces and different approaches to activities
ASB MPW and WDS held barbecues during the days of observation (Table 3) This meant
the residentsrsquo presence in the kitchen and dining areas was reduced at those meals Accordingly for
comparison across sites dining area sightings were adjusted by adding mealtime sightings in the
courtyards The peak periods for resident sightings were during the midday lunch (1130-1330) and
evening meals (1630-1830) (Table 5) Even so sightings of residents at mealtimes were only 66-
80 of occupancy indicating eight to ten residents were not seen at mealtimes in public areas at
most sites (Table 5) The exception was WDS where sightings indicated nearly all residents were
observed in public areas at mealtimes (Table 5) although WDS residents did not gather in the house
Mapping Five Sites
20 of 47
dining areas for the noon meal With most activities occurring in the core of the building WDS was
flexible about meal arrangements serving meals where residents were located such as the area
outside the great room on an activity room Residents were not required to return to their own houses
to eat They could join day program residents and eat in the common area or join residents in another
house One group of women was known for asking to eat together on their own in the common area
WDS also led other sites in the number of residents observed at other times of the day (Table 5) The
differences were especially marked in the afternoon between meals (1330-1630) and the period
after the evening meal (1830-2130) This suggests that WDS staff may have been viewing the
central areas like they would the central areas of a unit in a nursing home on dementia units staff
often prefer that residents stay in view and not return to their rooms
Resident Activity The observed activity patterns were surprising considering high levels of
resident inactivity reported for nursing home residents (Gottesman amp Bourestom 1974 Ice 2002)
Gottesman and Bourestomrsquos (1974) observations in 40 nursing homes revealed that residents spent
56 of their time during peak daylight hours engaged in no activity or passive activity In that study
residents were involved in personal care television and socializing for 43 of the time Ice (2002)
reprised the Gottesman and Bourestom study and found residents spent 65 of their time doing little
or nothing with only 12 in social activities (Ice 2002) In the present study observations of Just
Sitting and Watching were expected to measure levels of passive behaviors Residents in the five
sites appeared to be engaged in ADLs and Leisure for greater amounts of time than in Just Sitting
and Watching (although small amounts of napping as passive behavior were coded as
Miscellaneous) but this was not significant (Figure 7) Chi-square analysis using phi coefficients
found that residents at WDS engaged significantly less in ADLs than residents in other centres
(plt00001) residents at ASB MPN amp WDS were engaged less in leisure (plt005 each) ASB
Mapping Five Sites
21 of 47
residents were engaged less in Just Sitting (plt00005) and residents were observed Watching less at
MDR MPN amp MPW (plt00005 each) Leisure was the most frequently observed activity for MDR
MPN and MPW the second most frequent at ASB and the third at WDS Recreational activities
both planned and informal activities were considered to be Leisure thus watching TV or waiting to
be served at a coffee party were both coded as being Leisure (persons who were within the group and
actively attending to events but not actively engaged at the moment were coded as Leisure too and
this was distinguished from Watching which was defined as ldquoattending to activities or interactions of
others from a distance such as from a doorway watching a streetrdquo)
Insert Figure 7 about here
The ADLs were the second most frequently seen activity for MDR MPN and MPW and the
third for ASB but were seen much less at WDS The majority of ADLs across sites occurred at meal
times indicating they involved dining (ASB 570 MDR 590 MPN 758 MPW 736 but
WDS 422) The low percent of time spent by WDS residents on ADLs during the evening meal
time (42) agrees with the low number of sightings in the dining area at that time (385 of max)
It appears that WDS residents sat watched and walked but did not spend much time eating
(Figure 7) In contrast previous research at MPN and MPW has found mealtimes to be the longest
duration behavior Scans needed to be one hour apart to avoid seeing meals on two consecutive scans
and oversampling the behavior (Milke et al 2000)
Work that is tasks such as housekeeping and cooking were not seen at either of the sites
with 20-capacity houses but this is the only difference evident when compared with the 12-capacity
Mapping Five Sites
22 of 47
houses Compared to other sites MPN and MPW residents engaged in moderate proportions of all
behaviors (Figure 7) Residents at WDS spent proportionately less time on ADLs light
housekeeping and Leisure and more time at Walking Watching and Just Sitting Chi-square
analysis using phi coefficients showed that residents were observed Walking significantly less at
MDR (plt 005) residents at ASB and MDR engaged significantly less in Work and there were no
significant differences between sites in Miscellaneous activities (Figure 7)
Observersrsquo Notes
Some large differences were found in the care programs across sites Observersrsquo notes
indicated that at MPN and MPW residents were encouraged to be involved in the daily routine of the
facility and direct care staff ate meals with residents This strategy was said to stimulate conversation
and provide residents with a model for appropriate behavior Staff played the role of ldquomotherrdquo rising
to find an item in the kitchen and keeping an eye on food consumption Managers at MPN and MPW
considered this role an essential component of care At ASB MDR and WDS there was no evidence
of such a role
Most cooking was done in facility kitchens away from areas that residents could access This
tended to result in the house kitchens being treated more like institutional serveries Fridges mainly
contained large juice jugs and prepared snacks However at MPW and MPN when a resident opened
the fridge door the door was full of condiments and casseroles it looked just like home because of
an effort to keep institutional sized packages to a minimum These two sites used their kitchens quite
differently than the other three sites At MPN and MPW all breakfasts and snacks were prepared in
the houses each day by direct care staff On four weekdays lunches also were prepared Residents
were invited to participate in some of the chopping slicing and mixing which was considered an
essential component of the care program When meals were delivered from nearby facility kitchens
staff decanted items into family-size serving bowls They added condiments and poured drinks
Mapping Five Sites
23 of 47
serving the meals much like those prepared in-house Although residents helping with meal
preparation appeared to be limited to MPN and MPW staff records indicated additional forms of
daily and special occasion activities occurred at all sites Daily activities included easy tasks eg
folding laundry and exercises at all five sites discussion groups at MDR and WDS religious
activities at ASB MPN and MPW musicsinging at ASB MPW and WDS movies at ASB and
grooming at all sites except WDS
Outdoor courtyards were accessible to residents on the observation days at all sites The
barbecue meal at MPW drew the highest number of residents outside but from mid-morning until
early evening residents were seen on the patios or walkways This was true at every site except
MDR where few ventured outside (data not presented)
Disruptive behaviors were seen only at ASB where at 730 am 230 pm and 430 pm a
single resident was disruptive Whether this was the same or different resident is not known the
identity of persons was not recorded This accounted for only 03 of all behaviors seen at ASB (and
was not shown on Figure 7)
Discussion
The TESS-2+scale results clearly indicated that the pioneering WDS site and the four sites
modeled on it met best practice standards in many areas These include the ratings for global site
assessment overall configuration of self-contained living arrangements with adjacent common
spaces informal workspaces for staff and accessible outdoor green spaces walking paths and
maintenance More pertinent to the present study there were no significant differences between the
sites that had 12-capacity houses and those with 20-capacity houses on any TESS items the NIA
subscale of overall environmental quality (SCUEQS) or CAAQS the composite score devised by
Mapping Five Sites
24 of 47
Slaughter et al (2006) Sites with 20-capacity houses did not look substantially different from sites
with 12-capacity houses according to the scale
Behavioral Mapping
A principal finding from behavioral mapping was the amount of time residents were found
engaged in leisure activity at all five sites Leisure was the most frequently observed activity for
MDR MPN and MPW the second most frequent at ASB and the third at WDS The level of
participation in meaningful activities is considered an important measure of residentsrsquo quality of life
(Gonzalez-Salvador et al 2000 Zimmerman et al 2005) Although the extent of engagement is
typically measured in more focused and intensive ways the fact that observers saw residents who
were alert and watching an activity is meaningful because observers were asked to distinguish
whether the resident was ldquojust sittingrdquo or ldquowatchingrdquo if that was the extent of the involvement When
percentages of time spent in Leisure are combined with Activities of Daily Living following the lead
of Gottesman and Bourestom (1974) who combined personal care television and socializing the
results in this study are ASB 468 MDR 701 MPN 471 and MPW 483 All percentages
total are better than the 1974 studyrsquos 43 Only WDS with 261 was substantially worse and that
was largely because so little time was devoted to the evening meal Ice (2002) studying one site had
found only 12 of time spent in social activities however little time was spent Just Sitting or
Watching For the five sites in this study total percentages of these inactive behaviors are ASB
316 MDR 171 MPN 229 MPW 176 and WDS 402 which are all substantially
different than Gottesman and Bourestomrsquos finding of 56 of time engaged in no activity or passive
activity or the 65 seen by (Ice 2002)
Surprisingly the five sites differed in the percent of maximum possible number of sightings
of residents observed in public areas per scan per day ranging from 49 at MDR to 80 at WDS
This range of 38 difference between the lowest and highest sites is considerable The traditional
concern of staff is that residents who stay in their rooms miss out on socialization and planned
Mapping Five Sites
25 of 47
activities (Grade 1976 Hogden 1985) The public areas most frequented by WDS residents were the
fireplace area and the common hallway area At most sites if the residents were not observed in the
common areas it would be likely that they were in the house areas This was confirmed in the other
principal finding that the percent of maximum possible sightings in the house areas was lowest for
WDS at 25 and highest at ASB at 50 At ASB residents spent 80 of their time in their two
houses At WDS they were encouraged to spend their time in the common areas and they did The
houses were used very differently at the two sites and this may have been because the architects who
were very involved in both sites made it evident that they were intended to be used differently
However the use of communal spaces often has little to do with the intended purpose Lawton
(1970) reports that in 10 observational rounds of a facility a total of 13 people were observed in the
nine social rooms on the nine floors while 79 were counted in the main floor social room where
arrivals and departures could be observed Similarly areas around nursing stations and elevators
frequently draw residents (Lawton 1970 Lawton 1977 Snyder 1980)
A number of factors can be ruled out in the search for unique characteristics of WDS that
could have contributed to the above findings The first factor is the reliability of the observers It is
unlikely that the differences were due to variability in the observational skillsprocedures of the
observers because of the high level of agreement in the assessment of interobserver reliability and
because all observers followed the same protocol in collecting the data The observersrsquo reliability was
also attested to by the similarity of the data within sites across the two days of data collection The
second factor is the general floor plan WDS shared the same basic floor plan with MPN and MPW a
building footprint like the capital letter E So it is unlikely that the gross outer shape of the floor plan
was relevant The third more general factor is related to the inter-site comparability of the TESS-2+
data These data indicate that the five sites were remarkably similar in general and internal design
features WDS has ratings on all measures that were comparable to one or more of the other sites
Mapping Five Sites
26 of 47
including potentially relevant measures such as the presence of homelike features the degree of
interaction with staff and residentsrsquo involvement in activities
There are however a number of other factors that may be relevant to understanding the
WDS data WDS was the only site in which meals were served in the common areas as well as in the
house dining rooms Congruently as already noted the highest number of resident sightings at WDS
was in the common areas (fireplace and common hallway) and most of these common area sightings
were in the common areas of WDS adjacent to the central area of the three houses Importantly these
were the only common areas with a direct line of sight to the central hall and kitchen of the central
house (School House) Staff notes indicated that the number of meal servings from the central house
kitchen was twice as high as that of the kitchens of the other two houses at WDS Again there is
congruence resident sightings in the central house dining room although low relative to central
common areas were twice as high as in the dining rooms of the other two houses at WDS It is also
relevant that staff used all parts of the central common area for activity programming Thus it seems
probable that several factors including the internal floor plan meal service and activity
programming made the central common areas of WDS a multiuse area which resulted in high
number of resident sightings though out the day with peaks at meal times It is worth asking whether
WDS staff would have used the central common area so intensely if the house kitchens had been
aligned with the dining rooms providing staff with oversight as in MPN and MPW
These observations could also explain another WDS anomaly that is the low number
of residents seen to be engaged in ADL activities at meal times compared to other sites If the
lower-functioning residents at WDS engaged in other activities in the central common areas
perhaps abandoning a meal to walk or sit elsewhere that could result in fewer observations
of eating during the mealtime Conversely it could mean that it would be more likely that
Mapping Five Sites
27 of 47
other activities (ie watching walking sitting and leisure activities) would be seen during
meal times which was the case in WDS
Finally the unique features of the WDS resident sighting data may have been related to the
greater degree of dementia (lower than average MMSE scores) of WDS residents The average
MMSE scores at other sites were 50 to 100 higher indicating less severe symptoms than the
average WDS score Congruently WDS had relatively high levels of sightings of sitting watching
and walking behavior and the highest number of pacing incidents Thus it is possible that the
differences in degree of dementia between sites and the related differences in levels of ambulation
made it more likely that WDS residents would leave their rooms and therefore WDS residents would
be sighted most frequently in the common areas of the WDS facility
It is important to note that no substantial differences were found between the 20-capacity
and 12-capacity houses that is in the mean domain scores of the TESS which was used to describe
environmental characteristics Scores were much the same across the five sites The TESS has goals
and domains aligned with the general site design which are more architecturally based and those
best aligned with interior design site operations and providing care
The architects might have thought their design at ASB and MDR would result in a small care
group of 10 and that residents along each bedroom hall would form a household but this did not
happen The residents in the 20-capacity houses did not form a 20-resident cluster either instead they
formed small groups for eating and activities Therefore other factors such as early or late rising or
naturally-formed friendships may be a greater influence than bedroom proximity The addition of
eight more residents per house might be anticipated to lead to crowding in the housesrsquo living-dining
areas or some other notable difference However crowding was not evident in the 20-capacity
houses In fact WDS gatherings in the common areas were more apt to be viewed as crowds
Mapping Five Sites
28 of 47
Observations indicated there that Disruptive Behavior often attributed to crowding was rare It
occurred in only one site and therefore could not be associated with a particular design
These observational results combined with the TESS results have broad implications for
future studies The first implication is methodological and the second is empirical Methodologically
the combination of architectural and behavioral measures in studies of facilities for the elderly
highlights the advantages over methodologies that employ only behavioral measures eg Dementia
Care Mapping (Brooker 2005 Fulton Edelman amp Kuhn 2006 Sloane Brooker Cohen et al
2007) and over studies that rely on client interviews (Kane 2003) Empirically 20 residents in a
house is approaching the size of dementia units in some nursing homes The present study revealed
that the main difference seen in the operation of the 12-resident house and the 20-resident house
design was that the latter appeared to hold more activities within the house raising questions about
the value and need for those common spaces whereas the former made more use of the common
spaces for activities In this way behavior was affected by the house design and by the way that staff
chose to organize activities
Mapping Five Sites
29 of 47
References
Benson D M Cameron D Humbach E Servino L amp Gambert S R (1987) Establishment and
impact of a dementia unit within the nursing home Journal of the American Geriatrics Society
35 319-323
Brawley E C (1997) Designing for Alzheimerrsquos disease Strategies for creating better care
environments New York Wiley
Brooker D (2005) Dementia Care Mapping A review of the research literature The Gerontologist
45 Special Issue I 11ndash18
Calkins M P Meehan R A amp Lipstreuer E (1999) Creekview Its history and evaluation
Kirtland OH IDEAS Inc
Colling K B (1999) Passive behaviors in Alzheimer disease A descriptive analysis American
Journal of Alzheimers Disease and Other Dementias 14 27-40
Cronin-Golumb A (1995) Vision in Alzheimerrsquos disease The Gerontologist 35 370-376
Day K Carreon D amp Stump C (2000) The therapeutic design of environments for people with
dementia A review of the empirical research The Gerontologist 40 397-416
Deely B Klingensmith L amp Silverman M (1995) Developing a residential Alzheimers facility
Focus on Geriatric Care and Rehabilitation 8(7) 1-8
DiMotta S Dubney B M Hoglund J D amp Kershner C (1993) Long-term care design Blazing
new territory - code reform and beyond Journal of Healthcare Design 5 197-203
DiMotta S amp Hoglund J D (2000) Woodside Place A residential care model for the Alzheimerrsquos
and dementia resident Symposium on Healthcare Design Anaheim CA Center for Healthcare
Design
Mapping Five Sites
30 of 47
Doty M M Koren M J amp Sturla E L (2008) Culture change in nursing homes How far have
we come Findings from The Commonwealth Fund 2007 National Survey of Nursing Homes
New York The Commonwealth Fund
Edelman P Fulton B R Kuhn D amp Chang C H (2005) A comparison of three methods of
measuring dementia-specific quality of life Perspectives of residents staff and observers The
Gerontologist 45 27-36
Fleiss J L (1981) Statistical methods for rates and proportions (2nd ed) New York John Wiley amp
Son
Folstein M F Folstein S E amp McHugh P R (1975) Mini-Mental State a practical method for
grading the cognitive state of patients for the clinician Journal of Geriatric Research 12 189-
198
Fulton B R Edelman P amp Kuhn D (2006) Streamlined models of dementia care mapping
Aging amp Mental Health 10 343-351
Gold D T (1991) A descriptive typology of dementia units In P D Sloane amp L J Mathew (Eds)
Dementia units in long-term care (pp 50-61) Baltimore Johns Hopkins University Press
Gonzalez-Salvador T Lyketsos C G Baker A Hovanec L Roques C Brandt J et al (2000)
Quality of Life in dementia patients in long-term care International Journal of Geriatric
Psychiatry 15 181-189
Gottesman L E amp Bourestom N C (1974) Why nursing homes do what they do The
Gerontologist 14 501-506
Grade B L (1976) A study of the entry crisis to a nursing home Unpublished masterrsquos thesis
University of Wisconsin Milwaukee
Grant L A (1998) Beyond the dichotomy An empirical typology of Alzheimerrsquos care in nursing
homes Research on Aging 20 569-592
Mapping Five Sites
31 of 47
Greene J A Asp J amp Crane N (1985) Specialized management of the Alzheimerrsquos disease
patient Does it make a difference A preliminary progress report Journal of the Tennessee
Medical Association 78 559-563
Harper G J (1998) Stress and adaptation among elders in life care communities Unpublished
doctoral dissertation Ohio State University Columbus
Hogden K M (1985) Leisurerecreation needs of hospitalized elderly A task force report
Activities Adaptation amp Aging 7 53-65
Hoglund D J amp Ledewitz S D (1999) Designing to meet the needs of people with Alzheimerrsquos
disease In B Schwarz amp R Brent (Eds) Aging autonomy and architecture Advances in
assisted living (pp 229-261) Baltimore John Hopkins University Press
Ice G H (2002) Daily life in a nursing home has it changed in 25 years Journal of Aging Studies
16 345-359
Imamoğlu Ccedil (2007) Assisted living as a new place schema A comparison with homes and nursing
homes Environment and Behavior 39 246-268
Innes A amp Surr C (2001) Measuring the well-being of people with dementia living in formal care
settings The use of Dementia Care Mapping Aging and Mental Health 5 258-268
Kane R A (2003) Definition measurement and correlates of quality of life in nursing homes
Toward a reasonable practice research and policy agenda The Gerontologist 43 Special
Issue II 28ndash36
Kuhn D Kasayka R E amp Lechner C (2002) Behavioral observations and quality life among
persons with dementia in 10 assisted living facilities American Journal of Alzheimerrsquos Disease
and Other Dementias 17 291-298
Lawton M P (1970) Ecology and aging In L A Pastaland amp D H Carson (Eds) The spatial
behavior of older people (pp 41-67) Ann Arbor MI University of Michigan Press
Mapping Five Sites
32 of 47
Lawton M P (1977) The impact of the environment on aging and behavior In K W Schaie (Ed)
Handbook of the Psychology of Aging (pp 276-301) New York Van Nostrand Reinhold
Lawton M P Weisman G D Sloane P amp Calkins M (1997) Assessing environments for older
people with chronic illness Journal of Mental Health and Aging 3 83-100
Lawton M P Weisman G D Sloane P Norris-Baker C Calkins M amp Zimmerman S I
(2000) Professional Environmental Assessment Procedure for special care units for elders with
dementing illness and its relationship to the Therapeutic Environment Screening Schedule
Alzheimer Disease and Associated Disorders 14 28ndash38
Lee M Madden V Mason K Rice S Wyburd J amp Hobson S (2006) Occupational
engagement and adaptation in adults with dementia A preliminary investigation Physical and
Occupational Therapy in Geriatrics 25 63-81
Lehrner P N (1979) Handbook of ethological methods New York Garland STMP
Margulis S T (2003) Privacy as a social issue and behavioral concept Journal of Social Issues 59
243-261
Martin P amp Bateson P (1987) Measuring behaviour An introductory guide New York
Cambridge University Press
Mathew L J amp Sloane P D (1991) Organizing and staffing dementia units In P D Sloane amp L
J Mathew (Eds) Dementia units in long-term care (pp 101-127) Baltimore Johns Hopkins
University Press
McAllister C L amp Silverman M A (1999) Community formation and community roles among
persons with Alzheimerrsquos disease A comparative study of experience in a residential
Alzheimerrsquos facility and a traditional nursing home Qualitative Health Research 9 65-85
McCracken A L amp Fitzwater E (1989) The right environment for Alzheimerrsquos Geriatric
Nursing 10 293-294
Mapping Five Sites
33 of 47
Milke D L (2003) Iterative post-occupancy evaluations of the McConnell Place North design
[Abstract] Proceedings of the 56th Annual Scientific Meeting of the Gerontological Society of
America 43 48 San Diego CA
Milke D L Clark C amp Bucknell M (2000) Assessing the adequacy of residential lighting in two
care centres for persons with Alzheimerrsquos Disease using the new age-adjusted North American
illumination recommendations (Research Report) Ottawa Ontario Canada Canada Mortgage
and Housing Corporation
National Institute on Aging Coordinating Center (1993) NIA collaborative studies special care units
for Alzheimers disease Manual of procedures Davis CA Northern California Alzheimers
Disease Center University of California
Rabig J Thomas W Kane R A Cutler L J amp McAlilly S (2006) Radical redesign of nursing
homes Applying the Green House concept in Tupelo Mississippi The Gerontologist 46 533-
539
Rule B G Milke D L amp Dobbs A R (1992) Design of institutions Cognitive functioning and
social interactions of the aged resident Journal of Applied Gerontology 11 475-488
Saxton J Silverman M Ricci E Keane C amp Deely B (1998) Maintenance of mobility in
residents of an Alzheimer special care facility International Psychogeriatrics 10 213-224
Schwarz B Chaudhury H amp Tofle R B (2004) Effect of design interventions on a dementia care
setting American Journal of Alzheimers Disease and Other Dementias 19 172-176
Silverman M Ricci E Saxton J Ledewitz S McAllister C amp Keane C (1995) Woodside
Place The first three years of a residential Alzheimerrsquos facility (Vols 1-2) Oakmont PA
Presbyterian Senior Care
Skea D amp Lindesay J (1996) An evaluation of two models of long-term residential care for
elderly people with dementia International Journal of Geriatric Psychiatry 11 233-241
Mapping Five Sites
34 of 47
Slaughter S Calkins M Eliasziw M amp Reimer M (2006) Measuring physical and social
environments in nursing homes for people with middle- to late-stage dementia Journal of the
American Geriatrics Society 54 1436-1441
Sloane P D Brooker D Cohen L Douglass C Edelman P Fulton B R et al (2007)
Dementia Care Mapping as a research tool International Journal of Geriatric Psychiatry 22
580-589
Sloane P D Mitchell M Priesser J S Phillips C Commander C amp Burker E (1998)
Environmental correlates of resident agitation in Alzheimerrsquos disease special care units Journal
of the American Geriatric Society 46 862ndash869
Sloane P D Mitchell C M Weisman G Zimmerman S Foley K M L Lynn M et al
(2002) The Therapeutic Environment Screening Survey for Nursing Homes (TESS-NH) An
observational instrument for assessing the physical environment of institutional settings for
persons with dementia Journals of Gerontology Series B Psychological Sciences and Social
Sciences 57B(Suppl 2) S69-S78
Sloane P D Zimmerman S Williams C S Reed P S Gill KS amp Preisser J S (2005)
Evaluating the quality of life of long-term care residents with dementia The Gerontologist 45
37-49
Snyder L G (1980) An exploratory study of patterns of social interaction organization and facility
design in three nursing homes In J Hendricks (Ed) Institutionalization and Alternative Futures
(pp 68-80) Farmingdale NY Baywood Pub Co
Sommer R amp Sommer B B (1986) A practical guide to behavioral research Tools and
techniques (2nd ed) New York Oxford
Van Haitsma K Lawton M P amp Kleban M H (2000) Does segregation help or hinder
Examining the role of heterogeneity in behavioral and emotional aspects of quality of life for
Mapping Five Sites
35 of 47
persons with cognitive impairment in the nursing home Research and Practice in Alzheimerrsquos
Disease 4 163-177
Verbeek H van Rossum E Zwakhalen S M G Kempen G I J M amp Hamers J P H (2009)
Small homelike care environments for older people with dementia A literature review
International Psychogeriatrics 21 252-264
Voelkl J E (2006) Therapeutic environments in nursing homes Fostering residents meaningful
activity engagement Activities Directors Quarterly for Alzheimers and Other Dementia
Patients 7(3) 35-44
Warren S (Ed) (1998) Innovative dementia care McConnell Place North evaluation (Research
Report) Edmonton Alberta Canada Evaluating Programs of Innovative Continuing Care
Zeisel J (1998) The Hearthstone health environments case study Journal of Healthcare Design
Proceedings from the Symposium on Healthcare Design San Francisco CA National
Symposium on Healthcare Design Inc
Zeisel J Hyde J amp Levkoff S (1994) Best practices An environment-behavior (E-B) model for
Alzheimer special care units American Journal of Alzheimerrsquos Care and Related Disorders and
Research and Care 9(2) 4-21
Zimmerman S Sloane P D Williams C S Reed P S Preisser J S Eckert J K et al (2005)
Dementia care and quality of life in assisted living and nursing homes The Gerontologist 45
133-146
Mapping Five Sites
36 of 47
Table 1 Comparison of Architectural Features Across Five Sites
Feature ASB MDR MPN MPW WDS
Total facility square footage 23040 sq ft 27308 sq fta 24750 sq ft 23864 sq ft 21540 sq ft
Size of administration area (offices conference reception etc but not service or employee spaces)
960 sq ft (No entry hall)
1584 sq ft day program offices and program space
1675 sq ft 1629 sq ft 972 sq ft (No entry hall)
Staff (lunch) room 16rsquo x 18rsquo 6rsquo11rdquo x 6rsquo2rdquo 158rsquo x 16rsquo 138rsquo x 16rsquo 95rsquo x 30rsquo (plus)b
Treatment or examination room
No Yes In daycare area
No No Yes In central
areac
Medications storage Central medication cart
Medication room Medication room per house
Medication room per house
Central medication cart
Location of meal preparation
Facility kitchen in administration area
Facility kitchen in administration area
Adjacent nursing home (see house kitchen)
Adjacent nursing home (see house kitchen)
Facility kitchen in administration area
Use of house kitchen Servery snacks Servery snacks Meal preparation for all breakfasts and some lunches servery
Meal preparation for all breakfasts and some lunches servery
Servery snacks
Family dining room or central country kitchen usage
Small group activities family functions by reservation
Small group activities family functions by reservation
Small group meetings Great Room party food preparation family functions by reservation
Small group meetings Great Room party food preparation family functions by reservation
Small group activities family functions by reservation
Houses and capacity 2 20 2 20 3 12 3 12 3 12
Private tubroom Two off the central hallway
Two off the central hallway
One located in each house
One located in each house
None
Private shower areas One per 10 residents located in each wing of each house
One per 10 residents located in each wing of each house
One per resident located in each resident room with the one shared bedroom having a shared shower
One per resident located in each resident room with the one shared bedroom having a shared shower
One per 12 residents located in each house
Resident room doors Split door Split door Split door Regular Split door
Inventory of public rooms and seating capacity (includes all alcoves that can be used for seating and seating areas near exits)
15 165
17 176
15 232
13 219
14 182
Variety and appearance of outdoor Area
2 small (little greenery) 1 medium (mixed hardgreen surfaces) and a large courtyardmdashvery appealing
2 small (much greenery) 1 medium (mixed hardgreen surfaces) 2 large courtyards (1 mixed hardgreen surfaces 1 green) mdash very appealing
3 small (much greenery) 1 large (mostly green courtyard mdash very appealing
3 small (much greenery) and 1 large (mostly green courtyard mdash very appealing
1 small (much greenery) 1 medium (mostly green) and 1 large (mostly green) courtyard mdash very appealing
a Does not include researchteaching wing Total for entire floor space is 40382 sq ft b Room at WDS was not intended as a lounge ie a retreat from work to professionalize the care staff role it was to serve as a place to read and discuss work At other
sites the lunch room also served as a lounge c Room was intended as a multi-purpose room
Mapping Five Sites
37 of 47
Table 2 Therapeutic Environment Screening Scale Items for Goal and Domain Possible Range
Midpoint and Mean in Each Group
Therapeutic Goal and Domain
Item Numbers Range Mid-point ASB amp MDR
20-Capacity Houses MPN MPW amp WDS
12-Capacity Houses
ASB MDR Site Scores
Mean MPN MPW WDS Site Scores
Mean
Safetysecurityhealth
Exit control 2a 2b 2c 2d 2e 2g
2h 3a 3b 0-11 55 2 1 15 1 2 2 17
Maintenance 7b1Dagger 7b2Dagger 7b3Dagger 7b4Dagger 0-8 40 8 8 80 8 8 80
Cleanliness 7a1Dagger 7a2Dagger 7a3 7a4 0-8 40 8 8 80 7 8 8 77
Lack of odorsℓ 9aDagger 9bDagger 0-4 20 4 3 35 4 4 4 40
Safetyℓ 7c1 7c2Dagger 7c3 7c4 8 0-10 60 10 10 100 10 10 10 100
Orientationcuing 19 20ф 27a 27bcDagger
27d 27e 27f 28 29 0-17 85 1212 120 11 9 12 107
Privacycontrol
Privacy 30a 30b 30c 30d 0-4 20 0 0 0 1 2 0 10
Functional ability 16 17a 17b 18Dagger 0-7 35 7 7 70 7 7 7 70
Stimulation
Lighting 21 22a 22bDagger 22cDagger
23a 23b 23c 0-14 70 13 13 130 11 14 13 127
Tactilevisual
stimulation 34 35Dagger 37b 0-16 80 10 6 80 15 14 11 133
Quietness 24a 24b 24c 24d
24eDagger 24f 24g 25 26 0-25 125 21 21 210 19 20 23 207
Physical attractiveness
4a1 4a2 4b1 4b2
4c1 4c2 4d1 4d2 37c 0-34 140 16 15 155 15 16 16 157
Socialization
Homelike
environment 15Dagger 31Dagger 32 0-9 45 9 9 90 9 9 9 90
Resident
appearance 36Dagger
0-2 10 2 2 20 2 2 20
SCUEQS 0-41 - 41 39 40 39 4141 40
CAAQS sect 0-100 - 786 857
Large means represent better physical environment
Dagger Items used to compute the 18-item Special Care Environmental Quality Scale (SCUEQS) 27b and 27c were treated as a single item and item 15 was
misnumbered in the TESS-2+ Revised version (as item 13) ф Item 20 is the percentage of common rooms with signsgraphics floor plans in all sites allowed a view into common rooms (scored as zero) ℓ An item was unintentionally omitted from the TESS-2+ scoring form (10 in Odors and 11 in Safety) sect Composite Above Average Quality Score (CAAQS) represents the percentage of TESS-2+ domains that were above average in quality
Mapping Five Sites
38 of 47
Table 3 Percent of Resident Population Who Were Observed During Behavior Scans
at Each Site in Particular Areasa
AreaSite 20-Capacity Houses 12-Capacity Houses
ASB MDR MPN MPW WDS
Total Areas 608 493 511 564 803
Total Common Areas 62 158 169 200 511
Total Outdoor Areas 46 02 11 56 38
Total House Areas 500 333 331 311 254
House 1 259 168 115 69 62
House 2 241 165 108 128 123
House 3 108 114 69
House Kitchen 149 08 75 53 49
House LivingDining Room 324 278 236 232 200 a Resident data were adjusted to show the mean percent of residents at a site who were observed per scan per day Note Total Areas is the sum of the following Total Common Total Outdoor and Total House Total House Areas is the sum of Houses 1 House 2 and House 3 House Kitchen and LivingDining Rooms are summed across houses Blank cells indicate that the question was not applicable
Mapping Five Sites
39 of 47
Table 4 Percent of Resident Population Who Were Observed During Behavior Scans
at Each Site in Particular Common Areasa
Location 20-Capacity Houses 12-Capacity Houses ASB MDR MPN MPW WDS
Great Room 07 75 94 91 64
Fireplace Seating Area 22 69 43 13 106
ActivityCraft Room 04 47 00 02 10
TV Room ndash ndash 43 64 58
Other TV Area ndash ndash 11 39 ndash
Common Area Hallway Seating 37 108 138 143 396
Music Room ndash ndash 00 ndash 00
Garden Room ndash ndash 00 ndash 04
Beauty Salon 39 12 00 00 00
Family Dining RoomCountry Kitchen 00 09 00 00 00
Total 109 320 329 352 638 a Resident data were adjusted to show the mean percent of residents at a site who were observed per scan per day Note Dashes indicate that residents were not observed in these areas
Mapping Five Sites
40 of 47
Table 5 Percent of Resident Population Who Were Observed During Behavior Scans
at Each Site at Particular Times of Day
Time of Day 20-Capacity Houses 12-Capacity Houses
ASB MDR MPN MPW WDS
Before Lunch 541 360 386 475 654
Lunch 805 663 667 722 1000
Between Meals 657 530 506 589 963
Supper 765 738 744 744 922
After Supper 50 390 447 469 740 a Resident data were adjusted to show the mean percent of residents at a site who were observed per scan per day Note Before Lunch (4 scans-730-1030) Lunch (2 scans-1130 amp 1230) Between Meals (3 scans-1330 to 1530) Supper (2 scans-1630 amp 1730) After Supper (4 scans-1830 to 2130)
Mapping Five Sites
41 of 47
Figure 1 Floor plan of Asbury Place Mt Lebanon PA
Mapping Five Sites
42 of 47
Figure 2 Floor plan of Marjorie Doyle Rockwell Center Cohoes NY
Mapping Five Sites
43 of 47
Figure 3 Floor plan of McConnell Place North Edmonton AB
Mapping Five Sites
44 of 47
Figure 4 Floor plan of McConnell Place West Edmonton AB
Mapping Five Sites
45 of 47
Figure 5 Floor plan of Woodside Place Oakmont PA
Mapping Five Sites
46 of 47
Figure 6
McConnell Place Northordf Residentsrsquo Activities When Alone and in the Presence of Staff
ordf The average MMSE score was 153 at MPN higher than the average across sites 132 + 15 (M+SE) MPN residents appeared not to initiate activities when alone
0
5
10
15
20
25
30
35
40
Alone Day 1 With Staff Day 1 Alone Day 2 With Staff Day 2
Nu
mb
er R
esid
ents
Arts amp Crafts
Chores
CookingBaking
Eating
Exercising
Games
Grooming
Lg Activity Grp
Music Event
Reading
Sm Interaction
Walking
Watching
Watching TV
Other
Mapping Five Sites
47 of 47
Figure 7
Percent of Scans in Which Residents at Each Site Engaged in Particular Behaviors
0
10
20
30
40
50
60
70
80
90
100
ASB MDR MPN MPW WDS
Misc
Just Sit
Watch
Walk
Leisure
Work
ADLs

Mapping Five Sites
12 of 47
Therapeutic Environment Screening Scale
Environmental characteristics were described using the 38-item Therapeutic Environment
Screening Scale (TESS-2+) Designees at each site filled out the form after training by one of the
authors of the study who was experienced in using the scale Interrater agreement was assured by
comparing interpretations and ratings consensus was reached on any issues related to scoring
Interrater reliability for TESS-2+ items had ranged from 67 to 100 agreement (Sloane et al
1998) There were no significant differences in the mean domain scores between the sites that had
12-capacity houses and those with 20-capacity houses (Table 2) The findings are presented by
grouping the items into two types of goals and domains those associated with the general site design
that may be more architecturally based and those more aligned with interior design site operations
and providing care
Insert Table 2 about here
General Design The scores related to the therapeutic goals and domains for building design
were similar across sites reflecting the implementation of the basic Woodside building model
(Table 2 Exit control Orientation and cuing Privacy and Functional ability Physical
attractiveness) All sites in this study had strategies for exit control (Table 2 2andash2h) WDS had both
alarms and keypad-locks on external exits while the other sites had keypad-locks MPN and MPW
had a reception desk at the front entrance as a clerk-observation post At ASB and MPW the external
exits were partially disguised at the other sites they were not (Table 2 3a 3b)
Mapping Five Sites
13 of 47
Orientation and cuing is related to residentsrsquo personal safety and self-awareness thus the
photos and names beside the bedrooms doorways which all sites used are important (Table 2 27
28 29) as in the ldquotip of the tongue phenomenonrdquo they need a cue to retrieve the memory (Zeisel
1998) An open interior plan that allows residents to see into public rooms is an optimal way finding
strategy for persons with dementia all sites employed this The strategic location of cues and
personal items can also aid way finding Although institutional-style directional signage is eschewed
on restroom doors for example both graphics and labels are advised Open floor plans often require
few signs MDR had the most signs and MPW used the fewest graphics and signs with other sites
having intermediate numbers (Table 2 19 20) Large windows that provide natural exterior views
(Table 2 4) are not only attractive they are another tactic that serves way finding and also provides
seasonal orientation in the latitudes of these five sites The entrances of residentsrsquo bedrooms were
personalized at all sites (Table 2 27 28 29) Redundancy is recommended and a greater variety of
items were used at ASB MDR WDS and MPN than at MPW for this purpose
All five sites scored well on supporting functional ability (Table 2 16 17 18) that is either
slowing decline or stimulating improvement which is something for which sites designed for
dementia have been associated (Benson Cameron Humback Servino amp Gambert 1987 Greene
Asp amp Crane 1985 Innes amp Surr 2001 McCracken amp Fitzwater 1989 Rabig Thomas Kane
Cutler amp McAlilly 2006 Rule Milke Dobbs 1992 Silverman et al 1995 Skea amp Lindesay 1996
Warren 1998)
Interior Design and Approach to Care The first goal of this type is safety security and
health with domains (besides exit control discussed above) of Maintenance Cleanliness Lack of
odors and Safety (of floors) A second goal is Stimulation and a third is Socialization Slaughter et
al (2006) viewed these as basic requirements and found no significant differences in these goals
when comparing the 6 special care facilities (bungalows) with the 45 units in traditional institutional
facilities so it is not surprising that the same was true for these highly similar sites
Mapping Five Sites
14 of 47
Stimulation domains include Lighting Tactile and Visual stimulation as well as Quietness
Both sensory deprivation and over-stimulation are viewed as problems (Brawley 1997 Day
Carreon amp Stump 2000 Cronin-Golumb 1995) According to Zeisel Hyde amp Levkoff (1994)
appropriate levels of stimulation results from having a site with a high sensory comprehension
ranking so not necessarily the overall calmest setting but rather one with a moderate amount of
sensory input that residents can understand Ambient lighting was considered good in all sites with
minimal glare from a number of reflecting surfaces such as picture windows and French doors (Table
2 21) Lighting was evenly distributed and levels were considered ample (Table 2 22 23) with the
exception of MPN Ambient auditory noise was not deemed a problem whether considering type or
level of noise (Table 2 24 25) The general availability of things to touch in common areas such as
those that invite handling or folding was somewhat less at ASB and MDR than at other sites
Overall ratings of home likeness and the individuality of residentsrsquo appearance were
consistently good but the general atmosphere influenced by residentsrsquo lower overall levels of
participation in activities and a less positive rating for staff interactions with residents resulted in
MDR scoring lower that other sites (Table 2 15 31 32 36) WDS scored in the mid-range on
residentsrsquo involvement but as indicated above its residents had much lower MMSE scores At all
sites personal pictures or mementos were in most residentsrsquo bedrooms However such items were
not present in common rooms at MDR
The mean SCUEQS scores (Table 2) which summarized a subset of the TESS-2+ items
were not significantly different between the sites that had 12-capacity houses and those with 20-
capacity houses The SCUEQS had been derived for the NIA studies of special care units and was
considered by experts to measure important aspect of the physical environment and serve as a
reliable measure for differentiating better nursing units and assessing the overall environmental
quality (Sloane et al 2002) The results appear to justify the architectsrsquo design decisions that resulted
in two hallways of 10 residents sharing the large kitchen and the living-dining rooms Slaughter et al
Mapping Five Sites
15 of 47
(2006) devised another composite score the Composite Above Average Quality Score (CAAQS)
which they found to be more sensitive than the SCUEQS The CAAQS represents the percentage of
domains that were above average in quality It revealed a difference between the sites with 12-
capacity houses (857) and those with 20-capacity houses (786) that was not shown by the
SCUEQS but the difference was not significant
Behavioral Mapping
Reliability The number and category (staff family or resident) of persons observed at each location
was recorded on floor plans in successive behavior scans one hour apart over the course of two
days Interobserver reliability of the scans was assessed at each site Cohenrsquos kappa a measure of
agreement between observers has a range from 0 no agreement to 100 total agreement Fleiss
(1981) characterized a kappa of 4 to 6 as fair 6 to 75 as good and over 75 as excellent There was
good agreement on average between two independent observers on the identification of behaviors
observed Kappa mean (SD) 0851 (04) and excellent agreement on identification of people being
scanned as residents staff family or others kappa mean (SD) 0732 (07)
Observations Fifteen observation periods or scans per day were conducted one per hour during
the two days of observation Examination of the within-site data revealed that the only differences
were day differences in specific scans related to the occurrence of special events eg barbecues
Consequently the data were collapsed across days A scan of about 10 minutes in duration was
required to count people in all public areas Observers minimized the possibility of counting the same
person in more than one room during a scan by following a preplanned path through the building and
working quickly Counts of sightings of staff family and volunteers and residents by hour in each
Mapping Five Sites
16 of 47
area of each site were summed over the two-day period of observation To assist the description of
the findings resident data were subsequently adjusted to show the mean percent of residents at a site
who were observed per scan per day and to show the percent of scans in which residents were
involved in a particular activity or seen in a particular room or area
Staff and Family Observations of staff and family are presented without data as these were
ancillary to the principal focus on residents Staff were seen most often in the house kitchens or
diningliving rooms across all sites except WDS At WDS staff were seen in the kitchens but
seldom in the diningliving rooms In all three sites with 12-capacity houses the central house was a
hub of staff activity with nearly twice as many staff seen in that kitchen (or an adjacent room which
was the dining room in MPN and MPW but was a hallway in WDS) as in the kitchens of the houses
on either side WDS staff were also seen in the seating area outside the great room nearly as much as
in the house kitchens Residents were seldom engaged in an activity when staff were not around eg
see Figure 6 for MPN This is not surprising because persons with Alzheimer disease lose their
ability to initiate activities (Colling 1999 Lee et al 2006) Others have shown that appropriate
environments are not sufficient residents with this disease need activities and all five sites employed
activity coordinators (Grant 1998 Van Haitsma Lawton amp Kleban 2000 Voelkl 2006)
Insert Figure 6 about here
Family members were at some sites as early as 830 am and as late as 930 pm although at
MPN all visits except one were in the afternoon ASB had a family meeting increasing the number
Mapping Five Sites
17 of 47
of sightings of family members to 42 (19 were associated with the meeting) The numbers of
sightings of family members over the two days of observation at other sites were WDS ndash 27 MPN ndash
23 and MDR and MPN ndash 12 each
Insert Tables 3 and 4 about here
Resident Locations Direct observation revealed a pattern of use that was unexpected and not
evident in TESS results Overall resident sightings were at least 25 higher at WDS than at the
other four sites (Table 3) The number of sightings in the common areas of WDS was over 60
greater than those at any other site (Table 3) Residents were most frequently seen in the area just
outside the great room (Table 4) By contrast at all other sites residents spent more time (60 of
sightings) in their houses (Table 4) ASB where residents spent 80 of their time in their houses
represented the extreme in this regard with the other sites being intermediate between ASB and WDS
(Table 4) Differences did not appear to align with whether the houses were of 20- or 12-capacity At
all sites residents were seen most frequently in the common areas outside of the houses with the
common hallways the great room and fireplace seating area accounting for decreasing numbers of
residents in that order (Table 4) however a stylist in the ASB beauty salon drew a crowd showing
how an occasional event can change behavior patterns At the sites with 12-capacity houses and
television rooms those rooms were popular and drew as many residents as the fireplace area
The large percent (396) of residents seen in common areas at WDS was attributable to
sightings in the common hallway and fireplace seating area next to the School House (Figure 5
Table 4) All residents could be gathered in the area which was slightly larger than the great room
Mapping Five Sites
18 of 47
observers noted a continuous round of activities involving groups of varying sizes No other site used
this area as intensely At WDS a day program brought in 8 additional residents and several staff who
ran activities that attracted some residents (discussions newspaper reading crafts) Observers were
asked not to count persons associated with the day program in their tally but the heavy use of the
central space and the day program activities presented there had some influence ASB and MDR also
had day programs that used separate spaces for that purpose so program participants were not seen
Chairs lining the walls in this area of WDS augmenting seating arrangements in front of and on
either side of the fireplace as well as oversized displays of small snapshots on several walls resulted
in an institutional appearance Local lore attributes the lineup of chairs to residents who initiated it
shortly after move-in Staff moved chairs back where the interior designers located them but
residents would pull them back across the corridor in a line until staff gave up
Site differences in the use of the great room were noteworthy ASB appeared to use it only
for church services on a regular basis with ldquoaudience-seatingrdquo left in place from day-to-day
Possibly this was because this great room was relatively distant from the houses (Figure 1) In WDS
MPN and MPW great room seating was rearranged throughout the day to accommodate numerous
events MPN and MPW used the great room like a town hall holding events such as afternoon teas
dances and musical entertainment At MDR small numbers of residents were in the great room
throughout the day but no large gatherings were seen
Within sites the sightings of residents in the houses were distributed fairly evenly across the
houses (Figures 1-5 Table 3) Residents were most often seen in the living-dining rooms and as
noted above staff were most often seen in the adjacent kitchens The exception was WDS where the
house design did not provide a good line of sight for staff between the kitchens and the living-dining
rooms (Figures 4 amp 5) Staff at all other sites could work in kitchens and keep an eye on residents
WDS staff actively encouraged residents to leave dining rooms after a meal and join activities in the
central area likely for two reasons because activities were not planned for the houses and because
Mapping Five Sites
19 of 47
staff working in the houses could not easily monitor a resident who remained in the house living-
dining room WDS staff were rarely seen in the housesrsquo living-dining rooms The School House the
centre house accounted for the majority of residents observed across all houses This kitchen
adjacent to the highly used area just outside the Great Room provided a relatively good monitoring
station for the house and activities in the common areas At WDS mealtimes two common areas
were used residents who needed substantial assistance with meals were often fed in the craft room
and a high-functioning group ate at the dining table alongside the fireplace seating
In the houses at other sites most sightings of residents were in the diningliving room areas
Fewer were in the kitchen and fewer still in the house hallways (Table 3) At MDR only one area
adjacent to the kitchen was devoted to dining and almost no residents were seen in kitchens The
same was not true at ASB where approximately the same proportions of residents were seen in the
shared kitchens as in each of the living-dining rooms on either side (Table 3 sums all four living-
dining rooms) However at ASB the numbers were likely from residents moving between the two
diningliving rooms and passing through the kitchens (Figure 1) because residents were rarely
engaged in the type of tasks encouraged at MPN and MPW (ie handling dishes setting tables etc
to encourage maintenance of their functional abilities Figure 7) Interestingly the highly similar sites
found different ways to use their spaces and different approaches to activities
ASB MPW and WDS held barbecues during the days of observation (Table 3) This meant
the residentsrsquo presence in the kitchen and dining areas was reduced at those meals Accordingly for
comparison across sites dining area sightings were adjusted by adding mealtime sightings in the
courtyards The peak periods for resident sightings were during the midday lunch (1130-1330) and
evening meals (1630-1830) (Table 5) Even so sightings of residents at mealtimes were only 66-
80 of occupancy indicating eight to ten residents were not seen at mealtimes in public areas at
most sites (Table 5) The exception was WDS where sightings indicated nearly all residents were
observed in public areas at mealtimes (Table 5) although WDS residents did not gather in the house
Mapping Five Sites
20 of 47
dining areas for the noon meal With most activities occurring in the core of the building WDS was
flexible about meal arrangements serving meals where residents were located such as the area
outside the great room on an activity room Residents were not required to return to their own houses
to eat They could join day program residents and eat in the common area or join residents in another
house One group of women was known for asking to eat together on their own in the common area
WDS also led other sites in the number of residents observed at other times of the day (Table 5) The
differences were especially marked in the afternoon between meals (1330-1630) and the period
after the evening meal (1830-2130) This suggests that WDS staff may have been viewing the
central areas like they would the central areas of a unit in a nursing home on dementia units staff
often prefer that residents stay in view and not return to their rooms
Resident Activity The observed activity patterns were surprising considering high levels of
resident inactivity reported for nursing home residents (Gottesman amp Bourestom 1974 Ice 2002)
Gottesman and Bourestomrsquos (1974) observations in 40 nursing homes revealed that residents spent
56 of their time during peak daylight hours engaged in no activity or passive activity In that study
residents were involved in personal care television and socializing for 43 of the time Ice (2002)
reprised the Gottesman and Bourestom study and found residents spent 65 of their time doing little
or nothing with only 12 in social activities (Ice 2002) In the present study observations of Just
Sitting and Watching were expected to measure levels of passive behaviors Residents in the five
sites appeared to be engaged in ADLs and Leisure for greater amounts of time than in Just Sitting
and Watching (although small amounts of napping as passive behavior were coded as
Miscellaneous) but this was not significant (Figure 7) Chi-square analysis using phi coefficients
found that residents at WDS engaged significantly less in ADLs than residents in other centres
(plt00001) residents at ASB MPN amp WDS were engaged less in leisure (plt005 each) ASB
Mapping Five Sites
21 of 47
residents were engaged less in Just Sitting (plt00005) and residents were observed Watching less at
MDR MPN amp MPW (plt00005 each) Leisure was the most frequently observed activity for MDR
MPN and MPW the second most frequent at ASB and the third at WDS Recreational activities
both planned and informal activities were considered to be Leisure thus watching TV or waiting to
be served at a coffee party were both coded as being Leisure (persons who were within the group and
actively attending to events but not actively engaged at the moment were coded as Leisure too and
this was distinguished from Watching which was defined as ldquoattending to activities or interactions of
others from a distance such as from a doorway watching a streetrdquo)
Insert Figure 7 about here
The ADLs were the second most frequently seen activity for MDR MPN and MPW and the
third for ASB but were seen much less at WDS The majority of ADLs across sites occurred at meal
times indicating they involved dining (ASB 570 MDR 590 MPN 758 MPW 736 but
WDS 422) The low percent of time spent by WDS residents on ADLs during the evening meal
time (42) agrees with the low number of sightings in the dining area at that time (385 of max)
It appears that WDS residents sat watched and walked but did not spend much time eating
(Figure 7) In contrast previous research at MPN and MPW has found mealtimes to be the longest
duration behavior Scans needed to be one hour apart to avoid seeing meals on two consecutive scans
and oversampling the behavior (Milke et al 2000)
Work that is tasks such as housekeeping and cooking were not seen at either of the sites
with 20-capacity houses but this is the only difference evident when compared with the 12-capacity
Mapping Five Sites
22 of 47
houses Compared to other sites MPN and MPW residents engaged in moderate proportions of all
behaviors (Figure 7) Residents at WDS spent proportionately less time on ADLs light
housekeeping and Leisure and more time at Walking Watching and Just Sitting Chi-square
analysis using phi coefficients showed that residents were observed Walking significantly less at
MDR (plt 005) residents at ASB and MDR engaged significantly less in Work and there were no
significant differences between sites in Miscellaneous activities (Figure 7)
Observersrsquo Notes
Some large differences were found in the care programs across sites Observersrsquo notes
indicated that at MPN and MPW residents were encouraged to be involved in the daily routine of the
facility and direct care staff ate meals with residents This strategy was said to stimulate conversation
and provide residents with a model for appropriate behavior Staff played the role of ldquomotherrdquo rising
to find an item in the kitchen and keeping an eye on food consumption Managers at MPN and MPW
considered this role an essential component of care At ASB MDR and WDS there was no evidence
of such a role
Most cooking was done in facility kitchens away from areas that residents could access This
tended to result in the house kitchens being treated more like institutional serveries Fridges mainly
contained large juice jugs and prepared snacks However at MPW and MPN when a resident opened
the fridge door the door was full of condiments and casseroles it looked just like home because of
an effort to keep institutional sized packages to a minimum These two sites used their kitchens quite
differently than the other three sites At MPN and MPW all breakfasts and snacks were prepared in
the houses each day by direct care staff On four weekdays lunches also were prepared Residents
were invited to participate in some of the chopping slicing and mixing which was considered an
essential component of the care program When meals were delivered from nearby facility kitchens
staff decanted items into family-size serving bowls They added condiments and poured drinks
Mapping Five Sites
23 of 47
serving the meals much like those prepared in-house Although residents helping with meal
preparation appeared to be limited to MPN and MPW staff records indicated additional forms of
daily and special occasion activities occurred at all sites Daily activities included easy tasks eg
folding laundry and exercises at all five sites discussion groups at MDR and WDS religious
activities at ASB MPN and MPW musicsinging at ASB MPW and WDS movies at ASB and
grooming at all sites except WDS
Outdoor courtyards were accessible to residents on the observation days at all sites The
barbecue meal at MPW drew the highest number of residents outside but from mid-morning until
early evening residents were seen on the patios or walkways This was true at every site except
MDR where few ventured outside (data not presented)
Disruptive behaviors were seen only at ASB where at 730 am 230 pm and 430 pm a
single resident was disruptive Whether this was the same or different resident is not known the
identity of persons was not recorded This accounted for only 03 of all behaviors seen at ASB (and
was not shown on Figure 7)
Discussion
The TESS-2+scale results clearly indicated that the pioneering WDS site and the four sites
modeled on it met best practice standards in many areas These include the ratings for global site
assessment overall configuration of self-contained living arrangements with adjacent common
spaces informal workspaces for staff and accessible outdoor green spaces walking paths and
maintenance More pertinent to the present study there were no significant differences between the
sites that had 12-capacity houses and those with 20-capacity houses on any TESS items the NIA
subscale of overall environmental quality (SCUEQS) or CAAQS the composite score devised by
Mapping Five Sites
24 of 47
Slaughter et al (2006) Sites with 20-capacity houses did not look substantially different from sites
with 12-capacity houses according to the scale
Behavioral Mapping
A principal finding from behavioral mapping was the amount of time residents were found
engaged in leisure activity at all five sites Leisure was the most frequently observed activity for
MDR MPN and MPW the second most frequent at ASB and the third at WDS The level of
participation in meaningful activities is considered an important measure of residentsrsquo quality of life
(Gonzalez-Salvador et al 2000 Zimmerman et al 2005) Although the extent of engagement is
typically measured in more focused and intensive ways the fact that observers saw residents who
were alert and watching an activity is meaningful because observers were asked to distinguish
whether the resident was ldquojust sittingrdquo or ldquowatchingrdquo if that was the extent of the involvement When
percentages of time spent in Leisure are combined with Activities of Daily Living following the lead
of Gottesman and Bourestom (1974) who combined personal care television and socializing the
results in this study are ASB 468 MDR 701 MPN 471 and MPW 483 All percentages
total are better than the 1974 studyrsquos 43 Only WDS with 261 was substantially worse and that
was largely because so little time was devoted to the evening meal Ice (2002) studying one site had
found only 12 of time spent in social activities however little time was spent Just Sitting or
Watching For the five sites in this study total percentages of these inactive behaviors are ASB
316 MDR 171 MPN 229 MPW 176 and WDS 402 which are all substantially
different than Gottesman and Bourestomrsquos finding of 56 of time engaged in no activity or passive
activity or the 65 seen by (Ice 2002)
Surprisingly the five sites differed in the percent of maximum possible number of sightings
of residents observed in public areas per scan per day ranging from 49 at MDR to 80 at WDS
This range of 38 difference between the lowest and highest sites is considerable The traditional
concern of staff is that residents who stay in their rooms miss out on socialization and planned
Mapping Five Sites
25 of 47
activities (Grade 1976 Hogden 1985) The public areas most frequented by WDS residents were the
fireplace area and the common hallway area At most sites if the residents were not observed in the
common areas it would be likely that they were in the house areas This was confirmed in the other
principal finding that the percent of maximum possible sightings in the house areas was lowest for
WDS at 25 and highest at ASB at 50 At ASB residents spent 80 of their time in their two
houses At WDS they were encouraged to spend their time in the common areas and they did The
houses were used very differently at the two sites and this may have been because the architects who
were very involved in both sites made it evident that they were intended to be used differently
However the use of communal spaces often has little to do with the intended purpose Lawton
(1970) reports that in 10 observational rounds of a facility a total of 13 people were observed in the
nine social rooms on the nine floors while 79 were counted in the main floor social room where
arrivals and departures could be observed Similarly areas around nursing stations and elevators
frequently draw residents (Lawton 1970 Lawton 1977 Snyder 1980)
A number of factors can be ruled out in the search for unique characteristics of WDS that
could have contributed to the above findings The first factor is the reliability of the observers It is
unlikely that the differences were due to variability in the observational skillsprocedures of the
observers because of the high level of agreement in the assessment of interobserver reliability and
because all observers followed the same protocol in collecting the data The observersrsquo reliability was
also attested to by the similarity of the data within sites across the two days of data collection The
second factor is the general floor plan WDS shared the same basic floor plan with MPN and MPW a
building footprint like the capital letter E So it is unlikely that the gross outer shape of the floor plan
was relevant The third more general factor is related to the inter-site comparability of the TESS-2+
data These data indicate that the five sites were remarkably similar in general and internal design
features WDS has ratings on all measures that were comparable to one or more of the other sites
Mapping Five Sites
26 of 47
including potentially relevant measures such as the presence of homelike features the degree of
interaction with staff and residentsrsquo involvement in activities
There are however a number of other factors that may be relevant to understanding the
WDS data WDS was the only site in which meals were served in the common areas as well as in the
house dining rooms Congruently as already noted the highest number of resident sightings at WDS
was in the common areas (fireplace and common hallway) and most of these common area sightings
were in the common areas of WDS adjacent to the central area of the three houses Importantly these
were the only common areas with a direct line of sight to the central hall and kitchen of the central
house (School House) Staff notes indicated that the number of meal servings from the central house
kitchen was twice as high as that of the kitchens of the other two houses at WDS Again there is
congruence resident sightings in the central house dining room although low relative to central
common areas were twice as high as in the dining rooms of the other two houses at WDS It is also
relevant that staff used all parts of the central common area for activity programming Thus it seems
probable that several factors including the internal floor plan meal service and activity
programming made the central common areas of WDS a multiuse area which resulted in high
number of resident sightings though out the day with peaks at meal times It is worth asking whether
WDS staff would have used the central common area so intensely if the house kitchens had been
aligned with the dining rooms providing staff with oversight as in MPN and MPW
These observations could also explain another WDS anomaly that is the low number
of residents seen to be engaged in ADL activities at meal times compared to other sites If the
lower-functioning residents at WDS engaged in other activities in the central common areas
perhaps abandoning a meal to walk or sit elsewhere that could result in fewer observations
of eating during the mealtime Conversely it could mean that it would be more likely that
Mapping Five Sites
27 of 47
other activities (ie watching walking sitting and leisure activities) would be seen during
meal times which was the case in WDS
Finally the unique features of the WDS resident sighting data may have been related to the
greater degree of dementia (lower than average MMSE scores) of WDS residents The average
MMSE scores at other sites were 50 to 100 higher indicating less severe symptoms than the
average WDS score Congruently WDS had relatively high levels of sightings of sitting watching
and walking behavior and the highest number of pacing incidents Thus it is possible that the
differences in degree of dementia between sites and the related differences in levels of ambulation
made it more likely that WDS residents would leave their rooms and therefore WDS residents would
be sighted most frequently in the common areas of the WDS facility
It is important to note that no substantial differences were found between the 20-capacity
and 12-capacity houses that is in the mean domain scores of the TESS which was used to describe
environmental characteristics Scores were much the same across the five sites The TESS has goals
and domains aligned with the general site design which are more architecturally based and those
best aligned with interior design site operations and providing care
The architects might have thought their design at ASB and MDR would result in a small care
group of 10 and that residents along each bedroom hall would form a household but this did not
happen The residents in the 20-capacity houses did not form a 20-resident cluster either instead they
formed small groups for eating and activities Therefore other factors such as early or late rising or
naturally-formed friendships may be a greater influence than bedroom proximity The addition of
eight more residents per house might be anticipated to lead to crowding in the housesrsquo living-dining
areas or some other notable difference However crowding was not evident in the 20-capacity
houses In fact WDS gatherings in the common areas were more apt to be viewed as crowds
Mapping Five Sites
28 of 47
Observations indicated there that Disruptive Behavior often attributed to crowding was rare It
occurred in only one site and therefore could not be associated with a particular design
These observational results combined with the TESS results have broad implications for
future studies The first implication is methodological and the second is empirical Methodologically
the combination of architectural and behavioral measures in studies of facilities for the elderly
highlights the advantages over methodologies that employ only behavioral measures eg Dementia
Care Mapping (Brooker 2005 Fulton Edelman amp Kuhn 2006 Sloane Brooker Cohen et al
2007) and over studies that rely on client interviews (Kane 2003) Empirically 20 residents in a
house is approaching the size of dementia units in some nursing homes The present study revealed
that the main difference seen in the operation of the 12-resident house and the 20-resident house
design was that the latter appeared to hold more activities within the house raising questions about
the value and need for those common spaces whereas the former made more use of the common
spaces for activities In this way behavior was affected by the house design and by the way that staff
chose to organize activities
Mapping Five Sites
29 of 47
References
Benson D M Cameron D Humbach E Servino L amp Gambert S R (1987) Establishment and
impact of a dementia unit within the nursing home Journal of the American Geriatrics Society
35 319-323
Brawley E C (1997) Designing for Alzheimerrsquos disease Strategies for creating better care
environments New York Wiley
Brooker D (2005) Dementia Care Mapping A review of the research literature The Gerontologist
45 Special Issue I 11ndash18
Calkins M P Meehan R A amp Lipstreuer E (1999) Creekview Its history and evaluation
Kirtland OH IDEAS Inc
Colling K B (1999) Passive behaviors in Alzheimer disease A descriptive analysis American
Journal of Alzheimers Disease and Other Dementias 14 27-40
Cronin-Golumb A (1995) Vision in Alzheimerrsquos disease The Gerontologist 35 370-376
Day K Carreon D amp Stump C (2000) The therapeutic design of environments for people with
dementia A review of the empirical research The Gerontologist 40 397-416
Deely B Klingensmith L amp Silverman M (1995) Developing a residential Alzheimers facility
Focus on Geriatric Care and Rehabilitation 8(7) 1-8
DiMotta S Dubney B M Hoglund J D amp Kershner C (1993) Long-term care design Blazing
new territory - code reform and beyond Journal of Healthcare Design 5 197-203
DiMotta S amp Hoglund J D (2000) Woodside Place A residential care model for the Alzheimerrsquos
and dementia resident Symposium on Healthcare Design Anaheim CA Center for Healthcare
Design
Mapping Five Sites
30 of 47
Doty M M Koren M J amp Sturla E L (2008) Culture change in nursing homes How far have
we come Findings from The Commonwealth Fund 2007 National Survey of Nursing Homes
New York The Commonwealth Fund
Edelman P Fulton B R Kuhn D amp Chang C H (2005) A comparison of three methods of
measuring dementia-specific quality of life Perspectives of residents staff and observers The
Gerontologist 45 27-36
Fleiss J L (1981) Statistical methods for rates and proportions (2nd ed) New York John Wiley amp
Son
Folstein M F Folstein S E amp McHugh P R (1975) Mini-Mental State a practical method for
grading the cognitive state of patients for the clinician Journal of Geriatric Research 12 189-
198
Fulton B R Edelman P amp Kuhn D (2006) Streamlined models of dementia care mapping
Aging amp Mental Health 10 343-351
Gold D T (1991) A descriptive typology of dementia units In P D Sloane amp L J Mathew (Eds)
Dementia units in long-term care (pp 50-61) Baltimore Johns Hopkins University Press
Gonzalez-Salvador T Lyketsos C G Baker A Hovanec L Roques C Brandt J et al (2000)
Quality of Life in dementia patients in long-term care International Journal of Geriatric
Psychiatry 15 181-189
Gottesman L E amp Bourestom N C (1974) Why nursing homes do what they do The
Gerontologist 14 501-506
Grade B L (1976) A study of the entry crisis to a nursing home Unpublished masterrsquos thesis
University of Wisconsin Milwaukee
Grant L A (1998) Beyond the dichotomy An empirical typology of Alzheimerrsquos care in nursing
homes Research on Aging 20 569-592
Mapping Five Sites
31 of 47
Greene J A Asp J amp Crane N (1985) Specialized management of the Alzheimerrsquos disease
patient Does it make a difference A preliminary progress report Journal of the Tennessee
Medical Association 78 559-563
Harper G J (1998) Stress and adaptation among elders in life care communities Unpublished
doctoral dissertation Ohio State University Columbus
Hogden K M (1985) Leisurerecreation needs of hospitalized elderly A task force report
Activities Adaptation amp Aging 7 53-65
Hoglund D J amp Ledewitz S D (1999) Designing to meet the needs of people with Alzheimerrsquos
disease In B Schwarz amp R Brent (Eds) Aging autonomy and architecture Advances in
assisted living (pp 229-261) Baltimore John Hopkins University Press
Ice G H (2002) Daily life in a nursing home has it changed in 25 years Journal of Aging Studies
16 345-359
Imamoğlu Ccedil (2007) Assisted living as a new place schema A comparison with homes and nursing
homes Environment and Behavior 39 246-268
Innes A amp Surr C (2001) Measuring the well-being of people with dementia living in formal care
settings The use of Dementia Care Mapping Aging and Mental Health 5 258-268
Kane R A (2003) Definition measurement and correlates of quality of life in nursing homes
Toward a reasonable practice research and policy agenda The Gerontologist 43 Special
Issue II 28ndash36
Kuhn D Kasayka R E amp Lechner C (2002) Behavioral observations and quality life among
persons with dementia in 10 assisted living facilities American Journal of Alzheimerrsquos Disease
and Other Dementias 17 291-298
Lawton M P (1970) Ecology and aging In L A Pastaland amp D H Carson (Eds) The spatial
behavior of older people (pp 41-67) Ann Arbor MI University of Michigan Press
Mapping Five Sites
32 of 47
Lawton M P (1977) The impact of the environment on aging and behavior In K W Schaie (Ed)
Handbook of the Psychology of Aging (pp 276-301) New York Van Nostrand Reinhold
Lawton M P Weisman G D Sloane P amp Calkins M (1997) Assessing environments for older
people with chronic illness Journal of Mental Health and Aging 3 83-100
Lawton M P Weisman G D Sloane P Norris-Baker C Calkins M amp Zimmerman S I
(2000) Professional Environmental Assessment Procedure for special care units for elders with
dementing illness and its relationship to the Therapeutic Environment Screening Schedule
Alzheimer Disease and Associated Disorders 14 28ndash38
Lee M Madden V Mason K Rice S Wyburd J amp Hobson S (2006) Occupational
engagement and adaptation in adults with dementia A preliminary investigation Physical and
Occupational Therapy in Geriatrics 25 63-81
Lehrner P N (1979) Handbook of ethological methods New York Garland STMP
Margulis S T (2003) Privacy as a social issue and behavioral concept Journal of Social Issues 59
243-261
Martin P amp Bateson P (1987) Measuring behaviour An introductory guide New York
Cambridge University Press
Mathew L J amp Sloane P D (1991) Organizing and staffing dementia units In P D Sloane amp L
J Mathew (Eds) Dementia units in long-term care (pp 101-127) Baltimore Johns Hopkins
University Press
McAllister C L amp Silverman M A (1999) Community formation and community roles among
persons with Alzheimerrsquos disease A comparative study of experience in a residential
Alzheimerrsquos facility and a traditional nursing home Qualitative Health Research 9 65-85
McCracken A L amp Fitzwater E (1989) The right environment for Alzheimerrsquos Geriatric
Nursing 10 293-294
Mapping Five Sites
33 of 47
Milke D L (2003) Iterative post-occupancy evaluations of the McConnell Place North design
[Abstract] Proceedings of the 56th Annual Scientific Meeting of the Gerontological Society of
America 43 48 San Diego CA
Milke D L Clark C amp Bucknell M (2000) Assessing the adequacy of residential lighting in two
care centres for persons with Alzheimerrsquos Disease using the new age-adjusted North American
illumination recommendations (Research Report) Ottawa Ontario Canada Canada Mortgage
and Housing Corporation
National Institute on Aging Coordinating Center (1993) NIA collaborative studies special care units
for Alzheimers disease Manual of procedures Davis CA Northern California Alzheimers
Disease Center University of California
Rabig J Thomas W Kane R A Cutler L J amp McAlilly S (2006) Radical redesign of nursing
homes Applying the Green House concept in Tupelo Mississippi The Gerontologist 46 533-
539
Rule B G Milke D L amp Dobbs A R (1992) Design of institutions Cognitive functioning and
social interactions of the aged resident Journal of Applied Gerontology 11 475-488
Saxton J Silverman M Ricci E Keane C amp Deely B (1998) Maintenance of mobility in
residents of an Alzheimer special care facility International Psychogeriatrics 10 213-224
Schwarz B Chaudhury H amp Tofle R B (2004) Effect of design interventions on a dementia care
setting American Journal of Alzheimers Disease and Other Dementias 19 172-176
Silverman M Ricci E Saxton J Ledewitz S McAllister C amp Keane C (1995) Woodside
Place The first three years of a residential Alzheimerrsquos facility (Vols 1-2) Oakmont PA
Presbyterian Senior Care
Skea D amp Lindesay J (1996) An evaluation of two models of long-term residential care for
elderly people with dementia International Journal of Geriatric Psychiatry 11 233-241
Mapping Five Sites
34 of 47
Slaughter S Calkins M Eliasziw M amp Reimer M (2006) Measuring physical and social
environments in nursing homes for people with middle- to late-stage dementia Journal of the
American Geriatrics Society 54 1436-1441
Sloane P D Brooker D Cohen L Douglass C Edelman P Fulton B R et al (2007)
Dementia Care Mapping as a research tool International Journal of Geriatric Psychiatry 22
580-589
Sloane P D Mitchell M Priesser J S Phillips C Commander C amp Burker E (1998)
Environmental correlates of resident agitation in Alzheimerrsquos disease special care units Journal
of the American Geriatric Society 46 862ndash869
Sloane P D Mitchell C M Weisman G Zimmerman S Foley K M L Lynn M et al
(2002) The Therapeutic Environment Screening Survey for Nursing Homes (TESS-NH) An
observational instrument for assessing the physical environment of institutional settings for
persons with dementia Journals of Gerontology Series B Psychological Sciences and Social
Sciences 57B(Suppl 2) S69-S78
Sloane P D Zimmerman S Williams C S Reed P S Gill KS amp Preisser J S (2005)
Evaluating the quality of life of long-term care residents with dementia The Gerontologist 45
37-49
Snyder L G (1980) An exploratory study of patterns of social interaction organization and facility
design in three nursing homes In J Hendricks (Ed) Institutionalization and Alternative Futures
(pp 68-80) Farmingdale NY Baywood Pub Co
Sommer R amp Sommer B B (1986) A practical guide to behavioral research Tools and
techniques (2nd ed) New York Oxford
Van Haitsma K Lawton M P amp Kleban M H (2000) Does segregation help or hinder
Examining the role of heterogeneity in behavioral and emotional aspects of quality of life for
Mapping Five Sites
35 of 47
persons with cognitive impairment in the nursing home Research and Practice in Alzheimerrsquos
Disease 4 163-177
Verbeek H van Rossum E Zwakhalen S M G Kempen G I J M amp Hamers J P H (2009)
Small homelike care environments for older people with dementia A literature review
International Psychogeriatrics 21 252-264
Voelkl J E (2006) Therapeutic environments in nursing homes Fostering residents meaningful
activity engagement Activities Directors Quarterly for Alzheimers and Other Dementia
Patients 7(3) 35-44
Warren S (Ed) (1998) Innovative dementia care McConnell Place North evaluation (Research
Report) Edmonton Alberta Canada Evaluating Programs of Innovative Continuing Care
Zeisel J (1998) The Hearthstone health environments case study Journal of Healthcare Design
Proceedings from the Symposium on Healthcare Design San Francisco CA National
Symposium on Healthcare Design Inc
Zeisel J Hyde J amp Levkoff S (1994) Best practices An environment-behavior (E-B) model for
Alzheimer special care units American Journal of Alzheimerrsquos Care and Related Disorders and
Research and Care 9(2) 4-21
Zimmerman S Sloane P D Williams C S Reed P S Preisser J S Eckert J K et al (2005)
Dementia care and quality of life in assisted living and nursing homes The Gerontologist 45
133-146
Mapping Five Sites
36 of 47
Table 1 Comparison of Architectural Features Across Five Sites
Feature ASB MDR MPN MPW WDS
Total facility square footage 23040 sq ft 27308 sq fta 24750 sq ft 23864 sq ft 21540 sq ft
Size of administration area (offices conference reception etc but not service or employee spaces)
960 sq ft (No entry hall)
1584 sq ft day program offices and program space
1675 sq ft 1629 sq ft 972 sq ft (No entry hall)
Staff (lunch) room 16rsquo x 18rsquo 6rsquo11rdquo x 6rsquo2rdquo 158rsquo x 16rsquo 138rsquo x 16rsquo 95rsquo x 30rsquo (plus)b
Treatment or examination room
No Yes In daycare area
No No Yes In central
areac
Medications storage Central medication cart
Medication room Medication room per house
Medication room per house
Central medication cart
Location of meal preparation
Facility kitchen in administration area
Facility kitchen in administration area
Adjacent nursing home (see house kitchen)
Adjacent nursing home (see house kitchen)
Facility kitchen in administration area
Use of house kitchen Servery snacks Servery snacks Meal preparation for all breakfasts and some lunches servery
Meal preparation for all breakfasts and some lunches servery
Servery snacks
Family dining room or central country kitchen usage
Small group activities family functions by reservation
Small group activities family functions by reservation
Small group meetings Great Room party food preparation family functions by reservation
Small group meetings Great Room party food preparation family functions by reservation
Small group activities family functions by reservation
Houses and capacity 2 20 2 20 3 12 3 12 3 12
Private tubroom Two off the central hallway
Two off the central hallway
One located in each house
One located in each house
None
Private shower areas One per 10 residents located in each wing of each house
One per 10 residents located in each wing of each house
One per resident located in each resident room with the one shared bedroom having a shared shower
One per resident located in each resident room with the one shared bedroom having a shared shower
One per 12 residents located in each house
Resident room doors Split door Split door Split door Regular Split door
Inventory of public rooms and seating capacity (includes all alcoves that can be used for seating and seating areas near exits)
15 165
17 176
15 232
13 219
14 182
Variety and appearance of outdoor Area
2 small (little greenery) 1 medium (mixed hardgreen surfaces) and a large courtyardmdashvery appealing
2 small (much greenery) 1 medium (mixed hardgreen surfaces) 2 large courtyards (1 mixed hardgreen surfaces 1 green) mdash very appealing
3 small (much greenery) 1 large (mostly green courtyard mdash very appealing
3 small (much greenery) and 1 large (mostly green courtyard mdash very appealing
1 small (much greenery) 1 medium (mostly green) and 1 large (mostly green) courtyard mdash very appealing
a Does not include researchteaching wing Total for entire floor space is 40382 sq ft b Room at WDS was not intended as a lounge ie a retreat from work to professionalize the care staff role it was to serve as a place to read and discuss work At other
sites the lunch room also served as a lounge c Room was intended as a multi-purpose room
Mapping Five Sites
37 of 47
Table 2 Therapeutic Environment Screening Scale Items for Goal and Domain Possible Range
Midpoint and Mean in Each Group
Therapeutic Goal and Domain
Item Numbers Range Mid-point ASB amp MDR
20-Capacity Houses MPN MPW amp WDS
12-Capacity Houses
ASB MDR Site Scores
Mean MPN MPW WDS Site Scores
Mean
Safetysecurityhealth
Exit control 2a 2b 2c 2d 2e 2g
2h 3a 3b 0-11 55 2 1 15 1 2 2 17
Maintenance 7b1Dagger 7b2Dagger 7b3Dagger 7b4Dagger 0-8 40 8 8 80 8 8 80
Cleanliness 7a1Dagger 7a2Dagger 7a3 7a4 0-8 40 8 8 80 7 8 8 77
Lack of odorsℓ 9aDagger 9bDagger 0-4 20 4 3 35 4 4 4 40
Safetyℓ 7c1 7c2Dagger 7c3 7c4 8 0-10 60 10 10 100 10 10 10 100
Orientationcuing 19 20ф 27a 27bcDagger
27d 27e 27f 28 29 0-17 85 1212 120 11 9 12 107
Privacycontrol
Privacy 30a 30b 30c 30d 0-4 20 0 0 0 1 2 0 10
Functional ability 16 17a 17b 18Dagger 0-7 35 7 7 70 7 7 7 70
Stimulation
Lighting 21 22a 22bDagger 22cDagger
23a 23b 23c 0-14 70 13 13 130 11 14 13 127
Tactilevisual
stimulation 34 35Dagger 37b 0-16 80 10 6 80 15 14 11 133
Quietness 24a 24b 24c 24d
24eDagger 24f 24g 25 26 0-25 125 21 21 210 19 20 23 207
Physical attractiveness
4a1 4a2 4b1 4b2
4c1 4c2 4d1 4d2 37c 0-34 140 16 15 155 15 16 16 157
Socialization
Homelike
environment 15Dagger 31Dagger 32 0-9 45 9 9 90 9 9 9 90
Resident
appearance 36Dagger
0-2 10 2 2 20 2 2 20
SCUEQS 0-41 - 41 39 40 39 4141 40
CAAQS sect 0-100 - 786 857
Large means represent better physical environment
Dagger Items used to compute the 18-item Special Care Environmental Quality Scale (SCUEQS) 27b and 27c were treated as a single item and item 15 was
misnumbered in the TESS-2+ Revised version (as item 13) ф Item 20 is the percentage of common rooms with signsgraphics floor plans in all sites allowed a view into common rooms (scored as zero) ℓ An item was unintentionally omitted from the TESS-2+ scoring form (10 in Odors and 11 in Safety) sect Composite Above Average Quality Score (CAAQS) represents the percentage of TESS-2+ domains that were above average in quality
Mapping Five Sites
38 of 47
Table 3 Percent of Resident Population Who Were Observed During Behavior Scans
at Each Site in Particular Areasa
AreaSite 20-Capacity Houses 12-Capacity Houses
ASB MDR MPN MPW WDS
Total Areas 608 493 511 564 803
Total Common Areas 62 158 169 200 511
Total Outdoor Areas 46 02 11 56 38
Total House Areas 500 333 331 311 254
House 1 259 168 115 69 62
House 2 241 165 108 128 123
House 3 108 114 69
House Kitchen 149 08 75 53 49
House LivingDining Room 324 278 236 232 200 a Resident data were adjusted to show the mean percent of residents at a site who were observed per scan per day Note Total Areas is the sum of the following Total Common Total Outdoor and Total House Total House Areas is the sum of Houses 1 House 2 and House 3 House Kitchen and LivingDining Rooms are summed across houses Blank cells indicate that the question was not applicable
Mapping Five Sites
39 of 47
Table 4 Percent of Resident Population Who Were Observed During Behavior Scans
at Each Site in Particular Common Areasa
Location 20-Capacity Houses 12-Capacity Houses ASB MDR MPN MPW WDS
Great Room 07 75 94 91 64
Fireplace Seating Area 22 69 43 13 106
ActivityCraft Room 04 47 00 02 10
TV Room ndash ndash 43 64 58
Other TV Area ndash ndash 11 39 ndash
Common Area Hallway Seating 37 108 138 143 396
Music Room ndash ndash 00 ndash 00
Garden Room ndash ndash 00 ndash 04
Beauty Salon 39 12 00 00 00
Family Dining RoomCountry Kitchen 00 09 00 00 00
Total 109 320 329 352 638 a Resident data were adjusted to show the mean percent of residents at a site who were observed per scan per day Note Dashes indicate that residents were not observed in these areas
Mapping Five Sites
40 of 47
Table 5 Percent of Resident Population Who Were Observed During Behavior Scans
at Each Site at Particular Times of Day
Time of Day 20-Capacity Houses 12-Capacity Houses
ASB MDR MPN MPW WDS
Before Lunch 541 360 386 475 654
Lunch 805 663 667 722 1000
Between Meals 657 530 506 589 963
Supper 765 738 744 744 922
After Supper 50 390 447 469 740 a Resident data were adjusted to show the mean percent of residents at a site who were observed per scan per day Note Before Lunch (4 scans-730-1030) Lunch (2 scans-1130 amp 1230) Between Meals (3 scans-1330 to 1530) Supper (2 scans-1630 amp 1730) After Supper (4 scans-1830 to 2130)
Mapping Five Sites
41 of 47
Figure 1 Floor plan of Asbury Place Mt Lebanon PA
Mapping Five Sites
42 of 47
Figure 2 Floor plan of Marjorie Doyle Rockwell Center Cohoes NY
Mapping Five Sites
43 of 47
Figure 3 Floor plan of McConnell Place North Edmonton AB
Mapping Five Sites
44 of 47
Figure 4 Floor plan of McConnell Place West Edmonton AB
Mapping Five Sites
45 of 47
Figure 5 Floor plan of Woodside Place Oakmont PA
Mapping Five Sites
46 of 47
Figure 6
McConnell Place Northordf Residentsrsquo Activities When Alone and in the Presence of Staff
ordf The average MMSE score was 153 at MPN higher than the average across sites 132 + 15 (M+SE) MPN residents appeared not to initiate activities when alone
0
5
10
15
20
25
30
35
40
Alone Day 1 With Staff Day 1 Alone Day 2 With Staff Day 2
Nu
mb
er R
esid
ents
Arts amp Crafts
Chores
CookingBaking
Eating
Exercising
Games
Grooming
Lg Activity Grp
Music Event
Reading
Sm Interaction
Walking
Watching
Watching TV
Other
Mapping Five Sites
47 of 47
Figure 7
Percent of Scans in Which Residents at Each Site Engaged in Particular Behaviors
0
10
20
30
40
50
60
70
80
90
100
ASB MDR MPN MPW WDS
Misc
Just Sit
Watch
Walk
Leisure
Work
ADLs
Mapping Five Sites
13 of 47
Orientation and cuing is related to residentsrsquo personal safety and self-awareness thus the
photos and names beside the bedrooms doorways which all sites used are important (Table 2 27
28 29) as in the ldquotip of the tongue phenomenonrdquo they need a cue to retrieve the memory (Zeisel
1998) An open interior plan that allows residents to see into public rooms is an optimal way finding
strategy for persons with dementia all sites employed this The strategic location of cues and
personal items can also aid way finding Although institutional-style directional signage is eschewed
on restroom doors for example both graphics and labels are advised Open floor plans often require
few signs MDR had the most signs and MPW used the fewest graphics and signs with other sites
having intermediate numbers (Table 2 19 20) Large windows that provide natural exterior views
(Table 2 4) are not only attractive they are another tactic that serves way finding and also provides
seasonal orientation in the latitudes of these five sites The entrances of residentsrsquo bedrooms were
personalized at all sites (Table 2 27 28 29) Redundancy is recommended and a greater variety of
items were used at ASB MDR WDS and MPN than at MPW for this purpose
All five sites scored well on supporting functional ability (Table 2 16 17 18) that is either
slowing decline or stimulating improvement which is something for which sites designed for
dementia have been associated (Benson Cameron Humback Servino amp Gambert 1987 Greene
Asp amp Crane 1985 Innes amp Surr 2001 McCracken amp Fitzwater 1989 Rabig Thomas Kane
Cutler amp McAlilly 2006 Rule Milke Dobbs 1992 Silverman et al 1995 Skea amp Lindesay 1996
Warren 1998)
Interior Design and Approach to Care The first goal of this type is safety security and
health with domains (besides exit control discussed above) of Maintenance Cleanliness Lack of
odors and Safety (of floors) A second goal is Stimulation and a third is Socialization Slaughter et
al (2006) viewed these as basic requirements and found no significant differences in these goals
when comparing the 6 special care facilities (bungalows) with the 45 units in traditional institutional
facilities so it is not surprising that the same was true for these highly similar sites
Mapping Five Sites
14 of 47
Stimulation domains include Lighting Tactile and Visual stimulation as well as Quietness
Both sensory deprivation and over-stimulation are viewed as problems (Brawley 1997 Day
Carreon amp Stump 2000 Cronin-Golumb 1995) According to Zeisel Hyde amp Levkoff (1994)
appropriate levels of stimulation results from having a site with a high sensory comprehension
ranking so not necessarily the overall calmest setting but rather one with a moderate amount of
sensory input that residents can understand Ambient lighting was considered good in all sites with
minimal glare from a number of reflecting surfaces such as picture windows and French doors (Table
2 21) Lighting was evenly distributed and levels were considered ample (Table 2 22 23) with the
exception of MPN Ambient auditory noise was not deemed a problem whether considering type or
level of noise (Table 2 24 25) The general availability of things to touch in common areas such as
those that invite handling or folding was somewhat less at ASB and MDR than at other sites
Overall ratings of home likeness and the individuality of residentsrsquo appearance were
consistently good but the general atmosphere influenced by residentsrsquo lower overall levels of
participation in activities and a less positive rating for staff interactions with residents resulted in
MDR scoring lower that other sites (Table 2 15 31 32 36) WDS scored in the mid-range on
residentsrsquo involvement but as indicated above its residents had much lower MMSE scores At all
sites personal pictures or mementos were in most residentsrsquo bedrooms However such items were
not present in common rooms at MDR
The mean SCUEQS scores (Table 2) which summarized a subset of the TESS-2+ items
were not significantly different between the sites that had 12-capacity houses and those with 20-
capacity houses The SCUEQS had been derived for the NIA studies of special care units and was
considered by experts to measure important aspect of the physical environment and serve as a
reliable measure for differentiating better nursing units and assessing the overall environmental
quality (Sloane et al 2002) The results appear to justify the architectsrsquo design decisions that resulted
in two hallways of 10 residents sharing the large kitchen and the living-dining rooms Slaughter et al
Mapping Five Sites
15 of 47
(2006) devised another composite score the Composite Above Average Quality Score (CAAQS)
which they found to be more sensitive than the SCUEQS The CAAQS represents the percentage of
domains that were above average in quality It revealed a difference between the sites with 12-
capacity houses (857) and those with 20-capacity houses (786) that was not shown by the
SCUEQS but the difference was not significant
Behavioral Mapping
Reliability The number and category (staff family or resident) of persons observed at each location
was recorded on floor plans in successive behavior scans one hour apart over the course of two
days Interobserver reliability of the scans was assessed at each site Cohenrsquos kappa a measure of
agreement between observers has a range from 0 no agreement to 100 total agreement Fleiss
(1981) characterized a kappa of 4 to 6 as fair 6 to 75 as good and over 75 as excellent There was
good agreement on average between two independent observers on the identification of behaviors
observed Kappa mean (SD) 0851 (04) and excellent agreement on identification of people being
scanned as residents staff family or others kappa mean (SD) 0732 (07)
Observations Fifteen observation periods or scans per day were conducted one per hour during
the two days of observation Examination of the within-site data revealed that the only differences
were day differences in specific scans related to the occurrence of special events eg barbecues
Consequently the data were collapsed across days A scan of about 10 minutes in duration was
required to count people in all public areas Observers minimized the possibility of counting the same
person in more than one room during a scan by following a preplanned path through the building and
working quickly Counts of sightings of staff family and volunteers and residents by hour in each
Mapping Five Sites
16 of 47
area of each site were summed over the two-day period of observation To assist the description of
the findings resident data were subsequently adjusted to show the mean percent of residents at a site
who were observed per scan per day and to show the percent of scans in which residents were
involved in a particular activity or seen in a particular room or area
Staff and Family Observations of staff and family are presented without data as these were
ancillary to the principal focus on residents Staff were seen most often in the house kitchens or
diningliving rooms across all sites except WDS At WDS staff were seen in the kitchens but
seldom in the diningliving rooms In all three sites with 12-capacity houses the central house was a
hub of staff activity with nearly twice as many staff seen in that kitchen (or an adjacent room which
was the dining room in MPN and MPW but was a hallway in WDS) as in the kitchens of the houses
on either side WDS staff were also seen in the seating area outside the great room nearly as much as
in the house kitchens Residents were seldom engaged in an activity when staff were not around eg
see Figure 6 for MPN This is not surprising because persons with Alzheimer disease lose their
ability to initiate activities (Colling 1999 Lee et al 2006) Others have shown that appropriate
environments are not sufficient residents with this disease need activities and all five sites employed
activity coordinators (Grant 1998 Van Haitsma Lawton amp Kleban 2000 Voelkl 2006)
Insert Figure 6 about here
Family members were at some sites as early as 830 am and as late as 930 pm although at
MPN all visits except one were in the afternoon ASB had a family meeting increasing the number
Mapping Five Sites
17 of 47
of sightings of family members to 42 (19 were associated with the meeting) The numbers of
sightings of family members over the two days of observation at other sites were WDS ndash 27 MPN ndash
23 and MDR and MPN ndash 12 each
Insert Tables 3 and 4 about here
Resident Locations Direct observation revealed a pattern of use that was unexpected and not
evident in TESS results Overall resident sightings were at least 25 higher at WDS than at the
other four sites (Table 3) The number of sightings in the common areas of WDS was over 60
greater than those at any other site (Table 3) Residents were most frequently seen in the area just
outside the great room (Table 4) By contrast at all other sites residents spent more time (60 of
sightings) in their houses (Table 4) ASB where residents spent 80 of their time in their houses
represented the extreme in this regard with the other sites being intermediate between ASB and WDS
(Table 4) Differences did not appear to align with whether the houses were of 20- or 12-capacity At
all sites residents were seen most frequently in the common areas outside of the houses with the
common hallways the great room and fireplace seating area accounting for decreasing numbers of
residents in that order (Table 4) however a stylist in the ASB beauty salon drew a crowd showing
how an occasional event can change behavior patterns At the sites with 12-capacity houses and
television rooms those rooms were popular and drew as many residents as the fireplace area
The large percent (396) of residents seen in common areas at WDS was attributable to
sightings in the common hallway and fireplace seating area next to the School House (Figure 5
Table 4) All residents could be gathered in the area which was slightly larger than the great room
Mapping Five Sites
18 of 47
observers noted a continuous round of activities involving groups of varying sizes No other site used
this area as intensely At WDS a day program brought in 8 additional residents and several staff who
ran activities that attracted some residents (discussions newspaper reading crafts) Observers were
asked not to count persons associated with the day program in their tally but the heavy use of the
central space and the day program activities presented there had some influence ASB and MDR also
had day programs that used separate spaces for that purpose so program participants were not seen
Chairs lining the walls in this area of WDS augmenting seating arrangements in front of and on
either side of the fireplace as well as oversized displays of small snapshots on several walls resulted
in an institutional appearance Local lore attributes the lineup of chairs to residents who initiated it
shortly after move-in Staff moved chairs back where the interior designers located them but
residents would pull them back across the corridor in a line until staff gave up
Site differences in the use of the great room were noteworthy ASB appeared to use it only
for church services on a regular basis with ldquoaudience-seatingrdquo left in place from day-to-day
Possibly this was because this great room was relatively distant from the houses (Figure 1) In WDS
MPN and MPW great room seating was rearranged throughout the day to accommodate numerous
events MPN and MPW used the great room like a town hall holding events such as afternoon teas
dances and musical entertainment At MDR small numbers of residents were in the great room
throughout the day but no large gatherings were seen
Within sites the sightings of residents in the houses were distributed fairly evenly across the
houses (Figures 1-5 Table 3) Residents were most often seen in the living-dining rooms and as
noted above staff were most often seen in the adjacent kitchens The exception was WDS where the
house design did not provide a good line of sight for staff between the kitchens and the living-dining
rooms (Figures 4 amp 5) Staff at all other sites could work in kitchens and keep an eye on residents
WDS staff actively encouraged residents to leave dining rooms after a meal and join activities in the
central area likely for two reasons because activities were not planned for the houses and because
Mapping Five Sites
19 of 47
staff working in the houses could not easily monitor a resident who remained in the house living-
dining room WDS staff were rarely seen in the housesrsquo living-dining rooms The School House the
centre house accounted for the majority of residents observed across all houses This kitchen
adjacent to the highly used area just outside the Great Room provided a relatively good monitoring
station for the house and activities in the common areas At WDS mealtimes two common areas
were used residents who needed substantial assistance with meals were often fed in the craft room
and a high-functioning group ate at the dining table alongside the fireplace seating
In the houses at other sites most sightings of residents were in the diningliving room areas
Fewer were in the kitchen and fewer still in the house hallways (Table 3) At MDR only one area
adjacent to the kitchen was devoted to dining and almost no residents were seen in kitchens The
same was not true at ASB where approximately the same proportions of residents were seen in the
shared kitchens as in each of the living-dining rooms on either side (Table 3 sums all four living-
dining rooms) However at ASB the numbers were likely from residents moving between the two
diningliving rooms and passing through the kitchens (Figure 1) because residents were rarely
engaged in the type of tasks encouraged at MPN and MPW (ie handling dishes setting tables etc
to encourage maintenance of their functional abilities Figure 7) Interestingly the highly similar sites
found different ways to use their spaces and different approaches to activities
ASB MPW and WDS held barbecues during the days of observation (Table 3) This meant
the residentsrsquo presence in the kitchen and dining areas was reduced at those meals Accordingly for
comparison across sites dining area sightings were adjusted by adding mealtime sightings in the
courtyards The peak periods for resident sightings were during the midday lunch (1130-1330) and
evening meals (1630-1830) (Table 5) Even so sightings of residents at mealtimes were only 66-
80 of occupancy indicating eight to ten residents were not seen at mealtimes in public areas at
most sites (Table 5) The exception was WDS where sightings indicated nearly all residents were
observed in public areas at mealtimes (Table 5) although WDS residents did not gather in the house
Mapping Five Sites
20 of 47
dining areas for the noon meal With most activities occurring in the core of the building WDS was
flexible about meal arrangements serving meals where residents were located such as the area
outside the great room on an activity room Residents were not required to return to their own houses
to eat They could join day program residents and eat in the common area or join residents in another
house One group of women was known for asking to eat together on their own in the common area
WDS also led other sites in the number of residents observed at other times of the day (Table 5) The
differences were especially marked in the afternoon between meals (1330-1630) and the period
after the evening meal (1830-2130) This suggests that WDS staff may have been viewing the
central areas like they would the central areas of a unit in a nursing home on dementia units staff
often prefer that residents stay in view and not return to their rooms
Resident Activity The observed activity patterns were surprising considering high levels of
resident inactivity reported for nursing home residents (Gottesman amp Bourestom 1974 Ice 2002)
Gottesman and Bourestomrsquos (1974) observations in 40 nursing homes revealed that residents spent
56 of their time during peak daylight hours engaged in no activity or passive activity In that study
residents were involved in personal care television and socializing for 43 of the time Ice (2002)
reprised the Gottesman and Bourestom study and found residents spent 65 of their time doing little
or nothing with only 12 in social activities (Ice 2002) In the present study observations of Just
Sitting and Watching were expected to measure levels of passive behaviors Residents in the five
sites appeared to be engaged in ADLs and Leisure for greater amounts of time than in Just Sitting
and Watching (although small amounts of napping as passive behavior were coded as
Miscellaneous) but this was not significant (Figure 7) Chi-square analysis using phi coefficients
found that residents at WDS engaged significantly less in ADLs than residents in other centres
(plt00001) residents at ASB MPN amp WDS were engaged less in leisure (plt005 each) ASB
Mapping Five Sites
21 of 47
residents were engaged less in Just Sitting (plt00005) and residents were observed Watching less at
MDR MPN amp MPW (plt00005 each) Leisure was the most frequently observed activity for MDR
MPN and MPW the second most frequent at ASB and the third at WDS Recreational activities
both planned and informal activities were considered to be Leisure thus watching TV or waiting to
be served at a coffee party were both coded as being Leisure (persons who were within the group and
actively attending to events but not actively engaged at the moment were coded as Leisure too and
this was distinguished from Watching which was defined as ldquoattending to activities or interactions of
others from a distance such as from a doorway watching a streetrdquo)
Insert Figure 7 about here
The ADLs were the second most frequently seen activity for MDR MPN and MPW and the
third for ASB but were seen much less at WDS The majority of ADLs across sites occurred at meal
times indicating they involved dining (ASB 570 MDR 590 MPN 758 MPW 736 but
WDS 422) The low percent of time spent by WDS residents on ADLs during the evening meal
time (42) agrees with the low number of sightings in the dining area at that time (385 of max)
It appears that WDS residents sat watched and walked but did not spend much time eating
(Figure 7) In contrast previous research at MPN and MPW has found mealtimes to be the longest
duration behavior Scans needed to be one hour apart to avoid seeing meals on two consecutive scans
and oversampling the behavior (Milke et al 2000)
Work that is tasks such as housekeeping and cooking were not seen at either of the sites
with 20-capacity houses but this is the only difference evident when compared with the 12-capacity
Mapping Five Sites
22 of 47
houses Compared to other sites MPN and MPW residents engaged in moderate proportions of all
behaviors (Figure 7) Residents at WDS spent proportionately less time on ADLs light
housekeeping and Leisure and more time at Walking Watching and Just Sitting Chi-square
analysis using phi coefficients showed that residents were observed Walking significantly less at
MDR (plt 005) residents at ASB and MDR engaged significantly less in Work and there were no
significant differences between sites in Miscellaneous activities (Figure 7)
Observersrsquo Notes
Some large differences were found in the care programs across sites Observersrsquo notes
indicated that at MPN and MPW residents were encouraged to be involved in the daily routine of the
facility and direct care staff ate meals with residents This strategy was said to stimulate conversation
and provide residents with a model for appropriate behavior Staff played the role of ldquomotherrdquo rising
to find an item in the kitchen and keeping an eye on food consumption Managers at MPN and MPW
considered this role an essential component of care At ASB MDR and WDS there was no evidence
of such a role
Most cooking was done in facility kitchens away from areas that residents could access This
tended to result in the house kitchens being treated more like institutional serveries Fridges mainly
contained large juice jugs and prepared snacks However at MPW and MPN when a resident opened
the fridge door the door was full of condiments and casseroles it looked just like home because of
an effort to keep institutional sized packages to a minimum These two sites used their kitchens quite
differently than the other three sites At MPN and MPW all breakfasts and snacks were prepared in
the houses each day by direct care staff On four weekdays lunches also were prepared Residents
were invited to participate in some of the chopping slicing and mixing which was considered an
essential component of the care program When meals were delivered from nearby facility kitchens
staff decanted items into family-size serving bowls They added condiments and poured drinks
Mapping Five Sites
23 of 47
serving the meals much like those prepared in-house Although residents helping with meal
preparation appeared to be limited to MPN and MPW staff records indicated additional forms of
daily and special occasion activities occurred at all sites Daily activities included easy tasks eg
folding laundry and exercises at all five sites discussion groups at MDR and WDS religious
activities at ASB MPN and MPW musicsinging at ASB MPW and WDS movies at ASB and
grooming at all sites except WDS
Outdoor courtyards were accessible to residents on the observation days at all sites The
barbecue meal at MPW drew the highest number of residents outside but from mid-morning until
early evening residents were seen on the patios or walkways This was true at every site except
MDR where few ventured outside (data not presented)
Disruptive behaviors were seen only at ASB where at 730 am 230 pm and 430 pm a
single resident was disruptive Whether this was the same or different resident is not known the
identity of persons was not recorded This accounted for only 03 of all behaviors seen at ASB (and
was not shown on Figure 7)
Discussion
The TESS-2+scale results clearly indicated that the pioneering WDS site and the four sites
modeled on it met best practice standards in many areas These include the ratings for global site
assessment overall configuration of self-contained living arrangements with adjacent common
spaces informal workspaces for staff and accessible outdoor green spaces walking paths and
maintenance More pertinent to the present study there were no significant differences between the
sites that had 12-capacity houses and those with 20-capacity houses on any TESS items the NIA
subscale of overall environmental quality (SCUEQS) or CAAQS the composite score devised by
Mapping Five Sites
24 of 47
Slaughter et al (2006) Sites with 20-capacity houses did not look substantially different from sites
with 12-capacity houses according to the scale
Behavioral Mapping
A principal finding from behavioral mapping was the amount of time residents were found
engaged in leisure activity at all five sites Leisure was the most frequently observed activity for
MDR MPN and MPW the second most frequent at ASB and the third at WDS The level of
participation in meaningful activities is considered an important measure of residentsrsquo quality of life
(Gonzalez-Salvador et al 2000 Zimmerman et al 2005) Although the extent of engagement is
typically measured in more focused and intensive ways the fact that observers saw residents who
were alert and watching an activity is meaningful because observers were asked to distinguish
whether the resident was ldquojust sittingrdquo or ldquowatchingrdquo if that was the extent of the involvement When
percentages of time spent in Leisure are combined with Activities of Daily Living following the lead
of Gottesman and Bourestom (1974) who combined personal care television and socializing the
results in this study are ASB 468 MDR 701 MPN 471 and MPW 483 All percentages
total are better than the 1974 studyrsquos 43 Only WDS with 261 was substantially worse and that
was largely because so little time was devoted to the evening meal Ice (2002) studying one site had
found only 12 of time spent in social activities however little time was spent Just Sitting or
Watching For the five sites in this study total percentages of these inactive behaviors are ASB
316 MDR 171 MPN 229 MPW 176 and WDS 402 which are all substantially
different than Gottesman and Bourestomrsquos finding of 56 of time engaged in no activity or passive
activity or the 65 seen by (Ice 2002)
Surprisingly the five sites differed in the percent of maximum possible number of sightings
of residents observed in public areas per scan per day ranging from 49 at MDR to 80 at WDS
This range of 38 difference between the lowest and highest sites is considerable The traditional
concern of staff is that residents who stay in their rooms miss out on socialization and planned
Mapping Five Sites
25 of 47
activities (Grade 1976 Hogden 1985) The public areas most frequented by WDS residents were the
fireplace area and the common hallway area At most sites if the residents were not observed in the
common areas it would be likely that they were in the house areas This was confirmed in the other
principal finding that the percent of maximum possible sightings in the house areas was lowest for
WDS at 25 and highest at ASB at 50 At ASB residents spent 80 of their time in their two
houses At WDS they were encouraged to spend their time in the common areas and they did The
houses were used very differently at the two sites and this may have been because the architects who
were very involved in both sites made it evident that they were intended to be used differently
However the use of communal spaces often has little to do with the intended purpose Lawton
(1970) reports that in 10 observational rounds of a facility a total of 13 people were observed in the
nine social rooms on the nine floors while 79 were counted in the main floor social room where
arrivals and departures could be observed Similarly areas around nursing stations and elevators
frequently draw residents (Lawton 1970 Lawton 1977 Snyder 1980)
A number of factors can be ruled out in the search for unique characteristics of WDS that
could have contributed to the above findings The first factor is the reliability of the observers It is
unlikely that the differences were due to variability in the observational skillsprocedures of the
observers because of the high level of agreement in the assessment of interobserver reliability and
because all observers followed the same protocol in collecting the data The observersrsquo reliability was
also attested to by the similarity of the data within sites across the two days of data collection The
second factor is the general floor plan WDS shared the same basic floor plan with MPN and MPW a
building footprint like the capital letter E So it is unlikely that the gross outer shape of the floor plan
was relevant The third more general factor is related to the inter-site comparability of the TESS-2+
data These data indicate that the five sites were remarkably similar in general and internal design
features WDS has ratings on all measures that were comparable to one or more of the other sites
Mapping Five Sites
26 of 47
including potentially relevant measures such as the presence of homelike features the degree of
interaction with staff and residentsrsquo involvement in activities
There are however a number of other factors that may be relevant to understanding the
WDS data WDS was the only site in which meals were served in the common areas as well as in the
house dining rooms Congruently as already noted the highest number of resident sightings at WDS
was in the common areas (fireplace and common hallway) and most of these common area sightings
were in the common areas of WDS adjacent to the central area of the three houses Importantly these
were the only common areas with a direct line of sight to the central hall and kitchen of the central
house (School House) Staff notes indicated that the number of meal servings from the central house
kitchen was twice as high as that of the kitchens of the other two houses at WDS Again there is
congruence resident sightings in the central house dining room although low relative to central
common areas were twice as high as in the dining rooms of the other two houses at WDS It is also
relevant that staff used all parts of the central common area for activity programming Thus it seems
probable that several factors including the internal floor plan meal service and activity
programming made the central common areas of WDS a multiuse area which resulted in high
number of resident sightings though out the day with peaks at meal times It is worth asking whether
WDS staff would have used the central common area so intensely if the house kitchens had been
aligned with the dining rooms providing staff with oversight as in MPN and MPW
These observations could also explain another WDS anomaly that is the low number
of residents seen to be engaged in ADL activities at meal times compared to other sites If the
lower-functioning residents at WDS engaged in other activities in the central common areas
perhaps abandoning a meal to walk or sit elsewhere that could result in fewer observations
of eating during the mealtime Conversely it could mean that it would be more likely that
Mapping Five Sites
27 of 47
other activities (ie watching walking sitting and leisure activities) would be seen during
meal times which was the case in WDS
Finally the unique features of the WDS resident sighting data may have been related to the
greater degree of dementia (lower than average MMSE scores) of WDS residents The average
MMSE scores at other sites were 50 to 100 higher indicating less severe symptoms than the
average WDS score Congruently WDS had relatively high levels of sightings of sitting watching
and walking behavior and the highest number of pacing incidents Thus it is possible that the
differences in degree of dementia between sites and the related differences in levels of ambulation
made it more likely that WDS residents would leave their rooms and therefore WDS residents would
be sighted most frequently in the common areas of the WDS facility
It is important to note that no substantial differences were found between the 20-capacity
and 12-capacity houses that is in the mean domain scores of the TESS which was used to describe
environmental characteristics Scores were much the same across the five sites The TESS has goals
and domains aligned with the general site design which are more architecturally based and those
best aligned with interior design site operations and providing care
The architects might have thought their design at ASB and MDR would result in a small care
group of 10 and that residents along each bedroom hall would form a household but this did not
happen The residents in the 20-capacity houses did not form a 20-resident cluster either instead they
formed small groups for eating and activities Therefore other factors such as early or late rising or
naturally-formed friendships may be a greater influence than bedroom proximity The addition of
eight more residents per house might be anticipated to lead to crowding in the housesrsquo living-dining
areas or some other notable difference However crowding was not evident in the 20-capacity
houses In fact WDS gatherings in the common areas were more apt to be viewed as crowds
Mapping Five Sites
28 of 47
Observations indicated there that Disruptive Behavior often attributed to crowding was rare It
occurred in only one site and therefore could not be associated with a particular design
These observational results combined with the TESS results have broad implications for
future studies The first implication is methodological and the second is empirical Methodologically
the combination of architectural and behavioral measures in studies of facilities for the elderly
highlights the advantages over methodologies that employ only behavioral measures eg Dementia
Care Mapping (Brooker 2005 Fulton Edelman amp Kuhn 2006 Sloane Brooker Cohen et al
2007) and over studies that rely on client interviews (Kane 2003) Empirically 20 residents in a
house is approaching the size of dementia units in some nursing homes The present study revealed
that the main difference seen in the operation of the 12-resident house and the 20-resident house
design was that the latter appeared to hold more activities within the house raising questions about
the value and need for those common spaces whereas the former made more use of the common
spaces for activities In this way behavior was affected by the house design and by the way that staff
chose to organize activities
Mapping Five Sites
29 of 47
References
Benson D M Cameron D Humbach E Servino L amp Gambert S R (1987) Establishment and
impact of a dementia unit within the nursing home Journal of the American Geriatrics Society
35 319-323
Brawley E C (1997) Designing for Alzheimerrsquos disease Strategies for creating better care
environments New York Wiley
Brooker D (2005) Dementia Care Mapping A review of the research literature The Gerontologist
45 Special Issue I 11ndash18
Calkins M P Meehan R A amp Lipstreuer E (1999) Creekview Its history and evaluation
Kirtland OH IDEAS Inc
Colling K B (1999) Passive behaviors in Alzheimer disease A descriptive analysis American
Journal of Alzheimers Disease and Other Dementias 14 27-40
Cronin-Golumb A (1995) Vision in Alzheimerrsquos disease The Gerontologist 35 370-376
Day K Carreon D amp Stump C (2000) The therapeutic design of environments for people with
dementia A review of the empirical research The Gerontologist 40 397-416
Deely B Klingensmith L amp Silverman M (1995) Developing a residential Alzheimers facility
Focus on Geriatric Care and Rehabilitation 8(7) 1-8
DiMotta S Dubney B M Hoglund J D amp Kershner C (1993) Long-term care design Blazing
new territory - code reform and beyond Journal of Healthcare Design 5 197-203
DiMotta S amp Hoglund J D (2000) Woodside Place A residential care model for the Alzheimerrsquos
and dementia resident Symposium on Healthcare Design Anaheim CA Center for Healthcare
Design
Mapping Five Sites
30 of 47
Doty M M Koren M J amp Sturla E L (2008) Culture change in nursing homes How far have
we come Findings from The Commonwealth Fund 2007 National Survey of Nursing Homes
New York The Commonwealth Fund
Edelman P Fulton B R Kuhn D amp Chang C H (2005) A comparison of three methods of
measuring dementia-specific quality of life Perspectives of residents staff and observers The
Gerontologist 45 27-36
Fleiss J L (1981) Statistical methods for rates and proportions (2nd ed) New York John Wiley amp
Son
Folstein M F Folstein S E amp McHugh P R (1975) Mini-Mental State a practical method for
grading the cognitive state of patients for the clinician Journal of Geriatric Research 12 189-
198
Fulton B R Edelman P amp Kuhn D (2006) Streamlined models of dementia care mapping
Aging amp Mental Health 10 343-351
Gold D T (1991) A descriptive typology of dementia units In P D Sloane amp L J Mathew (Eds)
Dementia units in long-term care (pp 50-61) Baltimore Johns Hopkins University Press
Gonzalez-Salvador T Lyketsos C G Baker A Hovanec L Roques C Brandt J et al (2000)
Quality of Life in dementia patients in long-term care International Journal of Geriatric
Psychiatry 15 181-189
Gottesman L E amp Bourestom N C (1974) Why nursing homes do what they do The
Gerontologist 14 501-506
Grade B L (1976) A study of the entry crisis to a nursing home Unpublished masterrsquos thesis
University of Wisconsin Milwaukee
Grant L A (1998) Beyond the dichotomy An empirical typology of Alzheimerrsquos care in nursing
homes Research on Aging 20 569-592
Mapping Five Sites
31 of 47
Greene J A Asp J amp Crane N (1985) Specialized management of the Alzheimerrsquos disease
patient Does it make a difference A preliminary progress report Journal of the Tennessee
Medical Association 78 559-563
Harper G J (1998) Stress and adaptation among elders in life care communities Unpublished
doctoral dissertation Ohio State University Columbus
Hogden K M (1985) Leisurerecreation needs of hospitalized elderly A task force report
Activities Adaptation amp Aging 7 53-65
Hoglund D J amp Ledewitz S D (1999) Designing to meet the needs of people with Alzheimerrsquos
disease In B Schwarz amp R Brent (Eds) Aging autonomy and architecture Advances in
assisted living (pp 229-261) Baltimore John Hopkins University Press
Ice G H (2002) Daily life in a nursing home has it changed in 25 years Journal of Aging Studies
16 345-359
Imamoğlu Ccedil (2007) Assisted living as a new place schema A comparison with homes and nursing
homes Environment and Behavior 39 246-268
Innes A amp Surr C (2001) Measuring the well-being of people with dementia living in formal care
settings The use of Dementia Care Mapping Aging and Mental Health 5 258-268
Kane R A (2003) Definition measurement and correlates of quality of life in nursing homes
Toward a reasonable practice research and policy agenda The Gerontologist 43 Special
Issue II 28ndash36
Kuhn D Kasayka R E amp Lechner C (2002) Behavioral observations and quality life among
persons with dementia in 10 assisted living facilities American Journal of Alzheimerrsquos Disease
and Other Dementias 17 291-298
Lawton M P (1970) Ecology and aging In L A Pastaland amp D H Carson (Eds) The spatial
behavior of older people (pp 41-67) Ann Arbor MI University of Michigan Press
Mapping Five Sites
32 of 47
Lawton M P (1977) The impact of the environment on aging and behavior In K W Schaie (Ed)
Handbook of the Psychology of Aging (pp 276-301) New York Van Nostrand Reinhold
Lawton M P Weisman G D Sloane P amp Calkins M (1997) Assessing environments for older
people with chronic illness Journal of Mental Health and Aging 3 83-100
Lawton M P Weisman G D Sloane P Norris-Baker C Calkins M amp Zimmerman S I
(2000) Professional Environmental Assessment Procedure for special care units for elders with
dementing illness and its relationship to the Therapeutic Environment Screening Schedule
Alzheimer Disease and Associated Disorders 14 28ndash38
Lee M Madden V Mason K Rice S Wyburd J amp Hobson S (2006) Occupational
engagement and adaptation in adults with dementia A preliminary investigation Physical and
Occupational Therapy in Geriatrics 25 63-81
Lehrner P N (1979) Handbook of ethological methods New York Garland STMP
Margulis S T (2003) Privacy as a social issue and behavioral concept Journal of Social Issues 59
243-261
Martin P amp Bateson P (1987) Measuring behaviour An introductory guide New York
Cambridge University Press
Mathew L J amp Sloane P D (1991) Organizing and staffing dementia units In P D Sloane amp L
J Mathew (Eds) Dementia units in long-term care (pp 101-127) Baltimore Johns Hopkins
University Press
McAllister C L amp Silverman M A (1999) Community formation and community roles among
persons with Alzheimerrsquos disease A comparative study of experience in a residential
Alzheimerrsquos facility and a traditional nursing home Qualitative Health Research 9 65-85
McCracken A L amp Fitzwater E (1989) The right environment for Alzheimerrsquos Geriatric
Nursing 10 293-294
Mapping Five Sites
33 of 47
Milke D L (2003) Iterative post-occupancy evaluations of the McConnell Place North design
[Abstract] Proceedings of the 56th Annual Scientific Meeting of the Gerontological Society of
America 43 48 San Diego CA
Milke D L Clark C amp Bucknell M (2000) Assessing the adequacy of residential lighting in two
care centres for persons with Alzheimerrsquos Disease using the new age-adjusted North American
illumination recommendations (Research Report) Ottawa Ontario Canada Canada Mortgage
and Housing Corporation
National Institute on Aging Coordinating Center (1993) NIA collaborative studies special care units
for Alzheimers disease Manual of procedures Davis CA Northern California Alzheimers
Disease Center University of California
Rabig J Thomas W Kane R A Cutler L J amp McAlilly S (2006) Radical redesign of nursing
homes Applying the Green House concept in Tupelo Mississippi The Gerontologist 46 533-
539
Rule B G Milke D L amp Dobbs A R (1992) Design of institutions Cognitive functioning and
social interactions of the aged resident Journal of Applied Gerontology 11 475-488
Saxton J Silverman M Ricci E Keane C amp Deely B (1998) Maintenance of mobility in
residents of an Alzheimer special care facility International Psychogeriatrics 10 213-224
Schwarz B Chaudhury H amp Tofle R B (2004) Effect of design interventions on a dementia care
setting American Journal of Alzheimers Disease and Other Dementias 19 172-176
Silverman M Ricci E Saxton J Ledewitz S McAllister C amp Keane C (1995) Woodside
Place The first three years of a residential Alzheimerrsquos facility (Vols 1-2) Oakmont PA
Presbyterian Senior Care
Skea D amp Lindesay J (1996) An evaluation of two models of long-term residential care for
elderly people with dementia International Journal of Geriatric Psychiatry 11 233-241
Mapping Five Sites
34 of 47
Slaughter S Calkins M Eliasziw M amp Reimer M (2006) Measuring physical and social
environments in nursing homes for people with middle- to late-stage dementia Journal of the
American Geriatrics Society 54 1436-1441
Sloane P D Brooker D Cohen L Douglass C Edelman P Fulton B R et al (2007)
Dementia Care Mapping as a research tool International Journal of Geriatric Psychiatry 22
580-589
Sloane P D Mitchell M Priesser J S Phillips C Commander C amp Burker E (1998)
Environmental correlates of resident agitation in Alzheimerrsquos disease special care units Journal
of the American Geriatric Society 46 862ndash869
Sloane P D Mitchell C M Weisman G Zimmerman S Foley K M L Lynn M et al
(2002) The Therapeutic Environment Screening Survey for Nursing Homes (TESS-NH) An
observational instrument for assessing the physical environment of institutional settings for
persons with dementia Journals of Gerontology Series B Psychological Sciences and Social
Sciences 57B(Suppl 2) S69-S78
Sloane P D Zimmerman S Williams C S Reed P S Gill KS amp Preisser J S (2005)
Evaluating the quality of life of long-term care residents with dementia The Gerontologist 45
37-49
Snyder L G (1980) An exploratory study of patterns of social interaction organization and facility
design in three nursing homes In J Hendricks (Ed) Institutionalization and Alternative Futures
(pp 68-80) Farmingdale NY Baywood Pub Co
Sommer R amp Sommer B B (1986) A practical guide to behavioral research Tools and
techniques (2nd ed) New York Oxford
Van Haitsma K Lawton M P amp Kleban M H (2000) Does segregation help or hinder
Examining the role of heterogeneity in behavioral and emotional aspects of quality of life for
Mapping Five Sites
35 of 47
persons with cognitive impairment in the nursing home Research and Practice in Alzheimerrsquos
Disease 4 163-177
Verbeek H van Rossum E Zwakhalen S M G Kempen G I J M amp Hamers J P H (2009)
Small homelike care environments for older people with dementia A literature review
International Psychogeriatrics 21 252-264
Voelkl J E (2006) Therapeutic environments in nursing homes Fostering residents meaningful
activity engagement Activities Directors Quarterly for Alzheimers and Other Dementia
Patients 7(3) 35-44
Warren S (Ed) (1998) Innovative dementia care McConnell Place North evaluation (Research
Report) Edmonton Alberta Canada Evaluating Programs of Innovative Continuing Care
Zeisel J (1998) The Hearthstone health environments case study Journal of Healthcare Design
Proceedings from the Symposium on Healthcare Design San Francisco CA National
Symposium on Healthcare Design Inc
Zeisel J Hyde J amp Levkoff S (1994) Best practices An environment-behavior (E-B) model for
Alzheimer special care units American Journal of Alzheimerrsquos Care and Related Disorders and
Research and Care 9(2) 4-21
Zimmerman S Sloane P D Williams C S Reed P S Preisser J S Eckert J K et al (2005)
Dementia care and quality of life in assisted living and nursing homes The Gerontologist 45
133-146
Mapping Five Sites
36 of 47
Table 1 Comparison of Architectural Features Across Five Sites
Feature ASB MDR MPN MPW WDS
Total facility square footage 23040 sq ft 27308 sq fta 24750 sq ft 23864 sq ft 21540 sq ft
Size of administration area (offices conference reception etc but not service or employee spaces)
960 sq ft (No entry hall)
1584 sq ft day program offices and program space
1675 sq ft 1629 sq ft 972 sq ft (No entry hall)
Staff (lunch) room 16rsquo x 18rsquo 6rsquo11rdquo x 6rsquo2rdquo 158rsquo x 16rsquo 138rsquo x 16rsquo 95rsquo x 30rsquo (plus)b
Treatment or examination room
No Yes In daycare area
No No Yes In central
areac
Medications storage Central medication cart
Medication room Medication room per house
Medication room per house
Central medication cart
Location of meal preparation
Facility kitchen in administration area
Facility kitchen in administration area
Adjacent nursing home (see house kitchen)
Adjacent nursing home (see house kitchen)
Facility kitchen in administration area
Use of house kitchen Servery snacks Servery snacks Meal preparation for all breakfasts and some lunches servery
Meal preparation for all breakfasts and some lunches servery
Servery snacks
Family dining room or central country kitchen usage
Small group activities family functions by reservation
Small group activities family functions by reservation
Small group meetings Great Room party food preparation family functions by reservation
Small group meetings Great Room party food preparation family functions by reservation
Small group activities family functions by reservation
Houses and capacity 2 20 2 20 3 12 3 12 3 12
Private tubroom Two off the central hallway
Two off the central hallway
One located in each house
One located in each house
None
Private shower areas One per 10 residents located in each wing of each house
One per 10 residents located in each wing of each house
One per resident located in each resident room with the one shared bedroom having a shared shower
One per resident located in each resident room with the one shared bedroom having a shared shower
One per 12 residents located in each house
Resident room doors Split door Split door Split door Regular Split door
Inventory of public rooms and seating capacity (includes all alcoves that can be used for seating and seating areas near exits)
15 165
17 176
15 232
13 219
14 182
Variety and appearance of outdoor Area
2 small (little greenery) 1 medium (mixed hardgreen surfaces) and a large courtyardmdashvery appealing
2 small (much greenery) 1 medium (mixed hardgreen surfaces) 2 large courtyards (1 mixed hardgreen surfaces 1 green) mdash very appealing
3 small (much greenery) 1 large (mostly green courtyard mdash very appealing
3 small (much greenery) and 1 large (mostly green courtyard mdash very appealing
1 small (much greenery) 1 medium (mostly green) and 1 large (mostly green) courtyard mdash very appealing
a Does not include researchteaching wing Total for entire floor space is 40382 sq ft b Room at WDS was not intended as a lounge ie a retreat from work to professionalize the care staff role it was to serve as a place to read and discuss work At other
sites the lunch room also served as a lounge c Room was intended as a multi-purpose room
Mapping Five Sites
37 of 47
Table 2 Therapeutic Environment Screening Scale Items for Goal and Domain Possible Range
Midpoint and Mean in Each Group
Therapeutic Goal and Domain
Item Numbers Range Mid-point ASB amp MDR
20-Capacity Houses MPN MPW amp WDS
12-Capacity Houses
ASB MDR Site Scores
Mean MPN MPW WDS Site Scores
Mean
Safetysecurityhealth
Exit control 2a 2b 2c 2d 2e 2g
2h 3a 3b 0-11 55 2 1 15 1 2 2 17
Maintenance 7b1Dagger 7b2Dagger 7b3Dagger 7b4Dagger 0-8 40 8 8 80 8 8 80
Cleanliness 7a1Dagger 7a2Dagger 7a3 7a4 0-8 40 8 8 80 7 8 8 77
Lack of odorsℓ 9aDagger 9bDagger 0-4 20 4 3 35 4 4 4 40
Safetyℓ 7c1 7c2Dagger 7c3 7c4 8 0-10 60 10 10 100 10 10 10 100
Orientationcuing 19 20ф 27a 27bcDagger
27d 27e 27f 28 29 0-17 85 1212 120 11 9 12 107
Privacycontrol
Privacy 30a 30b 30c 30d 0-4 20 0 0 0 1 2 0 10
Functional ability 16 17a 17b 18Dagger 0-7 35 7 7 70 7 7 7 70
Stimulation
Lighting 21 22a 22bDagger 22cDagger
23a 23b 23c 0-14 70 13 13 130 11 14 13 127
Tactilevisual
stimulation 34 35Dagger 37b 0-16 80 10 6 80 15 14 11 133
Quietness 24a 24b 24c 24d
24eDagger 24f 24g 25 26 0-25 125 21 21 210 19 20 23 207
Physical attractiveness
4a1 4a2 4b1 4b2
4c1 4c2 4d1 4d2 37c 0-34 140 16 15 155 15 16 16 157
Socialization
Homelike
environment 15Dagger 31Dagger 32 0-9 45 9 9 90 9 9 9 90
Resident
appearance 36Dagger
0-2 10 2 2 20 2 2 20
SCUEQS 0-41 - 41 39 40 39 4141 40
CAAQS sect 0-100 - 786 857
Large means represent better physical environment
Dagger Items used to compute the 18-item Special Care Environmental Quality Scale (SCUEQS) 27b and 27c were treated as a single item and item 15 was
misnumbered in the TESS-2+ Revised version (as item 13) ф Item 20 is the percentage of common rooms with signsgraphics floor plans in all sites allowed a view into common rooms (scored as zero) ℓ An item was unintentionally omitted from the TESS-2+ scoring form (10 in Odors and 11 in Safety) sect Composite Above Average Quality Score (CAAQS) represents the percentage of TESS-2+ domains that were above average in quality
Mapping Five Sites
38 of 47
Table 3 Percent of Resident Population Who Were Observed During Behavior Scans
at Each Site in Particular Areasa
AreaSite 20-Capacity Houses 12-Capacity Houses
ASB MDR MPN MPW WDS
Total Areas 608 493 511 564 803
Total Common Areas 62 158 169 200 511
Total Outdoor Areas 46 02 11 56 38
Total House Areas 500 333 331 311 254
House 1 259 168 115 69 62
House 2 241 165 108 128 123
House 3 108 114 69
House Kitchen 149 08 75 53 49
House LivingDining Room 324 278 236 232 200 a Resident data were adjusted to show the mean percent of residents at a site who were observed per scan per day Note Total Areas is the sum of the following Total Common Total Outdoor and Total House Total House Areas is the sum of Houses 1 House 2 and House 3 House Kitchen and LivingDining Rooms are summed across houses Blank cells indicate that the question was not applicable
Mapping Five Sites
39 of 47
Table 4 Percent of Resident Population Who Were Observed During Behavior Scans
at Each Site in Particular Common Areasa
Location 20-Capacity Houses 12-Capacity Houses ASB MDR MPN MPW WDS
Great Room 07 75 94 91 64
Fireplace Seating Area 22 69 43 13 106
ActivityCraft Room 04 47 00 02 10
TV Room ndash ndash 43 64 58
Other TV Area ndash ndash 11 39 ndash
Common Area Hallway Seating 37 108 138 143 396
Music Room ndash ndash 00 ndash 00
Garden Room ndash ndash 00 ndash 04
Beauty Salon 39 12 00 00 00
Family Dining RoomCountry Kitchen 00 09 00 00 00
Total 109 320 329 352 638 a Resident data were adjusted to show the mean percent of residents at a site who were observed per scan per day Note Dashes indicate that residents were not observed in these areas
Mapping Five Sites
40 of 47
Table 5 Percent of Resident Population Who Were Observed During Behavior Scans
at Each Site at Particular Times of Day
Time of Day 20-Capacity Houses 12-Capacity Houses
ASB MDR MPN MPW WDS
Before Lunch 541 360 386 475 654
Lunch 805 663 667 722 1000
Between Meals 657 530 506 589 963
Supper 765 738 744 744 922
After Supper 50 390 447 469 740 a Resident data were adjusted to show the mean percent of residents at a site who were observed per scan per day Note Before Lunch (4 scans-730-1030) Lunch (2 scans-1130 amp 1230) Between Meals (3 scans-1330 to 1530) Supper (2 scans-1630 amp 1730) After Supper (4 scans-1830 to 2130)
Mapping Five Sites
41 of 47
Figure 1 Floor plan of Asbury Place Mt Lebanon PA
Mapping Five Sites
42 of 47
Figure 2 Floor plan of Marjorie Doyle Rockwell Center Cohoes NY
Mapping Five Sites
43 of 47
Figure 3 Floor plan of McConnell Place North Edmonton AB
Mapping Five Sites
44 of 47
Figure 4 Floor plan of McConnell Place West Edmonton AB
Mapping Five Sites
45 of 47
Figure 5 Floor plan of Woodside Place Oakmont PA
Mapping Five Sites
46 of 47
Figure 6
McConnell Place Northordf Residentsrsquo Activities When Alone and in the Presence of Staff
ordf The average MMSE score was 153 at MPN higher than the average across sites 132 + 15 (M+SE) MPN residents appeared not to initiate activities when alone
0
5
10
15
20
25
30
35
40
Alone Day 1 With Staff Day 1 Alone Day 2 With Staff Day 2
Nu
mb
er R
esid
ents
Arts amp Crafts
Chores
CookingBaking
Eating
Exercising
Games
Grooming
Lg Activity Grp
Music Event
Reading
Sm Interaction
Walking
Watching
Watching TV
Other
Mapping Five Sites
47 of 47
Figure 7
Percent of Scans in Which Residents at Each Site Engaged in Particular Behaviors
0
10
20
30
40
50
60
70
80
90
100
ASB MDR MPN MPW WDS
Misc
Just Sit
Watch
Walk
Leisure
Work
ADLs

Mapping Five Sites
15 of 47
(2006) devised another composite score the Composite Above Average Quality Score (CAAQS)
which they found to be more sensitive than the SCUEQS The CAAQS represents the percentage of
domains that were above average in quality It revealed a difference between the sites with 12-
capacity houses (857) and those with 20-capacity houses (786) that was not shown by the
SCUEQS but the difference was not significant
Behavioral Mapping
Reliability The number and category (staff family or resident) of persons observed at each location
was recorded on floor plans in successive behavior scans one hour apart over the course of two
days Interobserver reliability of the scans was assessed at each site Cohenrsquos kappa a measure of
agreement between observers has a range from 0 no agreement to 100 total agreement Fleiss
(1981) characterized a kappa of 4 to 6 as fair 6 to 75 as good and over 75 as excellent There was
good agreement on average between two independent observers on the identification of behaviors
observed Kappa mean (SD) 0851 (04) and excellent agreement on identification of people being
scanned as residents staff family or others kappa mean (SD) 0732 (07)
Observations Fifteen observation periods or scans per day were conducted one per hour during
the two days of observation Examination of the within-site data revealed that the only differences
were day differences in specific scans related to the occurrence of special events eg barbecues
Consequently the data were collapsed across days A scan of about 10 minutes in duration was
required to count people in all public areas Observers minimized the possibility of counting the same
person in more than one room during a scan by following a preplanned path through the building and
working quickly Counts of sightings of staff family and volunteers and residents by hour in each
Mapping Five Sites
16 of 47
area of each site were summed over the two-day period of observation To assist the description of
the findings resident data were subsequently adjusted to show the mean percent of residents at a site
who were observed per scan per day and to show the percent of scans in which residents were
involved in a particular activity or seen in a particular room or area
Staff and Family Observations of staff and family are presented without data as these were
ancillary to the principal focus on residents Staff were seen most often in the house kitchens or
diningliving rooms across all sites except WDS At WDS staff were seen in the kitchens but
seldom in the diningliving rooms In all three sites with 12-capacity houses the central house was a
hub of staff activity with nearly twice as many staff seen in that kitchen (or an adjacent room which
was the dining room in MPN and MPW but was a hallway in WDS) as in the kitchens of the houses
on either side WDS staff were also seen in the seating area outside the great room nearly as much as
in the house kitchens Residents were seldom engaged in an activity when staff were not around eg
see Figure 6 for MPN This is not surprising because persons with Alzheimer disease lose their
ability to initiate activities (Colling 1999 Lee et al 2006) Others have shown that appropriate
environments are not sufficient residents with this disease need activities and all five sites employed
activity coordinators (Grant 1998 Van Haitsma Lawton amp Kleban 2000 Voelkl 2006)
Insert Figure 6 about here
Family members were at some sites as early as 830 am and as late as 930 pm although at
MPN all visits except one were in the afternoon ASB had a family meeting increasing the number
Mapping Five Sites
17 of 47
of sightings of family members to 42 (19 were associated with the meeting) The numbers of
sightings of family members over the two days of observation at other sites were WDS ndash 27 MPN ndash
23 and MDR and MPN ndash 12 each
Insert Tables 3 and 4 about here
Resident Locations Direct observation revealed a pattern of use that was unexpected and not
evident in TESS results Overall resident sightings were at least 25 higher at WDS than at the
other four sites (Table 3) The number of sightings in the common areas of WDS was over 60
greater than those at any other site (Table 3) Residents were most frequently seen in the area just
outside the great room (Table 4) By contrast at all other sites residents spent more time (60 of
sightings) in their houses (Table 4) ASB where residents spent 80 of their time in their houses
represented the extreme in this regard with the other sites being intermediate between ASB and WDS
(Table 4) Differences did not appear to align with whether the houses were of 20- or 12-capacity At
all sites residents were seen most frequently in the common areas outside of the houses with the
common hallways the great room and fireplace seating area accounting for decreasing numbers of
residents in that order (Table 4) however a stylist in the ASB beauty salon drew a crowd showing
how an occasional event can change behavior patterns At the sites with 12-capacity houses and
television rooms those rooms were popular and drew as many residents as the fireplace area
The large percent (396) of residents seen in common areas at WDS was attributable to
sightings in the common hallway and fireplace seating area next to the School House (Figure 5
Table 4) All residents could be gathered in the area which was slightly larger than the great room
Mapping Five Sites
18 of 47
observers noted a continuous round of activities involving groups of varying sizes No other site used
this area as intensely At WDS a day program brought in 8 additional residents and several staff who
ran activities that attracted some residents (discussions newspaper reading crafts) Observers were
asked not to count persons associated with the day program in their tally but the heavy use of the
central space and the day program activities presented there had some influence ASB and MDR also
had day programs that used separate spaces for that purpose so program participants were not seen
Chairs lining the walls in this area of WDS augmenting seating arrangements in front of and on
either side of the fireplace as well as oversized displays of small snapshots on several walls resulted
in an institutional appearance Local lore attributes the lineup of chairs to residents who initiated it
shortly after move-in Staff moved chairs back where the interior designers located them but
residents would pull them back across the corridor in a line until staff gave up
Site differences in the use of the great room were noteworthy ASB appeared to use it only
for church services on a regular basis with ldquoaudience-seatingrdquo left in place from day-to-day
Possibly this was because this great room was relatively distant from the houses (Figure 1) In WDS
MPN and MPW great room seating was rearranged throughout the day to accommodate numerous
events MPN and MPW used the great room like a town hall holding events such as afternoon teas
dances and musical entertainment At MDR small numbers of residents were in the great room
throughout the day but no large gatherings were seen
Within sites the sightings of residents in the houses were distributed fairly evenly across the
houses (Figures 1-5 Table 3) Residents were most often seen in the living-dining rooms and as
noted above staff were most often seen in the adjacent kitchens The exception was WDS where the
house design did not provide a good line of sight for staff between the kitchens and the living-dining
rooms (Figures 4 amp 5) Staff at all other sites could work in kitchens and keep an eye on residents
WDS staff actively encouraged residents to leave dining rooms after a meal and join activities in the
central area likely for two reasons because activities were not planned for the houses and because
Mapping Five Sites
19 of 47
staff working in the houses could not easily monitor a resident who remained in the house living-
dining room WDS staff were rarely seen in the housesrsquo living-dining rooms The School House the
centre house accounted for the majority of residents observed across all houses This kitchen
adjacent to the highly used area just outside the Great Room provided a relatively good monitoring
station for the house and activities in the common areas At WDS mealtimes two common areas
were used residents who needed substantial assistance with meals were often fed in the craft room
and a high-functioning group ate at the dining table alongside the fireplace seating
In the houses at other sites most sightings of residents were in the diningliving room areas
Fewer were in the kitchen and fewer still in the house hallways (Table 3) At MDR only one area
adjacent to the kitchen was devoted to dining and almost no residents were seen in kitchens The
same was not true at ASB where approximately the same proportions of residents were seen in the
shared kitchens as in each of the living-dining rooms on either side (Table 3 sums all four living-
dining rooms) However at ASB the numbers were likely from residents moving between the two
diningliving rooms and passing through the kitchens (Figure 1) because residents were rarely
engaged in the type of tasks encouraged at MPN and MPW (ie handling dishes setting tables etc
to encourage maintenance of their functional abilities Figure 7) Interestingly the highly similar sites
found different ways to use their spaces and different approaches to activities
ASB MPW and WDS held barbecues during the days of observation (Table 3) This meant
the residentsrsquo presence in the kitchen and dining areas was reduced at those meals Accordingly for
comparison across sites dining area sightings were adjusted by adding mealtime sightings in the
courtyards The peak periods for resident sightings were during the midday lunch (1130-1330) and
evening meals (1630-1830) (Table 5) Even so sightings of residents at mealtimes were only 66-
80 of occupancy indicating eight to ten residents were not seen at mealtimes in public areas at
most sites (Table 5) The exception was WDS where sightings indicated nearly all residents were
observed in public areas at mealtimes (Table 5) although WDS residents did not gather in the house
Mapping Five Sites
20 of 47
dining areas for the noon meal With most activities occurring in the core of the building WDS was
flexible about meal arrangements serving meals where residents were located such as the area
outside the great room on an activity room Residents were not required to return to their own houses
to eat They could join day program residents and eat in the common area or join residents in another
house One group of women was known for asking to eat together on their own in the common area
WDS also led other sites in the number of residents observed at other times of the day (Table 5) The
differences were especially marked in the afternoon between meals (1330-1630) and the period
after the evening meal (1830-2130) This suggests that WDS staff may have been viewing the
central areas like they would the central areas of a unit in a nursing home on dementia units staff
often prefer that residents stay in view and not return to their rooms
Resident Activity The observed activity patterns were surprising considering high levels of
resident inactivity reported for nursing home residents (Gottesman amp Bourestom 1974 Ice 2002)
Gottesman and Bourestomrsquos (1974) observations in 40 nursing homes revealed that residents spent
56 of their time during peak daylight hours engaged in no activity or passive activity In that study
residents were involved in personal care television and socializing for 43 of the time Ice (2002)
reprised the Gottesman and Bourestom study and found residents spent 65 of their time doing little
or nothing with only 12 in social activities (Ice 2002) In the present study observations of Just
Sitting and Watching were expected to measure levels of passive behaviors Residents in the five
sites appeared to be engaged in ADLs and Leisure for greater amounts of time than in Just Sitting
and Watching (although small amounts of napping as passive behavior were coded as
Miscellaneous) but this was not significant (Figure 7) Chi-square analysis using phi coefficients
found that residents at WDS engaged significantly less in ADLs than residents in other centres
(plt00001) residents at ASB MPN amp WDS were engaged less in leisure (plt005 each) ASB
Mapping Five Sites
21 of 47
residents were engaged less in Just Sitting (plt00005) and residents were observed Watching less at
MDR MPN amp MPW (plt00005 each) Leisure was the most frequently observed activity for MDR
MPN and MPW the second most frequent at ASB and the third at WDS Recreational activities
both planned and informal activities were considered to be Leisure thus watching TV or waiting to
be served at a coffee party were both coded as being Leisure (persons who were within the group and
actively attending to events but not actively engaged at the moment were coded as Leisure too and
this was distinguished from Watching which was defined as ldquoattending to activities or interactions of
others from a distance such as from a doorway watching a streetrdquo)
Insert Figure 7 about here
The ADLs were the second most frequently seen activity for MDR MPN and MPW and the
third for ASB but were seen much less at WDS The majority of ADLs across sites occurred at meal
times indicating they involved dining (ASB 570 MDR 590 MPN 758 MPW 736 but
WDS 422) The low percent of time spent by WDS residents on ADLs during the evening meal
time (42) agrees with the low number of sightings in the dining area at that time (385 of max)
It appears that WDS residents sat watched and walked but did not spend much time eating
(Figure 7) In contrast previous research at MPN and MPW has found mealtimes to be the longest
duration behavior Scans needed to be one hour apart to avoid seeing meals on two consecutive scans
and oversampling the behavior (Milke et al 2000)
Work that is tasks such as housekeeping and cooking were not seen at either of the sites
with 20-capacity houses but this is the only difference evident when compared with the 12-capacity
Mapping Five Sites
22 of 47
houses Compared to other sites MPN and MPW residents engaged in moderate proportions of all
behaviors (Figure 7) Residents at WDS spent proportionately less time on ADLs light
housekeeping and Leisure and more time at Walking Watching and Just Sitting Chi-square
analysis using phi coefficients showed that residents were observed Walking significantly less at
MDR (plt 005) residents at ASB and MDR engaged significantly less in Work and there were no
significant differences between sites in Miscellaneous activities (Figure 7)
Observersrsquo Notes
Some large differences were found in the care programs across sites Observersrsquo notes
indicated that at MPN and MPW residents were encouraged to be involved in the daily routine of the
facility and direct care staff ate meals with residents This strategy was said to stimulate conversation
and provide residents with a model for appropriate behavior Staff played the role of ldquomotherrdquo rising
to find an item in the kitchen and keeping an eye on food consumption Managers at MPN and MPW
considered this role an essential component of care At ASB MDR and WDS there was no evidence
of such a role
Most cooking was done in facility kitchens away from areas that residents could access This
tended to result in the house kitchens being treated more like institutional serveries Fridges mainly
contained large juice jugs and prepared snacks However at MPW and MPN when a resident opened
the fridge door the door was full of condiments and casseroles it looked just like home because of
an effort to keep institutional sized packages to a minimum These two sites used their kitchens quite
differently than the other three sites At MPN and MPW all breakfasts and snacks were prepared in
the houses each day by direct care staff On four weekdays lunches also were prepared Residents
were invited to participate in some of the chopping slicing and mixing which was considered an
essential component of the care program When meals were delivered from nearby facility kitchens
staff decanted items into family-size serving bowls They added condiments and poured drinks
Mapping Five Sites
23 of 47
serving the meals much like those prepared in-house Although residents helping with meal
preparation appeared to be limited to MPN and MPW staff records indicated additional forms of
daily and special occasion activities occurred at all sites Daily activities included easy tasks eg
folding laundry and exercises at all five sites discussion groups at MDR and WDS religious
activities at ASB MPN and MPW musicsinging at ASB MPW and WDS movies at ASB and
grooming at all sites except WDS
Outdoor courtyards were accessible to residents on the observation days at all sites The
barbecue meal at MPW drew the highest number of residents outside but from mid-morning until
early evening residents were seen on the patios or walkways This was true at every site except
MDR where few ventured outside (data not presented)
Disruptive behaviors were seen only at ASB where at 730 am 230 pm and 430 pm a
single resident was disruptive Whether this was the same or different resident is not known the
identity of persons was not recorded This accounted for only 03 of all behaviors seen at ASB (and
was not shown on Figure 7)
Discussion
The TESS-2+scale results clearly indicated that the pioneering WDS site and the four sites
modeled on it met best practice standards in many areas These include the ratings for global site
assessment overall configuration of self-contained living arrangements with adjacent common
spaces informal workspaces for staff and accessible outdoor green spaces walking paths and
maintenance More pertinent to the present study there were no significant differences between the
sites that had 12-capacity houses and those with 20-capacity houses on any TESS items the NIA
subscale of overall environmental quality (SCUEQS) or CAAQS the composite score devised by
Mapping Five Sites
24 of 47
Slaughter et al (2006) Sites with 20-capacity houses did not look substantially different from sites
with 12-capacity houses according to the scale
Behavioral Mapping
A principal finding from behavioral mapping was the amount of time residents were found
engaged in leisure activity at all five sites Leisure was the most frequently observed activity for
MDR MPN and MPW the second most frequent at ASB and the third at WDS The level of
participation in meaningful activities is considered an important measure of residentsrsquo quality of life
(Gonzalez-Salvador et al 2000 Zimmerman et al 2005) Although the extent of engagement is
typically measured in more focused and intensive ways the fact that observers saw residents who
were alert and watching an activity is meaningful because observers were asked to distinguish
whether the resident was ldquojust sittingrdquo or ldquowatchingrdquo if that was the extent of the involvement When
percentages of time spent in Leisure are combined with Activities of Daily Living following the lead
of Gottesman and Bourestom (1974) who combined personal care television and socializing the
results in this study are ASB 468 MDR 701 MPN 471 and MPW 483 All percentages
total are better than the 1974 studyrsquos 43 Only WDS with 261 was substantially worse and that
was largely because so little time was devoted to the evening meal Ice (2002) studying one site had
found only 12 of time spent in social activities however little time was spent Just Sitting or
Watching For the five sites in this study total percentages of these inactive behaviors are ASB
316 MDR 171 MPN 229 MPW 176 and WDS 402 which are all substantially
different than Gottesman and Bourestomrsquos finding of 56 of time engaged in no activity or passive
activity or the 65 seen by (Ice 2002)
Surprisingly the five sites differed in the percent of maximum possible number of sightings
of residents observed in public areas per scan per day ranging from 49 at MDR to 80 at WDS
This range of 38 difference between the lowest and highest sites is considerable The traditional
concern of staff is that residents who stay in their rooms miss out on socialization and planned
Mapping Five Sites
25 of 47
activities (Grade 1976 Hogden 1985) The public areas most frequented by WDS residents were the
fireplace area and the common hallway area At most sites if the residents were not observed in the
common areas it would be likely that they were in the house areas This was confirmed in the other
principal finding that the percent of maximum possible sightings in the house areas was lowest for
WDS at 25 and highest at ASB at 50 At ASB residents spent 80 of their time in their two
houses At WDS they were encouraged to spend their time in the common areas and they did The
houses were used very differently at the two sites and this may have been because the architects who
were very involved in both sites made it evident that they were intended to be used differently
However the use of communal spaces often has little to do with the intended purpose Lawton
(1970) reports that in 10 observational rounds of a facility a total of 13 people were observed in the
nine social rooms on the nine floors while 79 were counted in the main floor social room where
arrivals and departures could be observed Similarly areas around nursing stations and elevators
frequently draw residents (Lawton 1970 Lawton 1977 Snyder 1980)
A number of factors can be ruled out in the search for unique characteristics of WDS that
could have contributed to the above findings The first factor is the reliability of the observers It is
unlikely that the differences were due to variability in the observational skillsprocedures of the
observers because of the high level of agreement in the assessment of interobserver reliability and
because all observers followed the same protocol in collecting the data The observersrsquo reliability was
also attested to by the similarity of the data within sites across the two days of data collection The
second factor is the general floor plan WDS shared the same basic floor plan with MPN and MPW a
building footprint like the capital letter E So it is unlikely that the gross outer shape of the floor plan
was relevant The third more general factor is related to the inter-site comparability of the TESS-2+
data These data indicate that the five sites were remarkably similar in general and internal design
features WDS has ratings on all measures that were comparable to one or more of the other sites
Mapping Five Sites
26 of 47
including potentially relevant measures such as the presence of homelike features the degree of
interaction with staff and residentsrsquo involvement in activities
There are however a number of other factors that may be relevant to understanding the
WDS data WDS was the only site in which meals were served in the common areas as well as in the
house dining rooms Congruently as already noted the highest number of resident sightings at WDS
was in the common areas (fireplace and common hallway) and most of these common area sightings
were in the common areas of WDS adjacent to the central area of the three houses Importantly these
were the only common areas with a direct line of sight to the central hall and kitchen of the central
house (School House) Staff notes indicated that the number of meal servings from the central house
kitchen was twice as high as that of the kitchens of the other two houses at WDS Again there is
congruence resident sightings in the central house dining room although low relative to central
common areas were twice as high as in the dining rooms of the other two houses at WDS It is also
relevant that staff used all parts of the central common area for activity programming Thus it seems
probable that several factors including the internal floor plan meal service and activity
programming made the central common areas of WDS a multiuse area which resulted in high
number of resident sightings though out the day with peaks at meal times It is worth asking whether
WDS staff would have used the central common area so intensely if the house kitchens had been
aligned with the dining rooms providing staff with oversight as in MPN and MPW
These observations could also explain another WDS anomaly that is the low number
of residents seen to be engaged in ADL activities at meal times compared to other sites If the
lower-functioning residents at WDS engaged in other activities in the central common areas
perhaps abandoning a meal to walk or sit elsewhere that could result in fewer observations
of eating during the mealtime Conversely it could mean that it would be more likely that
Mapping Five Sites
27 of 47
other activities (ie watching walking sitting and leisure activities) would be seen during
meal times which was the case in WDS
Finally the unique features of the WDS resident sighting data may have been related to the
greater degree of dementia (lower than average MMSE scores) of WDS residents The average
MMSE scores at other sites were 50 to 100 higher indicating less severe symptoms than the
average WDS score Congruently WDS had relatively high levels of sightings of sitting watching
and walking behavior and the highest number of pacing incidents Thus it is possible that the
differences in degree of dementia between sites and the related differences in levels of ambulation
made it more likely that WDS residents would leave their rooms and therefore WDS residents would
be sighted most frequently in the common areas of the WDS facility
It is important to note that no substantial differences were found between the 20-capacity
and 12-capacity houses that is in the mean domain scores of the TESS which was used to describe
environmental characteristics Scores were much the same across the five sites The TESS has goals
and domains aligned with the general site design which are more architecturally based and those
best aligned with interior design site operations and providing care
The architects might have thought their design at ASB and MDR would result in a small care
group of 10 and that residents along each bedroom hall would form a household but this did not
happen The residents in the 20-capacity houses did not form a 20-resident cluster either instead they
formed small groups for eating and activities Therefore other factors such as early or late rising or
naturally-formed friendships may be a greater influence than bedroom proximity The addition of
eight more residents per house might be anticipated to lead to crowding in the housesrsquo living-dining
areas or some other notable difference However crowding was not evident in the 20-capacity
houses In fact WDS gatherings in the common areas were more apt to be viewed as crowds
Mapping Five Sites
28 of 47
Observations indicated there that Disruptive Behavior often attributed to crowding was rare It
occurred in only one site and therefore could not be associated with a particular design
These observational results combined with the TESS results have broad implications for
future studies The first implication is methodological and the second is empirical Methodologically
the combination of architectural and behavioral measures in studies of facilities for the elderly
highlights the advantages over methodologies that employ only behavioral measures eg Dementia
Care Mapping (Brooker 2005 Fulton Edelman amp Kuhn 2006 Sloane Brooker Cohen et al
2007) and over studies that rely on client interviews (Kane 2003) Empirically 20 residents in a
house is approaching the size of dementia units in some nursing homes The present study revealed
that the main difference seen in the operation of the 12-resident house and the 20-resident house
design was that the latter appeared to hold more activities within the house raising questions about
the value and need for those common spaces whereas the former made more use of the common
spaces for activities In this way behavior was affected by the house design and by the way that staff
chose to organize activities
Mapping Five Sites
29 of 47
References
Benson D M Cameron D Humbach E Servino L amp Gambert S R (1987) Establishment and
impact of a dementia unit within the nursing home Journal of the American Geriatrics Society
35 319-323
Brawley E C (1997) Designing for Alzheimerrsquos disease Strategies for creating better care
environments New York Wiley
Brooker D (2005) Dementia Care Mapping A review of the research literature The Gerontologist
45 Special Issue I 11ndash18
Calkins M P Meehan R A amp Lipstreuer E (1999) Creekview Its history and evaluation
Kirtland OH IDEAS Inc
Colling K B (1999) Passive behaviors in Alzheimer disease A descriptive analysis American
Journal of Alzheimers Disease and Other Dementias 14 27-40
Cronin-Golumb A (1995) Vision in Alzheimerrsquos disease The Gerontologist 35 370-376
Day K Carreon D amp Stump C (2000) The therapeutic design of environments for people with
dementia A review of the empirical research The Gerontologist 40 397-416
Deely B Klingensmith L amp Silverman M (1995) Developing a residential Alzheimers facility
Focus on Geriatric Care and Rehabilitation 8(7) 1-8
DiMotta S Dubney B M Hoglund J D amp Kershner C (1993) Long-term care design Blazing
new territory - code reform and beyond Journal of Healthcare Design 5 197-203
DiMotta S amp Hoglund J D (2000) Woodside Place A residential care model for the Alzheimerrsquos
and dementia resident Symposium on Healthcare Design Anaheim CA Center for Healthcare
Design
Mapping Five Sites
30 of 47
Doty M M Koren M J amp Sturla E L (2008) Culture change in nursing homes How far have
we come Findings from The Commonwealth Fund 2007 National Survey of Nursing Homes
New York The Commonwealth Fund
Edelman P Fulton B R Kuhn D amp Chang C H (2005) A comparison of three methods of
measuring dementia-specific quality of life Perspectives of residents staff and observers The
Gerontologist 45 27-36
Fleiss J L (1981) Statistical methods for rates and proportions (2nd ed) New York John Wiley amp
Son
Folstein M F Folstein S E amp McHugh P R (1975) Mini-Mental State a practical method for
grading the cognitive state of patients for the clinician Journal of Geriatric Research 12 189-
198
Fulton B R Edelman P amp Kuhn D (2006) Streamlined models of dementia care mapping
Aging amp Mental Health 10 343-351
Gold D T (1991) A descriptive typology of dementia units In P D Sloane amp L J Mathew (Eds)
Dementia units in long-term care (pp 50-61) Baltimore Johns Hopkins University Press
Gonzalez-Salvador T Lyketsos C G Baker A Hovanec L Roques C Brandt J et al (2000)
Quality of Life in dementia patients in long-term care International Journal of Geriatric
Psychiatry 15 181-189
Gottesman L E amp Bourestom N C (1974) Why nursing homes do what they do The
Gerontologist 14 501-506
Grade B L (1976) A study of the entry crisis to a nursing home Unpublished masterrsquos thesis
University of Wisconsin Milwaukee
Grant L A (1998) Beyond the dichotomy An empirical typology of Alzheimerrsquos care in nursing
homes Research on Aging 20 569-592
Mapping Five Sites
31 of 47
Greene J A Asp J amp Crane N (1985) Specialized management of the Alzheimerrsquos disease
patient Does it make a difference A preliminary progress report Journal of the Tennessee
Medical Association 78 559-563
Harper G J (1998) Stress and adaptation among elders in life care communities Unpublished
doctoral dissertation Ohio State University Columbus
Hogden K M (1985) Leisurerecreation needs of hospitalized elderly A task force report
Activities Adaptation amp Aging 7 53-65
Hoglund D J amp Ledewitz S D (1999) Designing to meet the needs of people with Alzheimerrsquos
disease In B Schwarz amp R Brent (Eds) Aging autonomy and architecture Advances in
assisted living (pp 229-261) Baltimore John Hopkins University Press
Ice G H (2002) Daily life in a nursing home has it changed in 25 years Journal of Aging Studies
16 345-359
Imamoğlu Ccedil (2007) Assisted living as a new place schema A comparison with homes and nursing
homes Environment and Behavior 39 246-268
Innes A amp Surr C (2001) Measuring the well-being of people with dementia living in formal care
settings The use of Dementia Care Mapping Aging and Mental Health 5 258-268
Kane R A (2003) Definition measurement and correlates of quality of life in nursing homes
Toward a reasonable practice research and policy agenda The Gerontologist 43 Special
Issue II 28ndash36
Kuhn D Kasayka R E amp Lechner C (2002) Behavioral observations and quality life among
persons with dementia in 10 assisted living facilities American Journal of Alzheimerrsquos Disease
and Other Dementias 17 291-298
Lawton M P (1970) Ecology and aging In L A Pastaland amp D H Carson (Eds) The spatial
behavior of older people (pp 41-67) Ann Arbor MI University of Michigan Press
Mapping Five Sites
32 of 47
Lawton M P (1977) The impact of the environment on aging and behavior In K W Schaie (Ed)
Handbook of the Psychology of Aging (pp 276-301) New York Van Nostrand Reinhold
Lawton M P Weisman G D Sloane P amp Calkins M (1997) Assessing environments for older
people with chronic illness Journal of Mental Health and Aging 3 83-100
Lawton M P Weisman G D Sloane P Norris-Baker C Calkins M amp Zimmerman S I
(2000) Professional Environmental Assessment Procedure for special care units for elders with
dementing illness and its relationship to the Therapeutic Environment Screening Schedule
Alzheimer Disease and Associated Disorders 14 28ndash38
Lee M Madden V Mason K Rice S Wyburd J amp Hobson S (2006) Occupational
engagement and adaptation in adults with dementia A preliminary investigation Physical and
Occupational Therapy in Geriatrics 25 63-81
Lehrner P N (1979) Handbook of ethological methods New York Garland STMP
Margulis S T (2003) Privacy as a social issue and behavioral concept Journal of Social Issues 59
243-261
Martin P amp Bateson P (1987) Measuring behaviour An introductory guide New York
Cambridge University Press
Mathew L J amp Sloane P D (1991) Organizing and staffing dementia units In P D Sloane amp L
J Mathew (Eds) Dementia units in long-term care (pp 101-127) Baltimore Johns Hopkins
University Press
McAllister C L amp Silverman M A (1999) Community formation and community roles among
persons with Alzheimerrsquos disease A comparative study of experience in a residential
Alzheimerrsquos facility and a traditional nursing home Qualitative Health Research 9 65-85
McCracken A L amp Fitzwater E (1989) The right environment for Alzheimerrsquos Geriatric
Nursing 10 293-294
Mapping Five Sites
33 of 47
Milke D L (2003) Iterative post-occupancy evaluations of the McConnell Place North design
[Abstract] Proceedings of the 56th Annual Scientific Meeting of the Gerontological Society of
America 43 48 San Diego CA
Milke D L Clark C amp Bucknell M (2000) Assessing the adequacy of residential lighting in two
care centres for persons with Alzheimerrsquos Disease using the new age-adjusted North American
illumination recommendations (Research Report) Ottawa Ontario Canada Canada Mortgage
and Housing Corporation
National Institute on Aging Coordinating Center (1993) NIA collaborative studies special care units
for Alzheimers disease Manual of procedures Davis CA Northern California Alzheimers
Disease Center University of California
Rabig J Thomas W Kane R A Cutler L J amp McAlilly S (2006) Radical redesign of nursing
homes Applying the Green House concept in Tupelo Mississippi The Gerontologist 46 533-
539
Rule B G Milke D L amp Dobbs A R (1992) Design of institutions Cognitive functioning and
social interactions of the aged resident Journal of Applied Gerontology 11 475-488
Saxton J Silverman M Ricci E Keane C amp Deely B (1998) Maintenance of mobility in
residents of an Alzheimer special care facility International Psychogeriatrics 10 213-224
Schwarz B Chaudhury H amp Tofle R B (2004) Effect of design interventions on a dementia care
setting American Journal of Alzheimers Disease and Other Dementias 19 172-176
Silverman M Ricci E Saxton J Ledewitz S McAllister C amp Keane C (1995) Woodside
Place The first three years of a residential Alzheimerrsquos facility (Vols 1-2) Oakmont PA
Presbyterian Senior Care
Skea D amp Lindesay J (1996) An evaluation of two models of long-term residential care for
elderly people with dementia International Journal of Geriatric Psychiatry 11 233-241
Mapping Five Sites
34 of 47
Slaughter S Calkins M Eliasziw M amp Reimer M (2006) Measuring physical and social
environments in nursing homes for people with middle- to late-stage dementia Journal of the
American Geriatrics Society 54 1436-1441
Sloane P D Brooker D Cohen L Douglass C Edelman P Fulton B R et al (2007)
Dementia Care Mapping as a research tool International Journal of Geriatric Psychiatry 22
580-589
Sloane P D Mitchell M Priesser J S Phillips C Commander C amp Burker E (1998)
Environmental correlates of resident agitation in Alzheimerrsquos disease special care units Journal
of the American Geriatric Society 46 862ndash869
Sloane P D Mitchell C M Weisman G Zimmerman S Foley K M L Lynn M et al
(2002) The Therapeutic Environment Screening Survey for Nursing Homes (TESS-NH) An
observational instrument for assessing the physical environment of institutional settings for
persons with dementia Journals of Gerontology Series B Psychological Sciences and Social
Sciences 57B(Suppl 2) S69-S78
Sloane P D Zimmerman S Williams C S Reed P S Gill KS amp Preisser J S (2005)
Evaluating the quality of life of long-term care residents with dementia The Gerontologist 45
37-49
Snyder L G (1980) An exploratory study of patterns of social interaction organization and facility
design in three nursing homes In J Hendricks (Ed) Institutionalization and Alternative Futures
(pp 68-80) Farmingdale NY Baywood Pub Co
Sommer R amp Sommer B B (1986) A practical guide to behavioral research Tools and
techniques (2nd ed) New York Oxford
Van Haitsma K Lawton M P amp Kleban M H (2000) Does segregation help or hinder
Examining the role of heterogeneity in behavioral and emotional aspects of quality of life for
Mapping Five Sites
35 of 47
persons with cognitive impairment in the nursing home Research and Practice in Alzheimerrsquos
Disease 4 163-177
Verbeek H van Rossum E Zwakhalen S M G Kempen G I J M amp Hamers J P H (2009)
Small homelike care environments for older people with dementia A literature review
International Psychogeriatrics 21 252-264
Voelkl J E (2006) Therapeutic environments in nursing homes Fostering residents meaningful
activity engagement Activities Directors Quarterly for Alzheimers and Other Dementia
Patients 7(3) 35-44
Warren S (Ed) (1998) Innovative dementia care McConnell Place North evaluation (Research
Report) Edmonton Alberta Canada Evaluating Programs of Innovative Continuing Care
Zeisel J (1998) The Hearthstone health environments case study Journal of Healthcare Design
Proceedings from the Symposium on Healthcare Design San Francisco CA National
Symposium on Healthcare Design Inc
Zeisel J Hyde J amp Levkoff S (1994) Best practices An environment-behavior (E-B) model for
Alzheimer special care units American Journal of Alzheimerrsquos Care and Related Disorders and
Research and Care 9(2) 4-21
Zimmerman S Sloane P D Williams C S Reed P S Preisser J S Eckert J K et al (2005)
Dementia care and quality of life in assisted living and nursing homes The Gerontologist 45
133-146
Mapping Five Sites
36 of 47
Table 1 Comparison of Architectural Features Across Five Sites
Feature ASB MDR MPN MPW WDS
Total facility square footage 23040 sq ft 27308 sq fta 24750 sq ft 23864 sq ft 21540 sq ft
Size of administration area (offices conference reception etc but not service or employee spaces)
960 sq ft (No entry hall)
1584 sq ft day program offices and program space
1675 sq ft 1629 sq ft 972 sq ft (No entry hall)
Staff (lunch) room 16rsquo x 18rsquo 6rsquo11rdquo x 6rsquo2rdquo 158rsquo x 16rsquo 138rsquo x 16rsquo 95rsquo x 30rsquo (plus)b
Treatment or examination room
No Yes In daycare area
No No Yes In central
areac
Medications storage Central medication cart
Medication room Medication room per house
Medication room per house
Central medication cart
Location of meal preparation
Facility kitchen in administration area
Facility kitchen in administration area
Adjacent nursing home (see house kitchen)
Adjacent nursing home (see house kitchen)
Facility kitchen in administration area
Use of house kitchen Servery snacks Servery snacks Meal preparation for all breakfasts and some lunches servery
Meal preparation for all breakfasts and some lunches servery
Servery snacks
Family dining room or central country kitchen usage
Small group activities family functions by reservation
Small group activities family functions by reservation
Small group meetings Great Room party food preparation family functions by reservation
Small group meetings Great Room party food preparation family functions by reservation
Small group activities family functions by reservation
Houses and capacity 2 20 2 20 3 12 3 12 3 12
Private tubroom Two off the central hallway
Two off the central hallway
One located in each house
One located in each house
None
Private shower areas One per 10 residents located in each wing of each house
One per 10 residents located in each wing of each house
One per resident located in each resident room with the one shared bedroom having a shared shower
One per resident located in each resident room with the one shared bedroom having a shared shower
One per 12 residents located in each house
Resident room doors Split door Split door Split door Regular Split door
Inventory of public rooms and seating capacity (includes all alcoves that can be used for seating and seating areas near exits)
15 165
17 176
15 232
13 219
14 182
Variety and appearance of outdoor Area
2 small (little greenery) 1 medium (mixed hardgreen surfaces) and a large courtyardmdashvery appealing
2 small (much greenery) 1 medium (mixed hardgreen surfaces) 2 large courtyards (1 mixed hardgreen surfaces 1 green) mdash very appealing
3 small (much greenery) 1 large (mostly green courtyard mdash very appealing
3 small (much greenery) and 1 large (mostly green courtyard mdash very appealing
1 small (much greenery) 1 medium (mostly green) and 1 large (mostly green) courtyard mdash very appealing
a Does not include researchteaching wing Total for entire floor space is 40382 sq ft b Room at WDS was not intended as a lounge ie a retreat from work to professionalize the care staff role it was to serve as a place to read and discuss work At other
sites the lunch room also served as a lounge c Room was intended as a multi-purpose room
Mapping Five Sites
37 of 47
Table 2 Therapeutic Environment Screening Scale Items for Goal and Domain Possible Range
Midpoint and Mean in Each Group
Therapeutic Goal and Domain
Item Numbers Range Mid-point ASB amp MDR
20-Capacity Houses MPN MPW amp WDS
12-Capacity Houses
ASB MDR Site Scores
Mean MPN MPW WDS Site Scores
Mean
Safetysecurityhealth
Exit control 2a 2b 2c 2d 2e 2g
2h 3a 3b 0-11 55 2 1 15 1 2 2 17
Maintenance 7b1Dagger 7b2Dagger 7b3Dagger 7b4Dagger 0-8 40 8 8 80 8 8 80
Cleanliness 7a1Dagger 7a2Dagger 7a3 7a4 0-8 40 8 8 80 7 8 8 77
Lack of odorsℓ 9aDagger 9bDagger 0-4 20 4 3 35 4 4 4 40
Safetyℓ 7c1 7c2Dagger 7c3 7c4 8 0-10 60 10 10 100 10 10 10 100
Orientationcuing 19 20ф 27a 27bcDagger
27d 27e 27f 28 29 0-17 85 1212 120 11 9 12 107
Privacycontrol
Privacy 30a 30b 30c 30d 0-4 20 0 0 0 1 2 0 10
Functional ability 16 17a 17b 18Dagger 0-7 35 7 7 70 7 7 7 70
Stimulation
Lighting 21 22a 22bDagger 22cDagger
23a 23b 23c 0-14 70 13 13 130 11 14 13 127
Tactilevisual
stimulation 34 35Dagger 37b 0-16 80 10 6 80 15 14 11 133
Quietness 24a 24b 24c 24d
24eDagger 24f 24g 25 26 0-25 125 21 21 210 19 20 23 207
Physical attractiveness
4a1 4a2 4b1 4b2
4c1 4c2 4d1 4d2 37c 0-34 140 16 15 155 15 16 16 157
Socialization
Homelike
environment 15Dagger 31Dagger 32 0-9 45 9 9 90 9 9 9 90
Resident
appearance 36Dagger
0-2 10 2 2 20 2 2 20
SCUEQS 0-41 - 41 39 40 39 4141 40
CAAQS sect 0-100 - 786 857
Large means represent better physical environment
Dagger Items used to compute the 18-item Special Care Environmental Quality Scale (SCUEQS) 27b and 27c were treated as a single item and item 15 was
misnumbered in the TESS-2+ Revised version (as item 13) ф Item 20 is the percentage of common rooms with signsgraphics floor plans in all sites allowed a view into common rooms (scored as zero) ℓ An item was unintentionally omitted from the TESS-2+ scoring form (10 in Odors and 11 in Safety) sect Composite Above Average Quality Score (CAAQS) represents the percentage of TESS-2+ domains that were above average in quality
Mapping Five Sites
38 of 47
Table 3 Percent of Resident Population Who Were Observed During Behavior Scans
at Each Site in Particular Areasa
AreaSite 20-Capacity Houses 12-Capacity Houses
ASB MDR MPN MPW WDS
Total Areas 608 493 511 564 803
Total Common Areas 62 158 169 200 511
Total Outdoor Areas 46 02 11 56 38
Total House Areas 500 333 331 311 254
House 1 259 168 115 69 62
House 2 241 165 108 128 123
House 3 108 114 69
House Kitchen 149 08 75 53 49
House LivingDining Room 324 278 236 232 200 a Resident data were adjusted to show the mean percent of residents at a site who were observed per scan per day Note Total Areas is the sum of the following Total Common Total Outdoor and Total House Total House Areas is the sum of Houses 1 House 2 and House 3 House Kitchen and LivingDining Rooms are summed across houses Blank cells indicate that the question was not applicable
Mapping Five Sites
39 of 47
Table 4 Percent of Resident Population Who Were Observed During Behavior Scans
at Each Site in Particular Common Areasa
Location 20-Capacity Houses 12-Capacity Houses ASB MDR MPN MPW WDS
Great Room 07 75 94 91 64
Fireplace Seating Area 22 69 43 13 106
ActivityCraft Room 04 47 00 02 10
TV Room ndash ndash 43 64 58
Other TV Area ndash ndash 11 39 ndash
Common Area Hallway Seating 37 108 138 143 396
Music Room ndash ndash 00 ndash 00
Garden Room ndash ndash 00 ndash 04
Beauty Salon 39 12 00 00 00
Family Dining RoomCountry Kitchen 00 09 00 00 00
Total 109 320 329 352 638 a Resident data were adjusted to show the mean percent of residents at a site who were observed per scan per day Note Dashes indicate that residents were not observed in these areas
Mapping Five Sites
40 of 47
Table 5 Percent of Resident Population Who Were Observed During Behavior Scans
at Each Site at Particular Times of Day
Time of Day 20-Capacity Houses 12-Capacity Houses
ASB MDR MPN MPW WDS
Before Lunch 541 360 386 475 654
Lunch 805 663 667 722 1000
Between Meals 657 530 506 589 963
Supper 765 738 744 744 922
After Supper 50 390 447 469 740 a Resident data were adjusted to show the mean percent of residents at a site who were observed per scan per day Note Before Lunch (4 scans-730-1030) Lunch (2 scans-1130 amp 1230) Between Meals (3 scans-1330 to 1530) Supper (2 scans-1630 amp 1730) After Supper (4 scans-1830 to 2130)
Mapping Five Sites
41 of 47
Figure 1 Floor plan of Asbury Place Mt Lebanon PA
Mapping Five Sites
42 of 47
Figure 2 Floor plan of Marjorie Doyle Rockwell Center Cohoes NY
Mapping Five Sites
43 of 47
Figure 3 Floor plan of McConnell Place North Edmonton AB
Mapping Five Sites
44 of 47
Figure 4 Floor plan of McConnell Place West Edmonton AB
Mapping Five Sites
45 of 47
Figure 5 Floor plan of Woodside Place Oakmont PA
Mapping Five Sites
46 of 47
Figure 6
McConnell Place Northordf Residentsrsquo Activities When Alone and in the Presence of Staff
ordf The average MMSE score was 153 at MPN higher than the average across sites 132 + 15 (M+SE) MPN residents appeared not to initiate activities when alone
0
5
10
15
20
25
30
35
40
Alone Day 1 With Staff Day 1 Alone Day 2 With Staff Day 2
Nu
mb
er R
esid
ents
Arts amp Crafts
Chores
CookingBaking
Eating
Exercising
Games
Grooming
Lg Activity Grp
Music Event
Reading
Sm Interaction
Walking
Watching
Watching TV
Other
Mapping Five Sites
47 of 47
Figure 7
Percent of Scans in Which Residents at Each Site Engaged in Particular Behaviors
0
10
20
30
40
50
60
70
80
90
100
ASB MDR MPN MPW WDS
Misc
Just Sit
Watch
Walk
Leisure
Work
ADLs
Mapping Five Sites
17 of 47
of sightings of family members to 42 (19 were associated with the meeting) The numbers of
sightings of family members over the two days of observation at other sites were WDS ndash 27 MPN ndash
23 and MDR and MPN ndash 12 each
Insert Tables 3 and 4 about here
Resident Locations Direct observation revealed a pattern of use that was unexpected and not
evident in TESS results Overall resident sightings were at least 25 higher at WDS than at the
other four sites (Table 3) The number of sightings in the common areas of WDS was over 60
greater than those at any other site (Table 3) Residents were most frequently seen in the area just
outside the great room (Table 4) By contrast at all other sites residents spent more time (60 of
sightings) in their houses (Table 4) ASB where residents spent 80 of their time in their houses
represented the extreme in this regard with the other sites being intermediate between ASB and WDS
(Table 4) Differences did not appear to align with whether the houses were of 20- or 12-capacity At
all sites residents were seen most frequently in the common areas outside of the houses with the
common hallways the great room and fireplace seating area accounting for decreasing numbers of
residents in that order (Table 4) however a stylist in the ASB beauty salon drew a crowd showing
how an occasional event can change behavior patterns At the sites with 12-capacity houses and
television rooms those rooms were popular and drew as many residents as the fireplace area
The large percent (396) of residents seen in common areas at WDS was attributable to
sightings in the common hallway and fireplace seating area next to the School House (Figure 5
Table 4) All residents could be gathered in the area which was slightly larger than the great room
Mapping Five Sites
18 of 47
observers noted a continuous round of activities involving groups of varying sizes No other site used
this area as intensely At WDS a day program brought in 8 additional residents and several staff who
ran activities that attracted some residents (discussions newspaper reading crafts) Observers were
asked not to count persons associated with the day program in their tally but the heavy use of the
central space and the day program activities presented there had some influence ASB and MDR also
had day programs that used separate spaces for that purpose so program participants were not seen
Chairs lining the walls in this area of WDS augmenting seating arrangements in front of and on
either side of the fireplace as well as oversized displays of small snapshots on several walls resulted
in an institutional appearance Local lore attributes the lineup of chairs to residents who initiated it
shortly after move-in Staff moved chairs back where the interior designers located them but
residents would pull them back across the corridor in a line until staff gave up
Site differences in the use of the great room were noteworthy ASB appeared to use it only
for church services on a regular basis with ldquoaudience-seatingrdquo left in place from day-to-day
Possibly this was because this great room was relatively distant from the houses (Figure 1) In WDS
MPN and MPW great room seating was rearranged throughout the day to accommodate numerous
events MPN and MPW used the great room like a town hall holding events such as afternoon teas
dances and musical entertainment At MDR small numbers of residents were in the great room
throughout the day but no large gatherings were seen
Within sites the sightings of residents in the houses were distributed fairly evenly across the
houses (Figures 1-5 Table 3) Residents were most often seen in the living-dining rooms and as
noted above staff were most often seen in the adjacent kitchens The exception was WDS where the
house design did not provide a good line of sight for staff between the kitchens and the living-dining
rooms (Figures 4 amp 5) Staff at all other sites could work in kitchens and keep an eye on residents
WDS staff actively encouraged residents to leave dining rooms after a meal and join activities in the
central area likely for two reasons because activities were not planned for the houses and because
Mapping Five Sites
19 of 47
staff working in the houses could not easily monitor a resident who remained in the house living-
dining room WDS staff were rarely seen in the housesrsquo living-dining rooms The School House the
centre house accounted for the majority of residents observed across all houses This kitchen
adjacent to the highly used area just outside the Great Room provided a relatively good monitoring
station for the house and activities in the common areas At WDS mealtimes two common areas
were used residents who needed substantial assistance with meals were often fed in the craft room
and a high-functioning group ate at the dining table alongside the fireplace seating
In the houses at other sites most sightings of residents were in the diningliving room areas
Fewer were in the kitchen and fewer still in the house hallways (Table 3) At MDR only one area
adjacent to the kitchen was devoted to dining and almost no residents were seen in kitchens The
same was not true at ASB where approximately the same proportions of residents were seen in the
shared kitchens as in each of the living-dining rooms on either side (Table 3 sums all four living-
dining rooms) However at ASB the numbers were likely from residents moving between the two
diningliving rooms and passing through the kitchens (Figure 1) because residents were rarely
engaged in the type of tasks encouraged at MPN and MPW (ie handling dishes setting tables etc
to encourage maintenance of their functional abilities Figure 7) Interestingly the highly similar sites
found different ways to use their spaces and different approaches to activities
ASB MPW and WDS held barbecues during the days of observation (Table 3) This meant
the residentsrsquo presence in the kitchen and dining areas was reduced at those meals Accordingly for
comparison across sites dining area sightings were adjusted by adding mealtime sightings in the
courtyards The peak periods for resident sightings were during the midday lunch (1130-1330) and
evening meals (1630-1830) (Table 5) Even so sightings of residents at mealtimes were only 66-
80 of occupancy indicating eight to ten residents were not seen at mealtimes in public areas at
most sites (Table 5) The exception was WDS where sightings indicated nearly all residents were
observed in public areas at mealtimes (Table 5) although WDS residents did not gather in the house
Mapping Five Sites
20 of 47
dining areas for the noon meal With most activities occurring in the core of the building WDS was
flexible about meal arrangements serving meals where residents were located such as the area
outside the great room on an activity room Residents were not required to return to their own houses
to eat They could join day program residents and eat in the common area or join residents in another
house One group of women was known for asking to eat together on their own in the common area
WDS also led other sites in the number of residents observed at other times of the day (Table 5) The
differences were especially marked in the afternoon between meals (1330-1630) and the period
after the evening meal (1830-2130) This suggests that WDS staff may have been viewing the
central areas like they would the central areas of a unit in a nursing home on dementia units staff
often prefer that residents stay in view and not return to their rooms
Resident Activity The observed activity patterns were surprising considering high levels of
resident inactivity reported for nursing home residents (Gottesman amp Bourestom 1974 Ice 2002)
Gottesman and Bourestomrsquos (1974) observations in 40 nursing homes revealed that residents spent
56 of their time during peak daylight hours engaged in no activity or passive activity In that study
residents were involved in personal care television and socializing for 43 of the time Ice (2002)
reprised the Gottesman and Bourestom study and found residents spent 65 of their time doing little
or nothing with only 12 in social activities (Ice 2002) In the present study observations of Just
Sitting and Watching were expected to measure levels of passive behaviors Residents in the five
sites appeared to be engaged in ADLs and Leisure for greater amounts of time than in Just Sitting
and Watching (although small amounts of napping as passive behavior were coded as
Miscellaneous) but this was not significant (Figure 7) Chi-square analysis using phi coefficients
found that residents at WDS engaged significantly less in ADLs than residents in other centres
(plt00001) residents at ASB MPN amp WDS were engaged less in leisure (plt005 each) ASB
Mapping Five Sites
21 of 47
residents were engaged less in Just Sitting (plt00005) and residents were observed Watching less at
MDR MPN amp MPW (plt00005 each) Leisure was the most frequently observed activity for MDR
MPN and MPW the second most frequent at ASB and the third at WDS Recreational activities
both planned and informal activities were considered to be Leisure thus watching TV or waiting to
be served at a coffee party were both coded as being Leisure (persons who were within the group and
actively attending to events but not actively engaged at the moment were coded as Leisure too and
this was distinguished from Watching which was defined as ldquoattending to activities or interactions of
others from a distance such as from a doorway watching a streetrdquo)
Insert Figure 7 about here
The ADLs were the second most frequently seen activity for MDR MPN and MPW and the
third for ASB but were seen much less at WDS The majority of ADLs across sites occurred at meal
times indicating they involved dining (ASB 570 MDR 590 MPN 758 MPW 736 but
WDS 422) The low percent of time spent by WDS residents on ADLs during the evening meal
time (42) agrees with the low number of sightings in the dining area at that time (385 of max)
It appears that WDS residents sat watched and walked but did not spend much time eating
(Figure 7) In contrast previous research at MPN and MPW has found mealtimes to be the longest
duration behavior Scans needed to be one hour apart to avoid seeing meals on two consecutive scans
and oversampling the behavior (Milke et al 2000)
Work that is tasks such as housekeeping and cooking were not seen at either of the sites
with 20-capacity houses but this is the only difference evident when compared with the 12-capacity
Mapping Five Sites
22 of 47
houses Compared to other sites MPN and MPW residents engaged in moderate proportions of all
behaviors (Figure 7) Residents at WDS spent proportionately less time on ADLs light
housekeeping and Leisure and more time at Walking Watching and Just Sitting Chi-square
analysis using phi coefficients showed that residents were observed Walking significantly less at
MDR (plt 005) residents at ASB and MDR engaged significantly less in Work and there were no
significant differences between sites in Miscellaneous activities (Figure 7)
Observersrsquo Notes
Some large differences were found in the care programs across sites Observersrsquo notes
indicated that at MPN and MPW residents were encouraged to be involved in the daily routine of the
facility and direct care staff ate meals with residents This strategy was said to stimulate conversation
and provide residents with a model for appropriate behavior Staff played the role of ldquomotherrdquo rising
to find an item in the kitchen and keeping an eye on food consumption Managers at MPN and MPW
considered this role an essential component of care At ASB MDR and WDS there was no evidence
of such a role
Most cooking was done in facility kitchens away from areas that residents could access This
tended to result in the house kitchens being treated more like institutional serveries Fridges mainly
contained large juice jugs and prepared snacks However at MPW and MPN when a resident opened
the fridge door the door was full of condiments and casseroles it looked just like home because of
an effort to keep institutional sized packages to a minimum These two sites used their kitchens quite
differently than the other three sites At MPN and MPW all breakfasts and snacks were prepared in
the houses each day by direct care staff On four weekdays lunches also were prepared Residents
were invited to participate in some of the chopping slicing and mixing which was considered an
essential component of the care program When meals were delivered from nearby facility kitchens
staff decanted items into family-size serving bowls They added condiments and poured drinks
Mapping Five Sites
23 of 47
serving the meals much like those prepared in-house Although residents helping with meal
preparation appeared to be limited to MPN and MPW staff records indicated additional forms of
daily and special occasion activities occurred at all sites Daily activities included easy tasks eg
folding laundry and exercises at all five sites discussion groups at MDR and WDS religious
activities at ASB MPN and MPW musicsinging at ASB MPW and WDS movies at ASB and
grooming at all sites except WDS
Outdoor courtyards were accessible to residents on the observation days at all sites The
barbecue meal at MPW drew the highest number of residents outside but from mid-morning until
early evening residents were seen on the patios or walkways This was true at every site except
MDR where few ventured outside (data not presented)
Disruptive behaviors were seen only at ASB where at 730 am 230 pm and 430 pm a
single resident was disruptive Whether this was the same or different resident is not known the
identity of persons was not recorded This accounted for only 03 of all behaviors seen at ASB (and
was not shown on Figure 7)
Discussion
The TESS-2+scale results clearly indicated that the pioneering WDS site and the four sites
modeled on it met best practice standards in many areas These include the ratings for global site
assessment overall configuration of self-contained living arrangements with adjacent common
spaces informal workspaces for staff and accessible outdoor green spaces walking paths and
maintenance More pertinent to the present study there were no significant differences between the
sites that had 12-capacity houses and those with 20-capacity houses on any TESS items the NIA
subscale of overall environmental quality (SCUEQS) or CAAQS the composite score devised by
Mapping Five Sites
24 of 47
Slaughter et al (2006) Sites with 20-capacity houses did not look substantially different from sites
with 12-capacity houses according to the scale
Behavioral Mapping
A principal finding from behavioral mapping was the amount of time residents were found
engaged in leisure activity at all five sites Leisure was the most frequently observed activity for
MDR MPN and MPW the second most frequent at ASB and the third at WDS The level of
participation in meaningful activities is considered an important measure of residentsrsquo quality of life
(Gonzalez-Salvador et al 2000 Zimmerman et al 2005) Although the extent of engagement is
typically measured in more focused and intensive ways the fact that observers saw residents who
were alert and watching an activity is meaningful because observers were asked to distinguish
whether the resident was ldquojust sittingrdquo or ldquowatchingrdquo if that was the extent of the involvement When
percentages of time spent in Leisure are combined with Activities of Daily Living following the lead
of Gottesman and Bourestom (1974) who combined personal care television and socializing the
results in this study are ASB 468 MDR 701 MPN 471 and MPW 483 All percentages
total are better than the 1974 studyrsquos 43 Only WDS with 261 was substantially worse and that
was largely because so little time was devoted to the evening meal Ice (2002) studying one site had
found only 12 of time spent in social activities however little time was spent Just Sitting or
Watching For the five sites in this study total percentages of these inactive behaviors are ASB
316 MDR 171 MPN 229 MPW 176 and WDS 402 which are all substantially
different than Gottesman and Bourestomrsquos finding of 56 of time engaged in no activity or passive
activity or the 65 seen by (Ice 2002)
Surprisingly the five sites differed in the percent of maximum possible number of sightings
of residents observed in public areas per scan per day ranging from 49 at MDR to 80 at WDS
This range of 38 difference between the lowest and highest sites is considerable The traditional
concern of staff is that residents who stay in their rooms miss out on socialization and planned
Mapping Five Sites
25 of 47
activities (Grade 1976 Hogden 1985) The public areas most frequented by WDS residents were the
fireplace area and the common hallway area At most sites if the residents were not observed in the
common areas it would be likely that they were in the house areas This was confirmed in the other
principal finding that the percent of maximum possible sightings in the house areas was lowest for
WDS at 25 and highest at ASB at 50 At ASB residents spent 80 of their time in their two
houses At WDS they were encouraged to spend their time in the common areas and they did The
houses were used very differently at the two sites and this may have been because the architects who
were very involved in both sites made it evident that they were intended to be used differently
However the use of communal spaces often has little to do with the intended purpose Lawton
(1970) reports that in 10 observational rounds of a facility a total of 13 people were observed in the
nine social rooms on the nine floors while 79 were counted in the main floor social room where
arrivals and departures could be observed Similarly areas around nursing stations and elevators
frequently draw residents (Lawton 1970 Lawton 1977 Snyder 1980)
A number of factors can be ruled out in the search for unique characteristics of WDS that
could have contributed to the above findings The first factor is the reliability of the observers It is
unlikely that the differences were due to variability in the observational skillsprocedures of the
observers because of the high level of agreement in the assessment of interobserver reliability and
because all observers followed the same protocol in collecting the data The observersrsquo reliability was
also attested to by the similarity of the data within sites across the two days of data collection The
second factor is the general floor plan WDS shared the same basic floor plan with MPN and MPW a
building footprint like the capital letter E So it is unlikely that the gross outer shape of the floor plan
was relevant The third more general factor is related to the inter-site comparability of the TESS-2+
data These data indicate that the five sites were remarkably similar in general and internal design
features WDS has ratings on all measures that were comparable to one or more of the other sites
Mapping Five Sites
26 of 47
including potentially relevant measures such as the presence of homelike features the degree of
interaction with staff and residentsrsquo involvement in activities
There are however a number of other factors that may be relevant to understanding the
WDS data WDS was the only site in which meals were served in the common areas as well as in the
house dining rooms Congruently as already noted the highest number of resident sightings at WDS
was in the common areas (fireplace and common hallway) and most of these common area sightings
were in the common areas of WDS adjacent to the central area of the three houses Importantly these
were the only common areas with a direct line of sight to the central hall and kitchen of the central
house (School House) Staff notes indicated that the number of meal servings from the central house
kitchen was twice as high as that of the kitchens of the other two houses at WDS Again there is
congruence resident sightings in the central house dining room although low relative to central
common areas were twice as high as in the dining rooms of the other two houses at WDS It is also
relevant that staff used all parts of the central common area for activity programming Thus it seems
probable that several factors including the internal floor plan meal service and activity
programming made the central common areas of WDS a multiuse area which resulted in high
number of resident sightings though out the day with peaks at meal times It is worth asking whether
WDS staff would have used the central common area so intensely if the house kitchens had been
aligned with the dining rooms providing staff with oversight as in MPN and MPW
These observations could also explain another WDS anomaly that is the low number
of residents seen to be engaged in ADL activities at meal times compared to other sites If the
lower-functioning residents at WDS engaged in other activities in the central common areas
perhaps abandoning a meal to walk or sit elsewhere that could result in fewer observations
of eating during the mealtime Conversely it could mean that it would be more likely that
Mapping Five Sites
27 of 47
other activities (ie watching walking sitting and leisure activities) would be seen during
meal times which was the case in WDS
Finally the unique features of the WDS resident sighting data may have been related to the
greater degree of dementia (lower than average MMSE scores) of WDS residents The average
MMSE scores at other sites were 50 to 100 higher indicating less severe symptoms than the
average WDS score Congruently WDS had relatively high levels of sightings of sitting watching
and walking behavior and the highest number of pacing incidents Thus it is possible that the
differences in degree of dementia between sites and the related differences in levels of ambulation
made it more likely that WDS residents would leave their rooms and therefore WDS residents would
be sighted most frequently in the common areas of the WDS facility
It is important to note that no substantial differences were found between the 20-capacity
and 12-capacity houses that is in the mean domain scores of the TESS which was used to describe
environmental characteristics Scores were much the same across the five sites The TESS has goals
and domains aligned with the general site design which are more architecturally based and those
best aligned with interior design site operations and providing care
The architects might have thought their design at ASB and MDR would result in a small care
group of 10 and that residents along each bedroom hall would form a household but this did not
happen The residents in the 20-capacity houses did not form a 20-resident cluster either instead they
formed small groups for eating and activities Therefore other factors such as early or late rising or
naturally-formed friendships may be a greater influence than bedroom proximity The addition of
eight more residents per house might be anticipated to lead to crowding in the housesrsquo living-dining
areas or some other notable difference However crowding was not evident in the 20-capacity
houses In fact WDS gatherings in the common areas were more apt to be viewed as crowds
Mapping Five Sites
28 of 47
Observations indicated there that Disruptive Behavior often attributed to crowding was rare It
occurred in only one site and therefore could not be associated with a particular design
These observational results combined with the TESS results have broad implications for
future studies The first implication is methodological and the second is empirical Methodologically
the combination of architectural and behavioral measures in studies of facilities for the elderly
highlights the advantages over methodologies that employ only behavioral measures eg Dementia
Care Mapping (Brooker 2005 Fulton Edelman amp Kuhn 2006 Sloane Brooker Cohen et al
2007) and over studies that rely on client interviews (Kane 2003) Empirically 20 residents in a
house is approaching the size of dementia units in some nursing homes The present study revealed
that the main difference seen in the operation of the 12-resident house and the 20-resident house
design was that the latter appeared to hold more activities within the house raising questions about
the value and need for those common spaces whereas the former made more use of the common
spaces for activities In this way behavior was affected by the house design and by the way that staff
chose to organize activities
Mapping Five Sites
29 of 47
References
Benson D M Cameron D Humbach E Servino L amp Gambert S R (1987) Establishment and
impact of a dementia unit within the nursing home Journal of the American Geriatrics Society
35 319-323
Brawley E C (1997) Designing for Alzheimerrsquos disease Strategies for creating better care
environments New York Wiley
Brooker D (2005) Dementia Care Mapping A review of the research literature The Gerontologist
45 Special Issue I 11ndash18
Calkins M P Meehan R A amp Lipstreuer E (1999) Creekview Its history and evaluation
Kirtland OH IDEAS Inc
Colling K B (1999) Passive behaviors in Alzheimer disease A descriptive analysis American
Journal of Alzheimers Disease and Other Dementias 14 27-40
Cronin-Golumb A (1995) Vision in Alzheimerrsquos disease The Gerontologist 35 370-376
Day K Carreon D amp Stump C (2000) The therapeutic design of environments for people with
dementia A review of the empirical research The Gerontologist 40 397-416
Deely B Klingensmith L amp Silverman M (1995) Developing a residential Alzheimers facility
Focus on Geriatric Care and Rehabilitation 8(7) 1-8
DiMotta S Dubney B M Hoglund J D amp Kershner C (1993) Long-term care design Blazing
new territory - code reform and beyond Journal of Healthcare Design 5 197-203
DiMotta S amp Hoglund J D (2000) Woodside Place A residential care model for the Alzheimerrsquos
and dementia resident Symposium on Healthcare Design Anaheim CA Center for Healthcare
Design
Mapping Five Sites
30 of 47
Doty M M Koren M J amp Sturla E L (2008) Culture change in nursing homes How far have
we come Findings from The Commonwealth Fund 2007 National Survey of Nursing Homes
New York The Commonwealth Fund
Edelman P Fulton B R Kuhn D amp Chang C H (2005) A comparison of three methods of
measuring dementia-specific quality of life Perspectives of residents staff and observers The
Gerontologist 45 27-36
Fleiss J L (1981) Statistical methods for rates and proportions (2nd ed) New York John Wiley amp
Son
Folstein M F Folstein S E amp McHugh P R (1975) Mini-Mental State a practical method for
grading the cognitive state of patients for the clinician Journal of Geriatric Research 12 189-
198
Fulton B R Edelman P amp Kuhn D (2006) Streamlined models of dementia care mapping
Aging amp Mental Health 10 343-351
Gold D T (1991) A descriptive typology of dementia units In P D Sloane amp L J Mathew (Eds)
Dementia units in long-term care (pp 50-61) Baltimore Johns Hopkins University Press
Gonzalez-Salvador T Lyketsos C G Baker A Hovanec L Roques C Brandt J et al (2000)
Quality of Life in dementia patients in long-term care International Journal of Geriatric
Psychiatry 15 181-189
Gottesman L E amp Bourestom N C (1974) Why nursing homes do what they do The
Gerontologist 14 501-506
Grade B L (1976) A study of the entry crisis to a nursing home Unpublished masterrsquos thesis
University of Wisconsin Milwaukee
Grant L A (1998) Beyond the dichotomy An empirical typology of Alzheimerrsquos care in nursing
homes Research on Aging 20 569-592
Mapping Five Sites
31 of 47
Greene J A Asp J amp Crane N (1985) Specialized management of the Alzheimerrsquos disease
patient Does it make a difference A preliminary progress report Journal of the Tennessee
Medical Association 78 559-563
Harper G J (1998) Stress and adaptation among elders in life care communities Unpublished
doctoral dissertation Ohio State University Columbus
Hogden K M (1985) Leisurerecreation needs of hospitalized elderly A task force report
Activities Adaptation amp Aging 7 53-65
Hoglund D J amp Ledewitz S D (1999) Designing to meet the needs of people with Alzheimerrsquos
disease In B Schwarz amp R Brent (Eds) Aging autonomy and architecture Advances in
assisted living (pp 229-261) Baltimore John Hopkins University Press
Ice G H (2002) Daily life in a nursing home has it changed in 25 years Journal of Aging Studies
16 345-359
Imamoğlu Ccedil (2007) Assisted living as a new place schema A comparison with homes and nursing
homes Environment and Behavior 39 246-268
Innes A amp Surr C (2001) Measuring the well-being of people with dementia living in formal care
settings The use of Dementia Care Mapping Aging and Mental Health 5 258-268
Kane R A (2003) Definition measurement and correlates of quality of life in nursing homes
Toward a reasonable practice research and policy agenda The Gerontologist 43 Special
Issue II 28ndash36
Kuhn D Kasayka R E amp Lechner C (2002) Behavioral observations and quality life among
persons with dementia in 10 assisted living facilities American Journal of Alzheimerrsquos Disease
and Other Dementias 17 291-298
Lawton M P (1970) Ecology and aging In L A Pastaland amp D H Carson (Eds) The spatial
behavior of older people (pp 41-67) Ann Arbor MI University of Michigan Press
Mapping Five Sites
32 of 47
Lawton M P (1977) The impact of the environment on aging and behavior In K W Schaie (Ed)
Handbook of the Psychology of Aging (pp 276-301) New York Van Nostrand Reinhold
Lawton M P Weisman G D Sloane P amp Calkins M (1997) Assessing environments for older
people with chronic illness Journal of Mental Health and Aging 3 83-100
Lawton M P Weisman G D Sloane P Norris-Baker C Calkins M amp Zimmerman S I
(2000) Professional Environmental Assessment Procedure for special care units for elders with
dementing illness and its relationship to the Therapeutic Environment Screening Schedule
Alzheimer Disease and Associated Disorders 14 28ndash38
Lee M Madden V Mason K Rice S Wyburd J amp Hobson S (2006) Occupational
engagement and adaptation in adults with dementia A preliminary investigation Physical and
Occupational Therapy in Geriatrics 25 63-81
Lehrner P N (1979) Handbook of ethological methods New York Garland STMP
Margulis S T (2003) Privacy as a social issue and behavioral concept Journal of Social Issues 59
243-261
Martin P amp Bateson P (1987) Measuring behaviour An introductory guide New York
Cambridge University Press
Mathew L J amp Sloane P D (1991) Organizing and staffing dementia units In P D Sloane amp L
J Mathew (Eds) Dementia units in long-term care (pp 101-127) Baltimore Johns Hopkins
University Press
McAllister C L amp Silverman M A (1999) Community formation and community roles among
persons with Alzheimerrsquos disease A comparative study of experience in a residential
Alzheimerrsquos facility and a traditional nursing home Qualitative Health Research 9 65-85
McCracken A L amp Fitzwater E (1989) The right environment for Alzheimerrsquos Geriatric
Nursing 10 293-294
Mapping Five Sites
33 of 47
Milke D L (2003) Iterative post-occupancy evaluations of the McConnell Place North design
[Abstract] Proceedings of the 56th Annual Scientific Meeting of the Gerontological Society of
America 43 48 San Diego CA
Milke D L Clark C amp Bucknell M (2000) Assessing the adequacy of residential lighting in two
care centres for persons with Alzheimerrsquos Disease using the new age-adjusted North American
illumination recommendations (Research Report) Ottawa Ontario Canada Canada Mortgage
and Housing Corporation
National Institute on Aging Coordinating Center (1993) NIA collaborative studies special care units
for Alzheimers disease Manual of procedures Davis CA Northern California Alzheimers
Disease Center University of California
Rabig J Thomas W Kane R A Cutler L J amp McAlilly S (2006) Radical redesign of nursing
homes Applying the Green House concept in Tupelo Mississippi The Gerontologist 46 533-
539
Rule B G Milke D L amp Dobbs A R (1992) Design of institutions Cognitive functioning and
social interactions of the aged resident Journal of Applied Gerontology 11 475-488
Saxton J Silverman M Ricci E Keane C amp Deely B (1998) Maintenance of mobility in
residents of an Alzheimer special care facility International Psychogeriatrics 10 213-224
Schwarz B Chaudhury H amp Tofle R B (2004) Effect of design interventions on a dementia care
setting American Journal of Alzheimers Disease and Other Dementias 19 172-176
Silverman M Ricci E Saxton J Ledewitz S McAllister C amp Keane C (1995) Woodside
Place The first three years of a residential Alzheimerrsquos facility (Vols 1-2) Oakmont PA
Presbyterian Senior Care
Skea D amp Lindesay J (1996) An evaluation of two models of long-term residential care for
elderly people with dementia International Journal of Geriatric Psychiatry 11 233-241
Mapping Five Sites
34 of 47
Slaughter S Calkins M Eliasziw M amp Reimer M (2006) Measuring physical and social
environments in nursing homes for people with middle- to late-stage dementia Journal of the
American Geriatrics Society 54 1436-1441
Sloane P D Brooker D Cohen L Douglass C Edelman P Fulton B R et al (2007)
Dementia Care Mapping as a research tool International Journal of Geriatric Psychiatry 22
580-589
Sloane P D Mitchell M Priesser J S Phillips C Commander C amp Burker E (1998)
Environmental correlates of resident agitation in Alzheimerrsquos disease special care units Journal
of the American Geriatric Society 46 862ndash869
Sloane P D Mitchell C M Weisman G Zimmerman S Foley K M L Lynn M et al
(2002) The Therapeutic Environment Screening Survey for Nursing Homes (TESS-NH) An
observational instrument for assessing the physical environment of institutional settings for
persons with dementia Journals of Gerontology Series B Psychological Sciences and Social
Sciences 57B(Suppl 2) S69-S78
Sloane P D Zimmerman S Williams C S Reed P S Gill KS amp Preisser J S (2005)
Evaluating the quality of life of long-term care residents with dementia The Gerontologist 45
37-49
Snyder L G (1980) An exploratory study of patterns of social interaction organization and facility
design in three nursing homes In J Hendricks (Ed) Institutionalization and Alternative Futures
(pp 68-80) Farmingdale NY Baywood Pub Co
Sommer R amp Sommer B B (1986) A practical guide to behavioral research Tools and
techniques (2nd ed) New York Oxford
Van Haitsma K Lawton M P amp Kleban M H (2000) Does segregation help or hinder
Examining the role of heterogeneity in behavioral and emotional aspects of quality of life for
Mapping Five Sites
35 of 47
persons with cognitive impairment in the nursing home Research and Practice in Alzheimerrsquos
Disease 4 163-177
Verbeek H van Rossum E Zwakhalen S M G Kempen G I J M amp Hamers J P H (2009)
Small homelike care environments for older people with dementia A literature review
International Psychogeriatrics 21 252-264
Voelkl J E (2006) Therapeutic environments in nursing homes Fostering residents meaningful
activity engagement Activities Directors Quarterly for Alzheimers and Other Dementia
Patients 7(3) 35-44
Warren S (Ed) (1998) Innovative dementia care McConnell Place North evaluation (Research
Report) Edmonton Alberta Canada Evaluating Programs of Innovative Continuing Care
Zeisel J (1998) The Hearthstone health environments case study Journal of Healthcare Design
Proceedings from the Symposium on Healthcare Design San Francisco CA National
Symposium on Healthcare Design Inc
Zeisel J Hyde J amp Levkoff S (1994) Best practices An environment-behavior (E-B) model for
Alzheimer special care units American Journal of Alzheimerrsquos Care and Related Disorders and
Research and Care 9(2) 4-21
Zimmerman S Sloane P D Williams C S Reed P S Preisser J S Eckert J K et al (2005)
Dementia care and quality of life in assisted living and nursing homes The Gerontologist 45
133-146
Mapping Five Sites
36 of 47
Table 1 Comparison of Architectural Features Across Five Sites
Feature ASB MDR MPN MPW WDS
Total facility square footage 23040 sq ft 27308 sq fta 24750 sq ft 23864 sq ft 21540 sq ft
Size of administration area (offices conference reception etc but not service or employee spaces)
960 sq ft (No entry hall)
1584 sq ft day program offices and program space
1675 sq ft 1629 sq ft 972 sq ft (No entry hall)
Staff (lunch) room 16rsquo x 18rsquo 6rsquo11rdquo x 6rsquo2rdquo 158rsquo x 16rsquo 138rsquo x 16rsquo 95rsquo x 30rsquo (plus)b
Treatment or examination room
No Yes In daycare area
No No Yes In central
areac
Medications storage Central medication cart
Medication room Medication room per house
Medication room per house
Central medication cart
Location of meal preparation
Facility kitchen in administration area
Facility kitchen in administration area
Adjacent nursing home (see house kitchen)
Adjacent nursing home (see house kitchen)
Facility kitchen in administration area
Use of house kitchen Servery snacks Servery snacks Meal preparation for all breakfasts and some lunches servery
Meal preparation for all breakfasts and some lunches servery
Servery snacks
Family dining room or central country kitchen usage
Small group activities family functions by reservation
Small group activities family functions by reservation
Small group meetings Great Room party food preparation family functions by reservation
Small group meetings Great Room party food preparation family functions by reservation
Small group activities family functions by reservation
Houses and capacity 2 20 2 20 3 12 3 12 3 12
Private tubroom Two off the central hallway
Two off the central hallway
One located in each house
One located in each house
None
Private shower areas One per 10 residents located in each wing of each house
One per 10 residents located in each wing of each house
One per resident located in each resident room with the one shared bedroom having a shared shower
One per resident located in each resident room with the one shared bedroom having a shared shower
One per 12 residents located in each house
Resident room doors Split door Split door Split door Regular Split door
Inventory of public rooms and seating capacity (includes all alcoves that can be used for seating and seating areas near exits)
15 165
17 176
15 232
13 219
14 182
Variety and appearance of outdoor Area
2 small (little greenery) 1 medium (mixed hardgreen surfaces) and a large courtyardmdashvery appealing
2 small (much greenery) 1 medium (mixed hardgreen surfaces) 2 large courtyards (1 mixed hardgreen surfaces 1 green) mdash very appealing
3 small (much greenery) 1 large (mostly green courtyard mdash very appealing
3 small (much greenery) and 1 large (mostly green courtyard mdash very appealing
1 small (much greenery) 1 medium (mostly green) and 1 large (mostly green) courtyard mdash very appealing
a Does not include researchteaching wing Total for entire floor space is 40382 sq ft b Room at WDS was not intended as a lounge ie a retreat from work to professionalize the care staff role it was to serve as a place to read and discuss work At other
sites the lunch room also served as a lounge c Room was intended as a multi-purpose room
Mapping Five Sites
37 of 47
Table 2 Therapeutic Environment Screening Scale Items for Goal and Domain Possible Range
Midpoint and Mean in Each Group
Therapeutic Goal and Domain
Item Numbers Range Mid-point ASB amp MDR
20-Capacity Houses MPN MPW amp WDS
12-Capacity Houses
ASB MDR Site Scores
Mean MPN MPW WDS Site Scores
Mean
Safetysecurityhealth
Exit control 2a 2b 2c 2d 2e 2g
2h 3a 3b 0-11 55 2 1 15 1 2 2 17
Maintenance 7b1Dagger 7b2Dagger 7b3Dagger 7b4Dagger 0-8 40 8 8 80 8 8 80
Cleanliness 7a1Dagger 7a2Dagger 7a3 7a4 0-8 40 8 8 80 7 8 8 77
Lack of odorsℓ 9aDagger 9bDagger 0-4 20 4 3 35 4 4 4 40
Safetyℓ 7c1 7c2Dagger 7c3 7c4 8 0-10 60 10 10 100 10 10 10 100
Orientationcuing 19 20ф 27a 27bcDagger
27d 27e 27f 28 29 0-17 85 1212 120 11 9 12 107
Privacycontrol
Privacy 30a 30b 30c 30d 0-4 20 0 0 0 1 2 0 10
Functional ability 16 17a 17b 18Dagger 0-7 35 7 7 70 7 7 7 70
Stimulation
Lighting 21 22a 22bDagger 22cDagger
23a 23b 23c 0-14 70 13 13 130 11 14 13 127
Tactilevisual
stimulation 34 35Dagger 37b 0-16 80 10 6 80 15 14 11 133
Quietness 24a 24b 24c 24d
24eDagger 24f 24g 25 26 0-25 125 21 21 210 19 20 23 207
Physical attractiveness
4a1 4a2 4b1 4b2
4c1 4c2 4d1 4d2 37c 0-34 140 16 15 155 15 16 16 157
Socialization
Homelike
environment 15Dagger 31Dagger 32 0-9 45 9 9 90 9 9 9 90
Resident
appearance 36Dagger
0-2 10 2 2 20 2 2 20
SCUEQS 0-41 - 41 39 40 39 4141 40
CAAQS sect 0-100 - 786 857
Large means represent better physical environment
Dagger Items used to compute the 18-item Special Care Environmental Quality Scale (SCUEQS) 27b and 27c were treated as a single item and item 15 was
misnumbered in the TESS-2+ Revised version (as item 13) ф Item 20 is the percentage of common rooms with signsgraphics floor plans in all sites allowed a view into common rooms (scored as zero) ℓ An item was unintentionally omitted from the TESS-2+ scoring form (10 in Odors and 11 in Safety) sect Composite Above Average Quality Score (CAAQS) represents the percentage of TESS-2+ domains that were above average in quality
Mapping Five Sites
38 of 47
Table 3 Percent of Resident Population Who Were Observed During Behavior Scans
at Each Site in Particular Areasa
AreaSite 20-Capacity Houses 12-Capacity Houses
ASB MDR MPN MPW WDS
Total Areas 608 493 511 564 803
Total Common Areas 62 158 169 200 511
Total Outdoor Areas 46 02 11 56 38
Total House Areas 500 333 331 311 254
House 1 259 168 115 69 62
House 2 241 165 108 128 123
House 3 108 114 69
House Kitchen 149 08 75 53 49
House LivingDining Room 324 278 236 232 200 a Resident data were adjusted to show the mean percent of residents at a site who were observed per scan per day Note Total Areas is the sum of the following Total Common Total Outdoor and Total House Total House Areas is the sum of Houses 1 House 2 and House 3 House Kitchen and LivingDining Rooms are summed across houses Blank cells indicate that the question was not applicable
Mapping Five Sites
39 of 47
Table 4 Percent of Resident Population Who Were Observed During Behavior Scans
at Each Site in Particular Common Areasa
Location 20-Capacity Houses 12-Capacity Houses ASB MDR MPN MPW WDS
Great Room 07 75 94 91 64
Fireplace Seating Area 22 69 43 13 106
ActivityCraft Room 04 47 00 02 10
TV Room ndash ndash 43 64 58
Other TV Area ndash ndash 11 39 ndash
Common Area Hallway Seating 37 108 138 143 396
Music Room ndash ndash 00 ndash 00
Garden Room ndash ndash 00 ndash 04
Beauty Salon 39 12 00 00 00
Family Dining RoomCountry Kitchen 00 09 00 00 00
Total 109 320 329 352 638 a Resident data were adjusted to show the mean percent of residents at a site who were observed per scan per day Note Dashes indicate that residents were not observed in these areas
Mapping Five Sites
40 of 47
Table 5 Percent of Resident Population Who Were Observed During Behavior Scans
at Each Site at Particular Times of Day
Time of Day 20-Capacity Houses 12-Capacity Houses
ASB MDR MPN MPW WDS
Before Lunch 541 360 386 475 654
Lunch 805 663 667 722 1000
Between Meals 657 530 506 589 963
Supper 765 738 744 744 922
After Supper 50 390 447 469 740 a Resident data were adjusted to show the mean percent of residents at a site who were observed per scan per day Note Before Lunch (4 scans-730-1030) Lunch (2 scans-1130 amp 1230) Between Meals (3 scans-1330 to 1530) Supper (2 scans-1630 amp 1730) After Supper (4 scans-1830 to 2130)
Mapping Five Sites
41 of 47
Figure 1 Floor plan of Asbury Place Mt Lebanon PA
Mapping Five Sites
42 of 47
Figure 2 Floor plan of Marjorie Doyle Rockwell Center Cohoes NY
Mapping Five Sites
43 of 47
Figure 3 Floor plan of McConnell Place North Edmonton AB
Mapping Five Sites
44 of 47
Figure 4 Floor plan of McConnell Place West Edmonton AB
Mapping Five Sites
45 of 47
Figure 5 Floor plan of Woodside Place Oakmont PA
Mapping Five Sites
46 of 47
Figure 6
McConnell Place Northordf Residentsrsquo Activities When Alone and in the Presence of Staff
ordf The average MMSE score was 153 at MPN higher than the average across sites 132 + 15 (M+SE) MPN residents appeared not to initiate activities when alone
0
5
10
15
20
25
30
35
40
Alone Day 1 With Staff Day 1 Alone Day 2 With Staff Day 2
Nu
mb
er R
esid
ents
Arts amp Crafts
Chores
CookingBaking
Eating
Exercising
Games
Grooming
Lg Activity Grp
Music Event
Reading
Sm Interaction
Walking
Watching
Watching TV
Other
Mapping Five Sites
47 of 47
Figure 7
Percent of Scans in Which Residents at Each Site Engaged in Particular Behaviors
0
10
20
30
40
50
60
70
80
90
100
ASB MDR MPN MPW WDS
Misc
Just Sit
Watch
Walk
Leisure
Work
ADLs

Mapping Five Sites
20 of 47
dining areas for the noon meal With most activities occurring in the core of the building WDS was
flexible about meal arrangements serving meals where residents were located such as the area
outside the great room on an activity room Residents were not required to return to their own houses
to eat They could join day program residents and eat in the common area or join residents in another
house One group of women was known for asking to eat together on their own in the common area
WDS also led other sites in the number of residents observed at other times of the day (Table 5) The
differences were especially marked in the afternoon between meals (1330-1630) and the period
after the evening meal (1830-2130) This suggests that WDS staff may have been viewing the
central areas like they would the central areas of a unit in a nursing home on dementia units staff
often prefer that residents stay in view and not return to their rooms
Resident Activity The observed activity patterns were surprising considering high levels of
resident inactivity reported for nursing home residents (Gottesman amp Bourestom 1974 Ice 2002)
Gottesman and Bourestomrsquos (1974) observations in 40 nursing homes revealed that residents spent
56 of their time during peak daylight hours engaged in no activity or passive activity In that study
residents were involved in personal care television and socializing for 43 of the time Ice (2002)
reprised the Gottesman and Bourestom study and found residents spent 65 of their time doing little
or nothing with only 12 in social activities (Ice 2002) In the present study observations of Just
Sitting and Watching were expected to measure levels of passive behaviors Residents in the five
sites appeared to be engaged in ADLs and Leisure for greater amounts of time than in Just Sitting
and Watching (although small amounts of napping as passive behavior were coded as
Miscellaneous) but this was not significant (Figure 7) Chi-square analysis using phi coefficients
found that residents at WDS engaged significantly less in ADLs than residents in other centres
(plt00001) residents at ASB MPN amp WDS were engaged less in leisure (plt005 each) ASB
Mapping Five Sites
21 of 47
residents were engaged less in Just Sitting (plt00005) and residents were observed Watching less at
MDR MPN amp MPW (plt00005 each) Leisure was the most frequently observed activity for MDR
MPN and MPW the second most frequent at ASB and the third at WDS Recreational activities
both planned and informal activities were considered to be Leisure thus watching TV or waiting to
be served at a coffee party were both coded as being Leisure (persons who were within the group and
actively attending to events but not actively engaged at the moment were coded as Leisure too and
this was distinguished from Watching which was defined as ldquoattending to activities or interactions of
others from a distance such as from a doorway watching a streetrdquo)
Insert Figure 7 about here
The ADLs were the second most frequently seen activity for MDR MPN and MPW and the
third for ASB but were seen much less at WDS The majority of ADLs across sites occurred at meal
times indicating they involved dining (ASB 570 MDR 590 MPN 758 MPW 736 but
WDS 422) The low percent of time spent by WDS residents on ADLs during the evening meal
time (42) agrees with the low number of sightings in the dining area at that time (385 of max)
It appears that WDS residents sat watched and walked but did not spend much time eating
(Figure 7) In contrast previous research at MPN and MPW has found mealtimes to be the longest
duration behavior Scans needed to be one hour apart to avoid seeing meals on two consecutive scans
and oversampling the behavior (Milke et al 2000)
Work that is tasks such as housekeeping and cooking were not seen at either of the sites
with 20-capacity houses but this is the only difference evident when compared with the 12-capacity
Mapping Five Sites
22 of 47
houses Compared to other sites MPN and MPW residents engaged in moderate proportions of all
behaviors (Figure 7) Residents at WDS spent proportionately less time on ADLs light
housekeeping and Leisure and more time at Walking Watching and Just Sitting Chi-square
analysis using phi coefficients showed that residents were observed Walking significantly less at
MDR (plt 005) residents at ASB and MDR engaged significantly less in Work and there were no
significant differences between sites in Miscellaneous activities (Figure 7)
Observersrsquo Notes
Some large differences were found in the care programs across sites Observersrsquo notes
indicated that at MPN and MPW residents were encouraged to be involved in the daily routine of the
facility and direct care staff ate meals with residents This strategy was said to stimulate conversation
and provide residents with a model for appropriate behavior Staff played the role of ldquomotherrdquo rising
to find an item in the kitchen and keeping an eye on food consumption Managers at MPN and MPW
considered this role an essential component of care At ASB MDR and WDS there was no evidence
of such a role
Most cooking was done in facility kitchens away from areas that residents could access This
tended to result in the house kitchens being treated more like institutional serveries Fridges mainly
contained large juice jugs and prepared snacks However at MPW and MPN when a resident opened
the fridge door the door was full of condiments and casseroles it looked just like home because of
an effort to keep institutional sized packages to a minimum These two sites used their kitchens quite
differently than the other three sites At MPN and MPW all breakfasts and snacks were prepared in
the houses each day by direct care staff On four weekdays lunches also were prepared Residents
were invited to participate in some of the chopping slicing and mixing which was considered an
essential component of the care program When meals were delivered from nearby facility kitchens
staff decanted items into family-size serving bowls They added condiments and poured drinks
Mapping Five Sites
23 of 47
serving the meals much like those prepared in-house Although residents helping with meal
preparation appeared to be limited to MPN and MPW staff records indicated additional forms of
daily and special occasion activities occurred at all sites Daily activities included easy tasks eg
folding laundry and exercises at all five sites discussion groups at MDR and WDS religious
activities at ASB MPN and MPW musicsinging at ASB MPW and WDS movies at ASB and
grooming at all sites except WDS
Outdoor courtyards were accessible to residents on the observation days at all sites The
barbecue meal at MPW drew the highest number of residents outside but from mid-morning until
early evening residents were seen on the patios or walkways This was true at every site except
MDR where few ventured outside (data not presented)
Disruptive behaviors were seen only at ASB where at 730 am 230 pm and 430 pm a
single resident was disruptive Whether this was the same or different resident is not known the
identity of persons was not recorded This accounted for only 03 of all behaviors seen at ASB (and
was not shown on Figure 7)
Discussion
The TESS-2+scale results clearly indicated that the pioneering WDS site and the four sites
modeled on it met best practice standards in many areas These include the ratings for global site
assessment overall configuration of self-contained living arrangements with adjacent common
spaces informal workspaces for staff and accessible outdoor green spaces walking paths and
maintenance More pertinent to the present study there were no significant differences between the
sites that had 12-capacity houses and those with 20-capacity houses on any TESS items the NIA
subscale of overall environmental quality (SCUEQS) or CAAQS the composite score devised by
Mapping Five Sites
24 of 47
Slaughter et al (2006) Sites with 20-capacity houses did not look substantially different from sites
with 12-capacity houses according to the scale
Behavioral Mapping
A principal finding from behavioral mapping was the amount of time residents were found
engaged in leisure activity at all five sites Leisure was the most frequently observed activity for
MDR MPN and MPW the second most frequent at ASB and the third at WDS The level of
participation in meaningful activities is considered an important measure of residentsrsquo quality of life
(Gonzalez-Salvador et al 2000 Zimmerman et al 2005) Although the extent of engagement is
typically measured in more focused and intensive ways the fact that observers saw residents who
were alert and watching an activity is meaningful because observers were asked to distinguish
whether the resident was ldquojust sittingrdquo or ldquowatchingrdquo if that was the extent of the involvement When
percentages of time spent in Leisure are combined with Activities of Daily Living following the lead
of Gottesman and Bourestom (1974) who combined personal care television and socializing the
results in this study are ASB 468 MDR 701 MPN 471 and MPW 483 All percentages
total are better than the 1974 studyrsquos 43 Only WDS with 261 was substantially worse and that
was largely because so little time was devoted to the evening meal Ice (2002) studying one site had
found only 12 of time spent in social activities however little time was spent Just Sitting or
Watching For the five sites in this study total percentages of these inactive behaviors are ASB
316 MDR 171 MPN 229 MPW 176 and WDS 402 which are all substantially
different than Gottesman and Bourestomrsquos finding of 56 of time engaged in no activity or passive
activity or the 65 seen by (Ice 2002)
Surprisingly the five sites differed in the percent of maximum possible number of sightings
of residents observed in public areas per scan per day ranging from 49 at MDR to 80 at WDS
This range of 38 difference between the lowest and highest sites is considerable The traditional
concern of staff is that residents who stay in their rooms miss out on socialization and planned
Mapping Five Sites
25 of 47
activities (Grade 1976 Hogden 1985) The public areas most frequented by WDS residents were the
fireplace area and the common hallway area At most sites if the residents were not observed in the
common areas it would be likely that they were in the house areas This was confirmed in the other
principal finding that the percent of maximum possible sightings in the house areas was lowest for
WDS at 25 and highest at ASB at 50 At ASB residents spent 80 of their time in their two
houses At WDS they were encouraged to spend their time in the common areas and they did The
houses were used very differently at the two sites and this may have been because the architects who
were very involved in both sites made it evident that they were intended to be used differently
However the use of communal spaces often has little to do with the intended purpose Lawton
(1970) reports that in 10 observational rounds of a facility a total of 13 people were observed in the
nine social rooms on the nine floors while 79 were counted in the main floor social room where
arrivals and departures could be observed Similarly areas around nursing stations and elevators
frequently draw residents (Lawton 1970 Lawton 1977 Snyder 1980)
A number of factors can be ruled out in the search for unique characteristics of WDS that
could have contributed to the above findings The first factor is the reliability of the observers It is
unlikely that the differences were due to variability in the observational skillsprocedures of the
observers because of the high level of agreement in the assessment of interobserver reliability and
because all observers followed the same protocol in collecting the data The observersrsquo reliability was
also attested to by the similarity of the data within sites across the two days of data collection The
second factor is the general floor plan WDS shared the same basic floor plan with MPN and MPW a
building footprint like the capital letter E So it is unlikely that the gross outer shape of the floor plan
was relevant The third more general factor is related to the inter-site comparability of the TESS-2+
data These data indicate that the five sites were remarkably similar in general and internal design
features WDS has ratings on all measures that were comparable to one or more of the other sites
Mapping Five Sites
26 of 47
including potentially relevant measures such as the presence of homelike features the degree of
interaction with staff and residentsrsquo involvement in activities
There are however a number of other factors that may be relevant to understanding the
WDS data WDS was the only site in which meals were served in the common areas as well as in the
house dining rooms Congruently as already noted the highest number of resident sightings at WDS
was in the common areas (fireplace and common hallway) and most of these common area sightings
were in the common areas of WDS adjacent to the central area of the three houses Importantly these
were the only common areas with a direct line of sight to the central hall and kitchen of the central
house (School House) Staff notes indicated that the number of meal servings from the central house
kitchen was twice as high as that of the kitchens of the other two houses at WDS Again there is
congruence resident sightings in the central house dining room although low relative to central
common areas were twice as high as in the dining rooms of the other two houses at WDS It is also
relevant that staff used all parts of the central common area for activity programming Thus it seems
probable that several factors including the internal floor plan meal service and activity
programming made the central common areas of WDS a multiuse area which resulted in high
number of resident sightings though out the day with peaks at meal times It is worth asking whether
WDS staff would have used the central common area so intensely if the house kitchens had been
aligned with the dining rooms providing staff with oversight as in MPN and MPW
These observations could also explain another WDS anomaly that is the low number
of residents seen to be engaged in ADL activities at meal times compared to other sites If the
lower-functioning residents at WDS engaged in other activities in the central common areas
perhaps abandoning a meal to walk or sit elsewhere that could result in fewer observations
of eating during the mealtime Conversely it could mean that it would be more likely that
Mapping Five Sites
27 of 47
other activities (ie watching walking sitting and leisure activities) would be seen during
meal times which was the case in WDS
Finally the unique features of the WDS resident sighting data may have been related to the
greater degree of dementia (lower than average MMSE scores) of WDS residents The average
MMSE scores at other sites were 50 to 100 higher indicating less severe symptoms than the
average WDS score Congruently WDS had relatively high levels of sightings of sitting watching
and walking behavior and the highest number of pacing incidents Thus it is possible that the
differences in degree of dementia between sites and the related differences in levels of ambulation
made it more likely that WDS residents would leave their rooms and therefore WDS residents would
be sighted most frequently in the common areas of the WDS facility
It is important to note that no substantial differences were found between the 20-capacity
and 12-capacity houses that is in the mean domain scores of the TESS which was used to describe
environmental characteristics Scores were much the same across the five sites The TESS has goals
and domains aligned with the general site design which are more architecturally based and those
best aligned with interior design site operations and providing care
The architects might have thought their design at ASB and MDR would result in a small care
group of 10 and that residents along each bedroom hall would form a household but this did not
happen The residents in the 20-capacity houses did not form a 20-resident cluster either instead they
formed small groups for eating and activities Therefore other factors such as early or late rising or
naturally-formed friendships may be a greater influence than bedroom proximity The addition of
eight more residents per house might be anticipated to lead to crowding in the housesrsquo living-dining
areas or some other notable difference However crowding was not evident in the 20-capacity
houses In fact WDS gatherings in the common areas were more apt to be viewed as crowds
Mapping Five Sites
28 of 47
Observations indicated there that Disruptive Behavior often attributed to crowding was rare It
occurred in only one site and therefore could not be associated with a particular design
These observational results combined with the TESS results have broad implications for
future studies The first implication is methodological and the second is empirical Methodologically
the combination of architectural and behavioral measures in studies of facilities for the elderly
highlights the advantages over methodologies that employ only behavioral measures eg Dementia
Care Mapping (Brooker 2005 Fulton Edelman amp Kuhn 2006 Sloane Brooker Cohen et al
2007) and over studies that rely on client interviews (Kane 2003) Empirically 20 residents in a
house is approaching the size of dementia units in some nursing homes The present study revealed
that the main difference seen in the operation of the 12-resident house and the 20-resident house
design was that the latter appeared to hold more activities within the house raising questions about
the value and need for those common spaces whereas the former made more use of the common
spaces for activities In this way behavior was affected by the house design and by the way that staff
chose to organize activities
Mapping Five Sites
29 of 47
References
Benson D M Cameron D Humbach E Servino L amp Gambert S R (1987) Establishment and
impact of a dementia unit within the nursing home Journal of the American Geriatrics Society
35 319-323
Brawley E C (1997) Designing for Alzheimerrsquos disease Strategies for creating better care
environments New York Wiley
Brooker D (2005) Dementia Care Mapping A review of the research literature The Gerontologist
45 Special Issue I 11ndash18
Calkins M P Meehan R A amp Lipstreuer E (1999) Creekview Its history and evaluation
Kirtland OH IDEAS Inc
Colling K B (1999) Passive behaviors in Alzheimer disease A descriptive analysis American
Journal of Alzheimers Disease and Other Dementias 14 27-40
Cronin-Golumb A (1995) Vision in Alzheimerrsquos disease The Gerontologist 35 370-376
Day K Carreon D amp Stump C (2000) The therapeutic design of environments for people with
dementia A review of the empirical research The Gerontologist 40 397-416
Deely B Klingensmith L amp Silverman M (1995) Developing a residential Alzheimers facility
Focus on Geriatric Care and Rehabilitation 8(7) 1-8
DiMotta S Dubney B M Hoglund J D amp Kershner C (1993) Long-term care design Blazing
new territory - code reform and beyond Journal of Healthcare Design 5 197-203
DiMotta S amp Hoglund J D (2000) Woodside Place A residential care model for the Alzheimerrsquos
and dementia resident Symposium on Healthcare Design Anaheim CA Center for Healthcare
Design
Mapping Five Sites
30 of 47
Doty M M Koren M J amp Sturla E L (2008) Culture change in nursing homes How far have
we come Findings from The Commonwealth Fund 2007 National Survey of Nursing Homes
New York The Commonwealth Fund
Edelman P Fulton B R Kuhn D amp Chang C H (2005) A comparison of three methods of
measuring dementia-specific quality of life Perspectives of residents staff and observers The
Gerontologist 45 27-36
Fleiss J L (1981) Statistical methods for rates and proportions (2nd ed) New York John Wiley amp
Son
Folstein M F Folstein S E amp McHugh P R (1975) Mini-Mental State a practical method for
grading the cognitive state of patients for the clinician Journal of Geriatric Research 12 189-
198
Fulton B R Edelman P amp Kuhn D (2006) Streamlined models of dementia care mapping
Aging amp Mental Health 10 343-351
Gold D T (1991) A descriptive typology of dementia units In P D Sloane amp L J Mathew (Eds)
Dementia units in long-term care (pp 50-61) Baltimore Johns Hopkins University Press
Gonzalez-Salvador T Lyketsos C G Baker A Hovanec L Roques C Brandt J et al (2000)
Quality of Life in dementia patients in long-term care International Journal of Geriatric
Psychiatry 15 181-189
Gottesman L E amp Bourestom N C (1974) Why nursing homes do what they do The
Gerontologist 14 501-506
Grade B L (1976) A study of the entry crisis to a nursing home Unpublished masterrsquos thesis
University of Wisconsin Milwaukee
Grant L A (1998) Beyond the dichotomy An empirical typology of Alzheimerrsquos care in nursing
homes Research on Aging 20 569-592
Mapping Five Sites
31 of 47
Greene J A Asp J amp Crane N (1985) Specialized management of the Alzheimerrsquos disease
patient Does it make a difference A preliminary progress report Journal of the Tennessee
Medical Association 78 559-563
Harper G J (1998) Stress and adaptation among elders in life care communities Unpublished
doctoral dissertation Ohio State University Columbus
Hogden K M (1985) Leisurerecreation needs of hospitalized elderly A task force report
Activities Adaptation amp Aging 7 53-65
Hoglund D J amp Ledewitz S D (1999) Designing to meet the needs of people with Alzheimerrsquos
disease In B Schwarz amp R Brent (Eds) Aging autonomy and architecture Advances in
assisted living (pp 229-261) Baltimore John Hopkins University Press
Ice G H (2002) Daily life in a nursing home has it changed in 25 years Journal of Aging Studies
16 345-359
Imamoğlu Ccedil (2007) Assisted living as a new place schema A comparison with homes and nursing
homes Environment and Behavior 39 246-268
Innes A amp Surr C (2001) Measuring the well-being of people with dementia living in formal care
settings The use of Dementia Care Mapping Aging and Mental Health 5 258-268
Kane R A (2003) Definition measurement and correlates of quality of life in nursing homes
Toward a reasonable practice research and policy agenda The Gerontologist 43 Special
Issue II 28ndash36
Kuhn D Kasayka R E amp Lechner C (2002) Behavioral observations and quality life among
persons with dementia in 10 assisted living facilities American Journal of Alzheimerrsquos Disease
and Other Dementias 17 291-298
Lawton M P (1970) Ecology and aging In L A Pastaland amp D H Carson (Eds) The spatial
behavior of older people (pp 41-67) Ann Arbor MI University of Michigan Press
Mapping Five Sites
32 of 47
Lawton M P (1977) The impact of the environment on aging and behavior In K W Schaie (Ed)
Handbook of the Psychology of Aging (pp 276-301) New York Van Nostrand Reinhold
Lawton M P Weisman G D Sloane P amp Calkins M (1997) Assessing environments for older
people with chronic illness Journal of Mental Health and Aging 3 83-100
Lawton M P Weisman G D Sloane P Norris-Baker C Calkins M amp Zimmerman S I
(2000) Professional Environmental Assessment Procedure for special care units for elders with
dementing illness and its relationship to the Therapeutic Environment Screening Schedule
Alzheimer Disease and Associated Disorders 14 28ndash38
Lee M Madden V Mason K Rice S Wyburd J amp Hobson S (2006) Occupational
engagement and adaptation in adults with dementia A preliminary investigation Physical and
Occupational Therapy in Geriatrics 25 63-81
Lehrner P N (1979) Handbook of ethological methods New York Garland STMP
Margulis S T (2003) Privacy as a social issue and behavioral concept Journal of Social Issues 59
243-261
Martin P amp Bateson P (1987) Measuring behaviour An introductory guide New York
Cambridge University Press
Mathew L J amp Sloane P D (1991) Organizing and staffing dementia units In P D Sloane amp L
J Mathew (Eds) Dementia units in long-term care (pp 101-127) Baltimore Johns Hopkins
University Press
McAllister C L amp Silverman M A (1999) Community formation and community roles among
persons with Alzheimerrsquos disease A comparative study of experience in a residential
Alzheimerrsquos facility and a traditional nursing home Qualitative Health Research 9 65-85
McCracken A L amp Fitzwater E (1989) The right environment for Alzheimerrsquos Geriatric
Nursing 10 293-294
Mapping Five Sites
33 of 47
Milke D L (2003) Iterative post-occupancy evaluations of the McConnell Place North design
[Abstract] Proceedings of the 56th Annual Scientific Meeting of the Gerontological Society of
America 43 48 San Diego CA
Milke D L Clark C amp Bucknell M (2000) Assessing the adequacy of residential lighting in two
care centres for persons with Alzheimerrsquos Disease using the new age-adjusted North American
illumination recommendations (Research Report) Ottawa Ontario Canada Canada Mortgage
and Housing Corporation
National Institute on Aging Coordinating Center (1993) NIA collaborative studies special care units
for Alzheimers disease Manual of procedures Davis CA Northern California Alzheimers
Disease Center University of California
Rabig J Thomas W Kane R A Cutler L J amp McAlilly S (2006) Radical redesign of nursing
homes Applying the Green House concept in Tupelo Mississippi The Gerontologist 46 533-
539
Rule B G Milke D L amp Dobbs A R (1992) Design of institutions Cognitive functioning and
social interactions of the aged resident Journal of Applied Gerontology 11 475-488
Saxton J Silverman M Ricci E Keane C amp Deely B (1998) Maintenance of mobility in
residents of an Alzheimer special care facility International Psychogeriatrics 10 213-224
Schwarz B Chaudhury H amp Tofle R B (2004) Effect of design interventions on a dementia care
setting American Journal of Alzheimers Disease and Other Dementias 19 172-176
Silverman M Ricci E Saxton J Ledewitz S McAllister C amp Keane C (1995) Woodside
Place The first three years of a residential Alzheimerrsquos facility (Vols 1-2) Oakmont PA
Presbyterian Senior Care
Skea D amp Lindesay J (1996) An evaluation of two models of long-term residential care for
elderly people with dementia International Journal of Geriatric Psychiatry 11 233-241
Mapping Five Sites
34 of 47
Slaughter S Calkins M Eliasziw M amp Reimer M (2006) Measuring physical and social
environments in nursing homes for people with middle- to late-stage dementia Journal of the
American Geriatrics Society 54 1436-1441
Sloane P D Brooker D Cohen L Douglass C Edelman P Fulton B R et al (2007)
Dementia Care Mapping as a research tool International Journal of Geriatric Psychiatry 22
580-589
Sloane P D Mitchell M Priesser J S Phillips C Commander C amp Burker E (1998)
Environmental correlates of resident agitation in Alzheimerrsquos disease special care units Journal
of the American Geriatric Society 46 862ndash869
Sloane P D Mitchell C M Weisman G Zimmerman S Foley K M L Lynn M et al
(2002) The Therapeutic Environment Screening Survey for Nursing Homes (TESS-NH) An
observational instrument for assessing the physical environment of institutional settings for
persons with dementia Journals of Gerontology Series B Psychological Sciences and Social
Sciences 57B(Suppl 2) S69-S78
Sloane P D Zimmerman S Williams C S Reed P S Gill KS amp Preisser J S (2005)
Evaluating the quality of life of long-term care residents with dementia The Gerontologist 45
37-49
Snyder L G (1980) An exploratory study of patterns of social interaction organization and facility
design in three nursing homes In J Hendricks (Ed) Institutionalization and Alternative Futures
(pp 68-80) Farmingdale NY Baywood Pub Co
Sommer R amp Sommer B B (1986) A practical guide to behavioral research Tools and
techniques (2nd ed) New York Oxford
Van Haitsma K Lawton M P amp Kleban M H (2000) Does segregation help or hinder
Examining the role of heterogeneity in behavioral and emotional aspects of quality of life for
Mapping Five Sites
35 of 47
persons with cognitive impairment in the nursing home Research and Practice in Alzheimerrsquos
Disease 4 163-177
Verbeek H van Rossum E Zwakhalen S M G Kempen G I J M amp Hamers J P H (2009)
Small homelike care environments for older people with dementia A literature review
International Psychogeriatrics 21 252-264
Voelkl J E (2006) Therapeutic environments in nursing homes Fostering residents meaningful
activity engagement Activities Directors Quarterly for Alzheimers and Other Dementia
Patients 7(3) 35-44
Warren S (Ed) (1998) Innovative dementia care McConnell Place North evaluation (Research
Report) Edmonton Alberta Canada Evaluating Programs of Innovative Continuing Care
Zeisel J (1998) The Hearthstone health environments case study Journal of Healthcare Design
Proceedings from the Symposium on Healthcare Design San Francisco CA National
Symposium on Healthcare Design Inc
Zeisel J Hyde J amp Levkoff S (1994) Best practices An environment-behavior (E-B) model for
Alzheimer special care units American Journal of Alzheimerrsquos Care and Related Disorders and
Research and Care 9(2) 4-21
Zimmerman S Sloane P D Williams C S Reed P S Preisser J S Eckert J K et al (2005)
Dementia care and quality of life in assisted living and nursing homes The Gerontologist 45
133-146
Mapping Five Sites
36 of 47
Table 1 Comparison of Architectural Features Across Five Sites
Feature ASB MDR MPN MPW WDS
Total facility square footage 23040 sq ft 27308 sq fta 24750 sq ft 23864 sq ft 21540 sq ft
Size of administration area (offices conference reception etc but not service or employee spaces)
960 sq ft (No entry hall)
1584 sq ft day program offices and program space
1675 sq ft 1629 sq ft 972 sq ft (No entry hall)
Staff (lunch) room 16rsquo x 18rsquo 6rsquo11rdquo x 6rsquo2rdquo 158rsquo x 16rsquo 138rsquo x 16rsquo 95rsquo x 30rsquo (plus)b
Treatment or examination room
No Yes In daycare area
No No Yes In central
areac
Medications storage Central medication cart
Medication room Medication room per house
Medication room per house
Central medication cart
Location of meal preparation
Facility kitchen in administration area
Facility kitchen in administration area
Adjacent nursing home (see house kitchen)
Adjacent nursing home (see house kitchen)
Facility kitchen in administration area
Use of house kitchen Servery snacks Servery snacks Meal preparation for all breakfasts and some lunches servery
Meal preparation for all breakfasts and some lunches servery
Servery snacks
Family dining room or central country kitchen usage
Small group activities family functions by reservation
Small group activities family functions by reservation
Small group meetings Great Room party food preparation family functions by reservation
Small group meetings Great Room party food preparation family functions by reservation
Small group activities family functions by reservation
Houses and capacity 2 20 2 20 3 12 3 12 3 12
Private tubroom Two off the central hallway
Two off the central hallway
One located in each house
One located in each house
None
Private shower areas One per 10 residents located in each wing of each house
One per 10 residents located in each wing of each house
One per resident located in each resident room with the one shared bedroom having a shared shower
One per resident located in each resident room with the one shared bedroom having a shared shower
One per 12 residents located in each house
Resident room doors Split door Split door Split door Regular Split door
Inventory of public rooms and seating capacity (includes all alcoves that can be used for seating and seating areas near exits)
15 165
17 176
15 232
13 219
14 182
Variety and appearance of outdoor Area
2 small (little greenery) 1 medium (mixed hardgreen surfaces) and a large courtyardmdashvery appealing
2 small (much greenery) 1 medium (mixed hardgreen surfaces) 2 large courtyards (1 mixed hardgreen surfaces 1 green) mdash very appealing
3 small (much greenery) 1 large (mostly green courtyard mdash very appealing
3 small (much greenery) and 1 large (mostly green courtyard mdash very appealing
1 small (much greenery) 1 medium (mostly green) and 1 large (mostly green) courtyard mdash very appealing
a Does not include researchteaching wing Total for entire floor space is 40382 sq ft b Room at WDS was not intended as a lounge ie a retreat from work to professionalize the care staff role it was to serve as a place to read and discuss work At other
sites the lunch room also served as a lounge c Room was intended as a multi-purpose room
Mapping Five Sites
37 of 47
Table 2 Therapeutic Environment Screening Scale Items for Goal and Domain Possible Range
Midpoint and Mean in Each Group
Therapeutic Goal and Domain
Item Numbers Range Mid-point ASB amp MDR
20-Capacity Houses MPN MPW amp WDS
12-Capacity Houses
ASB MDR Site Scores
Mean MPN MPW WDS Site Scores
Mean
Safetysecurityhealth
Exit control 2a 2b 2c 2d 2e 2g
2h 3a 3b 0-11 55 2 1 15 1 2 2 17
Maintenance 7b1Dagger 7b2Dagger 7b3Dagger 7b4Dagger 0-8 40 8 8 80 8 8 80
Cleanliness 7a1Dagger 7a2Dagger 7a3 7a4 0-8 40 8 8 80 7 8 8 77
Lack of odorsℓ 9aDagger 9bDagger 0-4 20 4 3 35 4 4 4 40
Safetyℓ 7c1 7c2Dagger 7c3 7c4 8 0-10 60 10 10 100 10 10 10 100
Orientationcuing 19 20ф 27a 27bcDagger
27d 27e 27f 28 29 0-17 85 1212 120 11 9 12 107
Privacycontrol
Privacy 30a 30b 30c 30d 0-4 20 0 0 0 1 2 0 10
Functional ability 16 17a 17b 18Dagger 0-7 35 7 7 70 7 7 7 70
Stimulation
Lighting 21 22a 22bDagger 22cDagger
23a 23b 23c 0-14 70 13 13 130 11 14 13 127
Tactilevisual
stimulation 34 35Dagger 37b 0-16 80 10 6 80 15 14 11 133
Quietness 24a 24b 24c 24d
24eDagger 24f 24g 25 26 0-25 125 21 21 210 19 20 23 207
Physical attractiveness
4a1 4a2 4b1 4b2
4c1 4c2 4d1 4d2 37c 0-34 140 16 15 155 15 16 16 157
Socialization
Homelike
environment 15Dagger 31Dagger 32 0-9 45 9 9 90 9 9 9 90
Resident
appearance 36Dagger
0-2 10 2 2 20 2 2 20
SCUEQS 0-41 - 41 39 40 39 4141 40
CAAQS sect 0-100 - 786 857
Large means represent better physical environment
Dagger Items used to compute the 18-item Special Care Environmental Quality Scale (SCUEQS) 27b and 27c were treated as a single item and item 15 was
misnumbered in the TESS-2+ Revised version (as item 13) ф Item 20 is the percentage of common rooms with signsgraphics floor plans in all sites allowed a view into common rooms (scored as zero) ℓ An item was unintentionally omitted from the TESS-2+ scoring form (10 in Odors and 11 in Safety) sect Composite Above Average Quality Score (CAAQS) represents the percentage of TESS-2+ domains that were above average in quality
Mapping Five Sites
38 of 47
Table 3 Percent of Resident Population Who Were Observed During Behavior Scans
at Each Site in Particular Areasa
AreaSite 20-Capacity Houses 12-Capacity Houses
ASB MDR MPN MPW WDS
Total Areas 608 493 511 564 803
Total Common Areas 62 158 169 200 511
Total Outdoor Areas 46 02 11 56 38
Total House Areas 500 333 331 311 254
House 1 259 168 115 69 62
House 2 241 165 108 128 123
House 3 108 114 69
House Kitchen 149 08 75 53 49
House LivingDining Room 324 278 236 232 200 a Resident data were adjusted to show the mean percent of residents at a site who were observed per scan per day Note Total Areas is the sum of the following Total Common Total Outdoor and Total House Total House Areas is the sum of Houses 1 House 2 and House 3 House Kitchen and LivingDining Rooms are summed across houses Blank cells indicate that the question was not applicable
Mapping Five Sites
39 of 47
Table 4 Percent of Resident Population Who Were Observed During Behavior Scans
at Each Site in Particular Common Areasa
Location 20-Capacity Houses 12-Capacity Houses ASB MDR MPN MPW WDS
Great Room 07 75 94 91 64
Fireplace Seating Area 22 69 43 13 106
ActivityCraft Room 04 47 00 02 10
TV Room ndash ndash 43 64 58
Other TV Area ndash ndash 11 39 ndash
Common Area Hallway Seating 37 108 138 143 396
Music Room ndash ndash 00 ndash 00
Garden Room ndash ndash 00 ndash 04
Beauty Salon 39 12 00 00 00
Family Dining RoomCountry Kitchen 00 09 00 00 00
Total 109 320 329 352 638 a Resident data were adjusted to show the mean percent of residents at a site who were observed per scan per day Note Dashes indicate that residents were not observed in these areas
Mapping Five Sites
40 of 47
Table 5 Percent of Resident Population Who Were Observed During Behavior Scans
at Each Site at Particular Times of Day
Time of Day 20-Capacity Houses 12-Capacity Houses
ASB MDR MPN MPW WDS
Before Lunch 541 360 386 475 654
Lunch 805 663 667 722 1000
Between Meals 657 530 506 589 963
Supper 765 738 744 744 922
After Supper 50 390 447 469 740 a Resident data were adjusted to show the mean percent of residents at a site who were observed per scan per day Note Before Lunch (4 scans-730-1030) Lunch (2 scans-1130 amp 1230) Between Meals (3 scans-1330 to 1530) Supper (2 scans-1630 amp 1730) After Supper (4 scans-1830 to 2130)
Mapping Five Sites
41 of 47
Figure 1 Floor plan of Asbury Place Mt Lebanon PA
Mapping Five Sites
42 of 47
Figure 2 Floor plan of Marjorie Doyle Rockwell Center Cohoes NY
Mapping Five Sites
43 of 47
Figure 3 Floor plan of McConnell Place North Edmonton AB
Mapping Five Sites
44 of 47
Figure 4 Floor plan of McConnell Place West Edmonton AB
Mapping Five Sites
45 of 47
Figure 5 Floor plan of Woodside Place Oakmont PA
Mapping Five Sites
46 of 47
Figure 6
McConnell Place Northordf Residentsrsquo Activities When Alone and in the Presence of Staff
ordf The average MMSE score was 153 at MPN higher than the average across sites 132 + 15 (M+SE) MPN residents appeared not to initiate activities when alone
0
5
10
15
20
25
30
35
40
Alone Day 1 With Staff Day 1 Alone Day 2 With Staff Day 2
Nu
mb
er R
esid
ents
Arts amp Crafts
Chores
CookingBaking
Eating
Exercising
Games
Grooming
Lg Activity Grp
Music Event
Reading
Sm Interaction
Walking
Watching
Watching TV
Other
Mapping Five Sites
47 of 47
Figure 7
Percent of Scans in Which Residents at Each Site Engaged in Particular Behaviors
0
10
20
30
40
50
60
70
80
90
100
ASB MDR MPN MPW WDS
Misc
Just Sit
Watch
Walk
Leisure
Work
ADLs
Mapping Five Sites
22 of 47
houses Compared to other sites MPN and MPW residents engaged in moderate proportions of all
behaviors (Figure 7) Residents at WDS spent proportionately less time on ADLs light
housekeeping and Leisure and more time at Walking Watching and Just Sitting Chi-square
analysis using phi coefficients showed that residents were observed Walking significantly less at
MDR (plt 005) residents at ASB and MDR engaged significantly less in Work and there were no
significant differences between sites in Miscellaneous activities (Figure 7)
Observersrsquo Notes
Some large differences were found in the care programs across sites Observersrsquo notes
indicated that at MPN and MPW residents were encouraged to be involved in the daily routine of the
facility and direct care staff ate meals with residents This strategy was said to stimulate conversation
and provide residents with a model for appropriate behavior Staff played the role of ldquomotherrdquo rising
to find an item in the kitchen and keeping an eye on food consumption Managers at MPN and MPW
considered this role an essential component of care At ASB MDR and WDS there was no evidence
of such a role
Most cooking was done in facility kitchens away from areas that residents could access This
tended to result in the house kitchens being treated more like institutional serveries Fridges mainly
contained large juice jugs and prepared snacks However at MPW and MPN when a resident opened
the fridge door the door was full of condiments and casseroles it looked just like home because of
an effort to keep institutional sized packages to a minimum These two sites used their kitchens quite
differently than the other three sites At MPN and MPW all breakfasts and snacks were prepared in
the houses each day by direct care staff On four weekdays lunches also were prepared Residents
were invited to participate in some of the chopping slicing and mixing which was considered an
essential component of the care program When meals were delivered from nearby facility kitchens
staff decanted items into family-size serving bowls They added condiments and poured drinks
Mapping Five Sites
23 of 47
serving the meals much like those prepared in-house Although residents helping with meal
preparation appeared to be limited to MPN and MPW staff records indicated additional forms of
daily and special occasion activities occurred at all sites Daily activities included easy tasks eg
folding laundry and exercises at all five sites discussion groups at MDR and WDS religious
activities at ASB MPN and MPW musicsinging at ASB MPW and WDS movies at ASB and
grooming at all sites except WDS
Outdoor courtyards were accessible to residents on the observation days at all sites The
barbecue meal at MPW drew the highest number of residents outside but from mid-morning until
early evening residents were seen on the patios or walkways This was true at every site except
MDR where few ventured outside (data not presented)
Disruptive behaviors were seen only at ASB where at 730 am 230 pm and 430 pm a
single resident was disruptive Whether this was the same or different resident is not known the
identity of persons was not recorded This accounted for only 03 of all behaviors seen at ASB (and
was not shown on Figure 7)
Discussion
The TESS-2+scale results clearly indicated that the pioneering WDS site and the four sites
modeled on it met best practice standards in many areas These include the ratings for global site
assessment overall configuration of self-contained living arrangements with adjacent common
spaces informal workspaces for staff and accessible outdoor green spaces walking paths and
maintenance More pertinent to the present study there were no significant differences between the
sites that had 12-capacity houses and those with 20-capacity houses on any TESS items the NIA
subscale of overall environmental quality (SCUEQS) or CAAQS the composite score devised by
Mapping Five Sites
24 of 47
Slaughter et al (2006) Sites with 20-capacity houses did not look substantially different from sites
with 12-capacity houses according to the scale
Behavioral Mapping
A principal finding from behavioral mapping was the amount of time residents were found
engaged in leisure activity at all five sites Leisure was the most frequently observed activity for
MDR MPN and MPW the second most frequent at ASB and the third at WDS The level of
participation in meaningful activities is considered an important measure of residentsrsquo quality of life
(Gonzalez-Salvador et al 2000 Zimmerman et al 2005) Although the extent of engagement is
typically measured in more focused and intensive ways the fact that observers saw residents who
were alert and watching an activity is meaningful because observers were asked to distinguish
whether the resident was ldquojust sittingrdquo or ldquowatchingrdquo if that was the extent of the involvement When
percentages of time spent in Leisure are combined with Activities of Daily Living following the lead
of Gottesman and Bourestom (1974) who combined personal care television and socializing the
results in this study are ASB 468 MDR 701 MPN 471 and MPW 483 All percentages
total are better than the 1974 studyrsquos 43 Only WDS with 261 was substantially worse and that
was largely because so little time was devoted to the evening meal Ice (2002) studying one site had
found only 12 of time spent in social activities however little time was spent Just Sitting or
Watching For the five sites in this study total percentages of these inactive behaviors are ASB
316 MDR 171 MPN 229 MPW 176 and WDS 402 which are all substantially
different than Gottesman and Bourestomrsquos finding of 56 of time engaged in no activity or passive
activity or the 65 seen by (Ice 2002)
Surprisingly the five sites differed in the percent of maximum possible number of sightings
of residents observed in public areas per scan per day ranging from 49 at MDR to 80 at WDS
This range of 38 difference between the lowest and highest sites is considerable The traditional
concern of staff is that residents who stay in their rooms miss out on socialization and planned
Mapping Five Sites
25 of 47
activities (Grade 1976 Hogden 1985) The public areas most frequented by WDS residents were the
fireplace area and the common hallway area At most sites if the residents were not observed in the
common areas it would be likely that they were in the house areas This was confirmed in the other
principal finding that the percent of maximum possible sightings in the house areas was lowest for
WDS at 25 and highest at ASB at 50 At ASB residents spent 80 of their time in their two
houses At WDS they were encouraged to spend their time in the common areas and they did The
houses were used very differently at the two sites and this may have been because the architects who
were very involved in both sites made it evident that they were intended to be used differently
However the use of communal spaces often has little to do with the intended purpose Lawton
(1970) reports that in 10 observational rounds of a facility a total of 13 people were observed in the
nine social rooms on the nine floors while 79 were counted in the main floor social room where
arrivals and departures could be observed Similarly areas around nursing stations and elevators
frequently draw residents (Lawton 1970 Lawton 1977 Snyder 1980)
A number of factors can be ruled out in the search for unique characteristics of WDS that
could have contributed to the above findings The first factor is the reliability of the observers It is
unlikely that the differences were due to variability in the observational skillsprocedures of the
observers because of the high level of agreement in the assessment of interobserver reliability and
because all observers followed the same protocol in collecting the data The observersrsquo reliability was
also attested to by the similarity of the data within sites across the two days of data collection The
second factor is the general floor plan WDS shared the same basic floor plan with MPN and MPW a
building footprint like the capital letter E So it is unlikely that the gross outer shape of the floor plan
was relevant The third more general factor is related to the inter-site comparability of the TESS-2+
data These data indicate that the five sites were remarkably similar in general and internal design
features WDS has ratings on all measures that were comparable to one or more of the other sites
Mapping Five Sites
26 of 47
including potentially relevant measures such as the presence of homelike features the degree of
interaction with staff and residentsrsquo involvement in activities
There are however a number of other factors that may be relevant to understanding the
WDS data WDS was the only site in which meals were served in the common areas as well as in the
house dining rooms Congruently as already noted the highest number of resident sightings at WDS
was in the common areas (fireplace and common hallway) and most of these common area sightings
were in the common areas of WDS adjacent to the central area of the three houses Importantly these
were the only common areas with a direct line of sight to the central hall and kitchen of the central
house (School House) Staff notes indicated that the number of meal servings from the central house
kitchen was twice as high as that of the kitchens of the other two houses at WDS Again there is
congruence resident sightings in the central house dining room although low relative to central
common areas were twice as high as in the dining rooms of the other two houses at WDS It is also
relevant that staff used all parts of the central common area for activity programming Thus it seems
probable that several factors including the internal floor plan meal service and activity
programming made the central common areas of WDS a multiuse area which resulted in high
number of resident sightings though out the day with peaks at meal times It is worth asking whether
WDS staff would have used the central common area so intensely if the house kitchens had been
aligned with the dining rooms providing staff with oversight as in MPN and MPW
These observations could also explain another WDS anomaly that is the low number
of residents seen to be engaged in ADL activities at meal times compared to other sites If the
lower-functioning residents at WDS engaged in other activities in the central common areas
perhaps abandoning a meal to walk or sit elsewhere that could result in fewer observations
of eating during the mealtime Conversely it could mean that it would be more likely that
Mapping Five Sites
27 of 47
other activities (ie watching walking sitting and leisure activities) would be seen during
meal times which was the case in WDS
Finally the unique features of the WDS resident sighting data may have been related to the
greater degree of dementia (lower than average MMSE scores) of WDS residents The average
MMSE scores at other sites were 50 to 100 higher indicating less severe symptoms than the
average WDS score Congruently WDS had relatively high levels of sightings of sitting watching
and walking behavior and the highest number of pacing incidents Thus it is possible that the
differences in degree of dementia between sites and the related differences in levels of ambulation
made it more likely that WDS residents would leave their rooms and therefore WDS residents would
be sighted most frequently in the common areas of the WDS facility
It is important to note that no substantial differences were found between the 20-capacity
and 12-capacity houses that is in the mean domain scores of the TESS which was used to describe
environmental characteristics Scores were much the same across the five sites The TESS has goals
and domains aligned with the general site design which are more architecturally based and those
best aligned with interior design site operations and providing care
The architects might have thought their design at ASB and MDR would result in a small care
group of 10 and that residents along each bedroom hall would form a household but this did not
happen The residents in the 20-capacity houses did not form a 20-resident cluster either instead they
formed small groups for eating and activities Therefore other factors such as early or late rising or
naturally-formed friendships may be a greater influence than bedroom proximity The addition of
eight more residents per house might be anticipated to lead to crowding in the housesrsquo living-dining
areas or some other notable difference However crowding was not evident in the 20-capacity
houses In fact WDS gatherings in the common areas were more apt to be viewed as crowds
Mapping Five Sites
28 of 47
Observations indicated there that Disruptive Behavior often attributed to crowding was rare It
occurred in only one site and therefore could not be associated with a particular design
These observational results combined with the TESS results have broad implications for
future studies The first implication is methodological and the second is empirical Methodologically
the combination of architectural and behavioral measures in studies of facilities for the elderly
highlights the advantages over methodologies that employ only behavioral measures eg Dementia
Care Mapping (Brooker 2005 Fulton Edelman amp Kuhn 2006 Sloane Brooker Cohen et al
2007) and over studies that rely on client interviews (Kane 2003) Empirically 20 residents in a
house is approaching the size of dementia units in some nursing homes The present study revealed
that the main difference seen in the operation of the 12-resident house and the 20-resident house
design was that the latter appeared to hold more activities within the house raising questions about
the value and need for those common spaces whereas the former made more use of the common
spaces for activities In this way behavior was affected by the house design and by the way that staff
chose to organize activities
Mapping Five Sites
29 of 47
References
Benson D M Cameron D Humbach E Servino L amp Gambert S R (1987) Establishment and
impact of a dementia unit within the nursing home Journal of the American Geriatrics Society
35 319-323
Brawley E C (1997) Designing for Alzheimerrsquos disease Strategies for creating better care
environments New York Wiley
Brooker D (2005) Dementia Care Mapping A review of the research literature The Gerontologist
45 Special Issue I 11ndash18
Calkins M P Meehan R A amp Lipstreuer E (1999) Creekview Its history and evaluation
Kirtland OH IDEAS Inc
Colling K B (1999) Passive behaviors in Alzheimer disease A descriptive analysis American
Journal of Alzheimers Disease and Other Dementias 14 27-40
Cronin-Golumb A (1995) Vision in Alzheimerrsquos disease The Gerontologist 35 370-376
Day K Carreon D amp Stump C (2000) The therapeutic design of environments for people with
dementia A review of the empirical research The Gerontologist 40 397-416
Deely B Klingensmith L amp Silverman M (1995) Developing a residential Alzheimers facility
Focus on Geriatric Care and Rehabilitation 8(7) 1-8
DiMotta S Dubney B M Hoglund J D amp Kershner C (1993) Long-term care design Blazing
new territory - code reform and beyond Journal of Healthcare Design 5 197-203
DiMotta S amp Hoglund J D (2000) Woodside Place A residential care model for the Alzheimerrsquos
and dementia resident Symposium on Healthcare Design Anaheim CA Center for Healthcare
Design
Mapping Five Sites
30 of 47
Doty M M Koren M J amp Sturla E L (2008) Culture change in nursing homes How far have
we come Findings from The Commonwealth Fund 2007 National Survey of Nursing Homes
New York The Commonwealth Fund
Edelman P Fulton B R Kuhn D amp Chang C H (2005) A comparison of three methods of
measuring dementia-specific quality of life Perspectives of residents staff and observers The
Gerontologist 45 27-36
Fleiss J L (1981) Statistical methods for rates and proportions (2nd ed) New York John Wiley amp
Son
Folstein M F Folstein S E amp McHugh P R (1975) Mini-Mental State a practical method for
grading the cognitive state of patients for the clinician Journal of Geriatric Research 12 189-
198
Fulton B R Edelman P amp Kuhn D (2006) Streamlined models of dementia care mapping
Aging amp Mental Health 10 343-351
Gold D T (1991) A descriptive typology of dementia units In P D Sloane amp L J Mathew (Eds)
Dementia units in long-term care (pp 50-61) Baltimore Johns Hopkins University Press
Gonzalez-Salvador T Lyketsos C G Baker A Hovanec L Roques C Brandt J et al (2000)
Quality of Life in dementia patients in long-term care International Journal of Geriatric
Psychiatry 15 181-189
Gottesman L E amp Bourestom N C (1974) Why nursing homes do what they do The
Gerontologist 14 501-506
Grade B L (1976) A study of the entry crisis to a nursing home Unpublished masterrsquos thesis
University of Wisconsin Milwaukee
Grant L A (1998) Beyond the dichotomy An empirical typology of Alzheimerrsquos care in nursing
homes Research on Aging 20 569-592
Mapping Five Sites
31 of 47
Greene J A Asp J amp Crane N (1985) Specialized management of the Alzheimerrsquos disease
patient Does it make a difference A preliminary progress report Journal of the Tennessee
Medical Association 78 559-563
Harper G J (1998) Stress and adaptation among elders in life care communities Unpublished
doctoral dissertation Ohio State University Columbus
Hogden K M (1985) Leisurerecreation needs of hospitalized elderly A task force report
Activities Adaptation amp Aging 7 53-65
Hoglund D J amp Ledewitz S D (1999) Designing to meet the needs of people with Alzheimerrsquos
disease In B Schwarz amp R Brent (Eds) Aging autonomy and architecture Advances in
assisted living (pp 229-261) Baltimore John Hopkins University Press
Ice G H (2002) Daily life in a nursing home has it changed in 25 years Journal of Aging Studies
16 345-359
Imamoğlu Ccedil (2007) Assisted living as a new place schema A comparison with homes and nursing
homes Environment and Behavior 39 246-268
Innes A amp Surr C (2001) Measuring the well-being of people with dementia living in formal care
settings The use of Dementia Care Mapping Aging and Mental Health 5 258-268
Kane R A (2003) Definition measurement and correlates of quality of life in nursing homes
Toward a reasonable practice research and policy agenda The Gerontologist 43 Special
Issue II 28ndash36
Kuhn D Kasayka R E amp Lechner C (2002) Behavioral observations and quality life among
persons with dementia in 10 assisted living facilities American Journal of Alzheimerrsquos Disease
and Other Dementias 17 291-298
Lawton M P (1970) Ecology and aging In L A Pastaland amp D H Carson (Eds) The spatial
behavior of older people (pp 41-67) Ann Arbor MI University of Michigan Press
Mapping Five Sites
32 of 47
Lawton M P (1977) The impact of the environment on aging and behavior In K W Schaie (Ed)
Handbook of the Psychology of Aging (pp 276-301) New York Van Nostrand Reinhold
Lawton M P Weisman G D Sloane P amp Calkins M (1997) Assessing environments for older
people with chronic illness Journal of Mental Health and Aging 3 83-100
Lawton M P Weisman G D Sloane P Norris-Baker C Calkins M amp Zimmerman S I
(2000) Professional Environmental Assessment Procedure for special care units for elders with
dementing illness and its relationship to the Therapeutic Environment Screening Schedule
Alzheimer Disease and Associated Disorders 14 28ndash38
Lee M Madden V Mason K Rice S Wyburd J amp Hobson S (2006) Occupational
engagement and adaptation in adults with dementia A preliminary investigation Physical and
Occupational Therapy in Geriatrics 25 63-81
Lehrner P N (1979) Handbook of ethological methods New York Garland STMP
Margulis S T (2003) Privacy as a social issue and behavioral concept Journal of Social Issues 59
243-261
Martin P amp Bateson P (1987) Measuring behaviour An introductory guide New York
Cambridge University Press
Mathew L J amp Sloane P D (1991) Organizing and staffing dementia units In P D Sloane amp L
J Mathew (Eds) Dementia units in long-term care (pp 101-127) Baltimore Johns Hopkins
University Press
McAllister C L amp Silverman M A (1999) Community formation and community roles among
persons with Alzheimerrsquos disease A comparative study of experience in a residential
Alzheimerrsquos facility and a traditional nursing home Qualitative Health Research 9 65-85
McCracken A L amp Fitzwater E (1989) The right environment for Alzheimerrsquos Geriatric
Nursing 10 293-294
Mapping Five Sites
33 of 47
Milke D L (2003) Iterative post-occupancy evaluations of the McConnell Place North design
[Abstract] Proceedings of the 56th Annual Scientific Meeting of the Gerontological Society of
America 43 48 San Diego CA
Milke D L Clark C amp Bucknell M (2000) Assessing the adequacy of residential lighting in two
care centres for persons with Alzheimerrsquos Disease using the new age-adjusted North American
illumination recommendations (Research Report) Ottawa Ontario Canada Canada Mortgage
and Housing Corporation
National Institute on Aging Coordinating Center (1993) NIA collaborative studies special care units
for Alzheimers disease Manual of procedures Davis CA Northern California Alzheimers
Disease Center University of California
Rabig J Thomas W Kane R A Cutler L J amp McAlilly S (2006) Radical redesign of nursing
homes Applying the Green House concept in Tupelo Mississippi The Gerontologist 46 533-
539
Rule B G Milke D L amp Dobbs A R (1992) Design of institutions Cognitive functioning and
social interactions of the aged resident Journal of Applied Gerontology 11 475-488
Saxton J Silverman M Ricci E Keane C amp Deely B (1998) Maintenance of mobility in
residents of an Alzheimer special care facility International Psychogeriatrics 10 213-224
Schwarz B Chaudhury H amp Tofle R B (2004) Effect of design interventions on a dementia care
setting American Journal of Alzheimers Disease and Other Dementias 19 172-176
Silverman M Ricci E Saxton J Ledewitz S McAllister C amp Keane C (1995) Woodside
Place The first three years of a residential Alzheimerrsquos facility (Vols 1-2) Oakmont PA
Presbyterian Senior Care
Skea D amp Lindesay J (1996) An evaluation of two models of long-term residential care for
elderly people with dementia International Journal of Geriatric Psychiatry 11 233-241
Mapping Five Sites
34 of 47
Slaughter S Calkins M Eliasziw M amp Reimer M (2006) Measuring physical and social
environments in nursing homes for people with middle- to late-stage dementia Journal of the
American Geriatrics Society 54 1436-1441
Sloane P D Brooker D Cohen L Douglass C Edelman P Fulton B R et al (2007)
Dementia Care Mapping as a research tool International Journal of Geriatric Psychiatry 22
580-589
Sloane P D Mitchell M Priesser J S Phillips C Commander C amp Burker E (1998)
Environmental correlates of resident agitation in Alzheimerrsquos disease special care units Journal
of the American Geriatric Society 46 862ndash869
Sloane P D Mitchell C M Weisman G Zimmerman S Foley K M L Lynn M et al
(2002) The Therapeutic Environment Screening Survey for Nursing Homes (TESS-NH) An
observational instrument for assessing the physical environment of institutional settings for
persons with dementia Journals of Gerontology Series B Psychological Sciences and Social
Sciences 57B(Suppl 2) S69-S78
Sloane P D Zimmerman S Williams C S Reed P S Gill KS amp Preisser J S (2005)
Evaluating the quality of life of long-term care residents with dementia The Gerontologist 45
37-49
Snyder L G (1980) An exploratory study of patterns of social interaction organization and facility
design in three nursing homes In J Hendricks (Ed) Institutionalization and Alternative Futures
(pp 68-80) Farmingdale NY Baywood Pub Co
Sommer R amp Sommer B B (1986) A practical guide to behavioral research Tools and
techniques (2nd ed) New York Oxford
Van Haitsma K Lawton M P amp Kleban M H (2000) Does segregation help or hinder
Examining the role of heterogeneity in behavioral and emotional aspects of quality of life for
Mapping Five Sites
35 of 47
persons with cognitive impairment in the nursing home Research and Practice in Alzheimerrsquos
Disease 4 163-177
Verbeek H van Rossum E Zwakhalen S M G Kempen G I J M amp Hamers J P H (2009)
Small homelike care environments for older people with dementia A literature review
International Psychogeriatrics 21 252-264
Voelkl J E (2006) Therapeutic environments in nursing homes Fostering residents meaningful
activity engagement Activities Directors Quarterly for Alzheimers and Other Dementia
Patients 7(3) 35-44
Warren S (Ed) (1998) Innovative dementia care McConnell Place North evaluation (Research
Report) Edmonton Alberta Canada Evaluating Programs of Innovative Continuing Care
Zeisel J (1998) The Hearthstone health environments case study Journal of Healthcare Design
Proceedings from the Symposium on Healthcare Design San Francisco CA National
Symposium on Healthcare Design Inc
Zeisel J Hyde J amp Levkoff S (1994) Best practices An environment-behavior (E-B) model for
Alzheimer special care units American Journal of Alzheimerrsquos Care and Related Disorders and
Research and Care 9(2) 4-21
Zimmerman S Sloane P D Williams C S Reed P S Preisser J S Eckert J K et al (2005)
Dementia care and quality of life in assisted living and nursing homes The Gerontologist 45
133-146
Mapping Five Sites
36 of 47
Table 1 Comparison of Architectural Features Across Five Sites
Feature ASB MDR MPN MPW WDS
Total facility square footage 23040 sq ft 27308 sq fta 24750 sq ft 23864 sq ft 21540 sq ft
Size of administration area (offices conference reception etc but not service or employee spaces)
960 sq ft (No entry hall)
1584 sq ft day program offices and program space
1675 sq ft 1629 sq ft 972 sq ft (No entry hall)
Staff (lunch) room 16rsquo x 18rsquo 6rsquo11rdquo x 6rsquo2rdquo 158rsquo x 16rsquo 138rsquo x 16rsquo 95rsquo x 30rsquo (plus)b
Treatment or examination room
No Yes In daycare area
No No Yes In central
areac
Medications storage Central medication cart
Medication room Medication room per house
Medication room per house
Central medication cart
Location of meal preparation
Facility kitchen in administration area
Facility kitchen in administration area
Adjacent nursing home (see house kitchen)
Adjacent nursing home (see house kitchen)
Facility kitchen in administration area
Use of house kitchen Servery snacks Servery snacks Meal preparation for all breakfasts and some lunches servery
Meal preparation for all breakfasts and some lunches servery
Servery snacks
Family dining room or central country kitchen usage
Small group activities family functions by reservation
Small group activities family functions by reservation
Small group meetings Great Room party food preparation family functions by reservation
Small group meetings Great Room party food preparation family functions by reservation
Small group activities family functions by reservation
Houses and capacity 2 20 2 20 3 12 3 12 3 12
Private tubroom Two off the central hallway
Two off the central hallway
One located in each house
One located in each house
None
Private shower areas One per 10 residents located in each wing of each house
One per 10 residents located in each wing of each house
One per resident located in each resident room with the one shared bedroom having a shared shower
One per resident located in each resident room with the one shared bedroom having a shared shower
One per 12 residents located in each house
Resident room doors Split door Split door Split door Regular Split door
Inventory of public rooms and seating capacity (includes all alcoves that can be used for seating and seating areas near exits)
15 165
17 176
15 232
13 219
14 182
Variety and appearance of outdoor Area
2 small (little greenery) 1 medium (mixed hardgreen surfaces) and a large courtyardmdashvery appealing
2 small (much greenery) 1 medium (mixed hardgreen surfaces) 2 large courtyards (1 mixed hardgreen surfaces 1 green) mdash very appealing
3 small (much greenery) 1 large (mostly green courtyard mdash very appealing
3 small (much greenery) and 1 large (mostly green courtyard mdash very appealing
1 small (much greenery) 1 medium (mostly green) and 1 large (mostly green) courtyard mdash very appealing
a Does not include researchteaching wing Total for entire floor space is 40382 sq ft b Room at WDS was not intended as a lounge ie a retreat from work to professionalize the care staff role it was to serve as a place to read and discuss work At other
sites the lunch room also served as a lounge c Room was intended as a multi-purpose room
Mapping Five Sites
37 of 47
Table 2 Therapeutic Environment Screening Scale Items for Goal and Domain Possible Range
Midpoint and Mean in Each Group
Therapeutic Goal and Domain
Item Numbers Range Mid-point ASB amp MDR
20-Capacity Houses MPN MPW amp WDS
12-Capacity Houses
ASB MDR Site Scores
Mean MPN MPW WDS Site Scores
Mean
Safetysecurityhealth
Exit control 2a 2b 2c 2d 2e 2g
2h 3a 3b 0-11 55 2 1 15 1 2 2 17
Maintenance 7b1Dagger 7b2Dagger 7b3Dagger 7b4Dagger 0-8 40 8 8 80 8 8 80
Cleanliness 7a1Dagger 7a2Dagger 7a3 7a4 0-8 40 8 8 80 7 8 8 77
Lack of odorsℓ 9aDagger 9bDagger 0-4 20 4 3 35 4 4 4 40
Safetyℓ 7c1 7c2Dagger 7c3 7c4 8 0-10 60 10 10 100 10 10 10 100
Orientationcuing 19 20ф 27a 27bcDagger
27d 27e 27f 28 29 0-17 85 1212 120 11 9 12 107
Privacycontrol
Privacy 30a 30b 30c 30d 0-4 20 0 0 0 1 2 0 10
Functional ability 16 17a 17b 18Dagger 0-7 35 7 7 70 7 7 7 70
Stimulation
Lighting 21 22a 22bDagger 22cDagger
23a 23b 23c 0-14 70 13 13 130 11 14 13 127
Tactilevisual
stimulation 34 35Dagger 37b 0-16 80 10 6 80 15 14 11 133
Quietness 24a 24b 24c 24d
24eDagger 24f 24g 25 26 0-25 125 21 21 210 19 20 23 207
Physical attractiveness
4a1 4a2 4b1 4b2
4c1 4c2 4d1 4d2 37c 0-34 140 16 15 155 15 16 16 157
Socialization
Homelike
environment 15Dagger 31Dagger 32 0-9 45 9 9 90 9 9 9 90
Resident
appearance 36Dagger
0-2 10 2 2 20 2 2 20
SCUEQS 0-41 - 41 39 40 39 4141 40
CAAQS sect 0-100 - 786 857
Large means represent better physical environment
Dagger Items used to compute the 18-item Special Care Environmental Quality Scale (SCUEQS) 27b and 27c were treated as a single item and item 15 was
misnumbered in the TESS-2+ Revised version (as item 13) ф Item 20 is the percentage of common rooms with signsgraphics floor plans in all sites allowed a view into common rooms (scored as zero) ℓ An item was unintentionally omitted from the TESS-2+ scoring form (10 in Odors and 11 in Safety) sect Composite Above Average Quality Score (CAAQS) represents the percentage of TESS-2+ domains that were above average in quality
Mapping Five Sites
38 of 47
Table 3 Percent of Resident Population Who Were Observed During Behavior Scans
at Each Site in Particular Areasa
AreaSite 20-Capacity Houses 12-Capacity Houses
ASB MDR MPN MPW WDS
Total Areas 608 493 511 564 803
Total Common Areas 62 158 169 200 511
Total Outdoor Areas 46 02 11 56 38
Total House Areas 500 333 331 311 254
House 1 259 168 115 69 62
House 2 241 165 108 128 123
House 3 108 114 69
House Kitchen 149 08 75 53 49
House LivingDining Room 324 278 236 232 200 a Resident data were adjusted to show the mean percent of residents at a site who were observed per scan per day Note Total Areas is the sum of the following Total Common Total Outdoor and Total House Total House Areas is the sum of Houses 1 House 2 and House 3 House Kitchen and LivingDining Rooms are summed across houses Blank cells indicate that the question was not applicable
Mapping Five Sites
39 of 47
Table 4 Percent of Resident Population Who Were Observed During Behavior Scans
at Each Site in Particular Common Areasa
Location 20-Capacity Houses 12-Capacity Houses ASB MDR MPN MPW WDS
Great Room 07 75 94 91 64
Fireplace Seating Area 22 69 43 13 106
ActivityCraft Room 04 47 00 02 10
TV Room ndash ndash 43 64 58
Other TV Area ndash ndash 11 39 ndash
Common Area Hallway Seating 37 108 138 143 396
Music Room ndash ndash 00 ndash 00
Garden Room ndash ndash 00 ndash 04
Beauty Salon 39 12 00 00 00
Family Dining RoomCountry Kitchen 00 09 00 00 00
Total 109 320 329 352 638 a Resident data were adjusted to show the mean percent of residents at a site who were observed per scan per day Note Dashes indicate that residents were not observed in these areas
Mapping Five Sites
40 of 47
Table 5 Percent of Resident Population Who Were Observed During Behavior Scans
at Each Site at Particular Times of Day
Time of Day 20-Capacity Houses 12-Capacity Houses
ASB MDR MPN MPW WDS
Before Lunch 541 360 386 475 654
Lunch 805 663 667 722 1000
Between Meals 657 530 506 589 963
Supper 765 738 744 744 922
After Supper 50 390 447 469 740 a Resident data were adjusted to show the mean percent of residents at a site who were observed per scan per day Note Before Lunch (4 scans-730-1030) Lunch (2 scans-1130 amp 1230) Between Meals (3 scans-1330 to 1530) Supper (2 scans-1630 amp 1730) After Supper (4 scans-1830 to 2130)
Mapping Five Sites
41 of 47
Figure 1 Floor plan of Asbury Place Mt Lebanon PA
Mapping Five Sites
42 of 47
Figure 2 Floor plan of Marjorie Doyle Rockwell Center Cohoes NY
Mapping Five Sites
43 of 47
Figure 3 Floor plan of McConnell Place North Edmonton AB
Mapping Five Sites
44 of 47
Figure 4 Floor plan of McConnell Place West Edmonton AB
Mapping Five Sites
45 of 47
Figure 5 Floor plan of Woodside Place Oakmont PA
Mapping Five Sites
46 of 47
Figure 6
McConnell Place Northordf Residentsrsquo Activities When Alone and in the Presence of Staff
ordf The average MMSE score was 153 at MPN higher than the average across sites 132 + 15 (M+SE) MPN residents appeared not to initiate activities when alone
0
5
10
15
20
25
30
35
40
Alone Day 1 With Staff Day 1 Alone Day 2 With Staff Day 2
Nu
mb
er R
esid
ents
Arts amp Crafts
Chores
CookingBaking
Eating
Exercising
Games
Grooming
Lg Activity Grp
Music Event
Reading
Sm Interaction
Walking
Watching
Watching TV
Other
Mapping Five Sites
47 of 47
Figure 7
Percent of Scans in Which Residents at Each Site Engaged in Particular Behaviors
0
10
20
30
40
50
60
70
80
90
100
ASB MDR MPN MPW WDS
Misc
Just Sit
Watch
Walk
Leisure
Work
ADLs

Mapping Five Sites
25 of 47
activities (Grade 1976 Hogden 1985) The public areas most frequented by WDS residents were the
fireplace area and the common hallway area At most sites if the residents were not observed in the
common areas it would be likely that they were in the house areas This was confirmed in the other
principal finding that the percent of maximum possible sightings in the house areas was lowest for
WDS at 25 and highest at ASB at 50 At ASB residents spent 80 of their time in their two
houses At WDS they were encouraged to spend their time in the common areas and they did The
houses were used very differently at the two sites and this may have been because the architects who
were very involved in both sites made it evident that they were intended to be used differently
However the use of communal spaces often has little to do with the intended purpose Lawton
(1970) reports that in 10 observational rounds of a facility a total of 13 people were observed in the
nine social rooms on the nine floors while 79 were counted in the main floor social room where
arrivals and departures could be observed Similarly areas around nursing stations and elevators
frequently draw residents (Lawton 1970 Lawton 1977 Snyder 1980)
A number of factors can be ruled out in the search for unique characteristics of WDS that
could have contributed to the above findings The first factor is the reliability of the observers It is
unlikely that the differences were due to variability in the observational skillsprocedures of the
observers because of the high level of agreement in the assessment of interobserver reliability and
because all observers followed the same protocol in collecting the data The observersrsquo reliability was
also attested to by the similarity of the data within sites across the two days of data collection The
second factor is the general floor plan WDS shared the same basic floor plan with MPN and MPW a
building footprint like the capital letter E So it is unlikely that the gross outer shape of the floor plan
was relevant The third more general factor is related to the inter-site comparability of the TESS-2+
data These data indicate that the five sites were remarkably similar in general and internal design
features WDS has ratings on all measures that were comparable to one or more of the other sites
Mapping Five Sites
26 of 47
including potentially relevant measures such as the presence of homelike features the degree of
interaction with staff and residentsrsquo involvement in activities
There are however a number of other factors that may be relevant to understanding the
WDS data WDS was the only site in which meals were served in the common areas as well as in the
house dining rooms Congruently as already noted the highest number of resident sightings at WDS
was in the common areas (fireplace and common hallway) and most of these common area sightings
were in the common areas of WDS adjacent to the central area of the three houses Importantly these
were the only common areas with a direct line of sight to the central hall and kitchen of the central
house (School House) Staff notes indicated that the number of meal servings from the central house
kitchen was twice as high as that of the kitchens of the other two houses at WDS Again there is
congruence resident sightings in the central house dining room although low relative to central
common areas were twice as high as in the dining rooms of the other two houses at WDS It is also
relevant that staff used all parts of the central common area for activity programming Thus it seems
probable that several factors including the internal floor plan meal service and activity
programming made the central common areas of WDS a multiuse area which resulted in high
number of resident sightings though out the day with peaks at meal times It is worth asking whether
WDS staff would have used the central common area so intensely if the house kitchens had been
aligned with the dining rooms providing staff with oversight as in MPN and MPW
These observations could also explain another WDS anomaly that is the low number
of residents seen to be engaged in ADL activities at meal times compared to other sites If the
lower-functioning residents at WDS engaged in other activities in the central common areas
perhaps abandoning a meal to walk or sit elsewhere that could result in fewer observations
of eating during the mealtime Conversely it could mean that it would be more likely that
Mapping Five Sites
27 of 47
other activities (ie watching walking sitting and leisure activities) would be seen during
meal times which was the case in WDS
Finally the unique features of the WDS resident sighting data may have been related to the
greater degree of dementia (lower than average MMSE scores) of WDS residents The average
MMSE scores at other sites were 50 to 100 higher indicating less severe symptoms than the
average WDS score Congruently WDS had relatively high levels of sightings of sitting watching
and walking behavior and the highest number of pacing incidents Thus it is possible that the
differences in degree of dementia between sites and the related differences in levels of ambulation
made it more likely that WDS residents would leave their rooms and therefore WDS residents would
be sighted most frequently in the common areas of the WDS facility
It is important to note that no substantial differences were found between the 20-capacity
and 12-capacity houses that is in the mean domain scores of the TESS which was used to describe
environmental characteristics Scores were much the same across the five sites The TESS has goals
and domains aligned with the general site design which are more architecturally based and those
best aligned with interior design site operations and providing care
The architects might have thought their design at ASB and MDR would result in a small care
group of 10 and that residents along each bedroom hall would form a household but this did not
happen The residents in the 20-capacity houses did not form a 20-resident cluster either instead they
formed small groups for eating and activities Therefore other factors such as early or late rising or
naturally-formed friendships may be a greater influence than bedroom proximity The addition of
eight more residents per house might be anticipated to lead to crowding in the housesrsquo living-dining
areas or some other notable difference However crowding was not evident in the 20-capacity
houses In fact WDS gatherings in the common areas were more apt to be viewed as crowds
Mapping Five Sites
28 of 47
Observations indicated there that Disruptive Behavior often attributed to crowding was rare It
occurred in only one site and therefore could not be associated with a particular design
These observational results combined with the TESS results have broad implications for
future studies The first implication is methodological and the second is empirical Methodologically
the combination of architectural and behavioral measures in studies of facilities for the elderly
highlights the advantages over methodologies that employ only behavioral measures eg Dementia
Care Mapping (Brooker 2005 Fulton Edelman amp Kuhn 2006 Sloane Brooker Cohen et al
2007) and over studies that rely on client interviews (Kane 2003) Empirically 20 residents in a
house is approaching the size of dementia units in some nursing homes The present study revealed
that the main difference seen in the operation of the 12-resident house and the 20-resident house
design was that the latter appeared to hold more activities within the house raising questions about
the value and need for those common spaces whereas the former made more use of the common
spaces for activities In this way behavior was affected by the house design and by the way that staff
chose to organize activities
Mapping Five Sites
29 of 47
References
Benson D M Cameron D Humbach E Servino L amp Gambert S R (1987) Establishment and
impact of a dementia unit within the nursing home Journal of the American Geriatrics Society
35 319-323
Brawley E C (1997) Designing for Alzheimerrsquos disease Strategies for creating better care
environments New York Wiley
Brooker D (2005) Dementia Care Mapping A review of the research literature The Gerontologist
45 Special Issue I 11ndash18
Calkins M P Meehan R A amp Lipstreuer E (1999) Creekview Its history and evaluation
Kirtland OH IDEAS Inc
Colling K B (1999) Passive behaviors in Alzheimer disease A descriptive analysis American
Journal of Alzheimers Disease and Other Dementias 14 27-40
Cronin-Golumb A (1995) Vision in Alzheimerrsquos disease The Gerontologist 35 370-376
Day K Carreon D amp Stump C (2000) The therapeutic design of environments for people with
dementia A review of the empirical research The Gerontologist 40 397-416
Deely B Klingensmith L amp Silverman M (1995) Developing a residential Alzheimers facility
Focus on Geriatric Care and Rehabilitation 8(7) 1-8
DiMotta S Dubney B M Hoglund J D amp Kershner C (1993) Long-term care design Blazing
new territory - code reform and beyond Journal of Healthcare Design 5 197-203
DiMotta S amp Hoglund J D (2000) Woodside Place A residential care model for the Alzheimerrsquos
and dementia resident Symposium on Healthcare Design Anaheim CA Center for Healthcare
Design
Mapping Five Sites
30 of 47
Doty M M Koren M J amp Sturla E L (2008) Culture change in nursing homes How far have
we come Findings from The Commonwealth Fund 2007 National Survey of Nursing Homes
New York The Commonwealth Fund
Edelman P Fulton B R Kuhn D amp Chang C H (2005) A comparison of three methods of
measuring dementia-specific quality of life Perspectives of residents staff and observers The
Gerontologist 45 27-36
Fleiss J L (1981) Statistical methods for rates and proportions (2nd ed) New York John Wiley amp
Son
Folstein M F Folstein S E amp McHugh P R (1975) Mini-Mental State a practical method for
grading the cognitive state of patients for the clinician Journal of Geriatric Research 12 189-
198
Fulton B R Edelman P amp Kuhn D (2006) Streamlined models of dementia care mapping
Aging amp Mental Health 10 343-351
Gold D T (1991) A descriptive typology of dementia units In P D Sloane amp L J Mathew (Eds)
Dementia units in long-term care (pp 50-61) Baltimore Johns Hopkins University Press
Gonzalez-Salvador T Lyketsos C G Baker A Hovanec L Roques C Brandt J et al (2000)
Quality of Life in dementia patients in long-term care International Journal of Geriatric
Psychiatry 15 181-189
Gottesman L E amp Bourestom N C (1974) Why nursing homes do what they do The
Gerontologist 14 501-506
Grade B L (1976) A study of the entry crisis to a nursing home Unpublished masterrsquos thesis
University of Wisconsin Milwaukee
Grant L A (1998) Beyond the dichotomy An empirical typology of Alzheimerrsquos care in nursing
homes Research on Aging 20 569-592
Mapping Five Sites
31 of 47
Greene J A Asp J amp Crane N (1985) Specialized management of the Alzheimerrsquos disease
patient Does it make a difference A preliminary progress report Journal of the Tennessee
Medical Association 78 559-563
Harper G J (1998) Stress and adaptation among elders in life care communities Unpublished
doctoral dissertation Ohio State University Columbus
Hogden K M (1985) Leisurerecreation needs of hospitalized elderly A task force report
Activities Adaptation amp Aging 7 53-65
Hoglund D J amp Ledewitz S D (1999) Designing to meet the needs of people with Alzheimerrsquos
disease In B Schwarz amp R Brent (Eds) Aging autonomy and architecture Advances in
assisted living (pp 229-261) Baltimore John Hopkins University Press
Ice G H (2002) Daily life in a nursing home has it changed in 25 years Journal of Aging Studies
16 345-359
Imamoğlu Ccedil (2007) Assisted living as a new place schema A comparison with homes and nursing
homes Environment and Behavior 39 246-268
Innes A amp Surr C (2001) Measuring the well-being of people with dementia living in formal care
settings The use of Dementia Care Mapping Aging and Mental Health 5 258-268
Kane R A (2003) Definition measurement and correlates of quality of life in nursing homes
Toward a reasonable practice research and policy agenda The Gerontologist 43 Special
Issue II 28ndash36
Kuhn D Kasayka R E amp Lechner C (2002) Behavioral observations and quality life among
persons with dementia in 10 assisted living facilities American Journal of Alzheimerrsquos Disease
and Other Dementias 17 291-298
Lawton M P (1970) Ecology and aging In L A Pastaland amp D H Carson (Eds) The spatial
behavior of older people (pp 41-67) Ann Arbor MI University of Michigan Press
Mapping Five Sites
32 of 47
Lawton M P (1977) The impact of the environment on aging and behavior In K W Schaie (Ed)
Handbook of the Psychology of Aging (pp 276-301) New York Van Nostrand Reinhold
Lawton M P Weisman G D Sloane P amp Calkins M (1997) Assessing environments for older
people with chronic illness Journal of Mental Health and Aging 3 83-100
Lawton M P Weisman G D Sloane P Norris-Baker C Calkins M amp Zimmerman S I
(2000) Professional Environmental Assessment Procedure for special care units for elders with
dementing illness and its relationship to the Therapeutic Environment Screening Schedule
Alzheimer Disease and Associated Disorders 14 28ndash38
Lee M Madden V Mason K Rice S Wyburd J amp Hobson S (2006) Occupational
engagement and adaptation in adults with dementia A preliminary investigation Physical and
Occupational Therapy in Geriatrics 25 63-81
Lehrner P N (1979) Handbook of ethological methods New York Garland STMP
Margulis S T (2003) Privacy as a social issue and behavioral concept Journal of Social Issues 59
243-261
Martin P amp Bateson P (1987) Measuring behaviour An introductory guide New York
Cambridge University Press
Mathew L J amp Sloane P D (1991) Organizing and staffing dementia units In P D Sloane amp L
J Mathew (Eds) Dementia units in long-term care (pp 101-127) Baltimore Johns Hopkins
University Press
McAllister C L amp Silverman M A (1999) Community formation and community roles among
persons with Alzheimerrsquos disease A comparative study of experience in a residential
Alzheimerrsquos facility and a traditional nursing home Qualitative Health Research 9 65-85
McCracken A L amp Fitzwater E (1989) The right environment for Alzheimerrsquos Geriatric
Nursing 10 293-294
Mapping Five Sites
33 of 47
Milke D L (2003) Iterative post-occupancy evaluations of the McConnell Place North design
[Abstract] Proceedings of the 56th Annual Scientific Meeting of the Gerontological Society of
America 43 48 San Diego CA
Milke D L Clark C amp Bucknell M (2000) Assessing the adequacy of residential lighting in two
care centres for persons with Alzheimerrsquos Disease using the new age-adjusted North American
illumination recommendations (Research Report) Ottawa Ontario Canada Canada Mortgage
and Housing Corporation
National Institute on Aging Coordinating Center (1993) NIA collaborative studies special care units
for Alzheimers disease Manual of procedures Davis CA Northern California Alzheimers
Disease Center University of California
Rabig J Thomas W Kane R A Cutler L J amp McAlilly S (2006) Radical redesign of nursing
homes Applying the Green House concept in Tupelo Mississippi The Gerontologist 46 533-
539
Rule B G Milke D L amp Dobbs A R (1992) Design of institutions Cognitive functioning and
social interactions of the aged resident Journal of Applied Gerontology 11 475-488
Saxton J Silverman M Ricci E Keane C amp Deely B (1998) Maintenance of mobility in
residents of an Alzheimer special care facility International Psychogeriatrics 10 213-224
Schwarz B Chaudhury H amp Tofle R B (2004) Effect of design interventions on a dementia care
setting American Journal of Alzheimers Disease and Other Dementias 19 172-176
Silverman M Ricci E Saxton J Ledewitz S McAllister C amp Keane C (1995) Woodside
Place The first three years of a residential Alzheimerrsquos facility (Vols 1-2) Oakmont PA
Presbyterian Senior Care
Skea D amp Lindesay J (1996) An evaluation of two models of long-term residential care for
elderly people with dementia International Journal of Geriatric Psychiatry 11 233-241
Mapping Five Sites
34 of 47
Slaughter S Calkins M Eliasziw M amp Reimer M (2006) Measuring physical and social
environments in nursing homes for people with middle- to late-stage dementia Journal of the
American Geriatrics Society 54 1436-1441
Sloane P D Brooker D Cohen L Douglass C Edelman P Fulton B R et al (2007)
Dementia Care Mapping as a research tool International Journal of Geriatric Psychiatry 22
580-589
Sloane P D Mitchell M Priesser J S Phillips C Commander C amp Burker E (1998)
Environmental correlates of resident agitation in Alzheimerrsquos disease special care units Journal
of the American Geriatric Society 46 862ndash869
Sloane P D Mitchell C M Weisman G Zimmerman S Foley K M L Lynn M et al
(2002) The Therapeutic Environment Screening Survey for Nursing Homes (TESS-NH) An
observational instrument for assessing the physical environment of institutional settings for
persons with dementia Journals of Gerontology Series B Psychological Sciences and Social
Sciences 57B(Suppl 2) S69-S78
Sloane P D Zimmerman S Williams C S Reed P S Gill KS amp Preisser J S (2005)
Evaluating the quality of life of long-term care residents with dementia The Gerontologist 45
37-49
Snyder L G (1980) An exploratory study of patterns of social interaction organization and facility
design in three nursing homes In J Hendricks (Ed) Institutionalization and Alternative Futures
(pp 68-80) Farmingdale NY Baywood Pub Co
Sommer R amp Sommer B B (1986) A practical guide to behavioral research Tools and
techniques (2nd ed) New York Oxford
Van Haitsma K Lawton M P amp Kleban M H (2000) Does segregation help or hinder
Examining the role of heterogeneity in behavioral and emotional aspects of quality of life for
Mapping Five Sites
35 of 47
persons with cognitive impairment in the nursing home Research and Practice in Alzheimerrsquos
Disease 4 163-177
Verbeek H van Rossum E Zwakhalen S M G Kempen G I J M amp Hamers J P H (2009)
Small homelike care environments for older people with dementia A literature review
International Psychogeriatrics 21 252-264
Voelkl J E (2006) Therapeutic environments in nursing homes Fostering residents meaningful
activity engagement Activities Directors Quarterly for Alzheimers and Other Dementia
Patients 7(3) 35-44
Warren S (Ed) (1998) Innovative dementia care McConnell Place North evaluation (Research
Report) Edmonton Alberta Canada Evaluating Programs of Innovative Continuing Care
Zeisel J (1998) The Hearthstone health environments case study Journal of Healthcare Design
Proceedings from the Symposium on Healthcare Design San Francisco CA National
Symposium on Healthcare Design Inc
Zeisel J Hyde J amp Levkoff S (1994) Best practices An environment-behavior (E-B) model for
Alzheimer special care units American Journal of Alzheimerrsquos Care and Related Disorders and
Research and Care 9(2) 4-21
Zimmerman S Sloane P D Williams C S Reed P S Preisser J S Eckert J K et al (2005)
Dementia care and quality of life in assisted living and nursing homes The Gerontologist 45
133-146
Mapping Five Sites
36 of 47
Table 1 Comparison of Architectural Features Across Five Sites
Feature ASB MDR MPN MPW WDS
Total facility square footage 23040 sq ft 27308 sq fta 24750 sq ft 23864 sq ft 21540 sq ft
Size of administration area (offices conference reception etc but not service or employee spaces)
960 sq ft (No entry hall)
1584 sq ft day program offices and program space
1675 sq ft 1629 sq ft 972 sq ft (No entry hall)
Staff (lunch) room 16rsquo x 18rsquo 6rsquo11rdquo x 6rsquo2rdquo 158rsquo x 16rsquo 138rsquo x 16rsquo 95rsquo x 30rsquo (plus)b
Treatment or examination room
No Yes In daycare area
No No Yes In central
areac
Medications storage Central medication cart
Medication room Medication room per house
Medication room per house
Central medication cart
Location of meal preparation
Facility kitchen in administration area
Facility kitchen in administration area
Adjacent nursing home (see house kitchen)
Adjacent nursing home (see house kitchen)
Facility kitchen in administration area
Use of house kitchen Servery snacks Servery snacks Meal preparation for all breakfasts and some lunches servery
Meal preparation for all breakfasts and some lunches servery
Servery snacks
Family dining room or central country kitchen usage
Small group activities family functions by reservation
Small group activities family functions by reservation
Small group meetings Great Room party food preparation family functions by reservation
Small group meetings Great Room party food preparation family functions by reservation
Small group activities family functions by reservation
Houses and capacity 2 20 2 20 3 12 3 12 3 12
Private tubroom Two off the central hallway
Two off the central hallway
One located in each house
One located in each house
None
Private shower areas One per 10 residents located in each wing of each house
One per 10 residents located in each wing of each house
One per resident located in each resident room with the one shared bedroom having a shared shower
One per resident located in each resident room with the one shared bedroom having a shared shower
One per 12 residents located in each house
Resident room doors Split door Split door Split door Regular Split door
Inventory of public rooms and seating capacity (includes all alcoves that can be used for seating and seating areas near exits)
15 165
17 176
15 232
13 219
14 182
Variety and appearance of outdoor Area
2 small (little greenery) 1 medium (mixed hardgreen surfaces) and a large courtyardmdashvery appealing
2 small (much greenery) 1 medium (mixed hardgreen surfaces) 2 large courtyards (1 mixed hardgreen surfaces 1 green) mdash very appealing
3 small (much greenery) 1 large (mostly green courtyard mdash very appealing
3 small (much greenery) and 1 large (mostly green courtyard mdash very appealing
1 small (much greenery) 1 medium (mostly green) and 1 large (mostly green) courtyard mdash very appealing
a Does not include researchteaching wing Total for entire floor space is 40382 sq ft b Room at WDS was not intended as a lounge ie a retreat from work to professionalize the care staff role it was to serve as a place to read and discuss work At other
sites the lunch room also served as a lounge c Room was intended as a multi-purpose room
Mapping Five Sites
37 of 47
Table 2 Therapeutic Environment Screening Scale Items for Goal and Domain Possible Range
Midpoint and Mean in Each Group
Therapeutic Goal and Domain
Item Numbers Range Mid-point ASB amp MDR
20-Capacity Houses MPN MPW amp WDS
12-Capacity Houses
ASB MDR Site Scores
Mean MPN MPW WDS Site Scores
Mean
Safetysecurityhealth
Exit control 2a 2b 2c 2d 2e 2g
2h 3a 3b 0-11 55 2 1 15 1 2 2 17
Maintenance 7b1Dagger 7b2Dagger 7b3Dagger 7b4Dagger 0-8 40 8 8 80 8 8 80
Cleanliness 7a1Dagger 7a2Dagger 7a3 7a4 0-8 40 8 8 80 7 8 8 77
Lack of odorsℓ 9aDagger 9bDagger 0-4 20 4 3 35 4 4 4 40
Safetyℓ 7c1 7c2Dagger 7c3 7c4 8 0-10 60 10 10 100 10 10 10 100
Orientationcuing 19 20ф 27a 27bcDagger
27d 27e 27f 28 29 0-17 85 1212 120 11 9 12 107
Privacycontrol
Privacy 30a 30b 30c 30d 0-4 20 0 0 0 1 2 0 10
Functional ability 16 17a 17b 18Dagger 0-7 35 7 7 70 7 7 7 70
Stimulation
Lighting 21 22a 22bDagger 22cDagger
23a 23b 23c 0-14 70 13 13 130 11 14 13 127
Tactilevisual
stimulation 34 35Dagger 37b 0-16 80 10 6 80 15 14 11 133
Quietness 24a 24b 24c 24d
24eDagger 24f 24g 25 26 0-25 125 21 21 210 19 20 23 207
Physical attractiveness
4a1 4a2 4b1 4b2
4c1 4c2 4d1 4d2 37c 0-34 140 16 15 155 15 16 16 157
Socialization
Homelike
environment 15Dagger 31Dagger 32 0-9 45 9 9 90 9 9 9 90
Resident
appearance 36Dagger
0-2 10 2 2 20 2 2 20
SCUEQS 0-41 - 41 39 40 39 4141 40
CAAQS sect 0-100 - 786 857
Large means represent better physical environment
Dagger Items used to compute the 18-item Special Care Environmental Quality Scale (SCUEQS) 27b and 27c were treated as a single item and item 15 was
misnumbered in the TESS-2+ Revised version (as item 13) ф Item 20 is the percentage of common rooms with signsgraphics floor plans in all sites allowed a view into common rooms (scored as zero) ℓ An item was unintentionally omitted from the TESS-2+ scoring form (10 in Odors and 11 in Safety) sect Composite Above Average Quality Score (CAAQS) represents the percentage of TESS-2+ domains that were above average in quality
Mapping Five Sites
38 of 47
Table 3 Percent of Resident Population Who Were Observed During Behavior Scans
at Each Site in Particular Areasa
AreaSite 20-Capacity Houses 12-Capacity Houses
ASB MDR MPN MPW WDS
Total Areas 608 493 511 564 803
Total Common Areas 62 158 169 200 511
Total Outdoor Areas 46 02 11 56 38
Total House Areas 500 333 331 311 254
House 1 259 168 115 69 62
House 2 241 165 108 128 123
House 3 108 114 69
House Kitchen 149 08 75 53 49
House LivingDining Room 324 278 236 232 200 a Resident data were adjusted to show the mean percent of residents at a site who were observed per scan per day Note Total Areas is the sum of the following Total Common Total Outdoor and Total House Total House Areas is the sum of Houses 1 House 2 and House 3 House Kitchen and LivingDining Rooms are summed across houses Blank cells indicate that the question was not applicable
Mapping Five Sites
39 of 47
Table 4 Percent of Resident Population Who Were Observed During Behavior Scans
at Each Site in Particular Common Areasa
Location 20-Capacity Houses 12-Capacity Houses ASB MDR MPN MPW WDS
Great Room 07 75 94 91 64
Fireplace Seating Area 22 69 43 13 106
ActivityCraft Room 04 47 00 02 10
TV Room ndash ndash 43 64 58
Other TV Area ndash ndash 11 39 ndash
Common Area Hallway Seating 37 108 138 143 396
Music Room ndash ndash 00 ndash 00
Garden Room ndash ndash 00 ndash 04
Beauty Salon 39 12 00 00 00
Family Dining RoomCountry Kitchen 00 09 00 00 00
Total 109 320 329 352 638 a Resident data were adjusted to show the mean percent of residents at a site who were observed per scan per day Note Dashes indicate that residents were not observed in these areas
Mapping Five Sites
40 of 47
Table 5 Percent of Resident Population Who Were Observed During Behavior Scans
at Each Site at Particular Times of Day
Time of Day 20-Capacity Houses 12-Capacity Houses
ASB MDR MPN MPW WDS
Before Lunch 541 360 386 475 654
Lunch 805 663 667 722 1000
Between Meals 657 530 506 589 963
Supper 765 738 744 744 922
After Supper 50 390 447 469 740 a Resident data were adjusted to show the mean percent of residents at a site who were observed per scan per day Note Before Lunch (4 scans-730-1030) Lunch (2 scans-1130 amp 1230) Between Meals (3 scans-1330 to 1530) Supper (2 scans-1630 amp 1730) After Supper (4 scans-1830 to 2130)
Mapping Five Sites
41 of 47
Figure 1 Floor plan of Asbury Place Mt Lebanon PA
Mapping Five Sites
42 of 47
Figure 2 Floor plan of Marjorie Doyle Rockwell Center Cohoes NY
Mapping Five Sites
43 of 47
Figure 3 Floor plan of McConnell Place North Edmonton AB
Mapping Five Sites
44 of 47
Figure 4 Floor plan of McConnell Place West Edmonton AB
Mapping Five Sites
45 of 47
Figure 5 Floor plan of Woodside Place Oakmont PA
Mapping Five Sites
46 of 47
Figure 6
McConnell Place Northordf Residentsrsquo Activities When Alone and in the Presence of Staff
ordf The average MMSE score was 153 at MPN higher than the average across sites 132 + 15 (M+SE) MPN residents appeared not to initiate activities when alone
0
5
10
15
20
25
30
35
40
Alone Day 1 With Staff Day 1 Alone Day 2 With Staff Day 2
Nu
mb
er R
esid
ents
Arts amp Crafts
Chores
CookingBaking
Eating
Exercising
Games
Grooming
Lg Activity Grp
Music Event
Reading
Sm Interaction
Walking
Watching
Watching TV
Other
Mapping Five Sites
47 of 47
Figure 7
Percent of Scans in Which Residents at Each Site Engaged in Particular Behaviors
0
10
20
30
40
50
60
70
80
90
100
ASB MDR MPN MPW WDS
Misc
Just Sit
Watch
Walk
Leisure
Work
ADLs
Mapping Five Sites
26 of 47
including potentially relevant measures such as the presence of homelike features the degree of
interaction with staff and residentsrsquo involvement in activities
There are however a number of other factors that may be relevant to understanding the
WDS data WDS was the only site in which meals were served in the common areas as well as in the
house dining rooms Congruently as already noted the highest number of resident sightings at WDS
was in the common areas (fireplace and common hallway) and most of these common area sightings
were in the common areas of WDS adjacent to the central area of the three houses Importantly these
were the only common areas with a direct line of sight to the central hall and kitchen of the central
house (School House) Staff notes indicated that the number of meal servings from the central house
kitchen was twice as high as that of the kitchens of the other two houses at WDS Again there is
congruence resident sightings in the central house dining room although low relative to central
common areas were twice as high as in the dining rooms of the other two houses at WDS It is also
relevant that staff used all parts of the central common area for activity programming Thus it seems
probable that several factors including the internal floor plan meal service and activity
programming made the central common areas of WDS a multiuse area which resulted in high
number of resident sightings though out the day with peaks at meal times It is worth asking whether
WDS staff would have used the central common area so intensely if the house kitchens had been
aligned with the dining rooms providing staff with oversight as in MPN and MPW
These observations could also explain another WDS anomaly that is the low number
of residents seen to be engaged in ADL activities at meal times compared to other sites If the
lower-functioning residents at WDS engaged in other activities in the central common areas
perhaps abandoning a meal to walk or sit elsewhere that could result in fewer observations
of eating during the mealtime Conversely it could mean that it would be more likely that
Mapping Five Sites
27 of 47
other activities (ie watching walking sitting and leisure activities) would be seen during
meal times which was the case in WDS
Finally the unique features of the WDS resident sighting data may have been related to the
greater degree of dementia (lower than average MMSE scores) of WDS residents The average
MMSE scores at other sites were 50 to 100 higher indicating less severe symptoms than the
average WDS score Congruently WDS had relatively high levels of sightings of sitting watching
and walking behavior and the highest number of pacing incidents Thus it is possible that the
differences in degree of dementia between sites and the related differences in levels of ambulation
made it more likely that WDS residents would leave their rooms and therefore WDS residents would
be sighted most frequently in the common areas of the WDS facility
It is important to note that no substantial differences were found between the 20-capacity
and 12-capacity houses that is in the mean domain scores of the TESS which was used to describe
environmental characteristics Scores were much the same across the five sites The TESS has goals
and domains aligned with the general site design which are more architecturally based and those
best aligned with interior design site operations and providing care
The architects might have thought their design at ASB and MDR would result in a small care
group of 10 and that residents along each bedroom hall would form a household but this did not
happen The residents in the 20-capacity houses did not form a 20-resident cluster either instead they
formed small groups for eating and activities Therefore other factors such as early or late rising or
naturally-formed friendships may be a greater influence than bedroom proximity The addition of
eight more residents per house might be anticipated to lead to crowding in the housesrsquo living-dining
areas or some other notable difference However crowding was not evident in the 20-capacity
houses In fact WDS gatherings in the common areas were more apt to be viewed as crowds
Mapping Five Sites
28 of 47
Observations indicated there that Disruptive Behavior often attributed to crowding was rare It
occurred in only one site and therefore could not be associated with a particular design
These observational results combined with the TESS results have broad implications for
future studies The first implication is methodological and the second is empirical Methodologically
the combination of architectural and behavioral measures in studies of facilities for the elderly
highlights the advantages over methodologies that employ only behavioral measures eg Dementia
Care Mapping (Brooker 2005 Fulton Edelman amp Kuhn 2006 Sloane Brooker Cohen et al
2007) and over studies that rely on client interviews (Kane 2003) Empirically 20 residents in a
house is approaching the size of dementia units in some nursing homes The present study revealed
that the main difference seen in the operation of the 12-resident house and the 20-resident house
design was that the latter appeared to hold more activities within the house raising questions about
the value and need for those common spaces whereas the former made more use of the common
spaces for activities In this way behavior was affected by the house design and by the way that staff
chose to organize activities
Mapping Five Sites
29 of 47
References
Benson D M Cameron D Humbach E Servino L amp Gambert S R (1987) Establishment and
impact of a dementia unit within the nursing home Journal of the American Geriatrics Society
35 319-323
Brawley E C (1997) Designing for Alzheimerrsquos disease Strategies for creating better care
environments New York Wiley
Brooker D (2005) Dementia Care Mapping A review of the research literature The Gerontologist
45 Special Issue I 11ndash18
Calkins M P Meehan R A amp Lipstreuer E (1999) Creekview Its history and evaluation
Kirtland OH IDEAS Inc
Colling K B (1999) Passive behaviors in Alzheimer disease A descriptive analysis American
Journal of Alzheimers Disease and Other Dementias 14 27-40
Cronin-Golumb A (1995) Vision in Alzheimerrsquos disease The Gerontologist 35 370-376
Day K Carreon D amp Stump C (2000) The therapeutic design of environments for people with
dementia A review of the empirical research The Gerontologist 40 397-416
Deely B Klingensmith L amp Silverman M (1995) Developing a residential Alzheimers facility
Focus on Geriatric Care and Rehabilitation 8(7) 1-8
DiMotta S Dubney B M Hoglund J D amp Kershner C (1993) Long-term care design Blazing
new territory - code reform and beyond Journal of Healthcare Design 5 197-203
DiMotta S amp Hoglund J D (2000) Woodside Place A residential care model for the Alzheimerrsquos
and dementia resident Symposium on Healthcare Design Anaheim CA Center for Healthcare
Design
Mapping Five Sites
30 of 47
Doty M M Koren M J amp Sturla E L (2008) Culture change in nursing homes How far have
we come Findings from The Commonwealth Fund 2007 National Survey of Nursing Homes
New York The Commonwealth Fund
Edelman P Fulton B R Kuhn D amp Chang C H (2005) A comparison of three methods of
measuring dementia-specific quality of life Perspectives of residents staff and observers The
Gerontologist 45 27-36
Fleiss J L (1981) Statistical methods for rates and proportions (2nd ed) New York John Wiley amp
Son
Folstein M F Folstein S E amp McHugh P R (1975) Mini-Mental State a practical method for
grading the cognitive state of patients for the clinician Journal of Geriatric Research 12 189-
198
Fulton B R Edelman P amp Kuhn D (2006) Streamlined models of dementia care mapping
Aging amp Mental Health 10 343-351
Gold D T (1991) A descriptive typology of dementia units In P D Sloane amp L J Mathew (Eds)
Dementia units in long-term care (pp 50-61) Baltimore Johns Hopkins University Press
Gonzalez-Salvador T Lyketsos C G Baker A Hovanec L Roques C Brandt J et al (2000)
Quality of Life in dementia patients in long-term care International Journal of Geriatric
Psychiatry 15 181-189
Gottesman L E amp Bourestom N C (1974) Why nursing homes do what they do The
Gerontologist 14 501-506
Grade B L (1976) A study of the entry crisis to a nursing home Unpublished masterrsquos thesis
University of Wisconsin Milwaukee
Grant L A (1998) Beyond the dichotomy An empirical typology of Alzheimerrsquos care in nursing
homes Research on Aging 20 569-592
Mapping Five Sites
31 of 47
Greene J A Asp J amp Crane N (1985) Specialized management of the Alzheimerrsquos disease
patient Does it make a difference A preliminary progress report Journal of the Tennessee
Medical Association 78 559-563
Harper G J (1998) Stress and adaptation among elders in life care communities Unpublished
doctoral dissertation Ohio State University Columbus
Hogden K M (1985) Leisurerecreation needs of hospitalized elderly A task force report
Activities Adaptation amp Aging 7 53-65
Hoglund D J amp Ledewitz S D (1999) Designing to meet the needs of people with Alzheimerrsquos
disease In B Schwarz amp R Brent (Eds) Aging autonomy and architecture Advances in
assisted living (pp 229-261) Baltimore John Hopkins University Press
Ice G H (2002) Daily life in a nursing home has it changed in 25 years Journal of Aging Studies
16 345-359
Imamoğlu Ccedil (2007) Assisted living as a new place schema A comparison with homes and nursing
homes Environment and Behavior 39 246-268
Innes A amp Surr C (2001) Measuring the well-being of people with dementia living in formal care
settings The use of Dementia Care Mapping Aging and Mental Health 5 258-268
Kane R A (2003) Definition measurement and correlates of quality of life in nursing homes
Toward a reasonable practice research and policy agenda The Gerontologist 43 Special
Issue II 28ndash36
Kuhn D Kasayka R E amp Lechner C (2002) Behavioral observations and quality life among
persons with dementia in 10 assisted living facilities American Journal of Alzheimerrsquos Disease
and Other Dementias 17 291-298
Lawton M P (1970) Ecology and aging In L A Pastaland amp D H Carson (Eds) The spatial
behavior of older people (pp 41-67) Ann Arbor MI University of Michigan Press
Mapping Five Sites
32 of 47
Lawton M P (1977) The impact of the environment on aging and behavior In K W Schaie (Ed)
Handbook of the Psychology of Aging (pp 276-301) New York Van Nostrand Reinhold
Lawton M P Weisman G D Sloane P amp Calkins M (1997) Assessing environments for older
people with chronic illness Journal of Mental Health and Aging 3 83-100
Lawton M P Weisman G D Sloane P Norris-Baker C Calkins M amp Zimmerman S I
(2000) Professional Environmental Assessment Procedure for special care units for elders with
dementing illness and its relationship to the Therapeutic Environment Screening Schedule
Alzheimer Disease and Associated Disorders 14 28ndash38
Lee M Madden V Mason K Rice S Wyburd J amp Hobson S (2006) Occupational
engagement and adaptation in adults with dementia A preliminary investigation Physical and
Occupational Therapy in Geriatrics 25 63-81
Lehrner P N (1979) Handbook of ethological methods New York Garland STMP
Margulis S T (2003) Privacy as a social issue and behavioral concept Journal of Social Issues 59
243-261
Martin P amp Bateson P (1987) Measuring behaviour An introductory guide New York
Cambridge University Press
Mathew L J amp Sloane P D (1991) Organizing and staffing dementia units In P D Sloane amp L
J Mathew (Eds) Dementia units in long-term care (pp 101-127) Baltimore Johns Hopkins
University Press
McAllister C L amp Silverman M A (1999) Community formation and community roles among
persons with Alzheimerrsquos disease A comparative study of experience in a residential
Alzheimerrsquos facility and a traditional nursing home Qualitative Health Research 9 65-85
McCracken A L amp Fitzwater E (1989) The right environment for Alzheimerrsquos Geriatric
Nursing 10 293-294
Mapping Five Sites
33 of 47
Milke D L (2003) Iterative post-occupancy evaluations of the McConnell Place North design
[Abstract] Proceedings of the 56th Annual Scientific Meeting of the Gerontological Society of
America 43 48 San Diego CA
Milke D L Clark C amp Bucknell M (2000) Assessing the adequacy of residential lighting in two
care centres for persons with Alzheimerrsquos Disease using the new age-adjusted North American
illumination recommendations (Research Report) Ottawa Ontario Canada Canada Mortgage
and Housing Corporation
National Institute on Aging Coordinating Center (1993) NIA collaborative studies special care units
for Alzheimers disease Manual of procedures Davis CA Northern California Alzheimers
Disease Center University of California
Rabig J Thomas W Kane R A Cutler L J amp McAlilly S (2006) Radical redesign of nursing
homes Applying the Green House concept in Tupelo Mississippi The Gerontologist 46 533-
539
Rule B G Milke D L amp Dobbs A R (1992) Design of institutions Cognitive functioning and
social interactions of the aged resident Journal of Applied Gerontology 11 475-488
Saxton J Silverman M Ricci E Keane C amp Deely B (1998) Maintenance of mobility in
residents of an Alzheimer special care facility International Psychogeriatrics 10 213-224
Schwarz B Chaudhury H amp Tofle R B (2004) Effect of design interventions on a dementia care
setting American Journal of Alzheimers Disease and Other Dementias 19 172-176
Silverman M Ricci E Saxton J Ledewitz S McAllister C amp Keane C (1995) Woodside
Place The first three years of a residential Alzheimerrsquos facility (Vols 1-2) Oakmont PA
Presbyterian Senior Care
Skea D amp Lindesay J (1996) An evaluation of two models of long-term residential care for
elderly people with dementia International Journal of Geriatric Psychiatry 11 233-241
Mapping Five Sites
34 of 47
Slaughter S Calkins M Eliasziw M amp Reimer M (2006) Measuring physical and social
environments in nursing homes for people with middle- to late-stage dementia Journal of the
American Geriatrics Society 54 1436-1441
Sloane P D Brooker D Cohen L Douglass C Edelman P Fulton B R et al (2007)
Dementia Care Mapping as a research tool International Journal of Geriatric Psychiatry 22
580-589
Sloane P D Mitchell M Priesser J S Phillips C Commander C amp Burker E (1998)
Environmental correlates of resident agitation in Alzheimerrsquos disease special care units Journal
of the American Geriatric Society 46 862ndash869
Sloane P D Mitchell C M Weisman G Zimmerman S Foley K M L Lynn M et al
(2002) The Therapeutic Environment Screening Survey for Nursing Homes (TESS-NH) An
observational instrument for assessing the physical environment of institutional settings for
persons with dementia Journals of Gerontology Series B Psychological Sciences and Social
Sciences 57B(Suppl 2) S69-S78
Sloane P D Zimmerman S Williams C S Reed P S Gill KS amp Preisser J S (2005)
Evaluating the quality of life of long-term care residents with dementia The Gerontologist 45
37-49
Snyder L G (1980) An exploratory study of patterns of social interaction organization and facility
design in three nursing homes In J Hendricks (Ed) Institutionalization and Alternative Futures
(pp 68-80) Farmingdale NY Baywood Pub Co
Sommer R amp Sommer B B (1986) A practical guide to behavioral research Tools and
techniques (2nd ed) New York Oxford
Van Haitsma K Lawton M P amp Kleban M H (2000) Does segregation help or hinder
Examining the role of heterogeneity in behavioral and emotional aspects of quality of life for
Mapping Five Sites
35 of 47
persons with cognitive impairment in the nursing home Research and Practice in Alzheimerrsquos
Disease 4 163-177
Verbeek H van Rossum E Zwakhalen S M G Kempen G I J M amp Hamers J P H (2009)
Small homelike care environments for older people with dementia A literature review
International Psychogeriatrics 21 252-264
Voelkl J E (2006) Therapeutic environments in nursing homes Fostering residents meaningful
activity engagement Activities Directors Quarterly for Alzheimers and Other Dementia
Patients 7(3) 35-44
Warren S (Ed) (1998) Innovative dementia care McConnell Place North evaluation (Research
Report) Edmonton Alberta Canada Evaluating Programs of Innovative Continuing Care
Zeisel J (1998) The Hearthstone health environments case study Journal of Healthcare Design
Proceedings from the Symposium on Healthcare Design San Francisco CA National
Symposium on Healthcare Design Inc
Zeisel J Hyde J amp Levkoff S (1994) Best practices An environment-behavior (E-B) model for
Alzheimer special care units American Journal of Alzheimerrsquos Care and Related Disorders and
Research and Care 9(2) 4-21
Zimmerman S Sloane P D Williams C S Reed P S Preisser J S Eckert J K et al (2005)
Dementia care and quality of life in assisted living and nursing homes The Gerontologist 45
133-146
Mapping Five Sites
36 of 47
Table 1 Comparison of Architectural Features Across Five Sites
Feature ASB MDR MPN MPW WDS
Total facility square footage 23040 sq ft 27308 sq fta 24750 sq ft 23864 sq ft 21540 sq ft
Size of administration area (offices conference reception etc but not service or employee spaces)
960 sq ft (No entry hall)
1584 sq ft day program offices and program space
1675 sq ft 1629 sq ft 972 sq ft (No entry hall)
Staff (lunch) room 16rsquo x 18rsquo 6rsquo11rdquo x 6rsquo2rdquo 158rsquo x 16rsquo 138rsquo x 16rsquo 95rsquo x 30rsquo (plus)b
Treatment or examination room
No Yes In daycare area
No No Yes In central
areac
Medications storage Central medication cart
Medication room Medication room per house
Medication room per house
Central medication cart
Location of meal preparation
Facility kitchen in administration area
Facility kitchen in administration area
Adjacent nursing home (see house kitchen)
Adjacent nursing home (see house kitchen)
Facility kitchen in administration area
Use of house kitchen Servery snacks Servery snacks Meal preparation for all breakfasts and some lunches servery
Meal preparation for all breakfasts and some lunches servery
Servery snacks
Family dining room or central country kitchen usage
Small group activities family functions by reservation
Small group activities family functions by reservation
Small group meetings Great Room party food preparation family functions by reservation
Small group meetings Great Room party food preparation family functions by reservation
Small group activities family functions by reservation
Houses and capacity 2 20 2 20 3 12 3 12 3 12
Private tubroom Two off the central hallway
Two off the central hallway
One located in each house
One located in each house
None
Private shower areas One per 10 residents located in each wing of each house
One per 10 residents located in each wing of each house
One per resident located in each resident room with the one shared bedroom having a shared shower
One per resident located in each resident room with the one shared bedroom having a shared shower
One per 12 residents located in each house
Resident room doors Split door Split door Split door Regular Split door
Inventory of public rooms and seating capacity (includes all alcoves that can be used for seating and seating areas near exits)
15 165
17 176
15 232
13 219
14 182
Variety and appearance of outdoor Area
2 small (little greenery) 1 medium (mixed hardgreen surfaces) and a large courtyardmdashvery appealing
2 small (much greenery) 1 medium (mixed hardgreen surfaces) 2 large courtyards (1 mixed hardgreen surfaces 1 green) mdash very appealing
3 small (much greenery) 1 large (mostly green courtyard mdash very appealing
3 small (much greenery) and 1 large (mostly green courtyard mdash very appealing
1 small (much greenery) 1 medium (mostly green) and 1 large (mostly green) courtyard mdash very appealing
a Does not include researchteaching wing Total for entire floor space is 40382 sq ft b Room at WDS was not intended as a lounge ie a retreat from work to professionalize the care staff role it was to serve as a place to read and discuss work At other
sites the lunch room also served as a lounge c Room was intended as a multi-purpose room
Mapping Five Sites
37 of 47
Table 2 Therapeutic Environment Screening Scale Items for Goal and Domain Possible Range
Midpoint and Mean in Each Group
Therapeutic Goal and Domain
Item Numbers Range Mid-point ASB amp MDR
20-Capacity Houses MPN MPW amp WDS
12-Capacity Houses
ASB MDR Site Scores
Mean MPN MPW WDS Site Scores
Mean
Safetysecurityhealth
Exit control 2a 2b 2c 2d 2e 2g
2h 3a 3b 0-11 55 2 1 15 1 2 2 17
Maintenance 7b1Dagger 7b2Dagger 7b3Dagger 7b4Dagger 0-8 40 8 8 80 8 8 80
Cleanliness 7a1Dagger 7a2Dagger 7a3 7a4 0-8 40 8 8 80 7 8 8 77
Lack of odorsℓ 9aDagger 9bDagger 0-4 20 4 3 35 4 4 4 40
Safetyℓ 7c1 7c2Dagger 7c3 7c4 8 0-10 60 10 10 100 10 10 10 100
Orientationcuing 19 20ф 27a 27bcDagger
27d 27e 27f 28 29 0-17 85 1212 120 11 9 12 107
Privacycontrol
Privacy 30a 30b 30c 30d 0-4 20 0 0 0 1 2 0 10
Functional ability 16 17a 17b 18Dagger 0-7 35 7 7 70 7 7 7 70
Stimulation
Lighting 21 22a 22bDagger 22cDagger
23a 23b 23c 0-14 70 13 13 130 11 14 13 127
Tactilevisual
stimulation 34 35Dagger 37b 0-16 80 10 6 80 15 14 11 133
Quietness 24a 24b 24c 24d
24eDagger 24f 24g 25 26 0-25 125 21 21 210 19 20 23 207
Physical attractiveness
4a1 4a2 4b1 4b2
4c1 4c2 4d1 4d2 37c 0-34 140 16 15 155 15 16 16 157
Socialization
Homelike
environment 15Dagger 31Dagger 32 0-9 45 9 9 90 9 9 9 90
Resident
appearance 36Dagger
0-2 10 2 2 20 2 2 20
SCUEQS 0-41 - 41 39 40 39 4141 40
CAAQS sect 0-100 - 786 857
Large means represent better physical environment
Dagger Items used to compute the 18-item Special Care Environmental Quality Scale (SCUEQS) 27b and 27c were treated as a single item and item 15 was
misnumbered in the TESS-2+ Revised version (as item 13) ф Item 20 is the percentage of common rooms with signsgraphics floor plans in all sites allowed a view into common rooms (scored as zero) ℓ An item was unintentionally omitted from the TESS-2+ scoring form (10 in Odors and 11 in Safety) sect Composite Above Average Quality Score (CAAQS) represents the percentage of TESS-2+ domains that were above average in quality
Mapping Five Sites
38 of 47
Table 3 Percent of Resident Population Who Were Observed During Behavior Scans
at Each Site in Particular Areasa
AreaSite 20-Capacity Houses 12-Capacity Houses
ASB MDR MPN MPW WDS
Total Areas 608 493 511 564 803
Total Common Areas 62 158 169 200 511
Total Outdoor Areas 46 02 11 56 38
Total House Areas 500 333 331 311 254
House 1 259 168 115 69 62
House 2 241 165 108 128 123
House 3 108 114 69
House Kitchen 149 08 75 53 49
House LivingDining Room 324 278 236 232 200 a Resident data were adjusted to show the mean percent of residents at a site who were observed per scan per day Note Total Areas is the sum of the following Total Common Total Outdoor and Total House Total House Areas is the sum of Houses 1 House 2 and House 3 House Kitchen and LivingDining Rooms are summed across houses Blank cells indicate that the question was not applicable
Mapping Five Sites
39 of 47
Table 4 Percent of Resident Population Who Were Observed During Behavior Scans
at Each Site in Particular Common Areasa
Location 20-Capacity Houses 12-Capacity Houses ASB MDR MPN MPW WDS
Great Room 07 75 94 91 64
Fireplace Seating Area 22 69 43 13 106
ActivityCraft Room 04 47 00 02 10
TV Room ndash ndash 43 64 58
Other TV Area ndash ndash 11 39 ndash
Common Area Hallway Seating 37 108 138 143 396
Music Room ndash ndash 00 ndash 00
Garden Room ndash ndash 00 ndash 04
Beauty Salon 39 12 00 00 00
Family Dining RoomCountry Kitchen 00 09 00 00 00
Total 109 320 329 352 638 a Resident data were adjusted to show the mean percent of residents at a site who were observed per scan per day Note Dashes indicate that residents were not observed in these areas
Mapping Five Sites
40 of 47
Table 5 Percent of Resident Population Who Were Observed During Behavior Scans
at Each Site at Particular Times of Day
Time of Day 20-Capacity Houses 12-Capacity Houses
ASB MDR MPN MPW WDS
Before Lunch 541 360 386 475 654
Lunch 805 663 667 722 1000
Between Meals 657 530 506 589 963
Supper 765 738 744 744 922
After Supper 50 390 447 469 740 a Resident data were adjusted to show the mean percent of residents at a site who were observed per scan per day Note Before Lunch (4 scans-730-1030) Lunch (2 scans-1130 amp 1230) Between Meals (3 scans-1330 to 1530) Supper (2 scans-1630 amp 1730) After Supper (4 scans-1830 to 2130)
Mapping Five Sites
41 of 47
Figure 1 Floor plan of Asbury Place Mt Lebanon PA
Mapping Five Sites
42 of 47
Figure 2 Floor plan of Marjorie Doyle Rockwell Center Cohoes NY
Mapping Five Sites
43 of 47
Figure 3 Floor plan of McConnell Place North Edmonton AB
Mapping Five Sites
44 of 47
Figure 4 Floor plan of McConnell Place West Edmonton AB
Mapping Five Sites
45 of 47
Figure 5 Floor plan of Woodside Place Oakmont PA
Mapping Five Sites
46 of 47
Figure 6
McConnell Place Northordf Residentsrsquo Activities When Alone and in the Presence of Staff
ordf The average MMSE score was 153 at MPN higher than the average across sites 132 + 15 (M+SE) MPN residents appeared not to initiate activities when alone
0
5
10
15
20
25
30
35
40
Alone Day 1 With Staff Day 1 Alone Day 2 With Staff Day 2
Nu
mb
er R
esid
ents
Arts amp Crafts
Chores
CookingBaking
Eating
Exercising
Games
Grooming
Lg Activity Grp
Music Event
Reading
Sm Interaction
Walking
Watching
Watching TV
Other
Mapping Five Sites
47 of 47
Figure 7
Percent of Scans in Which Residents at Each Site Engaged in Particular Behaviors
0
10
20
30
40
50
60
70
80
90
100
ASB MDR MPN MPW WDS
Misc
Just Sit
Watch
Walk
Leisure
Work
ADLs

Mapping Five Sites
29 of 47
References
Benson D M Cameron D Humbach E Servino L amp Gambert S R (1987) Establishment and
impact of a dementia unit within the nursing home Journal of the American Geriatrics Society
35 319-323
Brawley E C (1997) Designing for Alzheimerrsquos disease Strategies for creating better care
environments New York Wiley
Brooker D (2005) Dementia Care Mapping A review of the research literature The Gerontologist
45 Special Issue I 11ndash18
Calkins M P Meehan R A amp Lipstreuer E (1999) Creekview Its history and evaluation
Kirtland OH IDEAS Inc
Colling K B (1999) Passive behaviors in Alzheimer disease A descriptive analysis American
Journal of Alzheimers Disease and Other Dementias 14 27-40
Cronin-Golumb A (1995) Vision in Alzheimerrsquos disease The Gerontologist 35 370-376
Day K Carreon D amp Stump C (2000) The therapeutic design of environments for people with
dementia A review of the empirical research The Gerontologist 40 397-416
Deely B Klingensmith L amp Silverman M (1995) Developing a residential Alzheimers facility
Focus on Geriatric Care and Rehabilitation 8(7) 1-8
DiMotta S Dubney B M Hoglund J D amp Kershner C (1993) Long-term care design Blazing
new territory - code reform and beyond Journal of Healthcare Design 5 197-203
DiMotta S amp Hoglund J D (2000) Woodside Place A residential care model for the Alzheimerrsquos
and dementia resident Symposium on Healthcare Design Anaheim CA Center for Healthcare
Design
Mapping Five Sites
30 of 47
Doty M M Koren M J amp Sturla E L (2008) Culture change in nursing homes How far have
we come Findings from The Commonwealth Fund 2007 National Survey of Nursing Homes
New York The Commonwealth Fund
Edelman P Fulton B R Kuhn D amp Chang C H (2005) A comparison of three methods of
measuring dementia-specific quality of life Perspectives of residents staff and observers The
Gerontologist 45 27-36
Fleiss J L (1981) Statistical methods for rates and proportions (2nd ed) New York John Wiley amp
Son
Folstein M F Folstein S E amp McHugh P R (1975) Mini-Mental State a practical method for
grading the cognitive state of patients for the clinician Journal of Geriatric Research 12 189-
198
Fulton B R Edelman P amp Kuhn D (2006) Streamlined models of dementia care mapping
Aging amp Mental Health 10 343-351
Gold D T (1991) A descriptive typology of dementia units In P D Sloane amp L J Mathew (Eds)
Dementia units in long-term care (pp 50-61) Baltimore Johns Hopkins University Press
Gonzalez-Salvador T Lyketsos C G Baker A Hovanec L Roques C Brandt J et al (2000)
Quality of Life in dementia patients in long-term care International Journal of Geriatric
Psychiatry 15 181-189
Gottesman L E amp Bourestom N C (1974) Why nursing homes do what they do The
Gerontologist 14 501-506
Grade B L (1976) A study of the entry crisis to a nursing home Unpublished masterrsquos thesis
University of Wisconsin Milwaukee
Grant L A (1998) Beyond the dichotomy An empirical typology of Alzheimerrsquos care in nursing
homes Research on Aging 20 569-592
Mapping Five Sites
31 of 47
Greene J A Asp J amp Crane N (1985) Specialized management of the Alzheimerrsquos disease
patient Does it make a difference A preliminary progress report Journal of the Tennessee
Medical Association 78 559-563
Harper G J (1998) Stress and adaptation among elders in life care communities Unpublished
doctoral dissertation Ohio State University Columbus
Hogden K M (1985) Leisurerecreation needs of hospitalized elderly A task force report
Activities Adaptation amp Aging 7 53-65
Hoglund D J amp Ledewitz S D (1999) Designing to meet the needs of people with Alzheimerrsquos
disease In B Schwarz amp R Brent (Eds) Aging autonomy and architecture Advances in
assisted living (pp 229-261) Baltimore John Hopkins University Press
Ice G H (2002) Daily life in a nursing home has it changed in 25 years Journal of Aging Studies
16 345-359
Imamoğlu Ccedil (2007) Assisted living as a new place schema A comparison with homes and nursing
homes Environment and Behavior 39 246-268
Innes A amp Surr C (2001) Measuring the well-being of people with dementia living in formal care
settings The use of Dementia Care Mapping Aging and Mental Health 5 258-268
Kane R A (2003) Definition measurement and correlates of quality of life in nursing homes
Toward a reasonable practice research and policy agenda The Gerontologist 43 Special
Issue II 28ndash36
Kuhn D Kasayka R E amp Lechner C (2002) Behavioral observations and quality life among
persons with dementia in 10 assisted living facilities American Journal of Alzheimerrsquos Disease
and Other Dementias 17 291-298
Lawton M P (1970) Ecology and aging In L A Pastaland amp D H Carson (Eds) The spatial
behavior of older people (pp 41-67) Ann Arbor MI University of Michigan Press
Mapping Five Sites
32 of 47
Lawton M P (1977) The impact of the environment on aging and behavior In K W Schaie (Ed)
Handbook of the Psychology of Aging (pp 276-301) New York Van Nostrand Reinhold
Lawton M P Weisman G D Sloane P amp Calkins M (1997) Assessing environments for older
people with chronic illness Journal of Mental Health and Aging 3 83-100
Lawton M P Weisman G D Sloane P Norris-Baker C Calkins M amp Zimmerman S I
(2000) Professional Environmental Assessment Procedure for special care units for elders with
dementing illness and its relationship to the Therapeutic Environment Screening Schedule
Alzheimer Disease and Associated Disorders 14 28ndash38
Lee M Madden V Mason K Rice S Wyburd J amp Hobson S (2006) Occupational
engagement and adaptation in adults with dementia A preliminary investigation Physical and
Occupational Therapy in Geriatrics 25 63-81
Lehrner P N (1979) Handbook of ethological methods New York Garland STMP
Margulis S T (2003) Privacy as a social issue and behavioral concept Journal of Social Issues 59
243-261
Martin P amp Bateson P (1987) Measuring behaviour An introductory guide New York
Cambridge University Press
Mathew L J amp Sloane P D (1991) Organizing and staffing dementia units In P D Sloane amp L
J Mathew (Eds) Dementia units in long-term care (pp 101-127) Baltimore Johns Hopkins
University Press
McAllister C L amp Silverman M A (1999) Community formation and community roles among
persons with Alzheimerrsquos disease A comparative study of experience in a residential
Alzheimerrsquos facility and a traditional nursing home Qualitative Health Research 9 65-85
McCracken A L amp Fitzwater E (1989) The right environment for Alzheimerrsquos Geriatric
Nursing 10 293-294
Mapping Five Sites
33 of 47
Milke D L (2003) Iterative post-occupancy evaluations of the McConnell Place North design
[Abstract] Proceedings of the 56th Annual Scientific Meeting of the Gerontological Society of
America 43 48 San Diego CA
Milke D L Clark C amp Bucknell M (2000) Assessing the adequacy of residential lighting in two
care centres for persons with Alzheimerrsquos Disease using the new age-adjusted North American
illumination recommendations (Research Report) Ottawa Ontario Canada Canada Mortgage
and Housing Corporation
National Institute on Aging Coordinating Center (1993) NIA collaborative studies special care units
for Alzheimers disease Manual of procedures Davis CA Northern California Alzheimers
Disease Center University of California
Rabig J Thomas W Kane R A Cutler L J amp McAlilly S (2006) Radical redesign of nursing
homes Applying the Green House concept in Tupelo Mississippi The Gerontologist 46 533-
539
Rule B G Milke D L amp Dobbs A R (1992) Design of institutions Cognitive functioning and
social interactions of the aged resident Journal of Applied Gerontology 11 475-488
Saxton J Silverman M Ricci E Keane C amp Deely B (1998) Maintenance of mobility in
residents of an Alzheimer special care facility International Psychogeriatrics 10 213-224
Schwarz B Chaudhury H amp Tofle R B (2004) Effect of design interventions on a dementia care
setting American Journal of Alzheimers Disease and Other Dementias 19 172-176
Silverman M Ricci E Saxton J Ledewitz S McAllister C amp Keane C (1995) Woodside
Place The first three years of a residential Alzheimerrsquos facility (Vols 1-2) Oakmont PA
Presbyterian Senior Care
Skea D amp Lindesay J (1996) An evaluation of two models of long-term residential care for
elderly people with dementia International Journal of Geriatric Psychiatry 11 233-241
Mapping Five Sites
34 of 47
Slaughter S Calkins M Eliasziw M amp Reimer M (2006) Measuring physical and social
environments in nursing homes for people with middle- to late-stage dementia Journal of the
American Geriatrics Society 54 1436-1441
Sloane P D Brooker D Cohen L Douglass C Edelman P Fulton B R et al (2007)
Dementia Care Mapping as a research tool International Journal of Geriatric Psychiatry 22
580-589
Sloane P D Mitchell M Priesser J S Phillips C Commander C amp Burker E (1998)
Environmental correlates of resident agitation in Alzheimerrsquos disease special care units Journal
of the American Geriatric Society 46 862ndash869
Sloane P D Mitchell C M Weisman G Zimmerman S Foley K M L Lynn M et al
(2002) The Therapeutic Environment Screening Survey for Nursing Homes (TESS-NH) An
observational instrument for assessing the physical environment of institutional settings for
persons with dementia Journals of Gerontology Series B Psychological Sciences and Social
Sciences 57B(Suppl 2) S69-S78
Sloane P D Zimmerman S Williams C S Reed P S Gill KS amp Preisser J S (2005)
Evaluating the quality of life of long-term care residents with dementia The Gerontologist 45
37-49
Snyder L G (1980) An exploratory study of patterns of social interaction organization and facility
design in three nursing homes In J Hendricks (Ed) Institutionalization and Alternative Futures
(pp 68-80) Farmingdale NY Baywood Pub Co
Sommer R amp Sommer B B (1986) A practical guide to behavioral research Tools and
techniques (2nd ed) New York Oxford
Van Haitsma K Lawton M P amp Kleban M H (2000) Does segregation help or hinder
Examining the role of heterogeneity in behavioral and emotional aspects of quality of life for
Mapping Five Sites
35 of 47
persons with cognitive impairment in the nursing home Research and Practice in Alzheimerrsquos
Disease 4 163-177
Verbeek H van Rossum E Zwakhalen S M G Kempen G I J M amp Hamers J P H (2009)
Small homelike care environments for older people with dementia A literature review
International Psychogeriatrics 21 252-264
Voelkl J E (2006) Therapeutic environments in nursing homes Fostering residents meaningful
activity engagement Activities Directors Quarterly for Alzheimers and Other Dementia
Patients 7(3) 35-44
Warren S (Ed) (1998) Innovative dementia care McConnell Place North evaluation (Research
Report) Edmonton Alberta Canada Evaluating Programs of Innovative Continuing Care
Zeisel J (1998) The Hearthstone health environments case study Journal of Healthcare Design
Proceedings from the Symposium on Healthcare Design San Francisco CA National
Symposium on Healthcare Design Inc
Zeisel J Hyde J amp Levkoff S (1994) Best practices An environment-behavior (E-B) model for
Alzheimer special care units American Journal of Alzheimerrsquos Care and Related Disorders and
Research and Care 9(2) 4-21
Zimmerman S Sloane P D Williams C S Reed P S Preisser J S Eckert J K et al (2005)
Dementia care and quality of life in assisted living and nursing homes The Gerontologist 45
133-146
Mapping Five Sites
36 of 47
Table 1 Comparison of Architectural Features Across Five Sites
Feature ASB MDR MPN MPW WDS
Total facility square footage 23040 sq ft 27308 sq fta 24750 sq ft 23864 sq ft 21540 sq ft
Size of administration area (offices conference reception etc but not service or employee spaces)
960 sq ft (No entry hall)
1584 sq ft day program offices and program space
1675 sq ft 1629 sq ft 972 sq ft (No entry hall)
Staff (lunch) room 16rsquo x 18rsquo 6rsquo11rdquo x 6rsquo2rdquo 158rsquo x 16rsquo 138rsquo x 16rsquo 95rsquo x 30rsquo (plus)b
Treatment or examination room
No Yes In daycare area
No No Yes In central
areac
Medications storage Central medication cart
Medication room Medication room per house
Medication room per house
Central medication cart
Location of meal preparation
Facility kitchen in administration area
Facility kitchen in administration area
Adjacent nursing home (see house kitchen)
Adjacent nursing home (see house kitchen)
Facility kitchen in administration area
Use of house kitchen Servery snacks Servery snacks Meal preparation for all breakfasts and some lunches servery
Meal preparation for all breakfasts and some lunches servery
Servery snacks
Family dining room or central country kitchen usage
Small group activities family functions by reservation
Small group activities family functions by reservation
Small group meetings Great Room party food preparation family functions by reservation
Small group meetings Great Room party food preparation family functions by reservation
Small group activities family functions by reservation
Houses and capacity 2 20 2 20 3 12 3 12 3 12
Private tubroom Two off the central hallway
Two off the central hallway
One located in each house
One located in each house
None
Private shower areas One per 10 residents located in each wing of each house
One per 10 residents located in each wing of each house
One per resident located in each resident room with the one shared bedroom having a shared shower
One per resident located in each resident room with the one shared bedroom having a shared shower
One per 12 residents located in each house
Resident room doors Split door Split door Split door Regular Split door
Inventory of public rooms and seating capacity (includes all alcoves that can be used for seating and seating areas near exits)
15 165
17 176
15 232
13 219
14 182
Variety and appearance of outdoor Area
2 small (little greenery) 1 medium (mixed hardgreen surfaces) and a large courtyardmdashvery appealing
2 small (much greenery) 1 medium (mixed hardgreen surfaces) 2 large courtyards (1 mixed hardgreen surfaces 1 green) mdash very appealing
3 small (much greenery) 1 large (mostly green courtyard mdash very appealing
3 small (much greenery) and 1 large (mostly green courtyard mdash very appealing
1 small (much greenery) 1 medium (mostly green) and 1 large (mostly green) courtyard mdash very appealing
a Does not include researchteaching wing Total for entire floor space is 40382 sq ft b Room at WDS was not intended as a lounge ie a retreat from work to professionalize the care staff role it was to serve as a place to read and discuss work At other
sites the lunch room also served as a lounge c Room was intended as a multi-purpose room
Mapping Five Sites
37 of 47
Table 2 Therapeutic Environment Screening Scale Items for Goal and Domain Possible Range
Midpoint and Mean in Each Group
Therapeutic Goal and Domain
Item Numbers Range Mid-point ASB amp MDR
20-Capacity Houses MPN MPW amp WDS
12-Capacity Houses
ASB MDR Site Scores
Mean MPN MPW WDS Site Scores
Mean
Safetysecurityhealth
Exit control 2a 2b 2c 2d 2e 2g
2h 3a 3b 0-11 55 2 1 15 1 2 2 17
Maintenance 7b1Dagger 7b2Dagger 7b3Dagger 7b4Dagger 0-8 40 8 8 80 8 8 80
Cleanliness 7a1Dagger 7a2Dagger 7a3 7a4 0-8 40 8 8 80 7 8 8 77
Lack of odorsℓ 9aDagger 9bDagger 0-4 20 4 3 35 4 4 4 40
Safetyℓ 7c1 7c2Dagger 7c3 7c4 8 0-10 60 10 10 100 10 10 10 100
Orientationcuing 19 20ф 27a 27bcDagger
27d 27e 27f 28 29 0-17 85 1212 120 11 9 12 107
Privacycontrol
Privacy 30a 30b 30c 30d 0-4 20 0 0 0 1 2 0 10
Functional ability 16 17a 17b 18Dagger 0-7 35 7 7 70 7 7 7 70
Stimulation
Lighting 21 22a 22bDagger 22cDagger
23a 23b 23c 0-14 70 13 13 130 11 14 13 127
Tactilevisual
stimulation 34 35Dagger 37b 0-16 80 10 6 80 15 14 11 133
Quietness 24a 24b 24c 24d
24eDagger 24f 24g 25 26 0-25 125 21 21 210 19 20 23 207
Physical attractiveness
4a1 4a2 4b1 4b2
4c1 4c2 4d1 4d2 37c 0-34 140 16 15 155 15 16 16 157
Socialization
Homelike
environment 15Dagger 31Dagger 32 0-9 45 9 9 90 9 9 9 90
Resident
appearance 36Dagger
0-2 10 2 2 20 2 2 20
SCUEQS 0-41 - 41 39 40 39 4141 40
CAAQS sect 0-100 - 786 857
Large means represent better physical environment
Dagger Items used to compute the 18-item Special Care Environmental Quality Scale (SCUEQS) 27b and 27c were treated as a single item and item 15 was
misnumbered in the TESS-2+ Revised version (as item 13) ф Item 20 is the percentage of common rooms with signsgraphics floor plans in all sites allowed a view into common rooms (scored as zero) ℓ An item was unintentionally omitted from the TESS-2+ scoring form (10 in Odors and 11 in Safety) sect Composite Above Average Quality Score (CAAQS) represents the percentage of TESS-2+ domains that were above average in quality
Mapping Five Sites
38 of 47
Table 3 Percent of Resident Population Who Were Observed During Behavior Scans
at Each Site in Particular Areasa
AreaSite 20-Capacity Houses 12-Capacity Houses
ASB MDR MPN MPW WDS
Total Areas 608 493 511 564 803
Total Common Areas 62 158 169 200 511
Total Outdoor Areas 46 02 11 56 38
Total House Areas 500 333 331 311 254
House 1 259 168 115 69 62
House 2 241 165 108 128 123
House 3 108 114 69
House Kitchen 149 08 75 53 49
House LivingDining Room 324 278 236 232 200 a Resident data were adjusted to show the mean percent of residents at a site who were observed per scan per day Note Total Areas is the sum of the following Total Common Total Outdoor and Total House Total House Areas is the sum of Houses 1 House 2 and House 3 House Kitchen and LivingDining Rooms are summed across houses Blank cells indicate that the question was not applicable
Mapping Five Sites
39 of 47
Table 4 Percent of Resident Population Who Were Observed During Behavior Scans
at Each Site in Particular Common Areasa
Location 20-Capacity Houses 12-Capacity Houses ASB MDR MPN MPW WDS
Great Room 07 75 94 91 64
Fireplace Seating Area 22 69 43 13 106
ActivityCraft Room 04 47 00 02 10
TV Room ndash ndash 43 64 58
Other TV Area ndash ndash 11 39 ndash
Common Area Hallway Seating 37 108 138 143 396
Music Room ndash ndash 00 ndash 00
Garden Room ndash ndash 00 ndash 04
Beauty Salon 39 12 00 00 00
Family Dining RoomCountry Kitchen 00 09 00 00 00
Total 109 320 329 352 638 a Resident data were adjusted to show the mean percent of residents at a site who were observed per scan per day Note Dashes indicate that residents were not observed in these areas
Mapping Five Sites
40 of 47
Table 5 Percent of Resident Population Who Were Observed During Behavior Scans
at Each Site at Particular Times of Day
Time of Day 20-Capacity Houses 12-Capacity Houses
ASB MDR MPN MPW WDS
Before Lunch 541 360 386 475 654
Lunch 805 663 667 722 1000
Between Meals 657 530 506 589 963
Supper 765 738 744 744 922
After Supper 50 390 447 469 740 a Resident data were adjusted to show the mean percent of residents at a site who were observed per scan per day Note Before Lunch (4 scans-730-1030) Lunch (2 scans-1130 amp 1230) Between Meals (3 scans-1330 to 1530) Supper (2 scans-1630 amp 1730) After Supper (4 scans-1830 to 2130)
Mapping Five Sites
41 of 47
Figure 1 Floor plan of Asbury Place Mt Lebanon PA
Mapping Five Sites
42 of 47
Figure 2 Floor plan of Marjorie Doyle Rockwell Center Cohoes NY
Mapping Five Sites
43 of 47
Figure 3 Floor plan of McConnell Place North Edmonton AB
Mapping Five Sites
44 of 47
Figure 4 Floor plan of McConnell Place West Edmonton AB
Mapping Five Sites
45 of 47
Figure 5 Floor plan of Woodside Place Oakmont PA
Mapping Five Sites
46 of 47
Figure 6
McConnell Place Northordf Residentsrsquo Activities When Alone and in the Presence of Staff
ordf The average MMSE score was 153 at MPN higher than the average across sites 132 + 15 (M+SE) MPN residents appeared not to initiate activities when alone
0
5
10
15
20
25
30
35
40
Alone Day 1 With Staff Day 1 Alone Day 2 With Staff Day 2
Nu
mb
er R
esid
ents
Arts amp Crafts
Chores
CookingBaking
Eating
Exercising
Games
Grooming
Lg Activity Grp
Music Event
Reading
Sm Interaction
Walking
Watching
Watching TV
Other
Mapping Five Sites
47 of 47
Figure 7
Percent of Scans in Which Residents at Each Site Engaged in Particular Behaviors
0
10
20
30
40
50
60
70
80
90
100
ASB MDR MPN MPW WDS
Misc
Just Sit
Watch
Walk
Leisure
Work
ADLs
Mapping Five Sites
32 of 47
Lawton M P (1977) The impact of the environment on aging and behavior In K W Schaie (Ed)
Handbook of the Psychology of Aging (pp 276-301) New York Van Nostrand Reinhold
Lawton M P Weisman G D Sloane P amp Calkins M (1997) Assessing environments for older
people with chronic illness Journal of Mental Health and Aging 3 83-100
Lawton M P Weisman G D Sloane P Norris-Baker C Calkins M amp Zimmerman S I
(2000) Professional Environmental Assessment Procedure for special care units for elders with
dementing illness and its relationship to the Therapeutic Environment Screening Schedule
Alzheimer Disease and Associated Disorders 14 28ndash38
Lee M Madden V Mason K Rice S Wyburd J amp Hobson S (2006) Occupational
engagement and adaptation in adults with dementia A preliminary investigation Physical and
Occupational Therapy in Geriatrics 25 63-81
Lehrner P N (1979) Handbook of ethological methods New York Garland STMP
Margulis S T (2003) Privacy as a social issue and behavioral concept Journal of Social Issues 59
243-261
Martin P amp Bateson P (1987) Measuring behaviour An introductory guide New York
Cambridge University Press
Mathew L J amp Sloane P D (1991) Organizing and staffing dementia units In P D Sloane amp L
J Mathew (Eds) Dementia units in long-term care (pp 101-127) Baltimore Johns Hopkins
University Press
McAllister C L amp Silverman M A (1999) Community formation and community roles among
persons with Alzheimerrsquos disease A comparative study of experience in a residential
Alzheimerrsquos facility and a traditional nursing home Qualitative Health Research 9 65-85
McCracken A L amp Fitzwater E (1989) The right environment for Alzheimerrsquos Geriatric
Nursing 10 293-294
Mapping Five Sites
33 of 47
Milke D L (2003) Iterative post-occupancy evaluations of the McConnell Place North design
[Abstract] Proceedings of the 56th Annual Scientific Meeting of the Gerontological Society of
America 43 48 San Diego CA
Milke D L Clark C amp Bucknell M (2000) Assessing the adequacy of residential lighting in two
care centres for persons with Alzheimerrsquos Disease using the new age-adjusted North American
illumination recommendations (Research Report) Ottawa Ontario Canada Canada Mortgage
and Housing Corporation
National Institute on Aging Coordinating Center (1993) NIA collaborative studies special care units
for Alzheimers disease Manual of procedures Davis CA Northern California Alzheimers
Disease Center University of California
Rabig J Thomas W Kane R A Cutler L J amp McAlilly S (2006) Radical redesign of nursing
homes Applying the Green House concept in Tupelo Mississippi The Gerontologist 46 533-
539
Rule B G Milke D L amp Dobbs A R (1992) Design of institutions Cognitive functioning and
social interactions of the aged resident Journal of Applied Gerontology 11 475-488
Saxton J Silverman M Ricci E Keane C amp Deely B (1998) Maintenance of mobility in
residents of an Alzheimer special care facility International Psychogeriatrics 10 213-224
Schwarz B Chaudhury H amp Tofle R B (2004) Effect of design interventions on a dementia care
setting American Journal of Alzheimers Disease and Other Dementias 19 172-176
Silverman M Ricci E Saxton J Ledewitz S McAllister C amp Keane C (1995) Woodside
Place The first three years of a residential Alzheimerrsquos facility (Vols 1-2) Oakmont PA
Presbyterian Senior Care
Skea D amp Lindesay J (1996) An evaluation of two models of long-term residential care for
elderly people with dementia International Journal of Geriatric Psychiatry 11 233-241
Mapping Five Sites
34 of 47
Slaughter S Calkins M Eliasziw M amp Reimer M (2006) Measuring physical and social
environments in nursing homes for people with middle- to late-stage dementia Journal of the
American Geriatrics Society 54 1436-1441
Sloane P D Brooker D Cohen L Douglass C Edelman P Fulton B R et al (2007)
Dementia Care Mapping as a research tool International Journal of Geriatric Psychiatry 22
580-589
Sloane P D Mitchell M Priesser J S Phillips C Commander C amp Burker E (1998)
Environmental correlates of resident agitation in Alzheimerrsquos disease special care units Journal
of the American Geriatric Society 46 862ndash869
Sloane P D Mitchell C M Weisman G Zimmerman S Foley K M L Lynn M et al
(2002) The Therapeutic Environment Screening Survey for Nursing Homes (TESS-NH) An
observational instrument for assessing the physical environment of institutional settings for
persons with dementia Journals of Gerontology Series B Psychological Sciences and Social
Sciences 57B(Suppl 2) S69-S78
Sloane P D Zimmerman S Williams C S Reed P S Gill KS amp Preisser J S (2005)
Evaluating the quality of life of long-term care residents with dementia The Gerontologist 45
37-49
Snyder L G (1980) An exploratory study of patterns of social interaction organization and facility
design in three nursing homes In J Hendricks (Ed) Institutionalization and Alternative Futures
(pp 68-80) Farmingdale NY Baywood Pub Co
Sommer R amp Sommer B B (1986) A practical guide to behavioral research Tools and
techniques (2nd ed) New York Oxford
Van Haitsma K Lawton M P amp Kleban M H (2000) Does segregation help or hinder
Examining the role of heterogeneity in behavioral and emotional aspects of quality of life for
Mapping Five Sites
35 of 47
persons with cognitive impairment in the nursing home Research and Practice in Alzheimerrsquos
Disease 4 163-177
Verbeek H van Rossum E Zwakhalen S M G Kempen G I J M amp Hamers J P H (2009)
Small homelike care environments for older people with dementia A literature review
International Psychogeriatrics 21 252-264
Voelkl J E (2006) Therapeutic environments in nursing homes Fostering residents meaningful
activity engagement Activities Directors Quarterly for Alzheimers and Other Dementia
Patients 7(3) 35-44
Warren S (Ed) (1998) Innovative dementia care McConnell Place North evaluation (Research
Report) Edmonton Alberta Canada Evaluating Programs of Innovative Continuing Care
Zeisel J (1998) The Hearthstone health environments case study Journal of Healthcare Design
Proceedings from the Symposium on Healthcare Design San Francisco CA National
Symposium on Healthcare Design Inc
Zeisel J Hyde J amp Levkoff S (1994) Best practices An environment-behavior (E-B) model for
Alzheimer special care units American Journal of Alzheimerrsquos Care and Related Disorders and
Research and Care 9(2) 4-21
Zimmerman S Sloane P D Williams C S Reed P S Preisser J S Eckert J K et al (2005)
Dementia care and quality of life in assisted living and nursing homes The Gerontologist 45
133-146
Mapping Five Sites
36 of 47
Table 1 Comparison of Architectural Features Across Five Sites
Feature ASB MDR MPN MPW WDS
Total facility square footage 23040 sq ft 27308 sq fta 24750 sq ft 23864 sq ft 21540 sq ft
Size of administration area (offices conference reception etc but not service or employee spaces)
960 sq ft (No entry hall)
1584 sq ft day program offices and program space
1675 sq ft 1629 sq ft 972 sq ft (No entry hall)
Staff (lunch) room 16rsquo x 18rsquo 6rsquo11rdquo x 6rsquo2rdquo 158rsquo x 16rsquo 138rsquo x 16rsquo 95rsquo x 30rsquo (plus)b
Treatment or examination room
No Yes In daycare area
No No Yes In central
areac
Medications storage Central medication cart
Medication room Medication room per house
Medication room per house
Central medication cart
Location of meal preparation
Facility kitchen in administration area
Facility kitchen in administration area
Adjacent nursing home (see house kitchen)
Adjacent nursing home (see house kitchen)
Facility kitchen in administration area
Use of house kitchen Servery snacks Servery snacks Meal preparation for all breakfasts and some lunches servery
Meal preparation for all breakfasts and some lunches servery
Servery snacks
Family dining room or central country kitchen usage
Small group activities family functions by reservation
Small group activities family functions by reservation
Small group meetings Great Room party food preparation family functions by reservation
Small group meetings Great Room party food preparation family functions by reservation
Small group activities family functions by reservation
Houses and capacity 2 20 2 20 3 12 3 12 3 12
Private tubroom Two off the central hallway
Two off the central hallway
One located in each house
One located in each house
None
Private shower areas One per 10 residents located in each wing of each house
One per 10 residents located in each wing of each house
One per resident located in each resident room with the one shared bedroom having a shared shower
One per resident located in each resident room with the one shared bedroom having a shared shower
One per 12 residents located in each house
Resident room doors Split door Split door Split door Regular Split door
Inventory of public rooms and seating capacity (includes all alcoves that can be used for seating and seating areas near exits)
15 165
17 176
15 232
13 219
14 182
Variety and appearance of outdoor Area
2 small (little greenery) 1 medium (mixed hardgreen surfaces) and a large courtyardmdashvery appealing
2 small (much greenery) 1 medium (mixed hardgreen surfaces) 2 large courtyards (1 mixed hardgreen surfaces 1 green) mdash very appealing
3 small (much greenery) 1 large (mostly green courtyard mdash very appealing
3 small (much greenery) and 1 large (mostly green courtyard mdash very appealing
1 small (much greenery) 1 medium (mostly green) and 1 large (mostly green) courtyard mdash very appealing
a Does not include researchteaching wing Total for entire floor space is 40382 sq ft b Room at WDS was not intended as a lounge ie a retreat from work to professionalize the care staff role it was to serve as a place to read and discuss work At other
sites the lunch room also served as a lounge c Room was intended as a multi-purpose room
Mapping Five Sites
37 of 47
Table 2 Therapeutic Environment Screening Scale Items for Goal and Domain Possible Range
Midpoint and Mean in Each Group
Therapeutic Goal and Domain
Item Numbers Range Mid-point ASB amp MDR
20-Capacity Houses MPN MPW amp WDS
12-Capacity Houses
ASB MDR Site Scores
Mean MPN MPW WDS Site Scores
Mean
Safetysecurityhealth
Exit control 2a 2b 2c 2d 2e 2g
2h 3a 3b 0-11 55 2 1 15 1 2 2 17
Maintenance 7b1Dagger 7b2Dagger 7b3Dagger 7b4Dagger 0-8 40 8 8 80 8 8 80
Cleanliness 7a1Dagger 7a2Dagger 7a3 7a4 0-8 40 8 8 80 7 8 8 77
Lack of odorsℓ 9aDagger 9bDagger 0-4 20 4 3 35 4 4 4 40
Safetyℓ 7c1 7c2Dagger 7c3 7c4 8 0-10 60 10 10 100 10 10 10 100
Orientationcuing 19 20ф 27a 27bcDagger
27d 27e 27f 28 29 0-17 85 1212 120 11 9 12 107
Privacycontrol
Privacy 30a 30b 30c 30d 0-4 20 0 0 0 1 2 0 10
Functional ability 16 17a 17b 18Dagger 0-7 35 7 7 70 7 7 7 70
Stimulation
Lighting 21 22a 22bDagger 22cDagger
23a 23b 23c 0-14 70 13 13 130 11 14 13 127
Tactilevisual
stimulation 34 35Dagger 37b 0-16 80 10 6 80 15 14 11 133
Quietness 24a 24b 24c 24d
24eDagger 24f 24g 25 26 0-25 125 21 21 210 19 20 23 207
Physical attractiveness
4a1 4a2 4b1 4b2
4c1 4c2 4d1 4d2 37c 0-34 140 16 15 155 15 16 16 157
Socialization
Homelike
environment 15Dagger 31Dagger 32 0-9 45 9 9 90 9 9 9 90
Resident
appearance 36Dagger
0-2 10 2 2 20 2 2 20
SCUEQS 0-41 - 41 39 40 39 4141 40
CAAQS sect 0-100 - 786 857
Large means represent better physical environment
Dagger Items used to compute the 18-item Special Care Environmental Quality Scale (SCUEQS) 27b and 27c were treated as a single item and item 15 was
misnumbered in the TESS-2+ Revised version (as item 13) ф Item 20 is the percentage of common rooms with signsgraphics floor plans in all sites allowed a view into common rooms (scored as zero) ℓ An item was unintentionally omitted from the TESS-2+ scoring form (10 in Odors and 11 in Safety) sect Composite Above Average Quality Score (CAAQS) represents the percentage of TESS-2+ domains that were above average in quality
Mapping Five Sites
38 of 47
Table 3 Percent of Resident Population Who Were Observed During Behavior Scans
at Each Site in Particular Areasa
AreaSite 20-Capacity Houses 12-Capacity Houses
ASB MDR MPN MPW WDS
Total Areas 608 493 511 564 803
Total Common Areas 62 158 169 200 511
Total Outdoor Areas 46 02 11 56 38
Total House Areas 500 333 331 311 254
House 1 259 168 115 69 62
House 2 241 165 108 128 123
House 3 108 114 69
House Kitchen 149 08 75 53 49
House LivingDining Room 324 278 236 232 200 a Resident data were adjusted to show the mean percent of residents at a site who were observed per scan per day Note Total Areas is the sum of the following Total Common Total Outdoor and Total House Total House Areas is the sum of Houses 1 House 2 and House 3 House Kitchen and LivingDining Rooms are summed across houses Blank cells indicate that the question was not applicable
Mapping Five Sites
39 of 47
Table 4 Percent of Resident Population Who Were Observed During Behavior Scans
at Each Site in Particular Common Areasa
Location 20-Capacity Houses 12-Capacity Houses ASB MDR MPN MPW WDS
Great Room 07 75 94 91 64
Fireplace Seating Area 22 69 43 13 106
ActivityCraft Room 04 47 00 02 10
TV Room ndash ndash 43 64 58
Other TV Area ndash ndash 11 39 ndash
Common Area Hallway Seating 37 108 138 143 396
Music Room ndash ndash 00 ndash 00
Garden Room ndash ndash 00 ndash 04
Beauty Salon 39 12 00 00 00
Family Dining RoomCountry Kitchen 00 09 00 00 00
Total 109 320 329 352 638 a Resident data were adjusted to show the mean percent of residents at a site who were observed per scan per day Note Dashes indicate that residents were not observed in these areas
Mapping Five Sites
40 of 47
Table 5 Percent of Resident Population Who Were Observed During Behavior Scans
at Each Site at Particular Times of Day
Time of Day 20-Capacity Houses 12-Capacity Houses
ASB MDR MPN MPW WDS
Before Lunch 541 360 386 475 654
Lunch 805 663 667 722 1000
Between Meals 657 530 506 589 963
Supper 765 738 744 744 922
After Supper 50 390 447 469 740 a Resident data were adjusted to show the mean percent of residents at a site who were observed per scan per day Note Before Lunch (4 scans-730-1030) Lunch (2 scans-1130 amp 1230) Between Meals (3 scans-1330 to 1530) Supper (2 scans-1630 amp 1730) After Supper (4 scans-1830 to 2130)
Mapping Five Sites
41 of 47
Figure 1 Floor plan of Asbury Place Mt Lebanon PA
Mapping Five Sites
42 of 47
Figure 2 Floor plan of Marjorie Doyle Rockwell Center Cohoes NY
Mapping Five Sites
43 of 47
Figure 3 Floor plan of McConnell Place North Edmonton AB
Mapping Five Sites
44 of 47
Figure 4 Floor plan of McConnell Place West Edmonton AB
Mapping Five Sites
45 of 47
Figure 5 Floor plan of Woodside Place Oakmont PA
Mapping Five Sites
46 of 47
Figure 6
McConnell Place Northordf Residentsrsquo Activities When Alone and in the Presence of Staff
ordf The average MMSE score was 153 at MPN higher than the average across sites 132 + 15 (M+SE) MPN residents appeared not to initiate activities when alone
0
5
10
15
20
25
30
35
40
Alone Day 1 With Staff Day 1 Alone Day 2 With Staff Day 2
Nu
mb
er R
esid
ents
Arts amp Crafts
Chores
CookingBaking
Eating
Exercising
Games
Grooming
Lg Activity Grp
Music Event
Reading
Sm Interaction
Walking
Watching
Watching TV
Other
Mapping Five Sites
47 of 47
Figure 7
Percent of Scans in Which Residents at Each Site Engaged in Particular Behaviors
0
10
20
30
40
50
60
70
80
90
100
ASB MDR MPN MPW WDS
Misc
Just Sit
Watch
Walk
Leisure
Work
ADLs

Mapping Five Sites
33 of 47
Milke D L (2003) Iterative post-occupancy evaluations of the McConnell Place North design
[Abstract] Proceedings of the 56th Annual Scientific Meeting of the Gerontological Society of
America 43 48 San Diego CA
Milke D L Clark C amp Bucknell M (2000) Assessing the adequacy of residential lighting in two
care centres for persons with Alzheimerrsquos Disease using the new age-adjusted North American
illumination recommendations (Research Report) Ottawa Ontario Canada Canada Mortgage
and Housing Corporation
National Institute on Aging Coordinating Center (1993) NIA collaborative studies special care units
for Alzheimers disease Manual of procedures Davis CA Northern California Alzheimers
Disease Center University of California
Rabig J Thomas W Kane R A Cutler L J amp McAlilly S (2006) Radical redesign of nursing
homes Applying the Green House concept in Tupelo Mississippi The Gerontologist 46 533-
539
Rule B G Milke D L amp Dobbs A R (1992) Design of institutions Cognitive functioning and
social interactions of the aged resident Journal of Applied Gerontology 11 475-488
Saxton J Silverman M Ricci E Keane C amp Deely B (1998) Maintenance of mobility in
residents of an Alzheimer special care facility International Psychogeriatrics 10 213-224
Schwarz B Chaudhury H amp Tofle R B (2004) Effect of design interventions on a dementia care
setting American Journal of Alzheimers Disease and Other Dementias 19 172-176
Silverman M Ricci E Saxton J Ledewitz S McAllister C amp Keane C (1995) Woodside
Place The first three years of a residential Alzheimerrsquos facility (Vols 1-2) Oakmont PA
Presbyterian Senior Care
Skea D amp Lindesay J (1996) An evaluation of two models of long-term residential care for
elderly people with dementia International Journal of Geriatric Psychiatry 11 233-241
Mapping Five Sites
34 of 47
Slaughter S Calkins M Eliasziw M amp Reimer M (2006) Measuring physical and social
environments in nursing homes for people with middle- to late-stage dementia Journal of the
American Geriatrics Society 54 1436-1441
Sloane P D Brooker D Cohen L Douglass C Edelman P Fulton B R et al (2007)
Dementia Care Mapping as a research tool International Journal of Geriatric Psychiatry 22
580-589
Sloane P D Mitchell M Priesser J S Phillips C Commander C amp Burker E (1998)
Environmental correlates of resident agitation in Alzheimerrsquos disease special care units Journal
of the American Geriatric Society 46 862ndash869
Sloane P D Mitchell C M Weisman G Zimmerman S Foley K M L Lynn M et al
(2002) The Therapeutic Environment Screening Survey for Nursing Homes (TESS-NH) An
observational instrument for assessing the physical environment of institutional settings for
persons with dementia Journals of Gerontology Series B Psychological Sciences and Social
Sciences 57B(Suppl 2) S69-S78
Sloane P D Zimmerman S Williams C S Reed P S Gill KS amp Preisser J S (2005)
Evaluating the quality of life of long-term care residents with dementia The Gerontologist 45
37-49
Snyder L G (1980) An exploratory study of patterns of social interaction organization and facility
design in three nursing homes In J Hendricks (Ed) Institutionalization and Alternative Futures
(pp 68-80) Farmingdale NY Baywood Pub Co
Sommer R amp Sommer B B (1986) A practical guide to behavioral research Tools and
techniques (2nd ed) New York Oxford
Van Haitsma K Lawton M P amp Kleban M H (2000) Does segregation help or hinder
Examining the role of heterogeneity in behavioral and emotional aspects of quality of life for
Mapping Five Sites
35 of 47
persons with cognitive impairment in the nursing home Research and Practice in Alzheimerrsquos
Disease 4 163-177
Verbeek H van Rossum E Zwakhalen S M G Kempen G I J M amp Hamers J P H (2009)
Small homelike care environments for older people with dementia A literature review
International Psychogeriatrics 21 252-264
Voelkl J E (2006) Therapeutic environments in nursing homes Fostering residents meaningful
activity engagement Activities Directors Quarterly for Alzheimers and Other Dementia
Patients 7(3) 35-44
Warren S (Ed) (1998) Innovative dementia care McConnell Place North evaluation (Research
Report) Edmonton Alberta Canada Evaluating Programs of Innovative Continuing Care
Zeisel J (1998) The Hearthstone health environments case study Journal of Healthcare Design
Proceedings from the Symposium on Healthcare Design San Francisco CA National
Symposium on Healthcare Design Inc
Zeisel J Hyde J amp Levkoff S (1994) Best practices An environment-behavior (E-B) model for
Alzheimer special care units American Journal of Alzheimerrsquos Care and Related Disorders and
Research and Care 9(2) 4-21
Zimmerman S Sloane P D Williams C S Reed P S Preisser J S Eckert J K et al (2005)
Dementia care and quality of life in assisted living and nursing homes The Gerontologist 45
133-146
Mapping Five Sites
36 of 47
Table 1 Comparison of Architectural Features Across Five Sites
Feature ASB MDR MPN MPW WDS
Total facility square footage 23040 sq ft 27308 sq fta 24750 sq ft 23864 sq ft 21540 sq ft
Size of administration area (offices conference reception etc but not service or employee spaces)
960 sq ft (No entry hall)
1584 sq ft day program offices and program space
1675 sq ft 1629 sq ft 972 sq ft (No entry hall)
Staff (lunch) room 16rsquo x 18rsquo 6rsquo11rdquo x 6rsquo2rdquo 158rsquo x 16rsquo 138rsquo x 16rsquo 95rsquo x 30rsquo (plus)b
Treatment or examination room
No Yes In daycare area
No No Yes In central
areac
Medications storage Central medication cart
Medication room Medication room per house
Medication room per house
Central medication cart
Location of meal preparation
Facility kitchen in administration area
Facility kitchen in administration area
Adjacent nursing home (see house kitchen)
Adjacent nursing home (see house kitchen)
Facility kitchen in administration area
Use of house kitchen Servery snacks Servery snacks Meal preparation for all breakfasts and some lunches servery
Meal preparation for all breakfasts and some lunches servery
Servery snacks
Family dining room or central country kitchen usage
Small group activities family functions by reservation
Small group activities family functions by reservation
Small group meetings Great Room party food preparation family functions by reservation
Small group meetings Great Room party food preparation family functions by reservation
Small group activities family functions by reservation
Houses and capacity 2 20 2 20 3 12 3 12 3 12
Private tubroom Two off the central hallway
Two off the central hallway
One located in each house
One located in each house
None
Private shower areas One per 10 residents located in each wing of each house
One per 10 residents located in each wing of each house
One per resident located in each resident room with the one shared bedroom having a shared shower
One per resident located in each resident room with the one shared bedroom having a shared shower
One per 12 residents located in each house
Resident room doors Split door Split door Split door Regular Split door
Inventory of public rooms and seating capacity (includes all alcoves that can be used for seating and seating areas near exits)
15 165
17 176
15 232
13 219
14 182
Variety and appearance of outdoor Area
2 small (little greenery) 1 medium (mixed hardgreen surfaces) and a large courtyardmdashvery appealing
2 small (much greenery) 1 medium (mixed hardgreen surfaces) 2 large courtyards (1 mixed hardgreen surfaces 1 green) mdash very appealing
3 small (much greenery) 1 large (mostly green courtyard mdash very appealing
3 small (much greenery) and 1 large (mostly green courtyard mdash very appealing
1 small (much greenery) 1 medium (mostly green) and 1 large (mostly green) courtyard mdash very appealing
a Does not include researchteaching wing Total for entire floor space is 40382 sq ft b Room at WDS was not intended as a lounge ie a retreat from work to professionalize the care staff role it was to serve as a place to read and discuss work At other
sites the lunch room also served as a lounge c Room was intended as a multi-purpose room
Mapping Five Sites
37 of 47
Table 2 Therapeutic Environment Screening Scale Items for Goal and Domain Possible Range
Midpoint and Mean in Each Group
Therapeutic Goal and Domain
Item Numbers Range Mid-point ASB amp MDR
20-Capacity Houses MPN MPW amp WDS
12-Capacity Houses
ASB MDR Site Scores
Mean MPN MPW WDS Site Scores
Mean
Safetysecurityhealth
Exit control 2a 2b 2c 2d 2e 2g
2h 3a 3b 0-11 55 2 1 15 1 2 2 17
Maintenance 7b1Dagger 7b2Dagger 7b3Dagger 7b4Dagger 0-8 40 8 8 80 8 8 80
Cleanliness 7a1Dagger 7a2Dagger 7a3 7a4 0-8 40 8 8 80 7 8 8 77
Lack of odorsℓ 9aDagger 9bDagger 0-4 20 4 3 35 4 4 4 40
Safetyℓ 7c1 7c2Dagger 7c3 7c4 8 0-10 60 10 10 100 10 10 10 100
Orientationcuing 19 20ф 27a 27bcDagger
27d 27e 27f 28 29 0-17 85 1212 120 11 9 12 107
Privacycontrol
Privacy 30a 30b 30c 30d 0-4 20 0 0 0 1 2 0 10
Functional ability 16 17a 17b 18Dagger 0-7 35 7 7 70 7 7 7 70
Stimulation
Lighting 21 22a 22bDagger 22cDagger
23a 23b 23c 0-14 70 13 13 130 11 14 13 127
Tactilevisual
stimulation 34 35Dagger 37b 0-16 80 10 6 80 15 14 11 133
Quietness 24a 24b 24c 24d
24eDagger 24f 24g 25 26 0-25 125 21 21 210 19 20 23 207
Physical attractiveness
4a1 4a2 4b1 4b2
4c1 4c2 4d1 4d2 37c 0-34 140 16 15 155 15 16 16 157
Socialization
Homelike
environment 15Dagger 31Dagger 32 0-9 45 9 9 90 9 9 9 90
Resident
appearance 36Dagger
0-2 10 2 2 20 2 2 20
SCUEQS 0-41 - 41 39 40 39 4141 40
CAAQS sect 0-100 - 786 857
Large means represent better physical environment
Dagger Items used to compute the 18-item Special Care Environmental Quality Scale (SCUEQS) 27b and 27c were treated as a single item and item 15 was
misnumbered in the TESS-2+ Revised version (as item 13) ф Item 20 is the percentage of common rooms with signsgraphics floor plans in all sites allowed a view into common rooms (scored as zero) ℓ An item was unintentionally omitted from the TESS-2+ scoring form (10 in Odors and 11 in Safety) sect Composite Above Average Quality Score (CAAQS) represents the percentage of TESS-2+ domains that were above average in quality
Mapping Five Sites
38 of 47
Table 3 Percent of Resident Population Who Were Observed During Behavior Scans
at Each Site in Particular Areasa
AreaSite 20-Capacity Houses 12-Capacity Houses
ASB MDR MPN MPW WDS
Total Areas 608 493 511 564 803
Total Common Areas 62 158 169 200 511
Total Outdoor Areas 46 02 11 56 38
Total House Areas 500 333 331 311 254
House 1 259 168 115 69 62
House 2 241 165 108 128 123
House 3 108 114 69
House Kitchen 149 08 75 53 49
House LivingDining Room 324 278 236 232 200 a Resident data were adjusted to show the mean percent of residents at a site who were observed per scan per day Note Total Areas is the sum of the following Total Common Total Outdoor and Total House Total House Areas is the sum of Houses 1 House 2 and House 3 House Kitchen and LivingDining Rooms are summed across houses Blank cells indicate that the question was not applicable
Mapping Five Sites
39 of 47
Table 4 Percent of Resident Population Who Were Observed During Behavior Scans
at Each Site in Particular Common Areasa
Location 20-Capacity Houses 12-Capacity Houses ASB MDR MPN MPW WDS
Great Room 07 75 94 91 64
Fireplace Seating Area 22 69 43 13 106
ActivityCraft Room 04 47 00 02 10
TV Room ndash ndash 43 64 58
Other TV Area ndash ndash 11 39 ndash
Common Area Hallway Seating 37 108 138 143 396
Music Room ndash ndash 00 ndash 00
Garden Room ndash ndash 00 ndash 04
Beauty Salon 39 12 00 00 00
Family Dining RoomCountry Kitchen 00 09 00 00 00
Total 109 320 329 352 638 a Resident data were adjusted to show the mean percent of residents at a site who were observed per scan per day Note Dashes indicate that residents were not observed in these areas
Mapping Five Sites
40 of 47
Table 5 Percent of Resident Population Who Were Observed During Behavior Scans
at Each Site at Particular Times of Day
Time of Day 20-Capacity Houses 12-Capacity Houses
ASB MDR MPN MPW WDS
Before Lunch 541 360 386 475 654
Lunch 805 663 667 722 1000
Between Meals 657 530 506 589 963
Supper 765 738 744 744 922
After Supper 50 390 447 469 740 a Resident data were adjusted to show the mean percent of residents at a site who were observed per scan per day Note Before Lunch (4 scans-730-1030) Lunch (2 scans-1130 amp 1230) Between Meals (3 scans-1330 to 1530) Supper (2 scans-1630 amp 1730) After Supper (4 scans-1830 to 2130)
Mapping Five Sites
41 of 47
Figure 1 Floor plan of Asbury Place Mt Lebanon PA
Mapping Five Sites
42 of 47
Figure 2 Floor plan of Marjorie Doyle Rockwell Center Cohoes NY
Mapping Five Sites
43 of 47
Figure 3 Floor plan of McConnell Place North Edmonton AB
Mapping Five Sites
44 of 47
Figure 4 Floor plan of McConnell Place West Edmonton AB
Mapping Five Sites
45 of 47
Figure 5 Floor plan of Woodside Place Oakmont PA
Mapping Five Sites
46 of 47
Figure 6
McConnell Place Northordf Residentsrsquo Activities When Alone and in the Presence of Staff
ordf The average MMSE score was 153 at MPN higher than the average across sites 132 + 15 (M+SE) MPN residents appeared not to initiate activities when alone
0
5
10
15
20
25
30
35
40
Alone Day 1 With Staff Day 1 Alone Day 2 With Staff Day 2
Nu
mb
er R
esid
ents
Arts amp Crafts
Chores
CookingBaking
Eating
Exercising
Games
Grooming
Lg Activity Grp
Music Event
Reading
Sm Interaction
Walking
Watching
Watching TV
Other
Mapping Five Sites
47 of 47
Figure 7
Percent of Scans in Which Residents at Each Site Engaged in Particular Behaviors
0
10
20
30
40
50
60
70
80
90
100
ASB MDR MPN MPW WDS
Misc
Just Sit
Watch
Walk
Leisure
Work
ADLs
Mapping Five Sites
34 of 47
Slaughter S Calkins M Eliasziw M amp Reimer M (2006) Measuring physical and social
environments in nursing homes for people with middle- to late-stage dementia Journal of the
American Geriatrics Society 54 1436-1441
Sloane P D Brooker D Cohen L Douglass C Edelman P Fulton B R et al (2007)
Dementia Care Mapping as a research tool International Journal of Geriatric Psychiatry 22
580-589
Sloane P D Mitchell M Priesser J S Phillips C Commander C amp Burker E (1998)
Environmental correlates of resident agitation in Alzheimerrsquos disease special care units Journal
of the American Geriatric Society 46 862ndash869
Sloane P D Mitchell C M Weisman G Zimmerman S Foley K M L Lynn M et al
(2002) The Therapeutic Environment Screening Survey for Nursing Homes (TESS-NH) An
observational instrument for assessing the physical environment of institutional settings for
persons with dementia Journals of Gerontology Series B Psychological Sciences and Social
Sciences 57B(Suppl 2) S69-S78
Sloane P D Zimmerman S Williams C S Reed P S Gill KS amp Preisser J S (2005)
Evaluating the quality of life of long-term care residents with dementia The Gerontologist 45
37-49
Snyder L G (1980) An exploratory study of patterns of social interaction organization and facility
design in three nursing homes In J Hendricks (Ed) Institutionalization and Alternative Futures
(pp 68-80) Farmingdale NY Baywood Pub Co
Sommer R amp Sommer B B (1986) A practical guide to behavioral research Tools and
techniques (2nd ed) New York Oxford
Van Haitsma K Lawton M P amp Kleban M H (2000) Does segregation help or hinder
Examining the role of heterogeneity in behavioral and emotional aspects of quality of life for
Mapping Five Sites
35 of 47
persons with cognitive impairment in the nursing home Research and Practice in Alzheimerrsquos
Disease 4 163-177
Verbeek H van Rossum E Zwakhalen S M G Kempen G I J M amp Hamers J P H (2009)
Small homelike care environments for older people with dementia A literature review
International Psychogeriatrics 21 252-264
Voelkl J E (2006) Therapeutic environments in nursing homes Fostering residents meaningful
activity engagement Activities Directors Quarterly for Alzheimers and Other Dementia
Patients 7(3) 35-44
Warren S (Ed) (1998) Innovative dementia care McConnell Place North evaluation (Research
Report) Edmonton Alberta Canada Evaluating Programs of Innovative Continuing Care
Zeisel J (1998) The Hearthstone health environments case study Journal of Healthcare Design
Proceedings from the Symposium on Healthcare Design San Francisco CA National
Symposium on Healthcare Design Inc
Zeisel J Hyde J amp Levkoff S (1994) Best practices An environment-behavior (E-B) model for
Alzheimer special care units American Journal of Alzheimerrsquos Care and Related Disorders and
Research and Care 9(2) 4-21
Zimmerman S Sloane P D Williams C S Reed P S Preisser J S Eckert J K et al (2005)
Dementia care and quality of life in assisted living and nursing homes The Gerontologist 45
133-146
Mapping Five Sites
36 of 47
Table 1 Comparison of Architectural Features Across Five Sites
Feature ASB MDR MPN MPW WDS
Total facility square footage 23040 sq ft 27308 sq fta 24750 sq ft 23864 sq ft 21540 sq ft
Size of administration area (offices conference reception etc but not service or employee spaces)
960 sq ft (No entry hall)
1584 sq ft day program offices and program space
1675 sq ft 1629 sq ft 972 sq ft (No entry hall)
Staff (lunch) room 16rsquo x 18rsquo 6rsquo11rdquo x 6rsquo2rdquo 158rsquo x 16rsquo 138rsquo x 16rsquo 95rsquo x 30rsquo (plus)b
Treatment or examination room
No Yes In daycare area
No No Yes In central
areac
Medications storage Central medication cart
Medication room Medication room per house
Medication room per house
Central medication cart
Location of meal preparation
Facility kitchen in administration area
Facility kitchen in administration area
Adjacent nursing home (see house kitchen)
Adjacent nursing home (see house kitchen)
Facility kitchen in administration area
Use of house kitchen Servery snacks Servery snacks Meal preparation for all breakfasts and some lunches servery
Meal preparation for all breakfasts and some lunches servery
Servery snacks
Family dining room or central country kitchen usage
Small group activities family functions by reservation
Small group activities family functions by reservation
Small group meetings Great Room party food preparation family functions by reservation
Small group meetings Great Room party food preparation family functions by reservation
Small group activities family functions by reservation
Houses and capacity 2 20 2 20 3 12 3 12 3 12
Private tubroom Two off the central hallway
Two off the central hallway
One located in each house
One located in each house
None
Private shower areas One per 10 residents located in each wing of each house
One per 10 residents located in each wing of each house
One per resident located in each resident room with the one shared bedroom having a shared shower
One per resident located in each resident room with the one shared bedroom having a shared shower
One per 12 residents located in each house
Resident room doors Split door Split door Split door Regular Split door
Inventory of public rooms and seating capacity (includes all alcoves that can be used for seating and seating areas near exits)
15 165
17 176
15 232
13 219
14 182
Variety and appearance of outdoor Area
2 small (little greenery) 1 medium (mixed hardgreen surfaces) and a large courtyardmdashvery appealing
2 small (much greenery) 1 medium (mixed hardgreen surfaces) 2 large courtyards (1 mixed hardgreen surfaces 1 green) mdash very appealing
3 small (much greenery) 1 large (mostly green courtyard mdash very appealing
3 small (much greenery) and 1 large (mostly green courtyard mdash very appealing
1 small (much greenery) 1 medium (mostly green) and 1 large (mostly green) courtyard mdash very appealing
a Does not include researchteaching wing Total for entire floor space is 40382 sq ft b Room at WDS was not intended as a lounge ie a retreat from work to professionalize the care staff role it was to serve as a place to read and discuss work At other
sites the lunch room also served as a lounge c Room was intended as a multi-purpose room
Mapping Five Sites
37 of 47
Table 2 Therapeutic Environment Screening Scale Items for Goal and Domain Possible Range
Midpoint and Mean in Each Group
Therapeutic Goal and Domain
Item Numbers Range Mid-point ASB amp MDR
20-Capacity Houses MPN MPW amp WDS
12-Capacity Houses
ASB MDR Site Scores
Mean MPN MPW WDS Site Scores
Mean
Safetysecurityhealth
Exit control 2a 2b 2c 2d 2e 2g
2h 3a 3b 0-11 55 2 1 15 1 2 2 17
Maintenance 7b1Dagger 7b2Dagger 7b3Dagger 7b4Dagger 0-8 40 8 8 80 8 8 80
Cleanliness 7a1Dagger 7a2Dagger 7a3 7a4 0-8 40 8 8 80 7 8 8 77
Lack of odorsℓ 9aDagger 9bDagger 0-4 20 4 3 35 4 4 4 40
Safetyℓ 7c1 7c2Dagger 7c3 7c4 8 0-10 60 10 10 100 10 10 10 100
Orientationcuing 19 20ф 27a 27bcDagger
27d 27e 27f 28 29 0-17 85 1212 120 11 9 12 107
Privacycontrol
Privacy 30a 30b 30c 30d 0-4 20 0 0 0 1 2 0 10
Functional ability 16 17a 17b 18Dagger 0-7 35 7 7 70 7 7 7 70
Stimulation
Lighting 21 22a 22bDagger 22cDagger
23a 23b 23c 0-14 70 13 13 130 11 14 13 127
Tactilevisual
stimulation 34 35Dagger 37b 0-16 80 10 6 80 15 14 11 133
Quietness 24a 24b 24c 24d
24eDagger 24f 24g 25 26 0-25 125 21 21 210 19 20 23 207
Physical attractiveness
4a1 4a2 4b1 4b2
4c1 4c2 4d1 4d2 37c 0-34 140 16 15 155 15 16 16 157
Socialization
Homelike
environment 15Dagger 31Dagger 32 0-9 45 9 9 90 9 9 9 90
Resident
appearance 36Dagger
0-2 10 2 2 20 2 2 20
SCUEQS 0-41 - 41 39 40 39 4141 40
CAAQS sect 0-100 - 786 857
Large means represent better physical environment
Dagger Items used to compute the 18-item Special Care Environmental Quality Scale (SCUEQS) 27b and 27c were treated as a single item and item 15 was
misnumbered in the TESS-2+ Revised version (as item 13) ф Item 20 is the percentage of common rooms with signsgraphics floor plans in all sites allowed a view into common rooms (scored as zero) ℓ An item was unintentionally omitted from the TESS-2+ scoring form (10 in Odors and 11 in Safety) sect Composite Above Average Quality Score (CAAQS) represents the percentage of TESS-2+ domains that were above average in quality
Mapping Five Sites
38 of 47
Table 3 Percent of Resident Population Who Were Observed During Behavior Scans
at Each Site in Particular Areasa
AreaSite 20-Capacity Houses 12-Capacity Houses
ASB MDR MPN MPW WDS
Total Areas 608 493 511 564 803
Total Common Areas 62 158 169 200 511
Total Outdoor Areas 46 02 11 56 38
Total House Areas 500 333 331 311 254
House 1 259 168 115 69 62
House 2 241 165 108 128 123
House 3 108 114 69
House Kitchen 149 08 75 53 49
House LivingDining Room 324 278 236 232 200 a Resident data were adjusted to show the mean percent of residents at a site who were observed per scan per day Note Total Areas is the sum of the following Total Common Total Outdoor and Total House Total House Areas is the sum of Houses 1 House 2 and House 3 House Kitchen and LivingDining Rooms are summed across houses Blank cells indicate that the question was not applicable
Mapping Five Sites
39 of 47
Table 4 Percent of Resident Population Who Were Observed During Behavior Scans
at Each Site in Particular Common Areasa
Location 20-Capacity Houses 12-Capacity Houses ASB MDR MPN MPW WDS
Great Room 07 75 94 91 64
Fireplace Seating Area 22 69 43 13 106
ActivityCraft Room 04 47 00 02 10
TV Room ndash ndash 43 64 58
Other TV Area ndash ndash 11 39 ndash
Common Area Hallway Seating 37 108 138 143 396
Music Room ndash ndash 00 ndash 00
Garden Room ndash ndash 00 ndash 04
Beauty Salon 39 12 00 00 00
Family Dining RoomCountry Kitchen 00 09 00 00 00
Total 109 320 329 352 638 a Resident data were adjusted to show the mean percent of residents at a site who were observed per scan per day Note Dashes indicate that residents were not observed in these areas
Mapping Five Sites
40 of 47
Table 5 Percent of Resident Population Who Were Observed During Behavior Scans
at Each Site at Particular Times of Day
Time of Day 20-Capacity Houses 12-Capacity Houses
ASB MDR MPN MPW WDS
Before Lunch 541 360 386 475 654
Lunch 805 663 667 722 1000
Between Meals 657 530 506 589 963
Supper 765 738 744 744 922
After Supper 50 390 447 469 740 a Resident data were adjusted to show the mean percent of residents at a site who were observed per scan per day Note Before Lunch (4 scans-730-1030) Lunch (2 scans-1130 amp 1230) Between Meals (3 scans-1330 to 1530) Supper (2 scans-1630 amp 1730) After Supper (4 scans-1830 to 2130)
Mapping Five Sites
41 of 47
Figure 1 Floor plan of Asbury Place Mt Lebanon PA
Mapping Five Sites
42 of 47
Figure 2 Floor plan of Marjorie Doyle Rockwell Center Cohoes NY
Mapping Five Sites
43 of 47
Figure 3 Floor plan of McConnell Place North Edmonton AB
Mapping Five Sites
44 of 47
Figure 4 Floor plan of McConnell Place West Edmonton AB
Mapping Five Sites
45 of 47
Figure 5 Floor plan of Woodside Place Oakmont PA
Mapping Five Sites
46 of 47
Figure 6
McConnell Place Northordf Residentsrsquo Activities When Alone and in the Presence of Staff
ordf The average MMSE score was 153 at MPN higher than the average across sites 132 + 15 (M+SE) MPN residents appeared not to initiate activities when alone
0
5
10
15
20
25
30
35
40
Alone Day 1 With Staff Day 1 Alone Day 2 With Staff Day 2
Nu
mb
er R
esid
ents
Arts amp Crafts
Chores
CookingBaking
Eating
Exercising
Games
Grooming
Lg Activity Grp
Music Event
Reading
Sm Interaction
Walking
Watching
Watching TV
Other
Mapping Five Sites
47 of 47
Figure 7
Percent of Scans in Which Residents at Each Site Engaged in Particular Behaviors
0
10
20
30
40
50
60
70
80
90
100
ASB MDR MPN MPW WDS
Misc
Just Sit
Watch
Walk
Leisure
Work
ADLs

Mapping Five Sites
42 of 47
Figure 2 Floor plan of Marjorie Doyle Rockwell Center Cohoes NY
Mapping Five Sites
43 of 47
Figure 3 Floor plan of McConnell Place North Edmonton AB
Mapping Five Sites
44 of 47
Figure 4 Floor plan of McConnell Place West Edmonton AB
Mapping Five Sites
45 of 47
Figure 5 Floor plan of Woodside Place Oakmont PA
Mapping Five Sites
46 of 47
Figure 6
McConnell Place Northordf Residentsrsquo Activities When Alone and in the Presence of Staff
ordf The average MMSE score was 153 at MPN higher than the average across sites 132 + 15 (M+SE) MPN residents appeared not to initiate activities when alone
0
5
10
15
20
25
30
35
40
Alone Day 1 With Staff Day 1 Alone Day 2 With Staff Day 2
Nu
mb
er R
esid
ents
Arts amp Crafts
Chores
CookingBaking
Eating
Exercising
Games
Grooming
Lg Activity Grp
Music Event
Reading
Sm Interaction
Walking
Watching
Watching TV
Other
Mapping Five Sites
47 of 47
Figure 7
Percent of Scans in Which Residents at Each Site Engaged in Particular Behaviors
0
10
20
30
40
50
60
70
80
90
100
ASB MDR MPN MPW WDS
Misc
Just Sit
Watch
Walk
Leisure
Work
ADLs
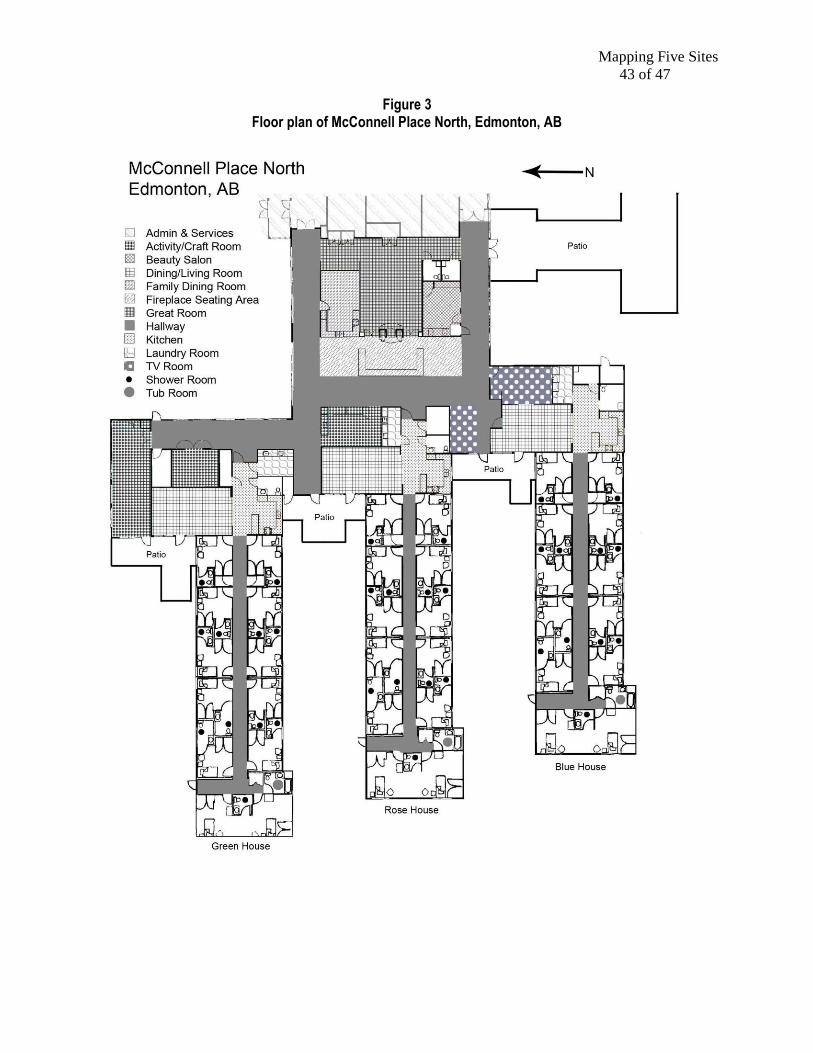
Mapping Five Sites
43 of 47
Figure 3 Floor plan of McConnell Place North Edmonton AB
Mapping Five Sites
44 of 47
Figure 4 Floor plan of McConnell Place West Edmonton AB
Mapping Five Sites
45 of 47
Figure 5 Floor plan of Woodside Place Oakmont PA
Mapping Five Sites
46 of 47
Figure 6
McConnell Place Northordf Residentsrsquo Activities When Alone and in the Presence of Staff
ordf The average MMSE score was 153 at MPN higher than the average across sites 132 + 15 (M+SE) MPN residents appeared not to initiate activities when alone
0
5
10
15
20
25
30
35
40
Alone Day 1 With Staff Day 1 Alone Day 2 With Staff Day 2
Nu
mb
er R
esid
ents
Arts amp Crafts
Chores
CookingBaking
Eating
Exercising
Games
Grooming
Lg Activity Grp
Music Event
Reading
Sm Interaction
Walking
Watching
Watching TV
Other
Mapping Five Sites
47 of 47
Figure 7
Percent of Scans in Which Residents at Each Site Engaged in Particular Behaviors
0
10
20
30
40
50
60
70
80
90
100
ASB MDR MPN MPW WDS
Misc
Just Sit
Watch
Walk
Leisure
Work
ADLs
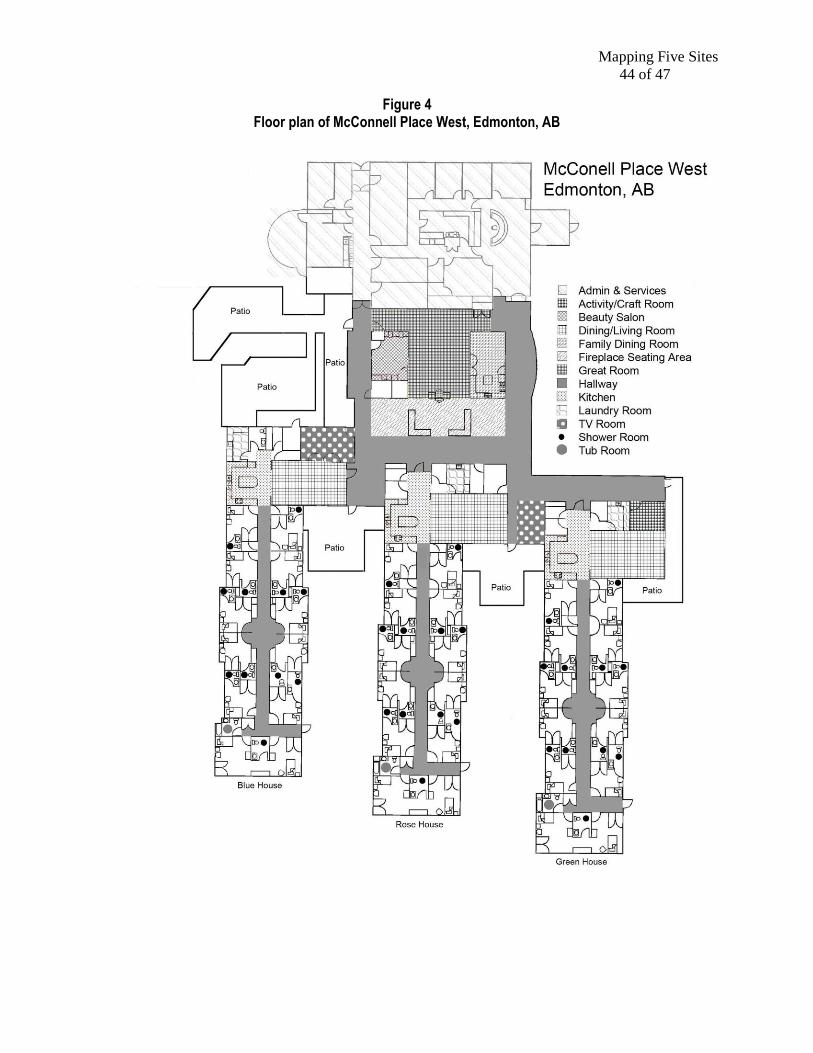
Mapping Five Sites
45 of 47
Figure 5 Floor plan of Woodside Place Oakmont PA
Mapping Five Sites
46 of 47
Figure 6
McConnell Place Northordf Residentsrsquo Activities When Alone and in the Presence of Staff
ordf The average MMSE score was 153 at MPN higher than the average across sites 132 + 15 (M+SE) MPN residents appeared not to initiate activities when alone
0
5
10
15
20
25
30
35
40
Alone Day 1 With Staff Day 1 Alone Day 2 With Staff Day 2
Nu
mb
er R
esid
ents
Arts amp Crafts
Chores
CookingBaking
Eating
Exercising
Games
Grooming
Lg Activity Grp
Music Event
Reading
Sm Interaction
Walking
Watching
Watching TV
Other
Mapping Five Sites
47 of 47
Figure 7
Percent of Scans in Which Residents at Each Site Engaged in Particular Behaviors
0
10
20
30
40
50
60
70
80
90
100
ASB MDR MPN MPW WDS
Misc
Just Sit
Watch
Walk
Leisure
Work
ADLs
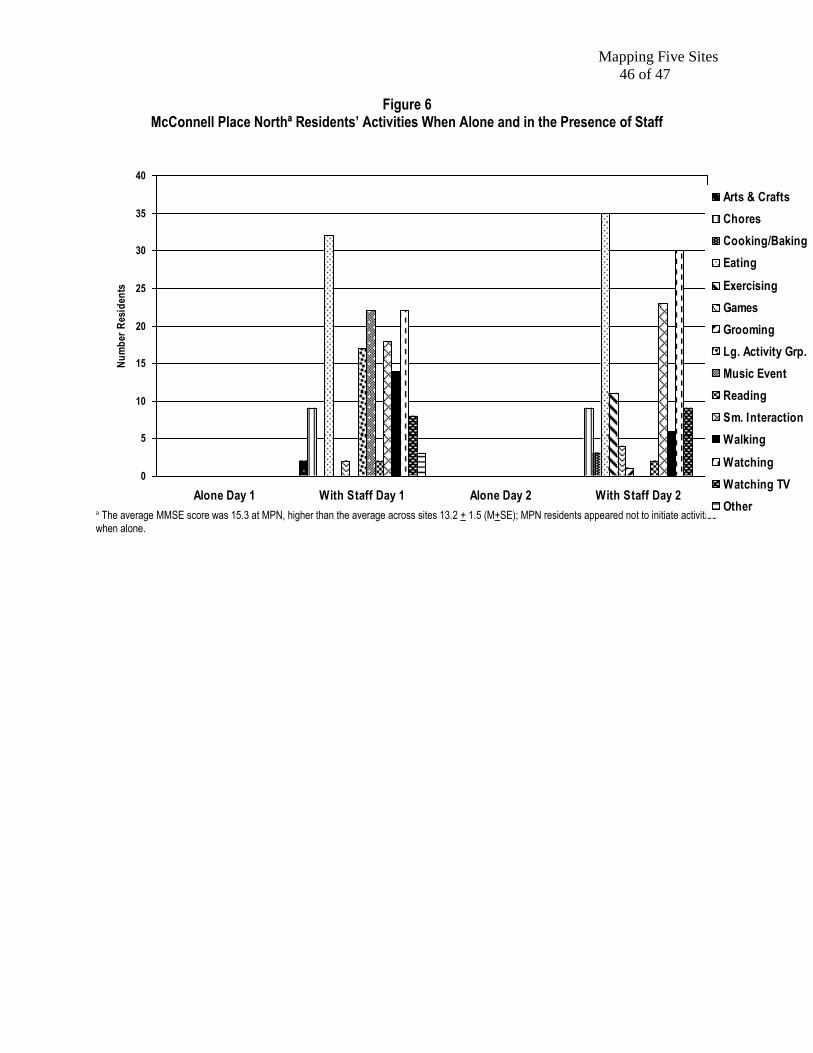
Mapping Five Sites
46 of 47
Figure 6
McConnell Place Northordf Residentsrsquo Activities When Alone and in the Presence of Staff
ordf The average MMSE score was 153 at MPN higher than the average across sites 132 + 15 (M+SE) MPN residents appeared not to initiate activities when alone
0
5
10
15
20
25
30
35
40
Alone Day 1 With Staff Day 1 Alone Day 2 With Staff Day 2
Nu
mb
er R
esid
ents
Arts amp Crafts
Chores
CookingBaking
Eating
Exercising
Games
Grooming
Lg Activity Grp
Music Event
Reading
Sm Interaction
Walking
Watching
Watching TV
Other
Mapping Five Sites
47 of 47
Figure 7
Percent of Scans in Which Residents at Each Site Engaged in Particular Behaviors
0
10
20
30
40
50
60
70
80
90
100
ASB MDR MPN MPW WDS
Misc
Just Sit
Watch
Walk
Leisure
Work
ADLs
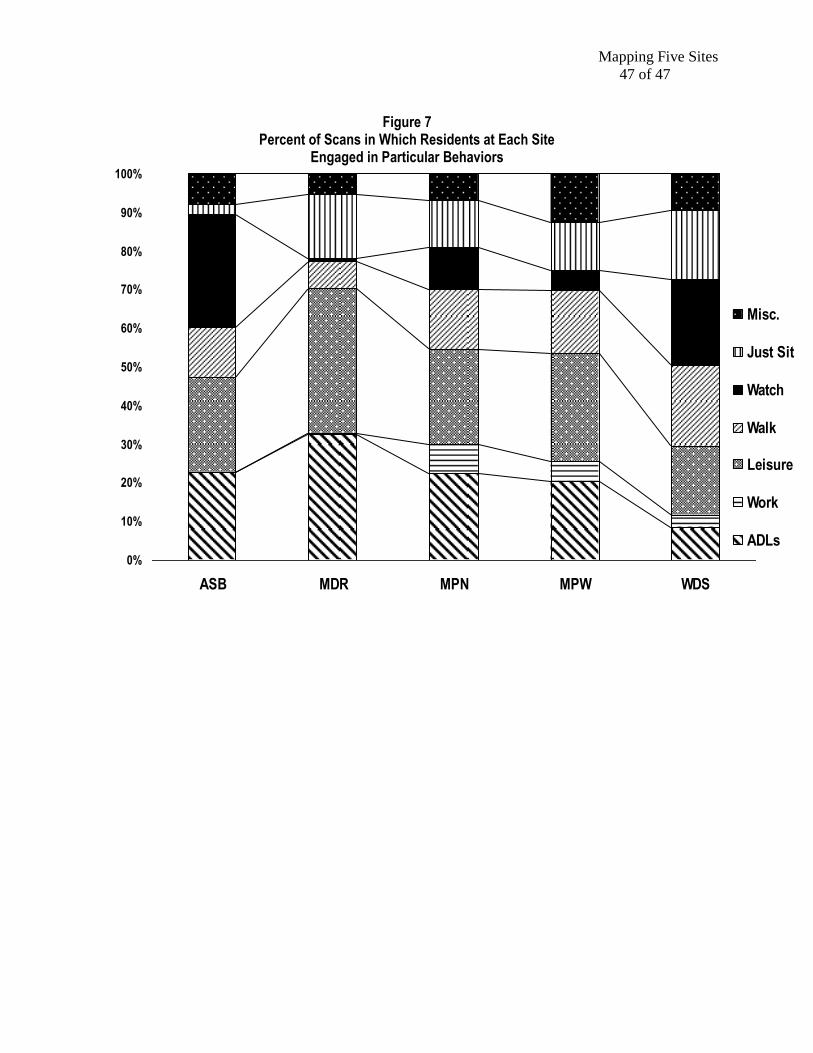
Mapping Five Sites
47 of 47
Figure 7
Percent of Scans in Which Residents at Each Site Engaged in Particular Behaviors
0
10
20
30
40
50
60
70
80
90
100
ASB MDR MPN MPW WDS
Misc
Just Sit
Watch
Walk
Leisure
Work
ADLs