Embed Size (px)
Citation preview

Behavioral Health Indicators for Tennessee and the United States
Contact: Ellen Omohundro, PhD, Research Director
(615) 770-1789
Office of Research
2018 Data Book
May 2018
Prepared by:
Xinqing Deng, MD, MPH and Rachel L. Jones

Page Number
1. Introduction 8
2. Quick facts 9
3. Substance use dashboardsYouth ages 12-17 14
Youth in high school 15
Young adults (18-25) 16
Adults (18+) 17
Adults (26+) 18
4. Substance use indicators for youth ages 12-174.1. Alcohol
4.1.1. Alcohol use in the past month among individuals aged 12-20. 19
4.1.2. Binge alcohol use in the past month among individuals aged 12-20. 19
4.1.3. Used alcohol in the past month. 19
4.1.4. Binge alcohol use in the past month. 19
4.1.5. With an alcohol use disorder in the past year. 20
4.1.6. Perceived a great risk of having five or more drinks of an alcoholic beverage once or
twice per week. 20
4.1.7. Needing but not receiving treatment for alcohol in the past year. 20
4.2. Tobacco/Cigarettes
4.2.1. Used tobacco products in the past month. 20
4.2.2. Used cigarettes in the past month. 21
4.2.3. Perceived a great risk from smoking one or more packs of cigarettes per day. 21
4.3. Illicit drugs
4.3.1. Used illicit drugs in the past month. 21
4.3.2. Used illicit drugs other than marijuana in the past month. 21
4.3.3. With an illicit drug use disorder in the past year. 22
4.3.4. Needing but not receiving substance abuse treatment for illicit drugs. 22
4.4. Marijuana
4.4.1. First use of marijuana. 22
4.4.2. Used marijuana in the past month. 22
4.4.3. Used marijuana in the past year. 23
4.4.4. Perceived a great risk of smoking marijuana once a month. 23
4.5. Non-medical use of pain relievers
4.5.1. Used pain relievers for nonmedical use in the past year. 23
4.5.2. With a pain reliever use disorder in the past year. 23
4.6. Heroin
4.6.1. Youth who used heroin in the past year. 24
Table of Contents
Section A: Substance Use
X. Deng
R. Jones
Behavioral Health Indicators for Tennessee and the United States
2018 Data Book 2

Page Number
4.6.2. Perceived a great risk from trying heroin once or twice. 24
4.7. Cocaine
4.7.1. Used cocaine in the past year. 24
4.7.2. Perceived a great risk from using cocaine once a month. 24
4.8. Substance use
4.8.1. With substance use disorder in the past year. 25
4.8.2. Needing but not receiving treatment at a specialty facility for substance use in the
past year. 25
5. Substance use indicators for youth in high school grades 9-125.1. Alcohol
5.1.1. Drank five or more drinks on the same occasion during the past 30 days. 26
5.1.2. Rode with a driver who had been drinking alcohol during the past 30 days. 26
5.2. Cigarettes
5.2.1. Smoked a cigarette on at least one day during the past 30 days. 26
5.3. Electronic Vapor Products
5.3.1. Ever used electronic vapor products 26
5.4. Methamphetamines
5.4.1. Used methamphetamines one or more times during their lifetime. 27
5.5. Non-medical use of prescription drugs.
5.5.1. Used prescription drugs one or more times in their lifetime without a doctor's
prescription. 27
6. Substance use indicators for young adults ages 18-256.1. Alcohol
6.1.1. Used alcohol in the past month. 28
6.1.2. Binge alcohol use in the past month. 28
6.1.3. With an alcohol use disorder in the past year. 28
6.1.4. Perceived a great risk of having five or more drinks of an alcoholic beverage once or
twice per week. 28
6.1.5. Needing but not receiving substance abuse treatment for alcohol. 29
6.2. Tobacco/Cigarettes
6.2.1. Used tobacco products in the past month. 29
6.2.2. Used cigarettes in the past month. 29
6.2.3. Perceived a great risk from smoking one or more packs of cigarettes per day. 29
6.3. Illicit drugs
6.3.1. Used illicit drugs in the past month. 30
6.3.2. Illicit drug use other than marijuana in the past month. 30
6.3.3. With an illicit drug use disorder in the past year. 30
6.3.4 Needing but not receiving substance abuse treatment for illicit drugs. 30
6.4. Marijuana
6.4.1. First use of marijuana. 31
6.4.2. Used marijuana in the past month. 31
6.4.3. Used marijuana in the past year. 31
6.4.4. Perceived a great risk of smoking marijuana once a month. 31
X. Deng
R. Jones
Behavioral Health Indicators for Tennessee and the United States
2018 Data Book 3

Page Number
6.5. Non-medical use of pain relievers
6.5.1. Used pain relievers for nonmedical use in the past year. 32
6.5.2. With a pain reliever use disorder in the past year. 32
6.6. Heroin
6.6.1. Used heroin in the past year. 32
6.6.2. Perceived a great risk from trying heroin once or twice. 33
6.7. Cocaine
6.7.1. Used cocaine in the past year. 33
6.7.2. Perceived a great rick from using cocaine once a month. 33
6.8. Substance use
6.8.1. With substance use disorder in the past year. 33
6.8.2. Needing but not receiving treatment at a specialty facility for substance use in the
past year. 34
7. Substance use indicators for adults (18 +)7.1. Alcohol
7.1.1. Used alcohol in the past month. 35
7.1.2. Binge alcohol use in the past month. 35
7.1.3. With an alcohol use disorder in the past year. 35
7.1.4. Perceived a great risk of having five or more drinks of an alcoholic beverage once or
twice per week. 35
7.1.5. Needing but not receiving substance abuse treatment for alcohol in the past year.36
7.2. Tobacco/Cigarettes
7.2.1. Used tobacco products in the past month. 36
7.2.2. Used cigarettes in the past month. 36
7.2.3. Perceived a great risk from smoking one or more packs of cigarettes per day. 36
7.3. Illicit drugs
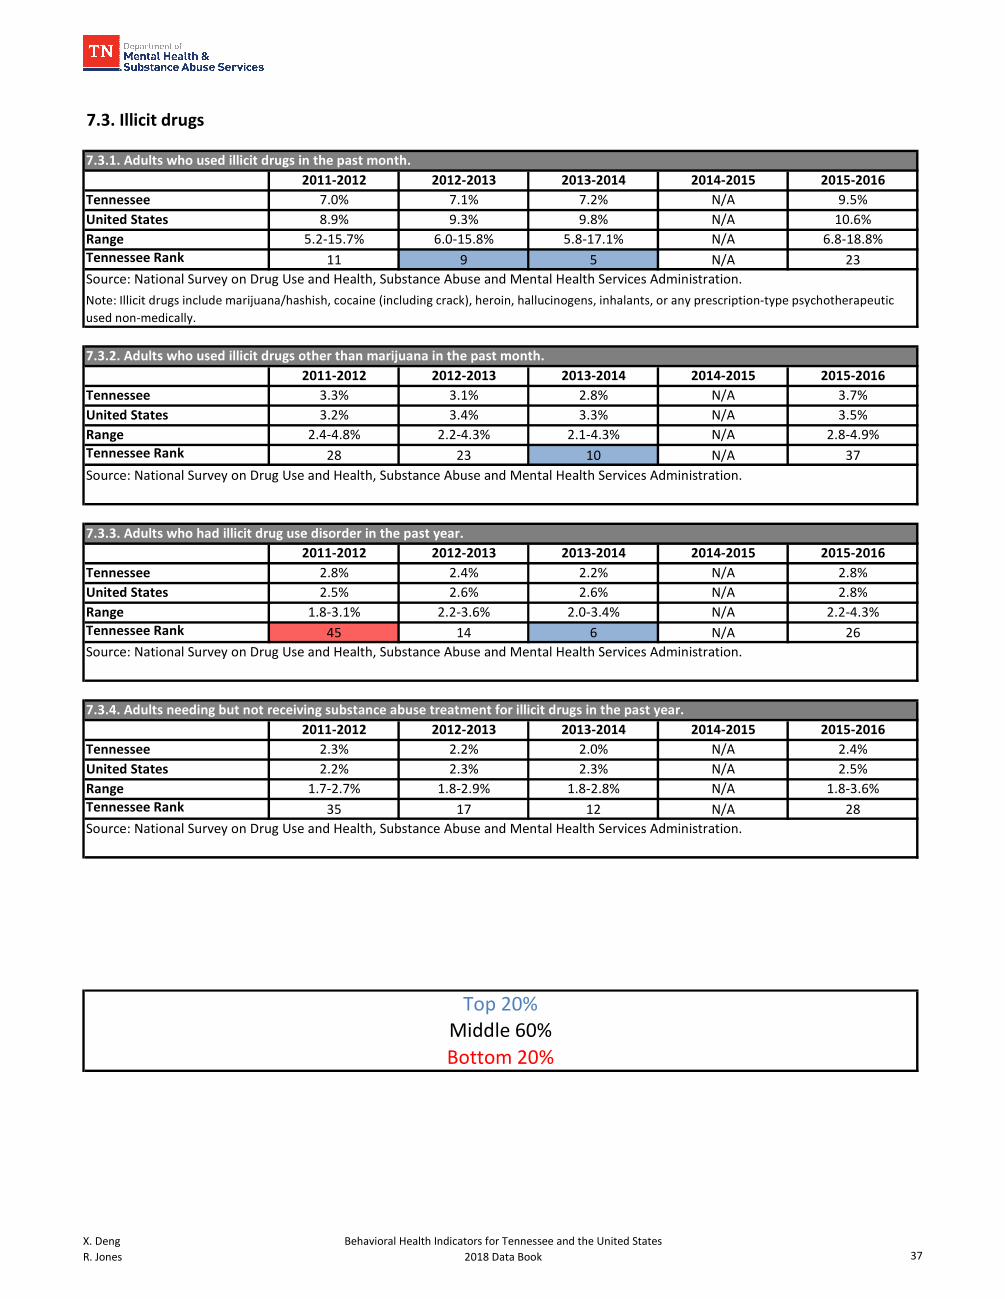
7.3.1. Used illicit drugs in the past month. 37
7.3.2. Used illicit drugs other than marijuana in the past month. 37
7.3.3. With illicit drug use disorder in the past year. 37
7.3.4. Needing but not receiving substance abuse treatment for illicit drugs in the past year.37
7.4. Marijuana
7.4.1. First use of marijuana. 38
7.4.2. Used marijuana in the past month. 38
7.4.3. Used marijuana in the past year. 38
7.4.4. Perceived a great risk of smoking marijuana once a month. 38
7.5. Nonmedical use of pain relievers
7.5.1. Used pain relievers for nonmedical use in the past year. 39
7.5.2. With a pain reliever use disorder in the past year. 39
7.6. Heroin
7.6.1. Used heroin in the past year. 39
7.6.2. Perceived a great risk from trying heroin once or twice. 39
X. Deng
R. Jones
Behavioral Health Indicators for Tennessee and the United States
2018 Data Book 4

Page Number
7.7. Cocaine
7.7.1. Used cocaine in the past year. 40
7.7.2. Perceived a great risk from using cocaine once a month. 40
7.8. Substance use
7.8.1. With substance use disorder in the past year. 40
7.8.2. Needing but not receiving treatment at a specialty facility for substance use in the
past year. 40
8. Substance use indicators for adults (26+)8.1. Alcohol
8.1.1. Used alcohol in the past month. 41
8.1.2. Binge alcohol use in the past month. 41
8.1.3. With an alcohol use disorder in the past year. 41
8.1.4. Perceived a great risk of having five or more drinks of an alcoholic beverage once or
twice per week. 41
8.1.5. Needing but not receiving substance abuse treatment for alcohol. 42
8.2. Tobacco/Cigarettes
8.2.1. Used tobacco in the past month. 42
8.2.2. Used cigarettes in the past month. 42
8.2.3. Perceived a great risk from smoking one or more packs of cigarettes per day. 42
8.3. Illicit drugs
8.3.1. Used illicit drugs in the past month. 43
8.3.2. Used illicit drugs other than marijuana in the past month. 43
8.3.3. With illicit drug use disorder in the past year. 43
8.3.4. Needing but not receiving substance abuse treatment for illicit drugs. 43
8.4. Marijuana
8.4.1. First use of marijuana. 44
8.4.2. Used marijuana in the past month. 44
8.4.3. Used marijuana in the past year. 44
8.4.4. Perceived a great risk of smoking marijuana once a month. 44
8.5. Non-medical use of pain relievers
8.5.1. Used pain relievers for nonmedical use in the past year. 45
8.5.2. With a pain reliever use disorder in the past year. 45
8.6. Heroin
8.6.1. Used heroin in the past year. 45
8.6.2. Perceived a great risk from trying heroin once or twice. 45
8.7. Cocaine
8.7.1. Used cocaine in the past year. 46
8.7.2. Perceived a great risk from using cocaine once a month. 46
X. Deng
R. Jones
Behavioral Health Indicators for Tennessee and the United States
2018 Data Book 5

Page Number
9. Mental health dashboardsChildren and youth (2-17) 48
Youth in high school (grades 9-12) 49
Young adults (18-25) 50
Adults (18+) 51
Adults (26+) 52
10. Mental health for children and youth
10.1. Mental health indicators for children and youth (2-17)
10.1.1. Children with a parent who reports that a doctor has told them their child has
autism, developmental delays, depression, anxiety, ADD/ADHD, or behavioral/conduct
problems. 53
10.1.2. Children with emotional, developmental, or behavioral problems that received
mental health care/counseling of some type during the past 12 months.53
10.2. Mental health indicators for children and youth (ages 12-17)
10.2.1. Youth who had at least one major depressive episode in the past year. 53
11. Mental health indicators for youth in high school grades 9-1211.1. Depression
11.1.1. Youth feeling sad or hopeless (almost every day for two weeks or more in a row). 54
11.2. Suicides
11.2.1. Youth who attempted suicide in the past 12 months. 54
11.2.2. Youth that made a plan about how they would attempt suicide. 54
11.2.3. Youth who attempted suicide that resulted in an injury, poisoning, or overdose that
had to be treated by a doctor or nurse. 54
11.3. Bullying
11.3.1. Youth who were electronically bullied (including being bullied through e-mail, chat
rooms, instant messaging, websites, or texting). 55
11.3.2. Youth who were bullied on school property. 55
12. Mental health indicators for young adults (18-25)12.1. Any mental illness/serious mental illness
12.1.1. Young adults with any mental illness in the past year. 56
12.1.2. Young adults with serious mental illness in the past year. 56
12.1.3. Young adults who received mental health services in the past year. 56
12.2. Depression
12.2.1. Young adults who had at least one major depressive episode in the past year. 57
12.3. Suicides
12.3.1. Young adults who had serious thoughts of suicide in the past year. 57
Section B: Mental Health
X. Deng
R. Jones
Behavioral Health Indicators for Tennessee and the United States
2018 Data Book 6

Page Number
13. Mental health indicators for adults (18+)13.1. Any mental illness/serious mental illness
13.1.1. Adults with any mental illness in the past year. 58
13.1.2. Adults with serious mental illness in the past year. 58
13.1.3. Adults who received mental health services in the past year. 58
13.2. Depression
13.2.1. Adults who had at least one major depressive episode in the past year. 59
13.3. Suicides
13.3.1. Adults who had serious thoughts of suicide in the past year. 59
13.4. Other mental health indicators
13.4.1. Adults who are limited in any activities because of physical, mental or emotional
problems. 59
13.4.2. Days in the past 30 days that adults self-reported their mental health was not good.60
13.4.3. Percent of adults having poor mental health days in the past 30 days. 60
14. Mental health of adults (26+)14.1. Any mental illness/serious mental illness
14.1.1. Adults with any mental illness in the past year. 61
14.1.2. Adults with serious mental illness. 61
14.1.3. Adults who received mental health services in the past year. 61
14.2. Depression
14.2.1. Adults who had at least one major depressive episode in the past year. 62
14.3. Suicides
14.3.1. Adults who had serious thoughts of suicide in the past year. 62
X. Deng
R. Jones
Behavioral Health Indicators for Tennessee and the United States
2018 Data Book 7

1. Introduction
The 2018 Data Book compares Tennessee data to national data for the most recent five years available. The
2018 Data Book has been divided into three sections to facilitate its interpretation.
Quick facts: This section includes a summary of the indicators where Tennessee ranked at the
top or the bottom when compared with other states based on the most recent data available. This
section includes information about patterns of ranks across years.
Dashboards: This section includes tables or dashboards grouping indicators' most recent data
available by type (substance use or mental health) and age group. The purpose of this section is to
provide a brief profile of substance use and mental health in Tennessee by age group. Each
dashboard includes the most recent percentages or rates available for the United States and
Tennessee as well as the Tennessee rank.
Indicators: Indicators have been categorized in sections that describe the type of indicator
(substance use or mental health) and the age group. For each indicator, percentages indicating
prevalence in the United States and Tennessee are provided for the most recent five years. A range
that represents the highest and lowest percent or rate on each indicator for a given year is also
provided along with the national ranking for each year.
Tennessee's rank is computed by ranking all states reporting the indicator. When fewer than 50 states are
ranked, the total number of states reporting is noted.
The Tennessee ranks are highlighted as blue or red to signify whether Tennessee is better or worse when
compared with other states. Blue means Tennessee ranks among the top 10 states or top 20% of states
reporting. No color means Tennessee ranks in the middle 30 states or 60% of states reporting. Red means
that Tennessee ranks in the bottom 10 states or bottom 20% of states reporting.
Please note that the order of indicators varies by age group and data source:
National Survey on Drug Use and Health (NSDUH): The data book focuses primarily on indicators from the
NSDUH. It provides information for the age groups 12-17 years, 18-25 years, 18+ years and 26+ years;
therefore, the order of NSDUH indicators is the same for these age groups. Some indicators are removed
from the dashboard because data are not available for 2015-2016 but are included in the indicator sections
for each age group.
Youth Risk Behavior Survey (YRBS): To provide a closer look at youth in high school grades 9-12, additional
data indicators from the YRBS were included. Some indicators are removed from the dashboard because data
are not available for 2015 but are included in the indicator sections for each age group.
Additional data from "The Annie E. Casey Foundation (KIDS COUNT Data Center)" and "The Henry J.
Kaiser Foundation" were included for the mental health section for children and youth ages 2-17.
Behavioral Risk Factor Surveillance System Survey (BRFSS): To supplement mental health information
X. Deng
R. Jones
Behavioral Health Indicators for Tennessee and the United States
2018 Data Book 8

The "quick facts" section highlights indicators for which (1) Tennessee ranks better or worse when compared
with other states' most recent data or (2) an interesting pattern over years was observed.
These highlights have been categorized in two groups: 1) indicators with a high rank, a low prevalence or
improvements in ranking over years; and 2) indicators with a low rank, a high prevalence or decreases in
ranking over years.
2. Quick facts
Indicators with low prevalence or positive outcomes
For most substance abuse indicators, Tennessee rankings were consistently in the top 10 or middle 30.
Tennessee had a lower prevalence of current alcohol users when compared with other states. The
data shows that Tennessee consistently ranked among the top ten states with a lower prevalence of alcohol
use in the past month than the national average among youth and adults over the most recent five years of
data available.
The percentage of people needing but not receiving treatment for alcohol use disorder was lower
than the national average for all age groups, particularly for adults ages 26+.
In addition, Tennessee had a lower prevalence of substance use disorder in the past year than the
national average, and showed a decreased trend in Tennessee and nationwide.
Tennessee improved its ranking for youth in grades 9-12 who smoked a cigarette on at least one day
in the past 30 days in both the 2013 and 2015 YRBS survey, moving up its rank from the bottom 20% to the
middle 60% of states. The prevalence of tobacco product use in the past month and cigarette use in the past
month decreased significantly among youth (ages 12 - 17).
The only mental health indicator where Tennessee had a lower percentage compared to other states
was for youth ages 12-17 who had at least one major depressive episode in the past year.
Tennessee was in the top ten states with a lower prevalence of individuals with an alcohol use
disorder (dependence or abuse of alcohol) in the past year. The percentages of individuals with an alcohol
disorder in the past year in Tennessee were lower than national average levels over the recent five years.
Tennessee was among the top ten states with a lower average annual incidence of marijuana use (age
at first use of marijuana).
The prevalence of marijuana use in the past month/marijuana use in the past year in Tennessee was
lower than the national average, but increased in year 2015 - 2016, particularly in Tennessee.
Tennessee had a lower prevalence of cocaine use in the past year when compared with other states,
but has showed an increased trend since 2013 - 2014 in all age groups.
X. Deng
R. Jones
Behavioral Health Indicators for Tennessee and the United States
2018 Data Book 9

YouthYoung
adultsAdults Adults
Age
12-17
Age
18-25
Age
18+
Age
26+
Alcohol use in the past month.
Binge alcohol use in past year.
Alcohol use disorder in past year.
Needing but not receiving substance abuse
treatment for alcohol. Perceptions of great risk of having five or more
drinks of an alcohol beverage once or twice per
week
First use of marijuana
Perceptions of great risk of smoking marijuana
once a month
Substance use disorder in the past year
The following table highlights the indicators where Tennessee ranks among the top 10, indicating a lower
prevalence of substance use and mental health issues, when compared with other states (based on the most
recent data available).
Table 1. Tennessee ranks among the top 10 states with low prevalence in:
Indicator
Please note that Tennessee ranks in the middle or bottom 20% for most mental health indicators; see next page.
X. Deng
R. Jones
Behavioral Health Indicators for Tennessee and the United States
2018 Data Book 10
Tennessee ranked among the bottom ten states for children and youth (ages 2- 17) who received a
mental health diagnosis by a doctor (e.g., autism, developmental delays, depression, anxiety, ADD/ADHD, or
behavioral/conduct problems).
Tennessee was in the bottom 10 states with the highest number of reported poor mental health days
for adults (18+ years) in the 2015 BRFSS survey.
A higher percentage of adults (26+ years) in Tennessee reported to be experiencing any mental
illness in the last year than the national average and Tennessee ranks in the bottom 10 states over the most
recent five years.
Tennessee ranked among the bottom 20% of states for a few indicators addressing behavioral health
issues for youth in high school (grades 9-12) during 2013. These indicators include:
- the use of methamphetamines;
- the use of non-medical prescription drugs during their lifetime;
- attempted suicides that resulted in an injury that had to be treated by a doctor or nurse.
Tennessee ranks are consistently in the bottom 10 or middle 30 with a higher prevalence than the
national average level for most mental health indicators, particularly for adults ages 26+.
Although improving over the most recent five years, the prevalence of tobacco product use and
cigarette use in the past month was still higher than national average level.
Tennessee ranked among the bottom 10 states with a high prevalence of adults (18+ years) who are
limited in any activities because of physical, mental or emotional problems in the 2015 BRFSS survey.
Indicators with high prevalence or negative outcomes in Tennessee
X. Deng
R. Jones
Behavioral Health Indicators for Tennessee and the United States
2018 Data Book 11

Children/
Youth
Youth in
high schoolAdults Adults
Age
2-17
Grades
9-12
Age
18+
Age
26+
Tobacco product use in the past month Cigarette use in the past month Pain reliever use disorder.
Adults with serious mental illness in the past year.
Used methamphetamines one or more times
during their lifetime. Used prescription drugs one or more times in their
life without a doctor's prescription. Children with a mental health diagnosis. Youth who attempted suicide that resulted in an
injury.
Youth who were bullied on school property in the
past 12 months
Adults who had serious thoughts of suicide.
Adults who are limited in any activities because of
physical, mental or emotional problems.
Number of reported poor mental health days.
Indicator
Table 2. Tennessee ranks among the bottom 10 states on indicators with a :
The following table highlights the indicators where Tennessee ranks in the bottom 10 states, indicating a high
prevalence of substance use and mental health issues, when compared with other states based on the most
recent data available.
X. Deng
R. Jones
Behavioral Health Indicators for Tennessee and the United States
2018 Data Book 12

SECTION A: SUBSTANCE USE
X. Deng
R. Jones
Behavioral Health Indicators for Tennessee and the United States
2018 Data Book 13

US TN TN Rank
Alcohol
Alcohol use in the past month among individuals aged 12-20 19.8% 17.3% nBinge alcohol use in the past month among individuals aged 12-20 12.7% 11.2% nAlcohol use in the past month 9.4% 7.9% nBinge alcohol use in the past month 5.3% 4.5% nAlcohol use disorder (alcohol dependence or abuse) in the past year 2.2% 1.9% nPerceptions of a great risk of having five or more drinks of an alcoholic
beverage once or twice per week43.3% 47.7% n
Needing but not receiving substance abuse treatment for alcohol in the past
year2.2% 1.9% n
Tobacco/Cigarettes
Tobacco product use in the past month 5.7% 7.5% oCigarette use in the past month 3.8% 5.1% oPerceptions of great risk from smoking one or more packs of cigarettes per 68.7% 66.2% oIllicit drugIllicit drug use disorder in the past year 3.3% 3.3% oIllicit drug use in the past month 8.3% 7.9% oIllicit drug use other than marijuana in the past month 2.7% 2.5% oNeeding but not receiving substance abuse treatment for illicit drugs in the
past year 3.1% 3.0% o
Marijuana
First use of marijuana 5.3% 5.0% nMarijuana use in the past month 6.8% 6.2% o
Marijuana use in the past year 12.3% 11.8% o
Perceptions of a great risk of smoking marijuana once a month 27.2% 29.5% o
Pain reliever
Pain reliever misuse in the past year 3.7% 3.9% o
Pain reliever use disorder in the past year 0.6% 0.5% o
Heroin
Heroin use in the past year. 0.1% 0.1% oPerceptions of a great risk from trying heroin once or twice. 65.4% 66.6% o
Cocaine
Cocaine use in the past year. 0.6% 0.5% oPerceptions of great risk from using cocaine once a month 56.5% 60.2% nSubstance useSubstance use disorder in the past year 4.6% 4.0% nNeeding but not receiving treatment at a speciality facility for substance use
in the past year4.4% 3.9% o
3.Substance use dashboardsYouth (ages 12-17) substance use
o (Middle 60%)n (Bottom 20%)
Substance use of youth ages 12-17 2015-2016
Legend
US and TN Percentages: Indicate prevalence for the group indicated in the table.
TN Rank: Compares most recent year’s data for Tennessee with data from other states. A higher ranking
indicates that the state has a lower prevalence or positive outcome. (See data tables for specific ranking.)
n (Top 20%)
Source: National Survey on Drug Use and Health (NSDUH), Substance Abuse and Mental Health Services Administration, 2015-
2016.
X. Deng
R. Jones
Behavioral Health Indicators for Tennessee and the United States
2018 Data Book 14

US TN TN Rank
Alcohol
Rode with a driver who had been drinking alcohol during the past 30 days. 20.0% 16.3% n
Cigarettes
Smoked a cigarette on at least one day during the past 30 days. 10.8% 11.5%
Electronic Vapor Products
Used electronic vapor products on at least one day during the 30 days before
survey 24.1% 21.7%
Source: Youth Risk Behavior Surveillance System (YRBS), Centers for Disease Control and Prevention, 2015
US and TN Percentages: Indicate prevalence for the group indicated in the table.
TN Rank: Compares most recent year’s data for Tennessee with data from other states. A higher ranking
n (Top 20%)o (Middle 60%)n (Bottom 20%)
Legend
Youth in high school (grades 9-12) substance use
Substance use of youth in grades 9-122015
o
o
X. Deng
R. Jones
Behavioral Health Indicators for Tennessee and the United States
2018 Data Book 15

US TN TN Rank
Alcohol
Alcohol use in the past month 57.8% 49.6% nBinge alcohol use in the past month 38.7% 31.2% nAlcohol use disorder (alcohol dependence or abuse) in the past year 10.8% 10.2% oPerceptions of a great risk of having five or more drinks of an alcoholic
beverage once or twice per week36.9% 38.4% o
Needing but not receiving substance abuse treatment for alcohol in the past
year10.5% 9.5% n
Tobacco/Cigarettes
Tobacco product use in the past month 31.5% 36.4% oCigarette use in the past month 25.1% 29.3% oPerceptions of great risk from smoking one or more packs of cigarettes per day 68.3% 64.5% oIllicit drugIllicit drug use in the past month 22.8% 21.3% oIllicit drug use other than marijuana in the past month 7.3% 8.0% oIllicit drug use disorder in the past year 7.1% 7.3% oNeeding but not receiving substance abuse treatment for illicit drugs in the past
year6.6% 6.8% o
Marijuana
First use of marijuana 7.7% 6.5% nMarijuana use in the past month 20.3% 18.3% o
Marijuana use in the past year 32.6% 29.5% o
Perceptions of a great risk of smoking marijuana once a month 14.3% 16.5% nPain reliever
Pain reliever misuse in the past year 7.8% 9.4% n
Pain reliever use disorder in the past year 1.0% 1.4% n
Heroin
Heroin use in the past year. 0.6% 0.6% oPerceptions of great risk from trying heroin once or twice 82.8% 83.7% o
Cocaine
Cocaine use in the past year. 5.5% 4.7% oPerceptions of great risk from using cocaine once a month 65.1% 69.2% nSubstance useSubstance use disorder in the past year 15.2% 13.8% nNeeding but not receiving treatment at a speciality facility for substance use in
the past year14.3% 12.9% n
n (Bottom 20%)
Young Adults (ages 18-25) substance use
Substance use of young adults ages 18-25 2015-2016
Source: National Survey on Drug Use and Health (NSDUH), Substance Abuse and Mental Health Services Administration, 2015-2016.
Legend
US and TN Percentages: Indicate prevalence for the group indicated in the table.
TN Rank: Compares most recent year’s data for Tennessee with data from other states. A higher ranking
indicates that the state has a lower prevalence or positive outcome. (See data tables for specific ranking.)
n (Top 20%)o (Middle 60%)
X. Deng
R. Jones
Behavioral Health Indicators for Tennessee and the United States
2018 Data Book 16

US TN TN Rank
Alcohol
Alcohol use in the past month 55.5% 46.4% nBinge alcohol use in the past month 26.5% 22.0% nAlcohol use disorder (alcohol dependence or abuse) in the past year 6.1% 5.4% nPerceptions of a great risk of having five or more drinks of an alcoholic
beverage once or twice per week44.4% 46.9% n
Needing but not receiving substance abuse treatment for alcohol in the past
year5.8% 5.0% n
Tobacco/Cigarettes
Tobacco product use in the past month 25.6% 37.7% nCigarette use in the past month 20.8% 26.8% nPerceptions of great risk from smoking one or more packs of cigarettes per 73.2% 69.7% o
Illicit drug
Illicit drug use in the past month 10.6% 9.5% o
Illicit drug use other than marijuana in the past month 3.5% 3.7% o
Illicit drug use disorder in the past year 2.8% 2.8% oNeeding but not receiving substance abuse treatment for illicit drugs in the
past year 2.5% 2.4% o
Marijuana
First use of marijuana 1.4% 1.1% nMarijuana use in the past month 8.8% 8.0% oMarijuana use in the past year 13.9% 12.9% oPerceptions of a great risk of smoking marijuana once a month 28.5% 30.3% o
Pain reliever
Pain reliever misuse in the past year 4.5% 4.8% o
Pain reliever use disorder in the past year 0.7% 0.9% nHeroin
Heroin use in the past year. 0.4% 0.3% oPerceptions of great risk from trying heroin once or twice 87.5% 88.2% o
Cocaine
Cocaine use in the past year. 2.0% 1.8% oPerceptions of great risk from using cocaine once a month 73.4% 78.0% nSubstance useSubstance use disorder in the past year 7.9% 7.1% oNeeding but not receiving treatment at a speciality facility for substance use 7.4% 6.4% n
US and TN Percentages: Indicate prevalence for the group indicated in the table.
TN Rank: Compares most recent year’s data for Tennessee with data from other states. A higher ranking
indicates that the state has a lower prevalence or positive outcome. (See data tables for specific ranking.)
n (Top 20%)o (Middle 60%)n (Bottom 20%)
Legend
Adults (ages 18+) substance use
Substance use of young adults ages 18+ 2015-2016
Source: National Survey on Drug Use and Health (NSDUH), Substance Abuse and Mental Health Services Administration, 2015-2016.
X. Deng
R. Jones
Behavioral Health Indicators for Tennessee and the United States
2018 Data Book 17

US TN TN Rank
Alcohol
Alcohol use in the past month 55.1% 45.8% nBinge alcohol use in the past month 24.5% 20.5% nAlcohol use disorder (alcohol dependence or abuse) in the past year 5.3% 4.6% oPerceptions of a great risk of having five or more drinks of an alcoholic
beverage once or twice per week45.7% 48.3% n
Needing but not receiving substance abuse treatment for alcohol in the past
year5.1% 4.2% n
Tobacco/Cigarettes
Tobacco product use in the past month 24.6% 32.1% nCigarette use in the past month 20.1% 26.4% nPerceptions of great risk from smoking one or more packs of cigarettes per
day74.0% 70.6% o
Illicit drug
Illicit drug use in the past month 8.5% 7.5% o
Illicit drug use other than marijuana in the past month 2.9% 3.0% o
Illicit drug use disorder in the past year 2.0% 2.0% oNeeding but not receiving substance abuse treatment for illicit drugs in the
past year 1.8% 1.7% o
Marijuana
First use of marijuana 0.4% 0.3% nMarijuana use in the past month 6.9% 6.3% oMarijuana use in the past year 10.7% 10.2% oPerceptions of a great risk of smoking marijuana once a month 30.9% 32.6% o
Pain reliever
Pain reliever misuse in the past year 4.0% 4.1% o
Pain reliever use disorder in the past year 0.7% 0.8% nHeroin
Heroin use in the past year. 0.3% 0.2% oPerceptions of great risk from trying heroin once or twice 88.2% 89.0% o
Cocaine
Cocaine use in the past year. 1.4% 1.4% oPerceptions of great risk from using cocaine once a month 74.8% 79.5% nSubstance useSubstance use disorder in the past year 6.7% 6.1% oNeeding but not receiving treatment at a speciality facility for substance use
in the past year6.2% 5.4% n
US and TN Percentages: Indicate prevalence for the group indicated in the table.
TN Rank: Compares most recent year’s data for Tennessee with data from other states. A higher ranking
indicates that the state has a lower prevalence or positive outcome. (See data tables for specific ranking.)
n (Top 20%)o (Middle 60%)n (Bottom 20%)
Legend
Adults (ages 26+) substance use
Substance use of young adults ages 26+ 2015-2016
Source: National Survey on Drug Use and Health (NSDUH), Substance Abuse and Mental Health Services Administration, 2015-2016.
X. Deng
R. Jones
Behavioral Health Indicators for Tennessee and the United States
2018 Data Book 18

4.1. Alcohol
2011-2012 2012-2013 2013-2014 2014-2015 2015-2016
Tennessee 18.2% 16.8% 18.4% 17.7% 17.3%
United States 24.7% 23.5% 22.8% 21.6% 19.8%
Range 15.7-34.8% 14.6-35.7% 13.4-31.1% 10.8-31.3% 10.7-31.7%
Tennessee Rank 2 2 4 5 10
Source: National Survey on Drug Use and Health, Substance Abuse and Mental Health Services Administration.
2011-2012 2012-2013 2013-2014 2014-2015 2015-2016
Tennessee 11.9% 11.5% 11.5% N/A 11.2%
United States 15.6% 14.8% 14.0% N/A 12.7%
Range 10.8-24.2% 11.2-23.2% 10.5-20.3% N/A 8.1-22.1%
Tennessee Rank 2 2 3 N/A 11
Source: National Survey on Drug Use and Health, Substance Abuse and Mental Health Services Administration.
2011-2012 2012-2013 2013-2014 2014-2015 2015-2016
Tennessee 10.2% 9.9% 9.4% 8.2% 7.9%
United States 13.1% 12.2% 11.6% 10.6% 9.4%
Range 7.5-17.6% 7.8-15.1% 6.8-14.6% 5.4-13.9% 5.2-12.9%
Tennessee Rank 2 2 5 2 5
Source: National Survey on Drug Use and Health, Substance Abuse and Mental Health Services Administration.
2011-2012 2012-2013 2013-2014 2014-2015 2015-2016
Tennessee 6.5% 6.1% 5.2% N/A 4.5%
United States 7.3% 6.7% 6.2% N/A 5.3%
Range 5.3-10.2% 5.8-8.7% 4.9-8.0% N/A 3.5-7.8%
Tennessee Rank 3 4 5 N/A 7
Source: National Survey on Drug Use and Health, Substance Abuse and Mental Health Services Administration.
4. Substance use indicators for youth ages 12-17
4.1.3. Youth who used alcohol in the past month.
4.1.1. Alcohol use in the past month among individuals aged 12-20.
4.1.4. Youth who had binge alcohol use in the past month.
Top 20%Middle 60%Bottom 20%
4.1.2. Binge alcohol use in the past month among individuals aged 12-20.
X. Deng
R. Jones
Behavioral Health Indicators for Tennessee and the United States
2018 Data Book 19

2011-2012 2012-2013 2013-2014 2014-2015 2015-2016
Tennessee 3.3% 3.1% 2.5% 2.2% 1.9%
United States 3.6% 3.1% 2.8% 2.6% 2.2%
Range 2.7-4.9% 2.3-4.9% 2.1-3.9% 2.1-3.2% 1.6-2.9%Tennessee Rank 11 19 11 4 5
Source: National Survey on Drug Use and Health, Substance Abuse and Mental Health Services Administration.
2011-2012 2012-2013 2013-2014 2014-2015 2015-2016
Tennessee 42.5% 42.2% 37.9% N/A 47.7%
United States 40.2% 39.3% 39.1% N/A 43.3%
Range 31.1-47.2% 30.0-45.7% 31.2-46.3% N/A 34.6-51.3%
Tennessee Rank 9 7 23 N/A 4
Source: National Survey on Drug Use and Health, Substance Abuse and Mental Health Services Administration.
2011-2012 2012-2013 2013-2014 2014-2015 2015-2016
Tennessee 3.1% 2.9% 2.4% N/A 1.9%
United States 3.5% 3.0% 2.6% N/A 2.1%
Range 2.6-4.4% 2.3-4.4% 2.0-3.5% N/A 1.7-2.6%Tennessee Rank 10 15 13 N/A 7
Source: National Survey on Drug Use and Health, Substance Abuse and Mental Health Services Administration.
4.2. Tobacco/Cigarettes
2011-2012 2012-2013 2013-2014 2014-2015 2015-2016
Tennessee 11.5% 10.4% 9.9% 7.9% 7.5%
United States 9.3% 8.2% 7.4% 6.5% 5.7%
Range 6.2-15.5% 5.7-12.8% 5.0-12.5% 3.7-12.6% 3.4-12.4%
Tennessee Rank 38 39 40 30 36
Source: National Survey on Drug Use and Health, Substance Abuse and Mental Health Services Administration.
Bottom 20%
4.1.7. Youth needing but not receiving substance abuse treatment for alcohol in the past year.
Top 20%Middle 60%
4.2.1. Youth who used tobacco products in the past month.
4.1.5. Youth who had alcohol use disorder in the past year.
4.1.6. Youth who have perceptions of a great risk of having five or more drinks of an alcohol beverage once or twice per week.
Note: Alcohol Use Disorder is defined as meeting criteria for alcohol dependence or abuse. Dependence or abuse is based on definitions
found in the 4th edition of the Diagnostic and Statistical Manual of Mental Disorders.
X. Deng
R. Jones
Behavioral Health Indicators for Tennessee and the United States
2018 Data Book 20

2011-2012 2012-2013 2013-2014 2014-2015 2015-2016
Tennessee 8.7% 7.6% 6.5% 5.3% 5.1%
United States 7.2% 6.1% 5.2% 4.5% 3.8%
Range 5.4-11.6% 4.3-9.5% 3.7-8.6% 3.1-8.3% 2.7-7.8%Tennessee Rank 36 39 35 30 36
Source: National Survey on Drug Use and Health, Substance Abuse and Mental Health Services Administration.
2011-2012 2012-2013 2013-2014 2014-2015 2015-2016
Tennessee 64.1% 63.3% 63.3% N/A 66.2%
United States 65.9% 65.0% 65.3% N/A 68.7%
Range 60.7-72.2% 59.1-70.4% 57.6-71.7% N/A 60.7-73.4%
Tennessee Rank 35 35 34 N/A 35
Source: National Survey on Drug Use and Health, Substance Abuse and Mental Health Services Administration.
4.3. Illicit drugs
2011-2012 2012-2013 2013-2014 2014-2015 2015-2016
Tennessee 8.5% 8.2% 7.5% N/A 7.9%
United States 9.8% 9.2% 9.1% N/A 8.3%
Range 6.7-15.5% 6.1-15.1 6.3-14.6% N/A 6.0-13.2%
Tennessee Rank 9 20 9 N/A 19
Source: National Survey on Drug Use and Health, Substance Abuse and Mental Health Services Administration.
2011-2012 2012-2013 2013-2014 2014-2015 2015-2016
Tennessee 4.2% 3.4% 2.9% N/A 2.5%
United States 3.9% 3.7% 3.3% N/A 2.7%
Range 2.7-5.5% 2.4-4.4% 2.4-4.9% N/A 2.1-4.3%
Tennessee Rank 39 29 18 N/A 15
Source: National Survey on Drug Use and Health, Substance Abuse and Mental Health Services Administration.
Top 20%
4.3.1. Youth who used illicit drugs in the past month.
4.2.2. Youth who used cigarettes in the past month.
Bottom 20%
Note: Illicit drugs include marijuana/hashish, cocaine (including crack), heroin, hallucinogens, inhalants, or any prescription-type psychotherapeutic
used non-medically.
4.3.2. Youth who used illicit drugs other than marijuana in the past month.
Middle 60%
4.2.3. Youth who have perceptions of great risk from smoking one or more packs of cigarettes per day.
X. Deng
R. Jones
Behavioral Health Indicators for Tennessee and the United States
2018 Data Book 21

2011-2012 2012-2013 2013-2014 2014-2015 2015-2016
Tennessee 3.5% 3.3% 3.3% N/A 3.3%
United States 4.3% 3.8% 3.5% N/A 3.3%
Range 3.1-6.2% 2.4-5.1% 2.8-4.5% N/A 2.3-4.8%Tennessee Rank 4 13 21 N/A 26
Source: National Survey on Drug Use and Health, Substance Abuse and Mental Health Services Administration.
2011-2012 2012-2013 2013-2014 2014-2015 2015-2016
Tennessee 3.3% 3.1% 3.1% N/A 3.0%
United States 4.0% 3.5% 3.3% N/A 3.1%
Range 3.0-5.8% 2.4-4.8% 2.3-4.1% N/A 2.2-4.8%Tennessee Rank 8 14 22 N/A 27
Source: National Survey on Drug Use and Health, Substance Abuse and Mental Health Services Administration.
4.4. Marijuana
2011-2012 2012-2013 2013-2014 2014-2015 2015-2016
Tennessee 5.2% 5.2% 4.4% 4.5% 5.0%
United States 6.0% 5.8% 5.6% 5.4% 5.3%
Range 3.7-9.4% 3.5-8.2% 3.5-9.1% 3.1-8.2% 3.5-7.8%
Tennessee Rank 11 13 7 9 19
Source: National Survey on Drug Use and Health, Substance Abuse and Mental Health Services Administration.
Note: First use of marijuana: average annual incidence estimates (Expressed as Percentages of the At-Risk Population).
2011-2012 2012-2013 2013-2014 2014-2015 2015-2016
Tennessee 5.9% 6.0% 5.7% 5.9% 6.2%
United States 7.6% 7.2% 7.2% 7.2% 6.8%
Range 5.0-13.4% 4.8-13.0% 5.0-12.6% 4.5-11.1% 4.3-10.5%Tennessee Rank 5 17 12 9 20
Source: National Survey on Drug Use and Health, Substance Abuse and Mental Health Services Administration.
Top 20%Middle 60%Bottom 20%
4.3.4. Youth needing but not receiving substance abuse treatment for illicit drugs in the past year.
4.4.2. Youth who used marijuana in the past month.
4.4.1. Youth first use of marijuana.
4.3.3. Youth who had an illicit drug use disorder in the past year.
X. Deng
R. Jones
Behavioral Health Indicators for Tennessee and the United States
2018 Data Book 22

2011-2012 2012-2013 2013-2014 2014-2015 2015-2016
Tennessee 11.1% 12.5% 11.6% 11.2% 11.8%
United States 13.9% 13.5% 13.3% 12.9% 12.3%
Range 9.9-21.5% 9.8-20.3% 9.9-20.8% 9.0-18.4% 9.6-18.9%Tennessee Rank 5 17 14 8 17
Source: National Survey on Drug Use and Health, Substance Abuse and Mental Health Services Administration.
2011-2012 2012-2013 2013-2014 2014-2015 2015-2016
Tennessee 31.5% 29.0% 25.5% N/A 29.5%
United States 27.0% 25.3% 23.5% N/A 27.2%
Range 19.9-39.7% 19.1-32.3% 16.2-32.8% N/A 17.9-40.3%
Tennessee Rank 11 11 17 N/A 13
Source: National Survey on Drug Use and Health, Substance Abuse and Mental Health Services Administration.
4.5. Nonmedical use of pain relievers
2011-2012 2012-2013 2013-2014 2014-2015 2015-2016
Tennessee 6.6% 5.2% 4.6% N/A 3.9%
United States 5.6% 5.0% 4.7% N/A 3.7%
Range 4.1-8.4% 3.5-7.2% 3.8-6.2% N/A 2.6-5.1%
Tennessee Rank 38 25 24 N/A 28
Source: National Survey on Drug Use and Health, Substance Abuse and Mental Health Services Administration.
2011-2012 2012-2013 2013-2014 2014-2015 2015-2016
Tennessee N/A N/A N/A N/A 0.5%
United States N/A N/A N/A N/A 0.6%
Range N/A N/A N/A N/A 0.4-0.7%
Tennessee Rank N/A N/A N/A N/A 11
Source: National Survey on Drug Use and Health, Substance Abuse and Mental Health Services Administration.
Note: Nonmedical pain relievers include (1) Darvocet-N®, Darvon®, or Tylenol® with codeine; (2) Percocet®, Percodan®, or Tylox®; and (3) Vicodin®,
Lortab®, or Lorcet®/Lorcet Plus®. Additional drugs were (4) codeine; (5) Demerol®; (6) Dilaudid®; (7) Fioricet®; (8) Fiorinal®; (9) hydrocodone; (10)
methadone; (11) morphine; (12) OxyContin®; (13) Phenaphen® with codeine; (14) propoxyphene; (15) SK-65®; (16) Stadol®; (17) Talacen®; (18) Talwin®;
(19) Talwin® NX; (20) tramadol; and (21) Ultram®.
4.5.1. Youth who used pain relievers for nonmedical use in the past year.
Top 20%
4.4.3. Youth who used marijuana in the past year.
4.4.4. Youth who have perceptions of a great risk of smoking marijuana once a month.
Middle 60%Bottom 20%
4.5.2. Youth who had pain reliever use disorder in the past year.
Note: Nonmedical pain relievers include (1) Darvocet-N®, Darvon®, or Tylenol® with codeine; (2) Percocet®, Percodan®, or Tylox®; and (3) Vicodin®,
Lortab®, or Lorcet®/Lorcet Plus®. Additional drugs were (4) codeine; (5) Demerol®; (6) Dilaudid®; (7) Fioricet®; (8) Fiorinal®; (9) hydrocodone; (10)
methadone; (11) morphine; (12) OxyContin®; (13) Phenaphen® with codeine; (14) propoxyphene; (15) SK-65®; (16) Stadol®; (17) Talacen®; (18) Talwin®;
(19) Talwin® NX; (20) tramadol; and (21) Ultram®.
X. Deng
R. Jones
Behavioral Health Indicators for Tennessee and the United States
2018 Data Book 23

4.6. Heroin
2011-2012 2012-2013 2013-2014 2014-2015 2015-2016
Tennessee N/A N/A N/A 0.1% 0.1%
United States N/A N/A N/A 0.1% 0.1%
Range N/A N/A N/A 0.05-0.2% 0.01-0.2%
Tennessee Rank N/A N/A N/A 21 18
Source: National Survey on Drug Use and Health, Substance Abuse and Mental Health Services Administration.
2011-2012 2012-2013 2013-2014 2014-2015 2015-2016
Tennessee N/A N/A N/A N/A 66.6%
United States N/A N/A N/A N/A 65.4%
Range N/A N/A N/A N/A 59.8-70.6%
Tennessee Rank N/A N/A N/A N/A 15
Source: National Survey on Drug Use and Health, Substance Abuse and Mental Health Services Administration.
4.7. Cocaine
2011-2012 2012-2013 2013-2014 2014-2015 2015-2016
Tennessee 0.8% 0.6% 0.4% 0.5% 0.5%
United States 0.8% 0.6% 0.6% 0.6% 0.6%
Range 0.6-1.3% 0.3-1.1% 0.3-1.0 0.4-1.0% 0.3-1.1%
Tennessee Rank 28 31 10 19 16
Source: National Survey on Drug Use and Health, Substance Abuse and Mental Health Services Administration.
2011-2012 2012-2013 2013-2014 2014-2015 2015-2016
Tennessee N/A N/A N/A N/A 60.2%
United States N/A N/A N/A N/A 56.5%
Range N/A N/A N/A N/A 51.2-60.9%
Tennessee Rank N/A N/A N/A N/A 3
Source: National Survey on Drug Use and Health, Substance Abuse and Mental Health Services Administration.
Top 20%Middle 60%Bottom 20%
4.7.1. Youth who have perceptions of great risk from using cocaine once a month.
4.7.1. Youth who used cocaine in the past year.
4.6.2. Youth who have perceptions of great risk from trying heroin once or twice.
4.6.1. Youth who used heroin in the past year.
X. Deng
R. Jones
Behavioral Health Indicators for Tennessee and the United States
2018 Data Book 24

4.8. Substance use
2011-2012 2012-2013 2013-2014 2014-2015 2015-2016
Tennessee 5.8% 5.2% 4.7% N/A 4.0%
United States 6.5% 5.7% 5.1% N/A 4.6%
Range 4.7-9.2% 4.6-7.2% 4.1-6.4% N/A 3.6-8.3%
Tennessee Rank 8 13 9 N/A 8
Source: National Survey on Drug Use and Health, Substance Abuse and Mental Health Services Administration.
2011-2012 2012-2013 2013-2014 2014-2015 2015-2016
Tennessee N/A N/A N/A N/A 3.9%
United States N/A N/A N/A N/A 4.4%
Range N/A N/A N/A N/A 3.2-6.2%
Tennessee Rank N/A N/A N/A N/A 11
Source: National Survey on Drug Use and Health, Substance Abuse and Mental Health Services Administration.
Top 20%Middle 60%Bottom 20%
4.8.1. Youth who had substance use disorder in the past year.
4.8.2. Youth needing but not receiving treatment at a speciality facility for substance use in the past year.
X. Deng
R. Jones
Behavioral Health Indicators for Tennessee and the United States
2018 Data Book 25

5.1. Alcohol
2007 2009 2011 2013 2015
Tennessee 21.7% 19.1% 18.6% 16.1% N/A
United States 26.0% 24.2% 21.9% 20.8% N/A
Range 11.7-32.7% 11.5-30.7% 9.1-26.5% 5.9-24.4% N/ATennessee Rank 8 of 40 6 of 41 12 of 43 11 of 42 N/A
Source: Centers for Disease Control and Prevention. Youth Risk Behavior Survey.
2007 2009 2011 2013 2015
Tennessee 24.2% 22.2% 20.3% 19.8% 16.3%
United States 29.1% 28.3% 24.1% 21.9% 20.0%
Range 14.8-35.6% 13.6-37.1% 13.5-32.2% 12.4-29.6% 14.2-25.5%
Tennessee Rank 10 or 39 8 of 39 7 of 39 14 of 38 5 of 33
Source: Centers for Disease Control and Prevention. Youth Risk Behavior Survey.
5.2. Cigarettes
2007 2009 2011 2013 2015
Tennessee 25.5% 20.9% 21.6% 15.4% 11.5%
United States 20.0% 19.5% 18.1% 15.7% 10.8%
Range 7.9-27.6% 8.5-26.1% 5.9-24.1% 4.4-19.6% 4.8-18.8%
Tennessee Rank 38 of 40 33 of 42 37 of 43 31 of 41 25 of 35Source: Centers for Disease Control and Prevention. Youth Risk Behavior Survey.
5.3. Electronic Vapor Products
2007 2009 2011 2013 2015
Tennessee N/A N/A N/A N/A 21.7%
United States N/A N/A N/A N/A 24.1%
Range N/A N/A N/A N/A 15.3-31.2%
Tennessee Rank N/A N/A N/A N/A 10 of 35
Source: Centers for Disease Control and Prevention. Youth Risk Behavior Survey.
Note: Electronic vapor products include e-cigarettes, e-cigars, vape pipes, vaping pens, e-hookahs, and hookah pens.
5.2.1. Youth who smoked a cigarette on at least one day in the past 30 days.
5.3.1. Youth who used electronic vapor products on at least one day in the 30 days before survey.
5. Substance use indicators for youth in high school grades 9-12
Top 20%Middle 60%Bottom 20%
5.1.1. Youth who drank five or more drinks on the same occasion during the past 30 days (binge drinking).
5.1.2. Youth who rode with a driver who had been drinking alcohol during the past 30 days.
X. Deng
R. Jones
Behavioral Health Indicators for Tennessee and the United States
2018 Data Book 26

5.4. Methamphetamines
2007 2009 2011 2013 2015
Tennessee 3.8% 3.0% 3.5% 4.9% N/A
United States 4.4% 4.1% 3.8% 3.2% N/A
Range 3.0-8.6% 2.3-7.9% 2.4-6.0% 1.6-8.9% N/A
Tennessee Rank 5 of 39 5 of 39 17 of 37 29 of 35 N/A
Source: Centers for Disease Control and Prevention. Youth Risk Behavior Survey.
5.5. Nonmedical use of prescription drugs
N/A N/A 2011 2013 2015
Tennessee N/A N/A 19.9% 17.8% N/A
United States N/A N/A 20.7% 19.0% N/A
Range N/A N/A 12.4-22.1% 8.7-21.5% N/A
Tennessee Rank N/A N/A 28 of 35 29 of 34 N/A
Source: Centers for Disease Control and Prevention. Youth Risk Behavior Survey.
Top 20%Middle 60%Bottom 20%
Notes: Prescription drugs include Oxycontin, Percocet, Vicodin, codeine, Adderall, Ritalin, Xanax or any other prescription drug used nonmedically.
5.4.1. Youth who used methamphetamines one or more times during their lifetime.
5.5.1. Youth who used prescription drugs one or more times in their lifetime without a doctor's prescription.
X. Deng
R. Jones
Behavioral Health Indicators for Tennessee and the United States
2018 Data Book 27

6.1. Alcohol
2011-2012 2012-2013 2013-2014 2014-2015 2015-2016
Tennessee 49.7% 48.0% 53.0% 51.1% 49.6%
United States 60.5% 59.9% 59.6% 59.0% 57.8%
Range 33.4-73.6% 34.5-73.2% 36.6-71.5% 34.8-70.7% 37.4-69.6%
Tennessee Rank 3 2 5 5 5
Source: National Survey on Drug Use and Health, Substance Abuse and Mental Health Services Administration.
2011-2012 2012-2013 2013-2014 2014-2015 2015-2016
Tennessee 31.6% 29.6% 31.2% N/A 31.2%
United States 39.7% 38.7% 37.8% N/A 38.7%
Range 24.2-53.9% 26.2-53.7% 26.1-50.1% N/A 27.1-49.9%
Tennessee Rank 4 2 2 N/A 3
Source: National Survey on Drug Use and Health, Substance Abuse and Mental Health Services Administration.
2011-2012 2012-2013 2013-2014 2014-2015 2015-2016
Tennessee 12.2% 11.6% 11.5% 10.4% 10.2%
United States 14.4% 13.7% 12.6% 11.6% 10.8%
Range 10.6-19.7% 11.0-19.2% 10.1-17.2% 8.9-15.5% 8.4-15.2%
Tennessee Rank 8 5 9 6 13
Source: National Survey on Drug Use and Health, Substance Abuse and Mental Health Services Administration.
2011-2012 2012-2013 2013-2014 2014-2015 2015-2016
Tennessee 37.8% 38.6% 33.7% N/A 38.4%
United States 34.5% 33.8% 33.4% N/A 36.9%
Range 24.8-41.0% 21.3-40.0% 22.2-42.0% N/A 25.0-44.0%Tennessee Rank 10 5 16 N/A 14
Source: National Survey on Drug Use and Health, Substance Abuse and Mental Health Services Administration.
Note: Alcohol Use Disorder is defined as meeting criteria for alcohol dependence or abuse. Dependence or abuse is based on definitions
found in the 4th edition of the Diagnostic and Statistical Manual of Mental Disorders.
6.1.4. Young adults who have perceptions of a great risk of having five or more drinks of an alcoholic beverage once or twice per week.
Top 20%Middle 60%
Bottom 20%
6.1.2. Young adults who had binge alcohol use in the past month.
6. Substance use indicators for young adults (18-25)
6.1.1. Young adults who used alcohol in the past month.
6.1.3. Young adults who had alcohol use disorder in the past year.
X. Deng
R. Jones
Behavioral Health Indicators for Tennessee and the United States
2018 Data Book 28

2011-2012 2012-2013 2013-2014 2014-2015 2015-2016
Tennessee 12.3% 11.7% 11.6% N/A 9.5%
United States 13.9% 13.3% 12.2% N/A 10.5%
Range 9.8-19.1% 10.3-18.7% 9.7-16.6% N/A 7.9-13.1%Tennessee Rank 8 6 13 N/A 10
Source: National Survey on Drug Use and Health, Substance Abuse and Mental Health Services Administration.
6.2. Tobacco/Cigarettes
2011-2012 2012-2013 2013-2014 2014-2015 2015-2016
Tennessee 43.0% 40.4% 41.9% 39.8% 36.4%
United States 38.8% 37.6% 36.0% 34.0% 31.5%
Range 25.1-54.1% 25.9-48.9% 23.6-50.6% 19.6-50.8% 21.3-44.3%
Tennessee Rank 29 24 39 34 36
Source: National Survey on Drug Use and Health, Substance Abuse and Mental Health Services Administration.
2011-2012 2012-2013 2013-2014 2014-2015 2015-2016
Tennessee 34.8% 33.0% 32.7% 30.3% 29.3%
United States 32.6% 31.2% 29.5% 27.5% 25.1%
Range 23.2-45.2% 23.6-40.1% 20.8-40.4% 17.0-40.1% 18.6-35.8%
Tennessee Rank 24 22 33 31 38
Source: National Survey on Drug Use and Health, Substance Abuse and Mental Health Services Administration.
2011-2012 2012-2013 2013-2014 2014-2015 2015-2016
Tennessee 63.1% 63.7% 63.2% N/A 64.5%
United States 66.3% 66.3% 66.4% N/A 68.3%
Range 57.9-72.9% 56.6-72.6% 57.1-71.2% N/A 60.1-74.4%
Tennessee Rank 31 28 32 N/A 36
Source: National Survey on Drug Use and Health, Substance Abuse and Mental Health Services Administration.
Middle 60%
6.2.3. Young adults who have perceptions of great risk from smoking one or more packs of cigarettes per day.
6.2.1. Young adults who used tobacco products in the past month.
Top 20%
6.1.5. Young adults needing but not receiving substance abuse treatment for alcohol use in the past year.
6.2.2. Young adults who used cigarettes in the past month.
Bottom 20%
X. Deng
R. Jones
Behavioral Health Indicators for Tennessee and the United States
2018 Data Book 29

6.3. Illicit drugs
2011-2012 2012-2013 2013-2014 2014-2015 2015-2016
Tennessee 18.0% 17.7% 16.9% N/A 21.3%
United States 21.4% 21.4% 21.8% N/A 22.8%
Range 13.1-33.3% 13.8-31.9% 14.1-33.8% N/A 15.0-40.0%
Tennessee Rank 13 14 6 N/A 23
Source: National Survey on Drug Use and Health, Substance Abuse and Mental Health Services Administration.
2011-2012 2012-2013 2013-2014 2014-2015 2015-2016
Tennessee 8.2% 6.9% 6.4% N/A 8.0%
United States 7.0% 6.9% 6.6% N/A 7.3%
Range 4.8-9.7% 5.0-10.0% 4.6-11.4% N/A 5.4-13.9%
Tennessee Rank 42 28 22 N/A 37
Source: National Survey on Drug Use and Health, Substance Abuse and Mental Health Services Administration.
2011-2012 2012-2013 2013-2014 2014-2015 2015-2016
Tennessee 8.6% 7.0% 5.9% N/A 7.3%
United States 7.7% 7.6% 7.0% N/A 7.1%
Range 5.8-10.6% 5.7-9.6% 5.4-9.5% N/A 4.9-11.0%
Tennessee Rank 42 18 5 N/A 28
Source: National Survey on Drug Use and Health, Substance Abuse and Mental Health Services Administration.
2011-2012 2012-2013 2013-2014 2014-2015 2015-2016
Tennessee 7.5% 6.6% 5.8% N/A 6.8%
United States 7.0% 7.0% 6.4% N/A 6.6%
Range 5.0-9.3% 5.2-8.6% 5.3-8.1% N/A 4.8-9.7%
Tennessee Rank 37 19 11 N/A 31
Source: National Survey on Drug Use and Health, Substance Abuse and Mental Health Services Administration.
Top 20%Middle 60%
Bottom 20%
6.3.2. Young adults who had illicit drug use other than marijuana in the past month.
6.3.3. Young adults who had an illicit drug use disorder in the past year.
6.3.1. Young adults who used illicit drugs in the past month.
6.3.4. Young adults needing but not receiving substance abuse treatment for illicit drugs.
Note: Illicit drugs include marijuana/hashish, cocaine (including crack), heroin, hallucinogens, inhalants, or any prescription-type psychotherapeutic
used non-medically.
X. Deng
R. Jones
Behavioral Health Indicators for Tennessee and the United States
2018 Data Book 30

6.4. Marijuana
2011-2012 2012-2013 2013-2014 2014-2015 2015-2016
Tennessee 5.9% 5.9% 6.0% 6.7% 6.5%
United States 7.6% 7.5% 7.7% 7.9% 7.7%
Range 4.2-11.6% 4.1-13.2% 4.7-12.9% 4.9-13.0% 5.5-16.0%
Tennessee Rank 6 4 3 9 9
Source: National Survey on Drug Use and Health, Substance Abuse and Mental Health Services Administration.
Note: First use of marijuana: average annual incidence estimates (Expressed as Percentages of the At-Risk Population).
2011-2012 2012-2013 2013-2014 2014-2015 2015-2016
Tennessee 14.7% 15.0% 14.7% 16.0% 18.3%
United States 18.9% 18.9% 19.3% 19.7% 20.3%
Range 9.8-33.2% 10.9-29.8% 11.6-31.2% 11.1-35.0% 12.1-38.2%Tennessee Rank 11 13 6 11 23
Source: National Survey on Drug Use and Health, Substance Abuse and Mental Health Services Administration.
2011-2012 2012-2013 2013-2014 2014-2015 2015-2016
Tennessee 24.8% 26.2% 25.5% 27.0% 29.5%
United States 31.1% 31.6% 31.8% 32.1% 32.6%
Range 18.7-47.0% 20.5-46.8% 22.7-46.3% 21.4-48.3% 21.8-48.1%
Tennessee Rank 7 10 5 7 20
Source: National Survey on Drug Use and Health, Substance Abuse and Mental Health Services Administration.
2011-2012 2012-2013 2013-2014 2014-2015 2015-2016
Tennessee 19.2% 18.7% 15.5% N/A 16.5%
United States 17.4% 15.8% 14.2% N/A 14.3%
Range 9.5-26.4% 7.9-24.4% 6.0-22.8% N/A 7.7-23.5%
Tennessee Rank 12 8 13 N/A 9
Source: National Survey on Drug Use and Health, Substance Abuse and Mental Health Services Administration.
6.4.1. Youth first use of marijuana.
Top 20%Middle 60%
Bottom 20%
6.4.3. Youth who used marijuana in the past year.
6.4.4. Youth who have perceptions of a great risk of smoking marijuana once a month.
6.4.2. Young adults who used marijuana in the past month.
X. Deng
R. Jones
Behavioral Health Indicators for Tennessee and the United States
2018 Data Book 31

2011-2012 2012-2013 2013-2014 2014-2015 2015-2016
Tennessee 12.1% 9.5% 8.3% N/A 9.4%
United States 10.0% 9.5% 8.3% N/A 7.8%
Range 8.0-13.8% 7.6-12.2% 7.0-11.0% N/A 6.4-10.3%
Tennessee Rank 45 26 23 N/A 43
Source: National Survey on Drug Use and Health, Substance Abuse and Mental Health Services Administration.
2011-2012 2012-2013 2013-2014 2014-2015 2015-2016
Tennessee N/A N/A N/A N/A 1.4%
United States N/A N/A N/A N/A 1.0%
Range N/A N/A N/A N/A 0.8-1.8%
Tennessee Rank N/A N/A N/A N/A 44
Source: National Survey on Drug Use and Health, Substance Abuse and Mental Health Services Administration.
6.6. Heroin
2011-2012 2012-2013 2013-2014 2014-2015 2015-2016
Tennessee N/A N/A N/A 0.6% 0.6%
United States N/A N/A N/A 0.7% 0.6%
Range N/A N/A N/A 0.3-1.9% 0.4-1.9%
Tennessee Rank N/A N/A N/A 21 14
Source: National Survey on Drug Use and Health, Substance Abuse and Mental Health Services Administration.
6.6.1. Young adults who used heroin in the past year.
6.5.2. Young adults who had pain reliever use disorder in the past year.
Top 20%Middle 60%
Bottom 20%
Note: Nonmedical pain relievers include (1) Darvocet-N®, Darvon®, or Tylenol® with codeine; (2) Percocet®, Percodan®, or Tylox®; and (3) Vicodin®,
Lortab®, or Lorcet®/Lorcet Plus®. Additional drugs were (4) codeine; (5) Demerol®; (6) Dilaudid®; (7) Fioricet®; (8) Fiorinal®; (9) hydrocodone; (10)
methadone; (11) morphine; (12) OxyContin®; (13) Phenaphen® with codeine; (14) propoxyphene; (15) SK-65®; (16) Stadol®; (17) Talacen®; (18) Talwin®;
(19) Talwin® NX; (20) tramadol; and (21) Ultram®.
6.5.1. Young adults who used pain relievers for nonmedical use in the past year.
6.5. Nonmedical use of pain relievers
Note: Nonmedical pain relievers include (1) Darvocet-N®, Darvon®, or Tylenol® with codeine; (2) Percocet®, Percodan®, or Tylox®; and (3) Vicodin®,
Lortab®, or Lorcet®/Lorcet Plus®. Additional drugs were (4) codeine; (5) Demerol®; (6) Dilaudid®; (7) Fioricet®; (8) Fiorinal®; (9) hydrocodone; (10)
methadone; (11) morphine; (12) OxyContin®; (13) Phenaphen® with codeine; (14) propoxyphene; (15) SK-65®; (16) Stadol®; (17) Talacen®; (18) Talwin®;
(19) Talwin® NX; (20) tramadol; and (21) Ultram®.
X. Deng
R. Jones
Behavioral Health Indicators for Tennessee and the United States
2018 Data Book 32

2011-2012 2012-2013 2013-2014 2014-2015 2015-2016
Tennessee N/A N/A N/A N/A 83.7%
United States N/A N/A N/A N/A 82.8%
Range N/A N/A N/A N/A 77.0-85.8%Tennessee Rank N/A N/A N/A N/A 14
Source: National Survey on Drug Use and Health, Substance Abuse and Mental Health Services Administration.
6.7. Cocaine
2011-2012 2012-2013 2013-2014 2014-2015 2015-2016
Tennessee 3.5% 3.2% 3.3% 4.2% 4.7%
United States 4.6% 4.5% 4.5% 5.0% 5.5%
Range 2.4-8.8% 2.6-8.1% 1.9-8.5% 1.8-10.5% 2.7-10.8%
Tennessee Rank 14 8 13 22 19
Source: National Survey on Drug Use and Health, Substance Abuse and Mental Health Services Administration.
2011-2012 2012-2013 2013-2014 2014-2015 2015-2016
Tennessee N/A N/A N/A N/A 69.2%
United States N/A N/A N/A N/A 65.1%
Range N/A N/A N/A N/A 51.8-75.4%
Tennessee Rank N/A N/A N/A N/A 7
Source: National Survey on Drug Use and Health, Substance Abuse and Mental Health Services Administration.
6.8. Substance use
2011-2012 2012-2013 2013-2014 2014-2015 2015-2016
Tennessee 17.3% 16.1% 14.7% N/A 13.8%
United States 18.7% 18.1% 16.8% N/A 15.2%
Range 14.5-23.4% 14.7-23.7% 14.1-21.2% N/A 11.8-21.9%
Tennessee Rank 11 5 6 N/A 9
Source: National Survey on Drug Use and Health, Substance Abuse and Mental Health Services Administration.
Middle 60%
6.7.1. Young adults who used cocaine in the past year.
Bottom 20%
Top 20%
6.7.2. Young adults who have perceptions of great risk from using cocaine once a month.
6.8.1. Young adults who had substance use disorder in the past year.
6.6.2. Young adults who have perceptions of great risk from trying heroin once or twice.
X. Deng
R. Jones
Behavioral Health Indicators for Tennessee and the United States
2018 Data Book 33

2011-2012 2012-2013 2013-2014 2014-2015 2015-2016
Tennessee N/A N/A N/A N/A 12.9%
United States N/A N/A N/A N/A 14.3%
Range N/A N/A N/A N/A 11.5-20.7%Tennessee Rank N/A N/A N/A N/A 5
Source: National Survey on Drug Use and Health, Substance Abuse and Mental Health Services Administration.
Middle 60%
Bottom 20%
6.8.2. Young adults needing but not receiving treatment at a speciality facility for substance use in the past year.
Top 20%
X. Deng
R. Jones
Behavioral Health Indicators for Tennessee and the United States
2018 Data Book 34

7.1. Alcohol
2011-2012 2012-2013 2013-2014 2014-2015 2015-2016
Tennessee 42.2% 41.6% 46.4% 47.0% 46.4%
United States 56.1% 56.3% 56.7% 56.5% 55.5%
Range 32.7-68.2 34.6-70.1% 35.5-69.1% 35.0-68.4% 33.3-68.3%
Tennessee Rank 3 3 6 6 8
Source: National Survey on Drug Use and Health, Substance Abuse and Mental Health Services Administration.
2011-2012 2012-2013 2013-2014 2014-2015 2015-2016
Tennessee 19.2% 18.0% 19.3% N/A 22.0%
United States 24.5% 24.6% 24.7% N/A 26.5%
Range 17.3-32.5% 17.7-32.6% 17.4-32.2% N/A 18.3-34.2%
Tennessee Rank 2 2 2 N/A 4
Source: National Survey on Drug Use and Health, Substance Abuse and Mental Health Services Administration.
2011-2012 2012-2013 2013-2014 2014-2015 2015-2016
Tennessee 6.1% 5.8% 5.7% 5.6% 5.4%
United States 7.0% 7.1% 6.9% 6.5% 6.1%
Range 5.0-9.4% 5.7-9.0% 5.5-8.2% 4.9-8.0% 4.4-8.0%
Tennessee Rank 9 2 2 5 10
Source: National Survey on Drug Use and Health, Substance Abuse and Mental Health Services Administration.
2011-2012 2012-2013 2013-2014 2014-2015 2015-2016
Tennessee 43.1% 46.7% 45.2% N/A 46.9%
United States 42.5% 42.1% 41.0% N/A 44.4%
Range 35.1-46.9% 33.9-46.8% 34.2-47.4% N/A 34.4-49.4%
Tennessee Rank 15 2 4 N/A 10
Source: National Survey on Drug Use and Health, Substance Abuse and Mental Health Services Administration.
7. Substance use indicators for adults (18+)
7.1.1. Adults who used alcohol in the past month.
7.1.3. Adults who had alcohol use disorder in the past year.
Note: Alcohol Use Disorder is defined as meeting criteria for alcohol dependence or abuse. Dependence or abuse is based on definitions found in the
4th edition of the Diagnostic and Statistical Manual of Mental Disorders.
7.1.2. Adults who had binge alcohol use in the past month.
7.1.4. Adults who have perceptions of a great risk of having five or more drinks of an alcohol beverage once or twice per week.
Middle 60%
Bottom 20%
Top 20%
X. Deng
R. Jones
Behavioral Health Indicators for Tennessee and the United States
2018 Data Book 35

2011-2012 2012-2013 2013-2014 2014-2015 2015-2016
Tennessee 6.0% 5.7% 5.6% N/A 5.0%
United States 6.6% 6.8% 6.6% N/A 5.8%
Range 4.6-8.9% 5.4-8.4% 5.4-7.8% N/A 4.3-7.5%Tennessee Rank 10 4 3 N/A 8
Source: National Survey on Drug Use and Health, Substance Abuse and Mental Health Services Administration.
7.2. Tobacco/Cigarettes
2011-2012 2012-2013 2013-2014 2014-2015 2015-2016
Tennessee 35.0% 33.3% 31.4% 30.8% 32.7%
United States 28.5% 28.0% 27.2% 26.4% 25.6%
Range 20.7-40.9% 20.5-40.0% 19.5-39.4% 17.1-39.6% 17.2-40.6%
Tennessee Rank 43 39 37 37 44
Source: National Survey on Drug Use and Health, Substance Abuse and Mental Health Services Administration.
2011-2012 2012-2013 2013-2014 2014-2015 2015-2016
Tennessee 29.2% 27.1% 24.5% 24.5% 26.8%
United States 23.7% 23.3% 22.7% 21.7% 20.8%
Range 17.5-34.6% 17.6-33.2% 16.5-32.6% 14.9-31.7% 14.9-31.2%
Tennessee Rank 43 37 32 36 45
Source: National Survey on Drug Use and Health, Substance Abuse and Mental Health Services Administration
2011-2012 2012-2013 2013-2014 2014-2015 2015-2016
Tennessee 66.3% 68.2% 67.4% N/A 69.7%
United States 72.0% 71.9% 71.7% N/A 73.2%
Range 63.6-77.7% 62.9-77.4% 62.7-77.1 N/A 64.7-79.0%
Tennessee Rank 47 35 39 N/A 36
Source: National Survey on Drug Use and Health, Substance Abuse and Mental Health Services Administration
Middle 60%
Bottom 20%
7.1.5. Adults needing but not receiving substance abuse treatment for alcohol in the past year.
7.2.1. Adults who used tobacco products in the past month.
7.2.2. Adults who used cigarettes in the past month.
7.2.3. Adults who have perceptions of great risk from smoking one or more packs of cigarettes per day.
Top 20%
X. Deng
R. Jones
Behavioral Health Indicators for Tennessee and the United States
2018 Data Book 36
7.3. Illicit drugs
2011-2012 2012-2013 2013-2014 2014-2015 2015-2016
Tennessee 7.0% 7.1% 7.2% N/A 9.5%
United States 8.9% 9.3% 9.8% N/A 10.6%
Range 5.2-15.7% 6.0-15.8% 5.8-17.1% N/A 6.8-18.8%
Tennessee Rank 11 9 5 N/A 23
Source: National Survey on Drug Use and Health, Substance Abuse and Mental Health Services Administration.
2011-2012 2012-2013 2013-2014 2014-2015 2015-2016
Tennessee 3.3% 3.1% 2.8% N/A 3.7%
United States 3.2% 3.4% 3.3% N/A 3.5%
Range 2.4-4.8% 2.2-4.3% 2.1-4.3% N/A 2.8-4.9%
Tennessee Rank 28 23 10 N/A 37
Source: National Survey on Drug Use and Health, Substance Abuse and Mental Health Services Administration.
2011-2012 2012-2013 2013-2014 2014-2015 2015-2016
Tennessee 2.8% 2.4% 2.2% N/A 2.8%
United States 2.5% 2.6% 2.6% N/A 2.8%
Range 1.8-3.1% 2.2-3.6% 2.0-3.4% N/A 2.2-4.3%
Tennessee Rank 45 14 6 N/A 26
Source: National Survey on Drug Use and Health, Substance Abuse and Mental Health Services Administration.
2011-2012 2012-2013 2013-2014 2014-2015 2015-2016
Tennessee 2.3% 2.2% 2.0% N/A 2.4%
United States 2.2% 2.3% 2.3% N/A 2.5%
Range 1.7-2.7% 1.8-2.9% 1.8-2.8% N/A 1.8-3.6%
Tennessee Rank 35 17 12 N/A 28
Source: National Survey on Drug Use and Health, Substance Abuse and Mental Health Services Administration.
Top 20%Middle 60%
Bottom 20%
7.3.4. Adults needing but not receiving substance abuse treatment for illicit drugs in the past year.
7.3.1. Adults who used illicit drugs in the past month.
7.3.2. Adults who used illicit drugs other than marijuana in the past month.
7.3.3. Adults who had illicit drug use disorder in the past year.
Note: Illicit drugs include marijuana/hashish, cocaine (including crack), heroin, hallucinogens, inhalants, or any prescription-type psychotherapeutic
used non-medically.
X. Deng
R. Jones
Behavioral Health Indicators for Tennessee and the United States
2018 Data Book 37

7.4. Marijuana
2011-2012 2012-2013 2013-2014 2014-2015 2015-2016
Tennessee 0.9% 0.9% 1.0% 1.1% 1.1%
United States 1.2% 1.2% 1.3% 1.4% 1.4%
Range 09-1.9 0.9-2.0% 0.9-2.0% 1.0-2.5% 1.0-3.0%
Tennessee Rank 3 4 4 5 3
Source: National Survey on Drug Use and Health, Substance Abuse and Mental Health Services Administration.
Note: First use of marijuana: average annual incidence estimates (Expressed as Percentages of the At-Risk Population).
2011-2012 2012-2013 2013-2014 2014-2015 2015-2016
Tennessee 5.4% 5.4% 5.5% 6.4% 8.0%
United States 7.1% 7.4% 8.0% 8.5% 8.8%
Range 3.9-13.3% 4.3-14.2% 4.8-15.2% 4.7-17.1% 5.3-17.6%Tennessee Rank 10 11 3 10 26
Source: National Survey on Drug Use and Health, Substance Abuse and Mental Health Services Administration.
2011-2012 2012-2013 2013-2014 2014-2015 2015-2016
Tennessee 8.7% 9.7% 10.2% 11.0% 12.9%
United States 11.6% 12.2% 12.9% 13.4% 13.9%
Range 7.4-19.6% 8.0-20.2% 8.9-20.7% 8.6-23.6% 9.4-23.8%
Tennessee Rank 3 11 7 11 25
Source: National Survey on Drug Use and Health, Substance Abuse and Mental Health Services Administration.
2011-2012 2012-2013 2013-2014 2014-2015 2015-2016
Tennessee 8.7% 36.6% 29.5% N/A 30.3%
United States 11.6% 29.9% 27.8% N/A 28.5%
Range 7.4-19.6% 18.7-40.0% 15.0-38.7% N/A 17.4-38.5%Tennessee Rank 3 4 13 N/A 12
Source: National Survey on Drug Use and Health, Substance Abuse and Mental Health Services Administration.
7.4.1. Adults first use of marijuana.
Top 20%Middle 60%
Bottom 20%
7.4.2. Adults who used marijuana in the past month.
7.4.4. Adults who have perceptions of a great risk of smoking marijuana once a month.
7.4.3. Adults who used marijuana in the past year.
X. Deng
R. Jones
Behavioral Health Indicators for Tennessee and the United States
2018 Data Book 38

7.5. Nonmedical use of pain relievers
2011-2012 2012-2013 2013-2014 2014-2015 2015-2016
Tennessee 4.9% 4.4% 3.9% N/A 4.8%
United States 4.5% 4.5% 4.0% N/A 4.5%
Range 3.6-5.6% 3.5-5.7% 3.1-4.9% N/A 3.9-5.6%
Tennessee Rank 38 25 22 N/A 34
Source: National Survey on Drug Use and Health, Substance Abuse and Mental Health Services Administration
2011-2012 2012-2013 2013-2014 2014-2015 2015-2016
Tennessee N/A N/A N/A N/A 0.9%
United States N/A N/A N/A N/A 0.7%
Range N/A N/A N/A N/A 0.5-1.0%
Tennessee Rank N/A N/A N/A N/A 45
Source: National Survey on Drug Use and Health, Substance Abuse and Mental Health Services Administration
7.6. Heroin
2011-2012 2012-2013 2013-2014 2014-2015 2015-2016
Tennessee N/A N/A N/A 0.3% 0.3%
United States N/A N/A N/A 0.4% 0.4%
Range N/A N/A N/A 0.1-1.4% 0.2-0.9%
Tennessee Rank N/A N/A N/A 20 13
Source: National Survey on Drug Use and Health, Substance Abuse and Mental Health Services Administration
2011-2012 2012-2013 2013-2014 2014-2015 2015-2016
Tennessee N/A N/A N/A N/A 88.2%
United States N/A N/A N/A N/A 87.5%
Range N/A N/A N/A N/A 82.4-90.5%
Tennessee Rank N/A N/A N/A N/A 15
Source: National Survey on Drug Use and Health, Substance Abuse and Mental Health Services Administration
Top 20%Middle 60%
Bottom 20%
7.5.2. Adults who had pain reliever use disorder in the past year.
7.6.2. Adults who have perceptions of great risk from trying heroin once or twice.
7.5.1. Adults who used pain relievers for nonmedical use in the past year.
Note: Nonmedical pain relievers include (1) Darvocet-N®, Darvon®, or Tylenol® with codeine; (2) Percocet®, Percodan®, or Tylox®; and (3) Vicodin®,
Lortab®, or Lorcet®/Lorcet Plus®. Additional drugs were (4) codeine; (5) Demerol®; (6) Dilaudid®; (7) Fioricet®; (8) Fiorinal®; (9) hydrocodone; (10)
methadone; (11) morphine; (12) OxyContin®; (13) Phenaphen® with codeine; (14) propoxyphene; (15) SK-65®; (16) Stadol®; (17) Talacen®; (18) Talwin®;
(19) Talwin® NX; (20) tramadol; and (21) Ultram®.
7.6.1. Adults who used heroin in the past year.
X. Deng
R. Jones
Behavioral Health Indicators for Tennessee and the United States
2018 Data Book 39

7.7. Cocaine
2011-2012 2012-2013 2013-2014 2014-2015 2015-2016
Tennessee 1.5% 1.4% 1.2% 1.6% 1.8%
United States 1.7% 1.8% 1.8% 1.9% 2.0%
Range 1.0-2.8% 1.1-2.9% 1.0-2.7% 0.9-3.3% 1.3-3.2%
Tennessee Rank 20 11 7 23 23
Source: National Survey on Drug Use and Health, Substance Abuse and Mental Health Services Administration
2011-2012 2012-2013 2013-2014 2014-2015 2015-2016
Tennessee N/A N/A N/A N/A 78.0%
United States N/A N/A N/A N/A 73.4%
Range N/A N/A N/A N/A 64.3-82.0%
Tennessee Rank N/A N/A N/A N/A 6
Source: National Survey on Drug Use and Health, Substance Abuse and Mental Health Services Administration
7.8. Substance use
2011-2012 2012-2013 2013-2014 2014-2015 2015-2016
Tennessee 8.0% 7.6% 7.2% N/A 7.1%
United States 8.5% 8.7% 8.5% N/A 7.9%
Range 6.6-10.9% 7.4-11.2% 7.2-10.4% N/A 6.3-10.3%
Tennessee Rank 13 3 1 N/A 11
Source: National Survey on Drug Use and Health, Substance Abuse and Mental Health Services Administration
2011-2012 2012-2013 2013-2014 2014-2015 2015-2016
Tennessee N/A N/A N/A N/A 6.4%
United States N/A N/A N/A N/A 7.4%
Range N/A N/A N/A N/A 5.9-9.6%
Tennessee Rank N/A N/A N/A N/A 23
Source: National Survey on Drug Use and Health, Substance Abuse and Mental Health Services Administration
Bottom 20%
Top 20%Middle 60%
7.7.1. Adults who used cocaine in the past year.
7.7.2. Adults who have perceptions of great risk from using cocaine once a month.
7.8.1. Adults who had substance use disorder in the past year.
7.8.2. Adults needing but not receiving treatment at a speciality facility for substance use in the past year.
X. Deng
R. Jones
Behavioral Health Indicators for Tennessee and the United States
2018 Data Book 40

8.1. Alcohol
2011-2012 2012-2013 2013-2014 2014-2015 2015-2016
Tennessee 40.9% 40.5% 45.3% 46.4% 45.8%
United States 55.3% 55.7% 56.2% 56.0% 55.1%
Range 32.5-67.8% 34.6-69.6% 35.2-68.8% 35.0-68.3% 32.4-68.2%
Tennessee Rank 3 3 6 6 8
Source: National Survey on Drug Use and Health, Substance Abuse and Mental Health Services Administration.
2011-2012 2012-2013 2013-2014 2014-2015 2015-2016
Tennessee 17.2% 16.1% 17.3% N/A 20.5%
United States 21.8% 22.2% 22.4% N/A 24.5%
Range 15.7-28.0% 15.8-29.9% 15.5-29.2% N/A 16.2-30.7%Tennessee Rank 3 2 2 N/A 5
Source: National Survey on Drug Use and Health, Substance Abuse and Mental Health Services Administration.
2011-2012 2012-2013 2013-2014 2014-2015 2015-2016
Tennessee 5.0% 4.9% 4.7% 4.8% 4.6%
United States 5.7% 5.9% 5.9% 5.6% 5.3%
Range 3.8-8.0% 4.4-7.3% 4.6-7.2% 4.1-7.2% 3.6-7.1%
Tennessee Rank 10 3 3 5 11
Source: National Survey on Drug Use and Health, Substance Abuse and Mental Health Services Administration.
2011-2012 2012-2013 2013-2014 2014-2015 2015-2016
Tennessee 44.0% 48.0% 47.2% N/A 48.3%
United States 43.8% 43.5% 42.3% N/A 45.7%
Range 36.4-48.6% 35.6-48.4% 35.2-48.4% N/A 35.3-50.7%
Tennessee Rank 18 2 2 N/A 9
Source: National Survey on Drug Use and Health, Substance Abuse and Mental Health Services Administration.
8. Substance use indicators for adults (26+)
8.1.1. Adults who used alcohol in the past month.
8.1.3. Adults who had alcohol use disorder in the past year.
Middle 60%
Bottom 20%
Top 20%
Note: Alcohol Use Disorder is defined as meeting criteria for alcohol dependence or abuse. Dependence or abuse is based on definitions found in the
4th edition of the Diagnostic and Statistical Manual of Mental Disorders.
8.1.2. Adults who had binge alcohol use in the past month.
8.1.4. Adults who have perceptions of a great risk of having five or more drinks of an alcoholic beverage once or twice per week.
X. Deng
R. Jones
Behavioral Health Indicators for Tennessee and the United States
2018 Data Book 41

2011-2012 2012-2013 2013-2014 2014-2015 2015-2016
Tennessee 4.9% 4.7% 4.7% N/A 4.2%
United States 5.4% 5.6% 5.6% N/A 5.1%
Range 3.6-7.8% 4.3-6.8% 4.6-6.5% N/A 3.5-6.7%Tennessee Rank 14 3 3 N/A 10
Source: National Survey on Drug Use and Health, Substance Abuse and Mental Health Services Administration.
8.2. Tobacco/ Cigarettes
2011-2012 2012-2013 2013-2014 2014-2015 2015-2016
Tennessee 33.7% 32.1% 29.7% 29.3% 32.1%
United States 26.7% 26.3% 25.7% 25.1% 24.6%
Range 18.9-38.8% 18.9-38.7% 18.4-37.7% 16.5-37.9% 16.2-40.0%
Tennessee Rank 44 39 39 37 44
Source: National Survey on Drug Use and Health, Substance Abuse and Mental Health Services Administration
2011-2012 2012-2013 2013-2014 2014-2015 2015-2016
Tennessee 28.2% 26.1% 23.1% 23.6% 26.4%
United States 22.1% 22.0% 21.5% 20.7% 20.1%
Range 15.8-32.8% 16.1-32.1% 15.1-31.4% 14.4-30.4% 14.1-31.1%
Tennessee Rank 44 38 31 36 45
Source: National Survey on Drug Use and Health, Substance Abuse and Mental Health Services Administration
2011-2012 2012-2013 2013-2014 2014-2015 2015-2016
Tennessee 66.9% 69.0% 68.1% N/A 70.6%
United States 73.0% 72.9% 72.6% N/A 74.0%
Range 64.6-78.9% 63.8-78.2% 63.6-78.2% N/A 65.5-79.8%
Tennessee Rank 47 37 40 N/A 35
Source: National Survey on Drug Use and Health, Substance Abuse and Mental Health Services Administration
8.1.5. Adults needing but not receiving substance abuse treatment for alcohol in the past year.
8.2.1. Adults who used tobacco in the past month.
8.2.2. Adults who used cigarettes in the past month.
8.2.3. Adults who have perceptions of great risk from smoking one or more packs of cigarettes per day.
Top 20%Middle 60%
Bottom 20%
X. Deng
R. Jones
Behavioral Health Indicators for Tennessee and the United States
2018 Data Book 42

8.3. Illicit drugs
2011-2012 2012-2013 2013-2014 2014-2015 2015-2016
Tennessee 5.2% 5.3% 5.6% N/A 7.5%
United States 6.7% 7.2% 7.8% N/A 8.5%
Range 3.7-12.3% 4.4-12.7% 4.3-14.2% N/A 5.0-16.0%
Tennessee Rank 12 11 6 N/A 21
Source: National Survey on Drug Use and Health, Substance Abuse and Mental Health Services Administration.
2011-2012 2012-2013 2013-2014 2014-2015 2015-2016
Tennessee 2.5% 2.5% 2.2% N/A 3.0%
United States 2.5% 2.8% 2.7% N/A 2.9%
Range 1.7-3.8% 1.7-3.6% 1.6-3.7% N/A 2.2-3.4%
Tennessee Rank 27 24 7 N/A 34
Source: National Survey on Drug Use and Health, Substance Abuse and Mental Health Services Administration.
2011-2012 2012-2013 2013-2014 2014-2015 2015-2016
Tennessee 1.8% 1.7% 1.6% N/A 2.0%
United States 1.6% 1.7% 1.8% N/A 2.0%
Range 1.0-2.0% 1.3-2.6% 1.3-2.5% N/A 1.5-3.4%
Tennessee Rank 34 18 12 N/A 23
Source: National Survey on Drug Use and Health, Substance Abuse and Mental Health Services Administration.
2011-2012 2012-2013 2013-2014 2014-2015 2015-2016
Tennessee 1.5% 1.5% 1.4% N/A 1.7%
United States 1.4% 1.5% 1.6% N/A 1.8%
Range 0.9-1.8% 1.1-2.0% 1.2-2.0% N/A 1.2-2.7%
Tennessee Rank 37 24 15 N/A 23
Source: National Survey on Drug Use and Health, Substance Abuse and Mental Health Services Administration.
Bottom 20%
8.3.4. Adults needing but not receiving substance abuse treatment for illicit drugs in the past year.
8.3.1. Adults who used illicit drugs in the past month.
Note: Illicit drugs include marijuana/hashish, cocaine (including crack), heroin, hallucinogens, inhalants, or any prescription-type psychotherapeutic
used non-medically.
Top 20%Middle 60%
8.3.2. Adults who used illicit drugs other than marijuana in the past month.
8.3.3. Adults who had illicit drug use disorder in the past year.
X. Deng
R. Jones
Behavioral Health Indicators for Tennessee and the United States
2018 Data Book 43
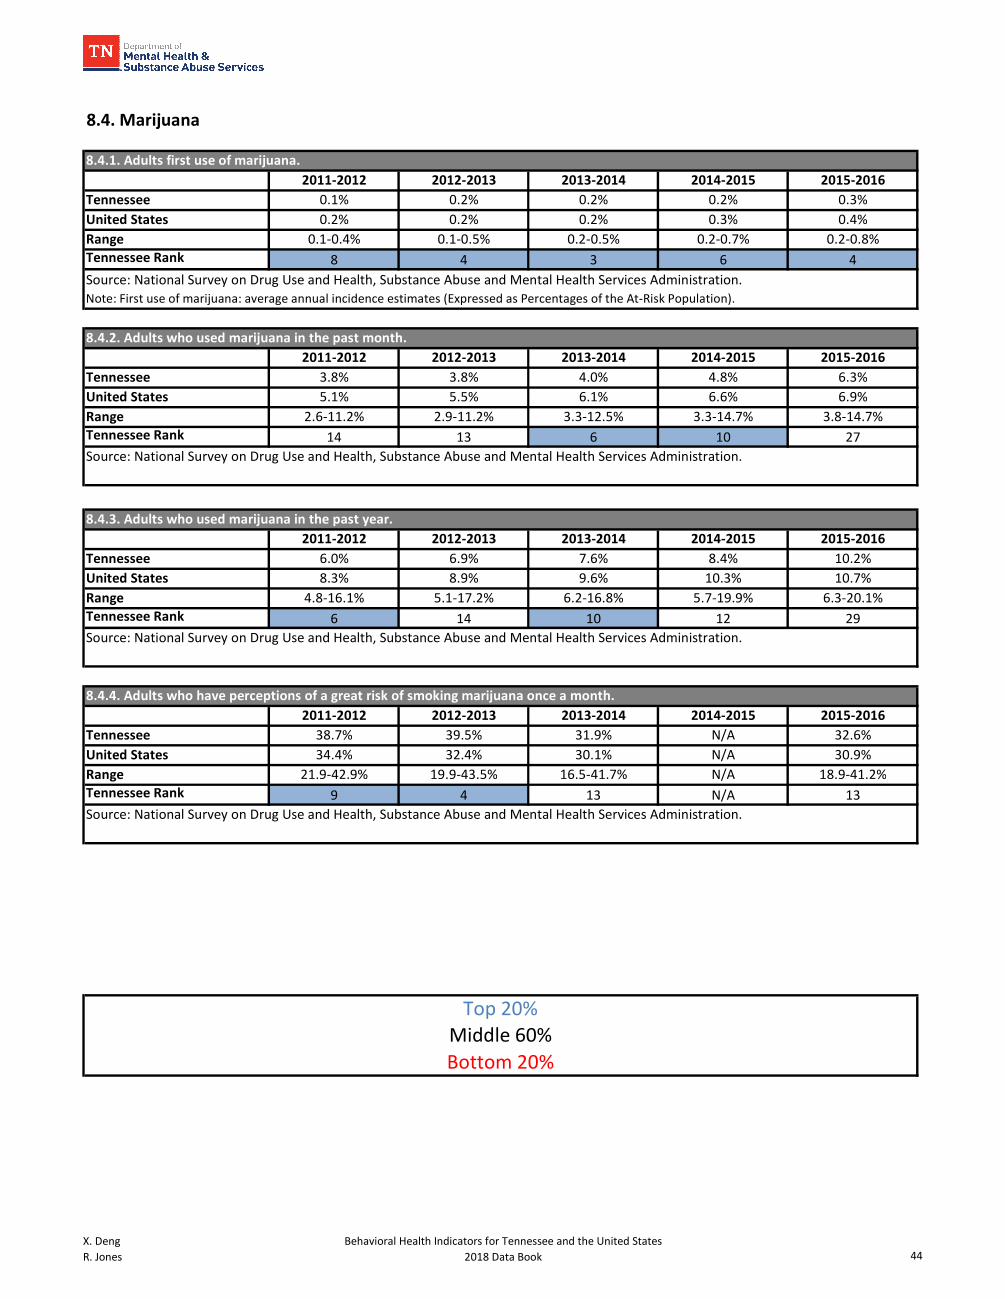
8.4. Marijuana
2011-2012 2012-2013 2013-2014 2014-2015 2015-2016
Tennessee 0.1% 0.2% 0.2% 0.2% 0.3%
United States 0.2% 0.2% 0.2% 0.3% 0.4%
Range 0.1-0.4% 0.1-0.5% 0.2-0.5% 0.2-0.7% 0.2-0.8%
Tennessee Rank 8 4 3 6 4
Source: National Survey on Drug Use and Health, Substance Abuse and Mental Health Services Administration.
Note: First use of marijuana: average annual incidence estimates (Expressed as Percentages of the At-Risk Population).
2011-2012 2012-2013 2013-2014 2014-2015 2015-2016
Tennessee 3.8% 3.8% 4.0% 4.8% 6.3%
United States 5.1% 5.5% 6.1% 6.6% 6.9%
Range 2.6-11.2% 2.9-11.2% 3.3-12.5% 3.3-14.7% 3.8-14.7%
Tennessee Rank 14 13 6 10 27
Source: National Survey on Drug Use and Health, Substance Abuse and Mental Health Services Administration.
2011-2012 2012-2013 2013-2014 2014-2015 2015-2016
Tennessee 6.0% 6.9% 7.6% 8.4% 10.2%
United States 8.3% 8.9% 9.6% 10.3% 10.7%
Range 4.8-16.1% 5.1-17.2% 6.2-16.8% 5.7-19.9% 6.3-20.1%
Tennessee Rank 6 14 10 12 29
Source: National Survey on Drug Use and Health, Substance Abuse and Mental Health Services Administration.
2011-2012 2012-2013 2013-2014 2014-2015 2015-2016
Tennessee 38.7% 39.5% 31.9% N/A 32.6%
United States 34.4% 32.4% 30.1% N/A 30.9%
Range 21.9-42.9% 19.9-43.5% 16.5-41.7% N/A 18.9-41.2%
Tennessee Rank 9 4 13 N/A 13
Source: National Survey on Drug Use and Health, Substance Abuse and Mental Health Services Administration.
Top 20%Middle 60%
Bottom 20%
8.4.3. Adults who used marijuana in the past year.
8.4.1. Adults first use of marijuana.
8.4.4. Adults who have perceptions of a great risk of smoking marijuana once a month.
8.4.2. Adults who used marijuana in the past month.
X. Deng
R. Jones
Behavioral Health Indicators for Tennessee and the United States
2018 Data Book 44

8.5. Nonmedical use of pain relievers
2011-2012 2012-2013 2013-2014 2014-2015 2015-2016
Tennessee 3.8% 3.5% 3.1% N/A 4.1%
United States 3.5% 3.6% 3.3% N/A 4.0%
Range 2.6-4.3% 2.7-4.7% 2.5-4.1% N/A 3.4-5.2%
Tennessee Rank 35 26 23 N/A 27
Source: National Survey on Drug Use and Health, Substance Abuse and Mental Health Services Administration
2011-2012 2012-2013 2013-2014 2014-2015 2015-2016
Tennessee N/A N/A N/A N/A 0.8%
United States N/A N/A N/A N/A 0.7%
Range N/A N/A N/A N/A 0.5-0.9%
Tennessee Rank N/A N/A N/A N/A 46
Source: National Survey on Drug Use and Health, Substance Abuse and Mental Health Services Administration
8.6. Heroin
2011-2012 2012-2013 2013-2014 2014-2015 2015-2016
Tennessee N/A N/A N/A 0.2% 0.2%
United States N/A N/A N/A 0.3% 0.3%
Range N/A N/A N/A 0.1-1.5% 0.2-0.8%
Tennessee Rank N/A N/A N/A 21 12
Source: National Survey on Drug Use and Health, Substance Abuse and Mental Health Services Administration
2011-2012 2012-2013 2013-2014 2014-2015 2015-2016
Tennessee N/A N/A N/A N/A 89.0%
United States N/A N/A N/A N/A 88.2%
Range N/A N/A N/A N/A 83.3-91.3%
Tennessee Rank N/A N/A N/A N/A 16
Source: National Survey on Drug Use and Health, Substance Abuse and Mental Health Services Administration
Bottom 20%
Top 20%Middle 60%
8.5.1. Adults who used pain relievers for nonmedical use in the past year.
Note: Nonmedical pain relievers include (1) Darvocet-N®, Darvon®, or Tylenol® with codeine; (2) Percocet®, Percodan®, or Tylox®; and (3) Vicodin®,
Lortab®, or Lorcet®/Lorcet Plus®. Additional drugs were (4) codeine; (5) Demerol®; (6) Dilaudid®; (7) Fioricet®; (8) Fiorinal®; (9) hydrocodone; (10)
methadone; (11) morphine; (12) OxyContin®; (13) Phenaphen® with codeine; (14) propoxyphene; (15) SK-65®; (16) Stadol®; (17) Talacen®; (18) Talwin®;
(19) Talwin® NX; (20) tramadol; and (21) Ultram®.
8.6.1. Adults who used heroin in the past year.
8.6.2. Adults who have perceptions of great risk from trying herion once or twice.
8.5.2. Adults who had pain reliever use disorder in the past year.
X. Deng
R. Jones
Behavioral Health Indicators for Tennessee and the United States
2018 Data Book 45

8.7. Cocaine
2011-2012 2012-2013 2013-2014 2014-2015 2015-2016
Tennessee 1.1% 1.1% 0.8% 1.2% 1.4%
United States 1.2% 1.3% 1.3% 1.4% 1.4%
Range 0.7-2.0% 0.8-2.0% 0.7-2.0% 0.5-2.1% 0.7-2.0%
Tennessee Rank 22 18 7 25 27
Source: National Survey on Drug Use and Health, Substance Abuse and Mental Health Services Administration
2011-2012 2012-2013 2013-2014 2014-2015 2015-2016
Tennessee N/A N/A N/A N/A 79.5%
United States N/A N/A N/A N/A 74.8%
Range N/A N/A N/A N/A 65.6-83.2%
Tennessee Rank N/A N/A N/A N/A 6
Source: National Survey on Drug Use and Health, Substance Abuse and Mental Health Services Administration
8.8. Substance use
2011-2012 2012-2013 2013-2014 2014-2015 2015-2016
Tennessee 6.4% 6.2% 6.0% N/A 6.1%
United States 6.7% 7.0% 7.1% N/A 6.7%
Range 5.0-8.7% 5.7-9.0% 5.7-8.5% N/A 5.1-8.8%
Tennessee Rank 16 4 2 N/A 11
Source: National Survey on Drug Use and Health, Substance Abuse and Mental Health Services Administration
2011-2012 2012-2013 2013-2014 2014-2015 2015-2016
Tennessee N/A N/A N/A N/A 5.4%
United States N/A N/A N/A N/A 6.2%
Range N/A N/A N/A N/A 4.6-8.5%
Tennessee Rank N/A N/A N/A N/A 10
Source: National Survey on Drug Use and Health, Substance Abuse and Mental Health Services Administration
Bottom 20%
8.7.1. Adults who used cocaine in the past year.
Middle 60%Top 20%
8.7.2. Adults who have perceptions of great risk from using cocaine once a month.
8.8.1. Adults who had substance use disorder in the past year.
8.8.2. Adults needing but not receiving treatment at a speciality facility for substance use in the past year.
X. Deng
R. Jones
Behavioral Health Indicators for Tennessee and the United States
2018 Data Book 46

SECTION B: MENTAL HEALTH
X. Deng
R. Jones
Behavioral Health Indicators for Tennessee and the United States
2018 Data Book 47

US TN TN Rank
Mental health issues
Children with a parent who reports that a doctor has told them their child has autism,
developmental delays, depression, anxiety, ADD/ADHD, or behavioral/conduct
problems.1
17.0% 21.0% n
Mental health care access
Children with emotional, developmental, or behavioral problems that received
mental health care/counseling of some type during the past 12 months.2 61.0% 60.2% o
US TN TN Rank
Depression
Youth who had at least one major depressive episode in the past year.3 12.6% 12.1% oSources:
9. Mental health dashboards
Middle 60%Bottom 20%
Children and youth (2-17) mental health
Mental health for children and youth
ages 2-17
2011-2012
Legend
US and TN Percentages: Indicate prevalence for the group indicated in the table.
TN Rank: Compares most recent year’s data for Tennessee with data from other states. A higher ranking indicates
that the state has a lower prevalence or positive outcome. (See data tables for specific ranking.)
Top 20%
3. National Survey on Drug Use and Health (NSDUH), Substance Abuse and Mental Health Services Administration.
2. The Henry J. Kaiser Family Foundation’s State Health Facts. National Survey of Children’s Health data.
1. The Annie E. Casey Foundation, KIDS COUNT Data Center. National Survey of Children’s Health data.
Mental health for children and youth
ages 12-17
2015-2016
X. Deng
R. Jones
Behavioral Health Indicators for Tennessee and the United States
2018 Data Book 48

US TN TN Rank
DepressionYouth feeling sad or hopeless (almost every day for two weeks or more in
a row) during the 12 months before survey.29.9% 28.0% o
Suicides
Youth who attempted suicide in the past 12 months. 8.6% 9.9% oYouth that made a plan about how they would attempt suicide (during the
12 months before the survey).14.6% 14.2% o
Youth who attempted suicide that resulted in an injury, poisoning, or
overdose that had to be treated by a doctor or nurse (during the 12
months before the survey).
2.8% 3.8% o
Bullying
Youth who were electronically bullied (including being bullied through e-
mail, chat rooms, instant messaging, websites, or texting)(during the 12
months before the survey).
15.5% 15.3% o
Youth who were bullied on school property(during the 12 months before
the survey).20.2% 24.1% n
Source: Centers for Disease Control & Prevention. Youth Risk Behavior Survey.
o (Middle 60%) n (Bottom 20%)
Youth in high school (grades 9-12) mental health
Mental health of youth in grades 9-122015
Legend
US and TN Percentages: Indicate prevalence for the group indicated in the table.
TN Rank: Compares most recent year’s data for Tennessee with data from other states. A higher
ranking indicates that the state has a lower prevalence or positive outcome. (See data tables for specific
ranking.)
n (Top 20%)
X. Deng
R. Jones
Behavioral Health Indicators for Tennessee and the United States
2018 Data Book 49
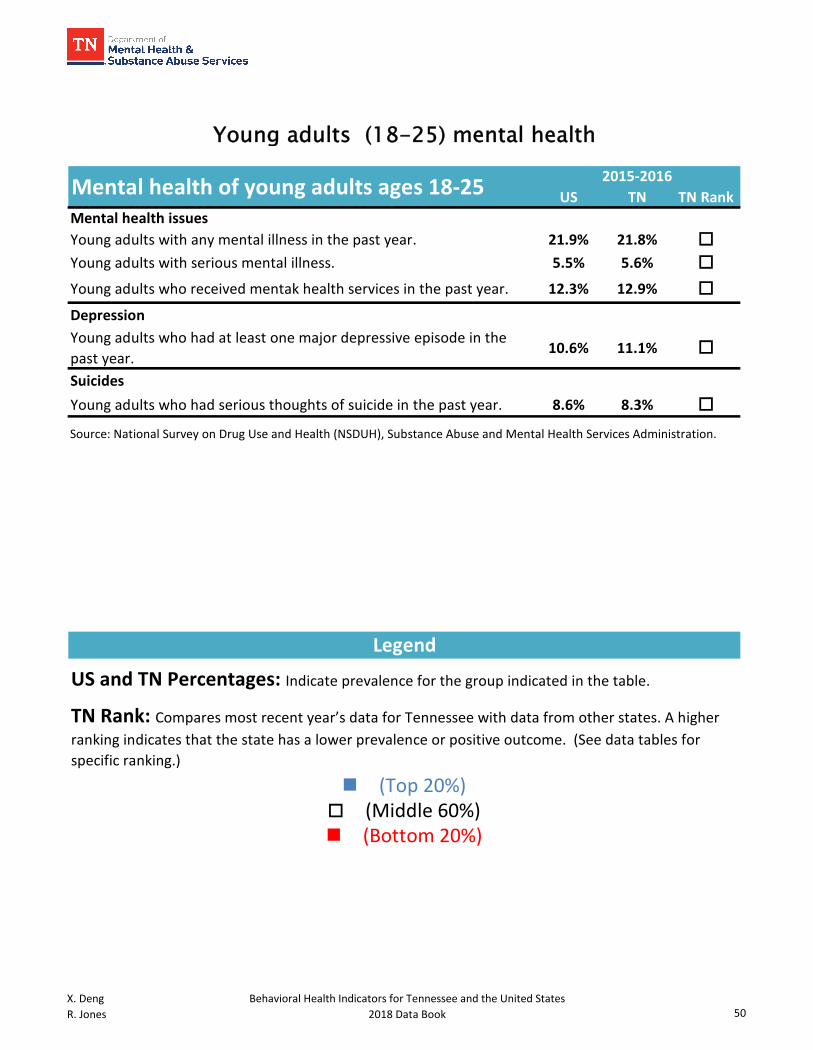
US TN TN Rank
Mental health issues
Young adults with any mental illness in the past year. 21.9% 21.8% oYoung adults with serious mental illness. 5.5% 5.6% o
Young adults who received mentak health services in the past year. 12.3% 12.9% o
Depression
Young adults who had at least one major depressive episode in the
past year. 10.6% 11.1% o
Suicides
Young adults who had serious thoughts of suicide in the past year. 8.6% 8.3% o
n (Top 20%)o (Middle 60%)n (Bottom 20%)
Young adults (18-25) mental health
Mental health of young adults ages 18-252015-2016
Source: National Survey on Drug Use and Health (NSDUH), Substance Abuse and Mental Health Services Administration.
Legend
US and TN Percentages: Indicate prevalence for the group indicated in the table.
TN Rank: Compares most recent year’s data for Tennessee with data from other states. A higher
ranking indicates that the state has a lower prevalence or positive outcome. (See data tables for
specific ranking.)
X. Deng
R. Jones
Behavioral Health Indicators for Tennessee and the United States
2018 Data Book 50

US TN TN Rank
Mental health issues
Adults with any mental illness in the past year. 18.1% 19.6% oAdults with serious mental illness. 4.1% 5.0% nAdults who received mental health services in the past year. 14.3% 15.1% oDepression
Adults who had at least one major depressive episode in the past
year.6.7% 7.1% o
Suicides
Adults who had serious thoughts of suicide in the past year. 4.0% 4.6% o
Other mental health indicators 2015
Adults who are limited in any activities because of physical, mental
or emotional problems.1 20.6% 24.9% n
Poor mental health days in the past 30 days.2 3.7 4.8 n
Percent of adults having poor mental health days.3 3.4% 3.4% o
n (Bottom 20%)
Legend
US and TN Percentages: Indicate prevalence for the group indicated in the table.
TN Rank: Compares most recent year’s data for Tennessee with data from other states. A higher
ranking indicates that the state has a lower prevalence or positive outcome. (See data tables for
specific ranking.)
n (Top 20%)o (Middle 60%)
Adults (18+) mental health
Mental health of adults ages 18+ 2015-2016
Source: National Survey on Drug Use and Health (NSDUH), Substance Abuse and Mental Health Services Administration.
Sources:
1. Centers for Disease Control and Prevention (CDC). Behavioral Risk Factor Surveillance System Survey data.
2. Health Indicators Warehouse. Behavioral Risk Factor Surveillance System Survey data.
3. The Henry J. Kaiser Family Foundation, State Health Facts. Behavioral Risk Factor Surveillance System Survey data.
X. Deng
R. Jones
Behavioral Health Indicators for Tennessee and the United States
2018 Data Book 51

US % TN % TN Rank
Mental health issues
Adults with any mental illness in the past year. 17.4% 19.3% oAdults with serious mental illness in the past year. 3.9% 4.9% nAdults who received mental health services in the past year. 14.6% 15.5% oDepression
Adults who had at least one major depressive episode in the past year. 6.1% 6.4% o
Suicides
Adults who had serious thoughts of suicide in the past year. 3.3% 3.9% o
n (Top 20%)o (Middle 60%)n (Bottom 20%)
Adults (26+) mental health
Mental health of adults ages 26+ 2015-2016
Source: National Survey on Drug Use and Health (NSDUH), Substance Abuse and Mental Health Services Administration.
Legend
US and TN Percentages: Indicate prevalence for the group indicated in the table.
TN Rank: Compares most recent year’s data for Tennessee with data from other states. A higher
X. Deng
R. Jones
Behavioral Health Indicators for Tennessee and the United States
2018 Data Book 52

10.1. Mental health indicators for children and youth (ages 2-17)
NA 2007 NA NA 2011-2012
Tennessee NA 16.0% NA NA 21.0%
United States NA 15.0% NA NA 17.0%
Range NA 12.0-20.0% NA NA 12.0-24.0%Tennessee Rank NA 21 NA NA 43
Source: The Annie E. Casey Foundation, KIDS COUNT Data Center.
NA 2007 NA NA 2011
Tennessee NA 64.1% NA NA 60.2%
United States NA 60.0% NA NA 61.0%
Range NA 41.7-81.5% NA NA 40.4-86.3%Tennessee Rank NA 27 NA NA 29
Source: The Kaiser Family Foundation's State Health Facts.
10.2. Mental health indicators for children and youth (ages 12-17)
2011-2012 2012-2013 2013-2014 2014-2015 2015-2016
Tennessee 8.6% 9.4% 9.9% 10.9% 12.1%
United States 8.7% 9.9% 11.0% 11.9% 12.6%
Range 7.3-11.7% 7.9-12.6% 9.0-14.6% 9.9-14.6% 10.1-15.9%
Tennessee Rank 24 16 8 6 16
Source: National Survey on Drug Use and Health, Substance Abuse and Mental Health Services Administration.
10. Mental Health for children and youth
Top 20%Middle 60%Bottom 20%
10.1.1. Children with a parent who reports that a doctor has told them their child has autism, developmental delays, depression,
anxiety, ADD/ADHD, or behavioral/conduct problems.
Notes: The KIDS COUNT® Data Center identifies the source of these data as a Child Trends analysis of data from the U.S. Department of Health and
Human Services, Health Resources and Services Administration, Maternal and Child Health Bureau, National Survey on Children's Health.
10.1.2. Children with emotional, developmental, or behavioral problems that received mental health care/counseling of some type
during the past 12 months.
Note: 2007 data are the estimated percentages after applying the sampling weights.
10.2.1. Youth who had at least one major depressive episode in the past year.
Note: Major depressive episode is defined in the 4th edition of the Diagnostic and Statistical Manual of Mental Disorders (DSM-IV) as a period of at
least two weeks when a person experienced a depressed mood or loss of interest or pleasure in daily activities and had a majority of specified
depression symptoms.
X. Deng
R. Jones
Behavioral Health Indicators for Tennessee and the United States
2018 Data Book 53

11.1. Depression
2007 2009 2011 2013 2015
Tennessee 26.8% 27.6% 25.9% 28.3% 28.0%
United States 28.5% 26.1% 28.5% 29.9% 29.9%
Range 17.1-32.5% 20.8-34.9% 19.2-33.6% 19.5-36.4% 24.1-34.2%
Tennessee Rank 22 of 40 25 of 40 22 of 42 31 of 42 17 of 37
Source: Centers for Disease Control and Prevention. Youth Risk Behavior Survey.
11.2. Suicides
2007 2009 2011 2013 2015
Tennessee 7.4% 7.1% 6.2% 9.0% 9.9%
United States 6.9% 6.3% 7.8% 8.0% 8.6%
Range 4.8-14.3% 4.3-12.8% 3.6-11.3% 5.5-14.3% 5.9-12.7%
Tennessee Rank 13 of 40 13 of 41 8 of 42 16 of 40 22 of 35
Source: Centers for Disease Control and Prevention. Youth Risk Behavior Survey.
2007 2009 2011 2013 2015
Tennessee 10.2% 11.7% 11.1% 13.5% 14.2%
United States 11.3% 10.9% 12.8% 13.6% 14.6%
Range 8.1-17.8% 8.7-16.0% 8.4-16.3% 9.8-17.4% 11.0-18.2%
Tennessee Rank 12 of 40 24 of 40 13 of 41 23 of 39 17 of 34
Source: Centers for Disease Control and Prevention. Youth Risk Behavior Survey.
2007 2009 2011 2013 2015
Tennessee 2.2% 2.2% 2.2% 4.4% 3.8%
United States 2.0% 1.9% 2.4% 2.7% 2.8%
Range 1.5-4.8% 1.6-4.9% 1.1-5.4% 1.4-5.6% 1.9-9.3%
Tennessee Rank 10 of 37 9 of 39 6 of 39 31 of 34 22 of 33
Source: Centers for Disease Control and Prevention. Youth Risk Behavior Survey.
Top 20%Middle 60%Bottom 20%
11.2.1. Youth who attempted suicide in the past 12 months.
11.1.1. Youth who reported feeling sad or hopeless (almost every day for two weeks or more in a row) during the 12 months before
11. Mental health indicators for youth in high school grades 9-12
11.2.2. Youth that made a plan about how they would attempt suicide (during the 12 months before the survey).
11.2.3. Youth who attempted suicide that resulted in an injury, poisoning, or overdose that had to be treated by a doctor or nurse
during the 12 months before survey.
X. Deng
R. Jones
Behavioral Health Indicators for Tennessee and the United States
2018 Data Book 54

11.3. Bullying
NA NA 2011 2013 2015
Tennessee NA NA 13.9% 15.5% 15.3%
United States NA NA 16.2% 14.8% 15.5%
Range NA NA 12.3-21.6% 11.9-20.6% 11.6-21.1%
Tennessee Rank NA NA 7 of 40 21 of 40 17 of 36
Source: Centers for Disease Control and Prevention. Youth Risk Behavior Survey.
NA 2009 2011 2013 2015
Tennessee NA 17.3% 17.5% 21.1% 24.1%
United States NA 19.9% 20.1% 19.6% 20.2%
Range NA 13.4-24.4% 14.0-26.7% 15.7-26.3% 15.0-26.3%
Tennessee Rank NA 8 of 34 7 of 41 20 of 40 30 of 35
Source: Centers for Disease Control and Prevention. Youth Risk Behavior Survey.
11.3.1. Youth who were electronically bullied during the 12 months before survey.
Note: Includes being bullied through e-mail, chat rooms, instant messaging, websites, or texting.
11.3.2. Youth who were bullied on school property during the 12 months before survey.
Top 20%Middle 60%Bottom 20%
X. Deng
R. Jones
Behavioral Health Indicators for Tennessee and the United States
2018 Data Book 55

12.1. Any mental illness / serious mental illness
2011-2012 2012-2013 2013-2014 2014-2015 2015-2016
Tennessee 18.6% 19.4% 19.9% 20.4% 21.8%
United States 19.1% 19.5% 19.8% 20.9% 21.9%
Range 16.3-25.0% 16.4-26.9% 16.3-26.5% 16.4-28.0% 16.9-28.4%
Tennessee Rank 16 21 21 14 21
Source: National Survey on Drug Use and Health, Substance Abuse and Mental Health Services Administration.
2011-2012 2012-2013 2013-2014 2014-2015 2015-2016
Tennessee 4.0% 4.2% 4.7% 4.8% 5.6%
United States 4.0% 4.2% 4.5% 4.9% 5.5%
Range 3.3-4.9% 3.5-5.8% 3.7-6.4% 3.9-7.6% 4.4-8.2%
Tennessee Rank 18 20 24 14 24
Source: National Survey on Drug Use and Health, Substance Abuse and Mental Health Services Administration.
2011-2012 2012-2013 2013-2014 2014-2015 2015-2016
Tennessee N/A N/A N/A N/A 12.9%
United States N/A N/A N/A N/A 12.3%
Range N/A N/A N/A N/A 8.9-22.3%
Tennessee Rank N/A N/A N/A N/A 18
Source: National Survey on Drug Use and Health, Substance Abuse and Mental Health Services Administration.
12.1.3. Young adults who received mental health services in the past year.
Top 20%Middle 60%Bottom 20%
12. Mental health indicators for young adults (18-25)
12.1.1. Young adults with any mental illness in the past year.
12.1.2. Young adults with serious mental illness in the past year.
NOTE: Mental Health Services is defined as having received inpatient treatment/counseling or outpatient treatment/counseling or having used
prescription medication for problems with emotions, nerves, or mental health. Respondents were not to include treatment for drug or alcohol use.
Notes: Serious mental illness is defined as having a diagnosable mental, behavioral, or emotional disorder, other than a developmental or substance
use disorder, that met the criteria found in the 4th edition of the Diagnostic and Statistical Manual of Mental Disorders (DSM-IV) and resulted in
serious functional impairment.
Notes: Any mental illness is defined as having a diagnosable mental, behavioral, or emotional disorder, other than a developmental or substance use
disorder, that met the criteria found in the 4th edition of the Diagnostic and Statistical Manual of Mental Disorders (DSM-IV).
X. Deng
R. Jones
Behavioral Health Indicators for Tennessee and the United States
2018 Data Book 56

12.2. Depression
2011-2012 2012-2013 2013-2014 2014-2015 2015-2016
Tennessee 7.9% 8.5% 8.9% 9.6% 11.1%
United States 8.6% 8.8% 9.0% 9.8% 10.6%
Range 7.3-10.9% 7.4-12.9% 6.9-11.8% 8.0-13.2% 7.8-13.4%
Tennessee Rank 9 16 21 17 29
Source: National Survey on Drug Use and Health, Substance Abuse and Mental Health Services Administration.
12.3. Suicides
2011-2012 2012-2013 2013-2014 2014-2015 2015-2016
Tennessee 6.6% 7.7% 7.6% 7.6% 8.3%
United States 7.0% 7.3% 7.4% 7.9% 8.6%
Range 5.6-8.7% 5.8-9.4% 6.2-10.3% 6.9-10.6% 7.1-11.8%
Tennessee Rank 9 37 31 11 14
Source: National Survey on Drug Use and Health, Substance Abuse and Mental Health Services Administration.
Middle 60%Bottom 20%
12.3.1. Young adults who had serious thoughts of suicide in the past year.
Notes: Major depressive episode is defined as in the 4th edition of the Diagnostic and Statistical Manual of Mental Disorders (DSM-IV), which specifies
a period of at least two weeks when a person experienced a depressed mood or loss of interest or pleasure in daily activities and had a majority of
specific depressed symptoms.
12.2.1. Young adults who had at least one major depressive episode in the past year.
Top 20%
X. Deng
R. Jones
Behavioral Health Indicators for Tennessee and the United States
2018 Data Book 57

13.1. Any mental illness / serious mental illness
2011-2012 2012-2013 2013-2014 2014-2015 2015-2016
Tennessee 20.3% 20.5% 20.4% 19.9% 19.6%
United States 18.2% 18.5% 18.3% 18.0% 18.1%
Range 14.7-22.4% 15.6-22.3% 16.0-22.7% 15.9-21.7% 15.5-22.6%
Tennessee Rank 43 46 42 37 36
Source: National Survey on Drug Use and Health, Substance Abuse and Mental Health Services Administration.
2011-2012 2012-2013 2013-2014 2014-2015 2015-2016
Tennessee 4.3% 4.6% 4.7% 4.4% 5.0%
United States 4.0% 4.1% 4.2% 4.1% 4.1%
Range 3.1-5.5% 3.3-5.5% 3.3-5.5% 3.1-5.4% 3.2-5.5%
Tennessee Rank 28 33 35 27 41
Source: National Survey on Drug Use and Health, Substance Abuse and Mental Health Services Administration.
2011-2012 2012-2013 2013-2014 2014-2015 2015-2016
Tennessee N/A N/A N/A N/A 15.1%
United States N/A N/A N/A N/A 14.3%
Range N/A N/A N/A N/A 9.0-20.7%
Tennessee Rank N/A N/A N/A N/A 23
Source: National Survey on Drug Use and Health, Substance Abuse and Mental Health Services Administration.
Top 20%Middle 60%Bottom 20%
12.1.3. Adults who received mental health services in the past year.
NOTE: Mental Health Services is defined as having received inpatient treatment/counseling or outpatient treatment/counseling or having used
prescription medication for problems with emotions, nerves, or mental health. Respondents were not to include treatment for drug or alcohol use.
13. Mental health indicators for adults (18+)
13.1.1. Adults with any mental illness in the past year.
13.1.2. Adults with serious mental illness in the past year.
Notes: Any mental illness is defined as having a diagnosable mental, behavioral, or emotional disorder, other than a developmental or substance use
disorder, that met the criteria found in the 4th edition of the Diagnostic and Statistical Manual of Mental Disorders (DSM-IV).
Notes: Serious mental illness is defined as having a diagnosable mental, behavioral, or emotional disorder, other than a developmental or substance
use disorder, that met the criteria found in the 4th edition of the Diagnostic and Statistical Manual of Mental Disorders (DSM-IV) and resulted in
serious functional impairment.
X. Deng
R. Jones
Behavioral Health Indicators for Tennessee and the United States
2018 Data Book 58

13.2. Depression
2011-2012 2012-2013 2013-2014 2014-2015 2015-2016
Tennessee 6.8% 7.0% 7.0% 7.0% 7.1%
United States 6.7% 6.8% 6.6% 6.6% 6.7%
Range 5.4-9.0% 5.6-9.4% 5.3-8.3% 5.7-8.7% 5.4-8.3%
Tennessee Rank 21 29 30 28 27
Source: National Survey on Drug Use and Health, Substance Abuse and Mental Health Services Administration.
13.3. Suicides
2011-2012 2012-2013 2013-2014 2014-2015 2015-2016
Tennessee 3.5% 4.0% 4.4% 4.3% 4.6%
United States 3.8% 3.9% 3.9% 4.0% 4.0%
Range 3.3-4.7% 3.5-4.8% 3.3-4.9% 3.5-5.3% 3.3-5.6%Tennessee Rank 5 24 41 34 38
Source: National Survey on Drug Use and Health, Substance Abuse and Mental Health Services Administration.
13.4. Other mental health indicators
2011 2012 2013 2014 2015
Tennessee 26.1% 23.1% 25.1% 25.9% 24.9%
United States 24.3% 20.1% 19.7% 20.4% 20.6%
Range 18.9-31.4% 15.4-28.6% 15.2-27.6% 15.2-29.1% 16.4-28.3%
Tennessee Rank 36 38 46 46 43
13.3.1. Adults who had serious thoughts of suicide in the past year.
13.4.1. Adults who are limited in any activities because of physical, mental or emotional problems.
Top 20%Middle 60%Bottom 20%
Source: Centers for Disease Control and Prevention (CDC). Behavioral Risk Factor Surveillance System Survey Data. Data were not available
in 2016.
Notes: Major depressive episode is defined in the 4th edition of the Diagnostic and Statistical Manual of Mental Disorders (DSM-IV) as a period of at
least two weeks when a person experienced a depressed mood or loss of interest or pleasure in daily activities and had a majority of specified
depression symptoms.
13.2.1. Adults who reported having at least one major depressive episode in the past year.
X. Deng
R. Jones
Behavioral Health Indicators for Tennessee and the United States
2018 Data Book 59

2012 2013 2014 2015 2016
Tennessee 3.8 4.0 3.7 4.8 4.3
United States 3.8 3.9 3.7 3.7 3.7
Range NA NA NA 2.7-4.8 2.4-4.7
Tennessee Rank 25 30 24 50 42
Source: Centers for Disease Control and Prevention (CDC). Behavioral Risk Factor Surveillance System Survey Data.
2012 2013 2014 2015 2016
Tennessee NA 28.5% 33.6% 33.9% 35.3%
United States NA 33.9% 33.9% 34.3% 34.4%
Range NA 26.8-40.2% 27.3-39.1% 27.6-41.1% 28.5-41.4%
Tennessee Rank NA 4 24 23 28
Source: Kaiser Family Foundation analysis of the Centers for Disease Control and Prevention (CDC)'s
Behavioral Risk Factor Surveillance System (BRFSS) 2013-2015 Survey results.
Middle 60%Bottom 20%
13.4.2. Days in the past 30 days that adults self-reported their mental health was not good.
Top 20%
13.4.3. Percent of adults having poor mental health days in the past 30 days.
X. Deng
R. Jones
Behavioral Health Indicators for Tennessee and the United States
2018 Data Book 60

14.1. Any mental illness / serious mental illness
2011-2012 2012-2013 2013-2014 2014-2015 2015-2016
Tennessee 20.5% 20.7% 20.5% 19.8% 19.3%
United States 18.0% 18.4% 18.1% 17.5% 17.4%
Range 14.3-22.2% 15.1-22.0% 15.4-22.3% 15.3-21.6% 14.7-22.2%
Tennessee Rank 43 45 46 41 40
Source: National Survey on Drug Use and Health, Substance Abuse and Mental Health Services Administration.
2011-2012 2012-2013 2013-2014 2014-2015 2015-2016
Tennessee 4.3% 4.7% 4.7% 4.3% 4.9%
United States 4.0% 4.1% 4.1% 3.9% 3.9%
Range 3.0-5.6% 3.2-5.6% 3.1-5.6% 2.8-5.4% 3.0-5.4%
Tennessee Rank 29 36 38 32 45
Source: National Survey on Drug Use and Health, Substance Abuse and Mental Health Services Administration.
2011-2012 2012-2013 2013-2014 2014-2015 2015-2016
Tennessee N/A N/A N/A N/A 15.5%
United States N/A N/A N/A N/A 14.6%
Range N/A N/A N/A N/A 9.0-20.8%
Tennessee Rank N/A N/A N/A N/A 23
Source: National Survey on Drug Use and Health, Substance Abuse and Mental Health Services Administration.
14.1.3. Adults who received mental health services in the past year.
NOTE: Mental Health Services is defined as having received inpatient treatment/counseling or outpatient treatment/counseling or having used
prescription medication for problems with emotions, nerves, or mental health. Respondents were not to include treatment for drug or alcohol use.
Top 20%Middle 60%Bottom 20%
14. Mental health of adults (26+)
14.1.1. Adults with any mental illness in the past year.
14.1.2. Adults with serious mental illness in the past year.
Notes: Any mental illness is defined as having a diagnosable mental, behavioral, or emotional disorder, other than a developmental or substance use
disorder, that met the criteria found in the 4th edition of the Diagnostic and Statistical Manual of Mental Disorders (DSM-IV).
Notes: Serious mental illness is defined as having a diagnosable mental, behavioral, or emotional disorder, other than a developmental or substance
use disorder, that met the criteria found in the 4th edition of the Diagnostic and Statistical Manual of Mental Disorders (DSM-IV) and resulted in
serious functional impairment.
X. Deng
R. Jones
Behavioral Health Indicators for Tennessee and the United States
2018 Data Book 61

14.2. Depression
2011-2012 2012-2013 2013-2014 2014-2015 2015-2016
Tennessee 6.6% 6.8% 6.7% 6.5% 6.4%
United States 6.4% 6.4% 6.2% 6.1% 6.1%
Range 5.0-8.6% 5.1-8.7% 5.0-7.9% 5.2-8.0% 4.8-7.8%
Tennessee Rank 27 35 32 30 27
Source: National Survey on Drug Use and Health, Substance Abuse and Mental Health Services Administration.
14.3. Suicides
2011-2012 2012-2013 2013-2014 2014-2015 2015-2016
Tennessee 3.0% 3.4% 3.9% 3.7% 3.9%
United States 3.2% 3.3% 3.3% 3.3% 3.3%
Range 2.8-4.3% 2.9-4.3% 2.8-4.2% 2.8-4.3% 2.6-4.6%
Tennessee Rank 9 24 44 38 40
Source: National Survey on Drug Use and Health, Substance Abuse and Mental Health Services Administration.
Top 20%Middle 60%Bottom 20%
14.3.1. Adults who had serious thoughts of suicide in the past year.
Notes: Major depressive episode is defined in the 4th edition of the Diagnostic and Statistical Manual of Mental Disorders (DSM-IV) as a period of at
least two weeks when a person experienced a depressed mood or loss of interest or pleasure in daily activities and had a majority of specified
depression symptoms.
14.2.1. Adults who had at least one major depressive episode in the past year.
X. Deng
R. Jones
Behavioral Health Indicators for Tennessee and the United States
2018 Data Book 62