Embed Size (px)
Citation preview
Behavioral Biases of Mutual Fund Investors
Warren Bailey Cornell University, Johnson Graduate School of Management
Alok Kumar University of Miami & University of Texas at Austin
David Ng University of Pennsylvania Wharton School & Cornell University
16th July 2010
Abstract
We examine the effect of behavioral biases on the mutual fund choices of a large sample of U.S. discount brokerage investors using new measures of attention to news, tax awareness, and fund-level familiarity bias, in addition to behavioral and demographic characteristics of earlier studies. Behaviorally-biased investors typically make poor decisions about fund style and expenses, trading frequency, and timing, resulting in poor performance. Furthermore, trend-chasing appears related to behavioral biases, rather than to rationally inferring managerial skill from past performance. Factor analysis suggests that biased investors often conform to stereotypes that can be characterized as “gambler”, “smart”, “overconfident”, “narrow-framer”, and “mature”.
JEL Codes: G11, D03
Keywords: individual investors, mutual funds, trend chasing, behavioral biases, factor analysis.
Address for Correspondence: Warren Bailey, Johnson Graduate School of Management, Cornell University, Sage Hall, Ithaca, NY 14853-6201, phone 607-255-4627, fax 607-255-4627, [email protected]; Alok Kumar, University of Miami, School of Business Administration, 514 Jenkins Building, Coral Gables, FL 33124, phone 305-284-1882, fax 305-284-4800, [email protected]; and David Ng, Wharton School, University of Pennsylvania, Steinberg Hall-Dietrich Hall, 3620 Locust Walk, Philadelphia, PA 19104-6302, and Dyson School of Applied Economics and Management, Cornell University, Ithaca, NY 14853-7801, phone 607-279-7141, [email protected]. We thank an anonymous referee, Malcolm Baker (AFA discussant), Nick Barberis, Robert Battalio, Zahi Ben-David, Garrick Blalock, Charles Chang, Susan Christoffersen, Josh Coval, Andrew Karolyi, George Korniotis, Lisa Kramer, Charles Lee, Ulrike Malmendier (AFA session chair), J. Spencer Martin, Jay Ritter, René Stulz, Jeremy Tobacman, Jeff Wurgler, and seminar participants at BSI Gamma Foundation Conference (Frankfurt), Cornell, Federal Reserve Bank of Boston, Ohio State’s Alumni Summer Conference, Northern Finance Association Meetings, McGill, and 2009 AFA Meetings (San Francisco) for comments and helpful discussions. We also thank Zoran Ivkovich and Lu Zheng for providing data for identifying the mutual funds in our sample. We are grateful to the BSI Gamma Foundation for financial support. Taehoon Lim provides excellent research assistance. All remaining errors and omissions are our own. Early presentations of this paper were entitled “Why Do Individual Investors Hold Stocks and High-Expense Funds Instead of Index Funds?”.

Behavioral Biases of Mutual Fund Investors
ABSTRACT We examine the effect of behavioral biases on the mutual fund choices of a large sample of U.S. discount brokerage investors using new measures of attention to news, tax awareness, and fund-level familiarity bias, in addition to behavioral and demographic characteristics of earlier studies. Behaviorally-biased investors typically make poor decisions about fund style and expenses, trading frequency, and timing, resulting in poor performance. Furthermore, trend-chasing appears related to behavioral biases, rather than to rationally inferring managerial skill from past performance. Factor analysis suggests that biased investors often conform to stereotypes that can be characterized as “gambler”, “smart”, “overconfident”, “narrow-framer”, and “mature”.

1
1. Introduction Previous studies of behavioral biases in the investment decisions of individual investors
focus on the selection of individual stocks. Odean (1998, 1999), Barber and Odean (2001), and
other empirical studies show that the stock-picking decisions of individual investors exhibit a
variety of behavioral biases. However, little work has been done to link the decision-making
biases of individuals to their mutual fund investments. Understanding the role of behavioral
biases in individual mutual fund decisions is important for several reasons.
First, individual investors increasingly use mutual funds to invest in the equity market
rather than trading individual stocks. French (2008) reports that: “Individuals hold 47.9% of the
market in 1980 and only 21.5% in 2007. This decline is matched by an increase in the holdings
of open-end mutual funds, from 4.6% in 1980 to 32.4% in 2007.” Hence, it is increasingly
important to understand how individual investors hold and trade mutual funds.
Second, even though direct stock trading by individuals has declined, their mutual fund
investment decisions can affect stock returns indirectly. Coval and Stafford (2007) argue that
large flows force some mutual funds to trade heavily, causing price pressure for securities held
across many funds. Previous papers document that mutual fund flows affect individual stock
returns. Gruber (1996) and Zheng (1999) find that fund flows are followed by positive short-
term fund returns, perhaps due to a momentum effect. Frazzini and Lamont (2008) show that
mutual fund flows appear to be “dumb money”: fund inflows are associated with low future
returns, while outflows are associated with high future returns.
Third, the manner in which individuals employ mutual funds cuts right to the heart of
basic principles of financial management. Traditional portfolio choice models imply a simple
investment strategy based on well-diversified, low expense mutual funds and minimal portfolio

2
rebalancing. Index funds, and other equity funds with low fees and low turnover, are cheap,
convenient vehicles for individual investors to implement such a strategy. The extent to which
individuals adhere to these principles in their use of mutual funds is an important measure of the
rationality and effectiveness with which investors approach capital markets.
The purpose of our paper is to test whether behavioral biases explain why the use of
mutual funds varies substantially across individual investors and often departs from the simple
strategies suggested by classic theories. The growing literature on behavioral finance has
uncovered a variety of decision-making biases in how investors use individual common stocks.
These behavioral forces should also have an impact on whether a particular investor uses mutual
funds, and whether she uses them effectively.
The mutual fund literature has already documented two specific anomalies. First,
individual investors buy funds with high fees. Gruber (1996) and Barber, Odean, and Zheng
(2005) document that many individual investors hold significant positions in high expense
mutual funds. Even more puzzling is the finding of Elton, Gruber and Busse (2004) that
substantial amounts have gone into index funds which charge high fees (over 2% per year) for
passive holdings of broad indexes like the S&P500. Second, individual investors chase returns.
Sirri and Tufano (1998), Bergstresser and Poterba (2002), and Sapp and Tiwari (2004) find that
fund flows tend to chase funds with high past returns. This may be fostered by Morningstar’s
practice of rating funds based on past returns (Del Guercio and Tkac (2008)).
Several explanations have been offered for these two anomalies. Carlin (2009) explains
participation in high fee index funds using a model with search costs. Choi, Laibson and Madrian
(2009) interpret their experiments on Wharton MBA students and participation in high fee funds
as consistent with behavioral biases. Return-chasing has been ascribed to an agency problem that

3
induces fund managers to alter the riskiness of the fund to maximize investment flows instead of
risk-adjusted expected returns (Chevalier and Ellison (1997)). It may also reflect inferring
managerial skill from past returns (Sirri and Tufano (1998), Gruber (1996), Berk and Green
(2004)). However, with the exception of the experimental data used by Choi, Laibson and
Madrian (2009), these authors study aggregate fund flows rather than individual investor
behavior.
In contrast to previous studies, we link the decision-making biases of particular
individual investors to their individual history of mutual fund investing using a database of tens
of thousands of brokerage records of U.S. individual investors. The key to our experiment is the
use of individual investor records of stock holdings and trading to estimate the behavioral bias
proxies that previous authors have used to explain how investors trade individual stocks. These
individual behavioral bias proxies are, in turn, related to the mutual fund holdings and trading of
those individuals in a variety of empirical specifications that reveal different facets of mutual
fund investor behavior.
We can easily imagine behavioral biases affecting mutual fund selection. For example,
the “disposition effect” (selling winners too quickly and holding losers too long) may lead some
investors to overestimate expected holding periods and mistakenly select high front-end load
funds. Investors with “narrow framing” bias (buying and selling individual assets without
considering total portfolio effects), “overconfidence” (frequent trading plus poor performance),
or a preference for speculative stocks may select funds that facilitate aggressive switching across
asset classes without considering higher fees. “Local bias” (preference for stocks of companies
geographically close to home) may induce the selection of locally-managed mutual funds
without regard to cost or expected performance. Investors who view their portfolios in terms of

4
“layers” that serve different purposes (Shefrin and Statman (2000)) may demonstrate different
behavior in their use of individual stocks versus mutual funds. For example, if mutual funds are
viewed as substantially safer than selecting individual stocks on their own, investors may “let
their guard down” and spend less time assessing fund performance and costs. Regardless of the
type of behavioral bias, poor decisions about timing, holding periods, and choice of funds can
combine with the substantial variety in mutual fund fee structures to yield poor performance.
To examine the interactions and consequences of mutual fund choices and behavioral
biases, we adopt two empirical viewpoints. First, we present tests across individual investors.
Estimates of several dimensions of behavioral bias for each individual in our sample are used to
explain individual investor choices across index funds, other types of mutual funds, and
individual stocks. We also test whether behavioral biases influence associations between trading
decisions and recent fund performance because those biases could cause some investors to
misuse performance information.
Second, we present tests across different types of funds. We summarize individual
investor holding periods and returns across mutual funds classified by fee structure and by the
extent of several behavioral biases of each fund’s investors. Behaviorally-biased investors may
cluster in particular types of funds, and demonstrate poor performance or very frequent trading.
Furthermore, the fund industry’s offerings may include some funds designed to attract and
perhaps even exploit such investors. A large and growing number of mutual funds offer a variety
of themes and fee structures to U.S. individual investors. Even across relatively generic index
funds, there are many competing products that offer a wide range of fee structures and resultant
performance (Elton, Gruber, and Busse (2004), Hortacsu and Syverson (2004)). It is plausible

5
that different types of funds attract different clienteles (Nanda, Wang, and Zheng (2009)), and
some funds may have been designed specifically with behaviorally-biased clienteles in mind.1
A handful of previous papers have examined specific dimensions of the mutual fund
choices of individual investors. Barber, Odean, and Zheng (2005) find that investors are more
sensitive to salient fees like front-end loads, but not as sensitive to hidden management fees.
Christoffersen, Evans, and Musto (2006) consider how fund managers respond to the preferences
of their investors. Malloy and Zhu (2004) show that investors who reside in less affluent and
less educated neighborhoods tend to select high expense funds. Zhu (2005) shows that “busy”
investors are more likely to invest in funds rather than individual stocks. Huang, Wei, and Yan
(2007) characterize the effect of the information environment on the associations between fund
flows and past performance. Bergstresser, Chalmers and Tufano (2009) study whether mutual
fund brokers help educate investors and attenuate their behavioral biases, but conclude that
brokers do not deliver tangible benefits for the fees they earn. Ivkovich and Weisbenner (2009)
examine aggregate individual investor fund flows for tax effects.
Our paper offers several substantial contributions. First, unlike earlier studies, we
examine a combination of behavioral factors, plus controls for other likely influences on
portfolio selection, to reveal the interactions between investor decisions, the characteristics of the
mutual funds they select, and the consequences for portfolio performance. Second, because we
employ proxies for a number of dimensions of investor behavior in our tests, we are also able to
study the associations between different investor characteristics. In particular, applying factor
1 There is already some evidence that skilled capital market participants outsmart individual mutual fund investors. Money market funds appear to raise fees to exploit investors who are insensitive to fees and performance (Christoffersen and Musto (2002)). Weak associations between equity fund fees and performance may also reflect such behavior (Gil-Bazo and Ruiz-Verdu (2009)). Corporations are aware of patterns in mutual fund inflows and outflows and attempt to exploit them in timing equity issues (Frazzini and Lamont (2008)). Mutual fund inflows are attracted to seemingly high performance assessed against benchmarks that funds specify but which do not match fund styles (Sensoy (2009)).

6
analysis to the correlation structure of our investor characteristics reveals interesting overlaps
among biases and other characteristics, and permits us to identify and profile five investor
stereotypes that we label “Gambler”, “Smart”, “Overconfident”, “Narrow-Framer”, and
“Mature”. Third, our tests take the viewpoints of both the investor, who may ignore or misuse
mutual funds, and the mutual fund industry, which may design some of its products to exploit the
poor decision-making skills of some investors. Last, we extend the empirical behavioral
literature beyond the choice of individual stocks to decisions about professionally-managed
portfolios.
A summary of our results is as follows. We find that “sophisticated” investors (better-
informed, higher income, older, and more experienced) investors make good use of mutual funds,
holding a high proportion of fund for long periods, avoiding high expense funds, and
experiencing relatively good performance. However, investors with strong behavioral biases or
lack of attention to firm-specific or macro-economic news are less likely to hold mutual funds, or
select mutual funds for the wrong reasons. When they do buy mutual funds, they trade them
frequently, tend to time their buys and sells badly, and prefer high expense funds and active
funds rather than index funds. We also find that biased investors are more likely to chase fund
performance, casting doubt on the idea that trend-chasing reflects rational fund selection
decisions.
Evidently, these decisions are sub-optimal because they are associated with lower overall
returns. For instance, top-quintile narrow-framing investors have average mutual fund returns
that are 2.16% lower than those in the bottom quintile, while top-quintile disposition effect
investors have average returns that are 0.89% lower than those in the bottom quintile. In contrast,
behavioral biases do not appear to affect the performance of index fund holdings.

7
Thus, our behavioral bias and news inattentiveness proxies, though crude, demonstrate
that behavioral effects are at work in the mutual fund decisions of many investors and take a toll
on performance. Furthermore, the bias and inattention to news proxies are themselves correlated
in interesting ways that allow us to identify and study stereotypical investors. The five factors
identified using factor analysis can explain over 75% of the variance of the behavioral factors
and other investor characteristics. The intuitive combinations of investor characteristics that
comprise these five factors relate to mutual fund trading habits and performance in an interesting
and consistent manner.
The rest of the paper is organized as follows. Section 2 describes our explanatory
variables and test specifications. Section 3 describes the individual investor database and other
data sources. We present our empirical results in Sections 4 and 5, and conclude in Section 6
with a brief discussion.
2. Measuring Investor Characteristics
Our main objective is to relate mutual fund use and performance to behavioral factors
that vary across our sample of investors. We begin by using each sample investor’s record of
common stock holdings and trading to estimate a set of variables that proxy for the behaviors
evident in each investor’s common stock portfolio. Recognizing that behavioral factors are
unlikely to be the only determinant of mutual fund choices, we also construct controls for other
drivers of mutual fund decisions suggested by the mutual fund and behavioral finance literatures.
We use these variables in a variety of tests across individual investors and then across types of
mutual funds. Detailed descriptions of behavioral factors, other investor characteristics, and
references to supporting papers can be found in the Appendix.

8
2.1 Behavioral Bias Proxies
We begin by estimating Disposition Effect and Narrow Framing, two mental accounting
biases that have been explored extensively in the behavioral finance literature. The Disposition
Effect is the propensity of an investor to sell winners too early and hold losers too long. As
detailed in the Appendix, we measure each investor’s peer-group adjusted disposition effect by
comparing each investor’s actual propensity to realize gains versus losses to a peer group’s
propensity to realize gains and losses. A positive value of our disposition effect proxy indicates
that the investor sells a greater proportion of winners and a relatively smaller proportion of losers.
Disposition Effect may be related to tax incentives. For example, selling winners but
retaining losers is particularly costly for high-income U.S. individuals. In contrast, realizing
losses in December instead of other months may represent a sophisticated tax minimization
strategy. To distinguish disposition effect from tax loss selling, we construct a disposition effect
times high income interaction variable (DE*High Income) and a disposition effect times no
December tax loss selling interaction variable (DE*No Dec Tax Loss Selling). Selling winners
too soon and holding losers too long is particularly costly for higher-income investors because
they face higher marginal tax rates. Similarly, a cleaner measure of disposition effect may be
isolated by identifying individuals who appear entirely unaware of the tax consequences of their
trades. Therefore, both of these interaction terms are intended to isolate cleaner and severe facets
of the disposition effect.
Our second bias proxy, Narrow Framing, is the propensity of an investor to select
investments individually, rather than considering the broad impact on her portfolio. Intuitively,
the time interval between two consecutive decisions reflects the decision frame, with temporally-

9
separated decisions more likely to be framed narrowly than simultaneous decisions. Hence,
investors who execute less-clustered trades are more likely to be using narrower decision frames.
The Appendix describes how each investor’s trade clustering measure is peer-group adjusted for
portfolio size, number of stocks, and trading frequency. A low trade clustering measure indicates
an investor who is more likely to use a narrow viewpoint in making investment choices.2
Another important concept from the empirical behavioral finance literature is
Overconfidence, an investor’s propensity to trade frequently but unsuccessfully. Our
overconfidence dummy variable is set to one for investors in the highest portfolio turnover
quintile and lowest performance quintile for their individual common stock trading.3 Since male
investors typically exhibit overconfidence, we also use a male dummy as an additional proxy for
overconfidence.
Next, we compute a proxy for “familiarity”, as articulated by Merton (1987) and
Huberman (2001).4 Specifically, the Local Bias of an investor’s common stock portfolio equals
the mean distance between her home zip code and the headquarters’ zip codes of companies in
her portfolio minus the mean distance to the companies’ headquarters in the market portfolio.
2 Odean (1998) computes Disposition Effect as proportion of losses realized minus proportion of gains realized, and notes that this measure is sensitive to portfolio size and trading frequency. For example, proportions are likely to be smaller for investors who hold larger portfolios and trade frequently because those portfolios contain a larger number of stocks with capital gains and capital losses. Thus, use of the original measure of the Disposition Effect in cross-sectional analysis is likely to induce mechanical associations with variables that are correlated with portfolio size and trading frequency. Similar issues apply to the Narrow Framing measure because the trade clustering measure used to proxy for narrow framing is correlated with portfolio size, number of stocks, and trading frequency. Further, there might be a mechanically induced relation between proxies for Narrow Framing and Disposition Effect. To minimize the potential influences of portfolio size, number of stocks, and trading frequency, we compute peer-group adjusted proxies of both Disposition Effect and Narrow Framing biases. Our stock-level and fund level local bias measures are adjusted with the means for the market. This does not affect estimation since the same constant is applied to all investors but this allows us to think about an investor’s portfolio characteristics relative to a typical investor. 3 We measure the performance and turnover from the stock holdings of the investors for the entire period. We also constructed an alternative measure for performance and turnover using the first year of investors’ record. The results are very similar. 4 A related concept is home bias, the tendency for some investors to under-diversify their portfolios internationally. See Bailey, Kumar, and Ng (2008) for evidence that home bias may have its origins in behavioral biases.

10
Later in the paper, we introduce a new measure, Fund Level Local Bias, which equals the mean
distance between the investor’s home zip code and the headquarters of the mutual funds in her
portfolio, minus the same measure aggregated across all funds held by all investors in the sample.
We measure each investor’s preference for gambling and speculation. Following Kumar
(2009), Lottery Stocks Preference is the investor’s mean portfolio weight (relative to the weight
in the market portfolio) assigned to stocks that have low prices, high idiosyncratic volatility, and
high idiosyncratic skewness.
Last, we construct two indicators of whether a particular investor appears to ignore
potentially relevant economic news. One variable captures inattention to earnings news while the
other captures inattention to macroeconomic news. Both measures are computed using each
individual’s record of individual stock trades using the formula 1 − (Number of investor trades
around the event)/(Total number of investor trades), where “around” the event is defined as
days t−1, t, and t+1, where t is the earnings announcement date. To compute Inattention to
Earnings News, earnings announcements for each stock held by the individual are collected from
I/B/E/S/. To compute Inattention to Macroeconomic News, we collect dates of Fed Funds target
rate changes, Non Farm Payroll reports, and Producer Price Index releases from relevant
government web pages.5
Note that the measures we construct are only proxies for behavioral biases. They do not
correspond exactly to the definitions of decision-making biases in the psychology literature.
Nonetheless, at the very least, these measures are indicators of sub-optimal stock investment
decisions. They reflect portfolio management mistakes, and allow us to measure associations
5 Subsequent results shed light on whether “inattention” is a bias or part of a sensible passive strategy. For example, Barber and Odean (2008) find no evidence that trading based on other measures of news arrival is beneficial.

11
between an individual’s propensity to make such mistakes, his use of mutual funds, and the
consequences for portfolio performance.
Furthermore, there are other ways to think about the behavioral bias proxies and our
results. What we call “behavioral bias proxies” may simply represent each investor’s “financial
literacy”. Put another way, it is costly to continually acquire the skills and information needed to
make successful investment decisions. While basic notions of portfolio management suggest that
a simple buy-and-hold use of index funds is a sensible way to avoid incurring such costs,
“bounded rationality” may lead some investors to other decisions. For example, an investor may
display narrow framing bias if he elects not to incur the cost of thinking more carefully about
investment decisions.
Aside from recognizing that each investor may rationally strike a different balance
between the costs and benefits of becoming a “better” investor, we must also consider
preferences. While a preference for lottery-type stocks sounds suboptimal and, as we shall see, is
associated with underperformance, it may simply represent skewness preference in the investor’s
objective function.
Finally, some behavioral bias proxies may represent frictions in the investment process.
For example, our overconfidence proxy identifies investors whose individual stock portfolio is
high on turnover and low on return. While this may represent investors who are irrationally
aggressive, it may also reflect a combination of small portfolio size, commission costs, and other
frictions. With a portfolio of only a few stocks, rebalancing by trading just one stock yields high
turnover, and even “overconfidence” if performance is poor. If such small investors recognize
that mutual funds are particularly advantageous, this may even induce a correlation between

12
overconfidence and the propensity to use mutual funds. Our inclusion of portfolio size as a
control variable in our regressions may not completely correct for such effects.
2.2 Control Variables
Though we focus on the behavioral forces for which the previous section describes proxies,
we also control for other factors that are likely to influence mutual fund choices. Specifically, we
consider a set of demographic characteristics, which includes Age, Marital Status (a dummy set to
one for married investors), Family Size (number of family members in the household),
Professional Dummy (a dummy set to zero for investor in a blue collar profession, one otherwise),
and Retired Dummy (a dummy set to one if the investor is retired). These factors may proxy for
forces, such as the availability of time to study investments (Zhu (2005)), that can affect portfolio
selection.
Other control variables are more directly related to each individual’s investment activities.
Stock portfolio diversification is measured as the negative of Normalized Portfolio Variance
(that is, the variance of the portfolio of individual domestic securities divided by the average
variance of the individual common stocks in the portfolio). Investors who demonstrate awareness
of the value of diversification in their portfolio of individual stocks are likely to extend that
insight into their choice of mutual funds. Income (the total annual household income) and
Portfolio Size (the sample-period natural log of the average market capitalization of the
investor’s common stock portfolio) identify investors who are more likely to understand the
basic precepts of portfolio management and, therefore, tend to select index funds or other low
expense funds, and hold them for relatively long periods. Investment Experience (years since the
brokerage account was open) and a dummy for residence in a Financial Center may indicate

13
more experienced investors with easier access to information and opinions about investments
(Christoffersen and Sarkissian (2009)). The Options Dummy equals one if the investor executes
at least one option trade during the sample period. The Short Sale Dummy equals one if the
investor executes at least one short trade during the sample period. 6 Stock Portfolio Performance
(the intercept from the market model time series regression with the monthly common stock
portfolio return as dependent variable) may identify particularly skillful, successful investors.
Success may originate from a variety of strategies, ranging from selecting individual stocks to
timing the market7 No December Tax Loss Selling equals one minus the ratio of realized losses
in December to both realized and paper losses in December. Holds Tax-Deferred Account is a
dummy variable equal to 1 if the investor holds an IRA or Keogh account at the brokerage. Stock
Portfolio Beta, Size, Value, and Momentum Factor loadings are computed with market or four-
factor regressions using monthly returns.
3. Data and Summary Statistics
Having outlined the behavioral proxies and control variables that will support our study of
multiple dimensions of investors’ mutual fund decisions, we now describe the data sets needed for
the empirical tests.
3.1 Data Sources
Our primary database is a six-year (January 1991 to November 1996) panel of trades and
monthly portfolio positions of individual investors with accounts at a major U.S. discount
6 Options and short sale dummies may proxy for skill and experience, or may also reflect a tendency to speculate. See Campbell (2006) on the correlation between investor “sophistication” and investment mistakes. 7 For example, an informed investor may optimally focus on only a few stocks (Goetzmann and Kumar (2008), Ivkovich, Sialm, and Weisbenner (2008), Van Nieuweburgh and Veldkamp (2010)).

14
broker.8 The database has been used by a number of other authors including Odean (1998) and
Barber and Odean (2000). The database indicates the end-of-month portfolios of all investors,
records all trades by these investors, and supplies demographic information (measured as of June
1997 and supplied to the brokerage house by Infobase) such as age, occupation, income, self-
reported net worth, gender, marital status, and zip code.9 We obtain the zip codes of the
headquarters of a subset of mutual fund families from Professors Josh Coval and Zoran Ivkovich.
We supplement this data set with additional information from the Lionshare database, 1996
Nelson’s Directory of Investment Managers, and Google searches.
We also obtain data from several standard sources. For each common stock and mutual
fund in our sample, we obtain monthly returns data from the Center for Research in Security
Prices (CRSP). We also use the CRSP mutual fund database to obtain information on fund
characteristics such as the expense ratio and front-end load. Finally, we obtain the monthly time-
series of the three Fama-French factors and the momentum factor from Professor Kenneth
French’s data library.10
3.2 Summary Statistics
Table 1 provides summary statistics on individual investor trading and holding of mutual
funds and, for comparison, individual stocks. Sample investors traded or held 1,492 different
equity mutual funds (of which 33 are index funds) and close to 11,000 stocks. 32,122 investors
have executed at least one mutual fund trade and 29,381 have held equity mutual funds at least
8 The brokerage firm has not made more recent data available. The time period covered largely excludes such phenomena as ETFs (WEBS) and high-frequency online day trading by individuals. 9 Each demographic variable is available for only a subset of the investors in the sample. For instance, both age and income is available for only 31,260 investors. Consequently, the number of observations in each cross-sectional regression depends upon the subset of demographic variables included. 10 The data library is available at http://mba.tuck.dartmouth.edu/pages/faculty/ken.french/.

15
once. Among these, only 5,594 have executed at least one index fund trade and 4,432 have held
index funds at least once. The balance of buys and sells suggests that, in contrast to individual
stocks, mutual fund investors tend to buy and hold funds, rather than buying and selling more
actively as with individual stocks. Trade sizes and quantities are typically modest.
The mean (median) number of equity funds in a typical mutual fund portfolio is 3.51 (2.0)
and number of trades executed is 19 (6.0). The mean (median) number of index funds held is
1.37 (1.0) and number of trades executed is 4 (2.0). In contrast, a typical investor holds 3.89
individual stocks (median is three) and executes 30 (median is 11) stock trades.
Beyond what is reported in the table, the proportion of mutual funds in a typical equity
portfolio that includes mutual funds is 23.78%.11 This proportion increases slightly with equity
portfolio size to about 26% in the highest size decile portfolios. The proportion of index funds in
the aggregate mutual fund portfolio is quite low, varying between 5.30% and 8.39%, with a
mean of only 6.54%. Nevertheless, among the investors who hold index funds, the proportion of
index funds in the mutual fund portfolio is about 38%. Furthermore, there is much evidence that
our sample of brokerage records represents typical U.S. individual investors.12
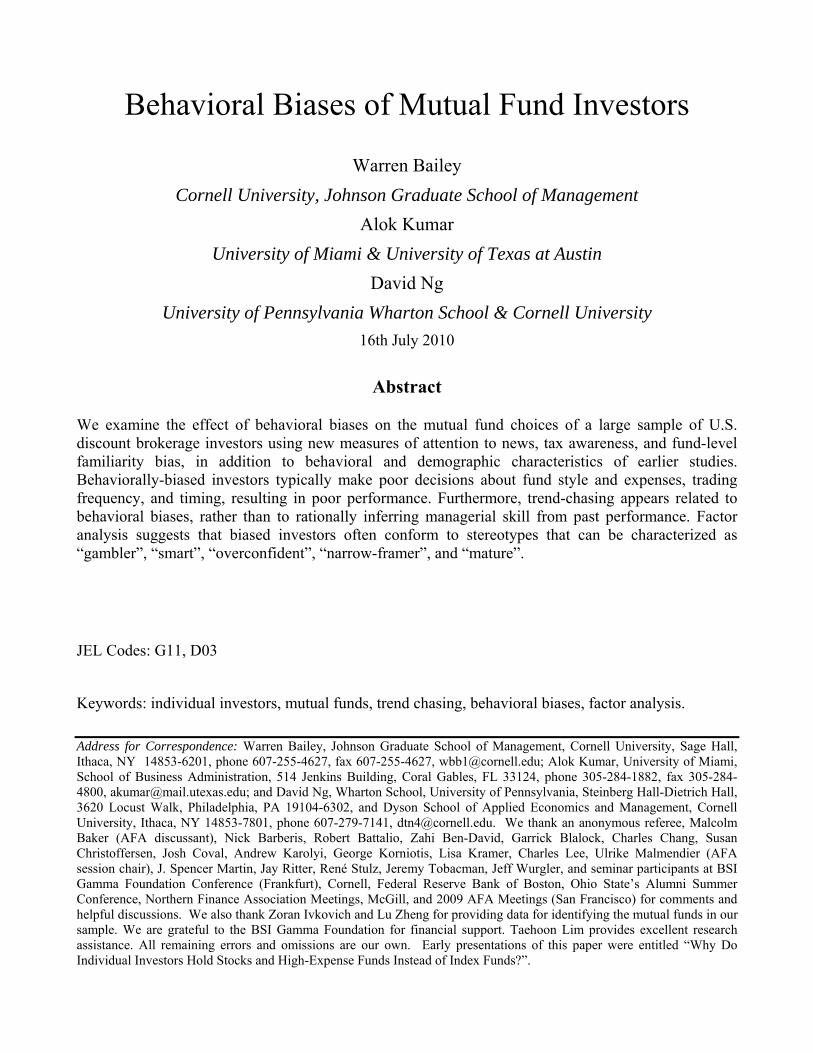
In addition to detailed descriptions of each investor characteristic variable, the Appendix
includes univariate summary statistics on those variables.13 It is interesting to note some features
of the data. For example, some of the behavioral bias proxies are skewed to the left (Disposition
Effect, Narrow Framing) while others are skewed right with large positive outliers (Lottery Stocks
11 If we include all investors, not just those who hold mutual funds, this proportion is only 13.49%. Consistent with the common industry trend, it has grown steadily from 7.63% in January 1991 to 16.58% in November 1996. About 10% of all investors hold only mutual funds in their equity portfolio while about 17% hold more than three-fourths in equity mutual funds. 12 Ivkovic, Poterba, and Weisbenner (2005) find the distribution of stock holding periods is very similar across our sample and the general population reflected in tax returns. Zhu (2005), Goetzmann and Kumar (2008), and Ivkovich, Sialm, and Weisbenner (2008) confirm that our sample closely resembles the general U.S. individual investor population. Bailey, Kumar, and Ng (2008) document similarities with the Census Bureau’s 1995 Survey of Income and Program Participation and the Fed’s Survey of Consumer Finances of 1992 and 1995. 13 These statistics are computed prior to 1% winsorizing which is employed throughout the balance of the paper.

16
Preference). The median age of our sample investors is about 50 years, median income is $87,500
per year, and median family size is 2. Almost 90% of the accounts are held by males. The average
(median) market risk-adjusted return on an investor’s portfolio of individual stocks is an
unflattering −0.378% (−0.278%) per month, and ranges from a minimum of −11.474% to a
maximum of 6.437%. The median individual stock portfolio beta is a surprisingly high 1.157.
4. Empirical Results
We begin by examining our behavioral bias and news inattention proxies in more detail
and, in particular, look for intuition from the associations among these proxies, and with other
investor characteristics. Next, we study mutual fund participation and fund selection decisions
across our sample investors. We then arrange information about these decisions by type of fund,
rather than by individuals. In these tests, we examine the fees and expenses of funds chosen by
the investors in our sample and whether there are associations with turnover, performance, and
behavioral biases. We also investigate whether investors’ trend-chasing behavior is influenced
by their behavioral biases. Further tests summarize the impact of individual investors’ mutual
fund investment decisions on portfolio performance. Last, we report the results of various
robustness checks.
4.1 Associations between Investor Characteristics
The recent behavioral finance literature has proposed a number of behavioral factors.
However, previous papers typically focus on only one behavioral factor. One of our contributions
is to examine different behavioral factors jointly, and measure how they relate to each other and to
other investor characteristics.

17
Table 2 presents correlations among the behavioral biases that we measure. A number of
statistically significant associations are evident. Disposition Effect, Narrow Framing, Weight in
Lottery Type Stocks, and Inattention to Earnings News often appear in the same individuals.
These individuals time their trades poorly, make decisions in isolation, buy speculative stocks,
and ignore firm-specific information. Although uncorrelated with Disposition Effect,
Overconfidence is significantly positively correlated with Narrow Framing, Male Dummy, and
Weight in Lottery Type Stocks, suggesting a class of particularly aggressive investors prone to
speculation. Interestingly, some correlations for Local Bias suggest a cautious investor type
(negative correlation with Overconfidence and Weight in Lottery Type Stocks). Inattention to
Macro News is negatively correlated with Inattention to Earnings News, suggesting that some
individuals invest on a top down basis and look at broad news, while ignoring firm-specific
news.
To save space, we do not report correlations among the other investor characteristics or
between the behavioral biases and the other characteristics (they are available upon request). We
summarize these correlations as follows. Many of the other investor characteristics are related in
sensible ways. For example, Age is positively correlated with Marital Status, Retired Dummy,
Investment Experience, and Stock Portfolio Size. Income is positively correlated with Family
Size, Professional Dummy, and Financial Center Dummy. The use of options or short sales is
correlated with Investment Experience and Financial Center Dummy. Financial sophistication is
evident in correlations among Investment Experience, Options Dummy, Short Sale Dummy,
Stock Portfolio Diversification, and tax minimization. A number of correlations are unexpected,
such as no association between Investment Experience and Stock Portfolio Performance and
negative association between Stock Portfolio Diversification and Stock Portfolio Performance.

18
Interestingly, high loadings of individual stock portfolios on market, size, value, and momentum
factors are associated with poor performance.
The (unreported) correlations between the behavioral bias variables and the other investor
characteristics begin to suggest links between investment decision-making biases and more
fundamental individual characteristics. For example, it is sensible that maturity and intelligence
(represented by Age, Income, Professional Dummy, and Retired dummy) are typically
uncorrelated or even negatively correlated with biases. Narrow-framing is more likely for young,
relatively low-income investors, which is consistent with the findings of Kumar and Lim (2008).
Lottery stock preference is associated with growth and value stocks (as proxied by SMB and
HML factor exposures) and poor performance. Among the biases, only Local Bias is positively
correlated with Stock Portfolio Performance, suggesting that familiarity bias is not necessarily
detrimental. As we would predict given its definition, Narrow Framing tends to be negatively
correlated with Stock Portfolio Diversification.
While it is difficult to comprehensively grasp literally hundreds of individual cross-
correlations, some hint at effective investing, some suggest cautious behavior, and many imply
that poor decision-making leads to inferior stock portfolio performance. To highlight these
associations in a more formal and dramatic manner, Table 3 presents the results of factor analysis
applied to the observed characteristics of the 21,542 investors in the database who traded
individual stocks during the sample period.
The first factor explains 21.8% of the variance of the investor characteristics. This factor
has substantial positive loadings on Disposition Effect, Narrow Framing, and, especially, Lottery
Stocks Preference. This suggests that this factor reflects investors with substantial behavioral
biases, particularly a taste for risky stocks. We label this factor ”Gambler”. Negative loadings on

19
Age, Income, Professional Dummy, Retired Dummy, Investment Experience, and Portfolio Size
suggest that Gambler is relatively young, poor, unsophisticated, and inexperienced. The negative
loading on Stock Portfolio Diversification indicates a tendency to plunge rather than spread risk.
This is consistent with models (Mitton and Vorkink, 2007; Barberis and Huang, 20008) in which
some investors take undiversified positions in skewed securities which appeal to their
preferences. The loadings on risk factors indicate an appetite for high beta stocks, small stocks,
value stocks, and trading against momentum. The negative loading on Stock Portfolio
Performance suggests that Gambler typically suffers poor performance. This is consistent with
the empirical finding in Kumar (2009) that investors with high Lottery Stocks Preference often
select small value stocks that do not perform well.
The second factor explains 18.1% of the variation of the investor characteristics. In
contrast to Gambler, this factor represents investors who seem to do everything right, and earn
good returns from individual stocks as a consequence. We label this factor “Smart”. Smart
displays negative loadings on several behavioral biases, and has high income, professional status,
and long investment experience. Smart’s large, diverse individual stock portfolio has relatively
modest loadings on market, size, value, and momentum risks, and reflects the value of December
tax-loss selling. Among the first five factors, Smart is the most likely to maintain a tax-deferred
brokerage account. This combination of good characteristics yields relatively high individual
stock portfolio performance. Interestingly, Smart is likely to use short-selling, implying
sophistication in investment tactics.
The third factor explains 15.3% of the investor characteristics and puts cumulative
variance explained above 55%. We label this factor “Overconfident” given the large positive
loading on Overconfidence Dummy (which, by construction, is consistent with the large negative

20
loading on Stock Portfolio Performance). Overconfident is typically male, inclined to Lottery
Stocks Preference, single, not retired, and inexperienced with investments. An association
between male gender and overconfident investing mirrors the findings of Barber and Odean
(2001). Overconfident’s individual stock portfolio is poorly diversified and has a large loading
on market risk. Interestingly, the use of options is associated with this ineffective decision-
maker, unlike the use of short sales which is associated with the successful Smart investor.
The fourth factor explains 12.3% of the investor characteristics. We label it “Narrow
Framer” given its particularly large loading on that bias. With significant positive loadings on
three biases, youth, and low income, poor Stock Portfolio Diversification, and weak Stock
Portfolio Performance, Narrow Framer is reminiscent of the Gambler and Overconfident
stereotypes presented previously. Similar to the findings in Kumar and Lim (2008), Narrow
Framer exhibits stronger disposition effect and hold less diversified portfolios. Narrow Framer
does seem aware of tax issues, given the negative loading on No December Tax Selling, perhaps
because he or she carefully accounts for each stock, though separately.
The fifth factor explains 10.2% of variance and, given that it is the last factor with
eigenvalue above one and puts cumulative variance explained above 75%, it is the final factor for
which we offer detailed interpretation.14 Given that this factor has a high loading on Age, Retired
Dummy, and Investment Experience, a negative loading on behavioral biases, a large, well-
diversified portfolio, and an understanding of tax-timing, we label it “Mature”. Unlike Smart,
Mature’s individual stock portfolio performance is not extraordinary, but successfully avoids the
cost of obvious biases and mistakes. Caution is also reflected in Mature’s relatively modest
loadings on market, size, value, and momentum risks. Interestingly, Mature is less likely to hold
14 Given that we use factor analysis rather than principal components, a cut-off of one for the eigenvalue is conservative. Information on the sixth through tenth factors is unreported but available on request.

21
a tax-deferred account, perhaps because such accounts must be drawn down upon approaching
retirement or are less valuable to relatively low income investors. Many of the characteristics of
Mature parallel what Korniotis and Kumar (2010) report for older investors. To reconcile
generally unbiased decision-making with mediocre performance, they suggest that aging is
associated with deterioration in cognitive skills
We recognize that the labels we have placed on the first five factors are at best
speculative. Nonetheless, the clusters of characteristics they identify across tens of thousands of
individual U.S. investors are intuitive. They validate the behavioral biases and other investor
characteristics that the empirical behavioral finance literature has developed. We will employ
these biases, and the factors we have extracted, in subsequent tests to understand how behavioral
biases affect the use of equity mutual funds.
4.2 Participation in Open End Mutual Funds: Logit Regression Estimates
Our next set of tests examines investors’ mutual fund participation decisions. We
estimate logit regressions where the dependent variable is the fund participation dummy, which
equals one for an investor who invests in mutual funds at least once during the sample period.
The main independent variables of interest are the behavioral bias proxies, inattention measures,
and tax-related interactives. The logit regression estimates are presented in the first four
specifications of Table 4. The independent variables are standardized so that coefficient
estimates can be easily compared within and across specifications.15
In specifications (1) and (2) of Table 4, we explain the mutual fund participation dummy
with behavioral bias proxies. Specification (2) also includes the control variables previously
15 To alleviate concerns about multi-collinearity, we check the variance inflation factor (VIF) for each explanatory variable.

22
described. Consistent with the presence of behavioral biases, negative slopes on disposition
effect, narrow framing, lottery stocks preference, and inattention regarding earnings news
indicate that investors who score high on these characteristics are less likely to invest in equity
mutual funds. The negative slope on the interactive term for disposition effect and no December
tax loss selling indicates that investors prone to both the disposition effect and lack of attention
to tax issues are even less likely to invest in equity mutual funds. Somewhat surprisingly, we find
that “overconfident” investors (that is, those who trade stocks more frequently, yet earn lower
returns) are more likely to invest in mutual funds. This may reflect overconfidence in their
ability to identify good funds.16
In economic terms, the logit regression estimates indicate that the propensity to invest in
mutual funds declines by 3.15% (0.126 × 25), 3.90%, 4.67%, and 0.95% when the level of
disposition effect, narrow framing, lottery preference, or inattention to earnings news increases
by one standard deviation, respectively.17 The absolute size of slope coefficients is the largest for
Lottery Stocks Preference, suggesting that the propensity to pick individual stocks is most likely
to divert investment away from sensible strategies involving mutual funds. The finding for
Lottery Stocks Preference is particularly significant as, unlike some of our other factors as
discussed in Section 2.1, it is hard to characterize this factor as anything other than behavioral or,
at best, skewness preference.
These findings are robust to the inclusion of the control variables. Moreover, the
estimated slopes on the control variables are intuitive. We find that investors who earn higher
income, work as a professional, do not live near a financial center, are sufficiently sophisticated
to use options, or who appear to value diversification in their stock portfolios are also more
16 Subsequent tests address this potentially puzzling finding. 17 Following Wooldridge (2003), we use a factor of 25% to interpret the logit regression results.

23
likely to invest in mutual funds. Those who ignore tax loss selling of their individual stocks or
load high on market, size, or value risks are less likely to hold equity mutual funds.
Specifications (3) and (4) repeat the tests described previously but for the index fund
participation dummy, which is set to one only for those investors who invest in index funds at
least once during the sample period. The decision to participate in index funds may be quite
different from the decision to participate in mutual funds generally. The evidence on behavioral
biases and index funds in specifications (3) and (4) largely echoes what we find for mutual funds
generally in specifications (1) and (2). Investors who score high on disposition effect, narrow
framing, inattention to earnings news, and disposition effect interacted with no December tax
loss selling are more likely to avoid index funds. Once again, the importance of the propensity to
trade risky individual stocks is evident: the strong aversion to mutual funds for those with
Lottery Stocks Preference is heightened for index funds. Interestingly, the association between
overconfidence and mutual fund investment disappears, perhaps indicating that overconfident
investors confine themselves to actively-managed funds.
Again, these findings are robust to the inclusion of the control variables. The estimates
of the coefficients on the control variables also suggest that older investors, higher income
investors, those with smaller stock portfolios, those who appear to value diversification, those
who are cognizant of tax issues, those who do not live near a financial center, and those who
avoid individual stocks with high loadings on market and size risks are more likely to value
index funds. Thus, the clientele of index funds differs somewhat from the clientele of other
mutual funds. However, behavioral biases appear to have a significant influence on the use of
equity mutual funds regardless of type. In the following sections, we conduct additional tests to
refine and extend these findings.

24
4.3 Extent of Fund Investment: Cross-Sectional Regression Estimates
In our third set of tests, we estimate cross-sectional regressions with portfolio weights in
mutual funds as dependent variables. Similar to the participation regressions, the independent
variables are the behavioral factors that we focus on, plus control variables. One concern in such
regressions is that the cross-correlation of individuals in decision-making may inflate the
statistical significance of our regressions. For instance, some segment of investors may select
very similar portfolios of funds and have correlated preferences for active, small cap, and
industry funds. As a result, their fund choices may be correlated.
We take the following steps to address such concerns for each of our cross-sectional
regressions. First, clustered standard errors are intended to correct for correlation of residuals
within each cluster (Petersen (2009)), though this method assumes independence across groups.18
We do not know the exact nature of any cross-sectional dependence of returns residuals.
Therefore, we try two different forms of clustered standard errors, by zip code (treating each
investor within a zip code as one observation) and by peer group (same quintile of portfolio size,
trading frequency and number of stocks).19 Second, we construct risk-adjusted returns to remove
the market-wide movement in returns that is common to all investors.
Specifications (5) and (6) of Table 4 present the regression estimates. In specification (5),
the dependent variable is the mean weight assigned to mutual funds in an investor’s equity
portfolio. The results parallel the findings from the participation regressions reported in Table 3.
Individuals who score high on the disposition effect, narrow framing, lottery stocks preference,
inattention to earnings news, or interaction between disposition effect and no tax loss selling
18 Kumar (2009) uses a similar method to account for potential cross-sectional dependence in performance across investors. 19 The results with peer group clustered standard errors are very similar. For brevity, we report the results with zip code clustered standard errors only.

25
typically put a smaller fraction of their portfolio in mutual funds, while overconfident investors
typically allocate a larger proportion of their equity portfolio to mutual funds. In economic terms,
a one standard deviation increase in narrow framing propensity is associated with a 1.94% lower
allocation to mutual funds. The estimates of other statistically significant behavioral bias proxies
are also economically significant. The estimates for the coefficients on the control variables
show that investors who have higher income, are married, do not live near a financial center,
understand short selling and diversification, have relatively small stock portfolios, understand tax
issues, and have relatively low loadings on risk factors in their stock portfolios typically hold a
higher proportion in mutual funds. Thus, similar forces drive the decision to participate in mutual
funds and the extent of that participation.
In specification (6), the dependent variable is the mean weight assigned to index funds.
The cross-sectional regression results with index fund weight reinforce the findings from the
index fund participation regressions. Investors with stronger behavioral biases typically allocate
a smaller proportion of their equity portfolio to index funds, although the effect of
overconfidence flips between specifications (5) and (6). Even though overconfident investors
allocate a slightly larger weight to mutual funds, they allocate a smaller proportion of their equity
portfolio to index funds. Thus, such investors focus more on actively-managed funds.
Interestingly, the extent to which index funds are held goes up as individual stock portfolio
performance goes down.
4.4 Behavioral Biases and Preference for Certain Types of Mutual Funds
To better understand investor preferences for different types of funds, we examine three
additional characteristics of investors’ mutual fund portfolios. Table 5, Panel A presents the

26
cross-sectional estimates. In specifications (1), (2) and (3), the dependent variable is the mean
expense ratio, the mean front-end load, and the mean fund turnover respectively for each
individual’s mutual fund portfolio. Specification (1) shows that investors with stronger
disposition effect, narrow framing, overconfidence, lottery stocks preference, inattention to
earnings news, and interaction between disposition effect and no December tax loss selling tend
to select mutual funds with higher expense ratios. Specification (2) examines front end loads and
confirms that the same set of biases that drive investors to higher expense funds is also
associated with choosing mutual funds with higher front end loads. Specification (3) shows that
individuals who are overconfident, male, have lottery stocks preference, display inattention to
earnings news, and have positive loading on measures of particularly severe disposition effect
(Disposition Effect * High Income and Disposition Effect * No December tax loss selling
interactive terms) tend to invest in funds with higher turnover.
If we assume that funds with higher expense ratios, higher front-end loads, and high
levels of turnover are poor choices, our evidence indicates that investors who demonstrate poor
decision making with individual stocks also appear to make poor decisions about mutual funds.
The slope coefficients on behavioral factors in specification (2) are particularly large, suggesting
that behavioral biases are important in driving investors into high front end load funds.
Interestingly, the slope coefficients on the control variables indicate that younger, poorer, less
experienced, and less tax-savvy investors are more likely to elect these apparently poor choices.
4.5 A Closer Look at Fund-level Local Bias and Inattention

27
Why do some investors go against common wisdom and hold high front-end load funds?
One possibility is that they are unaware of the load.20 Alternatively, some investors may be more
willing to pay a high load for funds they are familiar with. In particular, they may have more
awareness of funds headquartered in their geographic area, perhaps due to localized marketing
efforts.21 As a result, they are willing to pay high fees for such funds. To investigate this thesis,
we test whether investors with high “Fund Level Local Bias” are more likely to hold funds with
high fees and expenses. Having employed proxies for local bias and inattention to news based on
trading of individual stocks, we also investigate whether some investors concentrate their equity
mutual fund trades around news. In Table 5, Panel B we introduce our Fund-Level Local Bias
measure into the cross-sectional regression specification. This variable is distinct from
individual equity local bias in that it measures the geographical proximity between an investor’s
home and the headquarters of mutual funds held by the investor, rather than the proximity of the
headquarters of an individual listed company. We also introduce Fund-Level Inattention to the
cross sectional regressions. This variable measures each individual’s propensity to trade mutual
funds around macroeconomic news events as 1 − (Number of mutual fund trades around the
event)/(Total number of mutual fund trades).
The estimates in specifications (1), (2), and (3) show that investors with stronger fund-
level local bias tend to select mutual funds with higher expense ratios, front end loads, and
turnover, even after controlling for other behavioral biases. Indeed, Fund-Level Local Bias
emerges as the variable with the largest economic and statistical significance compared to all
other behavioral biases. Intriguingly, further correlation analysis (unreported but available upon
20 See Capon, Fitzsimons, and Prince (1996) for survey evidence that about 39% of mutual fund investors were unaware of the load charged by the funds they held. 21 Starks and Yates (2008) investigate a related familiarity-based hypothesis and find that individuals often cluster their choice of funds within the same family of funds.

28
request) shows that Fund-Level Local Bias is negatively correlated with age and positively
correlated with the Retired dummy variable and stock portfolio size. This again suggests
localized marketing efforts: older investors are typically cleverer and avoid Fund-Level Local
Bias, but retired investors with large portfolios may be subjected to recommendations or
marketing efforts from brokers, bankers, and social peers.
Thus, investors who exhibit a stronger preference to hold local funds, which may be
thought of as a “familiarity” effect, are more likely to buy funds with high fees, expenses, and
turnover. Furthermore, Fund-Level Inattention is positive and significant in two of the three
specifications, those for expense ratios and front end loads. Investors who pay less attention to
news seem to select funds that impose higher expenses and loads on themselves. These findings
suggest that behavioral biases can combine with ignorance to yield costly sub-optimal mutual
fund investment decisions.
4.6 Behavioral Biases and Trend-Chasing Behavior
Our next set of tests examines whether behavioral biases also play an important role in
explaining individual investors’ trend-chasing behavior. Many explanations have previously
been proposed for this robust pattern observed in mutual fund flow data. Chevalier and Ellison
(1997) show that agency problems induce fund managers to alter the riskiness of the fund to
maximize investment flows instead of risk-adjusted expected returns. Sirri and Tufano (1998)
and Gruber (1996) propose that investors infer managerial skill from past returns. Berk and
Green (2004) feature investors who infer managerial skill from past returns, and, therefore, chase
returns. However, fund managers facing decreasing returns to scale in their active portfolios no
longer outperform the index when more funds flow in, and, as a consequence, past performance

29
does not predict future returns. Rather than analyzing aggregate flows, our data allow us to study
the relation between behavioral tendencies and trend-chasing behavior at the individual investor-
level.
Table 6 examines trend-chasing in individual mutual fund portfolios. For each mutual
fund purchase, we compute the return prior to the purchase, which is then averaged for each
individual. Specification (1) uses one-year past returns as dependent variable while specification
(2) uses the two-year past returns. The results from both specifications show that investors with
certain behavioral biases, or inattention to macro news, tend to buy funds with more positive
recent returns. Although the disposition effect does not seem to be associated with trend-chasing,
the coefficients on the Disposition Effect * High Income and Disposition Effect * No December
tax loss selling interactive terms are strongly significantly positive. Among the coefficients on
the control variables, there is some evidence that sophisticated investors (those who are
professionals, live near a financial center, trade options, or have well-diversified, well-
performing individual stock portfolios) are less likely to engage in trend-chasing. As was found
previously (Table 5) for the propensity to select high-cost mutual funds, the size of slope
coefficients suggest that Overconfidence and Lottery Stocks Preference are among the strongest
predictors of whether a particular investor will trend-chase with mutual funds.
This evidence suggests that trend-chasing is not a rational strategy. This interpretation is
supported by the empirical results of previous authors concerning mutual fund flows and
subsequent returns on individual stocks held by the funds. Frazzini and Lamont (2008) find
relatively poor monthly returns on portfolios of individual stocks held disproportionately heavily
by mutual funds that experience high inflows over the previous six months to three years. We
find that it is more behaviorally-biased individuals who are responsible for trend-chasing inflows.

30
Thus, some of what they describe as the “dumb money” effect must be ascribed to a subset of
investors who we have also identified as making poor decisions with their individual stock
portfolios.
The disposition effect result merits further discussion. In the classic form of this bias,
investors sell well-performing individual stocks too quickly and hold poor-performing stocks too
long. Trend-chasing by individuals who invest in mutual funds is broadly contradictory to a
disposition effect in individual stocks: trend-chasers seek and then hold good performers, rather
than selling them quickly. Our disposition effect interactive terms isolate investors who display a
disposition effect that is likely to be particularly severe, and both terms earn a strongly
significantly positive slope coefficient in the regressions of Table 6. Thus, individuals who
display particularly damaging forms of the disposition effect in their individual stock portfolios
tend to contradict themselves by displaying trend-chasing in their mutual fund choices. This
implies that behavioral biases do not just vary across individuals but also across the components
within a particular investor’s portfolio, with professionally-managed assets handled in a radically
different manner than individual stocks. This may be consistent with the idea that investors
decompose their portfolios into “layers” that serve different purposes (Shefrin and Statman
(2000)).
Overall, our cross-sectional regression estimates reported in Tables 4 to 6 confirm that
investors who are more behaviorally-biased on any of several dimensions or do not pay attention
to salient news are more likely to display poor mutual fund investment decisions. They typically
have a greater proportion of their equity investment in individual stocks rather than mutual funds,
suggesting that they do not value diversification. When they buy funds, they prefer actively
managed funds to index funds, tend to buy funds with high fees and loads, and chase funds with

31
high recent returns. The strength of one of our simplest behavioral bias measures, Lottery Stocks
Preference, is particularly compelling.
The missing link in our evidence and interpretations to this point is more explicit
evidence on performance. While it appears that behavioral biases and ignoring news lead to poor
choices, we must also document the consequences for performance. For example, individual
investors typically avoid high front-end load funds (Barber, Odean, and Zheng (2005)), but some
investors may be able to discriminate between good and bad quality front-end load funds, and
enjoy superior portfolio performance from those high load funds that they do elect to hold. Thus,
our next task is to examine the performance of investors’ mutual fund portfolios.
4.7 Performance of Mutual Fund Portfolios
We again estimate cross-sectional regressions with the same behavioral proxies and
controls as explanatory variables. Table 7, Panel A studies mutual fund performance for each
investor’s actual holdings. The dependent variables are four measures of the sample period
performance of each investor’s mutual fund portfolio, the raw performance measure (mean
monthly portfolio return), the net-of-expenses performance measure (the net monthly return), the
Sharpe ratio, and the market model alpha. We again use zip code clustered standard errors to
compute the t-statistics because performance estimates are unlikely to be independent. 22
Specification (1) explains the mean monthly return. Disposition Effect, Narrow Framing,
Overconfidence, Lottery Stock Preference, and both measures of inattention to news are
associated with lower performance. For example, mean monthly return is lower by −0.041 per
month for each standard deviation of increase in narrow framing. Because the highest and
22 As before, other forms of standard error clustering yield very similar results.

32
lowest quintiles of narrow framing differ by 4.3 standard deviations, this implies a 2.12% per
year lower return for highest-quintile narrow framing investors compared to those in the lowest
quintile. Similarly, highest-quintile disposition effect investors have returns 1.34% lower than
those in the lowest quintile.23 Thus, our behavioral proxies detect poor decision-making skills
that reduce portfolio performance.
Among the control variables, investment experience is significant, and the positive slope
makes sense. The use of options or short sales is associated with better mutual fund performance,
which is consistent with those variables reflecting skill or financial sophistication. Specification
(2) examines net monthly returns and shows similar associations between behavioral biases and
performance.
Specification (3) examines the Sharpe Ratio. We again find broadly similar associations
with the behavioral bias proxies, inattention measures, and control variables. Narrow Framing,
Overconfidence, and, to a lesser extent, Disposition Effect are associated with lower
performance. Results are similar when we account for potential cross-sectional dependence in
performance induced by market-wide factors and consider a risk-adjusted performance measure
as the dependent variable (Specification (4)). Collectively, the evidence in Table 7, Panel A
shows that behavioral biases measured from individual stock selection are also associated with
lower raw and risk-adjusted returns from mutual funds. Thus, poor decision-making in one
domain appears to spill over into the performance experienced with other classes of investments.
While Table 7, Panel A describes the actual realized returns of individual investors based
on their total holdings at the end of each month, Panel B studies performance based on investor
trades under both actual and hypothetical holding periods computed using daily fund returns data
23 Given that the highest and lowest quintiles of disposition effect differ by 4.13 standard deviations, their yearly performance difference is 1.34% (−0.027% times 12 times 4.13).

33
from Morningstar. 24 Specifications (1) and (2) study actual holding period returns from trades.
They confirm that investors with higher values on most of our behavioral bias proxies and
inattention to news measures have significantly lower holding period returns and shorter holding
period, in contrast to the buy-and-hold strategies prescribed by standard portfolio theory.
Interestingly, Local Bias is associated with longer holding periods. Correlation analysis
(unreported but available upon request) indicates that Local Bias is associated with poor
diversification and mediocre performance in the individual stock portfolio, but Specification (2)
reminds us that it may also yield sensible low turnover of mutual fund holdings.
Specifications (3) and (4) adopt the alternative viewpoint of returns based on actual
trades but standardized hypothetical holding periods. Following Odean (1999) and Kumar and
Lee (2006), we calculate the subsequent k-month returns following each buy trade averaged over
the trading history of an individual and subtract the subsequent k-month returns following each
sell trade averaged over the trading history. The summary statistics on 1-month and 12-month
post-trade buy-sell return differentials show that investors who score high on most of our
behavioral and inattention proxies have lower post-trade buy-sell returns differentials. In other
words, investors with strong behavioral biases tend to time their buys and sells poorly, and
experience inferior performance relative to less-biased investors. The results are especially
significant for 12-month returns differentials.
Table 8 features interactions between investor portfolio characteristics and fund
characteristics to explain performance. Individual household mutual fund performance is
regressed on the behavioral biases and inattention measures previously employed, characteristics
of the individual’s mutual fund portfolio (the weight of the portfolio held in mutual funds, and
24 Partial sales are excluded from our calculations. Unlike Panel A, these calculations exclude any funds that were held prior to the start of our sample period.

34
the averages of the expense ratio, 12-B-1 fee, and front-end load on the funds held), interactive
terms that combine behavioral and portfolio characteristics, and (unreported) control variables.
The results confirm the negative impact of disposition effect, narrow framing,
overconfidence, lottery stocks preference, and inattention to news on performance as
documented previously. Among the mutual fund portfolio characteristics, investors with higher
weight on mutual funds tend to enjoy superior fund performance, which is consistent with classic
notions of portfolio management. Investors with higher weight on expenses, 12-B-1 marketing
fees, and front-end load funds typically experience inferior fund performance.
Among the interactive terms, we see particularly poor performance for high disposition
effect investors who select funds with high 12-B-1 marketing fees or high front-end loads. This
also appears to be the case for investors with strong framing effects or overconfidence. The
coefficients for interactives of High Inattention and fees are uniformly significantly negative.
Thus, investors with particularly high behavioral biases who choose to remain poorly informed
may make particularly poor choices, stumbling into mutual funds with high expense ratios, high
12-B-1 marketing fees, or front-end loads. This echoes the finding in Table 5 that behavioral
biases are particularly powerful in pulling investors into high front end load funds. This is also
consistent with the possibility that the mutual fund industry positions certain products to exploit
particularly biased individuals.
In unreported results, we examine the performance differences among investors who use
index funds. Interestingly, we do not find significant associations between the performance of
individual index fund portfolios and individual behavioral biases. We consider different types of
tests, including univariate sorts and multivariate regressions with and without controls or
interaction terms. All our results consistently show that behavioral biases do not affect the

35
performance of investors’ index fund portfolios. This evidence indicates that investors can
protect themselves from their own worst impulses by holding index funds and reinforces the
classic intuition that most individual investors perform better if they stick to well-diversified
index funds. Our findings also echo Kumar and Korniotis (2009) who show that the
performance difference between “smart” and “dumb” investors is insignificant when both hold
well-diversified stock portfolios, but is highly significant for those that choose concentrated
portfolios, with “smart” investors outperforming by a wide margin.25
4.8 Aggregating the Behavioral Bias Proxies and other Characteristics
Next, we measure the combined effects of investor characteristics using both the factors
constructed from the behavioral bias proxies and other investor characteristics, and an equally-
weighted index that combines the behavioral bias proxies. Panel A of Table 9 summarizes
regressions similar to those of Tables 4 to 7 but replacing the individual investor characteristics
with the first five factors resulting from factor analysis described in Section 4.1 above.
The first two columns study the first factor, which we previously labeled “Gambler”. The
evidence in the table confirms this characterization. Gambler represents individuals who are less
likely to use mutual funds, tend to select high expense funds, are more likely to trend-chase, and
suffer significantly inferior mutual fund portfolio performance as a consequence. Put another
way, Gambler employs mutual funds less than he probably should, but, when he does, he makes
poor use of them.
We previously identified the second factor as “Smart”, given that the individual stock
portfolio of this stereotype avoids biases and displays relatively good performance. The evidence
25 This supports the notion that individual investors should be encouraged to make good decisions, as with retirement savings plan (Benartzi and Thaler (2007)).

36
in Panel A of Table 9 suggests that Smart’s beneficial behavior extends to his use of mutual
funds. The signs and significance of regression coefficients indicate that the Smart stereotype is
more likely to use mutual funds, more likely to use funds with low expense ratios or loads, less
likely to trend-chase, and enjoys significantly positive mutual fund performance based on all
eight of the performance measures we examine.
We previously labeled the third factor “Overconfident” based on trading of individual
equities and other characteristics. The evidence on Overconfident’s mutual fund portfolio
confirms our impression that this stereotype is a poor decision-maker. Overconfident avoids
participation in mutual funds and trend-chases to an even greater degree than Gambler, and also
tends to select high expense, high load, and high turnover funds. Whether Overconfident’s
mutual fund performance is even worse than Gambler’s varies across our eight performance
measures.
We labeled the fourth factor “Narrow Framer”. Narrow Framer’s mutual fund
participation is about as bad as Gambler’s, though not as bad as Overconfident’s. Small holdings
of mutual funds, selection of high expense funds, trend-chasing, and consequent poor
performance are also evident, though milder than for Gambler and Overconfident.
Finally, the mutual fund use and performance represented by the fifth factor, “Mature”,
mirrors what we reported earlier for Mature’s individual stock portfolio. To Mature’s credit, he
participates and holds mutual funds to a greater extent than our other stereotypes, and avoids
high-expense funds and trend-chasing to an even greater extent than “Smart”. However, there are
other elements of Mature’s decision-making about mutual funds that yield significant negatives
on four of our eight performance measures. This finding is consistent with the evidence in
Korniotis and Kumar (2010) who show that older investors are more likely to follow common

37
investing rules, but employ them less effectively and subsequently experience worse portfolio
performance.
One interesting observation from Panel A of Table 9 concerns the use of index funds.
Unsurprisingly, Gambler, Overconfident, and Narrow Framer score negatively on both index
fund participation and holdings. Their lack of interest in these useful and prudent funds is
consistent with a pattern of bad decision-making in their use of other funds and individual stocks.
Mature seems to participate in index funds as frequently as Smart, and holds an even greater
proportion of such funds than Smart. However, this is not enough to overcome Mature’s other
decision-making problems and yield positive performance.
As an alternative to the five named factors from factor analysis, Panel B of Table 9
presents similar results based on an equally-weighted behavioral index. 26 Specifically, we
normalize each behavioral factor to have a mean of zero and a standard deviation of one, then
average these normalized behavioral proxies for each individual in the sample. The table shows
that in all cases the bias index is statistically significant and, more importantly, economically
significant. In the discussion that follows, we infer the decisions of investors in the lowest and
the highest bias quintiles.
The average behavioral bias index values of investors in the extreme bias quintiles are
−0.709 and 0.627. The standard deviation of the behavioral bias measure is 0.491, which
indicates that the low and high behavioral bias quintiles are 2.721 standard deviations away from
each other. In the participation regressions, the bias index estimates indicate that an investor who
moves from the lowest to highest bias quintile reduces the probability of investing in mutual
funds by −0.439 × 2.721 = 1.189%, while the propensity to invest in index funds drops by
26 This includes the five basic biases and the two inattention measures but excludes the two tax interactives.

38
1.933%. In the holdings regressions, we find that moving across the extreme bias quintiles
reduces the weight assigned to mutual funds by 2.038%. This effect is even stronger (5.254%)
for index funds. The other regressions summarized in Panel B of Table 9 paint a similar picture.
Behavioral biases are associated with selecting higher expense funds, trend chasing with funds,
and significant underperformance from fund holdings. In economic terms, the combined effects
of all behavioral biases are moderately to strongly significant.
5. Additional Diagnostics
In this section, we discuss additional tests that augment our main results by examining
their robustness, considering alternative explanations for our findings, and offering additional
evidence on the most biased investors.
5.1 “Play Money” Accounts?
In our first set of additional tests, we test whether our results are driven primarily by a
“play money” effect. We compute the average portfolio size-to-annual-income ratio for each
investor, excluding investors in the lowest quintile. Unreported results indicate that our findings
remain qualitatively similar even when we exclude investors who hold portfolios that are small
relative to their annual income. For example, the coefficient estimate of the bias index in Table 4,
Column (1) is −0.749 (t-statistic = −5.49) for the full-sample and −0.755 (t-statistic = −5.88) for
the sub-sample that excludes potential play money. This evidence indicates that our results are
unlikely to be induced by a subset of investors who maintain a small portfolio and trade it for
irrational or frivolous reasons.

39
5.2 Mutual Fund Decisions for Retirement Accounts
Many investors in our sample hold personal retirement accounts. About 42% of the
accounts in our sample are retirement accounts (IRA or Keogh).27 Thus, we examine whether
investors’ mutual fund choices vary between retirement and non-retirement accounts.28 29 It is
plausible that the adverse effects of behavioral biases on mutual fund decisions are mainly
concentrated in non-retirement accounts. Indeed, we may view a retirement account as the
opposite of a “play money” account, and predict that it is managed in a more conservative
manner. We define a “taxable account only” dummy, which is set to zero for investors who hold
only retirement accounts in their equity portfolios and one otherwise. We include this dummy
variable as an additional independent variable in our regression specifications.30
We find that investors do not exhibit a greater propensity to hold mutual funds in their
retirement accounts. The taxable account only dummy has an insignificant coefficient estimate
(−0.003 with z-statistic of −0.25). There is also no evidence of a stronger propensity to hold
index funds for investors who hold retirement accounts. The taxable account only dummy has a
coefficient estimate of −0.011 and z-statistic of −1.19. Even among investors who choose to hold
mutual funds, there is no evidence that they allocate a larger proportion of their equity portfolio
to mutual funds. The taxable account only dummy has statistically insignificant estimates in all
specifications.
27 Among 158,031 accounts in our sample there are 64,416 IRA and 1,299 Keogh accounts. A typical household holds multiple accounts. Out of 77,995 households in the sample, 43,706 hold at least one retirement account. 28 See Sialm and Starks (2008) for evidence that funds directed at taxable investors appear more tax-efficient than funds directed at retirement accounts. 29 Note that this approach is distinct from our use of the “holds tax deferred account” dummy in earlier regressions, which identifies all accounts, regular or tax deferred, held by someone who holds at least one tax-deferred account. 30 All results are qualitatively similar when re-estimated over two subsamples: (i) investors who hold only retirement accounts and (ii) investors who hold retirement and non-retirement accounts.

40
Examining the characteristics of funds in the portfolios of investors who hold only
retirement accounts, we find that they do not have lower expense ratios, lower front end loads, or
lower turnover. Moreover, there is a greater tendency to engage in trend-chasing among these
investors. When we re-estimate the trend chasing regressions of Table 6 with the taxable
account only dummy variable, it has a significantly positive coefficient estimate (coefficient
estimate = 0.029, t-statistic = 2.99).
To examine whether “retirement accounts only” investors exhibit better performance, we
re-estimate all the performance regressions with the taxable account dummy as an additional
independent variable. In all specifications, this dummy variable has an insignificant coefficient
estimate. Overall, we do not find evidence of superior mutual fund decisions when investors
hold retirement accounts. The adverse effects of behavioral biases on mutual fund decisions are
similar across both retirement and non-retirement accounts. Thus, behaviorally-biased investors
do not manage retirement funds any more carefully than their regular accounts.
5.3 How Do the Most Severely Biased Investors Use Mutual Funds?
Next, we consider whether the most severely behaviorally-biased investors tend to
concentrate in particular types of funds, how often they trade those funds, and what
consequences for performance result. We summarize unreported (but available on request)
evidence on holdings, holding periods, and returns for the mutual funds owned by quintiles of
investors who score highest on disposition effect, narrow framing, overconfidence, local bias,
preference for lottery stocks, and inattention to news. Our primary prediction is that severely-
biased investors are more likely to select higher expense funds, and avoid index funds. We also

41
expect the strongest Disposition Effect and Overconfidence investors to turn their mutual fund
holdings over relatively frequently.
There is much evidence to support such conjectures. For example, front load funds
comprise 27.15% of the mutual fund holdings of typical investors, but we observe statistically
significantly greater front holdings for the highest Disposition Effect (31.05%), Narrow Framing
(26.69%), and Overconfidence (30.81%) cohorts. Interestingly, the mutual fund holdings of the
highest Local Bias and Inattention Bias investors have, on average, about 2% less front load
funds than typical investors. Holding periods for front end load funds are, on average,
significantly low for highest Disposition Effect (215 days) and Overconfidence (233 days)
investors and are significantly high for highest Narrow Framing (306 days), Local Bias (323
days), and Inattention Bias (327 day) investors. Somewhat similar, but weaker, results are
observed for holdings of Back End Load funds and in comparing holdings of index funds and
other funds.
6. Summary and Conclusions
Using thousands of brokerage accounts of U.S. individual investors, we have shown that
behavioral factors influence the decisions of individual investors to hold individual stocks as
opposed to mutual funds, including passive index funds. As we might expect, investors with
higher income, relatively higher educational level, and greater investment experience are more
likely to use mutual funds and benefit from their choices. On the other hand, investors with
strong behavioral biases tend to gravitate towards individual stocks and avoid low expense index
funds. When they do invest in mutual funds, they tend to select high expense funds, trade funds
frequently, avoid index funds, and time their buys and sells poorly, thereby damaging their

42
portfolio’s performance. They also exhibit stronger trend-chasing behavior, suggesting that
trend-chasing by mutual fund investors is not the result of rationally inferring managerial skill
from past performance.
When we use factor analysis to characterize associations among investor characteristics,
we find interesting and intuitive patterns along multiple dimensions of bias and other
characteristics that often crop up in the same individual. There is consistency across the
behavioral biases, other characteristics, use of individual stocks, use of mutual funds, and
resultant performance that our Gambler, Smart, Overconfident, Narrow Framer, and Mature
stereotypes display.
Our evidence on behavioral biases and mutual fund clienteles provides a new perspective
on puzzles in mutual fund investment documented by previous authors. Several authors trace the
mutual fund decisions of individual investors to such factors as excess focus on front-end loads,
advertising, search costs, and complexity of fund features intended to exploit consumers.31 Our
evidence shows that investors who score high on behavioral biases tend to invest in funds with
higher expense ratios and loads. They experience poor investment performance as a result.
In his American Finance Association presidential address, Gruber (1996) notes several
puzzling aspects of individual portfolio allocation decisions. He speaks of “sophisticated”
investors who make decisions based on performance and “disadvantaged” investors who are
susceptible to sales pressure or constrained by tax or institutional issues. In his presidential
address, Campbell (2006) suggests that naïve investors may subsidize sophisticated investors in
financial products such as mortgages. Our results echo the spirit of these ideas. A complex set of
factors, some rational and some behavioral, appear to drive investors’ stocks versus funds
decisions and their mutual fund choices after they decide to invest in mutual funds. Some types 31 See Barber, Odean, and Zheng (2005), Hortacsu and Syverson (2004), and Carlin (2008).

43
of investors appear to make effective choices that enhance portfolio performance, while others
do not.
Given the misuse of equity mutual funds, a public campaign to increase awareness of
basic investment principles and the benefits and pitfalls of equity mutual funds is likely to help
many types of individual investors make better decisions. Furthermore, the lack of attention to
low cost or index funds suggests more explicit disclosure of fund expenses and turnover, perhaps
even as prominent as the health warnings now displayed on packets of cigarettes. Finally, the
reliance of mutual fund investors on broker-supplied information at the time a fund is selected
and on delegated investment decisions afterwards suggests that even more explicit disclosure of
fund characteristics be imposed on brokerage firms and fund managers.

44
REFERENCES
Bailey, Warren, Alok Kumar, and David Ng, 2008, Foreign Investments of U.S. Individual
Investors: Causes and Consequences, Management Science 54, 443-459.
Barber, Brad M., and Terrance Odean, 2000, Trading is Hazardous to your Wealth: The
Common Stock Investment Performance of Individual Investors, Journal of Finance 55,
773-806.
Barber, Brad M., and Terrance Odean, 2001, Boys will be Boys: Gender, Over-confidence, and
Common Stock Investment, Quarterly Journal of Economics 116, 261-292.
Barber, Brad M. and Terrance Odean, 2008, All That Glitters: The Effect of Attention and News
on the Buying Behavior of Individual and Institutional Investors, Review of Financial
Studies 21, 785 – 818.
Barber, Brad M., Terrance Odean, and Lu Zheng, 2005, Out of Sight, Out of Mind: The Effects
of Expenses on Mutual Fund Flows, Journal of Business 78, 2095-2120.
Barberis, Nicholas, and Ming Huang, 2008, Stocks as Lotteries: The Implications of Probability
Weighting for Security Prices, American Economic Review 98, 2066-2100.
Benartzi, Shlomo and Richard H. Thaler, 2007, Heuristics and Biases in Retirement Savings
Behavior, Journal of Economic Perspectives 21, 81-104.
Bergstresser, Daniel, John Chalmers and Peter Tufano, 2009, Assessing the Costs and Benefits
of Brokers in the Mutual Fund Industry, Review of Financial Studies 22, 4129-4156.
Berk, Jonathan, and Richard Green, 2004, Mutual Fund Flows and Performance in Rational
Markets, Journal of Political Economy 112, 1269-1295.
Campbell, John Y., 2006, Household Finance, Journal of Finance 61, 1553-1604.

45
Capon, Noel, Gavan J. Fitzsimons, and Russ A. Prince, 1996, An Individual Level Analysis of
the Mutual Fund Investment Decision, Journal of Financial Services Research 10, 59-82.
Carlin, Bruce Ian, 2008, Strategic Price Complexity in Retail Financial Markets, Journal of
Financial Economics, 91, 278-287.
Chevalier, Judith, and Glenn Ellison, 1997, Risk Taking by Mutual Funds as a Response to
Incentives, Journal of Political Economy 105, 1167-1200.
Choi, James, David Laibson, and Brigitte Madrian, 2009, Why does the Law of One Price Fail?
An Experiment on Index Mutual Funds, Review of Financial Studies, Forthcoming.
Christoffersen, Susan, and David Musto, 2002, Demand Curves and the Pricing of Money
Management, Review of Financial Studies 15, 1499-1524.
Christoffersen, Susan, and Sergei Sarkissian, 2009, City Size and Fund Performance, Journal of
Financial Economics, 92, 252-275.
Christoffersen, Susan, Richard Evans, and David Musto, 2006, The Economics of Mutual Fund
Brokerage: Evidence from Cross Section of Investment Channels, Working Paper,
Wharton School.
Coval, Joshua D., David A. Hirshleifer, and Tyler Shumway, 2005, Can Individual Investors
Beat the Market? Working Paper (September), Harvard Business School.
Coval, Joshua D., and Tobias Moskowitz, 1999, Home Bias at Home: Local Equity Preference in
Domestic Portfolio, Journal of Finance 54, 2045-2073.
Coval, Joshua D., and Tobias Moskowitz, 2001, The Geography of Investments: Informed
Trading and Asset pricies, Journal of Political Economy 109, 811-841.
Coval, Joshua, and Erik Stafford, 2007, Asset Fire Sales (and Purchases) in Equity Markets,
Journal of Financial Economics 86, 479-512.

46
Del Guercio, Diane, and Paula Tkac, 2008, Star Power: The Effect of Morningstar Ratings on
Mutual Fund Flows, Journal of Financial and Quantitative Analysis 43, 907-936.
Elton, Edwin J., Gruber, Martin J., and Jeffrey A. Busse, 2004, Are Investors Rational? Choices
Among Index Funds, Journal of Finance 59, 261-288.
Frazzini, Andrea, and Owen Lamont, 2008, Dumb Money: Mutual Fund Flows and the Cross-
Section of Stock Returns, Journal of Financial Economics 88, 299-322.
French, Kenneth R., 2008, The Cost of Active Investing, Journal of Finance 63, 1537-1574.
Gil-Bazo, Javier, and Pablo Ruiz-Verdu, 2009, The Relations between Price and Performance in
the Mutual Fund Industry, Journal of Finance 64, 2153-2184.
Goetzmann, William N. and Alok Kumar, 2008, Equity Portfolio Diversification, Review of
Finance 12,433-463.
Graham, John, and Alok Kumar, 2006, Do Dividend Clienteles Exist? Evidence on Dividend
Preferences of Retail Investors, Journal of Finance 61, 1305-1336.
Grinblatt, Mark, and Matti Keloharju, 2001, How Distance, Language, and Culture Influence
Stockholdings and Trade, Journal of Finance 56, 1053-1073.
Gruber, Martin, 1996, Another Puzzle: The Growth in Actively Managed Mutual Funds, Journal
of Finance 51, 783-810.
Hortacsu, Ali, and Chad Syverson, 2004, Product Differentiation, Search Costs, and Competition
in the Mutual Fund Industry: A Case Study of S&P 500 Index Funds, Quarterly Journal
of Economics 119, 457-488.
Huang, Jennifer, Wei, Kelsey D., and Hong Yan, 2007, Participation Costs and the Sensitivity of
Fund Flows to Past Performance, Journal of Finance 63, 1273-1311.
Huberman, Gur, 2001, Familiarity Breeds Investment, Review of Financial Studies 14, 659-680.

47
Ivkovich, Zoran, James Poterba, and Scott Weisbenner, 2005, Tax-Motivated Trading by
Individual Investors, American Economic Review 95, 1605-1630.
Ivkovich, Zoran, Clemens Sialm, and Scott Weisbenner, 2008, Portfolio Concentration and the
Performance of Individual Investors, Journal of Financial and Quantitative Analysis 43,
613-656.
Ivkovich, Zoran, and Scott Weisbenner, 2005, Local Does as Local Is: Information Content of
the Geography of Individual Investors’ Common Stock Investments, Journal of Finance
60, 267-306.
Ivkovich, Zoran, and Scott Weisbenner, 2009, Individual Investor Mutual Fund Flows, Journal
of Financial Economics 92, 223-237.
Kahneman, Daniel, 2003, Maps of Bounded Rationality: Psychology for Behavioral Economics,
American Economic Review 93, 1449-1475.
Kahneman, Daniel, and Dan Lovallo, 1993, Timid Choices and Bold Forecasts: A Cognitive
Perspective on Risk Taking, Management Science 39, 17-31.
Keswani, Aneel, and David Stolin, 2008, Which Money is Smart? Mutual Fund Buys and Sells
of Individual and Institutional Investors, Journal of Finance 63, 85 -118.
Kennickell, Arthur B., and Martha Starr-McCluer, 1994, Changes in Family Finances from 1989
to 1992: Evidence from the Survey of Consumer Finances, Federal Reserve Bulletin,
861-882.
Khorana, Ajay, Henri Servaes, and Peter Tufano, 2009, Mutual Fund Fees Around the World,
Review of Financial Studies 22, 1279-1310.
Korniotis, George M. and Alok Kumar, 2009, Do Portfolio Distortions Reflect Superior
Information or Psychological Biases?, Working Paper, University of Texas at Austin.

48
Korniotis, George M. and Alok Kumar, 2010, Do Older Investors Make Better Investment
Decisions?, forthcoming, Review of Economics and Statistics.
Kumar, Alok, 2009, Who Gambles in the Stock Market?, Journal of Finance 64, 1889-1933.
Kumar, Alok and Charles Lee, 2006, Retail Investor Sentiment and Return Comovements,
Journal of Finance 61, 2451-2486.
Kumar, Alok and Sonya S. Lim, 2008, How do Decision Frames Influence the Stock Investment
Choices of Individual Investors?, Management Science 54, 1052-1064.
Malloy, Christopher, and Ning Zhu, 2004, Mutual Fund Choices and Investor Demographics,
Working Paper (March), University of California at Davis.
Merton, Robert C., 1987, A Simple Model of Capital Market Equilibrium with Incomplete
Information, Journal of Finance 42, 483-510.
Mitton, Todd, and Keith Vorkink, 2007, Equilibrium Underdiversification and the Preference for
Skewness, Review of Financial Studies 20, 1255-1288.
Nanda, Vikram, Wang, Z. Jay, and Lu Zheng, 2009, The ABCs of Mutual Funds: On the
Introduction of Multiple Class Shares, Journal of Financial Intermediation 18, 329-361.
Odean, Terrance, 1998, Are Investors Reluctant to Realize Their Losses?, Journal of Finance 53,
1775-1798.
Odean, Terrance, 1999, Do Investors Trade Too Much?, American Economic Review 89, 1279-
1298.
Petersen, Mitchell A., 2009, Estimating Standard Errors in Finance Panel Data Sets: Comparing
Approaches, Review of Financial Studies 22, 435-480.
Sapp, Travis, and Ashish Tiwari, 2004, Does Stock Return Momentum Explain the ‘Smart
Money’ Effect?, Journal of Finance 59, 2605-2622.

49
Sensoy, Berk, 2009, Performance Evaluation and Self Designated Benchmark Indexes in the
Mutual Fund Industry, Journal of Financial Economics 92, 25-39.
Sialm, Clemens, and Laura Starks, 2008, Mutual Fund Tax Clienteles, Working Paper (October),
University of Texas at Austin.
Sirri, Erik, and Peter Tufano, 1998, Costly Search and Mutual Fund Flows, Journal of Finance
53, 1589-1622.
Shefrin, Hersh and Meir Statman, 2000, Behavioral Portfolio Theory, Journal of Financial and
Quantitative Analysis 35, 127-151.
Shefrin, Hersh and Meir Statman, 1985, The Disposition to Sell Winners Too Early and Rise
Losers Too Long, Journal of Finance 40, 777-790
Starks, Laura T., and Michael Yates, 2008, Reputation and Mutual Fund Choice, Working Paper
(June), University of Texas at Austin.
Statman, Meir, 2002, Lottery Players/Stock Traders, Financial Analysts Journal 58, 14-21.
Van Nieuwerburgh, Stijn and Laura Veldkamp, 2010, Information Acquisition and Under-
Diversification, Review of Economic Studies, Forthcoming.
Zheng, Lu, 1999, Is Money Smart? A Study of Mutual Fund Investor’s Fund Selection Ability,
Journal of Finance 54, 901-932.
Zhu, Ning, 2003, The Local Bias of Individual Investors, Working Paper (March), University of
California at Davis.
Zhu, Ning, 2005, Search Costs and Household Choice between Direct and Delegated Portfolio
Management, Working Paper (October), University of California at Davis.

50
APPENDIX
Panel A: Brief Description of Behavioral Proxies and Other Investor Characteristics Variable Description References Calculation Disposition Effect Investor’s propensity to sell
winners too early and hold losers too long. It is measured by the proportion of gains realized minus proportion of losses realized, adjusted for the peer group’s disposition effect.
Shefrin and Statman (1985), Odean (1998), Kumar and Lim (2008).
Proportion of gains realized (PGR) = realized gains/(realized gains + paper gains) Proportion of losses realized (PLR) = realized losses/(realized losses + paper losses) A peer group of an investor is defined as those in the same quintile of portfolio size, trading frequency and number of stocks. Adjusted PGR = PGR of an investor – Mean PGR of peer group. Adjusted PLR = PLR of an investor – mean PLR in her peer group. Adjusted disposition effect = Adjusted PGR – Adjusted PLR.
Narrow Framing Investor’s propensity to select investments individually rather than considering the broad impact on her portfolio. It is measured by the degree of trade clustering, adjusted for the peer group’s framing propensity.
Kahneman and Lovallo (1993), Kahneman (2003), Kumar and Lim (2008).
Trade clustering = 1 – (number of trades/number of trading days). A peer group of an investor is defined as those in the same quintile of portfolio size, trading frequency, and number of stocks. Adjusted trade clustering = Trade clustering – Mean trade clustering of the peer group.
Overconfidence Investor’s propensity to trade frequently but unsuccessfully. It is measured with a dummy variable.
Odean (1999), Barber and Odean (2001).
Overconfidence dummy variable = 1 for investors in the highest portfolio turnover quintile and lowest performance quintile for their individual common stock trading; 0 otherwise. Overconfidence is also captured by a gender dummy variable = 1 if the investor is male.
Local Bias Investor’s propensity to select stocks with headquarters close to his geographical location.
Huberman (2001), Coval and Moskowitz (1999), Grinblatt and Keloharju (2001), Zhu (2003), Ivkovich and Weisbenner (2005).
Local bias of an investor’s common stock portfolio = Mean distance between her home zip code and the headquarters’ zip codes of companies in her portfolio – Mean distance between home zip code and the headquarters’ zip codes of companies in the market portfolio.
Lottery Stock Preference
Investor’s propensity to select stocks with lottery like features (low price, volatile and skewed returns).
Barberis and Huang (2008), Kumar (2009).
Investor’s mean portfolio weight (relative to the weight in the market portfolio) assigned to stocks that have bottom quintile prices, top quintile idiosyncratic volatility, and top quintile idiosyncratic skewness.

51
Inattention to Earnings News
Degree to which investor does not trade a particular individual stock around earnings news.
New in this paper. 1 – (Number of investor trades around the event)/(Total number of investor trades) on days t–1, t, and t+1 where t is the date of quarterly earnings announcement from I/B/E/S. Only trades around each firm’s own earnings news are considered.
Inattention to Macroeconomic News
Degree to which investor does not trade any individual stocks around macroeconomic news events.
New in this paper. 1 – (Number of investor trades around the event)/(Total number of investor trades) on days t–1, t, and t+1 where t is the date of Fed Funds target rate changes, Non Farm Payroll reports, and Producer Price Index announcements.
Fund Level Local Bias
Investor’s propensity to select funds with headquarters close to his geographical location.
New in this paper. Fund-level local bias = Mean distance between the investor’s home zip code and the headquarters of the mutual funds in his portfolio – the same mean distance averaged across all investors in the sample.
Fund Level Inattention
Individual’s propensity to trade mutual funds around macroeconomic news events.
New in this paper 1 - (Number of mutual fund trades around the event)/(Total number of mutual fund trades)
DE * No Dec Tax Loss Selling
Extent of Disposition Effect for investor who ignores tax loss selling.
New in this paper. Disposition Effect times dummy variable equal to 1 for investor with no December tax loss selling.
DE * High Income
Extent of Disposition Effect for investor with high income.
New in this paper. Disposition Effect times High Income dummy
Age Age of the investor. Self-reported. Age of the investor. Income Income of the investor. Self-reported. Annual income of investor. High Income Dummy
Affluence of the household Graham and Kumar (2006)
High Income dummy = 1 if the investor’s average income exceeds $125,000, zero otherwise
Marital Status Marital status of the investor. Self-reported. Marital status dummy = 1 if the investor is married, and 0 otherwise.
Family Size Family size. Self-reported. Number of family members in the household.
Professional Dummy
A indicator whether an investor is a white collar or blue collar worker.
Self-reported. Professional dummy = 0 for investor in a blue collar profession, 1 otherwise
Retired Dummy Retirement status of investor. Self-reported. Retired dummy = 1 if the investor is retired, 0 otherwise.
Investment Experience
Investment experience of investor.
Self-reported. Years since the brokerage account was open
Financial Center Dummy
An indicator whether an investor lives near a financial center.
Based on self-reported address.
Financial center dummy = 1 if the zip code of the investor’s address is close to a metropolitan area, and zero otherwise.

52
Options Dummy An indicator for whether the investor has ever traded an option in the investment account.
Based on investment record.
Options Dummy = 1 if the investor executes at least one option trade during the sample period, zero otherwise.
Short Sale Dummy An indicator for whether the investor has ever shorted a stock in the investment account.
Based on investment record.
Short Sale Dummy = 1 if the investor executes at least one short trade during the sample period.
Stock Portfolio Diversification
The extent to which the stock portfolio of the investor is diversified.
Based on investment record.
Negative of Normalized Portfolio Variance, i.e. variance of the portfolio of individual domestic securities divided by the average variance of the individual common stocks in the portfolio.
Stock Portfolio Size
The size of the investor’s portfolio.
Based on investment record.
Sample-period average market capitalization of the investor’s common stock portfolio.
Stock Portfolio Performance
Risk-adjusted excess returns of the investor’s stock portfolios.
Based on investment record.
The intercept, “alpha”, from the CAPM regression with the monthly common stock portfolio return as dependent variable.
No December Tax Loss Selling
An indicator if the investor fails to realized losses of his stock trade in December
Based on investment record.
1– Proportion of realized losses in December = 1 – (Realized losses in December/Number of paper losses)
Holds Tax-Deferred Account
An indicator for whether the investor holds a tax deferred account in the brokerage.
Based on investment record.
Holds Tax Deferred Account Dummy = 1 if the investor holds an IRA or Keogh account in the brokerage.
Stock Portfolio Market Factor (Beta) exposure
The beta of the investor’s stock portfolio.
Based on investment record.
The loading of the stock portfolio on the market (RMRF) factor in a four-factor regression model with market, size, value, and momentum factors. All four factors come from Ken French’s website.
Stock Portfolio SMB Factor (Size) exposure
The loading of the stock portfolio on the small-minus-big factor in a four-factor model regression.
Based on investment record.
The loading of the stock portfolio on the size (SMB) factor in a four-factor regression model with market, size, value, and momentum factors. All four factors come from Ken French’s website.
Stock Portfolio HML Factor (Value) exposure
The loading of the stock portfolio on the high-minus-low book-to-market factor in a four-factor model regression.
Based on investment record.
The loading of the stock portfolio on the value (HML) factor in a four-factor regression model with market, size, value, and momentum factors. All four factors come from Ken French’s website.
Stock Portfolio UMD Factor (Momentum) exposure
The loading of the stock portfolio on the up-minus-down factor in a four-factor model regression.
Based on investment record.
The loading of the stock portfolio on the momentum (UMB) factor in a four-factor regression model with market, size, value, and momentum factors. All four factors come from Ken French’s website.
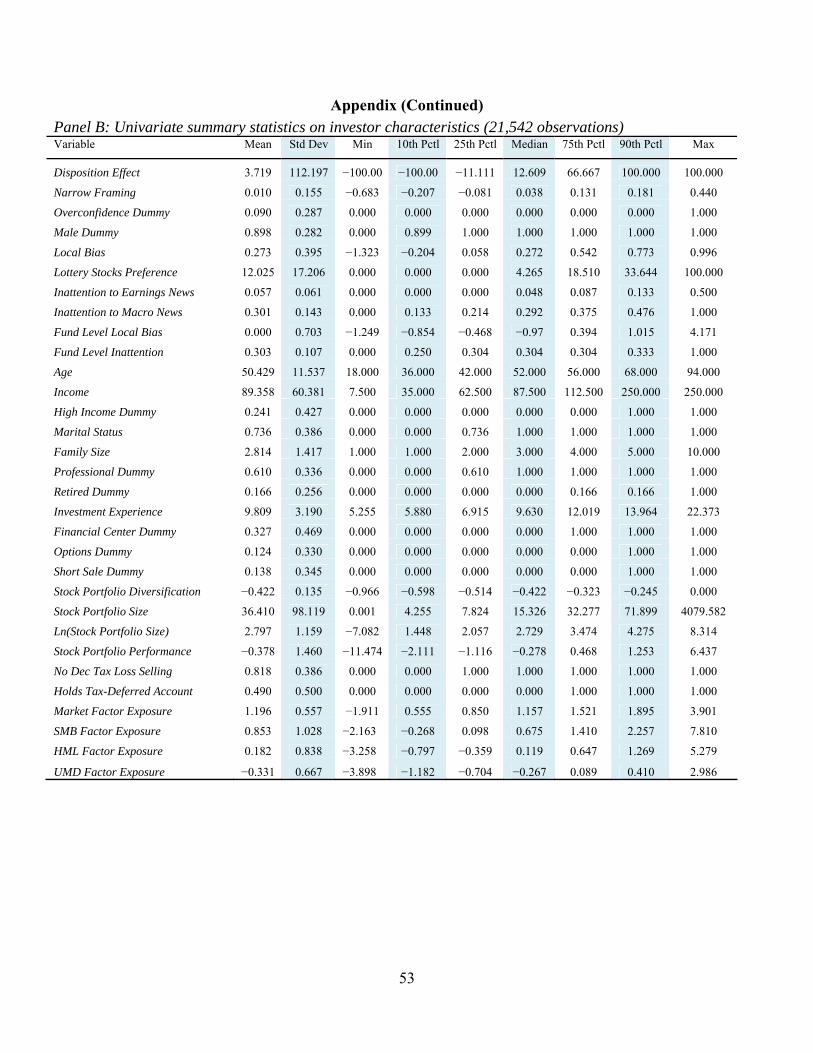
53
Appendix (Continued) Panel B: Univariate summary statistics on investor characteristics (21,542 observations) Variable Mean Std Dev Min 10th Pctl 25th Pctl Median 75th Pctl 90th Pctl Max
Disposition Effect 3.719 112.197 −100.00 −100.00 −11.111 12.609 66.667 100.000 100.000
Narrow Framing 0.010 0.155 −0.683 −0.207 −0.081 0.038 0.131 0.181 0.440
Overconfidence Dummy 0.090 0.287 0.000 0.000 0.000 0.000 0.000 0.000 1.000
Male Dummy 0.898 0.282 0.000 0.899 1.000 1.000 1.000 1.000 1.000
Local Bias 0.273 0.395 −1.323 −0.204 0.058 0.272 0.542 0.773 0.996
Lottery Stocks Preference 12.025 17.206 0.000 0.000 0.000 4.265 18.510 33.644 100.000
Inattention to Earnings News 0.057 0.061 0.000 0.000 0.000 0.048 0.087 0.133 0.500
Inattention to Macro News 0.301 0.143 0.000 0.133 0.214 0.292 0.375 0.476 1.000
Fund Level Local Bias 0.000 0.703 −1.249 −0.854 −0.468 −0.97 0.394 1.015 4.171
Fund Level Inattention 0.303 0.107 0.000 0.250 0.304 0.304 0.304 0.333 1.000
Age 50.429 11.537 18.000 36.000 42.000 52.000 56.000 68.000 94.000
Income 89.358 60.381 7.500 35.000 62.500 87.500 112.500 250.000 250.000
High Income Dummy 0.241 0.427 0.000 0.000 0.000 0.000 0.000 1.000 1.000
Marital Status 0.736 0.386 0.000 0.000 0.736 1.000 1.000 1.000 1.000
Family Size 2.814 1.417 1.000 1.000 2.000 3.000 4.000 5.000 10.000
Professional Dummy 0.610 0.336 0.000 0.000 0.610 1.000 1.000 1.000 1.000
Retired Dummy 0.166 0.256 0.000 0.000 0.000 0.000 0.166 0.166 1.000
Investment Experience 9.809 3.190 5.255 5.880 6.915 9.630 12.019 13.964 22.373
Financial Center Dummy 0.327 0.469 0.000 0.000 0.000 0.000 1.000 1.000 1.000
Options Dummy 0.124 0.330 0.000 0.000 0.000 0.000 0.000 1.000 1.000
Short Sale Dummy 0.138 0.345 0.000 0.000 0.000 0.000 0.000 1.000 1.000
Stock Portfolio Diversification −0.422 0.135 −0.966 −0.598 −0.514 −0.422 −0.323 −0.245 0.000
Stock Portfolio Size 36.410 98.119 0.001 4.255 7.824 15.326 32.277 71.899 4079.582
Ln(Stock Portfolio Size) 2.797 1.159 −7.082 1.448 2.057 2.729 3.474 4.275 8.314
Stock Portfolio Performance −0.378 1.460 −11.474 −2.111 −1.116 −0.278 0.468 1.253 6.437
No Dec Tax Loss Selling 0.818 0.386 0.000 0.000 1.000 1.000 1.000 1.000 1.000
Holds Tax-Deferred Account 0.490 0.500 0.000 0.000 0.000 0.000 1.000 1.000 1.000
Market Factor Exposure 1.196 0.557 −1.911 0.555 0.850 1.157 1.521 1.895 3.901
SMB Factor Exposure 0.853 1.028 −2.163 −0.268 0.098 0.675 1.410 2.257 7.810
HML Factor Exposure 0.182 0.838 −3.258 −0.797 −0.359 0.119 0.647 1.269 5.279
UMD Factor Exposure −0.331 0.667 −3.898 −1.182 −0.704 −0.267 0.089 0.410 2.986
54
Table 1: Summary Statistics on Mutual Fund Investments of Individual Investors
This table summarizes the stock and mutual fund investment activities of our sample individual investors. The individual investor data are from a large U.S. discount brokerage house for the 1991 to 1996 period. The median numbers are indicated in parentheses. We identified a total of 136 index funds that were available to our sample of investors during this time period. The CRSP universe of individual stocks available during this time period is about 12,000. Statistic Equity Funds Index Funds Stocks
Number of Assets 1,492 33 10,877 Sample-Period Trades Number of Investors With Trades 32,122 5,594 62,387 Number of Buys 405,376 (67.03%) 15,354 (73.66%) 1,015,735 (54.76%) Number of Sells 199,365 (32.97%) 5,491 (26.34%) 839,041 (45.24%) Mean (Median) Number of Trades 19 (6) 4 (2) 30 (11) Mean Buy Trade Quantity 2,787 470 634 Mean Buy Trade Size $9,929 $6,879 $11,251 Mean Sell Trade Quantity 4,226 964 694 Mean Sell Trade Size $15,744 $13,244 $13,684 End-of-Month Positions Number of Investors With Positions 29,381 4,432 59,387 Mean (Median) Portfolio Size $39,986 ($12,827) $13,659 ($5,200) $35,629 ($13,869) Mean (Median) Number of Assets 3.51 (2) 1.37 (1) 3.89 (3)
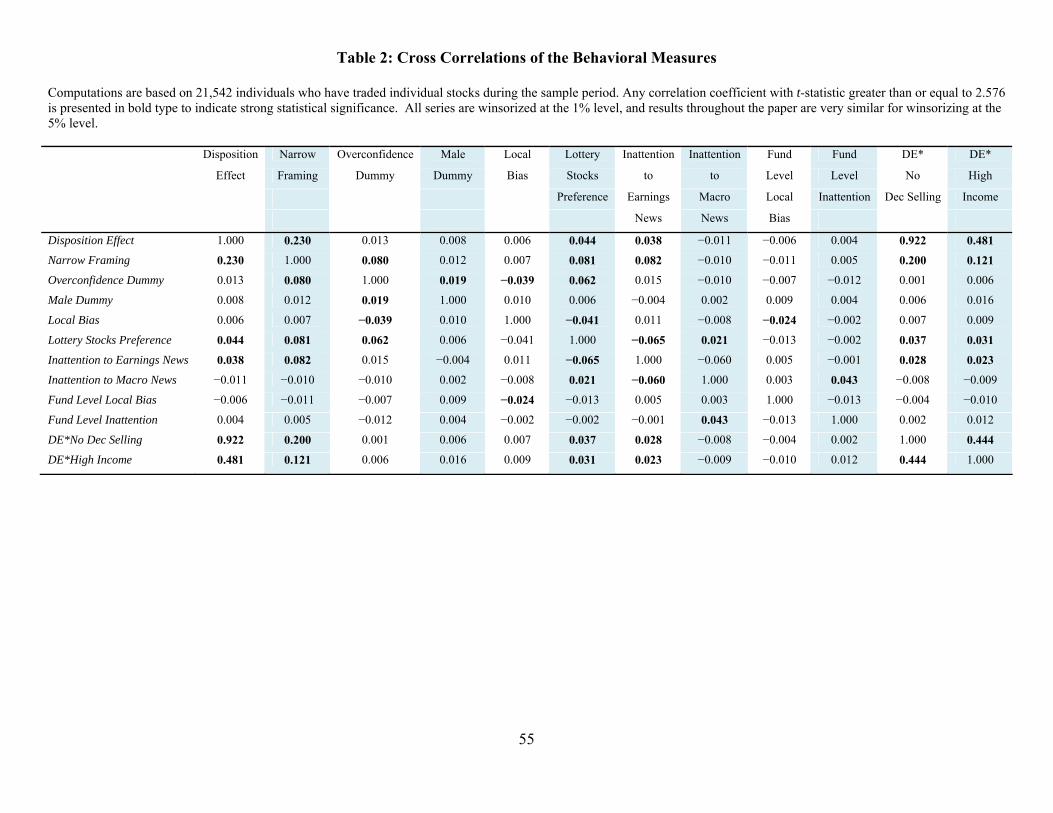
55
Table 2: Cross Correlations of the Behavioral Measures Computations are based on 21,542 individuals who have traded individual stocks during the sample period. Any correlation coefficient with t-statistic greater than or equal to 2.576 is presented in bold type to indicate strong statistical significance. All series are winsorized at the 1% level, and results throughout the paper are very similar for winsorizing at the 5% level.
Disposition Narrow Overconfidence Male Local Lottery Inattention Inattention Fund Fund DE* DE*
Effect Framing Dummy Dummy Bias Stocks to to Level Level No High
Preference Earnings Macro Local Inattention Dec Selling Income
News News Bias Disposition Effect 1.000 0.230 0.013 0.008 0.006 0.044 0.038 −0.011 −0.006 0.004 0.922 0.481 Narrow Framing 0.230 1.000 0.080 0.012 0.007 0.081 0.082 −0.010 −0.011 0.005 0.200 0.121
Overconfidence Dummy 0.013 0.080 1.000 0.019 −0.039 0.062 0.015 −0.010 −0.007 −0.012 0.001 0.006
Male Dummy 0.008 0.012 0.019 1.000 0.010 0.006 −0.004 0.002 0.009 0.004 0.006 0.016
Local Bias 0.006 0.007 −0.039 0.010 1.000 −0.041 0.011 −0.008 −0.024 −0.002 0.007 0.009
Lottery Stocks Preference 0.044 0.081 0.062 0.006 −0.041 1.000 −0.065 0.021 −0.013 −0.002 0.037 0.031
Inattention to Earnings News 0.038 0.082 0.015 −0.004 0.011 −0.065 1.000 −0.060 0.005 −0.001 0.028 0.023
Inattention to Macro News −0.011 −0.010 −0.010 0.002 −0.008 0.021 −0.060 1.000 0.003 0.043 −0.008 −0.009
Fund Level Local Bias −0.006 −0.011 −0.007 0.009 −0.024 −0.013 0.005 0.003 1.000 −0.013 −0.004 −0.010
Fund Level Inattention 0.004 0.005 −0.012 0.004 −0.002 −0.002 −0.001 0.043 −0.013 1.000 0.002 0.012
DE*No Dec Selling 0.922 0.200 0.001 0.006 0.007 0.037 0.028 −0.008 −0.004 0.002 1.000 0.444
DE*High Income 0.481 0.121 0.006 0.016 0.009 0.031 0.023 −0.009 −0.010 0.012 0.444 1.000

56
Table 3: Factor Analysis for the Behavioral Measures and Other Investor Characteristics
Computations are based on 21,542 individuals who have traded individual stocks during the sample period. The “varimax” method is run for ten factors but only the first five are reported given variance explained. Factors Variables Gambler Smart Overconfident Narrow
Framer Mature
Factor Characteristics Eigenvalue 2.288 1.894 1.607 1.286 1.071 Variance Explained 0.218 0.181 0.153 0.123 0.102 Cumulative Variance Explained
0.218 0.399 0.552 0.675 0.777
Factor Loadings Disposition Effect 0.189 −0.213 0.055 0.253 −0.302 Narrow Framing 0.216 −0.101 0.095 0.588 −0.221 Overconfidence Dummy 0.055 −0.058 0.472 0.090 −0.232 Male Dummy 0.021 0.004 0.202 −0.001 −0.013 Local Bias −0.044 −0.206 −0.02 0.005 −0.02 Lottery Stocks Preference 0.563 −0.202 0.143 −0.011 −0.243 Inattention to Earnings News −0.058 −0.011 0.090 0.196 −0.013 Inattention to Macro News 0.029 −0.007 −0.052 −0.011 −0.008 Fund Level Local Bias −0.02 −0.033 0.000 0.032 −0.016 Fund Level Inattention 0.005 −0.017 0.001 −0.004 −0.010 DE* No Dec Selling 0.023 −0.028 0.028 0.015 −0.015 DE* High Income 0.028 −0.027 0.037 0.022 −0.019 Age −0.335 0.067 −0.026 −0.202 0.458 Income −0.404 0.020 −0.005 −0.167 −0.126 High Income −0.027 0.196 −0.010 0.004 −0.085 Marital Status −0.032 −0.033 −0.255 −0.001 0.054 Family Size 0.008 −0.04 −0.023 −0.001 −0.104 Professional Dummy −0.155 0.332 −0.002 0.000 −0.589 Retired Dummy −0.342 0.055 −0.331 0.008 0.890 Investment Experience −0.333 0.509 −0.221 −0.015 0.292 Financial Center Dummy 0.045 0.005 0.032 −0.007 −0.059 Options Dummy 0.066 0.094 0.301 0.010 −0.029 Short Sale Dummy 0.014 0.332 0.014 0.012 −0.011 Stock Portfolio Diversif. −0.323 0.723 −0.333 −0.41 0.403 Stock Portfolio Size −0.202 0.407 0.080 −0.303 0.552 Stock Portfolio Performance −0.454 0.354 −0.828 −0.236 −0.020 No Dec Tax Loss Selling 0.006 −0.498 0.088 −0.398 −0.311 Holds Tax-Deferred Account −0.004 0.202 0.027 −0.005 −0.311 Market Factor Exposure 0.471 0.091 0.556 0.220 −0.046 SMB Factor Exposure 0.806 0.125 0.150 −0.023 −0.044 HML Factor Exposure 0.594 0.121 0.213 −0.110 0.059 UMD Factor Exposure −0.555 0.087 −0.045 −0.072 0.010

57
Table 4: Investor Characteristics and Mutual Fund Participation Decisions and Stock versus Funds Allocation
The first four specifications in the table are logit regressions. In specifications (1) and (2), the dependent variable is one for investors who hold or trade mutual funds at least once during the sample period. In specifications (3) and (4), the dependent variable in the logit regression is one for investors who hold or trade index funds at least once during the sample period. Specifications (5) and (6) are cross-sectional regression estimates, where the proportion of mutual funds in the equity portfolio is the dependent variable. In specification (5), the dependent variable is the mean weight of mutual funds in the total equity (stocks and mutual funds) portfolio. In specification (6), the dependent variable is the mean weight of index funds only. The dependent variable is multiplied by 100. Independent variables are defined in the Appendix, and a constant term is included. They are standardized so coefficients can be compared within or across specifications. There is one observation per investor. An intercept is included but not reported. Robust zip code clustered standard errors are used to obtain the t-statistics. The individual investor data are from a large U.S. discount brokerage house for the 1991 to 1996 period.
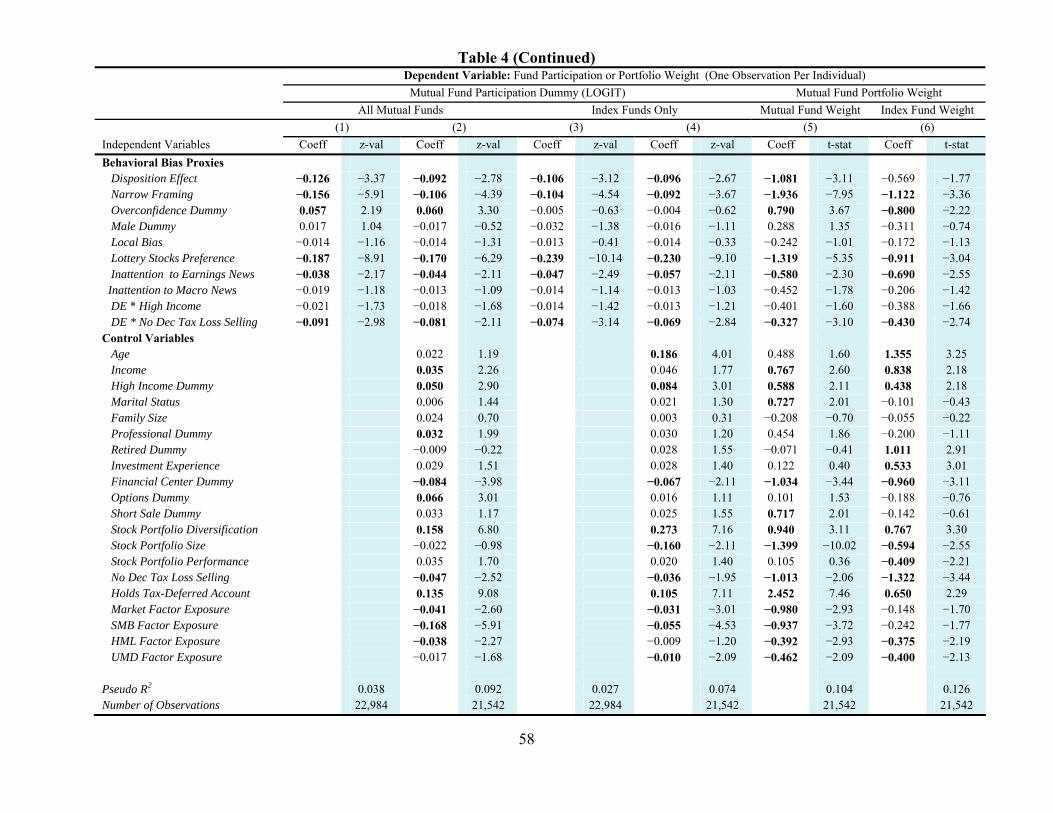
58
Table 4 (Continued) Dependent Variable: Fund Participation or Portfolio Weight (One Observation Per Individual) Mutual Fund Participation Dummy (LOGIT) Mutual Fund Portfolio Weight All Mutual Funds Index Funds Only Mutual Fund Weight Index Fund Weight (1) (2) (3) (4) (5) (6) Independent Variables Coeff z-val Coeff z-val Coeff z-val Coeff z-val Coeff t-stat Coeff t-stat Behavioral Bias Proxies Disposition Effect −0.126 −3.37 −0.092 −2.78 −0.106 −3.12 −0.096 −2.67 −1.081 −3.11 −0.569 −1.77 Narrow Framing −0.156 −5.91 −0.106 −4.39 −0.104 −4.54 −0.092 −3.67 −1.936 −7.95 −1.122 −3.36 Overconfidence Dummy 0.057 2.19 0.060 3.30 −0.005 −0.63 −0.004 −0.62 0.790 3.67 −0.800 −2.22 Male Dummy 0.017 1.04 −0.017 −0.52 −0.032 −1.38 −0.016 −1.11 0.288 1.35 −0.311 −0.74 Local Bias −0.014 −1.16 −0.014 −1.31 −0.013 −0.41 −0.014 −0.33 −0.242 −1.01 −0.172 −1.13 Lottery Stocks Preference −0.187 −8.91 −0.170 −6.29 −0.239 −10.14 −0.230 −9.10 −1.319 −5.35 −0.911 −3.04 Inattention to Earnings News −0.038 −2.17 −0.044 −2.11 −0.047 −2.49 −0.057 −2.11 −0.580 −2.30 −0.690 −2.55 Inattention to Macro News −0.019 −1.18 −0.013 −1.09 −0.014 −1.14 −0.013 −1.03 −0.452 −1.78 −0.206 −1.42 DE * High Income −0.021 −1.73 −0.018 −1.68 −0.014 −1.42 −0.013 −1.21 −0.401 −1.60 −0.388 −1.66 DE * No Dec Tax Loss Selling −0.091 −2.98 −0.081 −2.11 −0.074 −3.14 −0.069 −2.84 −0.327 −3.10 −0.430 −2.74 Control Variables Age 0.022 1.19 0.186 4.01 0.488 1.60 1.355 3.25 Income 0.035 2.26 0.046 1.77 0.767 2.60 0.838 2.18 High Income Dummy 0.050 2.90 0.084 3.01 0.588 2.11 0.438 2.18 Marital Status 0.006 1.44 0.021 1.30 0.727 2.01 −0.101 −0.43 Family Size 0.024 0.70 0.003 0.31 −0.208 −0.70 −0.055 −0.22 Professional Dummy 0.032 1.99 0.030 1.20 0.454 1.86 −0.200 −1.11 Retired Dummy −0.009 −0.22 0.028 1.55 −0.071 −0.41 1.011 2.91 Investment Experience 0.029 1.51 0.028 1.40 0.122 0.40 0.533 3.01 Financial Center Dummy −0.084 −3.98 −0.067 −2.11 −1.034 −3.44 −0.960 −3.11 Options Dummy 0.066 3.01 0.016 1.11 0.101 1.53 −0.188 −0.76 Short Sale Dummy 0.033 1.17 0.025 1.55 0.717 2.01 −0.142 −0.61 Stock Portfolio Diversification 0.158 6.80 0.273 7.16 0.940 3.11 0.767 3.30 Stock Portfolio Size −0.022 −0.98 −0.160 −2.11 −1.399 −10.02 −0.594 −2.55 Stock Portfolio Performance 0.035 1.70 0.020 1.40 0.105 0.36 −0.409 −2.21 No Dec Tax Loss Selling −0.047 −2.52 −0.036 −1.95 −1.013 −2.06 −1.322 −3.44 Holds Tax-Deferred Account 0.135 9.08 0.105 7.11 2.452 7.46 0.650 2.29 Market Factor Exposure −0.041 −2.60 −0.031 −3.01 −0.980 −2.93 −0.148 −1.70 SMB Factor Exposure −0.168 −5.91 −0.055 −4.53 −0.937 −3.72 −0.242 −1.77 HML Factor Exposure −0.038 −2.27 −0.009 −1.20 −0.392 −2.93 −0.375 −2.19 UMD Factor Exposure −0.017 −1.68 −0.010 −2.09 −0.462 −2.09 −0.400 −2.13 Pseudo R2 0.038 0.092 0.027 0.074 0.104 0.126 Number of Observations 22,984 21,542 22,984 21,542 21,542 21,542

59
Table 5: Characteristics of Investors and the Funds They Select
This table reports cross-sectional regression estimates, where three different mutual fund portfolio characteristics are employed as dependent variables. In Panel A specifications (1)-(3), the mean expense ratio, the mean front-end load, and the mean turnover of the funds in the mutual fund portfolio is the dependent variable, respectively. In all specifications, the dependent variable is multiplied by 100. There is one observation per investor. Independent variables are defined in the Appendix, and an intercept term is included but not reported. In Panel B, we consider two additional independent variables. Zip code clustered standard errors are used to obtain the t-statistics. There is one observation per individual.
Panel A: Mutual Fund Portfolio Characteristic Regression Estimates (1) Expense Ratio (2) Front-End Load (3) Fund Turnover
Independent Variables Coeff t-stat Coeff t-stat Coeff t-stat Behavioral Bias Proxies Disposition Effect 0.012 3.02 0.033 3.11 0.004 0.55 Narrow Framing 0.019 3.55 0.041 2.42 0.004 1.01 Overconfidence Dummy 0.020 3.11 0.029 2.50 0.022 2.67 Male Dummy 0.005 1.05 0.012 1.22 0.018 2.19 Local Bias 0.003 0.18 0.021 1.70 −0.009 −1.40 Lottery Stocks Preference 0.024 3.95 0.033 2.29 0.017 2.66 Inattention to Earnings News 0.013 2.33 0.022 2.65 0.019 2.08 Inattention to Macro News 0.005 1.13 0.017 1.54 0.003 0.34 DE * High Income 0.007 1.60 0.011 1.69 0.021 2.80 DE * No Dec Tax Loss Selling 0.024 3.60 0.026 2.44 0.025 3.51 Control Variables Age −0.014 −2.30 −0.030 −1.65 −0.037 −2.98 Income 0.007 1.51 0.011 1.00 0.023 1.71 High Income Dummy 0.003 0.90 0.015 0.69 −0.034 −2.30 Marital Status −0.005 −1.70 −0.008 −0.50 0.005 0.55 Family Size 0.004 0.80 0.012 1.01 0.015 0.70 Professional Dummy 0.007 1.11 0.024 1.22 −0.021 −2.05 Retired Dummy −0.015 −2.30 0.012 0.56 −0.017 −1.81 Investment Experience −0.014 −2.59 −0.025 −2.51 −0.033 −3.00 Financial Center Dummy −0.008 −1.41 −0.004 −1.22 −0.027 −2.67 Options Dummy 0.002 0.35 0.012 1.33 0.019 2.75 Short Sale Dummy −0.003 −1.13 −0.014 −0.99 0.013 1.99 Stock Portfolio Diversification −0.001 −0.11 0.003 0.90 0.013 1.09 Stock Portfolio Size 0.001 0.17 0.008 0.45 0.005 0.60 Stock Portfolio Performance −0.006 −1.54 −0.004 −0.26 0.009 0.91 No Dec Tax Loss Selling 0.015 2.52 0.031 2.89 0.034 2.99 Holds Tax-Deferred Account −0.022 −4.81 −0.013 −3.53 −0.020 −3.86 Market Factor Exposure 0.010 2.56 0.016 2.65 0.022 2.97 SMB Factor Exposure 0.018 3.17 0.012 2.26 0.024 3.39 HML Factor Exposure 0.003 0.93 0.012 2.39 0.001 0.23 UMD Factor Exposure 0.019 3.72 0.024 3.34 0.031 3.52 Adjusted R2 0.071 0.054 0.066
Number of Observations 21,542 21,542 21,542
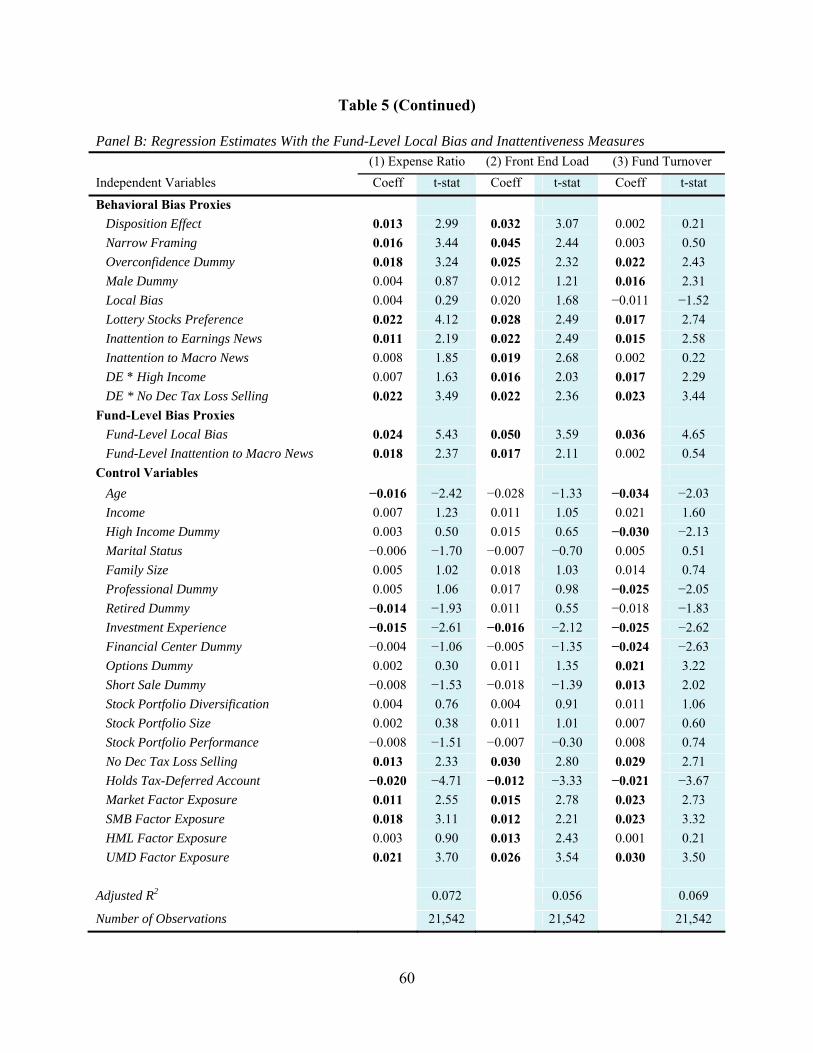
60
Table 5 (Continued)
Panel B: Regression Estimates With the Fund-Level Local Bias and Inattentiveness Measures (1) Expense Ratio (2) Front End Load (3) Fund Turnover
Independent Variables Coeff t-stat Coeff t-stat Coeff t-stat
Behavioral Bias Proxies Disposition Effect 0.013 2.99 0.032 3.07 0.002 0.21 Narrow Framing 0.016 3.44 0.045 2.44 0.003 0.50 Overconfidence Dummy 0.018 3.24 0.025 2.32 0.022 2.43 Male Dummy 0.004 0.87 0.012 1.21 0.016 2.31 Local Bias 0.004 0.29 0.020 1.68 −0.011 −1.52 Lottery Stocks Preference 0.022 4.12 0.028 2.49 0.017 2.74 Inattention to Earnings News 0.011 2.19 0.022 2.49 0.015 2.58 Inattention to Macro News 0.008 1.85 0.019 2.68 0.002 0.22 DE * High Income 0.007 1.63 0.016 2.03 0.017 2.29 DE * No Dec Tax Loss Selling 0.022 3.49 0.022 2.36 0.023 3.44 Fund-Level Bias Proxies Fund-Level Local Bias 0.024 5.43 0.050 3.59 0.036 4.65 Fund-Level Inattention to Macro News 0.018 2.37 0.017 2.11 0.002 0.54 Control Variables Age −0.016 −2.42 −0.028 −1.33 −0.034 −2.03 Income 0.007 1.23 0.011 1.05 0.021 1.60 High Income Dummy 0.003 0.50 0.015 0.65 −0.030 −2.13 Marital Status −0.006 −1.70 −0.007 −0.70 0.005 0.51 Family Size 0.005 1.02 0.018 1.03 0.014 0.74 Professional Dummy 0.005 1.06 0.017 0.98 −0.025 −2.05 Retired Dummy −0.014 −1.93 0.011 0.55 −0.018 −1.83 Investment Experience −0.015 −2.61 −0.016 −2.12 −0.025 −2.62 Financial Center Dummy −0.004 −1.06 −0.005 −1.35 −0.024 −2.63 Options Dummy 0.002 0.30 0.011 1.35 0.021 3.22 Short Sale Dummy −0.008 −1.53 −0.018 −1.39 0.013 2.02 Stock Portfolio Diversification 0.004 0.76 0.004 0.91 0.011 1.06 Stock Portfolio Size 0.002 0.38 0.011 1.01 0.007 0.60 Stock Portfolio Performance −0.008 −1.51 −0.007 −0.30 0.008 0.74 No Dec Tax Loss Selling 0.013 2.33 0.030 2.80 0.029 2.71 Holds Tax-Deferred Account −0.020 −4.71 −0.012 −3.33 −0.021 −3.67 Market Factor Exposure 0.011 2.55 0.015 2.78 0.023 2.73 SMB Factor Exposure 0.018 3.11 0.012 2.21 0.023 3.32 HML Factor Exposure 0.003 0.90 0.013 2.43 0.001 0.21 UMD Factor Exposure 0.021 3.70 0.026 3.54 0.030 3.50 Adjusted R2 0.072 0.056 0.069
Number of Observations 21,542 21,542 21,542

61
Table 6: Returns-Chasing and Fund Selection
This table reports cross-sectional regression estimates with two different mutual fund portfolio performance measures as dependent variables, the 12 month past return and the 24 month past return. There is one observation per investor. The independent variables include behavioral bias proxies, control variables and an intercept term which is included but unreported. Independent variables are defined in the Appendix. Investors with fewer than 12 months of data are excluded. Zip code clustered standard errors are used to obtain the t-statistics. The individual investor data are from a large U.S. discount brokerage house for the 1991 to 1996 period. Dependent Variable: Mutual Fund Portfolio Characteristic (One Observation Per Individual)
(1) 12 Month Past Return (2) 24 Month Past Return Independent Variables Coeff t-stat Coeff t-stat Behavioral Bias Proxies Disposition Effect −0.022 −0.25 0.087 0.34 Narrow Framing 0.644 4.35 0.764 3.45 Overconfidence Dummy 1.370 5.04 1.604 6.87 Male Dummy 0.062 0.46 0.258 2.51 Local Bias 0.154 1.09 0.034 0.33 Lottery Stocks Preference 0.978 6.39 1.196 5.75 Inattention to Earnings News 0.199 1.62 0.291 1.85 Inattention to Macro News 0.581 2.18 0.492 2.84 DE * High Income 0.353 2.05 0.508 2.57 DE * No Dec Tax Loss Selling 0.480 2.16 0.390 2.06 Control Variables Age −0.329 −1.66 −0.886 −2.11 Income −0.427 −1.83 −0.542 −1.62 High Income Dummy −0.061 −0.58 −0.196 −1.49 Marital Status −0.077 −0.81 0.443 1.52 Family Size −0.149 −1.22 −0.609 −1.76 Professional Dummy −0.629 −2.32 −1.052 −2.92 Retired Dummy −0.487 −2.91 −0.152 −1.92 Investment Experience 0.057 0.30 −0.468 −1.98 Financial Center Dummy −0.404 −2.13 −0.510 −1.63 Options Dummy −0.347 −2.71 −0.492 −2.63 Short Sale Dummy −0.024 −0.12 0.070 0.46 Stock Portfolio Diversification −0.093 −0.46 −0.492 −2.02 Stock Portfolio Size −0.139 −0.68 −0.103 −0.71 Stock Portfolio Performance −0.558 −3.46 −0.768 −2.13 No Dec Tax Loss Selling 0.380 1.92 0.407 2.93 Holds Tax-Deferred Account −0.062 −0.61 −0.168 −2.38 Market Factor Exposure 0.862 3.87 0.565 3.54 SMB Factor Exposure 0.393 2.64 0.485 3.82 HML Factor Exposure 0.068 0.67 0.151 2.15 UMD Factor Exposure 0.228 2.40 0.264 2.51 Adjusted R2 0.091 0.076 Number of Observations 21,542 21,542

62
Table 7: Investor Characteristics and Performance of Mutual Fund Investments
This table reports cross-sectional regression estimates to explain two measures of mutual fund portfolio performance, position-based performance measures in Panel A and trade-based performance measures in Panel B. In Panel A, the dependent variables are (1) the mean monthly percent return (in percentage terms), (2) the net monthly return which equals the mean monthly return minus expenses (but not loads), (3) the Sharpe ratio of net returns multiplied by 100, and (4) the monthly market model alpha. In Panel B, the dependent variables in specifications (1)-(4) are the mean annualized holding period return, the mean holding period, the 1-month post trade buy-sell return differential, and the 12-month post-trade buy-sell return differential (PTBSD), respectively. Independent variables are defined in the Appendix. A constant term is included. Investors with fewer than 12 months of data are excluded. Zip code clustered standard errors are used to obtain the t-statistics. The individual investor data are from a large U.S. discount brokerage house from 1991 to 1996.
Panel A: Position-Based Mutual Fund Portfolio Performance Regression Estimates
(1) Mean Monthly Returns
(2) Net Monthly Returns
(3) Net Sharpe Ratio x 100
(4) Market model Alpha
Independent Variables Coeff t-stat Coeff t-stat Coeff t-stat Coeff t-stat Behavioral Bias Proxies Disposition Effect −0.027 −2.14 −0.028 −2.16 −0.554 −1.94 −0.027 −1.96 Narrow Framing −0.041 −2.94 −0.047 −2.75 −1.550 −3.83 −0.050 −2.65 Overconfidence Dummy −0.025 −2.17 −0.031 −2.60 −1.502 −2.39 −0.033 −2.06 Male Dummy −0.009 −1.05 −0.012 −1.42 −1.503 −1.90 −0.039 −2.29 Local Bias 0.010 1.20 0.010 1.30 0.113 0.42 0.006 0.88 Lottery Stocks Preference −0.026 −2.99 −0.024 −2.78 −1.249 −1.97 −0.059 −3.26 Inattention to Earnings News −0.014 −2.18 −0.015 −2.48 −1.041 −2.13 −0.026 −2.82 Inattention to Macro News −0.022 −2.22 −0.024 −2.45 −1.010 −2.03 −0.019 −1.92 DE * High Income −0.009 −1.26 −0.012 −1.26 0.143 0.19 0.006 0.80 DE * No Dec Tax Loss Selling −0.016 −1.66 −0.016 −1.62 −0.155 −0.51 −0.028 −2.58 Control Variables Age −0.007 −1.59 −0.008 −1.45 0.448 0.65 −0.003 −0.72 Income 0.002 0.22 0.003 0.18 −0.581 −0.88 −0.011 −0.31 High Income Dummy 0.026 1.63 0.030 1.89 0.200 1.04 0.026 0.48 Marital Status 0.004 0.34 0.009 0.59 0.218 0.36 −0.003 −0.08 Family Size −0.004 −0.34 −0.004 −0.40 −0.679 −0.97 −0.039 −1.91 Professional Dummy −0.002 −0.12 −0.017 −0.87 −0.308 −0.40 0.002 0.43 Retired Dummy 0.003 0.21 0.003 0.18 0.046 0.08 −0.034 −1.54 Investment Experience 0.028 3.15 0.026 2.89 1.991 2.72 0.051 2.35 Financial Center Dummy −0.001 −0.08 −0.011 −0.88 −0.510 −0.85 −0.014 −1.42 Options Dummy 0.034 2.51 0.043 1.79 1.517 2.62 0.062 3.12 Short Sale Dummy 0.051 2.36 0.021 1.55 0.978 1.64 0.035 1.33 Stock Portfolio Diversification 0.028 1.83 0.024 1.57 0.105 0.18 −0.013 −0.94 Stock Portfolio Size 0.023 1.39 0.023 1.43 1.288 2.03 −0.011 −0.28 Stock Portfolio Performance −0.032 −1.29 −0.033 −2.07 −0.672 −1.17 0.001 0.31 No Dec Tax Loss Selling 0.003 0.29 0.002 0.18 −0.614 −1.66 −0.018 −1.47 Holds Tax-Deferred Account −0.003 −0.59 −0.003 −0.58 0.168 1.02 −0.017 −1.62 Market Factor Exposure 0.021 2.78 0.019 2.43 0.595 3.08 0.009 0.51 SMB Factor Exposure 0.012 1.38 0.004 0.66 0.670 3.51 0.038 2.71 HML Factor Exposure 0.007 1.35 0.006 1.22 0.025 0.14 0.014 1.39 UMD Factor Exposure 0.031 3.35 0.024 2.98 0.449 2.75 0.016 1.68 Adjusted R2 0.042 0.043 0.037 0.029 Number of Observations 21,542 21,542 21,542 20,142

63
Table 7 (Continued) Panel B: Trade-Based Mutual Fund Portfolio Performance
(1) Holding Period Return
(2) Holding Period (3) 1-Month PTBSD
(4) 12-Month PTBSD
Independent Variables Coeff t-stat Coeff t-stat Coeff t-stat Coeff t-stat
Intercept 0.418 12.57 444.20 17.85 0.042 0.97 −2.526 −14.34 Behavioral Bias Proxies Disposition Effect −0.059 −2.46 −25.15 −4.26 −0.070 −2.48 −0.295 −2.26 Narrow Framing −0.054 −3.40 −15.16 −2.97 −0.096 −3.48 −0.462 −3.26 Overconfidence Dummy −0.066 −3.06 −42.61 −7.75 −0.090 −2.17 −0.569 −2.99 Male Dummy 0.018 0.53 −3.36 −0.56 −0.018 −1.09 −0.114 −1.63 Local Bias −0.005 −0.14 10.02 2.67 0.013 0.69 −0.356 −2.27 Lottery Stocks Preference −0.037 −2.27 −24.17 −2.36 −0.058 −2.27 −0.551 −2.34 Inattention tos Earnings News −0.010 −1.26 −4.02 −1.62 −0.033 −2.66 −0.474 −2.36 Inattention to Macro News −0.048 −2.29 −11.71 −2.85 −0.029 −2.60 −0.526 −2.69 DE * High Income −0.065 −3.17 −19.66 −2.67 −0.061 −2.55 −0.485 −2.07 DE * No Dec Tax Loss Selling −0.037 −1.99 −15.69 −2.89 0.002 0.36 −0.079 −1.39 Control Variables Age −0.049 −2.46 18.65 1.99 −0.054 −2.06 −0.417 −2.23 Income 0.015 0.22 −2.27 −0.25 −0.005 −0.15 −0.084 −0.72 High Income Dummy 0.014 0.94 −4.58 −1.39 −0.024 −1.63 −0.257 −1.26 Marital Status 0.025 1.09 5.02 0.59 0.008 0.46 0.183 1.61 Family Size 0.016 1.82 −2.65 −0.27 0.007 0.17 0.061 0.20 Professional Dummy −0.010 −0.18 −4.49 −0.42 0.013 0.88 −0.191 −1.27 Retired Dummy −0.038 −1.68 27.61 3.33 −0.037 −2.17 −0.197 −2.19 Investment Experience 0.038 2.21 8.67 1.58 0.089 3.50 0.587 3.14 Financial Center Dummy 0.006 0.31 −16.56 −2.03 0.020 1.31 −0.051 −0.31 Options Dummy 0.040 1.97 −33.55 −5.56 0.050 2.14 0.302 2.71 Short Sale Dummy 0.034 1.82 −12.02 −2.01 0.041 1.86 0.181 1.98 Stock Portfolio Diversification 0.013 0.73 41.47 3.88 0.016 1.01 0.091 1.33 Stock Portfolio Size 0.026 1.70 3.33 0.55 0.022 1.55 0.071 0.95 Stock Portfolio Performance −0.042 −2.50 −25.00 −4.92 −0.017 −1.05 −0.409 −2.65 No Dec Tax Loss Selling −0.015 −1.32 45.25 3.35 −0.074 −2.77 −0.223 −1.85 Holds Tax-Deferred Account 0.023 1.95 7.11 1.53 −0.013 −0.38 0.035 0.25 Market Factor Exposure 0.004 0.16 −26.14 −3.53 0.047 2.09 0.261 1.78 SMB Factor Exposure 0.035 1.98 −23.73 −3.86 0.013 0.95 0.457 3.13 HML Factor Exposure −0.015 −1.21 −2.36 −0.51 0.025 1.65 0.234 1.68 UMD Factor Exposure 0.024 1.11 16.83 2.99 0.017 0.88 0.095 0.76 Adjusted R2 0.045 0.093 0.040 0.064
Number of Observations 15,210 15,210 18,002 18,002

64
Table 8: Behavioral Biases, Mutual Fund Portfolio Characteristics, and Portfolio
Performance
This table reports cross-sectional regression estimates with two different mutual fund portfolio performance measures as dependent variables, (1) the mean net monthly percent return (in and (2.) the Sharpe ratio computed using net returns multiplied by 100. There is one observation per investor. The independent variables include behavioral bias proxies and inattention measures, mutual fund characteristics, bias-load interaction terms and control variables. Independent variables are defined in the Appendix. Mutual fund characteristics include the initial weight assigned to mutual funds in the equity (stocks and mutual funds) portfolio and three expense measures of the mutual fund portfolio: (i) the sample period mean expense ratio, (ii) the sample period mean 12-B-1 fee, and (iii) the sample period mean front-end load. Bias-load interaction terms equal the multiplication between each of three behavioral bias measures and each of three mutual fund expense ratio measures. The three behavioral bias measures are high disposition effect, strong framing effects and overconfidence. The inattention measure is the equally-weighted average of the two stock-level inattention measures. The three expense ratio measures are high expense ratios, high 12-B-1 fees and high front-end loads. The mutual fund portfolio weight is measured at the time an investor enters the sample or invests in mutual funds for the first time. High and low dummy variables are defined using the highest and the lowest quintile of the respective variable. Investors with fewer than 12 months of data are excluded. Zip code clustered standard errors are used to obtain the t-statistics. The individual investor data are from a large U.S. discount brokerage house for the 1991 to 1996 period.
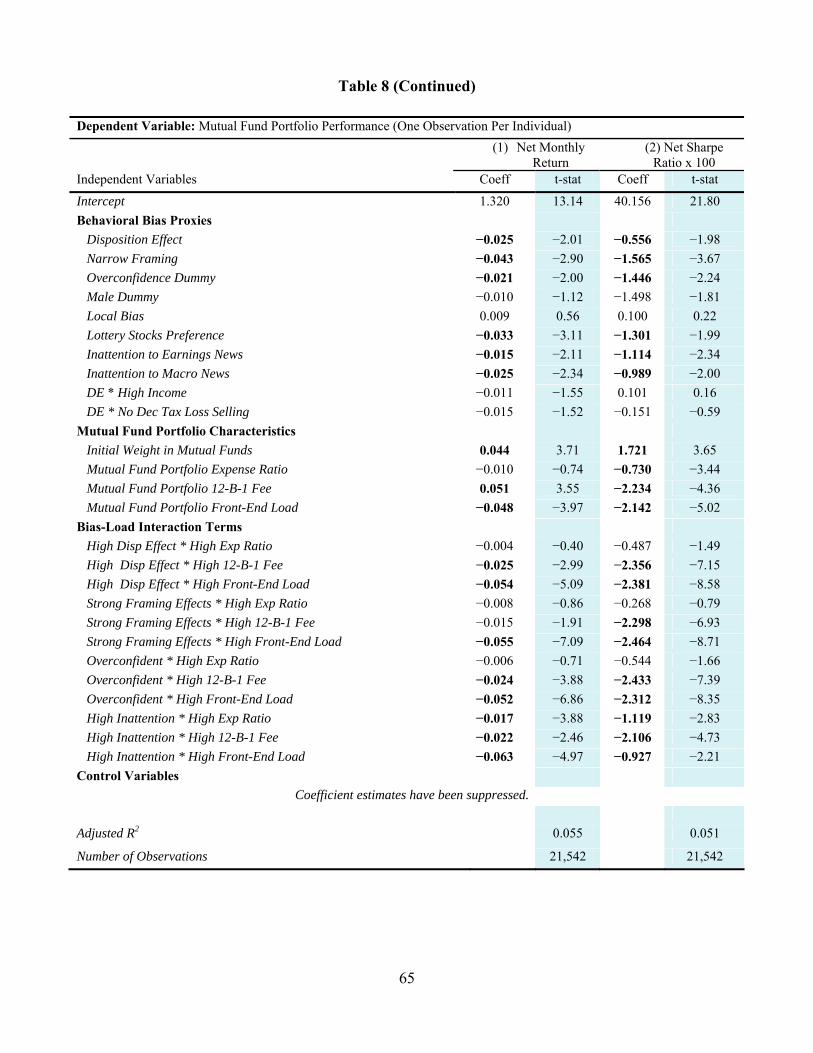
65
Table 8 (Continued) Dependent Variable: Mutual Fund Portfolio Performance (One Observation Per Individual) (1) Net Monthly
Return (2) Net Sharpe
Ratio x 100 Independent Variables Coeff t-stat Coeff t-stat
Intercept 1.320 13.14 40.156 21.80 Behavioral Bias Proxies Disposition Effect −0.025 −2.01 −0.556 −1.98 Narrow Framing −0.043 −2.90 −1.565 −3.67 Overconfidence Dummy −0.021 −2.00 −1.446 −2.24 Male Dummy −0.010 −1.12 −1.498 −1.81 Local Bias 0.009 0.56 0.100 0.22 Lottery Stocks Preference −0.033 −3.11 −1.301 −1.99 Inattention to Earnings News −0.015 −2.11 −1.114 −2.34 Inattention to Macro News −0.025 −2.34 −0.989 −2.00 DE * High Income −0.011 −1.55 0.101 0.16 DE * No Dec Tax Loss Selling −0.015 −1.52 −0.151 −0.59 Mutual Fund Portfolio Characteristics Initial Weight in Mutual Funds 0.044 3.71 1.721 3.65 Mutual Fund Portfolio Expense Ratio −0.010 −0.74 −0.730 −3.44 Mutual Fund Portfolio 12-B-1 Fee 0.051 3.55 −2.234 −4.36 Mutual Fund Portfolio Front-End Load −0.048 −3.97 −2.142 −5.02 Bias-Load Interaction Terms High Disp Effect * High Exp Ratio −0.004 −0.40 −0.487 −1.49 High Disp Effect * High 12-B-1 Fee −0.025 −2.99 −2.356 −7.15 High Disp Effect * High Front-End Load −0.054 −5.09 −2.381 −8.58 Strong Framing Effects * High Exp Ratio −0.008 −0.86 −0.268 −0.79 Strong Framing Effects * High 12-B-1 Fee −0.015 −1.91 −2.298 −6.93 Strong Framing Effects * High Front-End Load −0.055 −7.09 −2.464 −8.71 Overconfident * High Exp Ratio −0.006 −0.71 −0.544 −1.66 Overconfident * High 12-B-1 Fee −0.024 −3.88 −2.433 −7.39 Overconfident * High Front-End Load −0.052 −6.86 −2.312 −8.35 High Inattention * High Exp Ratio −0.017 −3.88 −1.119 −2.83 High Inattention * High 12-B-1 Fee −0.022 −2.46 −2.106 −4.73 High Inattention * High Front-End Load −0.063 −4.97 −0.927 −2.21 Control Variables
Coefficient estimates have been suppressed. Adjusted R2 0.055 0.051
Number of Observations 21,542 21,542

66
Table 9: Associations between Aggregated Behavioral Biases and Other Characteristics, Fund Decisions, and Consequences Panel A of this table measures the combined effect of multiple bias proxies on mutual fund decisions using the five most important factors from factor analysis of the behavioral bias proxies and other investor characteristics. Panel B of this table measures the combined effect of multiple bias proxies on mutual fund decisions using an equally-weighted index of the behavioral bias proxies. The behavioral factors are defined in the Appendix, while the factor analysis is detailed in Table 3. This table summarizes estimates of the regressions of Tables 4 to 7 in which the behavioral proxies and other investor characteristics are replaced with the five most important factors from factor analysis. For brevity, only the coefficient estimates for the variable of interest are reported. Panel A: Estimates When the Dependent Variable is a Factor of the Behavioral Bias Proxies and other Investor Characteristics Regression Type Gambler
Factor Coeff
t- or z-stat
Smart Factor Coeff
t- or z-stat
Over- confident
Factor Coeff
t- or z-stat
Narrow Framer Factor Coeff
t- or z-stat
Mature Factor Coeff
t- or z-stat
Adj R2 N
Participation (Table 4) All Mutual Funds: Column (2) −0.339 −3.77 0.125 2.24 −0.722 −3.75 −0.350 −2.73 0.258 3.11 0.059 21,542 Index Funds Only: Column (4) −0.229 −2.93 0.171 2.59 −0.402 −2.68 −0.311 −2.60 0.174 2.81 0.051 21,542 Holdings (Table 4) Weight in All Mutual Funds: Column (5) −2.827 −3.02 1.764 1.42 −3.193 −3.75 −1.981 −2.73 2.541 3.55 0.049 21,542 Weight in Index Funds Only: Column (6) −1.901 −2.71 1.166 1.81 −2.792 −3.18 −1.591 −2.76 2.407 2.76 0.055 21,542 Portfolio Characteristics (Table 5) Expense Ratio: Column (1) 0.209 5.15 −0.014 −2.88 0.079 4.46 0.027 2.13 −0.111 −5.42 0.038 21,542 Front End Load: Column (2) 0.132 2.72 −0.017 −2.15 0.082 2.21 0.063 1.91 −0.085 −3.11 0.031 21,542 Fund Turnover: Column (3) 0.114 3.71 −0.029 −2.31 0.145 3.59 0.033 1.22 −0.148 −4.68 0.043 21,542 Trend Chasing (Table 6) 12 Month Lagged Fund Perf: Column (1) 1.180 2.93 −0.096 −1.23 1.729 3.02 0.863 1.97 −1.367 −2.65 0.071 21,542 24 Month Lagged Fund Perf: Column (2) 1.156 2.61 −0.532 −2.33 1.941 2.98 1.167 2.57 −2.079 −3.14 0.050 21,542 Portfolio Performance (Table 7) Mean Monthly Returns: Panel A, Column (1) −0.109 −2.65 0.085 2.33 −0.111 −2.82 −0.066 −1.92 −0.025 −1.82 0.028 21,542 Net Monthly Returns: Panel A, Column (2) −0.122 −2.60 0.076 2.51 −0.189 −3.77 −0.058 −1.98 −0.019 −1.31 0.026 21,542 Net Sharpe Ratio: Panel A, Column (3) −2.568 −3.20 2.853 3.12 −1.110 −2.04 −2.109 −3.08 0.664 1.12 0.024 21,542 Four-Factor Alpha: Panel A, Column (4) −0.164 −2.84 0.123 2.34 −0.092 −2.78 −0.058 −2.88 −0.026 −1.26 0.021 21,542 Holding Period Returns: Panel B, Column (1) −0.095 −3.08 0.059 2.42 −0.074 −2.90 −0.078 −2.94 −0.055 −2.40 0.033 15,210 Holding Period: Panel B, Column (2) −27.904 −3.07 18.514 2.38 −15.504 −2.27 −8.211 −2.58 21.675 −2.99 0.065 15,210 One-Month PTBSD: Panel B, Column (3) −0.152 −3.49 0.125 3.48 −0.093 −3.36 −0.051 −2.77 −0.076 −3.21 0.025 15,210 One-Year PTBSD: Panel B, Column (4) −0.916 −3.37 0.936 3.70 −0.691 −3.28 −0.544 −2.82 −0.722 −2.87 0.050 15,210
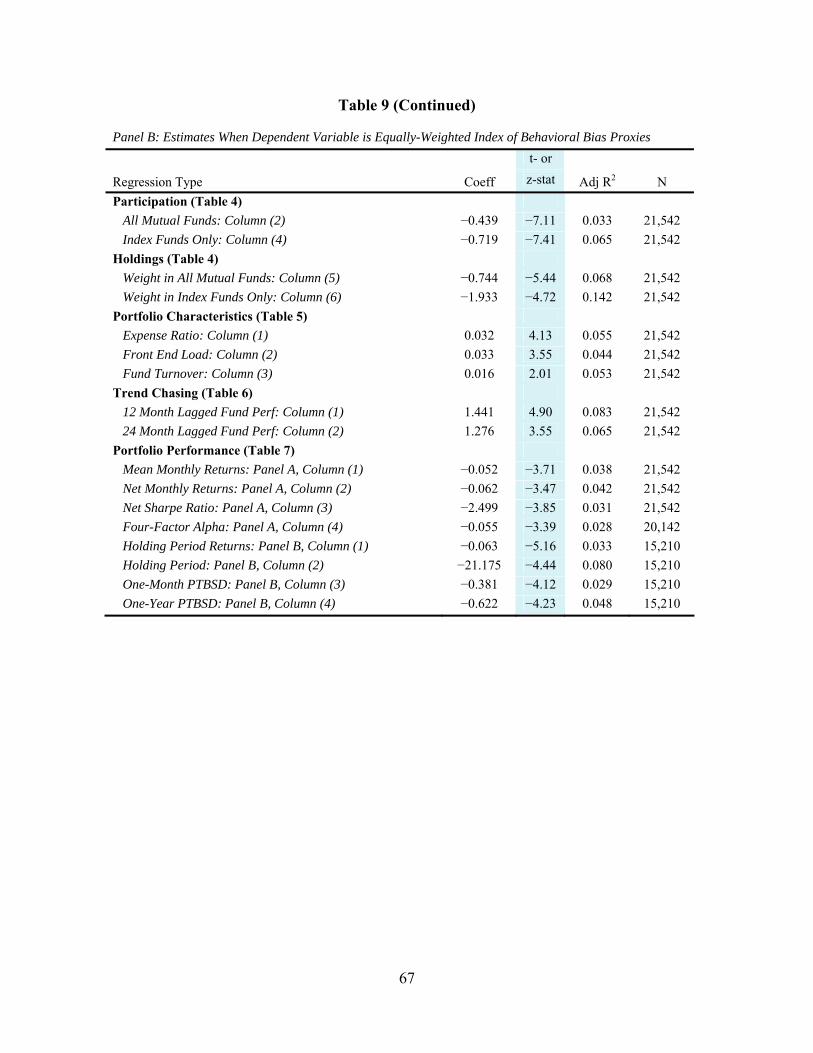
67
Table 9 (Continued)
Panel B: Estimates When Dependent Variable is Equally-Weighted Index of Behavioral Bias Proxies t- or
Regression Type Coeff z-stat Adj R2 N Participation (Table 4) All Mutual Funds: Column (2) −0.439 −7.11 0.033 21,542 Index Funds Only: Column (4) −0.719 −7.41 0.065 21,542 Holdings (Table 4) Weight in All Mutual Funds: Column (5) −0.744 −5.44 0.068 21,542 Weight in Index Funds Only: Column (6) −1.933 −4.72 0.142 21,542 Portfolio Characteristics (Table 5) Expense Ratio: Column (1) 0.032 4.13 0.055 21,542 Front End Load: Column (2) 0.033 3.55 0.044 21,542 Fund Turnover: Column (3) 0.016 2.01 0.053 21,542 Trend Chasing (Table 6) 12 Month Lagged Fund Perf: Column (1) 1.441 4.90 0.083 21,542 24 Month Lagged Fund Perf: Column (2) 1.276 3.55 0.065 21,542 Portfolio Performance (Table 7) Mean Monthly Returns: Panel A, Column (1) −0.052 −3.71 0.038 21,542 Net Monthly Returns: Panel A, Column (2) −0.062 −3.47 0.042 21,542 Net Sharpe Ratio: Panel A, Column (3) −2.499 −3.85 0.031 21,542 Four-Factor Alpha: Panel A, Column (4) −0.055 −3.39 0.028 20,142 Holding Period Returns: Panel B, Column (1) −0.063 −5.16 0.033 15,210 Holding Period: Panel B, Column (2) −21.175 −4.44 0.080 15,210 One-Month PTBSD: Panel B, Column (3) −0.381 −4.12 0.029 15,210 One-Year PTBSD: Panel B, Column (4) −0.622 −4.23 0.048 15,210