Embed Size (px)
Citation preview
BEHAVIOR OF THE DAM OF THE SAYANO-SHUSHENSKAYAHYDROPOWER PLANT BEFORE AND AFTER RECONDITIONING
V. I. Bryzgalov and É. G. Gaziev
Translated from Gidrotekhnicheskoe Stroitel’stvo, No. 4, April 2004, pp. 18 – 21.
After filling of the storage reservoir of the Sayano-Shu-
shenskaya HPP in 1989 it became obvious that the parame-
ters characterizing the condition of the dam exceed the de-
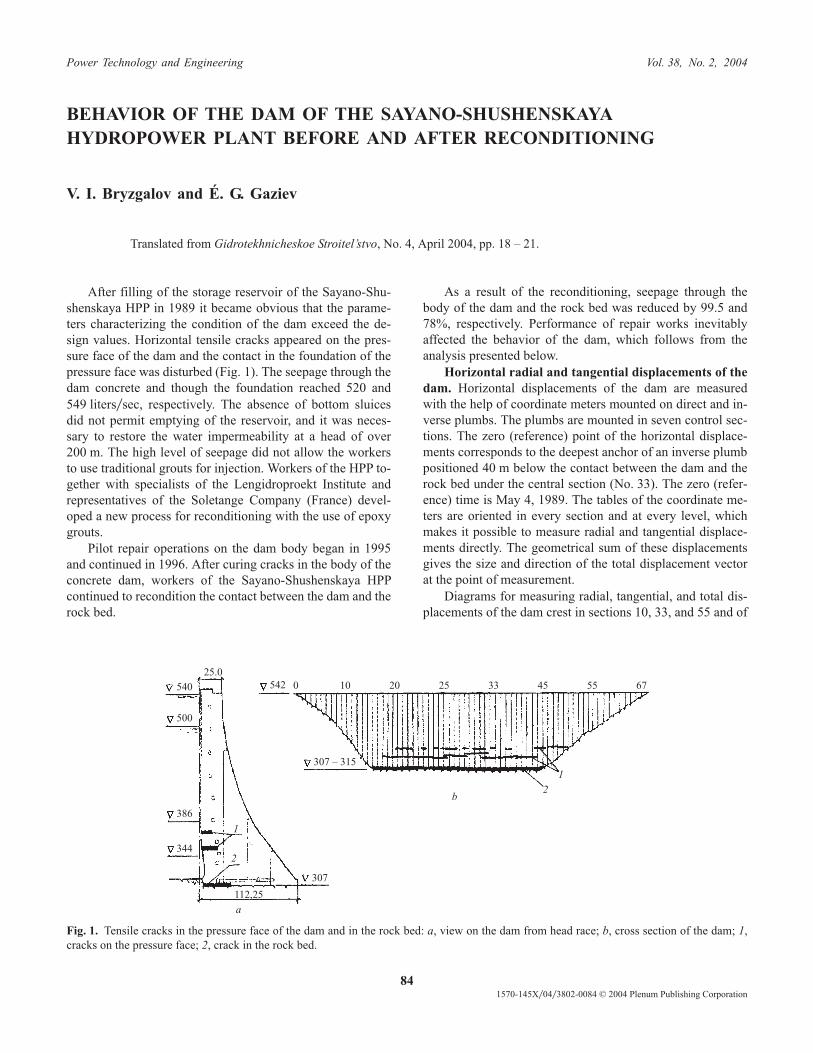
sign values. Horizontal tensile cracks appeared on the pres-
sure face of the dam and the contact in the foundation of the
pressure face was disturbed (Fig. 1). The seepage through the
dam concrete and though the foundation reached 520 and
549 liters�sec, respectively. The absence of bottom sluices
did not permit emptying of the reservoir, and it was neces-
sary to restore the water impermeability at a head of over
200 m. The high level of seepage did not allow the workers
to use traditional grouts for injection. Workers of the HPP to-
gether with specialists of the Lengidroproekt Institute and
representatives of the Soletange Company (France) devel-
oped a new process for reconditioning with the use of epoxy
grouts.
Pilot repair operations on the dam body began in 1995
and continued in 1996. After curing cracks in the body of the
concrete dam, workers of the Sayano-Shushenskaya HPP
continued to recondition the contact between the dam and the
rock bed.
As a result of the reconditioning, seepage through the
body of the dam and the rock bed was reduced by 99.5 and
78%, respectively. Performance of repair works inevitably
affected the behavior of the dam, which follows from the
analysis presented below.
Horizontal radial and tangential displacements of thedam. Horizontal displacements of the dam are measured
with the help of coordinate meters mounted on direct and in-
verse plumbs. The plumbs are mounted in seven control sec-
tions. The zero (reference) point of the horizontal displace-
ments corresponds to the deepest anchor of an inverse plumb
positioned 40 m below the contact between the dam and the
rock bed under the central section (No. 33). The zero (refer-
ence) time is May 4, 1989. The tables of the coordinate me-
ters are oriented in every section and at every level, which
makes it possible to measure radial and tangential displace-
ments directly. The geometrical sum of these displacements
gives the size and direction of the total displacement vector
at the point of measurement.
Diagrams for measuring radial, tangential, and total dis-
placements of the dam crest in sections 10, 33, and 55 and of
Power Technology and Engineering Vol. 38, No. 2, 2004
841570-145X�04�3802-0084 © 2004 Plenum Publishing Corporation
25.0
540
500
386
344
307
112,25
542 0 10 20 25 33 45 55 67
307 – 315
1
2
2
1
a
b
Fig. 1. Tensile cracks in the pressure face of the dam and in the rock bed: a, view on the dam from head race; b, cross section of the dam; 1,
cracks on the pressure face; 2, crack in the rock bed.
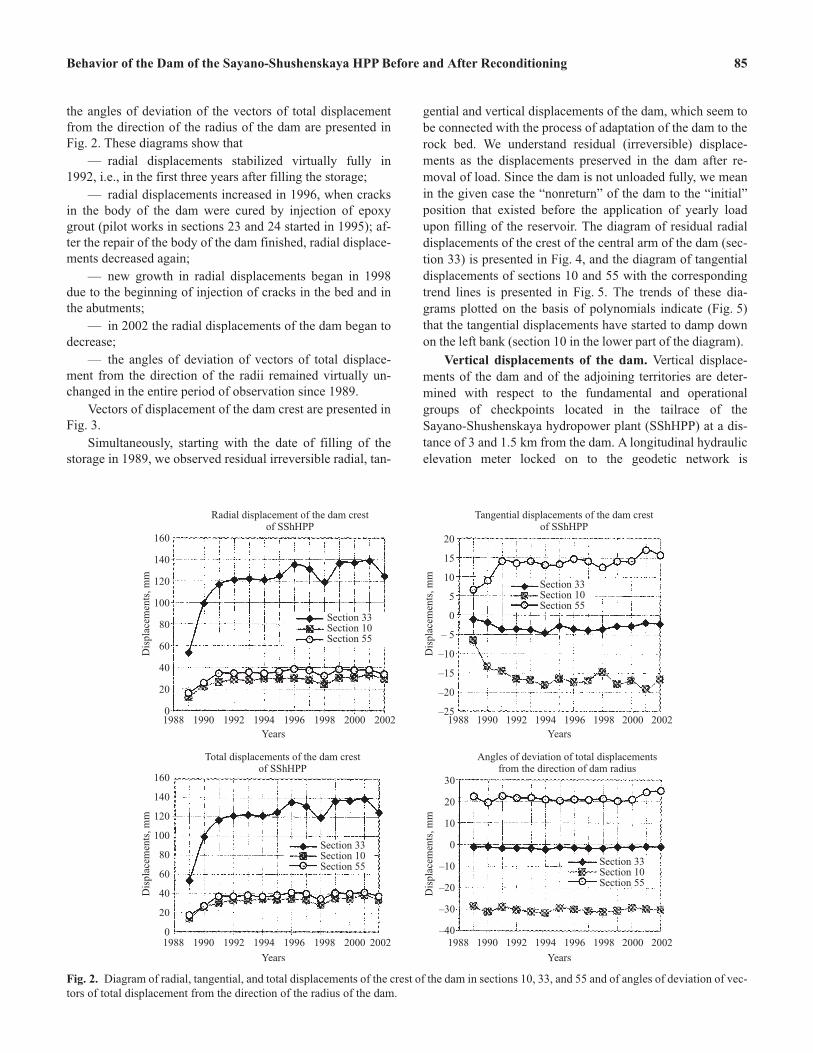
the angles of deviation of the vectors of total displacement
from the direction of the radius of the dam are presented in
Fig. 2. These diagrams show that
— radial displacements stabilized virtually fully in
1992, i.e., in the first three years after filling the storage;
— radial displacements increased in 1996, when cracks
in the body of the dam were cured by injection of epoxy
grout (pilot works in sections 23 and 24 started in 1995); af-
ter the repair of the body of the dam finished, radial displace-
ments decreased again;
— new growth in radial displacements began in 1998
due to the beginning of injection of cracks in the bed and in
the abutments;
— in 2002 the radial displacements of the dam began to
decrease;
— the angles of deviation of vectors of total displace-
ment from the direction of the radii remained virtually un-
changed in the entire period of observation since 1989.
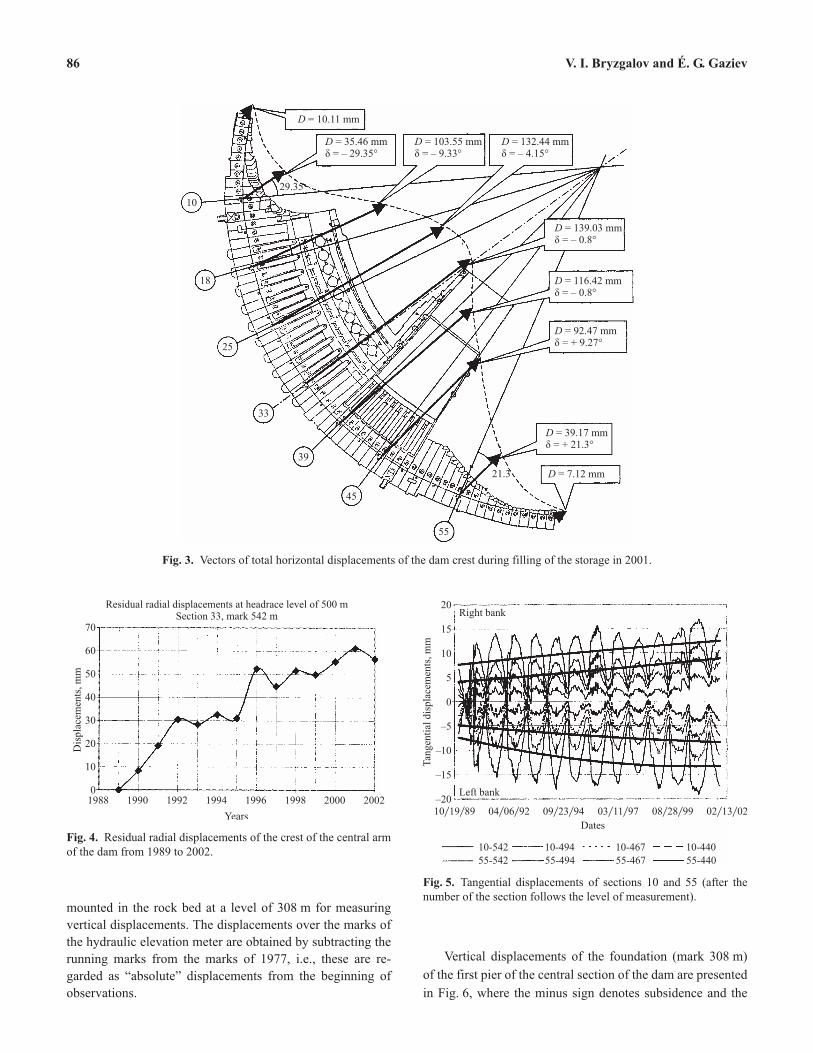
Vectors of displacement of the dam crest are presented in
Fig. 3.
Simultaneously, starting with the date of filling of the
storage in 1989, we observed residual irreversible radial, tan-
gential and vertical displacements of the dam, which seem to
be connected with the process of adaptation of the dam to the
rock bed. We understand residual (irreversible) displace-
ments as the displacements preserved in the dam after re-
moval of load. Since the dam is not unloaded fully, we mean
in the given case the “nonreturn” of the dam to the “initial”
position that existed before the application of yearly load
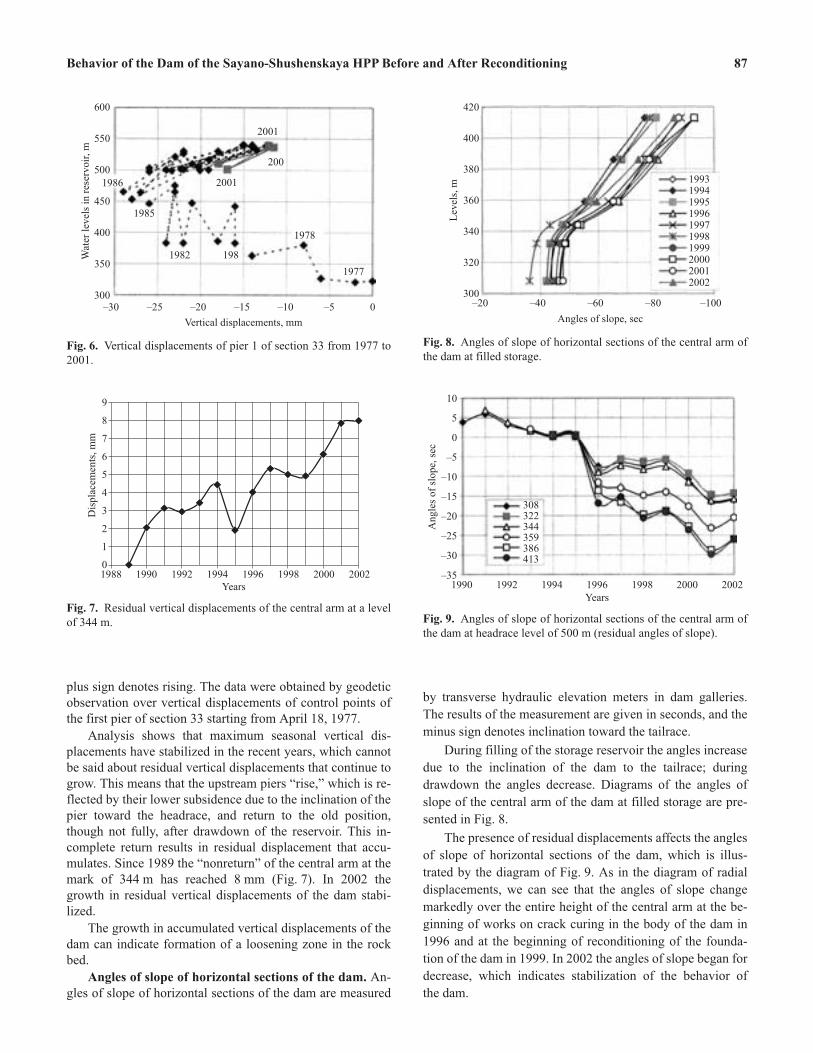
upon filling of the reservoir. The diagram of residual radial
displacements of the crest of the central arm of the dam (sec-
tion 33) is presented in Fig. 4, and the diagram of tangential
displacements of sections 10 and 55 with the corresponding
trend lines is presented in Fig. 5. The trends of these dia-
grams plotted on the basis of polynomials indicate (Fig. 5)
that the tangential displacements have started to damp down
on the left bank (section 10 in the lower part of the diagram).
Vertical displacements of the dam. Vertical displace-
ments of the dam and of the adjoining territories are deter-
mined with respect to the fundamental and operational
groups of checkpoints located in the tailrace of the
Sayano-Shushenskaya hydropower plant (SShHPP) at a dis-
tance of 3 and 1.5 km from the dam. A longitudinal hydraulic
elevation meter locked on to the geodetic network is
Behavior of the Dam of the Sayano-Shushenskaya HPP Before and After Reconditioning 85
Radial displacement of the dam crestof SShHPP
Tangential displacements of the dam crestof SShHPP
Total displacements of the dam crestof SShHPP
Angles of deviation of total displacementsfrom the direction of dam radius
1988
1988
1988
1988
1990
1990
1990
1990
1992
1992
1992
1992
1994
1994
1994
1994
1996
1996
1996
1996
1998
1998
1998
1998
2000
2000
2000
2000
2002
2002
2002
2002
160
160
140
140
120
120
100
100
80
80
60
60
40
40
20
20
0
0
Section 33Section 10Section 55
Section 33Section 10Section 55
Section 33Section 10Section 55
Section 33Section 10Section 55
20
15
10
5
0
– 5
–10
–15
–20
–25
30
20
10
0
–10
–20
–30
–40
Years Years
Years Years
Dis
pla
cem
ents
,m
m
Dis
pla
cem
ents
,m
m
Dis
pla
cem
ents
,m
m
Dis
pla
cem
ents
,m
m
Fig. 2. Diagram of radial, tangential, and total displacements of the crest of the dam in sections 10, 33, and 55 and of angles of deviation of vec-
tors of total displacement from the direction of the radius of the dam.
mounted in the rock bed at a level of 308 m for measuring
vertical displacements. The displacements over the marks of
the hydraulic elevation meter are obtained by subtracting the
running marks from the marks of 1977, i.e., these are re-
garded as “absolute” displacements from the beginning of
observations.
Vertical displacements of the foundation (mark 308 m)
of the first pier of the central section of the dam are presented
in Fig. 6, where the minus sign denotes subsidence and the
86 V. I. Bryzgalov and É. G. Gaziev
Residual radial displacements at headrace level of 500 mSection 33, mark 542 m
1988 1990 1992 1994 1996 1998 2000 2002
70
60
50
40
30
20
10
0
Dis
pla
cem
ents
,m
m
Years
Fig. 4. Residual radial displacements of the crest of the central arm
of the dam from 1989 to 2002.
D = 10.11 mm
D = 35.46 mm= – 29.35°ä
D = 103.55 mm= – 9.33°ä
Dä
= 132.44 mm= – 4.15°
Dä
= 139.03 mm= – 0.8°
Dä
= 116.42 mm= – 0.8°
Dä
= 92.47 mm= + 9.27°
Dä
= 39.17 mm= + 21.3°
29.35
21.3 D = 7.12 mm
55
45
39
33
25
18
10
Fig. 3. Vectors of total horizontal displacements of the dam crest during filling of the storage in 2001.
Tan
gen
tial
dis
pla
cem
ents
,m
m
Right bank
Left bank
20
15
10
5
0
–5
–10
–15
–20
10�19 89� 04� �06 92 09� �23 94 03� �11 97 08� �28 99 02� �13 02
Dates
10-542 10-494 10-467 10-440
55-542 55-494 55-467 55-440
Fig. 5. Tangential displacements of sections 10 and 55 (after the
number of the section follows the level of measurement).
plus sign denotes rising. The data were obtained by geodetic
observation over vertical displacements of control points of
the first pier of section 33 starting from April 18, 1977.
Analysis shows that maximum seasonal vertical dis-
placements have stabilized in the recent years, which cannot
be said about residual vertical displacements that continue to
grow. This means that the upstream piers “rise,” which is re-
flected by their lower subsidence due to the inclination of the
pier toward the headrace, and return to the old position,
though not fully, after drawdown of the reservoir. This in-
complete return results in residual displacement that accu-
mulates. Since 1989 the “nonreturn” of the central arm at the
mark of 344 m has reached 8 mm (Fig. 7). In 2002 the
growth in residual vertical displacements of the dam stabi-
lized.
The growth in accumulated vertical displacements of the
dam can indicate formation of a loosening zone in the rock
bed.
Angles of slope of horizontal sections of the dam. An-
gles of slope of horizontal sections of the dam are measured
by transverse hydraulic elevation meters in dam galleries.
The results of the measurement are given in seconds, and the
minus sign denotes inclination toward the tailrace.
During filling of the storage reservoir the angles increase
due to the inclination of the dam to the tailrace; during
drawdown the angles decrease. Diagrams of the angles of
slope of the central arm of the dam at filled storage are pre-
sented in Fig. 8.
The presence of residual displacements affects the angles
of slope of horizontal sections of the dam, which is illus-
trated by the diagram of Fig. 9. As in the diagram of radial
displacements, we can see that the angles of slope change
markedly over the entire height of the central arm at the be-
ginning of works on crack curing in the body of the dam in
1996 and at the beginning of reconditioning of the founda-
tion of the dam in 1999. In 2002 the angles of slope began for
decrease, which indicates stabilization of the behavior of
the dam.
Behavior of the Dam of the Sayano-Shushenskaya HPP Before and After Reconditioning 87
Wat
erle
vel
sin
rese
rvoir
,m
Vertical displacements, mm
600
550
500
450
400
350
300–30 –25 –20 –15 –10 –5 0
1986
2001
200
2001
1985
1982 198
1978
1977
Fig. 6. Vertical displacements of pier 1 of section 33 from 1977 to
2001.
9
8
7
6
5
4
3
2
1
01988 1990 1992 1994 1996 1998 2000 2002
Years
Dis
pla
cem
ents
,m
m
Fig. 7. Residual vertical displacements of the central arm at a level
of 344 m.
Lev
els,
m
Angles of slope, sec
420
400
380
360
340
320
300–20 –40 –60 –80 –100
1993199419951996199719981999200020012002
Fig. 8. Angles of slope of horizontal sections of the central arm of
the dam at filled storage.
308
322
344
359
386
413
10
5
0
–5
–10
–15
–20
–25
–30
–35
1990 1992 1994 1996 1998 2000 2002
Angle
sof
slope,
sec
Years
Fig. 9. Angles of slope of horizontal sections of the central arm of
the dam at headrace level of 500 m (residual angles of slope).
CONCLUSIONS
1. Curing of cracks performed by a new technology has
decreased seepage through the body of the dam and the rock
bed by 99.5 and 78%, respectively.
2. After injection of epoxy grouts into cracks the growth
in absolute radial, tangential, and vertical displacements be-
gan to stabilize.
3. Diagrams of accumulated residual displacements re-
flect the process of growth in these displacements, which
may be explained by “compaction” of the ground in the abut-
ments of the dam. Growth in the accumulated residual verti-
cal displacements of the dam can indicate formation of a
loosening zone in the rock bed. In 2002 the residual radial
and vertical displacements showed a tendency to stabilize.
This process of “adaptation of the dam to its rock bed” is
sure to be accompanied by redistribution of stresses in the
body of the dam and in the abutments, as a result of which
new conditions are created for interaction within the dam –
bed system.
4. In 2002 the displacements and the angles of slope of
the dam started to decrease, which reflects the beginning of
stabilization of the behavior of the dam.
88 V. I. Bryzgalov and É. G. Gaziev