Embed Size (px)
Citation preview

Accep
ted M
anus
cript
Not Cop
yedit
ed
1
Behavior of Large-Scale Rectangular Columns Confined with FRP
Composites
H. Toutanjia, M. Hana, J. Gilbertb and S. Matthysc
aDept. of Civil and Env. Eng., University of Alabama in Huntsville, Huntsville, AL 35805, USA bDept. of Mechanical and Aerospace Eng., University of Alabama in Huntsville, Huntsville, AL
35805, USA cDept. of Structure Eng., Ghent University, Technologiepark-Zwijnaarde 9, B-9052, Gent,
Belgium
ABSTRACT
This paper focuses on axially loaded, large-scale rectangular reinforced concrete (RC) columns
confined with fiber reinforced polymer (FRP) wrapping. Experimental tests are conducted to
obtain the stress-strain response and ultimate load for three field size columns having different
aspect ratios and/or corner radii. Effective transverse FRP failure strain and the effect of
increasing confining action on the stress-strain behavior are examined. Existing strength models,
the majority of which were developed for small-scale specimens, are applied to predict the
structural response. Since some of them fail to adequately characterize the test data and others are
complex and require significant calculation, a simple design-oriented model is developed. The
new model is based on the confinement effectiveness coefficient, an aspect ratio coefficient, and
a corner radius coefficient. It accurately predicts the axial ultimate strength of the large-scale
columns at hand and, when applied to the small-scale columns studied by other investigators,
produces reasonable results.
Journal of Composites for Construction. Submitted June 10, 2008; accepted June 11, 2009; posted ahead of print June 22, 2009. doi:10.1061/(ASCE)CC.1943-5614.0000051
Copyright 2009 by the American Society of Civil Engineers
Accep
ted M
anus
cript
Not Cop
yedit
ed
2
Keywords: FRP; rectangular column; large-scale; axial strength; axial and lateral strain;
stress-strain response
INTRODUCTION
Confinement of concrete is an efficient technique to increase the load-carrying capacity and
ductility of RC concrete columns. Under the lateral confining pressure provided by the
confinement material, the concrete column is subjected to a tri-axial stress state, thereby
increasing the ultimate stress and strain.
Lateral confining action was initially accomplished by restraining the lateral expansion of
concrete columns with closely spaced steel stirrups. Since then, techniques have been developed
to upgrade and confine structures by means of FRP wrapping, independently, or in combination
with steel stirrups.
Investigators determined that the rectangular sections laterally confined using FRP were not
as effective as their circular counterparts. This was attributed to the higher stress concentration
found at the corners and the non-uniformity in confinement (Chaallal and Shahawy 2000).
Rounding a column’s corners has now become commonplace because it helps to reduce the
cutting edge effect on the confining sheets.
One early model used to predict the axial strength of rectangular columns was developed by
the International Conference of Building Officials (ICBO 1997). This model predicts the ultimate
axial strength of confined columns (f’cc) and the ultimate axial strength of unconfined columns
(f’co) for rectangular columns with aspect ratios (b/d) less than 1.5. Although other models have
been developed to predict the axial strength behavior of rectangular columns, the effects of aspect
ratio and section size on the ultimate load and stress-strain behavior have received limited
attention. Moreover, the majority of specimens tested to verify these models are relatively small
Journal of Composites for Construction. Submitted June 10, 2008; accepted June 11, 2009; posted ahead of print June 22, 2009. doi:10.1061/(ASCE)CC.1943-5614.0000051
Copyright 2009 by the American Society of Civil Engineers

Accep
ted M
anus
cript
Not Cop
yedit
ed
3
with cross sectional dimensions (d, b): d = 94mm (3.7in.), 108mm (4.25in.), 150mm (5.91in.),
152mm (5.98in.), and b = 108mm (4.25in.), 150mm (5.91in.), 152mm (5.98in.), 188mm (7.4in.),
203mm (7.99in.) (Lam and Teng 2003). It is therefore uncertain whether the existing models
developed to predict the axial strength characteristics of small-scale rectangular columns can be
applied to accurately characterize the behavior of their large-scale counterparts.
The current study focuses on two larger field-size columns 355x355mm (14x14in.) columns
with different radii, and one 250x500mm (10x20in.) column having the same radii as one of the
square samples confined with external FRP wrapping reinforcement. As far as the authors’
knowledge, these samples have the biggest size of all specimens tested by previous studies (Wang
and Restrepo 2001). The number of samples was limited due to the difficulty in testing these
larger structures, but the selections allow the effects of varying the aspect ratio (b/d), fiber
thickness, and corner radius to be examined. The effect of increasing confining strength and the
effective transverse FRP failure strain (defined as the transverse FRP strain at ultimate load εclu
over the FRP failure strain εfum) were also investigated.
RESEARCH SIGNIFICANCE
This paper provides an evaluation of the previously published models that predict the
ultimate axial strength and the entire stress-strain response of FRP-confined concrete and assess
their reliability against the results obtained from large-scale columns. The effect of confinement
on the ultimate failure strain of the FRP composite sheets is quantified. This paper should provide
a better understanding of the behavior of fiber-wrapped or FRP confined rectangular concrete
columns. The results presented in this paper should be used to predict the ultimate strength of
actual-size columns in the current retrofitting projects in the field.
Journal of Composites for Construction. Submitted June 10, 2008; accepted June 11, 2009; posted ahead of print June 22, 2009. doi:10.1061/(ASCE)CC.1943-5614.0000051
Copyright 2009 by the American Society of Civil Engineers

Accep
ted M
anus
cript
Not Cop
yedit
ed
4
EXPERIMENTAL PROCEDURE
Test Specimens and Material Properties
This study concentrates on non-circular columns, and is a part of a previous study done by
Matthys et al. (2005, 2006). The three large-scale RC rectangular columns described herein are
referred to as K9, K10, and K11; columns K1 though K8 were circular with results reported
elsewhere (Matthys et al. 2006), and column K1 was unwrapped. Schematic diagrams of the
confined columns along with their wrapping configuration are shown in Figure. 1. Each column
has a total length of 2m (6ft-7in.), a longitudinal steel reinforcement ratio of approximately 0.98%,
and 8mm (0.31in.) diameter stirrups spaced every 140mm (5.51in.). An extra stirrup
reinforcement is included at the columns’ ends. Columns K9 and K10 are square; K11 is
rectangular. All three have approximately the same cross sectional area, Ag = 125,000mm2
(193.75in2).
The concrete used to construct the columns has a mean compressive strength at 28 days of
38.2MPa (5.5ksi). The corners of the columns are rounded with radii of 30mm (1.18in.) (K9 and
K11) and 15mm (0.59in.) (K10).
CFRP (graphite) fabrics are used to confine the specimens. The ‘wet lay-up’ FRP type
reinforcement is impregnated and cured in-situ. The CFRP consists of a SyncoTape system,
comprised of quasi unidirectional fabric, TU600/25 (600g/m2 (0.1229lb/ft2) fibers in the main
direction and 25g/m2 (0.0051lb/ft2) in perpendicular direction), and PC 5800 epoxy. The fabric
has a width of 200mm (7.87in.) and a nominal thickness of 0.300mm (0.0118in.). The PC 5800 is
a solvent-free 2-component epoxy primer consisting of a resin (Component A) and a hardener
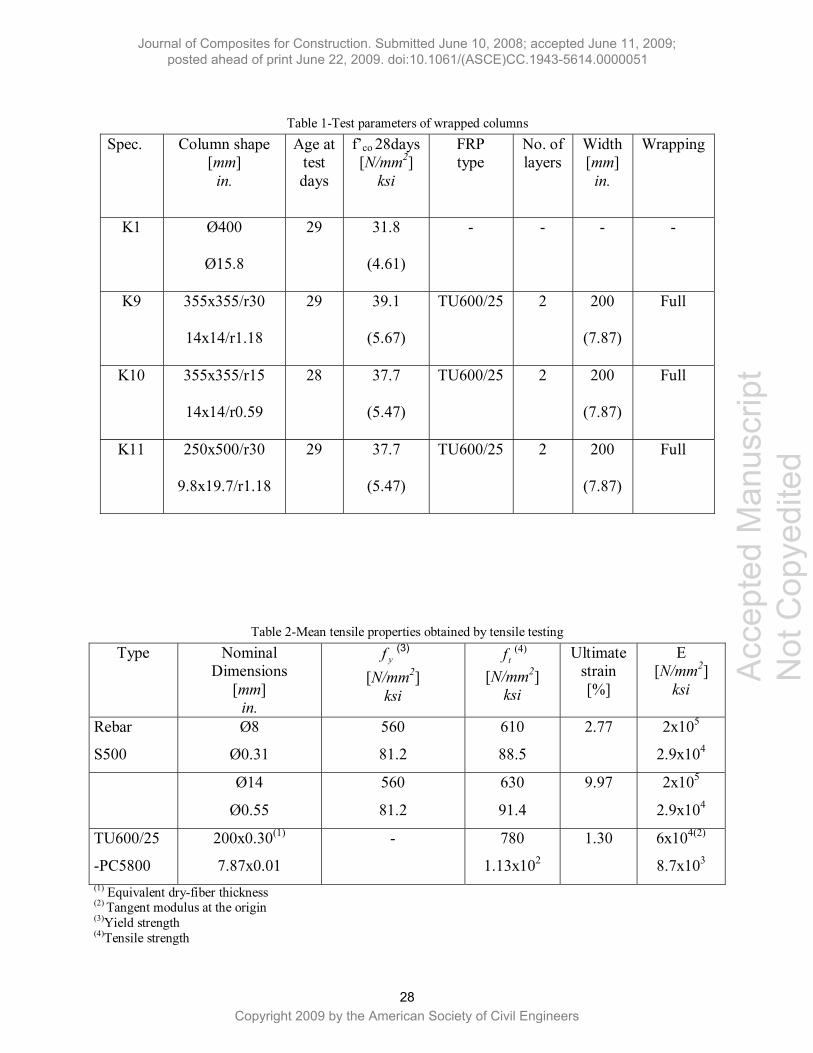
(Component B). The test parameters of the wrapped columns and the properties of the
reinforcement are given in Tables 1 and 2, respectively.
Journal of Composites for Construction. Submitted June 10, 2008; accepted June 11, 2009; posted ahead of print June 22, 2009. doi:10.1061/(ASCE)CC.1943-5614.0000051
Copyright 2009 by the American Society of Civil Engineers

Accep
ted M
anus
cript
Not Cop
yedit
ed
5
Specimen Preparation and Test Procedure
Test specimens and concrete quality control specimens were cast in the laboratory. The formwork
was removed after 1 day. Concrete curing took place under plastic foil during the first 7 days and
under laboratory conditions thereafter. Once the concrete columns were fully cured, they were
wrapped with FRP, following the manufacturer’s recommendations outlined in the next
paragraph.
Before the FRP was applied, the concrete surface was cleaned. The epoxy was prepared by
mixing 3 volumetric parts of component A (the resin) with 1 part of component B (the hardener).
This compound was deposited liberally on both surfaces of contact by using a paintbrush. A
uniform tensile force was applied to the fiber during application to ensure a tight wrap. Since the
tensile force was applied by hands, this force was kept as uniform as possible. Air was forced out
of the bonding layer using a customized roller. The FRP was applied a minimum of 7 and a
maximum of 9 days prior to the time that the columns were tested.
Each column was tested to failure in a displacement control mode; load was applied at a rate
of 0.5mm/min. The axial and transverse deformations of the columns were measured both
manually and electronically. Manual measurement relied on dial gauges having a gauge length of
1m (3.28ft) and mechanical extensometers with gauge lengths of 200mm (7.87in.) or 50mm
(1.97in.). Electronic measurements relied on strain gauges on the stirrups (with gauge lengths of
200mm (7.87in.) or 80mm (3.15in.)) and strain gauges on the vertical rebars.
TEST RESULTS
Behavior at Ultimate Load
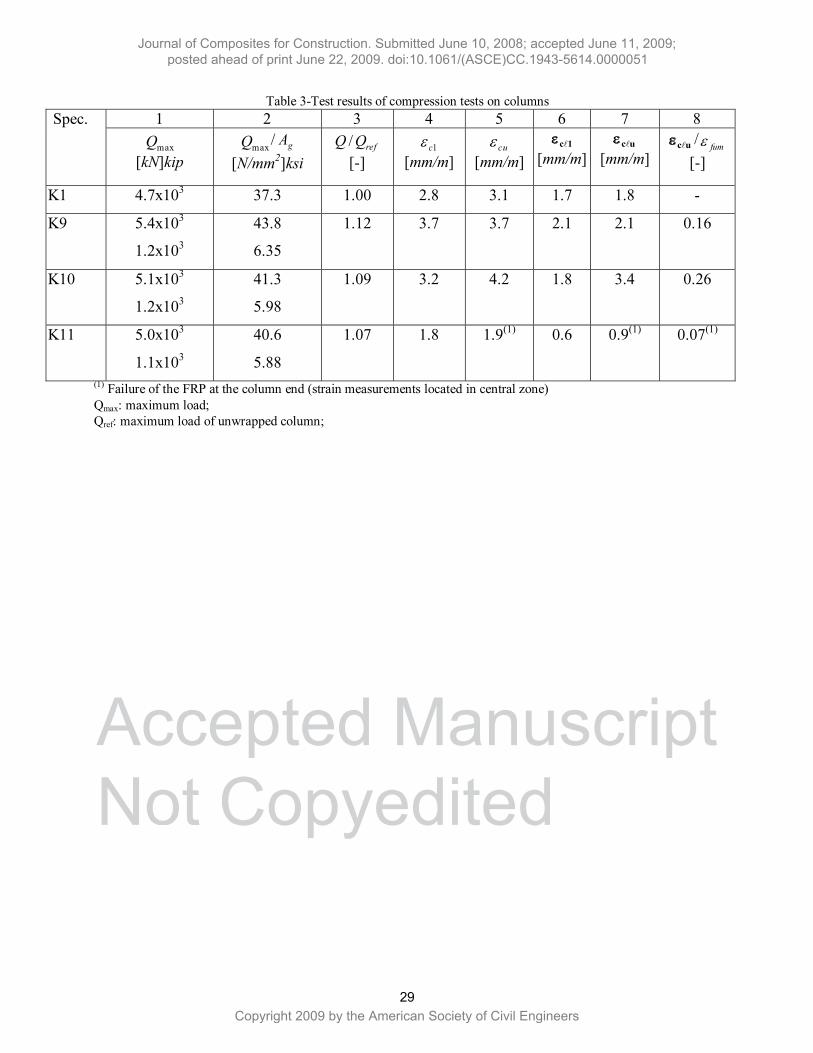
Table 3 shows test results including the maximum load, Qmax, the maximum stress, Qmax/Ag, and
the strength increase, Qmax/Qref, where Qref is the maximum load of unwrapped circular column
Journal of Composites for Construction. Submitted June 10, 2008; accepted June 11, 2009; posted ahead of print June 22, 2009. doi:10.1061/(ASCE)CC.1943-5614.0000051
Copyright 2009 by the American Society of Civil Engineers
Accep
ted M
anus
cript
Not Cop
yedit
ed
6
K1. Other quantities documented there include the axial ( c1 and cu) and transverse strains ( cl1
and εclu) at maximum and ultimate load, respectively. The last column lists the effective FRP
strain coefficient, (β=εclu/εfum), defined as the ratio of the transverse failure strain εclu to the
ultimate FRP tensile strain εfum. In all cases, the strains are the mean values taken from the strain
gauge measurements.
Figure 2 shows how the FRP reinforcement failed on the confined concrete columns that had
square cross sections but different radii. In both cases, the FRP reinforcement fractured just
beside one, or more, of the rounded corners. At ultimate load, when the confinement action was
no longer provided due to FRP fracture, the internal steel started to buckle and the crushed
concrete fell down between the fractured FRP. A similar trend was observed on the third column
that had the rectangular section.
Stress-Strain Behavior and Effectiveness of Wrapping Configuration
Figure 3 shows two sets of stress-strain curves generated while testing the columns. Both are
based on the axial stress; one set corresponds to the axial strain, the other to the transverse strain.
The square column with the larger corner radii (K9) has a strength increase of 1.12 (see Column 3,
Table 3) compared to the strength increase of 1.09 in the square column with the smaller corner
radii. Even though the rectangular column (K12) has the same corner radii as K9, it has the
smallest strength increase of all (1.07).
Figure 4 (ACI Committee 440 Report 2002) illustrates that the confining action occurs
predominately at the rounded corners. Unlike a circular section, for which the concrete core is
fully confined; for a square or rectangular section wrapped with FRP and with corners rounded
with a radius, a parabolic arching action is assumed for the concrete core where full confinement
is developed, which is indicating that the process of wrapping of rectangular sections becomes
Journal of Composites for Construction. Submitted June 10, 2008; accepted June 11, 2009; posted ahead of print June 22, 2009. doi:10.1061/(ASCE)CC.1943-5614.0000051
Copyright 2009 by the American Society of Civil Engineers

Accep
ted M
anus
cript
Not Cop
yedit
ed
7
more efficient when the corner radii are larger with corners situated closer together. Significantly
higher strength increases, ranging from 1.70 to 1.80, have been observed by researchers while
testing circular confined columns under axial loading (Matthys et al. 2005). Thus, it may be
concluded that, for square or rectangular sections, the wrapping becomes more efficient as the
cross section approaches a circular section (ACI Committee 440 Report 2002, Matthys et al. 2005
and 2006).
Behavior at Ultimate Strain and Effective FRP Strain Coefficient
According to the experimental results obtained by Matthys et al. (2006), the effective FRP strain
coefficient (the ratio of circumferential ultimate strain to ultimate strain of the FRP composite)
for fully wrapped circular columns ranged from 0.55 to 0.62. The results listed in the last column
of Table 3 reveal that this quantity is much smaller for rectangular columns.
Because of the knife-effect, the smaller the radii are around the corner, the smaller the
ultimate circumferential strain, and the smaller the effective FRP strain coefficient will get for the
same composite material that has stable tensile stress. The substantial decrease in this coefficient
for non-circular sections is attributed to the stress concentration and inhomogeneous strain that
occur in the corners of the column. It has been noted that these effects can be reduced by
rounding the corners; or, by locally strengthening them with strips of reinforcement prior to
continuous wrapping (Campione et al. 2004). The researchers cited preferred the first approach,
since it reduced the risk of fiber failure at the corners and increased the equivalent confinement
pressure (Campione et al. 2006).
Referring to the axes labeled on Figure 4, the maximum lateral (transverse) confinement
pressures (flu and fly) are (Matthys 1999):
Journal of Composites for Construction. Submitted June 10, 2008; accepted June 11, 2009; posted ahead of print June 22, 2009. doi:10.1061/(ASCE)CC.1943-5614.0000051
Copyright 2009 by the American Society of Civil Engineers

Accep
ted M
anus
cript
Not Cop
yedit
ed
8
cluconfxclu
confxfumconfxlux kkkf ' (1)
where fefxconfx Ekk and /'confxconfx kk
and cluconfyclu
confyfumconfyluy kkkf ' (2)
where fefyconfy Ekk and /'confyconfy kk .
As mentioned previously, the quantity, β, is referred to as the effective FRP strain coefficient
(β=εclu/εfum), defined as the ratio of the transverse failure strain εclu to the ultimate FRP tensile
strain εfum.
The ratios ρfx and ρfy reflect the amount of transverse confining reinforcement in the x and y
directions, respectively. These quantities can be expressed as
sd
tb jffx
2 (3)
sb
tb jffy
2 (4)
where bf is the width of the FRP, tj is the FRP thickness (total thickness in case of multiple layers),
and s is the center to center spacing of the FRP (s=bf for fully wrapped columns). b and d are
longer and shorter sides of rectangular section, respectively.
The confinement effectiveness confinement, ke, is given by
c
ee A
Ak
)1(3''
122
sggAdb
(5)
where Ag is the gross cross sectional area; and, ρsg is the reinforcement ratio of the longitudinal
steel reinforcement with respect to the gross cross sectional area (ρsg=As/Ag). b’=b-2r, d’=d-2r,
and r is corner radius.
Journal of Composites for Construction. Submitted June 10, 2008; accepted June 11, 2009; posted ahead of print June 22, 2009. doi:10.1061/(ASCE)CC.1943-5614.0000051
Copyright 2009 by the American Society of Civil Engineers

Accep
ted M
anus
cript
Not Cop
yedit
ed
9
Another parameter of interest is the confining stiffness defined as (Matthys et al. 2005):
clufj
conf DEt
k2
(6)
where fumclu (7)
and )(
2db
bdD . (8)
Stress-Strain Response Models
Figures 5-7 show the stress-strain plots obtained for the large-scale columns K9, K10, and
K11, respectively. The data are plotted along with behavior predicted by four models developed
by Lam and Teng (2003), Chaallal et al. (2003), Youssef (2004), and Harajli et al. (2006).
The three models developed by Lam and Teng, Youssef , and Harajli et al. all predicted the
stress-strain behavior quite well. The stress-strain model developed by Chaallal et al assumes a
tri-linear stress-strain curve and does not provide a very good representation of the experimental
data especially at higher stress/strain levels.
As far as strength is concerned, the model developed by Lam and Teng predicted the
maximum stress point and the corresponding axial strain reasonably well whereas both Youssef’s
model and the model developed by Harajli et al. predicted a lower maximum axial stress than
obtained experimentally. Moreover, Youssef’s model did not predict the stress-strain curves after
the transition point (when the axial strain exceeded 0.002mm/mm) and this model significantly
overestimated the ultimate axial strain in the columns.
Although the overall stress-strain behavior is important, the accurate prediction of strength is
critical to the design process. As discussed next, many other models have been developed to
pinpoint this parameter in rectangular columns confined with FRP. But these models were all
Journal of Composites for Construction. Submitted June 10, 2008; accepted June 11, 2009; posted ahead of print June 22, 2009. doi:10.1061/(ASCE)CC.1943-5614.0000051
Copyright 2009 by the American Society of Civil Engineers
Accep
ted M
anus
cript
Not Cop
yedit
ed
10
verified with small-scale specimens and, as the results of predicted-to-test ultimate load ratios
shown in Table 4, may not provide accurate results when applied to the large-scale columns
described herein.
EXISTING CONFINING MODELS FOR RECTANGULAR SECTION COLUMNS
ACI Committee 440 (ACI 440.2R 2002)
This model predicts the compressive strength (f’cc) and ultimate axial strain (εcu) for
FRP-confined rectangular concrete columns based on the arching action associated with
rectangular FRP-confined concrete. A shape factor ke is introduced that corresponds to the
confinement effectiveness coefficient defined in Eq. 5.
The compressive strength of the confined concrete is predicted by an equation, originally
proposed by Mander et al (1988) for steel-confined concrete, as:
254.1/2/94.71254.2 ''''''colcolcocc ffffff (9)
where f’l is the effective lateral confining pressure:
lel fkf ' . (10)
In the above equation, fl is an equivalent confining pressure given by:
D
tED
tf jclufjj
l
22 (11)
where D is the equivalent diameter of rectangular cross section, defined by Eq. 8;
fumclu 75.0004.0 . The ultimate axial strain εcu is:
c
cocccu E
ff )45(71.1 ''
(12)
where Ec is given by
Journal of Composites for Construction. Submitted June 10, 2008; accepted June 11, 2009; posted ahead of print June 22, 2009. doi:10.1061/(ASCE)CC.1943-5614.0000051
Copyright 2009 by the American Society of Civil Engineers

Accep
ted M
anus
cript
Not Cop
yedit
ed
11
'4730 coc fE . (13)
Mirmiran and Shahawy (1997)
In this model, the shape factor ke is defined as:
Drke
2 (14)
where D is still the equivalent diameter of rectangular cross section, and defined as the length of
the longest side of the rectangular section. The compressive strength is:
'1
''lcocc fkff (15)
where the effective lateral confining pressure, f’l (Eq. 10), is a function of the shape factor ke and
the equivalent confining pressure, fl. The confinement effectiveness coefficient, k1, is defined as:
3.01 0.6 lfk (16)
Campione and Miraglia (2003)
This model was developed exclusively for square columns with width, b, having rounded corners
of radius, r. The nominal hoop rupture stress in the FRP jacket, σj, is:
222
)22
1( iifrpj kbrkf (17)
where the ki is a stress reduction factor determined by regression analysis. The lateral confining
pressure is defined in terms of the FRP thickness, tj, by:
b
tf jj
l
2. (18)
Journal of Composites for Construction. Submitted June 10, 2008; accepted June 11, 2009; posted ahead of print June 22, 2009. doi:10.1061/(ASCE)CC.1943-5614.0000051
Copyright 2009 by the American Society of Civil Engineers

Accep
ted M
anus
cript
Not Cop
yedit
ed
12
Chaallal et al. (2003)
This model suggests a tri-linear stress-strain response consisting of three successive regions. The
first region depicts linear elastic behavior similar to that associated with unconfined concrete.
Very little concrete expansion occurs within this region. The second region is a transition zone
that begins when micro-cracking first occurs due to the confining pressure created by the FRP
wrapping. The third region reflects the point at which extensive cracking occurs in the concrete
core. The slope of the curve that characterizes this region is highly dependent on the FRP
stiffness.
The ultimate compressive strength of the confined concrete is given by:
kff cocc5'' 1012.4 (19)
where the stiffness coefficient, k, is given in terms of the cross sectional area of the concrete; and,
the elastic modulus of the fiber and concrete as:
cc
ff
AEAE
k . (20)
The term Af is the area of an inch-wide FRP sheet (Af=thickness x 1 in.). The ultimate axial strain
of the confined concrete (εcc) is predicted by:
'23 /)1503(10 cococc fkk (21)
where εco is the ultimate axial strain of unconfined concrete (εco=0.002 for concrete strength of
20.7MPa (3ksi) and 0.0024 for 41.4MPa (6ksi) concrete strength).
Journal of Composites for Construction. Submitted June 10, 2008; accepted June 11, 2009; posted ahead of print June 22, 2009. doi:10.1061/(ASCE)CC.1943-5614.0000051
Copyright 2009 by the American Society of Civil Engineers

Accep
ted M
anus
cript
Not Cop
yedit
ed
13
Youssef (2004)
In this model, the stress-strain curve consists of two parts. The first portion is a polynomial curve
extending from the initial conditions (fc,εc=0,0) to a transition point (ft, εt) loading. The second
portion begins at the transition point and extends linearly to the ultimate compressive strength of
the confined concrete. The curve in this region can be either ascending or descending depending
on the amount of FRP applied to the concrete core and the cross sectional geometry.
For stress-strain curves in which the second portion is ascending (E2>0) and determined by
the coordinates (ft, εt and f’cc, εcc),
1
211
1n
t
c
cccc E
En
Ef 02E (22)
where 0≤εc≤ εt and
ttc
tc
fEEE
n 2 . (23)
In a case where the second portion is descending (E2<0),
1
11
n
t
cccc n
Ef 02E (24)
where 0≤εc≤ εt .
The coordinates for the transition point are predicted by equations derived by regression
analysis:
45
'' 1350.10.1
co
jtffcot f
Eff (25)
Journal of Composites for Construction. Submitted June 10, 2008; accepted June 11, 2009; posted ahead of print June 22, 2009. doi:10.1061/(ASCE)CC.1943-5614.0000051
Copyright 2009 by the American Society of Civil Engineers
Accep
ted M
anus
cript
Not Cop
yedit
ed
14
21
76
'0775.0002.0f
frp
co
jtfft E
ffE
(26)
where εjt is the strain in the FRP at the transition point (0.002) and ffrp is the tensile strength of the
FRP sheet.
The ultimate compressive strength (fcu) and corresponding strain (εcu) of the confined
concrete are predicted by equations obtained from regression analysis:
53
'
'' 225.15.0
co
lcocu f
fff (27)
21
'
'
2625.0004325.0f
frp
co
lcu E
fff
(28)
where the effective lateral confining stress provided by the FRP wrapping at the ultimate
condition (f’l) is given by
frpfel fkf21' . (29)
Cusson and Paultre (1994)
This model predicts the compressive strength of confined concrete as:
])(1.21[ 7.0'
'''
co
lcocc f
fff . (30)
Razvi and Saatacioglu (1994)
In this model, the compressive strength is given by the additive relation:
Journal of Composites for Construction. Submitted June 10, 2008; accepted June 11, 2009; posted ahead of print June 22, 2009. doi:10.1061/(ASCE)CC.1943-5614.0000051
Copyright 2009 by the American Society of Civil Engineers
Accep
ted M
anus
cript
Not Cop
yedit
ed
15
83.0''' )(7.6 lcocc fff . (31)
Frangou et al. (1995)
This model, used as a design tool in Eurocode 8, specifies the increase in the maximum
compressive strength due to the applied lateral pressure as:
)25.1125.1(''wcocc ff 1.0w (32)
)5.21(''wcocc ff 1.0w (33)
where α is a reduction factor, expressing the effectiveness of confinement, and ωw is the
volumetric mechanical ratio.
Wang and Restrepo (2001)
This model holds for both square and rectangular columns. It is based on prior work performed
by Mander et al. (1988) who developed a model to calculate the increase in concrete compressive
strength due to confining pressure provided by transverse reinforcement in reinforced concrete
columns.
In the case of a rectangular section, the confining pressures in mutually orthogonal directions,
flx and fly are different. The confined concrete strength is given by
'21
'cocc ff (34)
where
]1/6.1)/84.71(8.1[25.1 ''1 colxcolx ffff (35)
and ]1/8.0)/(6.0/4.1[ 22 lylxlxlylxly ffffff . (36)
Journal of Composites for Construction. Submitted June 10, 2008; accepted June 11, 2009; posted ahead of print June 22, 2009. doi:10.1061/(ASCE)CC.1943-5614.0000051
Copyright 2009 by the American Society of Civil Engineers

Accep
ted M
anus
cript
Not Cop
yedit
ed
16
Harajli et al. (2006)
This model is an extension of the ACI 440 model discussed earlier. The compressive strength of
confined concrete is given by:
g
clslfcocc A
Affkff 1
'' . (37)
The value of the confinement effectiveness coefficient, 5.0'1 )
/(25.1
c
gcclslf
fAAff
k , where
2≤k1≤7.
Restrepo and Vino (1996)
In this model, the axial compressive strength of the confined member is:
'21
'cocc ff (38)
with 254.1294.71254.2 ''1co
x
co
x
ff
ff
(39)
and '2
2 ]8.04.1)(6.0[1co
x
x
y
x
y
ff
ff
ff
(40)
where flx and fly are the lateral confinement pressures induced by the FRP wrapping reinforcement
on a square or rectangular cross-section in x and y directions, respectively.
International Conference of Building Official (ICBO 1997)
For rectangular sections with an aspect ratio (b/d) less than 1.5, the enhanced compressive
strength is given by:
)cos51( 2''fcocc ff . (41)
Journal of Composites for Construction. Submitted June 10, 2008; accepted June 11, 2009; posted ahead of print June 22, 2009. doi:10.1061/(ASCE)CC.1943-5614.0000051
Copyright 2009 by the American Society of Civil Engineers

Accep
ted M
anus
cript
Not Cop
yedit
ed
17
Lam and Teng (2003)
This design-oriented model is an extension of a stress-stain model initially developed for
uniformly confined concrete columns having circular cross sections. For a rectangular section, the
compressive strength and ultimate axial strain are predicted by the following equations:
lscocc fkkff 11'' (42)
45.0
'2275.1co
clu
co
ls
co
cu
ff
kk (43)
where the terms ks1 and ks2 are the enhancement factors, and k1 and k2 are constant values found
by means of regression analysis.
Proposed Compressive Strength Model
The performance of a rectangular FRP-confined concrete column depends on several parameters
including the mechanical properties of the confining material and geometrical factors such as the
aspect ratio (b/d) and corner radii.
This study has shown that the overall increase in a column’s strength reduces with increasing
aspect ratio. Square columns experience the highest strength increase while columns fabricated
with progressively larger radii lead to higher strength gains. These trends have been observed by
others (Matthys 1999; Lam and Teng 2003; Eugene 2005) and must be considered to accurately
predict the compressive strength of a large-scale FRP-confined concrete column.
To this end, a model is suggested based on the linear equation initially proposed by Richart
et al. (1929) for uniformly confined concrete:
lcocc fkff 1'' . (44)
Journal of Composites for Construction. Submitted June 10, 2008; accepted June 11, 2009; posted ahead of print June 22, 2009. doi:10.1061/(ASCE)CC.1943-5614.0000051
Copyright 2009 by the American Society of Civil Engineers
Accep
ted M
anus
cript
Not Cop
yedit
ed
18
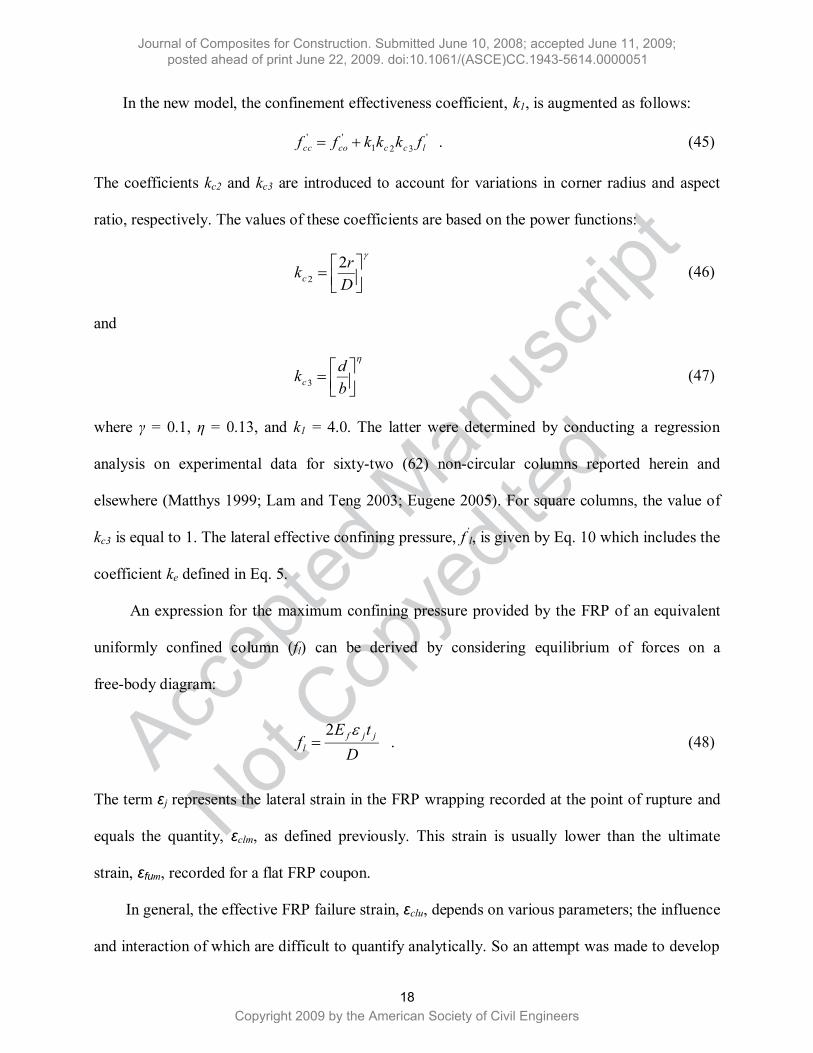
In the new model, the confinement effectiveness coefficient, k1, is augmented as follows:
'321
''lcccocc fkkkff . (45)
The coefficients kc2 and kc3 are introduced to account for variations in corner radius and aspect
ratio, respectively. The values of these coefficients are based on the power functions:
Drkc
22 (46)
and
bdkc3 (47)
where γ = 0.1, η = 0.13, and k1 = 4.0. The latter were determined by conducting a regression
analysis on experimental data for sixty-two (62) non-circular columns reported herein and
elsewhere (Matthys 1999; Lam and Teng 2003; Eugene 2005). For square columns, the value of
kc3 is equal to 1. The lateral effective confining pressure, f’l, is given by Eq. 10 which includes the
coefficient ke defined in Eq. 5.
An expression for the maximum confining pressure provided by the FRP of an equivalent
uniformly confined column (fl) can be derived by considering equilibrium of forces on a
free-body diagram:
D
tEf jjf
l
2 . (48)
The term εj represents the lateral strain in the FRP wrapping recorded at the point of rupture and
equals the quantity, εclm, as defined previously. This strain is usually lower than the ultimate
strain, εfum, recorded for a flat FRP coupon.
In general, the effective FRP failure strain, εclu, depends on various parameters; the influence
and interaction of which are difficult to quantify analytically. So an attempt was made to develop
Journal of Composites for Construction. Submitted June 10, 2008; accepted June 11, 2009; posted ahead of print June 22, 2009. doi:10.1061/(ASCE)CC.1943-5614.0000051
Copyright 2009 by the American Society of Civil Engineers

Accep
ted M
anus
cript
Not Cop
yedit
ed
19
an empirical relationship between the effective FRP strain coefficient, β and the confining
stiffness, kconf. A plot of these parameters for all 62 columns found in the literature mentioned
above is shown in Figure 8.
A regression analysis was performed on this data in an attempt to obtain a simple design
equation for the lateral confinement pressure. The analysis revealed that the optimum value of β
was 0.43, making:
fumj 43.0 . (49)
The model can also be applied to an equivalent circular column having a diameter, D, given by
Eq. 8.
DISCUSSION
Table 4 shows a comparison of the theoretical compressive strength values, predicted by all of the
models cited above, with the experimental results taken for the large-scale columns studied
herein. The new model predicts the axial ultimate stress of these field size columns very well.
The new model was also applied to predict the compressive strength of the all of the
specimens considered during its development. Figure 9 shows the results for fifty-nine
small-scale columns and three field size columns; a good correlation is observed.
CONCLUSIONS
In this study, the existing ultimate axial strength and stress-strain models are reviewed; and,
comparisons made with experimental data taken from large-scale rectangular columns. During
this process, a simple design-oriented model was developed to predict the ultimate axial strength.
The latter takes into account the confinement effectiveness coefficient, the aspect ratio, and
Journal of Composites for Construction. Submitted June 10, 2008; accepted June 11, 2009; posted ahead of print June 22, 2009. doi:10.1061/(ASCE)CC.1943-5614.0000051
Copyright 2009 by the American Society of Civil Engineers
Accep
ted M
anus
cript
Not Cop
yedit
ed
20
corner radii. Due to the cost and labor associated with making large size specimens, this study is
based on a limited number of columns. More columns with number of FRP layers should be made
to verify the results and the new developed FRP model.
The following conclusions can be drawn for non-circular columns:
1. Higher aspect ratios result in lower confinement strength.
2. Confinement compressive strength increases as the corner radii increase.
3. Models developed by Lam and Teng and Youssef are slightly underestimate the
experimental curve except that Youssef’s model slightly overestimate the experimental
curve in K11. Overall, all models seem to perform quite well in the pre-peak stage.
However, the models produce great scatter in terms of predictions of the post-peak
behavior. The models developed by Harajili et al. and Youssef have decreasing branches
which is quite different from the experimental curve shape. It seems that these two models
overly underestimate the test results at the ultimate state. Chaallal’s model is intended to
over predict the experimental curve in the post-peak region. Also the three-line curve of
Chaallal’s model does not quite fit the smooth experimental curve. Generally, Lam and
Teng’s model perform the best among all evaluated models in terms of shape and critical
values.
The new model accurately predicts the ultimate axial strength for both small and large scale
rectangular columns. However, additional testing on large-scale specimens must be done to better
establish validity.
Notation
The following symbols are used in this paper:
Journal of Composites for Construction. Submitted June 10, 2008; accepted June 11, 2009; posted ahead of print June 22, 2009. doi:10.1061/(ASCE)CC.1943-5614.0000051
Copyright 2009 by the American Society of Civil Engineers
Accep
ted M
anus
cript
Not Cop
yedit
ed
21
cA = total area of concrete;
eA = area of effectively confined concrete;
fA = area of an inch width FRP sheet;
gA = gross cross-sectional area;
db, = longer and shorter sides of rectangular section;
'' ,db = rddrbb 2,2 '' ;
fb = width of the FRP;
D = equivalent diameter of rectangular cross section;
2E = tangent of the second part of stress-strain curve in Youssef’s model;
cE = elastic modulus of unconfined concrete;
fE = elastic modulus of FRP fiber;
lsE = modulus of elasticity the transverse reinforcement;
cf = y coordinate for stress-strain curve;
'ccf = maximum axial strength of confined columns;
'cof = maximum axial strength of unconfined columns;
cuf = ultimate axial compressive strength;
lf = equivalent confining pressure;
'lf = effective lateral confining pressure;
lff = lateral confining pressure exerted by the FRP;
lsf = lateral confining pressure exerted by the transverse steel;
Journal of Composites for Construction. Submitted June 10, 2008; accepted June 11, 2009; posted ahead of print June 22, 2009. doi:10.1061/(ASCE)CC.1943-5614.0000051
Copyright 2009 by the American Society of Civil Engineers

Accep
ted M
anus
cript
Not Cop
yedit
ed
22
luf = maximum lateral confinement pressure;
luylux ff , = maximum lateral confinement pressure on x and y direction;
tf = y coordinate of transition point;
k = stiffness coefficient;
21,kk = confinement effectiveness coefficient for stress and strain;
2ck = coefficient of effect of varying the corner radius;
3ck = coefficient of effect of aspect ratio;
confk = confining stiffness;
confyconfx kk , = confining stiffness on x and y direction;
'' , confyconfx kk = effective confining stiffness on x and y direction;
ek = shape factor;
ik = stress reduction factor;
1sk = strength enhancement factors;
2sk = strain enhancement factors;
k = FRP efficiency factor;
r = corner radius;
s = center to center spacing of the FRP;
jt = FRP thickness (total thickness in case of multiple layers);
= reduction factor, expressing the effectiveness of confinement;
1 = strength enhancement coefficients caused by lateral confinement pressure on x
direction (Restrpo and Vino’s model);
Journal of Composites for Construction. Submitted June 10, 2008; accepted June 11, 2009; posted ahead of print June 22, 2009. doi:10.1061/(ASCE)CC.1943-5614.0000051
Copyright 2009 by the American Society of Civil Engineers
Accep
ted M
anus
cript
Not Cop
yedit
ed
23
2 = strength enhancement coefficients caused by ratio of lateral confinement
pressure on x and y direction (Restrpo and Vino’s model);
= effective FRP strain coefficient;
, = coefficients based on regression analysis;
c = x coordinate of stress-strain curve;
fum = FRP failure strain;
1c = axial strain at maximum load;
cu = axial strain at failure load;
1c = circumferential strain at maximum load;
clu = circumferential strain at failure load;
co = ultimate axial strain of unconfined concrete columns;
j = nominal hoop rupture strain of an equivalent circular column;
jt = strain in the FRP at the transition point;
o = yield strain of ordinary transverse hoops or 0.002 if no internal confinement
by ordinary transverse steel is available;
t = x coordinate of transition point;
yt = yield strain of ordinary transverse hoops;
= angle of inclination of the fibers to the longitudinal axis of the member;
f = quantities of transverse confining reinforcement;
fyfx , = quantities of transverse confining reinforcement in the x and y direction;
Journal of Composites for Construction. Submitted June 10, 2008; accepted June 11, 2009; posted ahead of print June 22, 2009. doi:10.1061/(ASCE)CC.1943-5614.0000051
Copyright 2009 by the American Society of Civil Engineers

Accep
ted M
anus
cript
Not Cop
yedit
ed
24
sg = reinforcement ratio of the longitudinal steel reinforcement with respect to the
gross sectional area;
j = nominal hoop rupture stress in the FRP jacket;
w = volumetric mechanical ratio.
Journal of Composites for Construction. Submitted June 10, 2008; accepted June 11, 2009; posted ahead of print June 22, 2009. doi:10.1061/(ASCE)CC.1943-5614.0000051
Copyright 2009 by the American Society of Civil Engineers

Accep
ted M
anus
cript
Not Cop
yedit
ed
25
REFERENCES
ACI Committee 440 Report. (2002). “Guide for the design and construction of externally bonded
FRP systems for strengthening concrete structure.” ACI 440.2R-02, Detroit.
Campione, G., and Miraglia, N. (2003). “Strength and strain capacities of concrete compression
members reinforced with FRP.” Cem. Concr. Compos., 25:31-41.
Campione, G., Miraglia, N., and Papia, M. (2004). “Strength and strain enhancements of concrete
columns confined with FRP sheets.” Struct. Eng. Mech., 18(6): 769-790.
Campione, G., Miraglia, N., and Papia, M. (2006). “Influence of radius of corners in concrete
columns confined with FRP sheets.” 3rd Int. Conf. on FRP Compos. in Civ. Eng.,
Miami ,Florida, USA. (On CD-ROM).
Chaallal, O., and Shahawy, M. (2000). “Performance of fiber-reinforced polymer-wrapped
reinforced concrete column under combined axial-flexural loading.” ACI Struct. J.,
97(4):659-668.
Chaallal, O., Hassan, M., and Shahawy, M. (2003). “Confinement model for axially loaded short
rectangular columns strengthened with fiber-reinforced polymer wrapping.” ACI Struct. J.,
100(2):215-221.
Cusson, D., and Paultre, P. (1994). “Confinement model for high-strength concrete tied
columns.” Report MS-93/02, 54 pages, University of Sherbrooke, Canada.
Eugene, A. (2005). “Stress-strain behavior of rectangular columns confined with CFRP
composites.” Master’s Thesis, University of Alabama in Huntsville, Huntsville, AL.
Frangou, M., Pilakoutas, K., and Dritsos, S.E. (1995). “Structural repair/strengthening of RC
columns.” Constr. and Building Mater., 9(5): 259-265.
Journal of Composites for Construction. Submitted June 10, 2008; accepted June 11, 2009; posted ahead of print June 22, 2009. doi:10.1061/(ASCE)CC.1943-5614.0000051
Copyright 2009 by the American Society of Civil Engineers

Accep
ted M
anus
cript
Not Cop
yedit
ed
26
Harajli, M.H., Hantouche, E., and Soudki, K. (2006). “Stress-strain model for fiber-reinforced
polymer jacketed concrete columns.” ACI Struct. J., 103(69):672-681.
ICBO. (1997). “Acceptance criteria for concrete and reinforced and unreinforced masonry
strengthening using fiber-reinforced composite systems.” ICBO Evaluation Service,
Whittier, California.
Jiang, T., and Teng, J.G. (2006). “Strengthening of short circular RC columns with FRP jackets: a
design proposal.” 3rd Int. Conf. on FRP Compos. in Civ. Eng., Miami,Florida, USA. (On
CD-ROM)
Lam, L., and Teng, J.G. (2003). “Design-oriented stress-strain model for FRP-confined concrete
in rectangular columns.” J. of Reinforced Plastics and Compos., 22(13): 1149-1185.
Mander, J.B., Priestley, M.J.N., and Park, R. (1988). “Theoretical stress-strain model for confined
concrete.” J. Struct. Eng., ASCE, 114(8): 1804-1826.
Matthys, S. (1999). “Structural behavior and design of concrete members strengthened with
externally bonded FRP reinforcement.” Thesis in fulfillment of the requirements for the
degree of Doctor of Applied Sciences, option Structural Engineering. Ghent University,
Belgium. 345 Pages.
Matthys, S., Toutanji, H., Audenaert, K., and Taerwe, L. (2005). “Axial load behavior of
large-scale columns confined with fiber-reinforced polymer composites.” ACI Struct. J.,
102(2):258-267.
Matthys, S., Toutanji, H., and Taerwe, L. (2006). “Stress-strain behavior of large-scale circular
columns confined with FRP composites.” J. Struct. Eng., ASCE, 132(1): 123-133.
Mirmiran, A., and Shahawy, M. (1997). “Behavior of concrete columns confined by fiber
composites.” J. Struct. Eng., ASCE, 123(5): 583-590.
Journal of Composites for Construction. Submitted June 10, 2008; accepted June 11, 2009; posted ahead of print June 22, 2009. doi:10.1061/(ASCE)CC.1943-5614.0000051
Copyright 2009 by the American Society of Civil Engineers

Accep
ted M
anus
cript
Not Cop
yedit
ed
27
Razvi, S.R., and Saatcioglu, M. (1994). “Strength and deformability of confined high-strength
concrete columns.” ACI Struct. J., 91(6): 678-687.
Restrepo, J.I., and Vino, B.D. (1996). “Enhancement of the axial load carrying capacity of
reinforced concrete columns by means of fiber glass-epoxy jackets.” Proc., 2nd. Int. Conf.
On Adv. Compos. Mater. in Brid. Struct., 547-554, the Canadian Society for Civil
Engineering, Montreal, Quebec, Canada.
Richart, F.E., Brandtzaeg, A., and Brown, R.L. (1929). “The failure of plain and spiral ly
reinforced concrete in compression.” Bulletin 190, University of Illinois Engineering
Experimental Station, Champaign, Illinois.
Spoelstra, M.R., and Monti, G. (1999). “FRP-confined concrete model.” J. Compos. Constr.,
ASCE, 3(3): 143-150.
Youssef, M.N. (2004). “Stress-strain model for concrete confined by FRP composites.” Ph.D.
Dissertation, University of California, Irvine.
Wang, Y.C., and Restrepo, J.I. (2001). “Investigation of Concentrically Loaded Reinforced
Concrete Columns Confined with Glass Fiber-Reinforced Polymer Jackets.” ACI Struct. J.,
98(3):377-385.
Journal of Composites for Construction. Submitted June 10, 2008; accepted June 11, 2009; posted ahead of print June 22, 2009. doi:10.1061/(ASCE)CC.1943-5614.0000051
Copyright 2009 by the American Society of Civil Engineers
Acc
epte
d M
anus
crip
t N
ot C
opye
dite
d
28
Table 1-Test parameters of wrapped columns
Spec. Column shape [mm]
in.
Age at test days
f’co 28days [N/mm2]
ksi
FRP type
No. of layers
Width [mm]
in.
Wrapping
K1 Ø400
Ø15.8
29 31.8
(4.61)
- - - -
K9 355x355/r30
14x14/r1.18
29 39.1
(5.67)
TU600/25 2 200
(7.87)
Full
K10 355x355/r15
14x14/r0.59
28 37.7
(5.47)
TU600/25 2 200
(7.87)
Full
K11 250x500/r30
9.8x19.7/r1.18
29 37.7
(5.47)
TU600/25 2 200
(7.87)
Full
Table 2-Mean tensile properties obtained by tensile testing Type Nominal
Dimensions [mm]
in.
yf (3)
[N/mm2] ksi
tf (4) [N/mm2]
ksi
Ultimate strain [%]
E [N/mm2]
ksi
Rebar
S500
Ø8
Ø0.31
560
81.2
610
88.5
2.77 2x10⁵
2.9x10⁴
Ø14
Ø0.55
560
81.2
630
91.4
9.97 2x10⁵
2.9x10⁴
TU600/25
-PC5800
200x0.30(1)
7.87x0.01
- 780
1.13x10²
1.30 6x10⁴(2)
8.7x10³ (1) Equivalent dry-fiber thickness (2) Tangent modulus at the origin (3)Yield strength (4)Tensile strength
Journal of Composites for Construction. Submitted June 10, 2008; accepted June 11, 2009; posted ahead of print June 22, 2009. doi:10.1061/(ASCE)CC.1943-5614.0000051
Copyright 2009 by the American Society of Civil Engineers
Accepted Manuscript Not Copyedited
29
Table 3-Test results of compression tests on columns Spec. 1 2 3 4 5 6 7 8
maxQ
[kN]kip maxQ / gA
[N/mm2]ksi refQQ /
[-] 1c
[mm/m] cu
[mm/m] 1c
[mm/m] uc
[mm/m] uc / fum
[-]
K1 4.7x10³ 37.3 1.00 2.8 3.1 1.7 1.8 -
K9
5.4x10³
1.2x10³
43.8
6.35
1.12
3.7 3.7 2.1 2.1 0.16
K10
5.1x10³
1.2x10³
41.3
5.98
1.09 3.2 4.2 1.8 3.4 0.26
K11
5.0x10³
1.1x10³
40.6
5.88
1.07 1.8 1.9(1) 0.6 0.9(1) 0.07(1)
(1) Failure of the FRP at the column end (strain measurements located in central zone) Qmax: maximum load; Qref: maximum load of unwrapped column;
Journal of Composites for Construction. Submitted June 10, 2008; accepted June 11, 2009; posted ahead of print June 22, 2009. doi:10.1061/(ASCE)CC.1943-5614.0000051
Copyright 2009 by the American Society of Civil Engineers

Accepted Manuscript Not Copyedited
30
Table 4-Comparison of difference ratio for '
ccf between each model and experimental data
'ccf for Each Specimen
'ccf for Each Model
K9 43.8MPa 6.35ksi
K10 41.3MPa 5.98ksi
K11 40.6MPa 5.88ksi
ACI 440 Harajli Lam and Teng Mirmiran Campione and Miraglia Challal Youssef Cusson and Paultre Razvi and Saatacioglu Richart ICBO Frangou Restrepo and Vino New proposed
-4.0% 40.9% -6.3% -6.2% -4.6% 5.5% -9.8% -2.7% -3.1% -6.6% -7.7% -6.5% -2.9%
-0.61%
-8.2% 44.4% -3.8% -5.2% -3.9% 9.9% -6.8% -3.4% 0.2% -4.1% -4.5% -3.2%
-0.84% -0.24%
-6.6% 41.3% -5.3% -6.3%
- 11.7% -5.3% 0.7% 0.2% -3.0%
- -2.1% -1.1% 1.1%
Journal of Composites for Construction. Submitted June 10, 2008; accepted June 11, 2009; posted ahead of print June 22, 2009. doi:10.1061/(ASCE)CC.1943-5614.0000051
Copyright 2009 by the American Society of Civil Engineers

Accep
ted M
anus
cript
Not Cop
yedit
ed
31
List of figures captions:
Fig. 1 Column dimensions and wrapping configuration.
Fig. 2 Confined concrete columns failed by fracture of the FRP after testing.
Fig. 3 Stress-strain behavior of non-circular columns.
Fig. 4 Effective confined region of rectangular column due to arching action. (ACI Committee
440 Report 2002)
Fig. 5 Evaluation of the stress-strain models against tested column specimen K9.
Fig. 6 Evaluation of the stress-strain models against tested column specimen K10.
Fig. 7 Evaluation of the stress-strain models against tested column specimen K11.
Fig. 8 Effective FRP Failure Strain coefficient.
Fig. 9 Performance of newly proposed strength model against 59 data points.
Journal of Composites for Construction. Submitted June 10, 2008; accepted June 11, 2009; posted ahead of print June 22, 2009. doi:10.1061/(ASCE)CC.1943-5614.0000051
Copyright 2009 by the American Society of Civil Engineers

Fig. 1.pdf
Accepted Manuscript Not Copyedited
Journal of Composites for Construction. Submitted June 10, 2008; accepted June 11, 2009; posted ahead of print June 22, 2009. doi:10.1061/(ASCE)CC.1943-5614.0000051
Copyright 2009 by the American Society of Civil Engineers

Fig. 2.pdf
Accepted Manuscript Not Copyedited
Journal of Composites for Construction. Submitted June 10, 2008; accepted June 11, 2009; posted ahead of print June 22, 2009. doi:10.1061/(ASCE)CC.1943-5614.0000051
Copyright 2009 by the American Society of Civil Engineers

Fig. 3.pdf
Accepted Manuscript Not Copyedited
Journal of Composites for Construction. Submitted June 10, 2008; accepted June 11, 2009; posted ahead of print June 22, 2009. doi:10.1061/(ASCE)CC.1943-5614.0000051
Copyright 2009 by the American Society of Civil Engineers

Fig. 4.pdf
Accepted Manuscript Not Copyedited
Journal of Composites for Construction. Submitted June 10, 2008; accepted June 11, 2009; posted ahead of print June 22, 2009. doi:10.1061/(ASCE)CC.1943-5614.0000051
Copyright 2009 by the American Society of Civil Engineers

Fig. 5.pdf
Accepted Manuscript Not Copyedited
Journal of Composites for Construction. Submitted June 10, 2008; accepted June 11, 2009; posted ahead of print June 22, 2009. doi:10.1061/(ASCE)CC.1943-5614.0000051
Copyright 2009 by the American Society of Civil Engineers
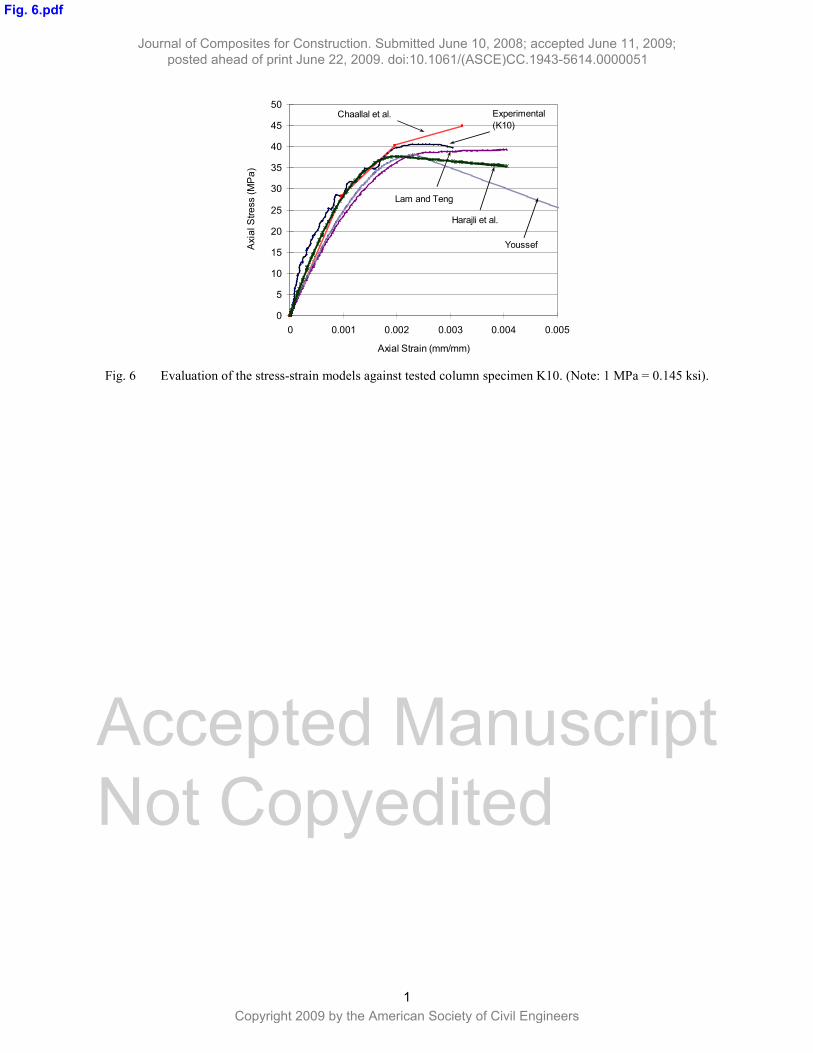
Fig. 6.pdf
Accepted Manuscript Not Copyedited
Journal of Composites for Construction. Submitted June 10, 2008; accepted June 11, 2009; posted ahead of print June 22, 2009. doi:10.1061/(ASCE)CC.1943-5614.0000051
Copyright 2009 by the American Society of Civil Engineers

Fig. 7.pdf
Accepted Manuscript Not Copyedited
Journal of Composites for Construction. Submitted June 10, 2008; accepted June 11, 2009; posted ahead of print June 22, 2009. doi:10.1061/(ASCE)CC.1943-5614.0000051
Copyright 2009 by the American Society of Civil Engineers

Fig. 8.pdf
Accepted Manuscript Not Copyedited
Journal of Composites for Construction. Submitted June 10, 2008; accepted June 11, 2009; posted ahead of print June 22, 2009. doi:10.1061/(ASCE)CC.1943-5614.0000051
Copyright 2009 by the American Society of Civil Engineers

Fig. 9.pdf
Accepted Manuscript Not Copyedited
Journal of Composites for Construction. Submitted June 10, 2008; accepted June 11, 2009; posted ahead of print June 22, 2009. doi:10.1061/(ASCE)CC.1943-5614.0000051
Copyright 2009 by the American Society of Civil Engineers