Embed Size (px)
Citation preview
TRANSPORTATION RESEARCH RECORD 1307 129
Behavior of a Rigid Pavement Under Moving Dynamic Loads
MUHAMMAD A. NASIM, STEVEN M. KARAMIHAS, THOMAS D. GILLESPIE,
WILL HANSEN, AND DAVID CEBON
Computer programs for calculating strain histories in rigid pavements under heavy-truck traffic have been developed. A finiteelement structural model, ILLI-SLAB, was modified to generate influence functions, which are combined with the dynamic loads under the wheels of a truck to predict the strain time histories at points of interest in the pavement. Using experimental measurements of pavement response, it is demonstrated that these programs are capable of predicting strains in a rigid pavement when the truck dynamic loads and pavement properties are known. Variations in truck speed cause some variations in strain not replicated by the pavement model, which has no speed-dependent effects. Behavior in the vicinity of a pavement crack is difficult to predict because of the unknown load transfer properties of the crack, the inconsistent load transfer performance from test to test, and an apparent but unexplained sensitivity of load transfer performance to truck travel speed.
Pavements deteriorate because of many factors, one of these being the moving dynamic loads of heavy vehicles. Rigid pavement structures are traditionally analyzed by examining the stress and strain responses in the vicinity of a static load imposed on the surface of a plate supported by an elastic foundation (1-3). The analyses have been extended by consideration of nonlinear foundation models ( 4) and, to a limited extent, inclusion of dynamic axle loads (5). Few rigid pavement models have been validated by comparison with field experiments. Although static analysis provides a systematic method to quantify the load-bearing properties of a pavement structure, it does not lend itself to analysis of the cyclic stresses and strains caused by the moving dynamic loads of a passing truck. At best the static analysis methods only allow static responses from the analytical computations to be compared with experimental measurements. In the absence of a developed methodology for computing localized response to a passing truck, the analyst is hindered in studying the mechanics of the truck loading and pavement response process.
In NCHRP Project 1-25(1) (6), the interaction of trucks and pavements is being investigated by an analytical approach. The analytical tools that have been developed in the conduct of this work provide an opportunity for the first time to compare theoretical predictions of strain time histories by rigid pavement models with experimental measurements. The
M. A. Nasim and W. Hansen, Department of Civil Engineering, The University of Michigan, GG Brown Building, Ann Arbor, Mich. 48109. S. M. Karamihas and T. D. Gillespie, The University of Michigan Transportation Research Institute, 2901 Baxter Road, Ann Arbor, Mich. 48109. D. Cebon, Department of Mechanical Engineering, Cambridge University Engineering Department, Cambridge, CB2 lPZ, England.
methodology used and the agreement that can be obtained with experimental measurements are described in the following paragraphs.
RIGID PAVEMENT MODEL
The most commonly accepted method of modeling rigid pavement structures is with a finite element representation of the slab supported by an elastic base. Numerous models have been developed for this purpose (3, 7-10), most being functionally similar to the ILLI-SLAB program developed by the University of Illinois (7), which was made available for use in this work.
ILLI-SLAB is a static model capable of calculating pavement response at any location as a consequence of a singlepoint load defined by a pressure applied to a contact area. The input to ILLI-SLAB is a parameter list describing the pavement design, the finite element mesh to be used, and the load and its application point. The pavement design parameters are thickness of slab and subbase (if any), elastic modulus of the slab and subbase, modulus of subgrade reaction, and joint information (such as load transfer devices and width of joints). Dowels are described in terms of material properties and dimensional information. Special attention is given to joints allowing treatment in four ways: doweled joints, joints with aggregate interlock, joints with dowels and aggregate interlock, and free joints. For doweled joints, torsion, moment, and shear effects of the dowel bars can be selectively considered.
The finite element mesh is described by the coordinates of a rectangular grid of nodes. Up to 10 slabs can be modeled in the longitudinal direction, but this procedure requires considerable computer memory. It is usually necessary to model at least three slabs with two joints to properly represent end effects. The load is defined by a pressure acting over a rectangular area on the pavement slab. The program calculates the stresses and deflections at each node of the finite element mesh. It generates a printed output of the response at all points selected by the user.
In order to calculate the pavement response to a load moving along the surface, an approach that incorporates influence functions can be used. Because the load from a truck wheel moves along a wheelpath, it is sufficient to know how the stress or strain response at a point of interest is influenced by a load applied anywhere on the wheelpath. This relationship between applied load and the response at a point of interest
130
is called an influence function. The influence function is defined as follows:
(1)
where
l,i = influence function for Point j caused by a load at Point i;
Ri = response (stress, strain, or deflection) at Point j; and L, = load at Point i.
Because the pavement models are linear, the influence function is not load dependent, and the response to loading from the multiple wheels of a truck can be determined by superposition of the responses to individual wheels .
The ILLI-SLAB model was modified to calculate influence functions by adding a subroutine that runs the model sequentially with a unit load applied at each point along a defined wheelpath. In the modified form the program saves the response at every node in a file, with separate files for each load position. Names are automatically assigned to each file using a common prefix and sequential numbering. At the completion of the run, the files are reprocessed to obtain the influence function for all selected node positions . This procedure is accomplished by extracting the response for the point of interest from the file for each load position and saving it in an influence function file for that point. In addition, the program performs certain housekeeping functions, such as maintaining a record of file identifications and the load and response positions.
The modified version of ILLI-SLAB can be run in desktop computer environments but requires at least 8 megabytes of random access memory (RAM) . The computation time, of course, depends directly on the finite element mesh size and the number of load positions along the road. (For example, a 40-ft slab with a 3-in. node interval takes about 1 min 20 sec of computation time per load position on a Macintosh Ilci computer.) Although computation time may be lengthy, once the calculations have been completed for a given pavement design, the output can he storecl on clisk and the calculations need not be repeated. The influence functions can then be used to determine the response to any arbitrary set of dynamic wheel loads.
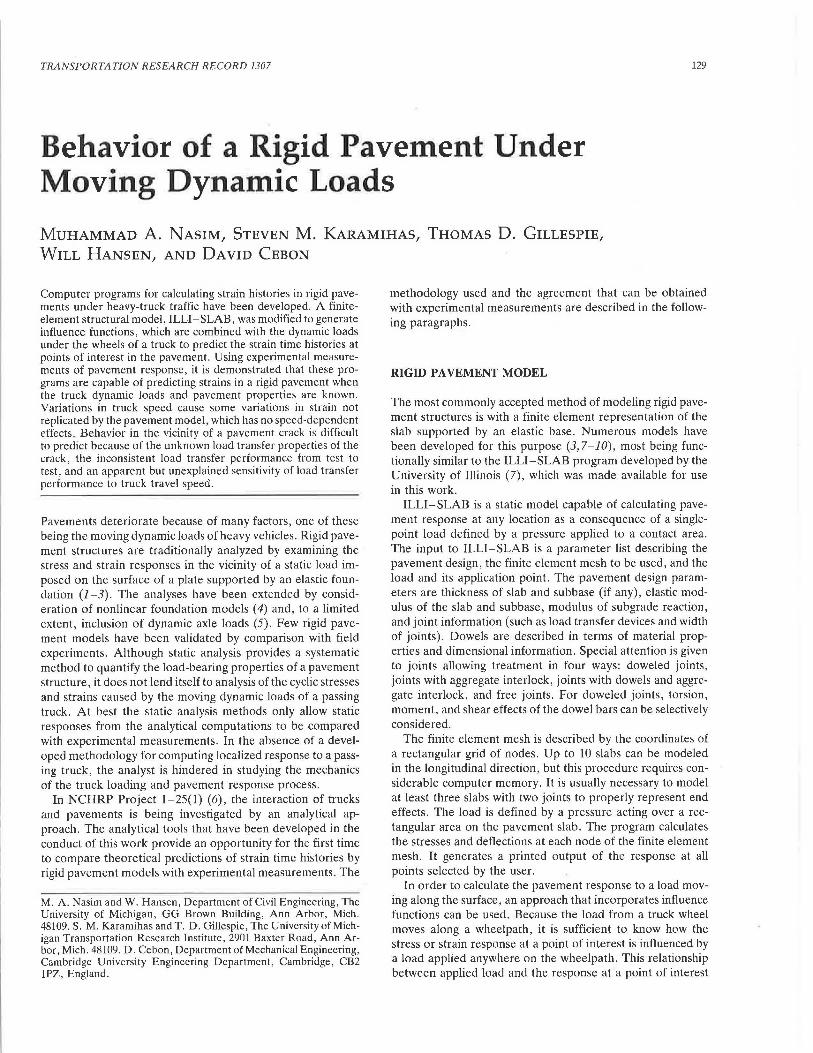
A typical influence function for stress in the longitudinal direction at a point on the bottom of a 40-ft x 12-ft x 9.5-in. slab near its midpoint is shown in Figure l. The pavement response to a moving load is readily seen in the influence function. As a tire approaches, compressive stress begins to build but changes sharply to a much larger tensile stress when the tire is directly above the point. The reverse pattern is observed as the tire departs from the point of interest. The overall area in which the function is nonzero is the deflection basin . The influence functions for all regions in the interior of the slab are similar to that shown in the figure .
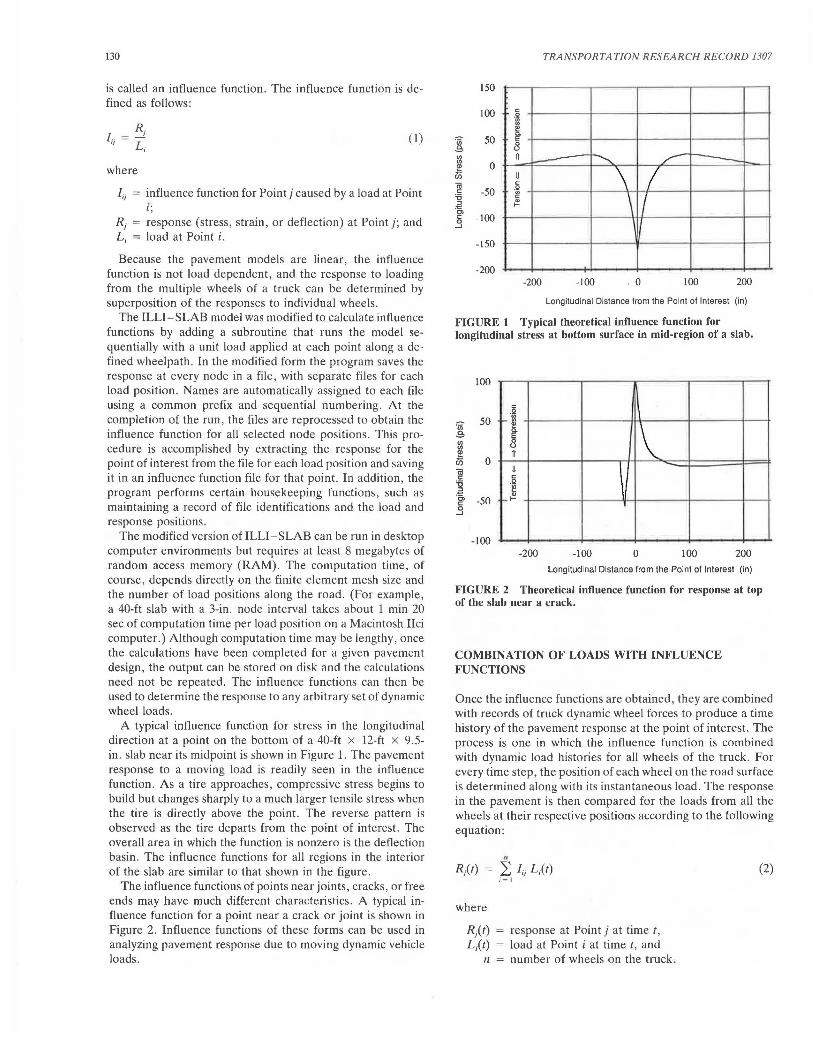
The influence functions of points near joints, cracks, or free ends may have much different characteristics. A typical influence function for a point near a crack or joint is shown in Figure 2. Influence functions of these forms can be used in analyzing pavement response due to moving dynamic vehicle loads.
TRANSPORTATION RESEARCH RECORD 1307
150
100 c: .2 ~
'iii 50 s
i 8
el 0 e
Ui (ij
-50 c: 'ii :l
·5, -100 c:
0 --'
n ~ .....__ / ----u \ I c:
·~
\ I {!'.
I
-150
-200 -200 -100 . o 100 200
Longitudinal Distance from the Point of Interest (in)
FIGURE 1 Typical theoretical influence function for longitudinal stress at bottom surface in mid-region of a slab.
100
c: .2
·u; 50 s l:l e Ui 0
-1 \ tl
1t
~ 'g ·6, -50 c:
u c: .2 ~ .,
........ 0 --'
-100 -200 -100 0 100 200
Longitudinal Distance from the Point of Interest (in)
FIGURE 2 Theoretical influence function for response at top of the slab near a crack.
COMBINATION OF LOADS WITH INFLUENCE FUNCTIONS
Once the influence functions are obtained, they are combined with records of truck dynamic wheel forces to produce a time history of the pavement response at the point of interest. The process is one in which the influence function is combined with dynamic load histories for all wheels of the truck. For every time step, the position of each wheel on the road surface is determined along with its instantaneous load. The response in the pavement is then compared for the loads from all the wheels at their respective positions according to the following equation:
ti
R/t) = L lu L,(t) (2) i=I
where
Rit) response at Point j at time t , L,(t) load at Point i at time t, and
n number of wheels on the truck .
Nasim et al.
Repeating this process for every time step as the truck passes in the vicinity of the point of interest produces the stress or strain time history for that point. Calculating the response in this manner is only valid when the pavement response is proportional to the applied load, and it neglects any dependency on inertia or damping of the pavement.
The program RIGID COMBINE was written to perform the combination process for rigid pavements. The program is configured to accept dynamic wheel loads from any source, providing they are in a standard format. Thus, it can be used to predict pavement response either from records of wheel loads measured on a truck or from an analytical model of vehicle dynamics.
The combination is performed by selecting a starting point for the truck at which the leading tire is sufficiently distant from the point of interest that the influence function is zero. The truck is moved along in a series of discrete time steps, and for each step the aggregate response is computed at the point of interest from the combined influence of all the truck tires. The procedure is as follows:
1. Find the position of each tire relative to the point of interest,
2. Look up the value of the influence function for a unit load at the position of each tire,
3. Look up the dynamic load that each tire is exerting on the road at this instant,
4. Scale the influence of each tire by the dynamic load to get the component of response caused by that tire at the point of interest , and
5. Sum up the response due to all the tires.
This sum is the response at the point of interest to all wheels of the truck for the particular time step. To get a complete time history of the response, the computation is repeated for a series of time steps selected to be small enough to reflect the rapid variations in dynamic wheel loads and the rapidly changing position of the wheels on the slab. Generally, time steps corresponding to about 3 in. of truck movement along the slab are necessary. Once the influence functions and truck dynamic loads are determined, calculation of road response using the method previously described can be carried out for the whole slab on a desktop computer in under a minute.
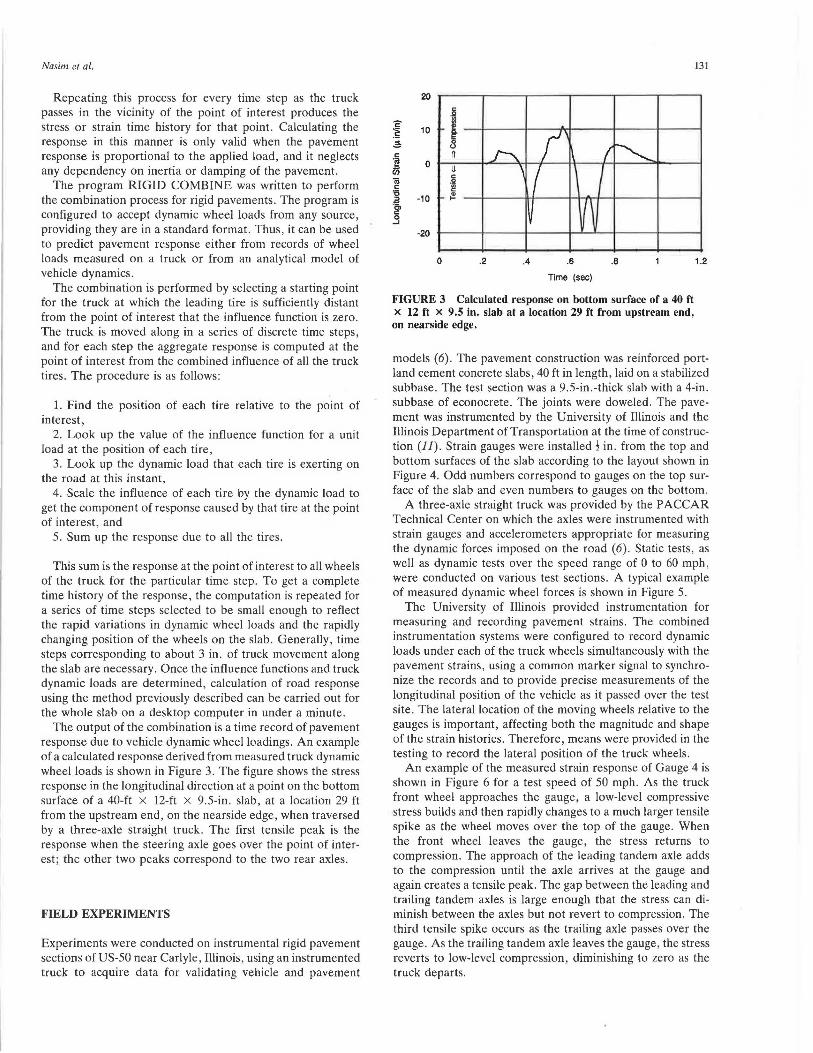
The output of the combination is a time record of pavement response due to vehicle dynamic wheel loadings. An example of a calculated response derived from measured truck dynamic wheel loads is shown in Figure 3. The figure shows the stress response in the longitudinal direction at a point on the bottom surface of a 40-ft x 12-ft x 9.5-in. slab, at a location 29 ft from the upstream end, on the nearside edge, when traversed by a three-axle straight truck . The first tensile peak is the response when the steering axle goes over the point of interest; the other two peaks correspond to the two rear axles .
FIELD EXPERIMENTS
Experiments were conducted on instrumental rigid pavement sections of US-50 near Carlyle , Illinois, using an instrumented truck to acquire data for validating vehicle and pavement
20
c 10 ·1 £
~ 8 c: n 'ij! 0 i'i5 J)
Oi .~ c: ~ '6 -10 ~ ~ ·;;, c: .9
-20
0 .2 .4 .6 .8
Time (sec)
FIGURE 3 Calculated response on bottom surface of a 40 ft x 12 ft X 9.5 in. slab at a location 29 ft from upstream end, on nearside edge.
131
1.2
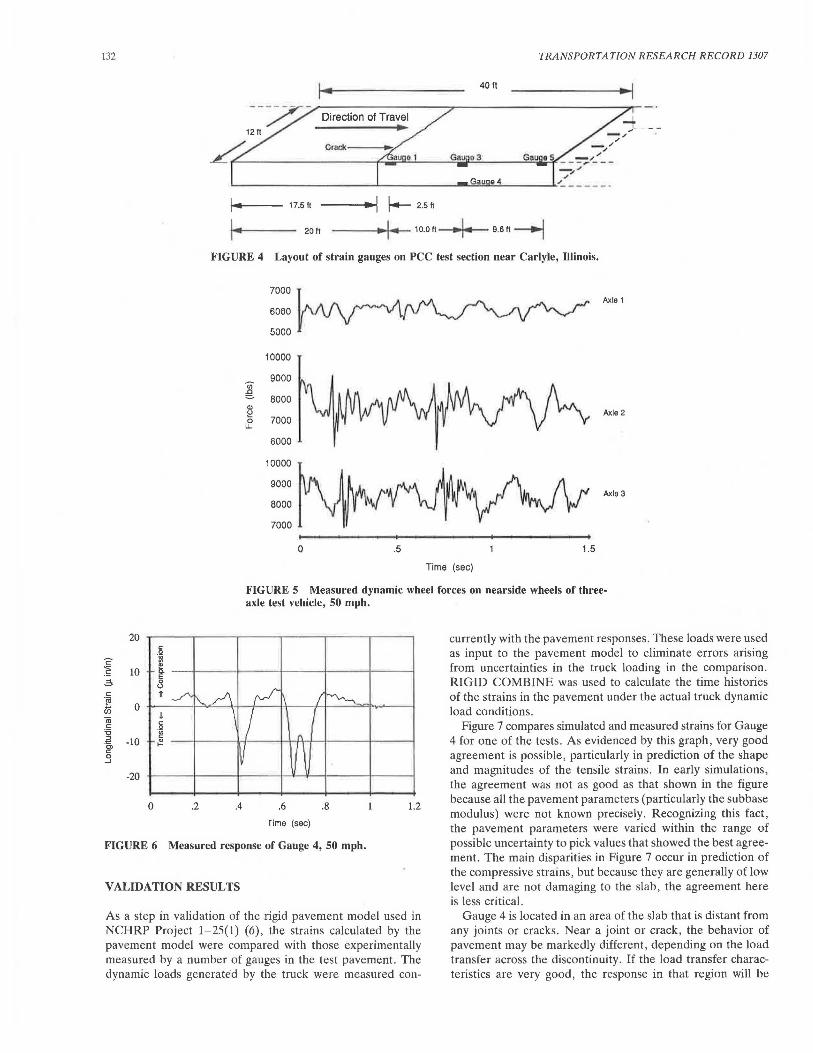
models (6). The pavement construction was reinforced portland cement concrete slabs, 40 ft in length , laid on a stabilized subbase. The test section was a 9.5-in.-thick slab with a 4-in. subbase of econocrete. The joints were doweled. The pavement was instrumented by the University of Illinois and the Illinois Department of Transportation at the time of construction (JJ) . Strain gauges were installed! in . from the top and bottom surfaces of the slab according to the layout shown in Figure 4. Odd numbers correspond to gauges on the top surface of the slab and even numbers to gauges on the bottom.
A three-axle straight truck was provided by the PACCAR Technical Center on which the axles were instrumented with strain gauges and accelerometers appropriate for measuring the dynamic forces imposed on the road (6) . Static tests , as well as dynamic tests over the speed range of 0 to 60 mph, were conducted on various test sections. A typical example of measured dynamic wheel forces is shown in Figure 5.
The University of Illinois provided instrumentation for measuring and recording pavement strains. The combined instrumentation systems were configured to record dynamic loads under each of the truck wheels simultaneously with the pavement strains, using a common marker signal to synchronize the records and to provide precise measurements of the longitudinal position of the vehicle as it passed over the test site. The lateral location of the moving wheels relative to the gauges is important, affecting both the magnitude and shape of the strain histories. Therefore, means were provided in the testing to record the lateral position of the truck wheels.
An example of the measured strain response of Gauge 4 is shown in Figure 6 for a test speed of 50 mph. As the truck front wheel approaches the gauge, a low-level compressive stress builds and then rapidly changes to a much larger tensile spike as the wheel moves over the top of the gauge. When the front wheel leaves the gauge, the stress returns to compression. The approach of the leading tandem axle adds to the compression until the axle arrives at the gauge and again creates a tensile peak. The gap between the leading and trailing tandem axles is large enough that the stress can diminish between the axles but not revert to compression. The third tensile spike occurs as the trailing axle passes over the gauge. As the trailing tandem axle leaves the gauge, the stress reverts to low-level compression, diminishing to zero as the truck departs.
132
20
<=" ~ 10 ~
·~ 0 iii
'" c: '6 .~ -10 "' c: 0 -'
-20
c: .2
~ a. E 8
TRANSPORTATION RESEARCH RECORD 1307
40 ft
--o - ...J. 12ft ------- -.;'L __ _
./ Crack----ti .. / -,."' .;
~~-----~-----t ...... 'r=~~~--=;;;;p.:•~3'-----"'-'="iillirt'"-- ~/..~ _ _ -,." ,.
~---------~~-----~Ga~u=e~4-----~~ -----·
-.1----- 17.5ft ---11•~1 f.- 2.5 ft
1 .. 20ft ---...... 1-10.ott .. 1 .. 9.6ft~
FIGURE 4 Layout of strain gauges on PCC test section near Carlyle, Illinois.
Q)
7000
60('.)0
5000
10000
9000
8000 I:! ~ 7000
6000
10000
9000
8000
7000
0 .5 1.5
Time (sec)
Axle 1
Axle 2
Axle 3
FIGURE 5 Measured dynamic wheel forces on nearside wheels of threeaxlc lc~l vd1idc, 50 mph.
n ../" I\.. _r'\ rv-1 I I~
currently with the pavement responses. These loads were used as input to the pavement model to eliminate errors arising from uncertainties in the truck loading in the comparison. RIGID COMBINE was used to calculate the time histories of the strains in the pavement under the actual truck dynamic load conditions. u
' I I
c: .2 ~ (\
... ,!
v J\ 0 .2 .4 .6 .8 1.2
Time (sec)
FIGURE 6 Measured response of Gauge 4, 50 mph.
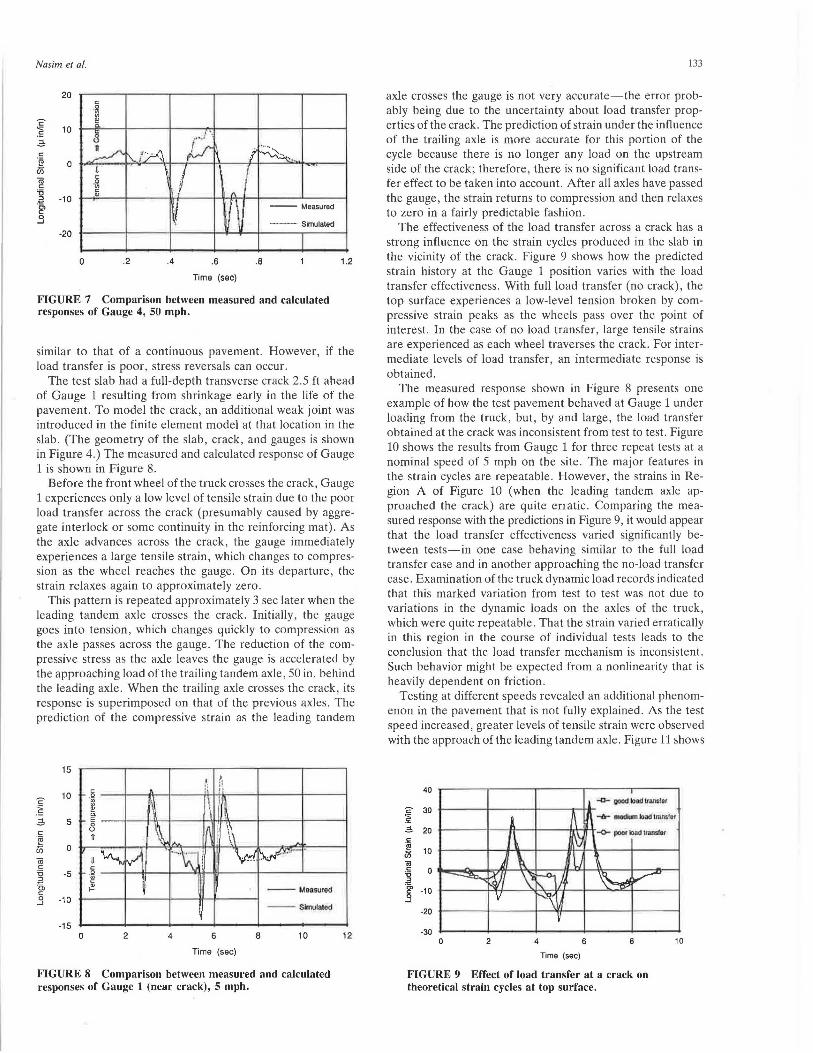
Figure 7 compares simulated and measured strains for Gauge 4 for one of the tests . As evidenced by this graph, very good agreement is possible, particularly in prediction of the shape and magnitudes of the tensile strains. In early simulations, the agreement was not as good as that shown in the figure because all the pavement parameters (particularly the subbase modulus) were not known precisely. Recognizing this fact, the pavement parameters were varied within the range of possible uncertainty to pick values that showed the best agreement. The main disparities in Figure 7 occur in prediction of the compressive strains , but because they are generally of low level and are not damaging to the slab, the agreement here is less critical.
VALIDATION RESULTS
As a step in validation of the rigid pavement model used in NCHRP Project 1-25(1) (6), the strains calculated by the pavement model were compared with those experimentally measured by a number of gauges in the test pavement . The dynamic loads generated by the truck were measured con-
Gauge 4 is located in an area of the slab that is distant from any joints or cracks. Near a joint or crack , the behavior of pavement may be markedly different , depending on the load transfer across the discontinuity. If the load transfer characteristics are very good , the response in that region will be
Nasim et al.
20
c "" 10 .5 ~
@ 0 U5 o; c:: ii -~ -10 g> .9
-20
0
-~ ~
.2 .4 .6
Time {sec)
.B
FIGURE 7 Comparison between measured and calculated responses of Gauge 4, SO mph.
1.2
similar to that of a continuous pavement. However, if the load transfer is poor, stress reversals can occur.
The test slab had a full-depth transverse crack 2.5 ft ahead of Gauge 1 resulting from shrinkage early in the life of the pavement. To model the crack, an additional weak joint was mtroduced in the finite element model at that location in the slab . (The geometry of the slab, crack, and gauges is shown in Figure 4.) The measured and calculated response of Gauge 1 is shown in Figure 8.
Before the front wheel of the truck crosses the crack, Gauge 1 experiences only a low level of tensile strain due to the poor load transfer across the crack (presumably caused by aggregate interlock or some continuity in the reinforcing mat) . As the axle advances across the crack, the gauge immediately e_xpenences a large tensile strain, which changes to compress10n as the wheel reaches the gauge. On its departure, the strain relaxes again to approximately zero.
This pattern is repeated approximately 3 sec later when the leading tandem axle crosses the crack. Initially, the gauge goes into tension, which changes quickly to compression as the axle passes across the gauge. The reduction of the compressive stress as the axle leaves the gauge is accelerated by the approaching load of the trailing tandem axle , 50 in. behind the leading axle . When the trailing axle crosses the crack, its response is superimposed on that of the previous axles. The prediction of the compressive strain as the leading tandem
15 I
10 c: il j';
... 0 c ·~ i\ ~ ~ I!! c.
~ 5 E
c:: 8 ~ ~ -~ ·e n i'i5 0
~~ H ·-·\\ I ~-(ij iv ·· .. .-··
c:: .
ii -5 0
2 ·~ -\j ·a, ~ ll c:: I --Meosurod 0 -10 ..J -- Slrrolaled
-15 ___ ...._ __ -+-__ _.. __ ~-------1
0 2 4 6
Time {sec)
8 10
FIGURE 8 Comparison between measured and calculated responses of Gauge 1 (near crack), S mph.
12
133
axle crosses the gauge is not very accurate-the error probabl_y being due to the uncertainty about load transfer properties of the crack. The prediction of strain under the influence of the trailing axle is more accurate for this portion of the c~cle because there is no longer any load on the upstream side of the crack; therefore, there is no significant load transfer effect to be taken into account. After all axles have passed the gauge, the strain returns to compression and then relaxes to zero in a fairly predictable fashion .
The effectiveness of the load transfer across a crack has a strong influence on the strain cycles produced in the slab in the vicinity of the crack. Figure 9 shows how the predicted strain history at the Gauge 1 position varies with the load transfer effectiveness. With full load transfer (no crack), the top surface experiences a low-level tension broken by com~ressive strain peaks as the wheels pass over the point of mterest. In the case of no load transfer, large tensile strains are experienced as each wheel traverses the crack. For intermediate levels of load transfer, an intermediate response is obtained.
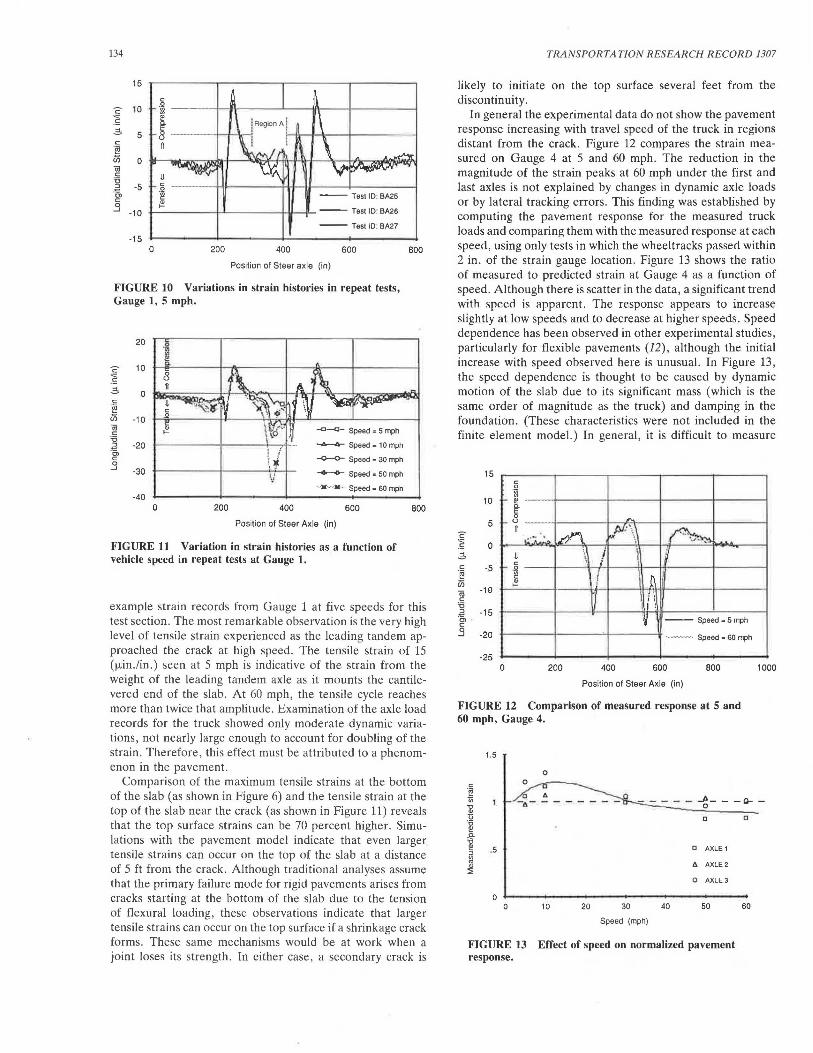
The measured response shown in Figure 8 presents one example of how the test pavement behaved at Gauge 1 under loading from the truck, but, by and large, the load transfer obtained at the crack was inconsistent from test to test. Figure 10 shows the results from Gauge 1 for three repeat tests at a nominal speed of 5 mph on the site. The major features in the strain cycles are repeatable. However, the strains in Region A of Figure 10 (when the leading tandem axle approached the crack) are quite erratic . Comparing the measured response with the predictions in Figure 9, it would appear that the load transfer effectiveness varied significantly between tests-in one case behaving similar to the full load transfer case and in another approaching the no-load transfer case. Examination of the truck dynamic load records indicated that this marked variation from test to test was not due to variations in the dynamic loads on the axles of the truck which were quite repeatable. That the strain varied erraticall; in this region in the course of individual tests leads to the conclusion that the load transfer mechanism is inconsistent. Such behavior might be expected from a nonlinearity that is heavily dependent on friction.
Testing at different speeds revealed an additional phenomenon in the pavement that is not fully explained. As the test speed increased, greater levels of tensile strain were observed with the approach of the leading tandem axle. Figure 11 shows
40
'2 30 ~ ~ 20 c:: ... ~ 10
1il c: 0 '6 ::I
"' C> -10 c: .9
-20
-30 0 2 4 6 8
Time (sec)
FIGURE 9 Effect of load transfer at a crack on theoretical strain cycles at top surface.
10
134
15
c 10
"" .s 3 5 c: ·~
us 0 1il c: '6 2 -5 ·c;, c: .3 -10
-15
c:
-~ ~ a. E 0 ()
n
u c:
-~ .. I-
-- Tosi ID: BA25
+------t-'~----t-V---¥--- Test ID: BA26
-- Test ID: BA27
0 200 400 600
Position of Steer axle (in)
FIGURE 10 Variations in strain histories in repeat tests, Gauge 1, 5 mph.
20
c 10
"" .S 3 0 c: ·~
iii -10 1il c: '6
" -20 "" Cl c: .3 -30
-40 0 200
\I .....o.---A-- Speed - 10 mph
-o-o- Speed • 30 mph
: -+--<>-- Speed • 50 mph
-M--M· Speed • 60 mph
400 600
Position of Steer Axle (in)
FIGURE 11 Variation in strain histories as a function of vehicle speed in repeat tests at Gauge 1.
600
600
example strain records from Gauge 1 at five speeds for this test section . The most remarkable observation is the very high level of tensile strain experienced as the leading tandem approached the crack at high speed. The tensile strain of 15 (µin.fin.) seen at 5 mph is indicative of the strain from the weight of the leading tandem axle as it mounts the cantilevered end of the slab. At 60 mph, the tensile cycle reaches more than twice that amplitude. Examination of the axle load records for the truck showed only moderate dynamic variations, not nearly large enough to account for doubling of the strain . Therefore , this effect must be attributed to a phenomenon in the pavement.
Comparison of the maximum tensile strains at the bottom of the slab (as shown in Figure 6) and the tensile strain at the top of the slab near the crack (as shown in Figure 11) reveals that the top surface strains can be 70 percent higher. Simulations with the pavement model indicate that even larger tensile strains can occur on the top of the slab at a distance of 5 ft from the crack . Although traditional analyses assume that the primary failure mode for rigid pavements arises from cracks starting at the bottom of the slab due to the tension of flexural loading, these observations indicate that larger tensile strains can occur on the top surface if a shrinkage crack forms. These same mechanisms would be at work when a joint loses its strength. In either case, a secondary crack is
TRANSPORTATION RESEARCH RECORD 1307
likely to initiate on the top surface several feet from the discontinuity.
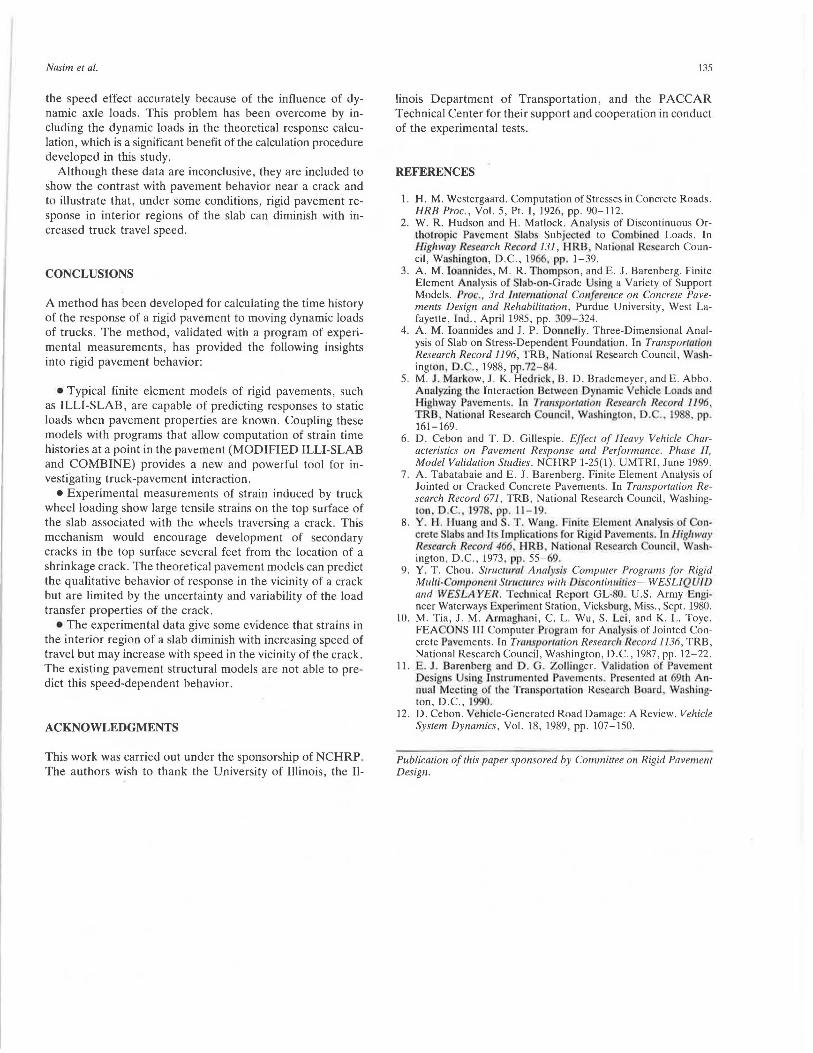
In general the experimental data do not show the pavement response increasing with travel speed of the truck in regions distant from the crack. Figure 12 compares the strain measured on Gauge 4 at 5 and 60 mph. The reduction in the magnitude of the strain peaks at 60 mph under the first and last axles is not explained by changes in dynamic axle loads or by lateral tracking errors. This finding was established by computing the pavement response for the measured truck loads and comparing them with the measured response at each speed, using only tests in which the wheeltracks passed within 2 in. of the strain gauge location. Figure 13 shows the ratio of measured to predicted strain at Gauge 4 as a function of speed. Although there is scatter in the data, a significant trend with speed is ilpparent. The response appears to increase slightly at low speeds and to decrease at higher speeds. Speed dependence has been observed in other experimental studies , particularly for flexible pavements (12), although the initial increase with speed observed here is unusual. In Figure 13 , the speed dependence is thought to be caused by dynamic motion of the slab due to its significant mass (which is the same order of magnitude as the truck) and damping in the foundation. (These characteristics were not included in the finite element model.) In general, it is difficult to measure
15 c: .Q
ill 10 ,... ~
a. E
5 c ~ 0 3 c: -5 ·~
iii -1()
<ii c: '5
" -15 ·5, c:
0 ~ ,_ ()
n l~ l.f':\~ ~ ~ · '";. ._ ..
u ~I I l v c: \ i I- .2
"' [ f c: I ..
I- I
u· i i I !
·v -- Speed • 5 mph
.9 -20 -----· Speed - 60 mph
-25 0 200 400 600 600
Position of Steer Axle (in)
FIGURE 12 Comparison of measured response at 5 and 60 mph, Gauge 4.
1.5
0
c: 0
1000
·~
- - - - - -{- - - ll- -1;;
al 1J a i5 ~ a. 'ti ~ .5 a AXLE 1 :J
lQ "' AXLE 2 "' ::; 0 AXLc3
0 0 10 20 30 40 50
Speed (mph)
FIGURE 13 Effect of speed on normalized pavement response.
a
60
Nasim et al.
the speed effect accurately because of the influence of dynamic axle loads. This problem has been overcome by including the dynamic loads in the theoretical response calculation, which is a significant benefit of the calculation procedure developed in this study.
Although these data are inconclusive, they are included to show the contrast with pavement behavior near a crack and to illustrate that, under some conditions, rigid pavement response in interior regions of the slab can diminish with increased truck travel speed.
CONCLUSIONS
A method has been developed for calculating the time history of the response of a rigid pavement to moving dynamic loads of trucks. The method, validated with a program of experimental measurements, has provided the following insights into rigid pavement behavior:
• Typical finite element models of rigid pavements, such as ILLI-SLAB, are capable of predicting responses to static loads when pavement properties are known. Coupling these models with programs that allow computation of strain time histories at a point in the pavement (MODIFIED ILLI-SLAB and COMBINE) provides a new and powerful tool for investigating truck-pavement interaction.
• Experimental measurements of strain induced by truck wheel loading show large tensile strains on the top surface of the slab associated with the wheels traversing a crack. This mechanism would encourage development of secondary cracks in the top surface several feet from the location of a shrinkage crack. The theoretical pavement models can predict the qualitative behavior of response in the vicinity of a crack but are limited by the uncertainty and variability of the load transfer properties of the crack.
• The experimental data give some evidence that strains in the interior region of a slab diminish with increasing speed of travel but may increase with speed in the vicinity of the crack. The existing pavement structural models are not able to predict this speed-dependent behavior.
ACKNOWLEDGMENTS
This work was carried out under the sponsorship of NCHRP. The authors wish to thank the University of Illinois, the II-
135
linois Department of Transportation, and the PACCAR Technical Center for their support and cooperation in conduct of the experimental tests.
REFERENCES
1. H. M. Westergaard. Computation of Stresses in Concrete Roads. HRB Proc., Vol. 5, Pt. I, 1926, pp. 90-112.
2. W. R. Hudson and H. Matlock. Analysis of Discontinuous Orth tropic Pavement Slabs Subjecie·d to ombincd Loads. In 1-ligluvay Research Record 131, HRB, National Re earch Council, Washington, D.C., 1966, pp. 1-39.
3. A. M. loannides, M. R. Thompson, and E. J. Barenberg. Finite Element Analysis of Slab-o.n·Grade Using a Variety of Support Models. Proc., 3rd ln terlimional Co11/ere11ce on Concrete Pavements Design and Rehabilitation, Purdue University, West Lafayette, Ind., April 1985, pp. 309- 324.
4. A. M. Ioannides and J. P. Donnelly. Three-Dimensional Analysis of Slab on Stress-Dependent Foundation. In Transportation Research Record 1196, TRB, National Research Council, Washington , D.C. , 1988, pp.72-84.
5. M. J. Markow, J. K. Hedrick , B. D. Brademeyer, and E. Abbo. Analyzirtg the Interaction Bcnwecn Dynamic Vehicle Loads and Highway Pavements. In Tra11spor1atim1 Research Record 1196, TRB, Nati nal Research ouncil , Washington D ... 19 • pp. 161-169.
6. D. Cebon and T. D. Gillespie. Effect of Heavy Vehicle Characteristics on Pavement Response and Performance. Phase fl, Model Validation Studies. NCHRP 1-25(1). UMTRI, June 1989.
7. A. Tabatabaie and E. J. Barenberg. Finite Element Analysis of Jointed or Cracked Concrete Pavements. In Transportation Research Record 671, TRB, National Research Council , Washington. D . .. 197 • pp. 11 - 19.
8. Y. H. 1-luang and S. l'. Wong. Finite Element Analysis of oncretc lab and It Implication ror Rigid Pavemems. In Highway Research Record 466. HRB, Natio nal Research ouncil. Washington, D.C., 1973, pp. 55-69.
9. Y. T. Chou . Structural Analysis Computer Programs for Rigid Multi-Co111po11e11t Stmcwres with Di contin11ities-WESLIQUID and WESLAYER. Technical Report GL-80. U.S. Army Engineer Waterway Experiment Station, Vicksburg, Miss., Sept. 1980.
10. M. Tia, J.M. Armaghani, C. L. Wu, S. Lei, and K. L. Toye. FEACONS III Computer Program for Analysi of Jointed Concrete Pavements . In Tmnsportation Research Uccord 1136, TRB, National Research Council, Washington , D.C., 1987, pp. 12-22.
11. E_ J . Barcnberg and D . G. Zollinger. Validation oC Pavement Design U. ing In trumcntccl Pavements. Presented at 69th Annual Meeting of the Tmnsportution Research Board , Wn hington, D.C., 1990.
12. D. Cebon. Vehicle-Generated Road Damage: A Review. Vehicle System Dynamics, Vol. 18. 1989, pp. 107-150.
Publication of this paper sponsored by Committee on Rigid Pavement Design.