Embed Size (px)
Citation preview

Behavior Informatics and Computing
Professor Longbing Cao
Advanced Analytics Institute, University of Technology Sydney, Australia
References Download
• http://www-
staff.it.uts.edu.au/~lbcao/publication/behavio
r-informatics-tutorial-slidesx.pdf
• http://www-
staff.it.uts.edu.au/~lbcao/publication/publicat
ions.htm
• www.behaviorinformatics.org

Acknowledgement
• I appreciate all of my team members who
have made contributions to this slide. The
team member names can be found from the
references.
• Appreciate Ms Can Wang’s great efforts in
creating many of the slides.

Behavior Model/Representation5
Outline
1 Why Behavior Informatics & Computing?
4 Related Work
2 What is Behavior?
3 What is Behavior Informatics & Computing?
High Impact Behavior Analysis6

High Utility Behavior Analysis8
Negative Behavior Analysis9
Impact-oriented Combined Behavior Analysis7
Challenges and Prospects of Complex
Behavior Computing11
10 Coupled/Group Behavior Analysis

Behavior Informatics: Overview
Longbing Cao, In-depth Behavior Understanding and Use:the Behavior Informatics Approach, Information Science,180(17); 3067-3085, 2010.
Can Wang, and Longbing Cao.Modeling and Analysis ofSocial Activity Process, in Longbing Cao and Philip S Yu (eds)Behavior Computing, 21-35, Springer, 2012

Behavior informatics – Concept Map
http://www.behaviorinformatics.org/

Cao, L: BI at DDDM2008 Joint with ICDM20088
Behavior Informatics-IEEE Task Force:
http://www.behaviorinformatics.org/

1. Why Behavior
Informatics & Computing?
Longbing Cao, In-depth Behavior Understanding and Use: the Behavior Informatics Approach, Information Science,
180(17); 3067-3085, 2010.
www.behaviorinformatics.org

10
Argument 1: Behavior is ubiquitous
• Behavior is an important analysis object in
– Consumer analysis
– Marketing strategy design
– Business intelligence
– Customer relationship management
– Social computing
– Intrusion detection
– Fraud detection
– Event analysis
– Risk analysis
– Group decision-making, etc.
�Customer behavior analysis
�Consumer behavior and market strategy
�Web usage and user preference analysis
�Exceptional behavior analysis of terrorist and
criminals
�Trading pattern analysis of investors in capital
markets

11
Argument 2: Major work focuses on
Behavior exterior-driven analysis
• Example 1: Price movement as market behavior
Price/index
movement
is the
behavior
exterior

• Example 2: Announcement as market
behavior driver
Announcement
is the interior
driver of
behavior exterior
(price)
Argument 3: Behavior interior-
driven analysis can make difference

0 500 1000 1500 2000 250010.5
11
11.5
12
Time
Pric
e
Turning pointsthat are relatingto announcments
Announcement A
Announcement B
Connection
between
interior driver
and behavior
exterior

• Why does this stock go so crazily?

• Short-term manipulation behavior as cause
Behavior exterior
presentation
Behavior
driver
Behavior
interior
driver

• Associated
accounts

Group
behaviors
Group
behaviors
Group behavior-driven
price movement

Behavior is Ubiquitous

• Microstructure data
Argument 4: Need to consider
behavior context

20
Observation: Traditional analysis on
behavior
• Empirical, qualitative, psychological, social etc
• Behavior-oriented analysis was usually conducted on customer demographic and transactional datadirectly– Telecom churn analysis, customer demographic data and service usage
data are analyzed to classify customers into loyal and non-loyal groups based on the dynamics of usage change
– Outlier mining of trading behavior, price movement is usually focused to detect abnormal behavior
so-called behavior-oriented analysis is actually not on customer behavior-oriented elements, rather on straightforward customer demographic data and business usage related appearance data (transactions)

21
Problems with traditional behavior
analysis
• Customer demographic and transactional data is not organized in terms of behavior but entity relationships
• Human behavior is implicit in normal transactional data: behavior implication
• cannot support in-depth analysis on behavior interior: focus on behavior exterior
• Cannot scrutinize behavioral actor’s belief, desire, intention and impact on business appearance and problems
Such behavior implication indicates the limitation or even ineffectiveness of supporting behavior-oriented analysis on transactional data directly.
22
Genuine behavior analysis does matter
• Behavior plays the role as internal driving forces or causes for business appearance and problems
• Complement traditional pattern analysis solely relying on demographic and transactional data
• Disclose extra information and relationship between behavior and target business problem-solving
A multiple-dimensional viewpoint and solution may exist that can uncover problem-solving evidence from not only demographic and transactional but behavioral (including intentional, social, interactive and impact aspects) perspectives
23
Support genuine behavior analysis
• Make behavior ‘explicit’ by squeezing out behavior elements hidden in transactional data
• A conversion from transactional space to behavior feature space is necessary
• Behavioral data: • behavior modeling and mapping
• organized in terms of behavior, behavior relationship and impact
Explicitly and more effectively analyze behavior patterns and behavior impacts than on transactional data

2. What is Behavior?

What is Behavior ?
Human
Beings
Activities
Context
and
EnvironmentActions
Operations
Events
Sequences
1. What is Behavior and Behavior Computing

26
What is behavior?
• An abstract behavior model– Demographics and
circumstances of behavioral subjects and objects
– Associates of a behavior may form into certain behavior sequences or network;
– Social behavioral network consists of sequences of behaviors that are organized in terms of certain social relationships or norms.
– Impact, costs, risk and trust of behavior/behavior network

Abstract Behavior Model

28
• Behavior instance: behavior vector
– basic properties
– social and organizational factors
• Vector-based behavior sequences
• Vector-oriented patterns
29
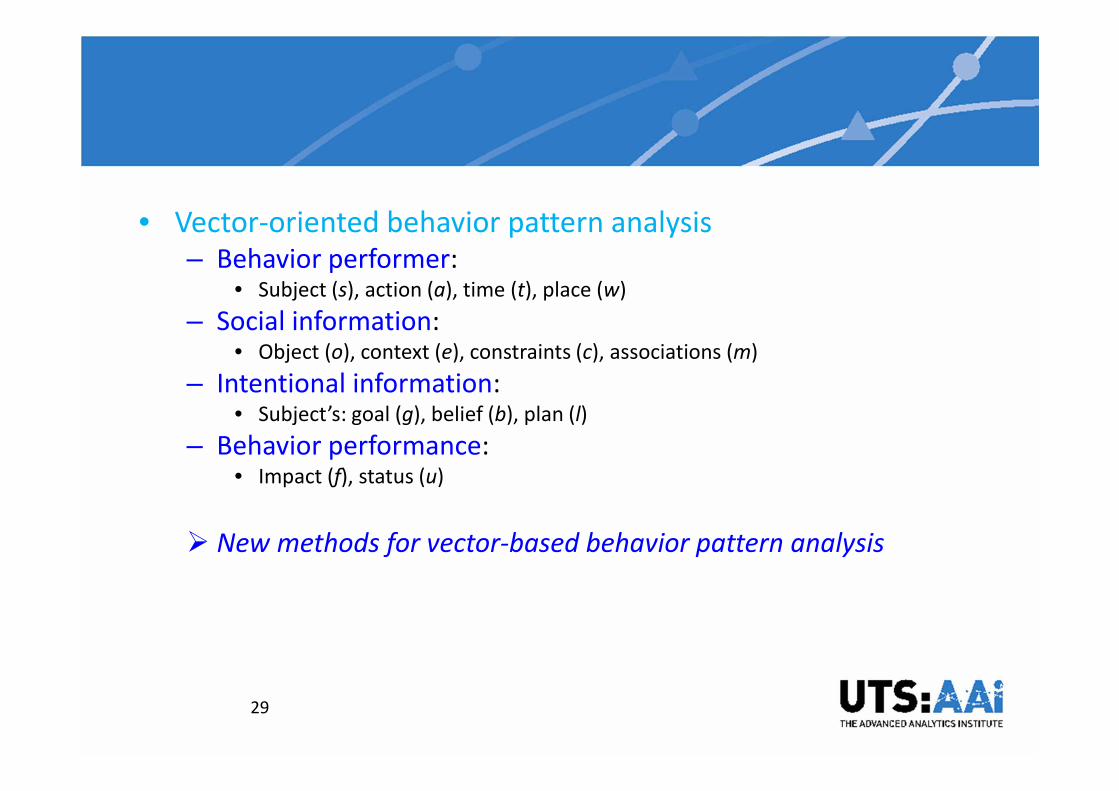
• Vector-oriented behavior pattern analysis
– Behavior performer:• Subject (s), action (a), time (t), place (w)
– Social information:• Object (o), context (e), constraints (c), associations (m)
– Intentional information:• Subject’s: goal (g), belief (b), plan (l)
– Behavior performance:• Impact (f), status (u)
� New methods for vector-based behavior pattern analysis

30
Behavioral data
• Behavioral elements hidden or dispersed in transactional data
• behavioral feature space
� Behavioral data modeling� Behavioral feature space� Mapping from transactional to behavioral data� Behavioral data processing� Behavioral data transformation

3. What is
Behavior Informatics and
Computing?
Longbing Cao, In-depth Behavior Understanding and Use: the Behavior Informatics Approach, Information Science,
180(17); 3067-3085, 2010.
www.behaviorinformatics.org

Behavior informatics – Concept Map
Be
ha
vio
r
Re
pre
sen
tati
on
&
Re
aso
nin
g
Be
ha
vio
r
Lea
rnin
g &
Min
ing
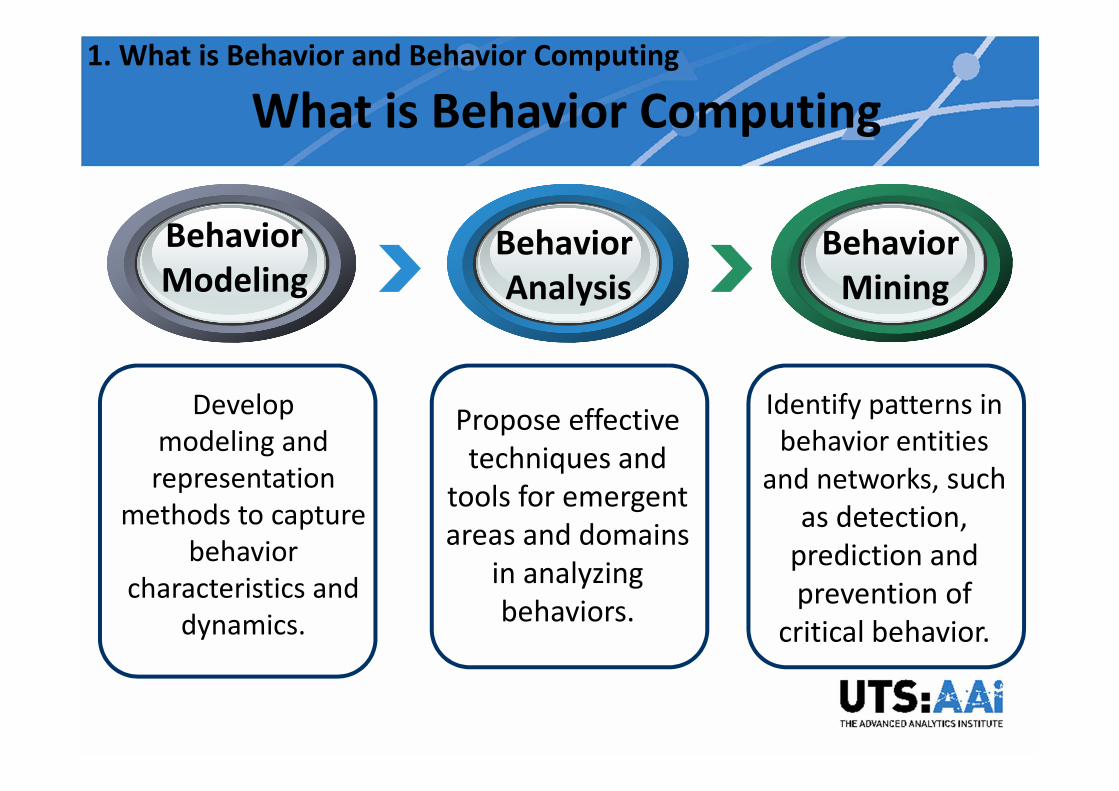
What is Behavior Computing
Behavior
ModelingBehavior
Analysis
Behavior
Mining
Develop
modeling and
representation
methods to capture
behavior
characteristics and
dynamics.
Propose effective
techniques and
tools for emergent
areas and domains
in analyzing
behaviors.
Identify patterns in
behavior entities
and networks, such
as detection,
prediction and
prevention of
critical behavior.
1. What is Behavior and Behavior Computing

Comprehensive Review
2013/4/16

Behavior Modeling
Real-world
Entities
Behavior
Modeling
Formal
Techniques
Classes Relations
1. What is Behavior and Behavior Computing

36
Behavioral representation
• (Behavior modeling)
– describing behavioral elements
– extracting syntactic and semantic relationships amongst
the elements
– presentation and construction of behavioral sequences
and properties
– unified mechanism for describing and presenting
behavioral elements, properties, behavioral impact and
patterns

Behavior Analysis
BehaviorAnalysis……
High Impact/Utility Behavior
Negative Behavior
Coupled Behavior
Behavior Interaction
1. What is Behavior and Behavior Computing

Behavior Mining
Behavior
Mining
Understand
Behavior
Investigate
Pattern
Structures
Semantics
Dynamics
Fraud Detection
Prediction and
Prevention
Activity Mining
… …
1. What is Behavior and Behavior Computing

39
Behavioral impact analysis
• Behavioral instances that are associated with
high impact on business processes and/or
outcomes
• Modeling of behavioral impact
�Behavior impact analysis
�Behavioral measurement
�Organizational/social impact analysis
�Risk, cost and trust analysis
�Scenario analysis
�Cause-effect analysis
�Exception/outlier analysis and use
�Impact transfer patterns
�Opportunity analysis and use
�Detection, prediction, intervention and prevention
40
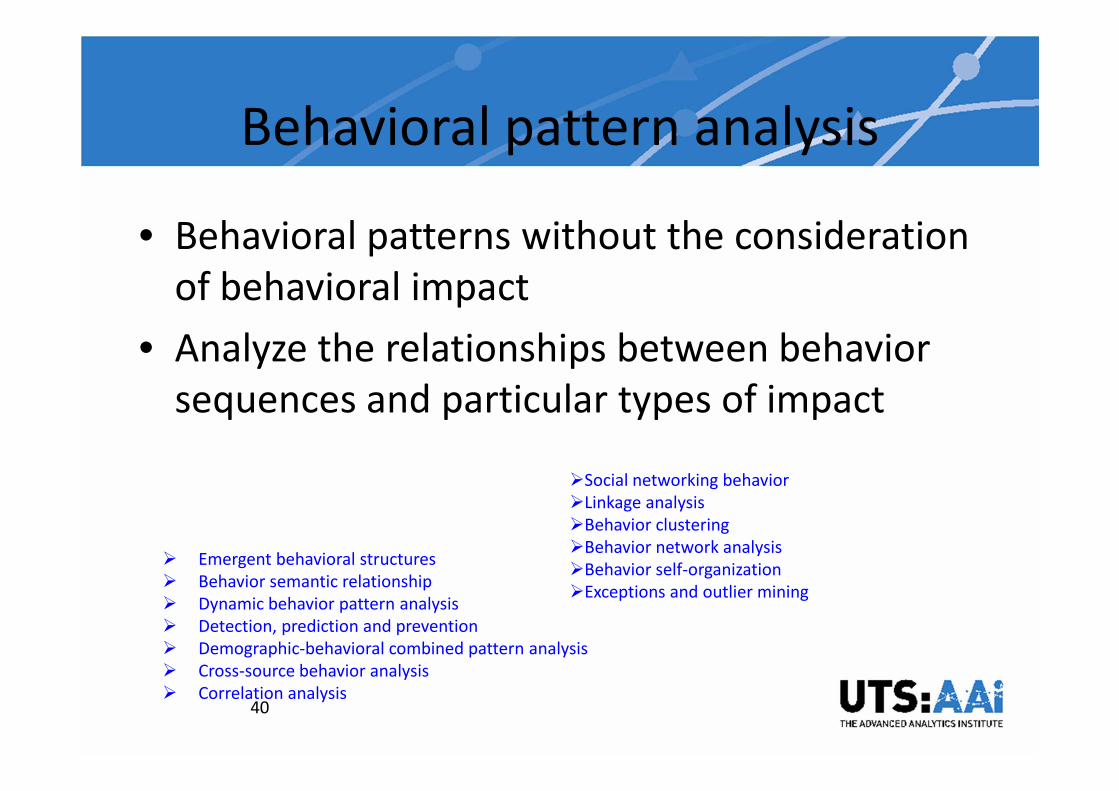
Behavioral pattern analysis
• Behavioral patterns without the consideration
of behavioral impact
• Analyze the relationships between behavior
sequences and particular types of impact
� Emergent behavioral structures
� Behavior semantic relationship
� Dynamic behavior pattern analysis
� Detection, prediction and prevention
� Demographic-behavioral combined pattern analysis
� Cross-source behavior analysis
� Correlation analysis
�Social networking behavior
�Linkage analysis
�Behavior clustering
�Behavior network analysis
�Behavior self-organization
�Exceptions and outlier mining

Behavioral Anomaly Analysis
• Abnormal behavior
• Abnormal + normal behaviors
• Abnormal group behavior

42
Behavioral intelligence emergence
• Behavioral occurrences, evolution and life cycles
• Impact of particular behavioral rules and patterns on
behavioral evolution and intelligence emergence
• Define and model behavioral rules, protocols and
relationships, and
• Their impact on behavioral evolution and intelligence
emergence

43
Behavior networking
• Intrinsic mechanisms inside a network• behavioral rules, interaction protocols, convergence
and divergence of associated behavioral itemsets
• effects such as network topological structures, linkage relationships, and impact dynamics
• Community formation, pattern, dynamics and evolution
�· Intrinsic mechanisms inside a network
�· Behavior network topological structures
�· Convergence and divergence of associated behavior
�· Hidden group and community formation and identification
�· Linkage formation and identification
�· Community behavior analysis

44
Behavioral simulation
• Observe the dynamics,
• The impact of rules/protocols/patterns,
behavioral intelligence emergence, and
• The formation and dynamics of social
behavioral network
� Large-scale behavior network
� Behavior convergence and divergence
� Behavior learning and adaptation
� Group behavior formation and evolution
� Behavior interaction and linkage
� Artificial behavior system
� Computational behavior system
� Multi-agent simulation

45
Behavioral presentation
• presentation means and tools
− describe the motivation and the interest of
stakeholders on the particular behavioral data
− traditional behavior pattern presentation
− visual behavioral presentation
� Rule-based behavior presentation
� Flow visualization
� Sequence visualization
� Dynamic group formation
� Visual behavior network
� Behavior lifecycle visualization
� Temporal-spatial relationship
� Dynamic factor tuning, configuration and effect analysis
� Behavior pattern emergence visualization
� Distributed, linkage and collaborative visualization

46
Behavior analysis process
4. Related Work

Related Work 2. Related Work and Limitations

Related Work 2. Related Work and Limitations
Several qualitative models have been abstracted:
- belief-desire-intention model
- situation calculus
- human-machine interaction
- reasoning about action
- behavior composition
- action recognition and simulation
- action coordination and planning
- modeling systems rather than behaviors
- …

Related Work 2. Related Work and Limitations
Several quantitative models have been proposed:
- user behavior modeling
- activity monitoring
- customer and consumer behavior analysis
- ontological engineering and semantic web
- sequence analysis
- reality mining
- activity mining
- multivariate time series
- coupled hidden Markov model
- …

Research Limitations2. Related Work and Limitations
Traditional behavior modeling that mainly relies on qualitative
methods from behavior and social sciences often leads to
ineffective and limited analysis in understanding social activities
deeply and accurately.
1
Traditional behavior modeling approaches have too many styles
and forms according to distinct situations. There is very limited
research on formalizing the concept of behavior and its
elements. There are no formal behavior representation models
stated from a general perspective and providing a comprehensive
understanding of behavior constitution.
2

Research Limitations2. Related Work and Limitations
3
Traditional behavior expressiveness is too weak to reveal that
behavior plays the key role of an internal driving force for
social activities.
4
The existing work often overlooks the checking of behavior
modeling, which weakens the soundness and robustness of
models built for complex behavior applications.
Complex coupling relationships between group behaviors are
often ignored or only weakly addressed; few building blocks
are available to explicitly model complex interactions between
group behaviors.
5

• Qualitative Reasoning and Verification
With the formal representation of coupled behaviors, the qualitative analytics to address the task of behavior reasoning and verification is in great demand.
• Quantitative Leaning and Evaluation
The quantitative research to target behavior learning and evaluation must be focused on.
• Integrated Understanding of Behavior Algebra
Research Issues2. Related Work and Limitations
An appropriate way could be chosen to integrate
these two studies to obtain an integrated
understanding of the implicit complex behaviors

Multiple
Styles
Advantages
Limitations
Formal
Explicit Model
Unified
Research Question2. Related Work and Limitations

5. Behavior Modeling
and Representation

Behavior Modeling and Representation
UTS/AAI Technique Report 2011
Can Wang, Longbing Cao
Formalization and Verification of
Group Behavior Interactions
University of Technology, Sydney, Australia
3. Behavior Model/Representation

Behavior Modeling and Checking Framework
Ontology-based Behavior Modeling and Checking
3. Behavior Model/Representation

Behavior Visual Descriptor
• Actor: refers to the subject(s) or object(s) of a behavior, for
example, organizations, departments, systems, agents and people
involved in an activity or activity sequence.
• Operation: represents activities, actions or events in a behavior
or behavior sequence.
• Coupling: refers to the interaction between behaviors, including
connections between actors and/or operations of either one or
multiple actors.
3. Behavior Model/Representation

Behavior Visual Descriptor
Intra-relationships within Behavior
• Instance Of
Connecting instances (in
Rectangle) to their
corresponding classes
• Subclass Of
Linking a subclass (in
Oval) to its parent class
• Object Property
Denoting the
relationships between
instances, between an
object and its properties
(in Rounded Rectangle),
or between properties.
3. Behavior Model/Representation

21/6/2010 L. Cao 11
Overall Single Behavior Model

21/6/2010 L. Cao 61
Relationship Sub-model

2013/4/16 Footer text here 62
Relationships between Agent Behaviors

Coupling Relationships
Coupling Relationships
Perspectives
Temporal Party-based
l
Inferential
Serial Coupling
Parallel coupling
Synchronous relationship
Asynchronous coupling
Interleaving
Shared-variable
Channel system
Causal Coupling
Conjunction Coupling
Disjunction Coupling
Exclusive Coupling
One-Party-
Multiple-Operation
Multiple-Party-
One-Operation
Multiple-Party-
Multiple-Operation
3. Behavior Model/Representation
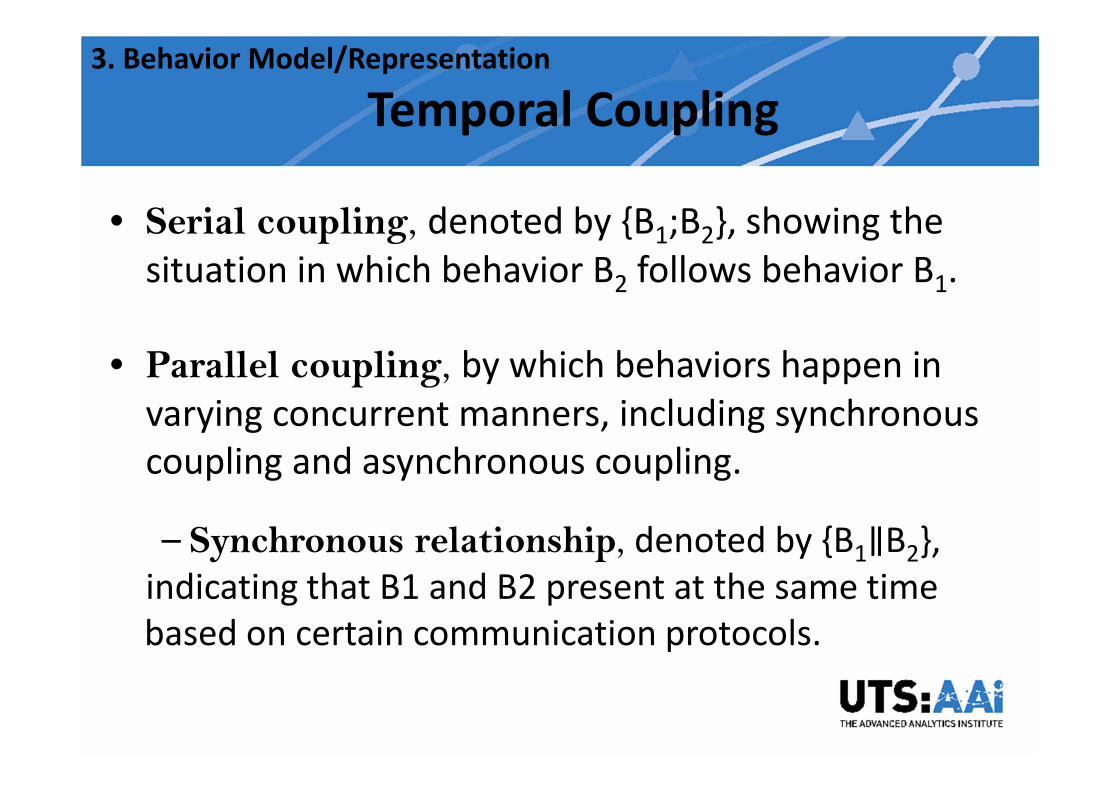
• Serial coupling, denoted by {B1;B2}, showing the
situation in which behavior B2 follows behavior B1.
• Parallel coupling, by which behaviors happen in
varying concurrent manners, including synchronous
coupling and asynchronous coupling.
– Synchronous relationship, denoted by {B1∥B2},
indicating that B1 and B2 present at the same time
based on certain communication protocols.
Temporal Coupling3. Behavior Model/Representation

– Asynchronous coupling, showing that two behaviors
B1 and B2 interact with each other at different time points.
∗ Interleaving, denoted by {B1 : B2}, representing the
involvement of independent complex behaviors by
nondeterministic choice (independently).
∗ Shared-variable, denoted by {B1 ||| B2}, signifying that
the relevant behaviors have variables in common.
∗ Channel system, denoted by {B1 | B2}, is a parallel system
in which complex behaviors communicate via a channel, for
instance, first-in and first-out buffers.
Temporal Coupling
3. Behavior Model/Representation

• Causal coupling, represented as {B1 → B2}, meaning
that behavior B1 causes behavior B2.
• Conjunction coupling, {B1 ∧ B2}, specifying that
B1 and B2 take place together.
• Disjunction coupling, {B1 ∨ B2}, by which at least one
of the associated behaviors must happen.
• Exclusive coupling, {B1 ⊕ B2}, indicating that if B1
happens, B2 will not happen, and vice versa.
Inferential Coupling
IMPLY
AND
OR
XOR
3. Behavior Model/Representation

Party-based Coupling
• One-Party-Multiple-Operation, represented as
{(B1,B2)[A1]} , depicts that distinct behaviors B1 and B2
are performed by the same actor A1.
• Multiple-Party-One-Operation, shown as {(B1)[A1A2]},
represents that multiple actors A1 and A2 implement
the same behavior B1 to achieve their own intentions.
• Multiple-Party-Multiple-Operation, presented as
{(B1,B2 )[A1A2]}, describes that different behaviors B1
and B2 are carried out by distinct actors A1 and A2.
3. Behavior Model/Representation

Behavior Formal Descriptor
For instance, in a stock market, a behavior can be represented as “an investor places a buy order”. The involved actor is the “investor” himself or herself, the operation is the transaction of “buy”. The third component coupling exposes the intra-relationship between this behavior and this investor’s sell order on the other day, together with the inter-relationship between this behavior and another investor’s buy order on the same day.
3. Behavior Model/Representation

We tackle the coupled behaviors from either one or
different actors, denoted as intra-coupling and inter-
coupling, respectively.
Behavior Formal Descriptor
I actors:
An actor undertakes operations
Behavior Feature Matrix
intra-coupling
inter-coupling
3. Behavior Model/Representation

Intra-Coupling
For instance, in the stock market, the investor will place a
sell order at some time after buying his
or her desired instrument due to a
great rise in the trading price. This is, to some extent, one way to express how these two behaviors
are intra-coupled with each other.
The intra-coupling reveals the complex couplings within an actor’s
distinct behaviors.
3. Behavior Model/Representation

Inter-Coupling3. Behavior Model/Representation
The inter-coupling embodies the way multiple behaviors of different
actors interact. For instance, a trading happens successfully only when an investor
sells the instrument at the same price as the
other investor buys this
instrument. This is another example of how to trigger the interactions between inter-
coupled behaviors.

In practice, behaviors may interact with one another in both ways
of intra-coupling and inter-coupling.
Coupling3. Behavior Model/Representation
For instance, we consider both the successful trading between investor
A1 (buy) and investor A2 (sell),
and then the selling behavior
conducted by A1
after he or she has bought the
instrument at a relative low price.

We conduct behavior aggregations to interpret the interactions
of intra-coupled and inter-coupled behaviors. The outcomes of
the behavior aggregations form the basis of behavior verification.
Behavior Aggregator3. Behavior Model/Representation
Three types of aggregations
Intra-Coupled Aggregation
Inter-Coupled Aggregation
Combined Aggregation
function function function

For the behaviors conducted by the same actor, we interpret the behavior dynamics in terms of a transition system (TS).
Intra-Coupled Aggregation3. Behavior Model/Representation
Nodes: System States
A state describes the
behavior status at a
certain moment of
system dynamics.
Edges: Model Transitions
State changes
of a system.
TS: Directed Graphs
TS is often used in computer science for modeling
the behavior dynamics of a system.

Intra-Coupled Aggregation3. Behavior Model/Representation
In particular, the TS interpretation of the intra-coupled
behaviors for actor is the tuple (St; Act;→; In),
where is the intra-coupling function.
Every actor is interpreted by an independent transition system, we regard
an operation as a corresponding action in TS; and the intra-coupling
function θj , which links intra-coupled behaviors, represents the associated
states in TS to connect all the involved operations.

Inter-coupled Aggregation3. Behavior Model/Representation
Apart from the intra-coupled behaviors, inter-coupling
refers to interactions between operations by different actors.
Temporal
Operators
Inferential
Operators
Part-based
Operators

Combined Aggregation3. Behavior Model/Representation
With the intra-coupled and inter-coupled interactions
defined, we develop the combined aggregation of coupled
behaviors to model complex behavior-oriented applications.
1
Behavior Combination
2 3
RuleReduction
TS Conversion

First, we consider the extension of behavior sequences
towards hierarchical and hybrid combinations, in which
behaviors are associated in a hierarchical structure that
consists of different relationships.
Behavior Combination
3. Behavior Model/Representation
Behavior is followed by the
handshaking (g(·)) of and
The concatenation of and
Finite repetition of
Infinite iteration of

Rule Reduction3. Behavior Model/Representation
Second, interaction rules (IR) are induced to support
appropriate combinational reduction of multiple coupling
relationships.
In the above SOS-notation based interaction rule, if the
numerator formula holds, then the denominator part holds as
well. With interaction rules, we can perform reasoning about
behaviors to simplify and conclude critical rules.

Rule Reduction3. Behavior Model/Representation
For instance, four interaction rules are induced as follows
(where ∗; ∗1; ∗2 are the coupling operators):
Associative
Law
Basic
Equivalence
Rules
Distributive
Law
Distributive
Law
Absorption
Law
Induction
Reduction
Behavior
Aggregation
and
Reasoning

TS Conversion3. Behavior Model/Representation
Finally, concurrent transition systems (TSs) are constructed
to specify complex interactions by utilizing temporal,
inferential, and party-based couplings to describe, combine
and aggregate the coupling relationships.
The relationships among TSs are concerned since complex
behaviors are represented as TSs. Assume that there
are n complex behaviors (TSs) associated with one another
in terms of different coupling relationships.

TS Conversion3. Behavior Model/Representation
The
combined
aggregation
of coupled
behaviors
reflects the
semantics of
behavior
coupling and
interaction.

Group Behavior Representation and Verification
3. Behavior Model/Representation
Extract
Behavior
Ontology
Obtain
Combined
Aggregation
Semantics
Behavior
Aggregator
Syntax
Behavior
Descriptor
Semantics
Intra-coupled
Aggregation
Semantics
Inter-coupled
Aggregation
Formalize
Behavior
Constraints
Verify
Behavior
Checker
Output
Behavior Refiner
& Exporter
Input
Behavior
Application

Behavior Constraint Indicator3. Behavior Model/Representation
In order to improve the quality of the behavior model, a simulation can
be conducted prior to the behavior checking. For verification purposes,
the behavior model under consideration needs to be accompanied by a
relevant constraint specification that is to be verified.
Constraints, i.e., prior simulations, can be used effectively to get rid of
the simpler categories of modeling errors. To make a rigorous verification
possible, constraints should be described in a precise and unambiguous
manner. This is done through a constraint specification language.
For instance, a business constraint in stock markets isthat investors are not allowed to make transactions after trading hours.

3. Behavior Model/Representation
We take advantage of the propositional logic and temporal
logic to express the constraints of the desired model.
Behavior Constraint Indicator
Temporal
Logic
Linear Temporal Logic
(LTL)
Computation Tree Logic
(CTL)
Next (○)
Until (u)
Eventually (◊)
Always (□)
synchronous and asynchronous behavior couplings

3. Behavior Model/Representation
Behavior Constraint Indicator
Forbidden Constraint
Desired Constraint
Inferential Coupling
Ontology Axiom
Inferential Reasoning:Causal, Conjunction,
Disjunction, Exclusive
Predefined Ontology Axiom to be Satisfied
Feature of Desired Pattern
WickCharacteristic

Behavior Checker3. Behavior Model/Representation
Different types of formal verification:
Manual Proof of Mathematical Arguments
- Time-consuming
- Error-prone
- Often not economically viable
Interactive Computer Aided Theorem Proof
- Require significant expert knowledge
Automated Model Checking
An automated technique that, given a finite-state model
of a system and a formal property, can systematically
check whether or not this property holds for that model.
If not, model checkers can help to identify the input
sequence that triggers the failure.

3. Behavior Model/Representation
Behavior Checker

Case study of behavior representation

L. Cao 90
Graphical Action Sub-model of Online Shopping based on Actor’s Roles

L. Cao 91
Graphical Action Sub-model of Online Shoppingbased on Stages
{ }{ { }},RP AID AP RK→ ⊕○ ○

Behavior Modeling and Checking Framework
Ontology-based Behavior Modeling and Checking
3. Behavior Model/Representation

3. Behavior Model/Representation
Case Study: Robot Soccer Game
Snapshot of the four-legged league in the Robocup soccer
competition: two teams participate in a Robocup soccer competition
with four Sony AIBO robots in each group.

3. Behavior Model/Representation
Case Study: Behavior Descriptor
A case-based multi-robot architecture with n robots and k retrievers:
Robot RC firstly retrieves a case from the case space and then informs
the rest of the Ords robot players. Once the Ords successfully receive
the messages from RC, they send acknowledgments back to the
retriever RC for confirmation. the RC also coordinates all the other
players including itself to defeat the opponent. All the robots, no
matter RC or Ord, could abort the executions at any moment if
timeout expires, or messages or cases are lost in the interactions.
Complex Features
Distributed
BehaviorsConcurrent
Actions
Uncertain
Situations
Collaborated
StrategiesNonstop
Operations

3. Behavior Model/Representation
Case Study: Behavior Aggregator
Transition system models and
Intra-coupled
Aggregation

3. Behavior Model/Representation
Case Study: Behavior Aggregator
Inter-coupled
Aggregation
Combined
Aggregation
The syntax of coupled behaviors between retriever RC and players Ords:

3. Behavior Model/Representation
Case Study: Behavior Constraint Indicator
It is never the case that any Ord can both implement the executions of attack and block opponent players
If the case is successfully retrieved by CR, then eventually the message sent is
received and the acknowledgmentis sent by Ord.
The execution of a case will not be done until all Ords
have completed their actions.
Ord will infinitely often abort the execution.
Ontology Axiom Inferential Coupling
Desired Constraint Forbidden Constraint

3. Behavior Model/Representation
Case Study: Behavior Checker
SPIN is used to perform checking of the corresponding and constraints.
The graphical interface of the counter example process with XSPIN is
shown on the left, which is based on a Message
Sequence Chart window of XSPIN. The vertical
lines represent robot behaviors, boxes
represent states, and arrows representmessages sent.

3. Behavior Model/Representation
Case Study: Behavior Checker
At State 39, the robot player Ord2 aborts the execution
whenever it receives messages from RC. Therefore, at State
45, Ord2 and RC wait for each other, resulting in an infinite
wait loop while the executions of other robots are interruptedsimultaneously, which is the so-called deadlock. A typical
deadlock scenario occurs when components mutually wait for
each other to progress.

3. Behavior Model/Representation
Case Study: Behavior Model Refiner and Exporter
After analyzing the deadlock scenario, we introduce an additional
state called “hold on” to break the loop.When such a deadlock happens, the next state will be ‘hold on’, which
means that the other two robot players Ord3 and Ord4 will continue
their execution as usual. RC continues to retrieve cases and send
messages without receiving ack from Ord2 until the behaviors of Ord2
become normal. If this does not occur, there must be design flaws in Ord2, which should be explored by
robot experts. In fact, “State40” serves as a Behavior Model
Refiner.
Finally, a refined system (in addition with State 40) will be provided by the Behavior Model Exporter

Model Refiner
An additional state called “hold_on” to break the loop.
Deadlock hold_on
2013/4/16 101
- Two robot players Ord3 and Ord4 willcontinue their executions as usual.
- CR continues to retrieve cases and send messages without receiving acknowledgment from Ord1 until the behaviors of Ord1become normal.
- Else, there must be some design flaws in Ord1, which should be further explored by robot experts.

6. High Impact Behavior
Analysis
Longbing Cao. Zhao Y., Zhang, C. Mining Impact-Targeted Activity
Patterns in Imbalanced Data, IEEE Trans. on Knowledge and Data
Engineering, 20(8): 1053-1066, 2008.

Coupled impact-oriented behaviors

Risk/Impact Definition
• Risk is defined as a feasible detrimental outcome of an activity or action (e.g., launch or operation of a spacecraft) subject to hazard(s)
• (1) magnitude (or severity) of the adverse consequence(s) that can potentially result from the given activity or action, and
• (2) likelihood of occurrence of the given adverse consequence(s).

Impact
• Business impact of behavior
– Consequence:
• Fraud
• Debt
• Exception …
– Magnitude:
• Positive/negative
• Multi-level
• Ratio
• Probabilistic

• qualitative risk assessment:
– severity and likelihood are both expressed
qualitatively (e.g., high, medium, or low)
• quantitative risk assessment/probabilistic risk
assessment:
– Consequences are expressed numerically
– Their likelihoods of occurrence are expressed as
probabilities or frequencies

Probabilistic Risk Assessment
• Causes/Initiators: – What can go wrong with the studied technological entity,
or what are the initiators or initiating events (undesirable starting events) that lead to adverse consequence(s)?
• Effects/Consequences: – What and how severe are the potential detriments, or the
adverse consequences that the technological entity may be eventually subjected to as a result of the occurrence of the initiator?
• Functions(cause, effect):– How likely to occur are these undesirable consequences,
or what are their probabilities or frequencies?

Cause/initiator modeling
• Factor analysis
• Rule-based methods
• Cause-effect analysis
• Failure Modes and Effects Analyses
• Sensitivity analysis
• Statistics techniques
• …

Effects/Consequences Modeling
• Quantifying accident (or mishap) scenarios
– chains of events that link the initiator to the end-
point detrimental consequences
• Deterministic analysis
• Probabilistic analysis

Function(Cause, Effect)
• Probabilistic or statistical methods
• Inductive logic methods like event tree
analysis or event sequence diagrams
• Deductive methods like fault tree analysis

111
Expected Distribution of Clients with Risks

112
ContinuousMonitoring
Q2
ContinuousReview
Q1
PeriodicReview
Q3
Likelihood
Consequences
High
Low High
Periodic Monitoring
Q4
Risk Differentiation Framework

Behavior impact modeling
• Impact measuring
– Cost
– Cost-sensitive
– Profit
– Cost-benefit
– Risk score
– …
• Impact evolution
– Positive � Negative
– Negative � Positive

• Risk of a pattern, eg.

16/04/2013 115
Impact-Targeted Activity Mining
• Frequent impact-oriented activity patterns
• Frequent impact-contrasted activity patterns
• Sequential impact-reversed activity patterns
Here:
Impact � Debt, Fraud, Risk …

16/04/2013 116
Impact-Oriented Activity Patterns
• frequent positive impact-oriented (T) activity
patterns
– P --> T, or
• frequent negative impact-oriented ( ) activity
patterns
– , or
P is an activity sequence, (P = {ai, ai+1, …}, i=0, 1,…).
T
T

16/04/2013 117
Impact-Contrasted Activity Patterns
• Pattern: P is of high significance in positive impact
dataset, and of low significance in negative impact
dataset, or vice versa.
• Positive impact-contrasted pattern
• Negative impact-contrasted pattern

16/04/2013 118
Impact-Reversed Activity Patterns
• Sequential impact-reversed activity pattern
pair
– underlying pattern:
– derivative pattern:

16/04/2013 119
Raw Data
• Data:
– Time: [1/1/06, 31/3/06]
– No. of activity transactions: 15,932,832
– No. of customers: 495,891
– No. of debts: 30,546

16/04/2013 120
Constructing Activity Baskets and Sequences
• Positive-impact activity sequences: the activities before a debt are put in a basket. E.g., {a8, a9, a10, a11, a12, a13, d2}, {a13, a14, a15, a16, a17, a18,
d3}
• Negative-impact activity sequencesA virtual activity “NDT” is created for those customers have never had a debt.

16/04/2013 121
Examples of Debt/Non-Debt Activity
Sequences
Table 1.Example of an activity sequence associated with a debt from target dataseta15, a9, a18, a19, a16, a9, DET
ACTIVITY CODESTART DATE TIME
a15 15/02/2006 13:34:05
a9 16/02/2006 16:26:16
a18 16/02/2006 16:26:17
a19 20/02/2006 16:12:35
a16 28/02/2006 11:27:50
a9 1/03/2006 13:50:03
Debt 1/03/2006 23:59:59
Table 2. Example of an activity sequence related to non-debt from non-target dataseta14, a16, a1, a20, a14, a21, a22, NDT
ACTIVITY CODE
START DATE TIME
a14 6/02/2006 2:19:37
a16 6/02/2006 10:21:50
a1 7/02/2006 3:51:07
a20 7/02/2006 4:44:48
a14 7/02/2006 9:48:59
a21 8/02/2006 10:03:13
a22 15/02/2006 13:55:39
No-Debt 15/02/2006 23:59:59

Frequent Debt-Targeted Activity Patterns

High impact behaviour analysis(Impact-targeted behavior pattern mining)

7. Impact-oriented
Behavior Combined
Pattern Analysis

References
• Longbing Cao. Combined Mining: Analyzing Object and Pattern Relations
for Discovering and Constructing Complex but Actionable Patterns, WIREs
Data Mining and Knowledge Discovery.
• Longbing Cao, Huaifeng Zhang, Yanchang Zhao, Dan Luo, Chengqi Zhang.
Combined Mining: Discovering Informative Knowledge in Complex Data,
IEEE Trans. SMC Part B, 41(3): 699 - 712, 2011.
• Yanchang Zhao, Huaifeng Zhang, Longbing Cao, Chengqi Zhang. Combined
Pattern Mining: from Learned Rules to Actionable Knowledge, LNCS
5360/2008, 393-403, 2008.
• Huaifeng Zhang, Yanchang Zhao, Longbing Cao and Chengqi Zhang.
Combined Association Rule Mining, PAKDD2008.
• Yanchang Zhao, Huaifeng Zhang, Fernando Figueiredo, Longbing Cao
Chengqi Zhang, Mining for Combined Association Rules on Multiple
Datasets, Proc. of 2007 ACM SIGKDD Workshop on Domain Driven Data
Mining (DDDM 07), 2007, pp. 18-23.

Pattern discovery process
126

Combined mining
127

The meaning of “combined”:
128
4) The combination of pattern impacts.

Basic paradigms
• Nonimpact-oriented combined patterns
• Impact-oriented combined patterns
129

Number of constituent atoms
• Pair patterns
• Cluster patterns
130

Structural relations
• Peer-to-peer patterns
• Master-slave patterns
• Hierarchy patterns
131

Time frame
• Independent patterns
• Sequential patterns
• Hybrid patterns
132

Basic Process: an framework
• Multi-source combined pattern mining
133

134

• Multi-feature combined pattern mining
135

• Multi-method combined pattern mining
136

• Multi-method combined pattern mining
– Parallel MMCM
– Serial MMCM
137

Multi-Feature Combined Patterns
138
For example, A1 can be a demographic itemset, A2 can be a transactional itemset on marketing campaign, A3 can be an itemset from a third-party dataset, and T can be the loyalty level of a customer.

Traditional Supports, Confidences & Lifts
• Supp(A->B) = Prob(A^B)
• Conf(A->B) = Prob(A^B) / Prob(A)
• Lift = Conf(A->B) / Prob(B)
139

Contribution
140

Interestingness of Combined Pattern
141

Combined Pattern Pairs
• A combined rule pair is composed of two contrasting rules.
• Eg,. for customers with the same characteristics U, different policies/campaigns, V1 and V2, can result in different outcomes, T1 and T2.
142

Interestingness of Pattern Pairs
143

Combined Pattern Clusters
• Based on a combined rule pair, related combined rules can be organized into a cluster to supplement more information to the rule pair.
• The rules in cluster C have the same U but different V , which makes them associated with various results T.
144

Interestingness of Pattern Clusters
145

Interestingness of Rule Pair/Cluster
• dist(): the dissimilarity between the descendants of R1 and R2
• The interestingness of combined rule pair/cluster is decided by both the interestingness of rules and the most contrasting rules within the pair/cluster.
• A cluster made of contrasting confident rules is interesting, because it explains why different results occur and what can be done to produce an expected result or avoid an undesirable consequence.
146

Rule Pair vs Rule Cluster
• From P, we can see that V1 is a preferable policy for
customers with characteristics U.
• If, for some reason, policy V1 is inapplicable to the
specific customer group, P is no longer actionable.
• Rule cluster C suggests that another policy V3 can be
employed to retain those customers.
147

Extended Combined Pattern Pairs
148

Conditional P-S ratio
149

Extended Combined Pattern Clusters
150

Impact
151

Intervention Strategy 1
• Type A: Demographics differentiated
combined pattern
– Customers with the same actions but different
demographics
� different classes/business impact

Intervention Strategy 2
• Type B: Action differentiated combined
pattern
– Customers with the same demographics but
taking different actions
� different classes/business impact

Business Impact
• Able to move customers from one class to another class
• Useful for designing business policy
154
Behavior 1 Behavior 2
Demographic 1 Slow Fast
Demographic 2 Fast Slow

Case Study I
• Mining Combined Patterns and Patterns
Clusters for Debt Recovery
155

Business Problem
• To profile customers according to their
capacity to pay off their debts in shortened
timeframes.
• To target those customers with recovery and
amount options suitable to their own
circumstances, and increase the frequency
and level of repayment.
156

Data (1)
• Customer demographic data
– Customer ID, gender, age, marital status, number of children, declared wages, location, benefit type, …
• Debt data
– Debt amount, debt start/end date, …
• Repayment data (transactional)
– Repayment method, amount, time, date, …
• Class ID: Quick/Moderate/Slow Payer
157

Data (2)
• The case study is on governmental social security
data with debts raised in the calendar year 2006 and
the corresponding customers and
arrangement/repayment activities.
• The cleaned sample data contains 355,800
customers with their demographic attributes,
arrangements and repayments.
• There are 7,711 traditional associations mined.
158

Results (1)
• There were 7,711 association rules before removing
redundancy of combined rules.
• After removing redundancy of combined rules, 2,601
rules were left, which built up 734 combined rule
clusters.
• After removing redundancy of combined rule clusters, 98
rule clusters with 235 rules remained, which was within
the capability of human beings to read.
159

Results (2)
160

Results (3)
161

Business Rule
162

Case Study II
• Mining Extended Combined Pattern Pairs for
Debt Prevention
163

Business Problem
• A case study of extend combined pattern pairs on Centrelink debt-related activity data is given as follows. More details can be found in [Cao et al. 2008], where they are called impact-reversed sequential activity patterns.
• The data involves four data sources, which are activity files recording activity details, debt files logging debt details, customer files enclosing customer circumstances, and earnings files storing earnings details.
• To analyse the relationship between activity and debt, the data from activity files and debt files are extracted.
164

Data (1)
• Customer demographic data
– Customer ID, gender, age, marital status, number of children, declared wages, location, benefit type, …
• Debt data
– Debt amount, debt start/end date, …
• Repayment data (transactional)
– Repayment method, amount, time, date, …
• Class ID: Quick/Moderate/Slow Payer
165

Date (2)
• The activity data for us to test the proposed approaches is Centrelink activity data from Jan. 1st to Mar. 31st 2006.
• We extract activity data including 15,932,832 activity records recording government-customer contacts with 495,891 customers, which lead to 30,546 debts in the first three months of 2006.
• After data preprocessing and transformation, there are 454,934 sequences: 16,540 (3.6%) activity sequences associated with debts and 438,394 (96.4%) sequences with nil debt.
166

Results (1)
167

An Example of Extended Combined Pattern Pair
• The local supports of and are respectively 0.903 and 0.684, so the ratio of the two values is 1.3.
• The local supports of and are 0.428 and 0.119 respectively, so the ratio of the two values is 3.6.
• When a14 occurs first, the appearance of a4 makes it more likely to become debtable.
• This kind of pattern pairs help to know what effect an additional activity will have on the impact of the patterns.
168

Case Study III
• Exploring the impact of behavior dynamics
• Identifying the most important behavior
during the evolution
169

Combined pattern presentation
170

An Example of Extended Combined Pattern Cluster
171

An Example of Extended Combined Pattern Cluster
172

8. High Utility
Behavior Analysis

4. High Impact/Utility Behavior Analysis
USpan: An Efficient Algorithm for High
Utility Sequential Pattern Mining
Junfu Yin, Zhigang Zheng and Longbing Cao
Advanced Analytics InstituteUniversity of Technology, Sydney, Australia
The 18th ACM SIGKDD Conference on Knowledge Discovery and Data Mining (KDD 2012)
High Utility Sequential Pattern Mining

Outline
1. Introduction
2. Related Work
3. Problem Statement
4. USpan Algorithm
5. Experiments
6. Conclusions
4. High Impact/Utility Behavior Analysis

Introduction
• Sequential pattern mining
• Very essential for handling order-based critical
business problems.
• Interesting and significant sequential patterns are
generally selected by frequency.
• Insufficient of frequency/support framework
• They do not show the business value and impact.
• Some truly interesting sequences may be filtered
because of their low frequencies.
Example: Retail business
4. High Impact/Utility Behavior Analysis

Introduction
SID Quantitative Sequence
1 < (e, 5) [(c, 2)(f, 1)] (b, 2) >
2 < [(a, 2)(e, 6)] [(a, 1)(b, 1)(c, 2)] [(a, 2)(d, 3)(e, 3)] >
3 < (c, 1) [(a, 6)(d, 3)(e, 2)] >
4 < [(b, 2)(e, 2)] [(a, 7)(d, 3)] [(a, 4)(b, 1)(e, 2)] >
5 < [(b, 2)(e, 3)] [(a, 6)(e, 3)] [(a, 2)(b, 1)] >
Items a b c d e f
Quality 2 5 4 3 1 1
Table 1: Quality Table
Table 2: Quantitative Sequence Database
In sequence s2, there are three
transactions:
[(a, 2)(e, 6)],
[(a, 1)(b, 1)(c, 2)] and
[(a, 2)(d, 3)(e, 3)].
Transaction [(a, 2)(e, 6)] means the
customer buys two items, namely a and e.
(a, 2) means the quanity of item a is 2.
The square brackets omitted when there is
only one item in the transaction. For
example: (e, 5), (b, 2) in s1 and (c, 1) in s3.
4. High Impact/Utility Behavior Analysis

SID Quantitative Sequence
1 < (e, 5) [(c, 2)(f, 1)] (b, 2) >
2 < [(a, 2)(e, 6)] [(a, 1)(b, 1)(c, 2)] [(a, 2)(d, 3)(e, 3)] >
3 < (c, 1) [(a, 6)(d, 3)(e, 2)] >
4 < [(b, 2)(e, 2)] [(a, 7)(d, 3)] [(a, 4)(b, 1)(e, 2)] >
5 < [(b, 2)(e, 3)] [(a, 6)(e, 3)] [(a, 2)(b, 1)] >
Introduction
Items a b c d e f
Quality 2 5 4 3 1 1
Table 1: Quality Table
Table 2: Quantitative Sequence Database
The utility of <e> in (e, 6) is 6×1 = 6
The utility of <ea> in s2 is
{ ((6×1) + (1×2)), ((6×1) + (1×2)) }
= {8, 10}
The utility of <ea> is the database is
{{}, {8, 10}, {}, {16, 10}, {15, 7}}.
Add the highest utility in each sequence
to represent the utility of <ea>:
10 + 16 + 15 = 41
If the minimum utility threshold ξ = 40
then <ea> is a high utility pattern.
4. High Impact/Utility Behavior Analysis

Introduction
Contributions:
1. We define the problem of mining high utility sequential
patterns systematically.
2. USpan as a novel algorithm for mining high utility
sequential patterns.
3. Two pruning strategies, namely width and depth
pruning, are proposed to reduce the search space
substantially.
4. High Impact/Utility Behavior Analysis

Related Work
• High utility pattern mining
• Two-Phase Algorithm (Liu et al., UBDM’ 2005)
• IHUP Algorithm (Ahmed et al., IEEE Trans. TKDE’ 2009)
• UP-Growth (Tseng et al., SIGKDD’ 2010)
• High utility sequential pattern mining
• UMSP (Shie et al., DASFAA’ 2011) Designed for mining high utility
mobile sequential patterns.
• UWAS-tree / IUWAS-tree (Ahmed et al., SNPD’ 2010) Designed for
mining the high utility weblog data. IUWAS-tree is for incremental
environment.
• UI / US (Ahmed et al., ETRI Journal’ 2010) Uses two measurements
of utilities of sequences. No generic framework is proposed.
4. High Impact/Utility Behavior Analysis

Problem Statement: Containing
Items a b c d e f
Quality 2 5 4 3 1 1
Table 1: Quality Table
Table 2: Quantitative Sequence Database
(a, 2): Q-item
[(a, 2)(e, 6)]: Q-itemset
s1 - s5: Q-sequence
• Q-itemset containing
[(a, 4)(b, 1)(e, 2)] contains q-itemsets
(a, 4), [(a, 4)(e, 2)] and [(a, 4)(b, 1)(e, 2)]
but not [(a, 2)(e, 2)] and [(a, 4)(c, 1)].
• Q-sequence containing
<[(b, 2)(e, 3)][(a, 6)(e, 3)][(a, 2)(b, 1)]>
contains q-sequences
<(b, 2)>, <[(b, 2)(e, 3)]> and
<[(b, 2)][(e, 3)](a, 2)>
but not [(a, 2)(e, 2)] and [(a, 4)(c, 1)].
SID Quantitative Sequence
1 < (e, 5) [(c, 2)(f, 1)] (b, 2) >
2 < [(a, 2)(e, 6)] [(a, 1)(b, 1)(c, 2)] [(a, 2)(d, 3)(e, 3)] >
3 < (c, 1) [(a, 6)(d, 3)(e, 2)] >
4 < [(b, 2)(e, 2)] [(a, 7)(d, 3)] [(a, 4)(b, 1)(e, 2)] >
5 < [(b, 2)(e, 3)] [(a, 6)(e, 3)] [(a, 2)(b, 1)] >
4. High Impact/Utility Behavior Analysis

SID Quantitative Sequence
1 < (e, 5) [(c, 2)(f, 1)] (b, 2) >
2 < [(a, 2)(e, 6)] [(a, 1)(b, 1)(c, 2)] [(a, 2)(d, 3)(e, 3)] >
3 < (c, 1) [(a, 6)(d, 3)(e, 2)] >
4 < [(b, 2)(e, 2)] [(a, 7)(d, 3)] [(a, 4)(b, 1)(e, 2)] >
5 < [(b, 2)(e, 3)] [(a, 6)(e, 3)] [(a, 2)(b, 1)] >
Problem Statement: Matching
Items a b c d e f
Quality 2 5 4 3 1 1
Table 1: Quality Table
Table 2: Quantitative Sequence Database
Sequence <ea> matches:
<(e, 6)(a, 1)> and <(e, 6)(a, 2)> in s2 ;
<(e, 2)(a, 7)> and <(e, 2)(a, 4)> in s4 ;
<(e, 3)(a, 6)> and <(e, 3)(a, 2)> in s5 ;
Denote as <(e, 6)(a, 1)> ~ <ea>
4. High Impact/Utility Behavior Analysis

Problem Statement: Utilities
The q-item utility:���, � � ���� � , �
The q-itemset utility:
���� � ���������, ���
����
The q-sequence utility:
���� � ����������
����
The q-sequence database utility:
���� � �����������
����
The sequence utility in a q-sequence:
� �, � � � � � !"~$∩!"⊆!
The sequence utility in a database:
� � � ����, ��!∈(
For example:
v(<ea>, s4) = {u(<(e, 2)(a, 7)>), u(<(e, 2)(a, 4)>)}
v(<ea>) = {v(<ea>, s2), v(<ea>, s4), v(<ea>, s5)}
The Sequence Utility Framework
4. High Impact/Utility Behavior Analysis

Problem Statement: Utilities
The q-item utility: �� � � , � ���� )
The q-itemset utility:
�����������
���� � *���� , ��
�
���The q-sequence utility:
����������
���� � *�����
�
���The q-sequence database utility:
�����������
���� � *�����
�
���
For example:
V(<ea>, s4) = {16, 10}
V(<ea>) = { {8, 10}, {16, 10}, {15, 7} }
Sequence t is a high utility sequential
pattern if and only if umax ≥ ξ
where ξ is a user-specified minimum utility.
High Utility Sequential Pattern Mining
Target: Extracting all high utility sequential patterns in S satisfying ξ.
4. High Impact/Utility Behavior Analysis

USpan Algorithm
Challenges of mining for high utility patterns
umax (<a>)= 4 + 12 + 14 + 12 = 42
umax (<ab>)= 7 + 13 + 9 = 29
umax (<abc>)= 15
umax (<(abc)a>)= 19
No Downward Closure Property
4. High Impact/Utility Behavior Analysis

USpan Algorithm
Lexicographic Q-sequence Tree
4. High Impact/Utility Behavior Analysis

SID Quantitative Sequence
1 < (e, 5) [(c, 2)(f, 1)] (b, 2) >
2 < [(a, 2)(e, 6)] [(a, 1)(b, 1)(c, 2)] [(a, 2)(d, 3)(e, 3)] >
3 < (c, 1) [(a, 6)(d, 3)(e, 2)] >
4 < [(b, 2)(e, 2)] [(a, 7)(d, 3)] [(a, 4)(b, 1)(e, 2)] >
5 < [(b, 2)(e, 3)] [(a, 6)(e, 3)] [(a, 2)(b, 1)] >
USpan Algorithm
Items Itemset 1 Itemset 2 Itemset 3
a 14 8
b 10 5
d 9
e 2 2
Items a b c d e f
Quality 2 5 4 3 1 1
Table 1: Quality Table
Table 2: Quantitative Sequence Database
Items I 1 I 2 I 3
a 14 8
b 10� 5�
d 9
e 2 2
v(<b>) = {10, 5}
Items I 1 I 2 I 3
a 14 8
b 10 5
d 9
e 2� 2�
v(<(be)>) = {10 + 2, 5 + 2} = {12, 7}
v(<(be)a>) = {12 + 14, 12 + 8} = {26, 20}
Items I 1 I 2 I 3
a 14� 8�
b 10 5
d 9
e 2 2
v(<(be)(ad)>) = {26 + 9} = {35}
Items I 1 I 2 I 3
a 14 8
b 10 5
d 9�
e 2 2
v(<(be)(ad)a>) = {35 + 8}
= {44}Items I 1 I 2 I 3
a 14 8�
b 10 5
d 9
e 2 2
4. High Impact/Utility Behavior Analysis

USpan Algorithm: Concatenation
Data Representation
4. High Impact/Utility Behavior Analysis

USpan Algorithm: Width Pruning
What is Width Pruning
4. High Impact/Utility Behavior Analysis

USpan Algorithm: Width Pruning
What to Width Prune
SWU(<ea>) = u(s2) + u(s4) + u(s5)
= 41 + 50 + 24
= 115
Items a b c d e f
Quality 2 5 4 3 1 1
Table 1: Quality Table
Table 2: Quantitative Sequence Database
SID Quantitative Sequence SU
1 < (e, 5) [(c, 2)(f, 1)] (b, 2) > 24
2 < [(a, 2)(e, 6)] [(a, 1)(b, 1)(c, 2)] [(a, 2)(d, 3)(e, 3)] > 41
3 < (c, 1) [(a, 6)(d, 3)(e, 2)] > 27
4 < [(b, 2)(e, 2)] [(a, 7)(d, 3)] [(a, 4)(b, 1)(e, 2)] > 50
5 < [(b, 2)(e, 3)] [(a, 6)(e, 3)] [(a, 2)(b, 1)] > 42
SID Quantitative Sequence SU
1 < (e, 5) [(c, 2)(f, 1)] (b, 2) > 24
2 < [(a, 2)(e, 6)] [(a, 1)(b, 1)(c, 2)] [(a, 2)(d, 3)(e, 3)] > 41
3 < (c, 1) [(a, 6)(d, 3)(e, 2)] > 27
4 < [(b, 2)(e, 2)] [(a, 7)(d, 3)] [(a, 4)(b, 1)(e, 2)] > 50
5 < [(b, 2)(e, 3)] [(a, 6)(e, 3)] [(a, 2)(b, 1)] > 42
SWU(<f>) = u(s1) = 24
<f> should be width-pruned
4. High Impact/Utility Behavior Analysis

USpan Algorithm: Depth Pruning
What is Depth Pruning
4. High Impact/Utility Behavior Analysis

USpan Algorithm: Depth Pruning
What to Depth Prune
Items a b c d e f
Quality 2 5 4 3 1 1
Table 1: Quality Table
Table 2: Quantitative Sequence Database
SID Quantitative Sequence SU
1 < (e, 5) [(c, 2)(f, 1)] (b, 2) > 24
2 < [(a, 2)(e, 6)] [(a, 1)(b, 1)(c, 2)] [(a, 2)(d, 3)(e, 3)] > 41
3 < (c, 1) [(a, 6)(d, 3)(e, 2)] > 27
4 < [(b, 2)(e, 2)] [(a, 7)(d, 3)] [(a, 4)(b, 1)(e, 2)] > 50
5 < [(b, 2)(e, 3)] [(a, 6)(e, 3)] [(a, 2)(b, 1)] > 42
urest (<ea>) = (8+29) + (16+24) + (15+17)
= 37 + 40 + 32
= 109
urest (<e(ae)>) = (18 + 9)
= 27
SID Quantitative Sequence SU
1 < (e, 5) [(c, 2)(f, 1)] (b, 2) > 24
2 < [(a, 2)(e, 6)] [(a, 1)(b, 1)(c, 2)] [(a, 2)(d, 3)(e, 3)] > 41
3 < (c, 1) [(a, 6)(d, 3)(e, 2)] > 27
4 < [(b, 2)(e, 2)] [(a, 7)(d, 3)] [(a, 4)(b, 1)(e, 2)] > 50
5 < [(b, 2)(e, 3)] [(a, 6)(e, 3)] [(a, 2)(b, 1)] > 42
<e(ae)> should be depth-pruned
4. High Impact/Utility Behavior Analysis

Experiments
Datasets
DS3 is a dataset consisting of online
shopping transactions which contains
350,241 transactions and 59,477
customers.
DS4 is a real dataset that includes
mobile communication transactions.
The dataset is a 100,000 mobile call
history from a specific day. There are
67,420 customers in the dataset.
Parameters DS1 DS2
that the average number
of elements10 8
the average number of
items in an element 2.5 2.5
the average length of a
maximal pattern4 6
the average number of
items per element2.5 2.5
Number of sequences 10k 10k
Number of items 1k 10k
Synthetic Datasets Real Datasets
4. High Impact/Utility Behavior Analysis

Experiments
Performance and distributions (DS2)
• The running time and the number of patterns grow
exponentially with respect to ξ.
• The high utility sequential patterns are mid-long
patterns.
4. High Impact/Utility Behavior Analysis

Experiments
Scalability Test (DS1 & DS2)
• Both the time and memory usage grow linearly with respect
to the size of the DB.
4. High Impact/Utility Behavior Analysis

Experiments
High Utility Sequential Pattern vs. Frequent Sequential Patterns (DS3)
• USpan out performs Prefixspan with respect to the utilities
of the patterns.
4. High Impact/Utility Behavior Analysis

Conclusions
1. We define the problem of mining high utility sequential
patterns.
2. We propose the USpan to efficiently mine for mining high
utility sequential patterns.
3. Two pruning strategies are proposed to substantially
reduce the search space.
4. Experiments on both synthetic and real datasets show
that USpan can discover the high utility sequential
patterns efficiently.
4. High Impact/Utility Behavior Analysis

9. Negative Behavior Analysis

Negative sequential pattern mining

References
• Xiangjun Dong, Zhigang Zhao, Longbing Cao, Yanchang Zhao, ChengqiZhang, Jinjiu Li, Wei Wei, Yuming Ou. e-NSP: Efficient Negative Sequential Pattern Mining Based on Identified Positive Patterns Without Database Rescanning, CIKM 2011, 825-830.
• Zhigang Zheng, Yanchang Zhao, Ziye Zuo, Longbing Cao. An Efficient GA-Based Algorithm for Mining Negative Sequential Patterns, PAKDD2010, 262-273.
• Zhigang Zheng, Yanchang Zhao, Ziye Zuo, Longbing Cao. Negative-GSP: An Efficient Method for Mining Negative Sequential Patterns, AusDM 2009: 63-67.
• Yanchang Zhao, Huaifeng Zhang, Shanshan Wu, Jian Pei,Longbing Cao, Chengqi Zhang and Hans Bohlscheid. Debt Detection in Social Security by Sequence Classification Using Both Positive and Negative Patterns, ECML/PKDD2009, 648-663.
• Yanchang Zhao, Huaifeng Zhang, Longbing Cao, Chengqi Zhang and Hans Bohlscheid. Mining Both Positive and Negative Impact-Oriented Sequential Rules From Transactional Data, PAKDD2009, pp.656-663.

201
Problem description• What is negative sequential patterns?• Focus on negative relationship between itemsets• Absent items are taken into consideration
• Example:p1 = <a b c d> vs p2 = <a b ¬c e>
• Each item, a, b, c, d and e, stands for a claim item of insurance.
• p1: an insurant usually claims for a, b, c and d in a claim.• p2: does NOT claim c after a and b, then claim item e
instead of d.

5. Negative Behavior Analysis
PSP & NSP
202
PSP: Positive Sequential Pattern
� Only contain occurring itemsets
E.g. p1=<a b c X>.
Existing Methods:
AprioriAll, GSP, FreeSpan, PrefixSpan, SPADE , SPAM
NSP: Negative Sequential Pattern� Also contain non-occurring itemsets
E.g. p1=<a b ¬c X>.
Limited research:
Neg_GSP, PNSP

203
Challenges for NSP
• Apriori principle doesn’t work for some situations
• Huge search space– 10 distinct items
– 3-item PSC: 103
– 3-item NSC: 203

5. Negative Behavior Analysis
Difficulties in Mining NSP
■■■■ High Computational Complexity.
Additionally scanning database after identifying PSP.
■■■■ Large NSC Search Space.
k-size NSC by conducting a joining operation on (k-1 )-
size NSP. (NSC : Negative Sequential Candidates)
■■■■ No Unified Definition about Negative Containment.
How a data sequence contains a negative sequence?
<a> contains < a¬a >? <a> contains < ¬a a¬a >?

Non-occurrence behaviour analysis(Negative sequence analysis)

Genetic-Algorithm based NSP approach: GA-NSP
• Find good (frequent) genes with good performance
(supp), and optimize genes (FP) through crossover
and mutation, m*generations
• Improve gene quality (making more and more
frequent)
Strengths:
• Treat candidates unequally
• Very low support threshold
• Find long-NSP at the beginning
2013/4/16 Footer text here 206

GA-NSP
• New generations: good genes (freq patterns) through crossover and mutation operations.
• Population evolution control: fitness and dynamic fitness.
• Performance improvement: pruning method (check constraints of NSP)
2013/4/16 Footer text here 207

208
Problem Statement
• Sequence (general)s =<e1 e2 ... en>i.e. <a b (c,d) e>, <a ¬b c e>
• Positive/Negative Sequencesp =<e1 e2 ... en>, all elements are positivesn =<e1 e2 ... en>, at least one element is negative
• Negative Sequential Pattern– Its support is greater than minimum support threshold.– Two or more continuous negative elements are not accepted.– For each negative item, its corresponding positive item is required to be
frequent.– Items in an element should be all positive or all negative. i.e. <a (a,¬b) c> is
not allowed.

• Negative MatchingNegative MatchingNegative MatchingNegative Matching
SequenceSequenceSequenceSequence MatchingMatchingMatchingMatching Data SequenceData SequenceData SequenceData Sequence
SSSS1111 <<<<bbbb ¬c¬c¬c¬c aaaa>>>> NoNoNoNo <<<<bbbb f d cf d cf d cf d c aaaa>>>>
SSSS2222 <<<<bbbb ¬c¬c¬c¬c d ad ad ad a>>>> YesYesYesYes <<<<bbbb f f f f d c ad c ad c ad c a>>>>

210
GA-NSP Algorithm
� Encoding
� Crossover
� MutationSelect a random position and then replace all genes after that position with 1-item patterns

211
� Fitness & Dynamic Fitness
� Selection

Initial Population(1-item Patterns)
Population (Patterns)
Parents
Mutation
Crossover
Operation
Children Prune? >min_sup
Select Top K Individuals(Dynamic Fitness)
Selection
No
Yes

213
� GA-NSP Pseudocode

214
Experiments Result .1
• Datasets
• Dataset1(DS1) is C8.T8.S4.I8.DB10k.N1k, which means the average number of elements in a sequence is 8, the average number of items in an element is 8, the average length of a maximal pattern consists of 4 elements and each element is composed of 8 items average. The data set contains 10k sequences, the number of items is 1000.
• Dataset2(DS2) is C10.T2.5.S4.I2.5.DB100k.N10k.
• Dataset3(DS3) is C20.T4.S6.I8.DB10k.N2k.
• Dataset4(DS4) is real application data for insurance claims.

215
• Crossover Rate

216
• Mutation Rate

217
• Decay Rate

218
• Comparison with PNSP, Neg-GSP

Classification of both positive and negative
behavior patterns
•Huaifeng Zhang, Yanchang Zhao, Longbing Cao, Chengqi Zhang and Hans Bohlscheid. Customer Activity
Sequence Classification for Debt Prevention in Social Security, Journal of Computer Science and Technology,
24(6): 1000-1009 (2009).
•Yanchang Zhao, Huaifeng Zhang, Shanshan Wu, Jian Pei,Longbing Cao, Chengqi Zhang and Hans Bohlscheid.
Debt Detection in Social Security by Sequence Classification Using Both Positive and Negative Patterns,
ECML/PKDD2009, 648-663.

Sequence classification

• Class correlation ratio


Negative Sequential Pattern Mining
e-NSP: Efficient Negative Sequential
Pattern Mining Based on Identified Positive Patterns Without
Database Rescanning
5. Negative Behavior Analysis
The 20th ACM Conference on Information and Knowledge Management (CIKM 2011)

5. Negative Behavior Analysis
Some Definitions
� Negative Item/Element: Non-occurring item / element
� Negative SequenceA sequence includes at least one negative item
� Positive-partner of a Negative Element /Sequence
p(¬e)= e. p(<a¬(ab) c>) =<a(ab) c>.
� Max Positive Sub-sequenceMPS(<a¬(ab) c>) = <ac>.

5. Negative Behavior Analysis
Constraints to Negative Sequence
Constraint 1. Frequency Constraint
This paper only focuses on the negative sequences ns whose positive
partner is frequent, i.e., sup(p(ns))>=min_ sup.
Constraint 2. Format Constraint
Continuous negative elements in a NSC are not allowed.
< ¬(ab) c ¬ d> ✔
< ¬(ab) ¬ c d> ✗
Constraint 3. Element Negative Constraint
The minimum negative unit in a NSC is an element.
< ¬(ab) c d> ✔
<(¬ab) c d> ✗

5. Negative Behavior Analysis
What does This Paper Do
227
E-NSP: Only use corresponding PSP information to
calculate the support of negative sequence, without
additional database scanning.
� A definition about negative containment.
� Three constraints for negative sequence
� A smart method to generate negative sequence
candidate (NSC).
� A conversion strategy to convert negative containment
problems to positive containment problems.
� A method to calculate the support of NSC.

5. Negative Behavior Analysis
The framework of E-NSP
228
PSPSequence database
ConvertGenerate Calculatesup(NSC)NSC PSP
1. Mine all PSP by traditional PSP mining algorithms;
2. Generate NSC based on these PSP;
3. Convert these NSC to corresponding PSP;
4. Get supports of NSC by calculating support of
corresponding PSP.

5. Negative Behavior Analysis
Negative Containment Definition

5. Negative Behavior Analysis
Negative Containment Definition
230
ns=< nsleft, ¬e, nsright >
MPS(nsleft) e MPS(nsright)
ds=<s1,……,si, si+1,…sj-1, sj,………st>
ds contains ns if <s1,…,si > contain MPS(nsleft) ,
<sj,…st> contain MPS(nsright) , and < si+1,…sj-1,
>doesn’t contain <e>. (To EACH negative
element ¬e in ns)
}
}}}}⊆ ⊄ ⊆{ {
}{

5. Negative Behavior Analysis
Example: Negative Containment Definition
231
ns=<a¬bb(cde)>. ds=<a(bc)d(cde)>.
< a ¬b b(cde)>
ds= <a (bc)d(cde)>.
ds contains ns.
}
}}}}⊆ ⊄ ⊆{ {}
{

5. Negative Behavior Analysis
Definitions
1-neg-size Maximum Sub-sequence is a sequence
that includes MPS(ns) and one negative element e in
original sequence order.
1-neg-size maximum sub-sequence set is a set that
includes all 1-neg-size maximum sub-sequences of ns,
denoted as 1-negMSSns.
Example ns=<a¬bc¬d>,
1-negMSSns ={<a¬bc>, <ac¬d>}

5. Negative Behavior Analysis
Negative Conversion Strategy
Example ns =<a¬bb¬a(cde)>, ds=<a(bc)d(cde)>.
1-negMSSns={ <a¬bb(cde)> , <ab¬a(cde)> }
(1)MPS(ns)=< ab(cde)>⊆⊆⊆⊆ds;
(2)p(<a¬bb(cde)> )= <abb(cde)> ⊄⊄⊄⊄ ds;
p(<ab¬a(cde)> )= <aba(cde)> ⊄⊄⊄⊄ ds;
ds contains ns
233

5. Negative Behavior Analysis
Negative Conversion Strategy
problem
whether a data
sequence contains
a negative
sequence
problem
whether the data
sequence does not
contain its
corresponding
positive sequences
Now we can calculate the support of NSC only
using the NSC’s corresponding PSP.

5. Negative Behavior Analysis
Calculate the Support of NS
sup(ns)=|{ ns }|=|{MPS(ns)} -1
n
i=∪ {p(1-negMSi)}| (1)
Because 1
n
i=∪ {p(1-negMSi)} ⊆⊆⊆⊆ {MPS(ns)}, equation 1 can be rewritten as:
sup(ns)= |{MPS(ns)}| -|1
n
i=∪ {p(1-negMSi)}|
= sup(MPS(ns))-|1
n
i=∪ {p(1-negMSi)}| (2)
Example 10 sup(<a¬bc¬de>)=sup(<ace>})-|{<abce>}∪∪∪∪ {<acde>}|;
sup(<¬aa¬a>)=sup(<a>)-|{<aa>}∪∪∪∪{<aa>}|=sup(<a>)-sup(<aa>).
If ns only contains a negative element, the support of ns is:
sup(ns) = sup(MPS(ns)) - sup(p(ns)) (3)
Example 11 sup(<a¬bce>) = sup(<ace>) - sup(<abce>)
Specially, for negative sequence <¬e >,
sup(<¬e>) =|D| – sup(<e>). (4)

5. Negative Behavior Analysis
Calculate the Support of NS
Known
Calculate the
union set of
{p(1-negMSi)}.
(p(1-negMSi)
are frequent.)

5. Negative Behavior Analysis
Negative Sequential Candidates Generation
Definition . e-NSP Candidate Generation
For a k-size PSP, its NSC are generated by changing
any m non-contiguous element(s) to its (their)
negative one(s), m=1,2, …,k/2, where k/2 is a
minimum integer that is not less than k/2.
Example. s= <(ab) c d> include:
m=1, <¬(ab) c d>,<(ab) ¬cd>,<(ab) c¬d>;
m=2, <¬(ab) c ¬d>.

5. Negative Behavior Analysis
An Example

5. Negative Behavior Analysis
An Example

5. Negative Behavior Analysis
Experiment and Evaluation
Data Sets
Four source datasets including both real
data and synthetic datasets generated by
IBM data generator. Partition these
datasets to 14 datasets according to
different data factors.

5. Negative Behavior Analysis
An
Exa
mp
le

5. Negative Behavior Analysis
Experiment and Evaluation
Co
mp
uta
tion
al C
ost

5. Negative Behavior Analysis
Conclusions
We have proposed a simple but very efficient NSP mining
algorithm: e-NSP. E-NSP includes:
� A formal definition, negative containment, to define how a
data sequence contains a negative sequence.
� A negative conversion strategy to convert negative
containing problems to positive containing problems.
� A method to calculate the supports of NSC only using the
corresponding PSP.
� A simple but efficient approach to generate NSC.
� The experimental results and comparisons on 14 datasets
from different data characteristics perspectives have clearly
shown that e-NSP is much more efficient than
existing approaches.

10. Coupled/Group
Behavior Analysis

References
• Can Wang, Zhong She, Longbing Cao. Coupled Clustering Ensemble: Incorporating
Coupling Relationships Both between Base Clusterings and Objects, ICDE2013.
• Longbing Cao, Yuming Ou, Philip S Yu. Coupled Behavior Analysis with Applications,
IEEE Trans. on Knowledge and Data Engineering, 24(8): 1378-1392 (2012).
• Longbing Cao, Yuming Ou, Philip S YU, Gang Wei. Detecting Abnormal Coupled
Sequences and Sequence Changes in Group-based Manipulative Trading Behaviors,
KDD2010, 85-94.
• Yin Song, Longbing Cao, et al. Coupled Behavior Analysis for Capturing Coupling
Relationships in Group-based Market Manipulation, KDD 2012, 976-984.
• Yin Song and Longbing Cao. Graph-based Coupled Behavior Analysis: A Case Study
on Detecting Collaborative Manipulations in Stock Markets, IJCNN 2012, 1-8.
• Can Wang, Mingchun Wang, Zhong She, Longbing Cao. CD: A Coupled
Discretization Algorithm, PAKDD2012, 407-418

What is Coupled Behavior?
Longbing Cao, In-depth Behavior Understanding and Use: the Behavior Informatics Approach, Information Science,
180(17); 3067-3085, 2010.
www.behaviorinformatics.org

Ph
ysic
al
wo
rld
Virtual world
Problem-
solving
world
Intelligent Transport
Systems

Relationship crossing behaviors

Behavior Coupling Types
• Logic/semantic relation based behavior
coupling
• Statistical/Probabilistic relation based
behavior coupling

Logic/Semantic Relation based Group
Behavior Analysis
Longbing Cao. Combined Mining: Analyzing Object and Pattern Relations for Discovering and Constructing Complex
but Actionable Patterns, WIREs Data Mining and Knowledge Discovery.
Longbing Cao. Zhao Y., Zhang, C. Mining Impact-Targeted Activity Patterns in Imbalanced Data, IEEE Trans. on
Knowledge and Data Engineering, 20(8): 1053-1066, 2008.

Coupling relationships
• From temporal aspect
• From inferential aspect
• From combinational aspect

{ }1 2, , , na a a⋯
{ }→i ja a
1{ , , }na a↔ ↔⋯
{ }1 2 , , na a a⋯
Basic Behavior Patterns
� Tracing: Different actions with sequential order.
� Consequence: Different actions have causalities in occurrence.
� Synchronization: Different actions occur at the same time.
� Combination: Different actions occur in concurrency.

{ }1 2 , ,⊕ ⊕ ⊕⋯ na a a
{ }i ja a⇒
� Exclusion: Different actions occur mutually exclusively.
� Precedence: Different actions have required precedence
And more to be explored…
� Sequential Combination
� Parallel Combination
� Nested Combination
� Fuzzy or probabilistic Combination
A B C× × ×⋯
A B C⊗ ⊗ ⊗⋯

Logic Coupling Based Combined Pattern Pairs
254
Group 1 behavior
Group 2 behavior

Logic Coupling Based Combined Pattern
Clusters
255
Group 1 behavior
Group K behavior

Multi-group Pattern Relation
• Type A: Demographics differentiated
combined pattern
– Customers with the same actions but different
demographics
� different classes/business impact

Multi-group Pattern Relation
• Type B: Action differentiated combined
pattern
– Customers with the same demographics but
taking different actions
� different classes/business impact

Multiple Group Pattern Relations
258

Multi-Group Combined Patterns
259

Multi-Group Combined Patterns
• Divergence vs. convergence of group
behaviors
260

Statistical/Probabilistic Behavior
Coupling Analysis
Yin Song, Longbing Cao, et al. Coupled Behavior Analysis for Capturing Coupling Relationships in Group-based
Market Manipulation, KDD 2012, 976-984.
Yin Song and Longbing Cao. Graph-based Coupled Behavior Analysis: A Case Study on Detecting Collaborative
Manipulations in Stock Markets, IJCNN 2012, 1-8.
Longbing Cao, Yuming Ou, Philip S Yu. Coupled Behavior Analysis with Applications, IEEE Trans. on Knowledge and
Data Engineering, 24(8): 1378-1392 (2012).

Behavior Feature Matrix

An Example of Stock Market
Transactional Data Behavior Feature Matrix
B1B2B3B4
B6B5
B7B8

Behavior Intra-relationship

Behavior Inter-relationship

Behavior Relationship

Behavior Behavior Analysis

Coupled Hidden Markov Model-based
Abnormal Coupled Behavior Analysis
Longbing Cao, Yuming Ou, Philip S Yu. Coupled Behavior Analysis with Application, IEEE Trans. Knowledge and Data Engineering.
Cao, L., Ou Y, Yu PS, Wei G. Detecting Abnormal Coupled Sequences and Sequence Changes in Group-based Manipulative Trading Behaviors, KDD2010.

Pool manipulation


Construct behavior sequences


CHMM Based Coupled Sequence
Modeling
• Coupled behavior sequences
– Multiple sequences
– Coupling relationship
– Behavior properties


CBA - CHMM

Framework: abnormal CBA


Adaptive CHMM for Detecting Sequence
Changes

The Algorithm


• Benchmark Models
– HMM-B
– HMM-S
– HMM-T
– IHMM
– CHMM
– ACHMM

Evaluation
• Technical performance
• Business performance


• Business Performance

• Computational cost

Conditional Probability Distribution-
based Coupled Behavior Analysis
Yin Song, Longbing Cao, et al. Coupled Behavior Analysis for Capturing Coupling Relationships in Group-based Market Manipulation, KDD 2012, 976-984.
Yin Song and Longbing Cao. Graph-based Coupled Behavior Analysis: A Case Study on Detecting Collaborative Manipulations in Stock Markets, IJCNN 2012, 1-8.


Graph-based Coupled Behavior
Presentation


Propositional Coupled Behavior
• CPD

• Estimate p(RF|X)
• Estimate

• CBA problem � CPD problem

• Conditional likelihood:


6. Coupled Behavior Analysis
Coupled Nominal Similarity Analysis
The 20th ACM Conference on Information and Knowledge Management (CIKM 2011)
Can Wang, Longbing Cao, Mingchun Wang,
Jinjiu Li, Wei Wei, Yuming Ou
Coupled Nominal Similarity
in Unsupervised Learning
Wednesday, 26 Oct. 2011, Glasgow,UK
University of Technology, Sydney, Australia

6. Coupled Behavior Analysis
Coupled Nominal Similarity
� Similarity Analysis
� Related Work
� Motivation: Example
� Coupled Nominal Similarity
- Intra-coupled Interaction
- Inter-coupled Interaction
� Theoretical Analysis
� Back to Example
� Experiment and Evaluation
� Conclusion

6. Coupled Behavior Analysis
Similarity Analysis
The more two objects resemble
The larger the similarity

6. Coupled Behavior Analysis
Similarity Analysis

6. Coupled Behavior Analysis
Related Work
� Simple Matching (SM)
� Jaccard
� Russell and Rao
� Occurrence Frequency
� Goodall
� Anderberg
� Iterated Contextual
� Ahmad and Dey (AD)

6. Coupled Behavior Analysis
Motivation
Value Frequency Distribution:
Sim (Scorsese, Coppola) < Sim(Koster, Hitchcock)
Matching Coefficient:
Sim(Scorsese, Coppola) = 0;
Sim(Koster, Hitchcock) = Sim(Koster, Coppola).
Feature Dependency Aggregation:
Sim (Koster, Koster) = Sim(Scorsese, Coppola)
Similar directors
Former, Larger
Former, Larger
Former, Larger

6. Coupled Behavior Analysis
Coupled Nominal Similarity

6. Coupled Behavior Analysis
Coupled Nominal Similarity
Intra-coupled Interaction:
Inter-coupled Interaction:

6. Coupled Behavior Analysis
Intra-coupled Interaction
Rationale:
The Greater similarity is assigned to the attribute value pair
which owns approximately equal frequencies.
The higher these frequencies are, the closer such two values are.
IaAVS has been captured to characterize the value
similarity in terms of attribute value occurrence times.

6. Coupled Behavior Analysis
Inter-coupled InteractionModified Value Distance Matrix:
Inter-coupled Relative Similarity based on Power Set (IRSP), Universal Set
(IRSU), Join Set (IRSJ), and Intersection Set (IRSI).
IRSP:
IRSI:
IRSU:
IRSJ:
Object Co-occurrence
Probability

6. Coupled Behavior Analysis
Inter-coupled Interaction
IeAVS focuses on the object co-occurrence comparisons
with four inter-coupled relative similarity options.
Coupled Object Similarity (COS) between objects:

6. Coupled Behavior Analysis
Theoretical Analysis
- Computational Accuracy Equivalence:
- Computational Complexity Comparison:
IRSP IRSU IRSJ IRSI
IRSP IRSU IRSJ IRSI≥ ≥≥
R: The maximal number of
attribute values.
AD
Inter-coupled Relative Similarity

6. Coupled Behavior Analysis
Back to Example
Coupled Nominal Similarity:
Sim(Scorsese, Coppola) = Sim(Coppola, Coppola) = 0.33
Sim(Koster, Hitchcock) = 0.25 Sim(Koster, Coppola) = 0
Sim(Koster, Koster) = Sim(Hitchcock, Hitchcock) = 0.5
Scorsese and Coppola are very similar directors
Sim(Koster, Hitchcock) > Sim(Koster, Coppola)
Sim (Scorsese, Coppola) > Sim(Koster, Hitchcock)
Sim (Koster, Koster) > Sim(Scorsese, Coppola)

6. Coupled Behavior Analysis
Experiment and Evaluation
� Coupled Similarity Comparison
The goal is to show the obvious superiority of IRSI, compared
with the most time-consuming one IRSP.
� COS Application (COD)
Four groups of experiments are conducted on the same data
sets by k-modes(KM) with ADD (existing methods), KM with
COD, spectral clustering(SC) with ADD, and SC with COD.
Several experiments are performed on extensive UCI
data sets to show the effectiveness and efficiency.

6. Coupled Behavior Analysis
Coupled Similarity Comparison

6. Coupled Behavior Analysis
Coupled Similarity Comparison
In summary, all of the above experiment results clearly
show that IRSI outperforms IRSU, IRSJ, and IRSP in terms of
the computational complexity, no matter how small or large,
simple or complicated a data set is.
In particular, with the increasing numbers of either
features or attribute values, IRSI demonstrates superior
efficiency compared to the others. IRSJ and IRSU follow, with
IRSP being the most time-consuming, especially for the
large-scale data set.

6. Coupled Behavior Analysis
Application

6. Coupled Behavior Analysis
Experiment and Evaluation
We draw the following two conclusions:
� Intra-coupled relative similarity IRSI is the most
efficient one when compared with IRSP, IRSU and IRSJ,
especially for large-scale data.
� Our proposed object dissimilarity metric COD is better
than others, such as dependency aggregation only ADD,
for categorical data in terms of clustering qualities.

6. Coupled Behavior Analysis
Conclusion

11. Challenges and Prospects

Frequent
Pattern
mining
Event
detection
Sequence
analysis
Group
Behavior
Pattern
mining
Community
discovery
Coupled
behavior
analysis
Impact-oriented:
- Positive
- Negative
- Multi-level
- Mixed
- Evolution

Modeling and Analysis of Complex Behaviors
9. Challenges and Prospects of Complex Behavior Computing

We could develop two directions to explicate complex behaviors:
qualitative and quantitative behavior analytics
With the formal representation of coupled behaviors, the qualitative
analytics addresses the task of behavior reasoning and verification,
while the quantitative research targets behavior learning and
evaluation. Finally, an appropriate way could be chosen to integrate
these two studies to obtain an integrated understanding of the implicit
complex behaviors from both qualitative and quantitative aspects.
During this process, many open issues are worth systematic
investigation along with case studies from aspects such as behavior
reasoning, behavior learning, behavior evaluation, behavior
integration at individual but more on group levels.
Modeling and Analysis of Complex Behaviors
9. Challenges and Prospects of Complex Behavior Computing

Behavior Representation
Behavior Learning
Behavior Reasoning
Behavior Verification
Behavior Evaluation
Behavior Integration
Behavior Algebra
Individual Coupled
Modeling and Analysis of Complex Behaviors
9. Challenges and Prospects of Complex Behavior Computing

Fundamental
• Formal methods
• Reasoning
• Modelling check
• Quantitative representation and learning

Individual Behaviour Learning
• Intention learning
• Negative sequence/behaviour analysis
• Complex behaviour/sequence analysis
• Behaviour impact learning
• Behaviour utility learning
• Early prediction of high impact/utility behaviours
• …

Group-oriented Coupled Learning
• Group intent learning
• Coupled sequence modelling and analysis
• Coupling relationship learning
• Heterogeneous behaviour learning
• Social influence analysis
• Contrast group analysis
• Divergence vs. convergence of group behaviors

Noniidness learning

References
• Yin Song, Longbing Cao, et al. Coupled Behavior Analysis for Capturing Coupling Relationships in Group-based
Market Manipulation, KDD 2012, 976-984.
Yin Song and Longbing Cao. Graph-based Coupled Behavior Analysis: A Case Study on Detecting Collaborative
Manipulations in Stock Markets, IJCNN 2012, 1-8.
Longbing Cao, Yuming Ou, Philip S Yu. Coupled Behavior Analysis with Applications, IEEE Trans. on Knowledge and
Data Engineering, 24(8): 1378-1392 (2012).
Zhong She, Can Wang, and Longbing Cao. A Coupled Framework of Clustering Ensembles, AAAI2012 (poster)
Can Wang, and Longbing Cao.Modeling and Analysis of Social Activity Process, in Longbing Cao and Philip S Yu
(eds) Behavior Computing, 21-35, Springer, 2012
Can Wang, Mingchun Wang, Zhong She, Longbing Cao. CD: A Coupled Discretization Algorithm, PAKDD2012, 407-
418
Can Wang, Longbing Cao, Minchun Wang, Jinjiu Li, Wei Wei, Yuming Ou. Coupled Nominal Similarity in
Unsupervised Learning, CIKM 2011, 973-978.
Xiangjun Dong, Zhigang Zhao, Longbing Cao, Yanchang Zhao, Chengqi Zhang, Jinjiu Li, Wei Wei, Yuming Ou. e-NSP:
Efficient Negative Sequential Pattern Mining Based on Identified Positive Patterns Without Database Rescanning,
CIKM 2011, 825-830.

• Longbing Cao, In-depth Behavior Understanding and Use: the Behavior Informatics Approach, Information Science, 180(17); 3067-3085, 2010.
Longbing Cao, Yuming Ou, Philip S YU, Gang Wei. Detecting Abnormal Coupled Sequences and Sequence Changes in Group-based Manipulative Trading Behaviors, KDD2010, 85-94.
Zhigang Zheng, Yanchang Zhao, Ziye ZuoLongbing Cao, Huaifeng Zhang, Yanchang Zhao, Chengqi Zhang. An Efficient GA-Based Algorithm for Mining Negative Sequential Patterns, PAKDD2010, 262-273
• Longbing Cao, Philip S Yu, Behavior Informatics: An Informatics Perspective for Behavior Studies, The Intelligent Informatics Bulletin, 10(1): 6-11, 2009.
Zhigang Zheng, Yanchang Zhao, Ziye Zuo, Longbing Cao. Negative-GSP: An Efficient Method for Mining Negative Sequential Patterns, AusDM 2009: 63-67.
Shanshan Wu, Yanchang Zhao, Huaifeng Zhang, Chengqi Zhang, Longbing Cao, Hans Bohlscheid. Debt Detection in Social Security by Adaptive Sequence Classification, KSEM 2009: 192-203.
Yanchang Zhao, Huaifeng Zhang, Shanshan Wu, Jian Pei,Longbing Cao, Chengqi Zhang and Hans Bohlscheid. Debt Detection in Social Security by Sequence Classification Using Both Positive and Negative Patterns, ECML/PKDD2009, 648-663, 2009.
Yanchang Zhao, Huaifeng Zhang, Longbing Cao, Chengqi Zhang and Hans Bohlscheid. Mining Both Positive and Negative Impact-Oriented Sequential Rules From Transactional Data, PAKDD2009, pp.656-663.

•Longbing Cao, Behavior Informatics and Analytics: Let Behavior Talk, DDDM2008 joint with ICDM2008, 87 - 96.
Longbing Cao Yuming Ou. Market Microstructure Patterns Powering Trading and Surveillance Agents. Journal of Universal Computer Sciences, 14(14): 2288-2308, 2008.
Yanchang Zhao, Huaifeng Zhang, Longbing Cao, Chengqi Zhang and Hans Bohlscheid. Efficient Mining of Event-Oriented Negative Sequential Rules, WI 08, pp. 336-342.
Longbing Cao. Zhao Y., Zhang, C. Mining Impact-Targeted Activity Patterns in Imbalanced Data, IEEE Trans. on Knowledge and Data Engineering, 20(8): 1053-1066, 2008.
Longbing Cao, Yanchang Zhao, Chengqi Zhang, Huaifeng Zhang. Activity Mining: from Activities to Actions, International Journal of Information Technology & Decision Making, 7(2): 259-273, 2008
Longbing Cao, Behavior Informatics and Analytics: Let Behavior Talk, DDDM2008 joint with ICDM2008.
Chengqi Zhang, Longbing Cao. Keynote: Activity Mining to Strengthen Debt Prevention, Pacific Asia Conf. on Intelligence and Security Informatics (PAISI), 2007.
Longbing Cao, Yanchang Zhao, Fernando Figueiredo, Yuming Ou, Dan Luo. Mining High Impact Exceptional Behavior Patterns, PAKDD2007 industry track, LNCS4819, 56-63, 2007.
Longbing Cao.Activity mining: challenges and prospects. ADMA2006, LNAI4093, 582-593.

IEEE Task Force
• IEEE Task Force on Behavior and Social
Informatics and Computing (BSIC)
• www.behaviorinformatics.org

Call for Papers
Behavior and Social Informatics Workshops:
• PAKDD - BSI 2013 Australia
http://datamining.it.uts.edu.au/bsi/bsi2013/
• IJCAI – BSIC 2013 China
http://datamining.it.uts.edu.au/bsi/bsic2013/
• IJCAI 2013 Tutorial
– Behavior Informatics
• Special Issue with World Wide Web Journal

Your feedback is appreciated.
• Longbing Cao
www-staff.it.uts.edu.au/~lbcao
www.behaviorinformatics.org