Embed Size (px)
Citation preview
BeginEnd ShowTable of Contents
Supply and Demand (3.2.2)
Copyright © 2013 N.S.
Last SlideViewed
ForwardBackEnd ShowResourcesTitle Page Table of Contents
Copyright © 2012 N.S.
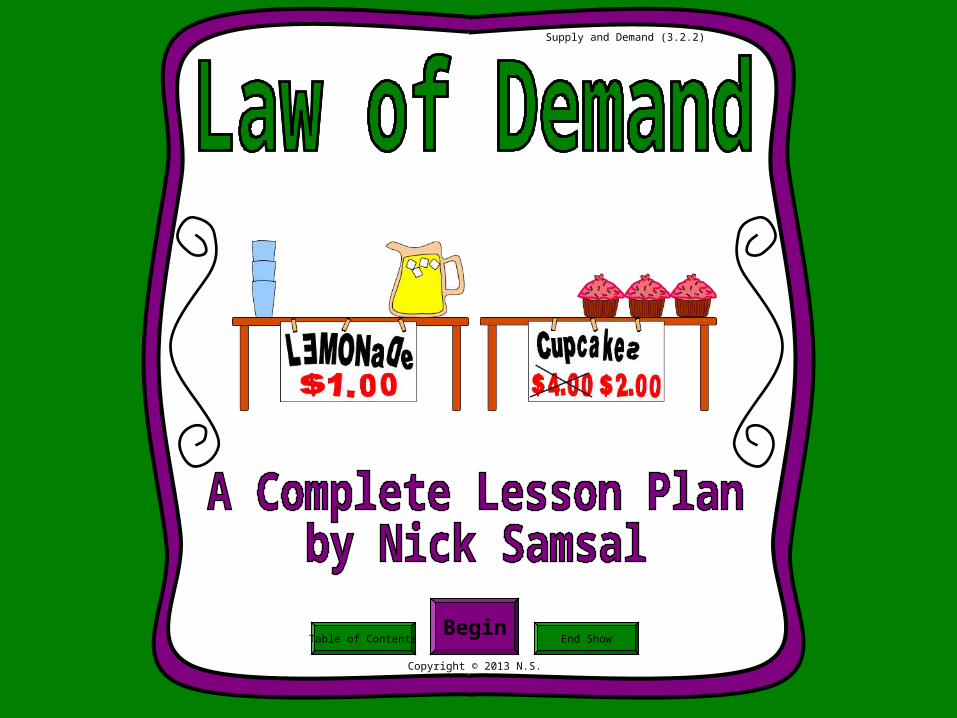
Table of Contents
Demand Survey“Law of Demand”
Targets“Law of Demand”
TargetsDefinition Changes in Demand
Demand Can ChangeIn Two Ways
You Draw the Graph
Increases Demand
Decreases Demand
The Effects ofShifting Demand
Access PriorKnowledge
Set GoalsNew
InformationActivity Conclusion
Last SlideViewed
ForwardBackEnd ShowResourcesTitle Page Table of Contents
Copyright © 2012 N.S.
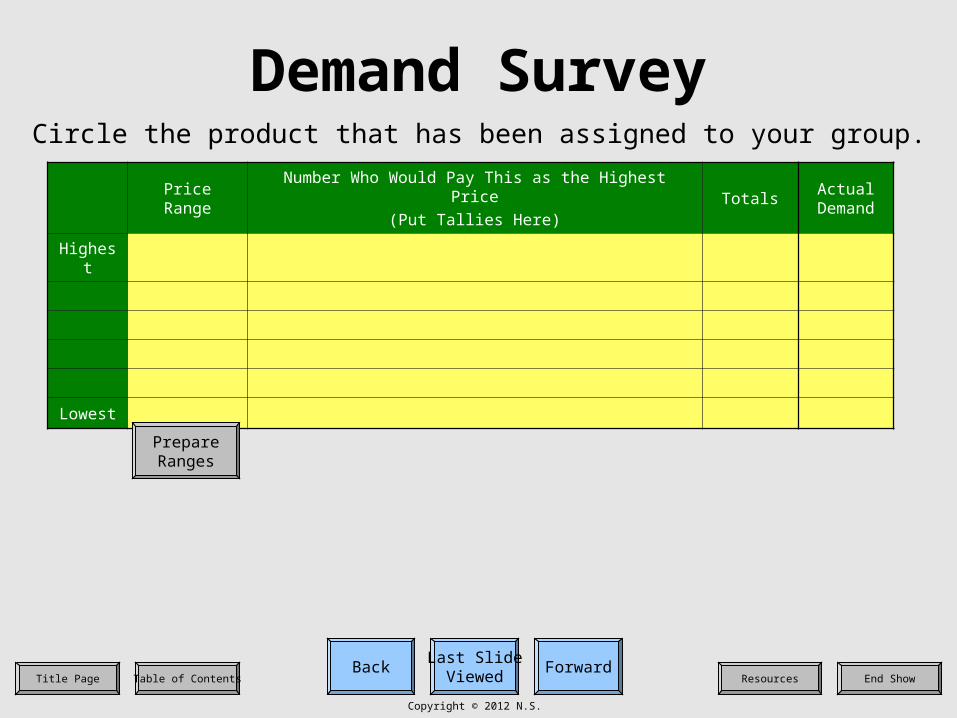
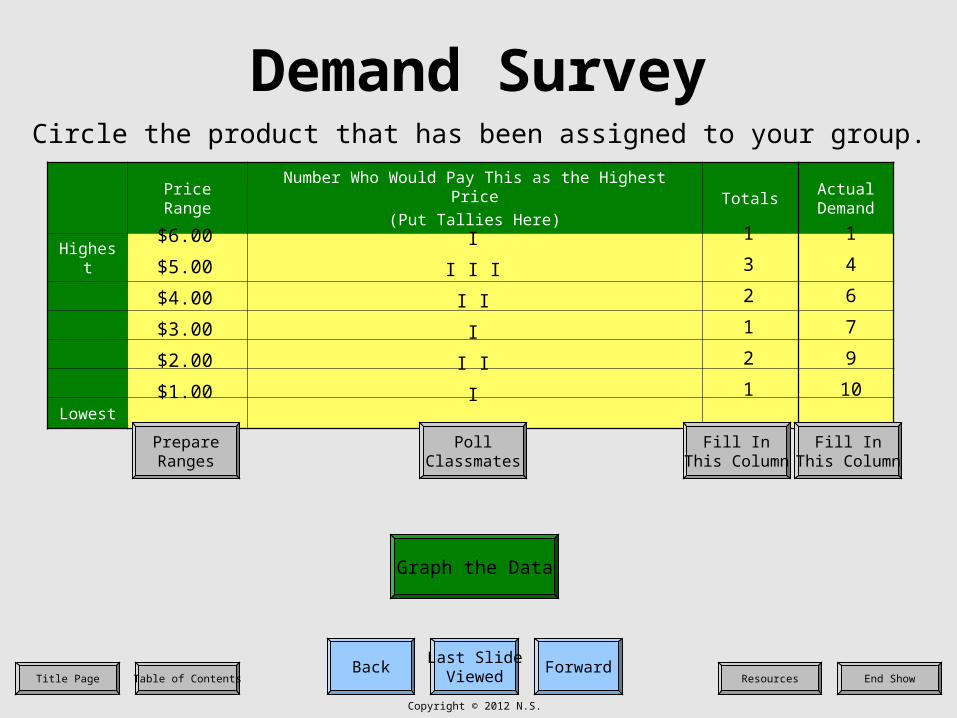
Demand SurveyCircle the product that has been assigned to your group.
Last SlideViewed
ForwardBackEnd ShowResourcesTitle Page Table of Contents
Copyright © 2012 N.S.
Demand Survey
Price RangeNumber Who Would Pay This as the Highest Price
(Put Tallies Here)Totals
Actual Demand
Highest
Lowest
PrepareRanges
Circle the product that has been assigned to your group.
Last SlideViewed
ForwardBackEnd ShowResourcesTitle Page Table of Contents
Copyright © 2012 N.S.
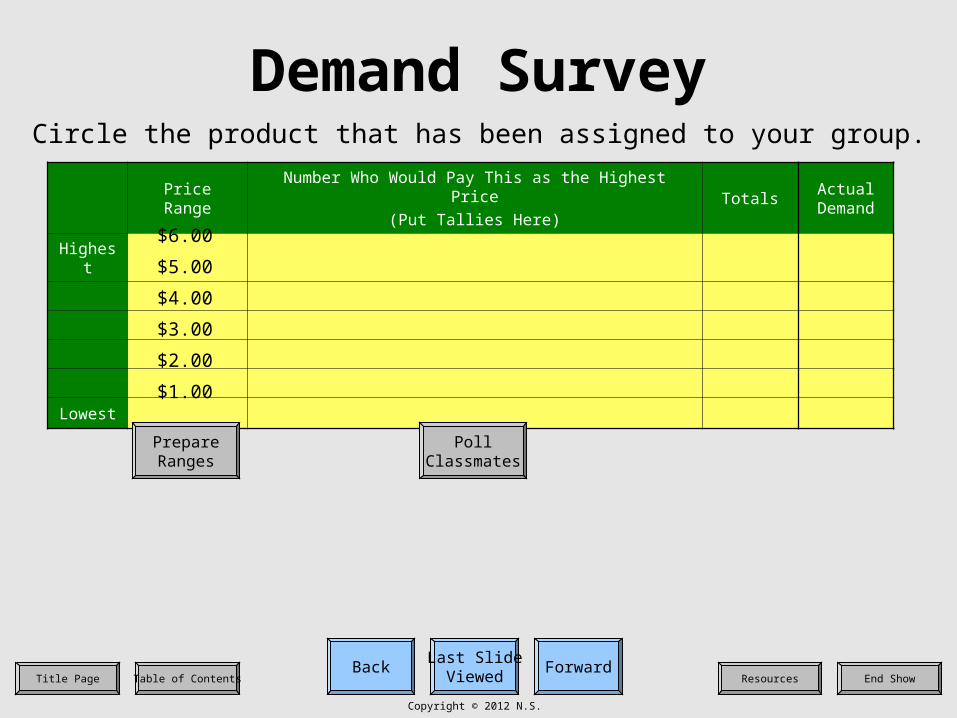
Price RangeNumber Who Would Pay This as the Highest Price
(Put Tallies Here)Totals
Actual Demand
Highest
Lowest
Demand Survey
PrepareRanges
PollClassmates
$6.00
$5.00
$4.00
$3.00
$2.00
$1.00
Circle the product that has been assigned to your group.
Last SlideViewed
ForwardBackEnd ShowResourcesTitle Page Table of Contents
Copyright © 2012 N.S.
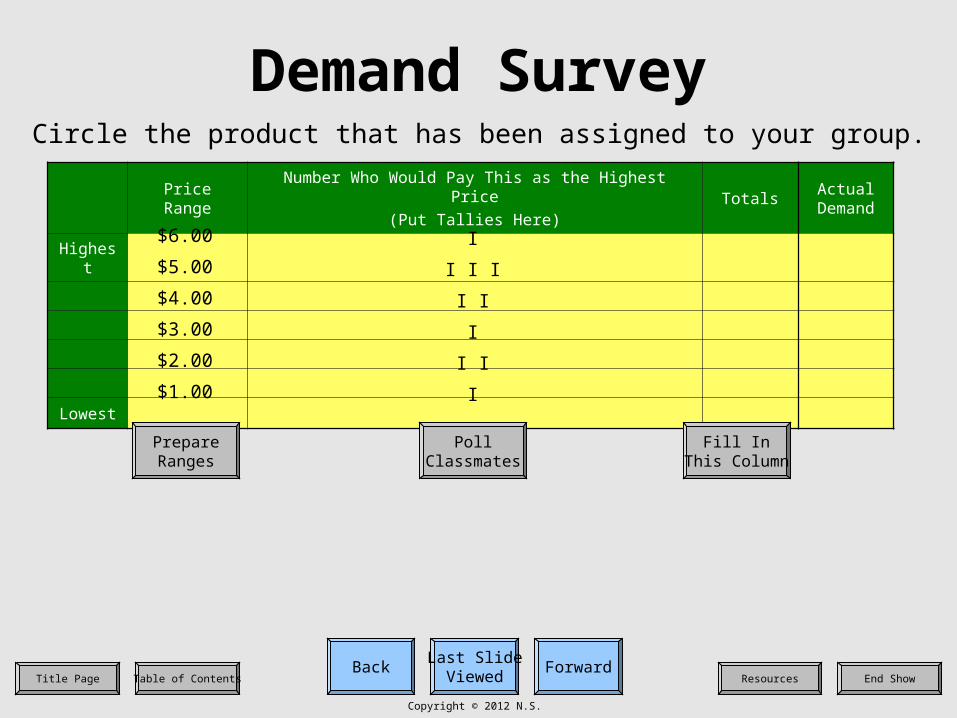
Price RangeNumber Who Would Pay This as the Highest Price
(Put Tallies Here)Totals
Actual Demand
Highest
Lowest
Demand Survey
Fill InThis Column
PrepareRanges
PollClassmates
I
I I I
I I
I
I I
I
$6.00
$5.00
$4.00
$3.00
$2.00
$1.00
Circle the product that has been assigned to your group.
Last SlideViewed
ForwardBackEnd ShowResourcesTitle Page Table of Contents
Copyright © 2012 N.S.
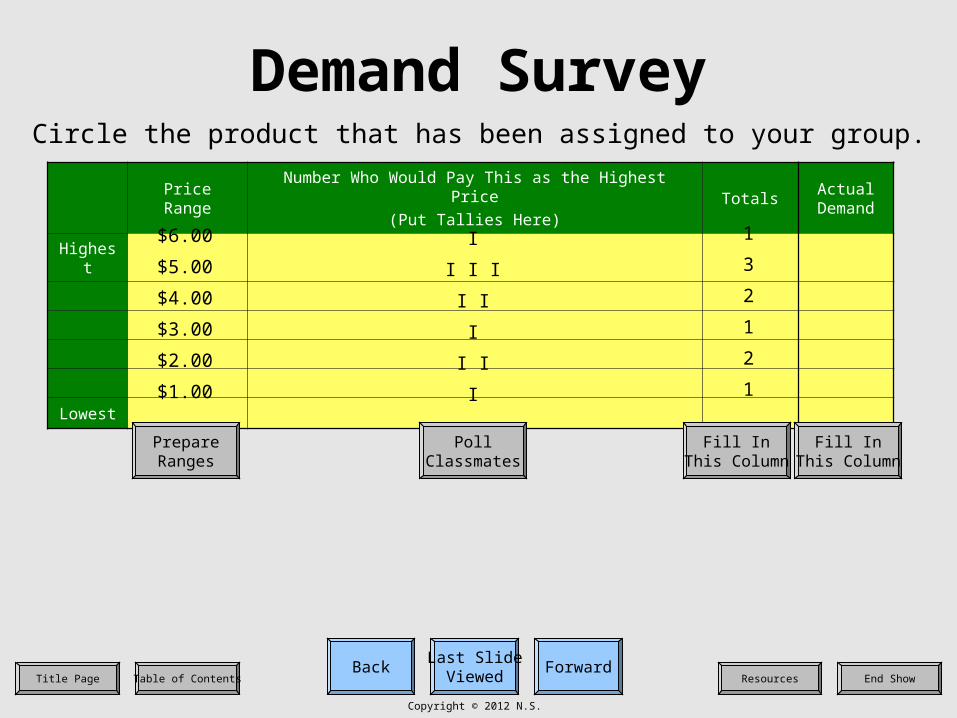
Price RangeNumber Who Would Pay This as the Highest Price
(Put Tallies Here)Totals
Actual Demand
Highest
Lowest
Demand Survey
Fill InThis Column
Fill InThis Column
PrepareRanges
PollClassmates
I
I I I
I I
I
I I
I
1
3
2
1
2
1
Circle the product that has been assigned to your group.
$6.00
$5.00
$4.00
$3.00
$2.00
$1.00
Last SlideViewed
ForwardBackEnd ShowResourcesTitle Page Table of Contents
Copyright © 2012 N.S.
Price RangeNumber Who Would Pay This as the Highest Price
(Put Tallies Here)Totals
Actual Demand
Highest
Lowest
Demand Survey
Fill InThis Column
Fill InThis Column
PrepareRanges
PollClassmates
Graph the Data
I
I I I
I I
I
I I
I
1
4
6
7
9
10
1
3
2
1
2
1
Circle the product that has been assigned to your group.
$6.00
$5.00
$4.00
$3.00
$2.00
$1.00
Last SlideViewed
ForwardBackEnd ShowResourcesTitle Page Table of Contents
Copyright © 2012 N.S.
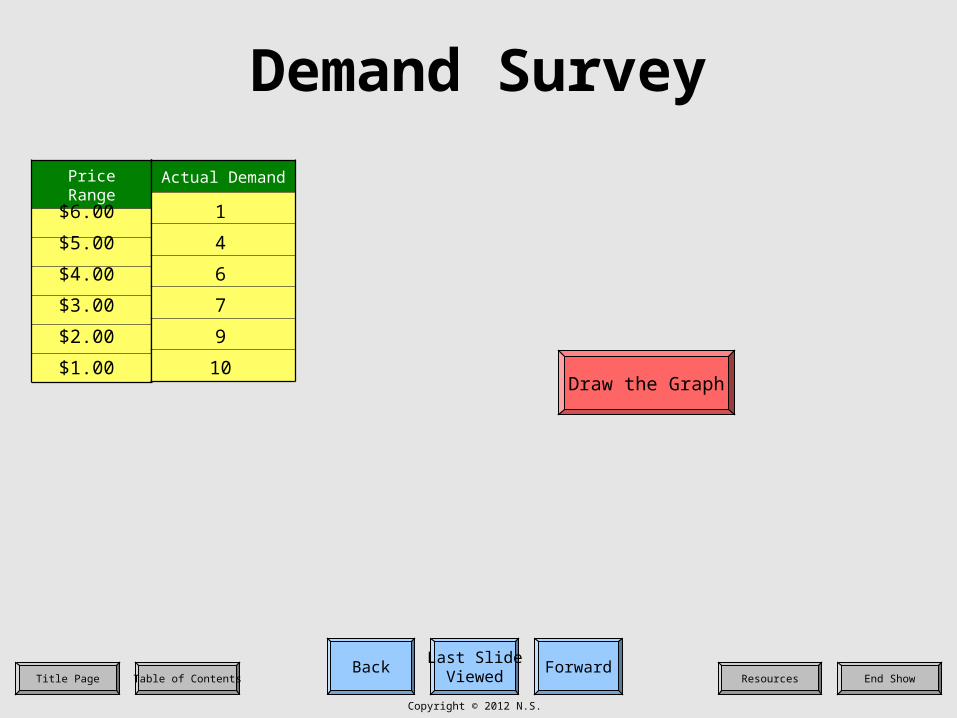
Demand Survey
Price Range
$6.00
$5.00
$4.00
$3.00
$2.00
$1.00
Actual Demand
1
4
6
7
9
10Draw the Graph
Last SlideViewed
ForwardBackEnd ShowResourcesTitle Page Table of Contents
Copyright © 2012 N.S.
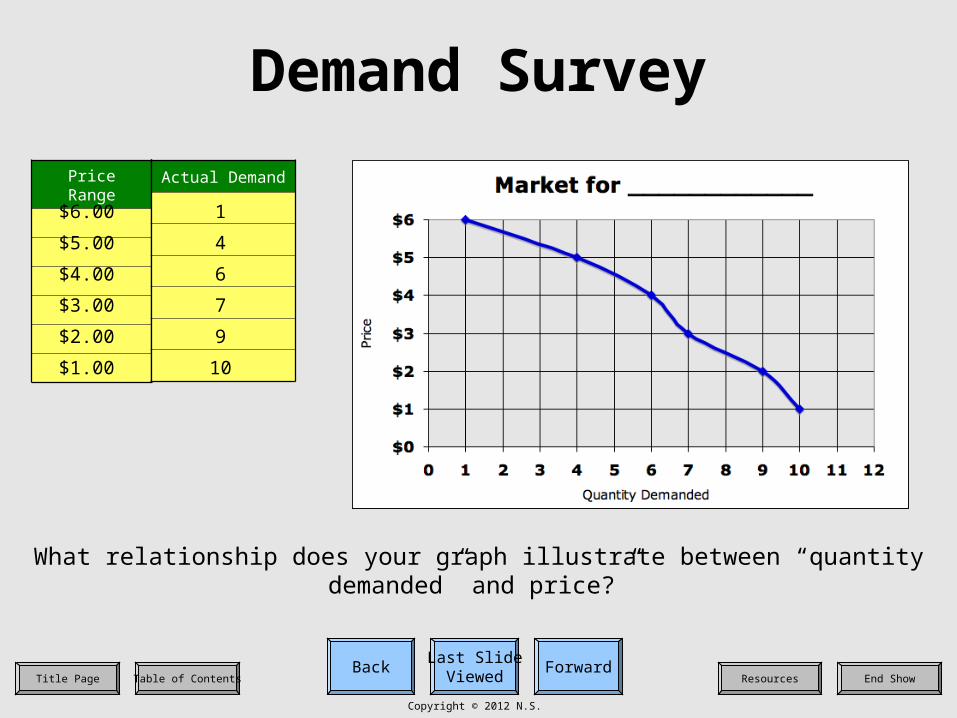
Demand Survey
Price Range
$6.00
$5.00
$4.00
$3.00
$2.00
$1.00
Actual Demand
1
4
6
7
9
10
What relationship does your graph illustrate between “quantity demanded” and price?”
Last SlideViewed
ForwardBackEnd ShowResourcesTitle Page Table of Contents
Copyright © 2012 N.S.
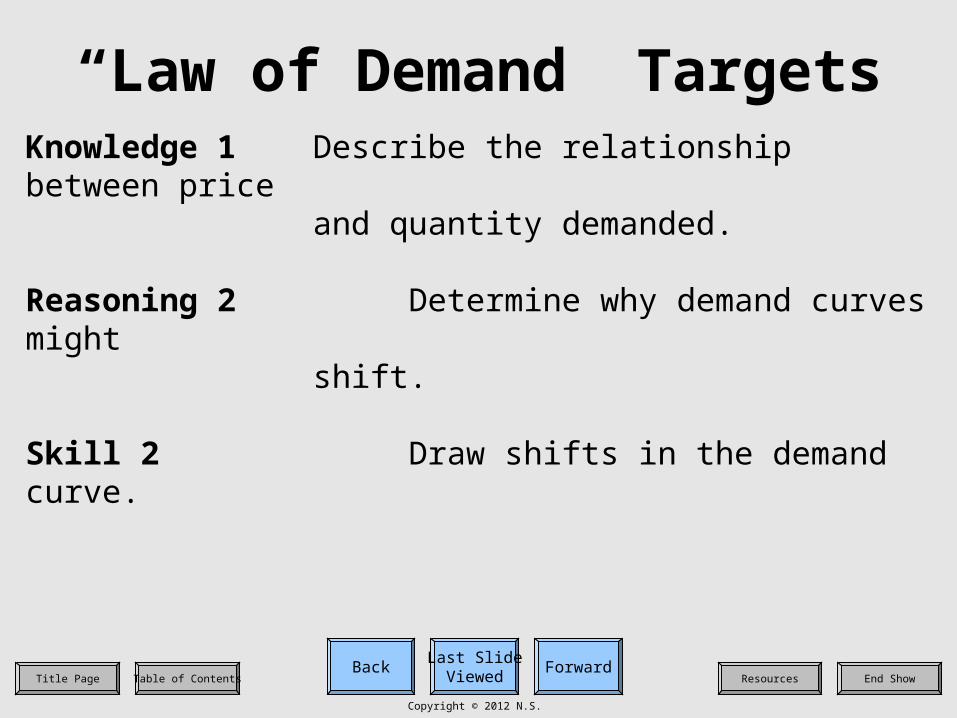
“Law of Demand” Targets
Knowledge 1 Describe the relationship between priceand quantity demanded.
Reasoning 2 Determine why demand curves mightshift.
Skill 2 Draw shifts in the demand curve.
Last SlideViewed
ForwardBackEnd ShowResourcesTitle Page Table of Contents
Copyright © 2012 N.S.
DefinitionIf all things are equal, consumers will demand more of a product as its price
decreases, and less of a product as its price increases.
Last SlideViewed
ForwardBackEnd ShowResourcesTitle Page Table of Contents
Copyright © 2012 N.S.
Definition
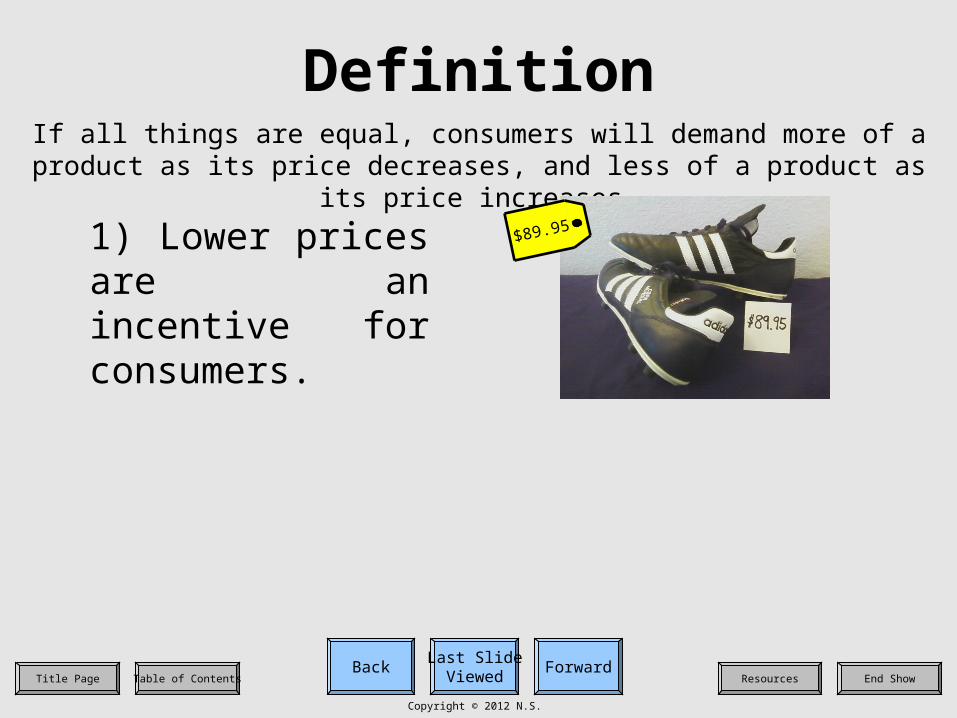
1) Lower prices are an incentive for consumers.
If all things are equal, consumers will demand more of a product as its price decreases, and less of a product as its price increases.
$89.95
Last SlideViewed
ForwardBackEnd ShowResourcesTitle Page Table of Contents
Copyright © 2012 N.S.
Definition
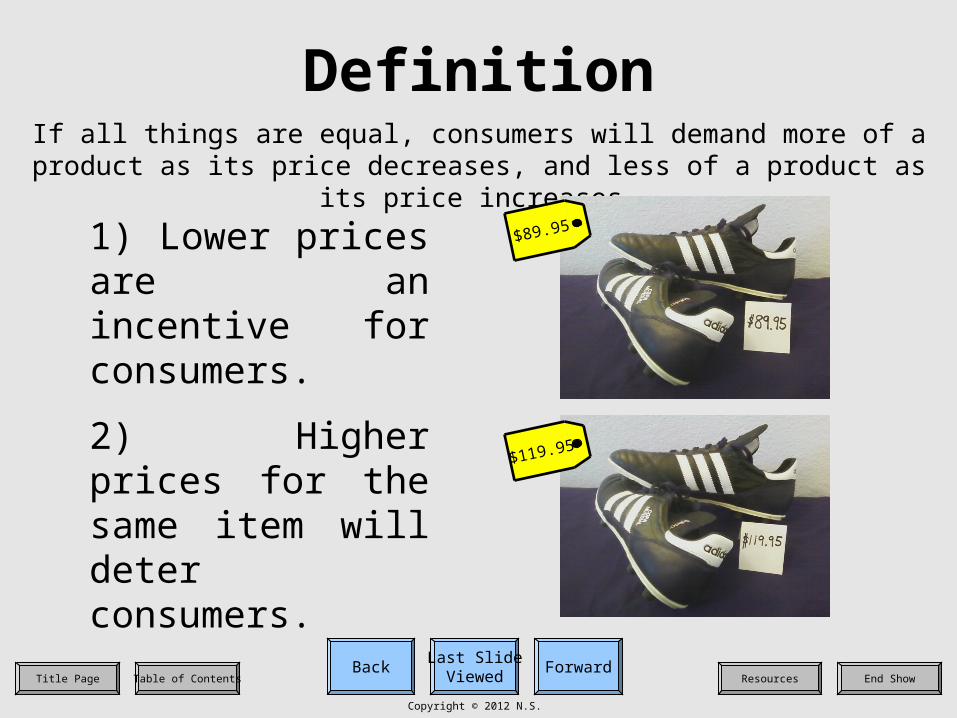
1) Lower prices are an incentive for consumers.
2) Higher prices for the same item will deter consumers.
If all things are equal, consumers will demand more of a product as its price decreases, and less of a product as its price increases.
$119.95
$89.95
Last SlideViewed
ForwardBackEnd ShowResourcesTitle Page Table of Contents
Copyright © 2012 N.S.
Demand Can Change in Two Ways
1) Change in “Quantity Demanded”
Last SlideViewed
ForwardBackEnd ShowResourcesTitle Page Table of Contents
Copyright © 2012 N.S.
Demand Can Change in Two Ways
1) Change in “Quantity Demanded”
•This is just a change along the demand curve.
Last SlideViewed
ForwardBackEnd ShowResourcesTitle Page Table of Contents
Copyright © 2012 N.S.
Demand Can Change in Two Ways
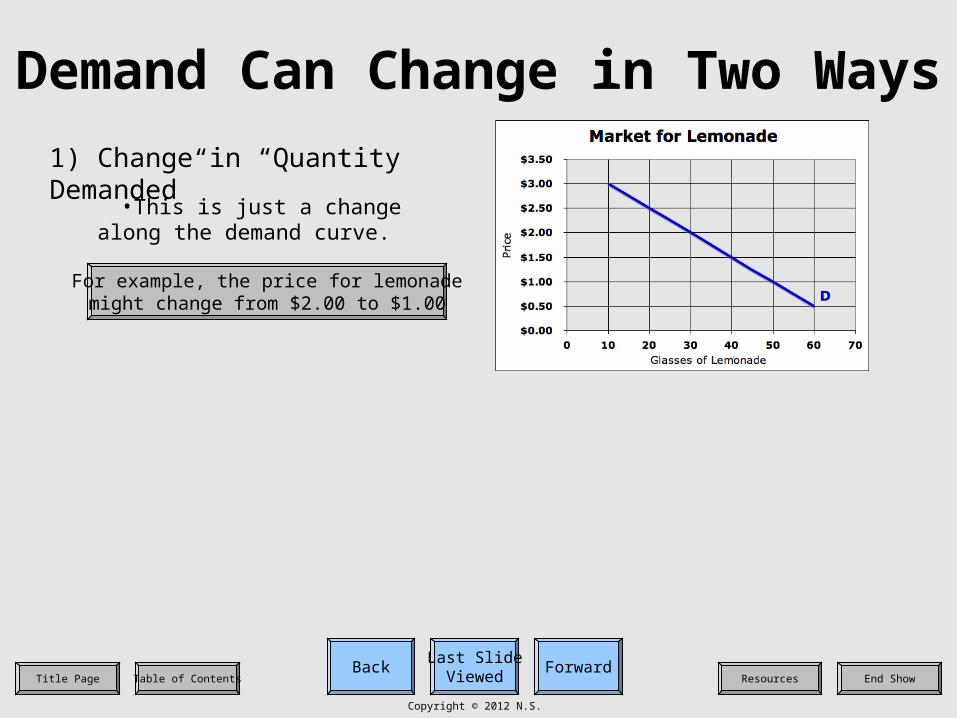
1) Change in “Quantity Demanded”
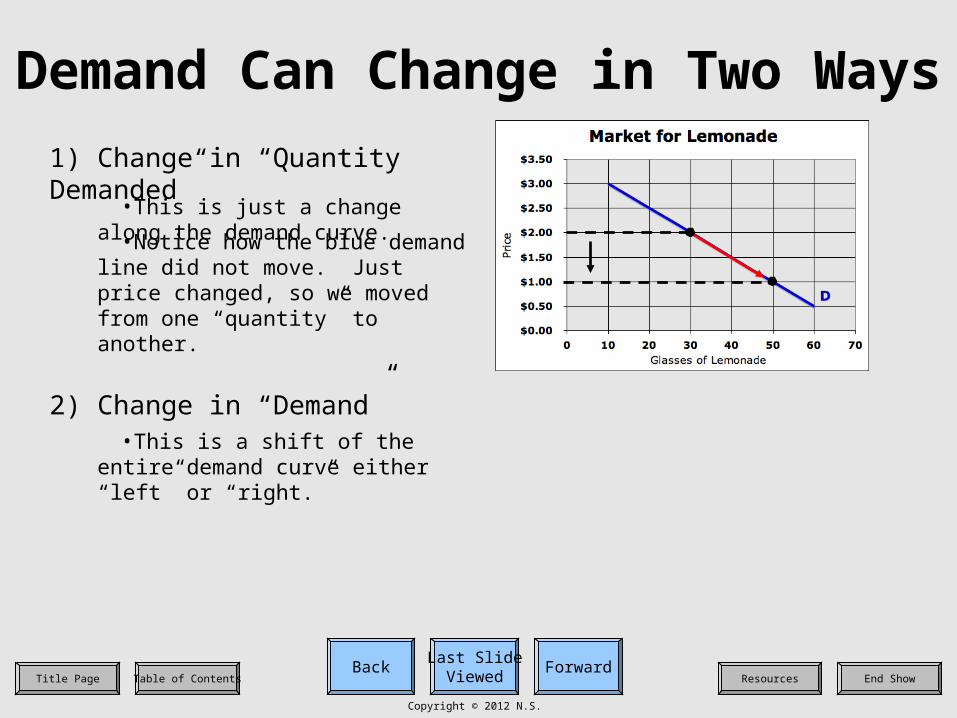
For example, the price for lemonademight change from $2.00 to $1.00
•This is just a change along the demand curve.
Last SlideViewed
ForwardBackEnd ShowResourcesTitle Page Table of Contents
Copyright © 2012 N.S.
Demand Can Change in Two Ways
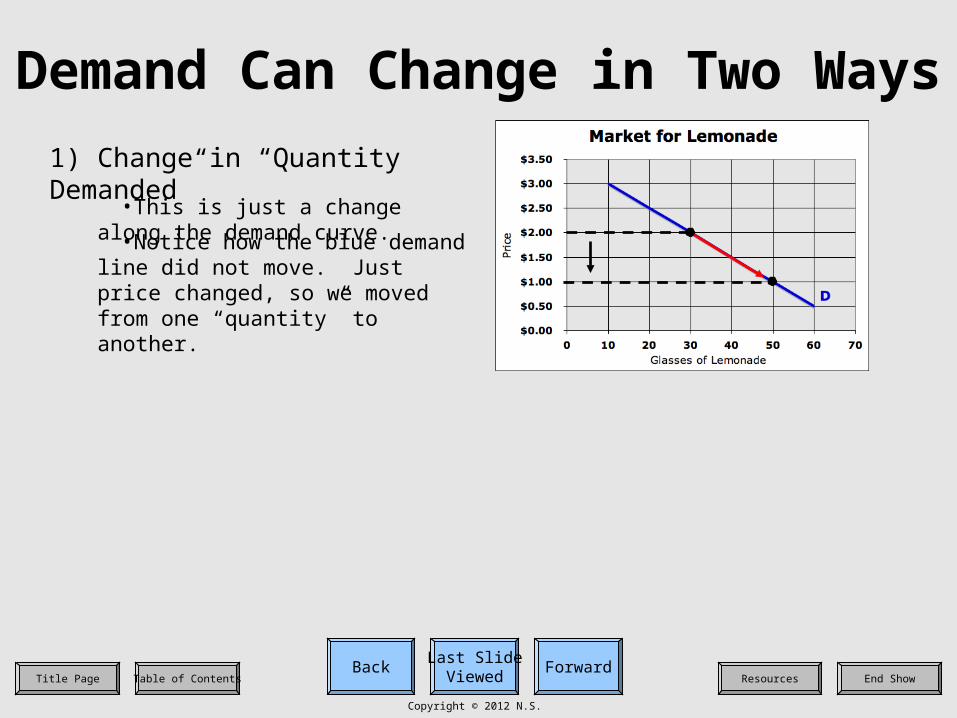
1) Change in “Quantity Demanded”
•This is just a change along the demand curve.
•Notice how the blue demand line did not move. Just price changed, so we moved from one “quantity” to another.
Last SlideViewed
ForwardBackEnd ShowResourcesTitle Page Table of Contents
Copyright © 2012 N.S.
Demand Can Change in Two Ways
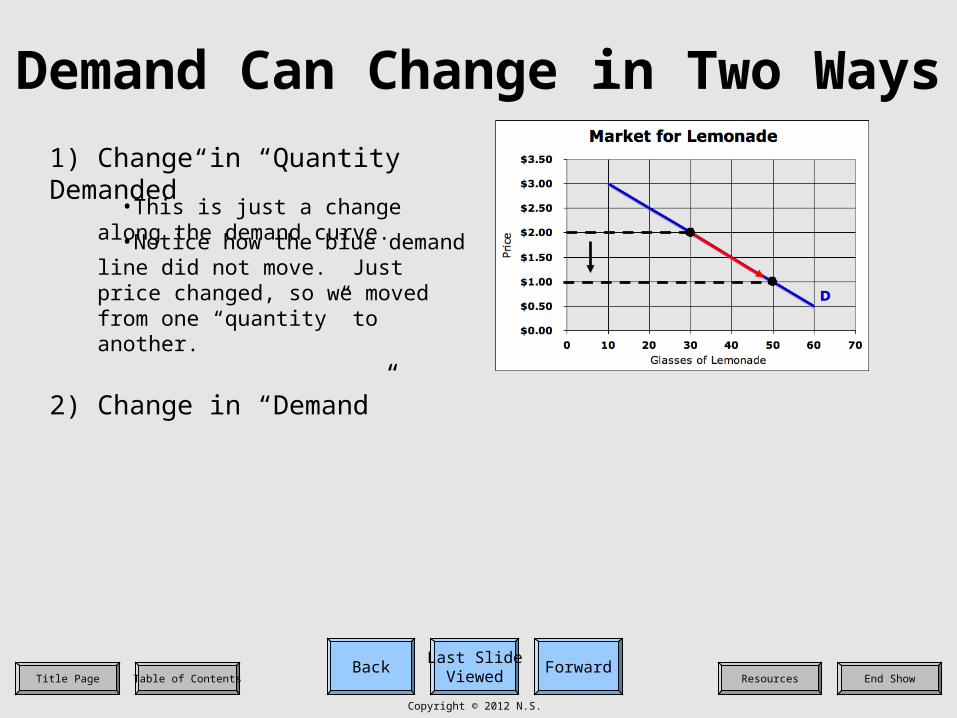
1) Change in “Quantity Demanded”
•This is just a change along the demand curve.
•Notice how the blue demand line did not move. Just price changed, so we moved from one “quantity” to another.
2) Change in “Demand”
Last SlideViewed
ForwardBackEnd ShowResourcesTitle Page Table of Contents
Copyright © 2012 N.S.
Demand Can Change in Two Ways
1) Change in “Quantity Demanded”
•This is just a change along the demand curve.
•Notice how the blue demand line did not move. Just price changed, so we moved from one “quantity” to another.
2) Change in “Demand”
•This is a shift of the entire demand curve either “left” or “right.”
Last SlideViewed
ForwardBackEnd ShowResourcesTitle Page Table of Contents
Copyright © 2012 N.S.
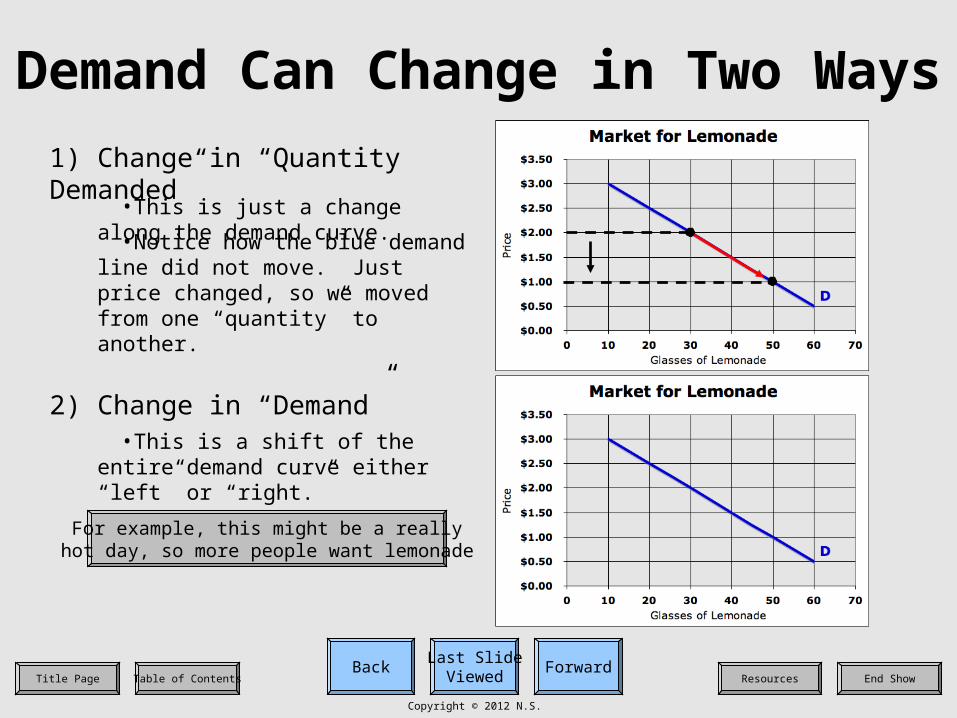
Demand Can Change in Two Ways
1) Change in “Quantity Demanded”
•This is just a change along the demand curve.
•Notice how the blue demand line did not move. Just price changed, so we moved from one “quantity” to another.
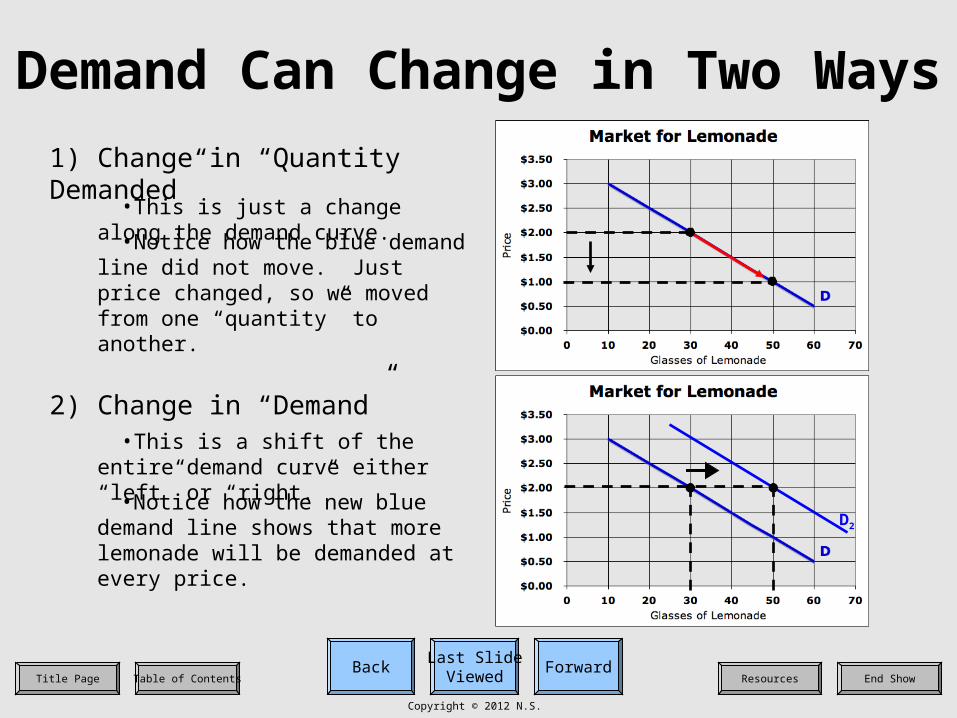
2) Change in “Demand”
•This is a shift of the entire demand curve either “left” or “right.”
For example, this might be a reallyhot day, so more people want lemonade
Last SlideViewed
ForwardBackEnd ShowResourcesTitle Page Table of Contents
Copyright © 2012 N.S.
Demand Can Change in Two Ways
1) Change in “Quantity Demanded”
•This is just a change along the demand curve.
•Notice how the blue demand line did not move. Just price changed, so we moved from one “quantity” to another.
2) Change in “Demand”
•This is a shift of the entire demand curve either “left” or “right.”
•Notice how the new blue demand line shows that more lemonade will be demanded at every price.
D2
Last SlideViewed
ForwardBackEnd ShowResourcesTitle Page Table of Contents
Copyright © 2012 N.S.
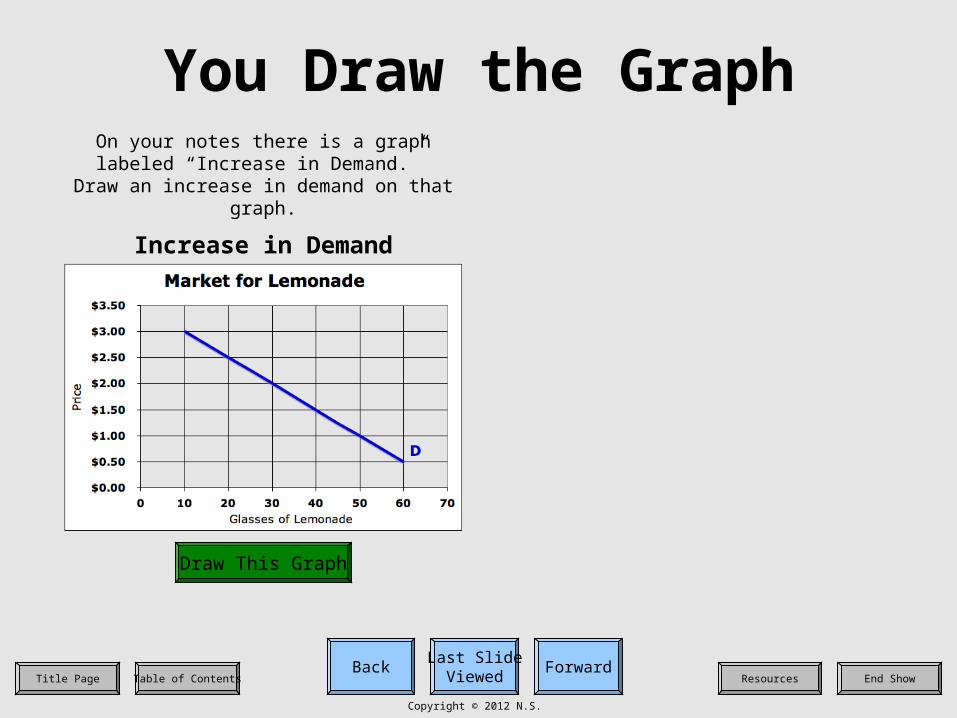
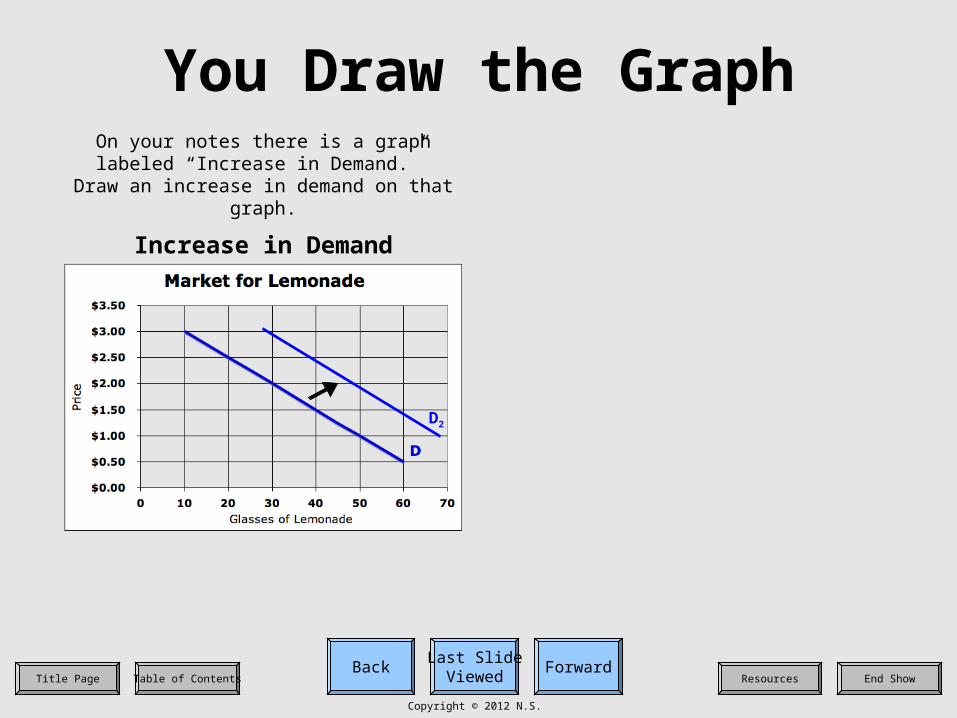
You Draw the GraphOn your notes there is a graph labeled
“Increase in Demand.” Draw an increase in demand on that graph.
Increase in Demand
Draw This Graph
Last SlideViewed
ForwardBackEnd ShowResourcesTitle Page Table of Contents
Copyright © 2012 N.S.
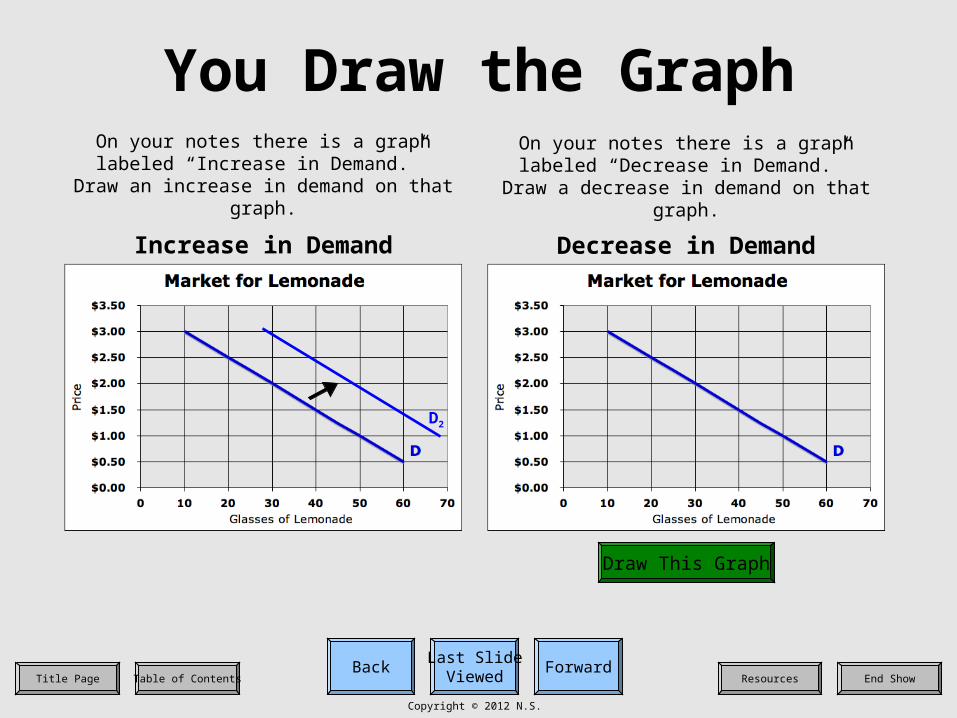
You Draw the GraphOn your notes there is a graph labeled
“Increase in Demand.” Draw an increase in demand on that graph.
Increase in Demand
D2
Last SlideViewed
ForwardBackEnd ShowResourcesTitle Page Table of Contents
Copyright © 2012 N.S.
You Draw the GraphOn your notes there is a graph labeled
“Increase in Demand.” Draw an increase in demand on that graph.
On your notes there is a graph labeled “Decrease in Demand.” Draw a decrease in
demand on that graph.
Increase in Demand Decrease in Demand
Draw This Graph
D2
Last SlideViewed
ForwardBackEnd ShowResourcesTitle Page Table of Contents
Copyright © 2012 N.S.
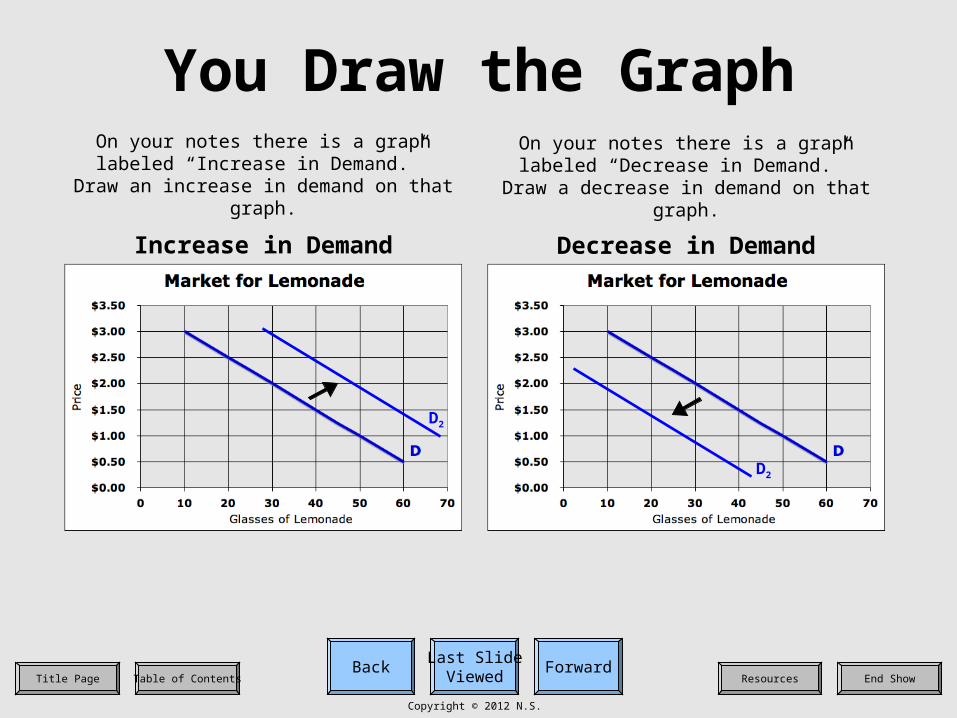
You Draw the GraphOn your notes there is a graph labeled
“Increase in Demand.” Draw an increase in demand on that graph.
On your notes there is a graph labeled “Decrease in Demand.” Draw a decrease in
demand on that graph.
Increase in Demand Decrease in Demand
D2
D2
Last SlideViewed
ForwardBackEnd ShowResourcesTitle Page Table of Contents
Copyright © 2012 N.S.
Increases DemandThere are six factors that will cause demand to increase.
Last SlideViewed
ForwardBackEnd ShowResourcesTitle Page Table of Contents
Copyright © 2012 N.S.
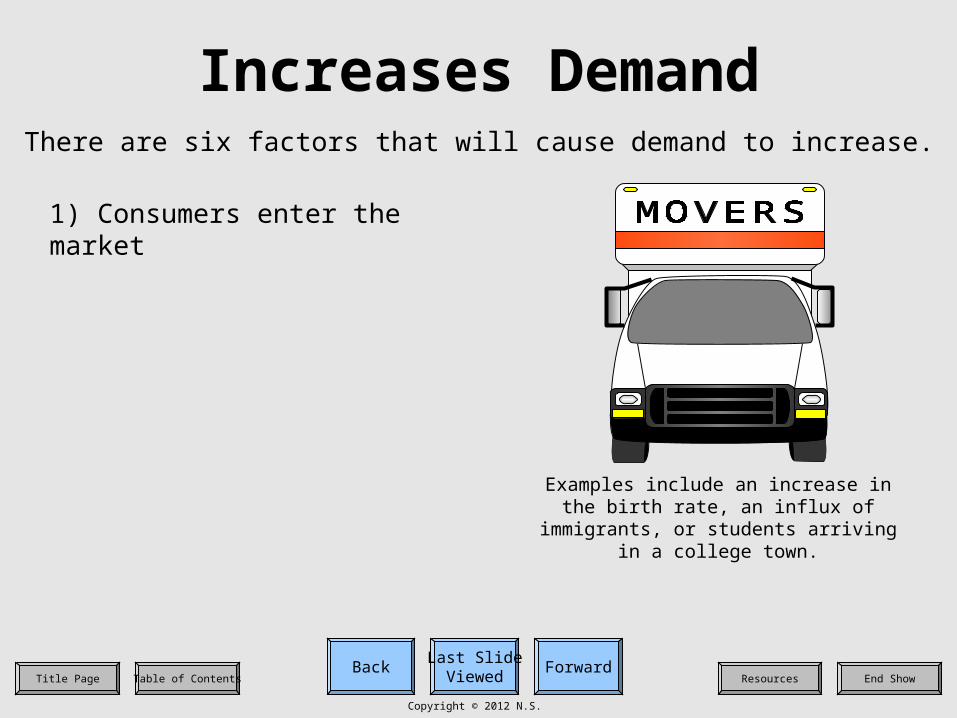
Increases DemandThere are six factors that will cause demand to increase.
1) Consumers enter the market
Examples include an increase in the birth rate, an influx of immigrants, or students
arriving in a college town.
Last SlideViewed
ForwardBackEnd ShowResourcesTitle Page Table of Contents
Copyright © 2012 N.S.
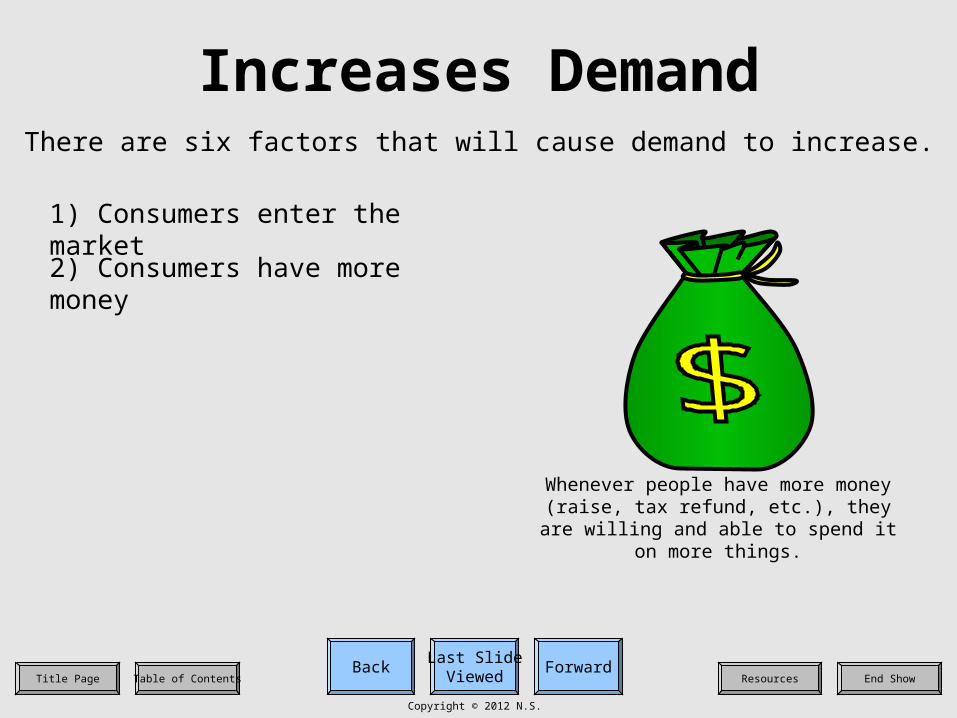
Increases DemandThere are six factors that will cause demand to increase.
1) Consumers enter the market
Whenever people have more money (raise, tax refund, etc.), they are willing and able to
spend it on more things.
2) Consumers have more money
Last SlideViewed
ForwardBackEnd ShowResourcesTitle Page Table of Contents
Copyright © 2012 N.S.
Increases DemandThere are six factors that will cause demand to increase.
1) Consumers enter the market
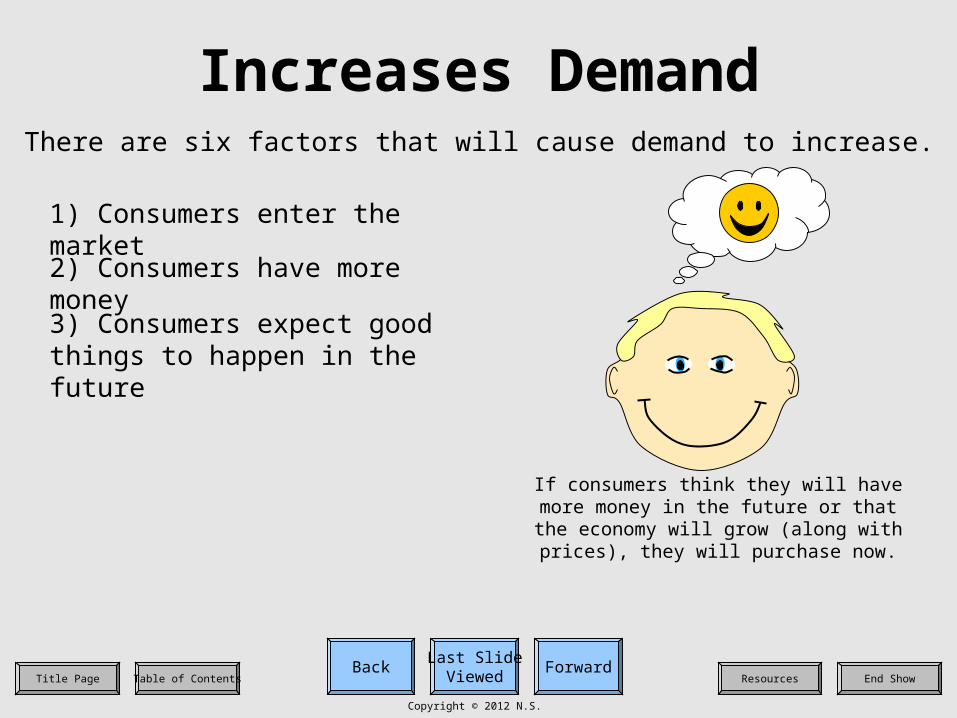
If consumers think they will have more money in the future or that the economy will grow (along with prices), they will purchase now.
2) Consumers have more money
3) Consumers expect good things to happen in the future
Last SlideViewed
ForwardBackEnd ShowResourcesTitle Page Table of Contents
Copyright © 2012 N.S.
Increases DemandThere are six factors that will cause demand to increase.
1) Consumers enter the market
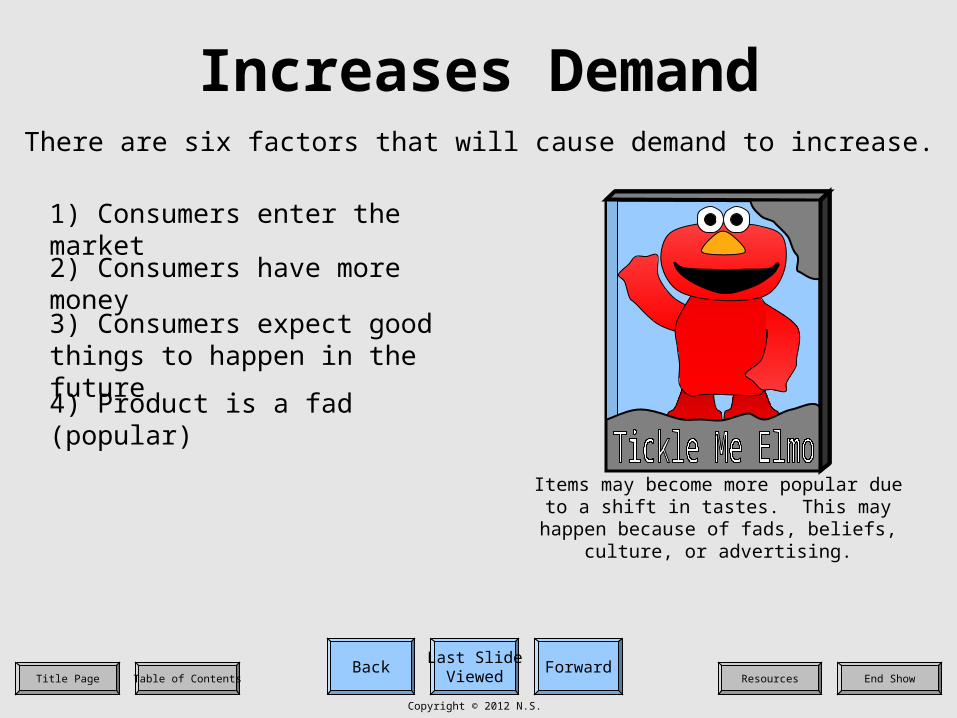
Items may become more popular due to a shift in tastes. This may happen because of
fads, beliefs, culture, or advertising.
2) Consumers have more money
3) Consumers expect good things to happen in the future
4) Product is a fad (popular)

Last SlideViewed
ForwardBackEnd ShowResourcesTitle Page Table of Contents
Copyright © 2012 N.S.
Increases DemandThere are six factors that will cause demand to increase.
1) Consumers enter the market
If an item that serves a similar function (substitute) becomes expensive, consumers
will demand more of the original item.
2) Consumers have more money
3) Consumers expect good things to happen in the future
4) Product is a fad (popular)
5) Price of a substitute good increases
Last SlideViewed
ForwardBackEnd ShowResourcesTitle Page Table of Contents
Copyright © 2012 N.S.
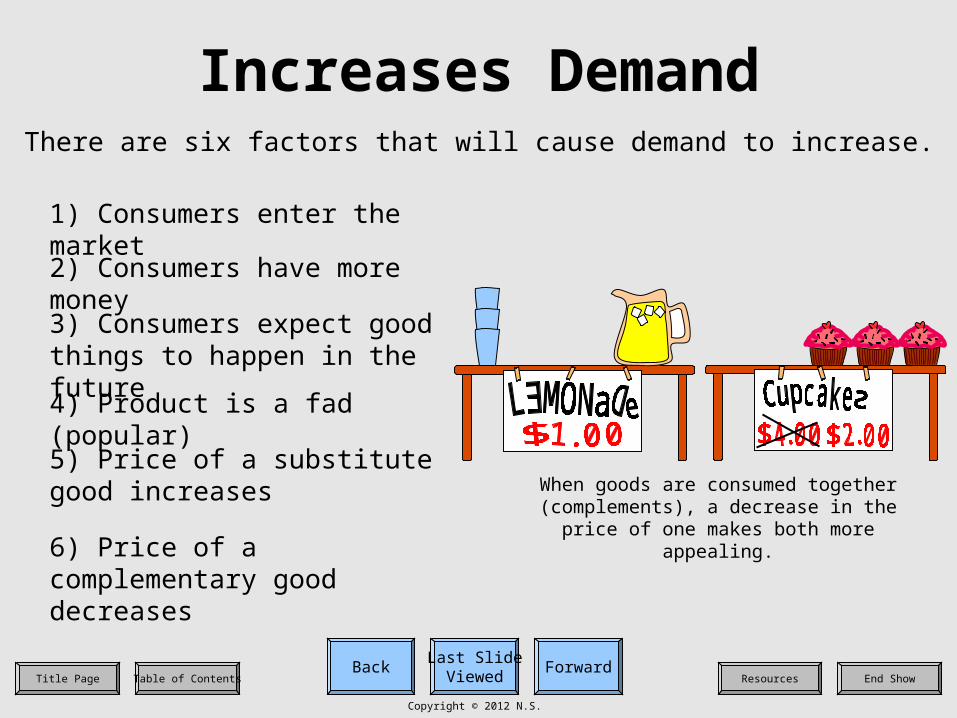
Increases DemandThere are six factors that will cause demand to increase.
1) Consumers enter the market
When goods are consumed together (complements), a decrease in the price of
one makes both more appealing.
2) Consumers have more money
3) Consumers expect good things to happen in the future
4) Product is a fad (popular)
5) Price of a substitute good increases
6) Price of a complementary good decreases
Last SlideViewed
ForwardBackEnd ShowResourcesTitle Page Table of Contents
Copyright © 2012 N.S.
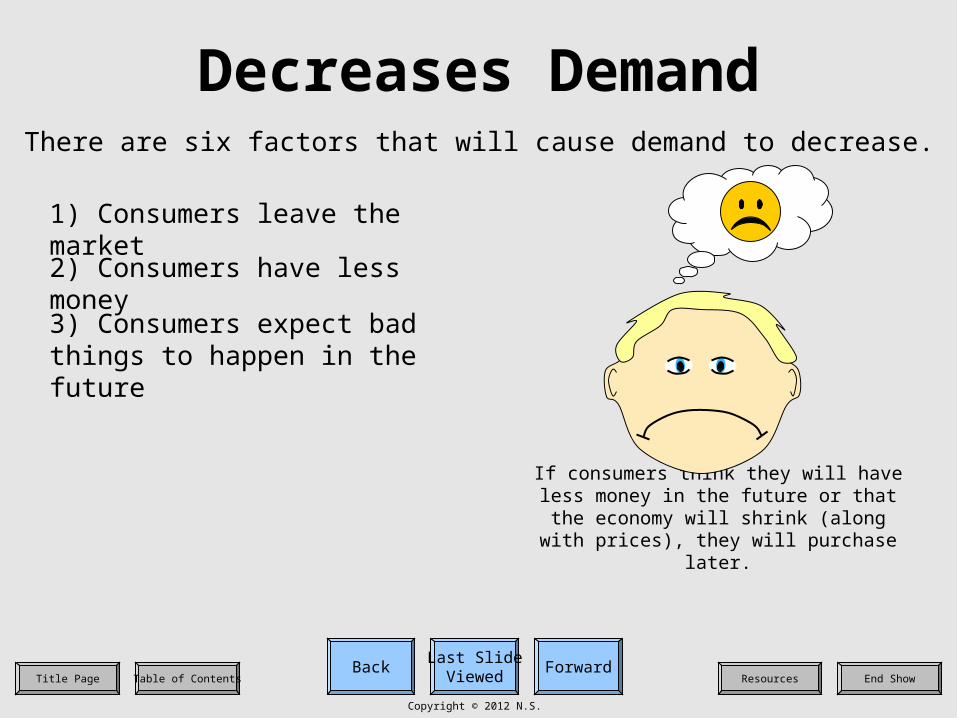
Decreases DemandThere are six factors that will cause demand to decrease.
Last SlideViewed
ForwardBackEnd ShowResourcesTitle Page Table of Contents
Copyright © 2012 N.S.
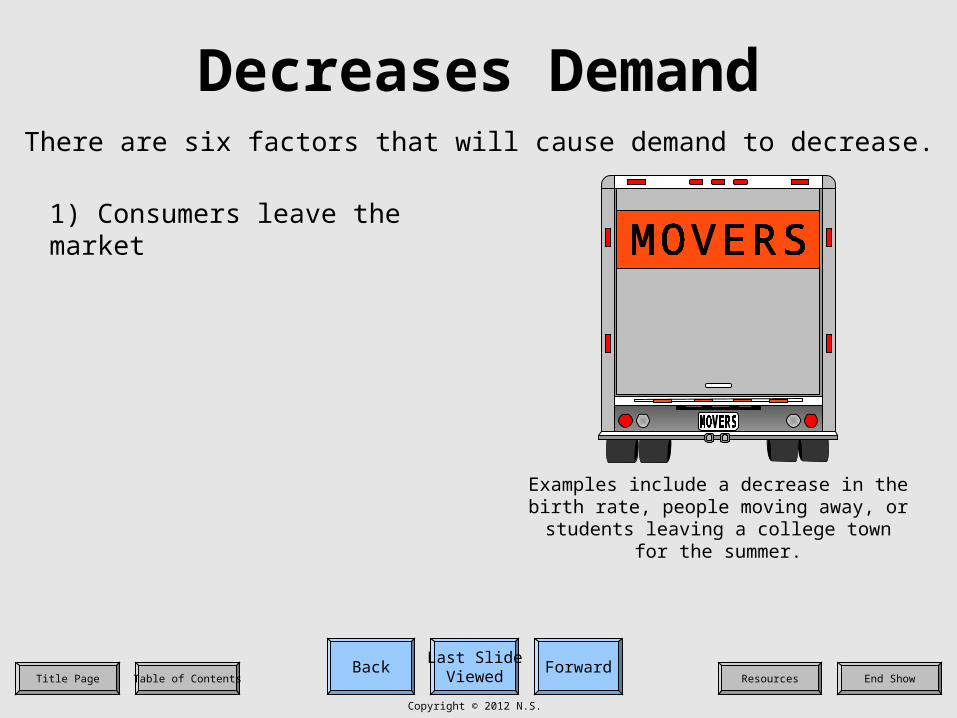
Decreases DemandThere are six factors that will cause demand to decrease.
1) Consumers leave the market
Examples include a decrease in the birth rate, people moving away, or students leaving a
college town for the summer.
Last SlideViewed
ForwardBackEnd ShowResourcesTitle Page Table of Contents
Copyright © 2012 N.S.
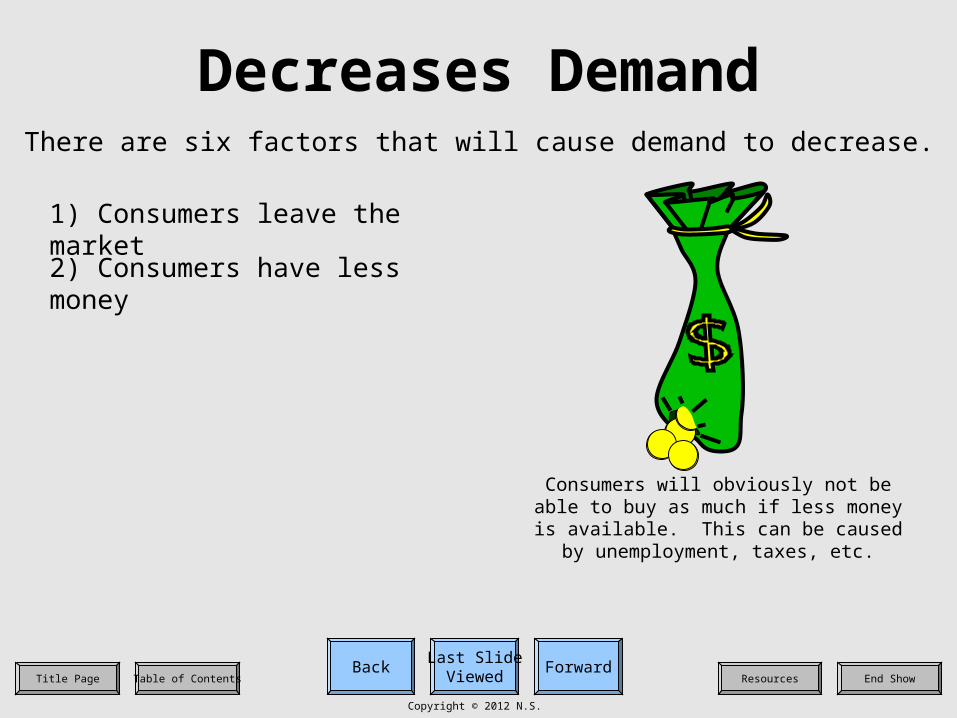
Decreases DemandThere are six factors that will cause demand to decrease.
1) Consumers leave the market
Consumers will obviously not be able to buy as much if less money is available. This can
be caused by unemployment, taxes, etc.
2) Consumers have less money
Last SlideViewed
ForwardBackEnd ShowResourcesTitle Page Table of Contents
Copyright © 2012 N.S.
Decreases DemandThere are six factors that will cause demand to decrease.
1) Consumers leave the market
If consumers think they will have less money in the future or that the economy will shrink (along with prices), they will purchase later.
2) Consumers have less money
3) Consumers expect bad things to happen in the future
Last SlideViewed
ForwardBackEnd ShowResourcesTitle Page Table of Contents
Copyright © 2012 N.S.
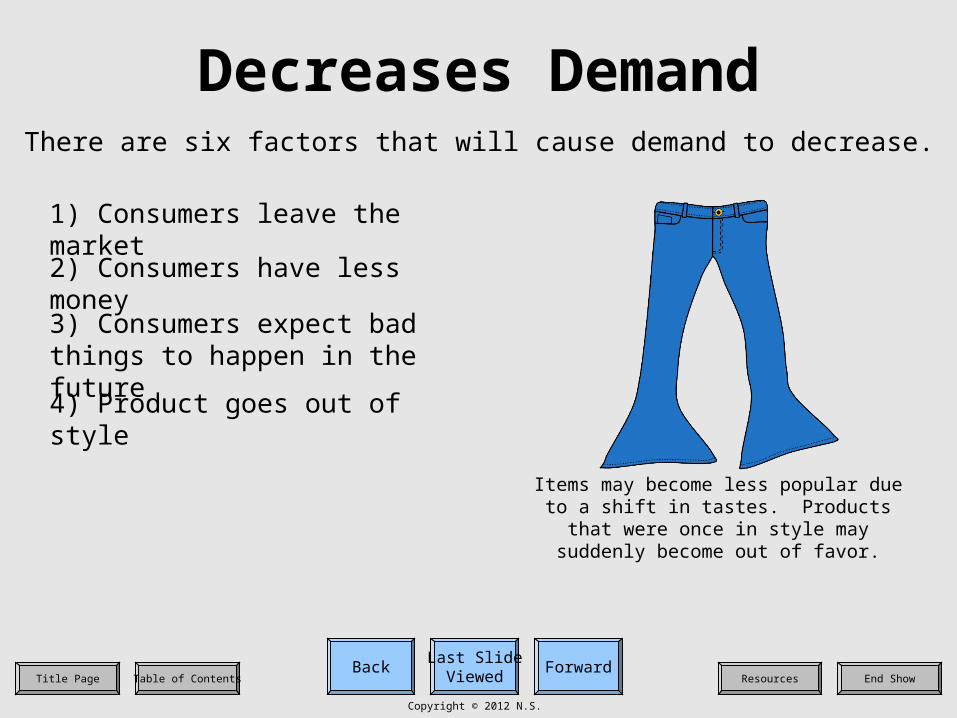
Decreases DemandThere are six factors that will cause demand to decrease.
1) Consumers leave the market
Items may become less popular due to a shift in tastes. Products that were once in style
may suddenly become out of favor.
2) Consumers have less money
3) Consumers expect bad things to happen in the future
4) Product goes out of style
Last SlideViewed
ForwardBackEnd ShowResourcesTitle Page Table of Contents
Copyright © 2012 N.S.
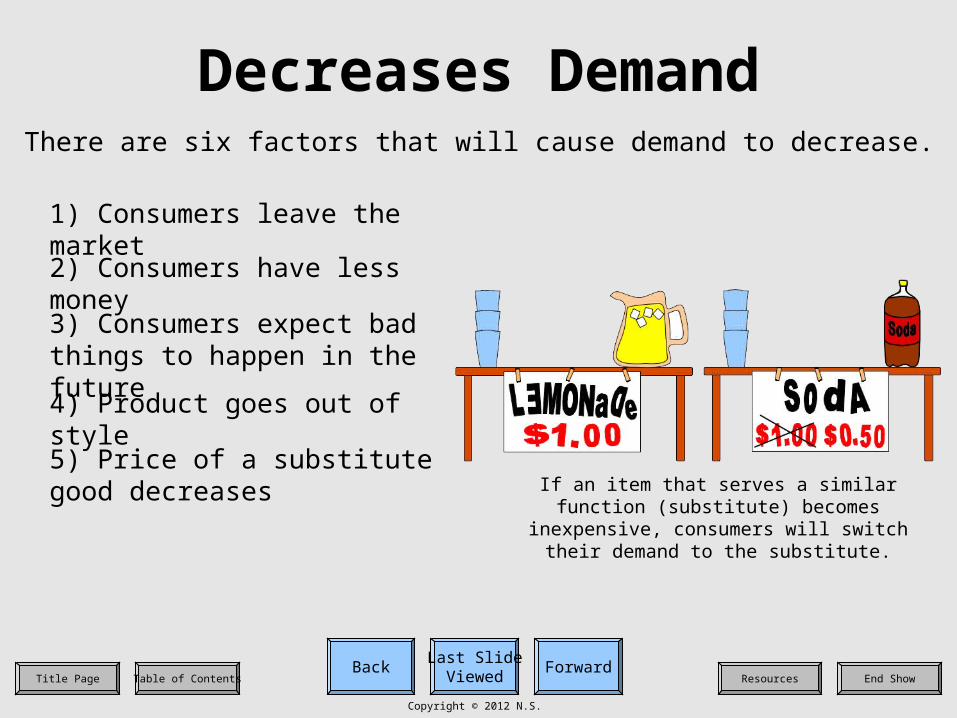
Decreases DemandThere are six factors that will cause demand to decrease.
1) Consumers leave the market
If an item that serves a similar function (substitute) becomes inexpensive, consumers
will switch their demand to the substitute.
2) Consumers have less money
3) Consumers expect bad things to happen in the future
4) Product goes out of style
5) Price of a substitute good decreases
Last SlideViewed
ForwardBackEnd ShowResourcesTitle Page Table of Contents
Copyright © 2012 N.S.
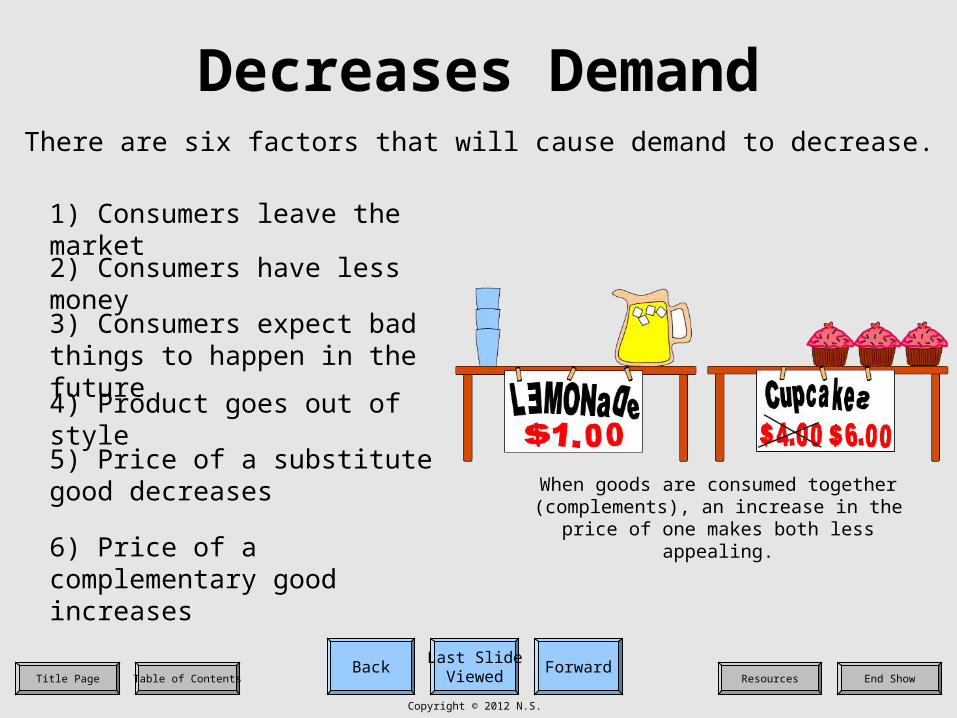
Decreases DemandThere are six factors that will cause demand to decrease.
1) Consumers leave the market
When goods are consumed together (complements), an increase in the price of
one makes both less appealing.
2) Consumers have less money
3) Consumers expect bad things to happen in the future
4) Product goes out of style
5) Price of a substitute good decreases
6) Price of a complementary good increases
Last SlideViewed
ForwardBackEnd ShowResourcesTitle Page Table of Contents
Copyright © 2012 N.S.
The Effects of Shifting Demand
When the demand curve shifts, it affects quantity and price. Complete the table (on your notes) by deciding whether quantity and price increase or
decrease for each scenario. Use the graphs to help you.
Last SlideViewed
ForwardBackEnd ShowResourcesTitle Page Table of Contents
Copyright © 2012 N.S.
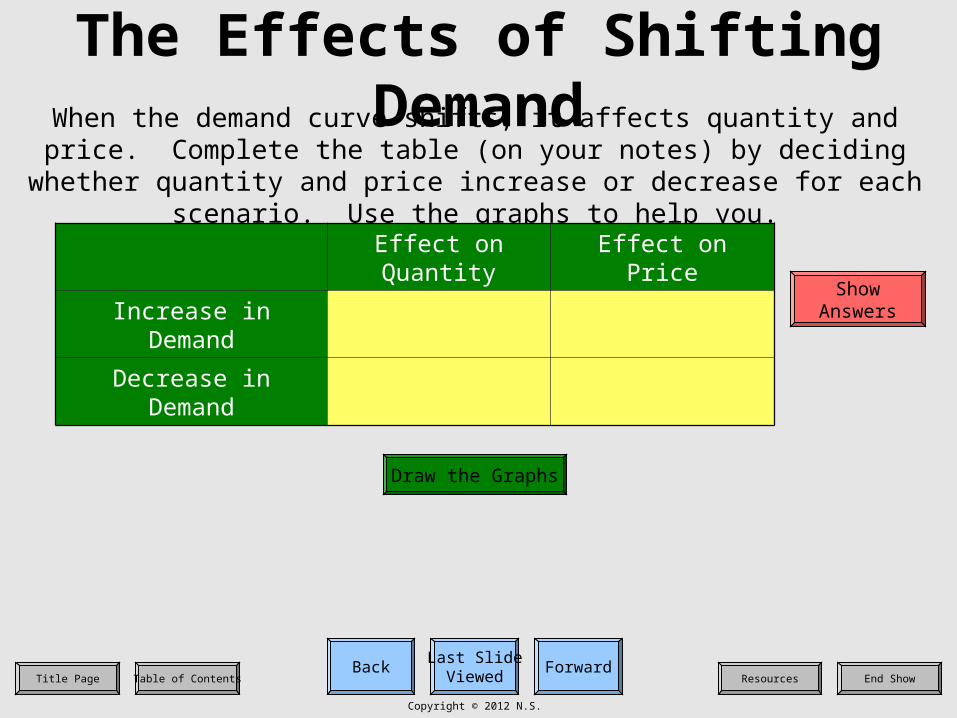
The Effects of Shifting Demand
When the demand curve shifts, it affects quantity and price. Complete the table (on your notes) by deciding whether quantity and price increase or
decrease for each scenario. Use the graphs to help you.
Effect on Quantity Effect on Price
Increase in Demand
Decrease in Demand
ShowAnswers
Draw the Graphs
Last SlideViewed
ForwardBackEnd ShowResourcesTitle Page Table of Contents
Copyright © 2012 N.S.
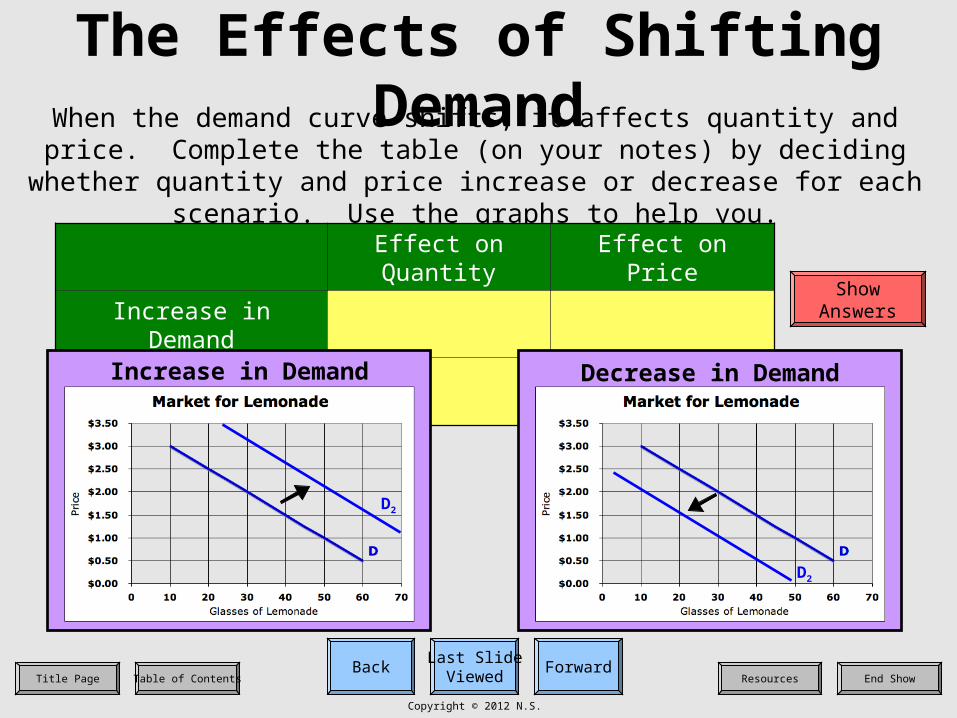
The Effects of Shifting Demand
When the demand curve shifts, it affects quantity and price. Complete the table (on your notes) by deciding whether quantity and price increase or
decrease for each scenario. Use the graphs to help you.
Effect on Quantity Effect on Price
Increase in Demand
Decrease in Demand
ShowAnswers
Increase in Demand
D2
Decrease in Demand
D2
Last SlideViewed
ForwardBackEnd ShowResourcesTitle Page Table of Contents
Copyright © 2012 N.S.
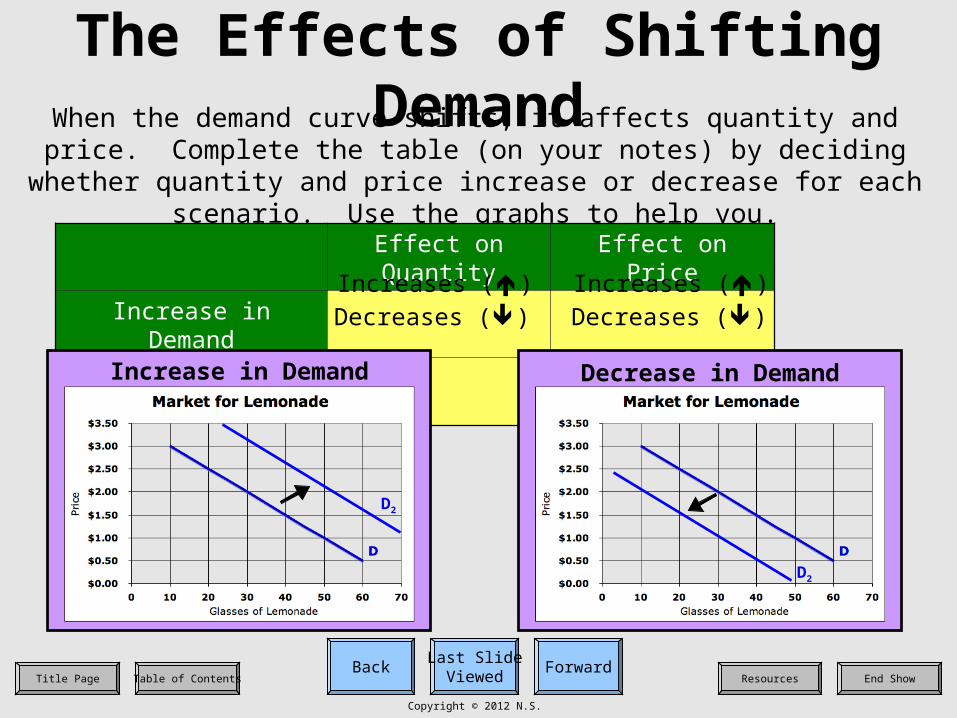
The Effects of Shifting Demand
When the demand curve shifts, it affects quantity and price. Complete the table (on your notes) by deciding whether quantity and price increase or
decrease for each scenario. Use the graphs to help you.
Effect on Quantity Effect on Price
Increase in Demand
Decrease in Demand
Increases ()
Decreases ()
Increases ()
Decreases ()
Increase in Demand
D2
Decrease in Demand
D2
Last SlideViewed
ForwardBackEnd ShowResourcesTitle Page Table of Contents
Copyright © 2012 N.S.
Changes in Demand
(a) Complete this version if you feel you need theteacher to work with you on this topic.
(b) Complete this version if you feel you have a fairlygood understanding of the targets.
(c) Complete this version if you feel this topic is easy.
This is today’s assignment.

Last SlideViewed
ForwardBackEnd ShowResourcesTitle Page Table of Contents
Copyright © 2012 N.S.
“Law of Demand” Targets
Knowledge 1 Describe the relationship between priceand quantity demanded.
Reasoning 2 Determine why demand curves mightshift.
Skill 2 Draw shifts in the demand curve.
Last SlideViewed
ForwardBackEnd ShowResourcesTitle Page Table of Contents
Copyright © 2012 N.S.
Resources