Embed Size (px)
Citation preview

BEFORE THE RÉGIE DE L'ÉNERGIE
IN THE MATTER OF:
HYDRO QUÉBEC DISTRIBUTION
Demande du Distributeur relative à
l 'établissement des tarifs
d'électricité pour l 'année tarifaire
2011-2012
DOSSIER R-3740-2010
22 October 2010
prepared on behalf of:
l'Association québécoise des consommateurs
industriels d'électricité (AQCIE)
Conseil de l'industrie forestière du Québec (CIFQ)
prepared evidence of:
Robert D. Knecht
Industrial Economics, Incorporated
2067 Massachusetts Avenue
Cambridge, MA 02140

Evidence of Robert D. Knecht Docket No. R-3740-2010
1
My name is Robert D. Knecht. I am a Principal and the Treasurer of Industrial 1 Economics, Incorporated (“IEc”), a consulting firm located at 2067 Massachusetts 2 Avenue, Cambridge, MA 02140. As part of my consulting practice, I prepare analyses 3 and expert testimony in the field of regulatory economics. In Canada, I have 4 submitted expert evidence in regulatory proceedings in Québec, Ontario, Alberta, New 5 Brunswick, Nova Scotia, Manitoba, and Prince Edward Island. In matters regarding 6 Hydro Québec Distribution (“HQD”), I have submitted evidence or reports before the 7 Régie in various dockets since 2001. 8
I obtained a B.S. degree in Economics from the Massachusetts Institute of Technology 9 in 1978, and a M.S. degree in Management from the Sloan School of Management at 10 M.I.T. in 1982, with concentrations in applied economics and finance. My curriculum 11 vitae and a schedule of my expert evidence presented to regulatory tribunals during 12 the past five years are attached as Exhibit IEc-1. 13
I was retained by l'Association québécoise des consommateurs industriels d'électricité 14 (“AQCIE”) and the Conseil de l'industrie forestière du Québec (“CIFQ”) to evaluate 15 the following aspects of HQD’s filing: 16
History of cross-subsidies; 17
The Rate M/RateL tariff interface; 18
HQD’s pension cost claims. 19
PLEASE PROVIDE A BRIEF BACKGROUND OF THE REGULATORY ISSUES 20 SURROUNDING REVENUE ALLOCATION FOR THIS PROCEEDING.1 21 The regulation of HQD is subject to the unusual (and quite possibly unique) 22 requirement that rates may not be adjusted in order to cause changes in historical 23 levels of cross-subsidization. How that cross-subsidization should be measured was a 24 matter of some debate over several rate proceedings. 25
Nevertheless, in the 2006 HQD proceeding (R-3610-2006), the Régie approved a 26 methodology proposed by HQD which measures the increase in allocated per-kWh 27 cost from proceeding to proceeding, based on a consistent cost allocation 28 methodology. That is, HQD simulates its cost allocation methodology for the prior 29 test year and for the proposed test year with the same cost allocation methodology. 30 The difference in the per-kWh allocated costs between those two simulations is 31 deemed, under this methodology, to be the necessary difference in rates that would 32 result in no change in cross-subsidies. 33
Thus, in Docket R-3610-2006, the Régie implicitly adopted a new base level of cross-34 subsidies. 35
1 This section of my testimony updates my quantitative analysis of the history of cross-
subsidization among rate classes that I presented in HQD last base rates case. I have borrowed
some of the text from that testimony as well.
INTRODUCTION
1. CROSS-
SUBSIDIZATION
HISTORY

Evidence of Robert D. Knecht Docket No. R-3740-2010
2
However, in the last four proceedings, the Régie has not applied its cross-subsidy 1 approach for revenue allocation.2 Instead, it approved “across-the-board” rate 2 increases for all rate classes in all four cases. 3
In the current proceeding, HQD has again prepared its cross-subsidization analysis, 4 which implies differential rate increases are necessary to prevent cross-subsidies from 5 changing. However, HQD has again proposed to apply an across-the-board approach 6 in this proceeding, albeit at a zero increase. 7
WHAT ARE THE IMPLICATIONS FOR CROSS-SUBSIDIES AMONG THE RATE CLASSES 8 FROM HQD’S PROPOSAL? 9 Exhibit IEc-2 attached to this evidence updates my analysis of the cross-subsidy 10 implications of HQD’s proposal. In this case, an across-the-board approach reduces 11 the cross-subsidy to the residential class, relative to the previous year. For the classes 12 that provide the cross-subsidy, HQD’s proposed approach will result in an increase in 13 cross-subsidies from the medium commercial class, with reductions in cross-subsidies 14 from the small commercial and large industrial classes. I note that this is the first year 15 in which the cross-subsidy from the large industrial class has been reduced on a 16 single-year basis. Of course, relative to the 2007 test year, the large industrial cross-17 subsidy has increased substantially, as a result of subsidy growth in the intervening 18 years. 19
Relative to the base year proceeding in 2006, the time at which the Régie established 20 the base conditions for cross-subsidies, the cumulative subsidies to the residential 21 class continue to grow, as do the cross-subsidies from the medium commercial and 22 large industrial rate classes. 23
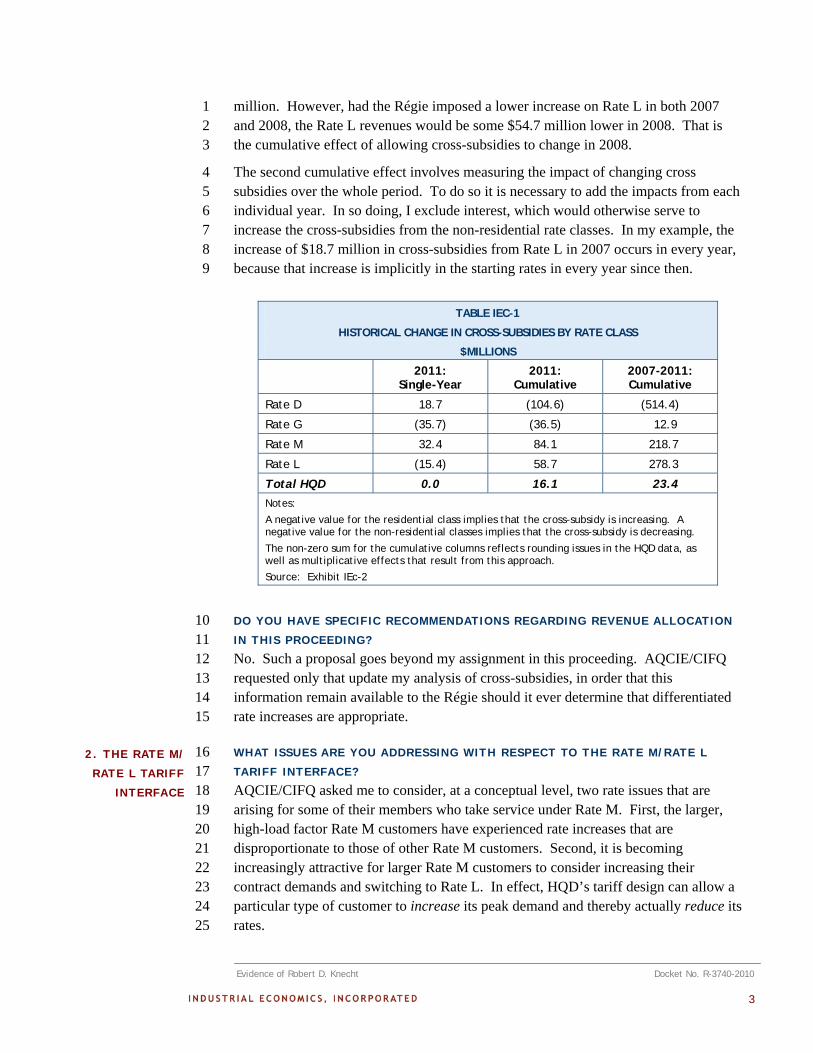
Cumulative cross-subsidy increases to the residential class over the four-year period 24 are now over $500 million. A summary of the cumulative class-specific effects is 25 shown in Table IEc-1 below. 26
Last year, some confusion arose in respect of the cumulating calculations shown in 27 Exhibit IEc-2.3 The logic in that exhibit is as follows. First, each year is evaluated 28 based on the information provided by HQD for that specific year. That is, I compare 29 the rate increase necessary to keep cross-subsidies constant with the actual rate 30 increase applied in that year. The difference represents the single-year effect. 31
However, there are two cumulative effects over time. The first relates to the effect on 32 an individual year. For example, in the 2007 initial year, the Rate L increase in cross-33 subsidies was $18.7 million. In the second year, 2008, the standalone effect was $35.5 34
2 I use the term “revenue allocation” to apply to how much of the overall increase in HQD’s
revenue requirement is applied to each rate class. I use the term “rate design” to apply to how
rates are structured to recover the revenue requirement assigned to each class in the revenue
allocation process.
3 I discussed this method informally with HQD during last year’s proceedings, and I believe
that they have no conceptual disagreement with this approach.
Evidence of Robert D. Knecht Docket No. R-3740-2010
3
million. However, had the Régie imposed a lower increase on Rate L in both 2007 1 and 2008, the Rate L revenues would be some $54.7 million lower in 2008. That is 2 the cumulative effect of allowing cross-subsidies to change in 2008. 3
The second cumulative effect involves measuring the impact of changing cross 4 subsidies over the whole period. To do so it is necessary to add the impacts from each 5 individual year. In so doing, I exclude interest, which would otherwise serve to 6 increase the cross-subsidies from the non-residential rate classes. In my example, the 7 increase of $18.7 million in cross-subsidies from Rate L in 2007 occurs in every year, 8 because that increase is implicitly in the starting rates in every year since then. 9
TABLE IEC-1
HISTORICAL CHANGE IN CROSS-SUBSIDIES BY RATE CLASS
$MILLIONS
2011: Single-Year
2011: Cumulative
2007-2011: Cumulative
Rate D 18.7 (104.6) (514.4)
Rate G (35.7) (36.5) 12.9
Rate M 32.4 84.1 218.7
Rate L (15.4) 58.7 278.3
Total HQD 0.0 16.1 23.4
Notes:
A negative value for the residential class implies that the cross-subsidy is increasing. A negative value for the non-residential classes implies that the cross-subsidy is decreasing.
The non-zero sum for the cumulative columns reflects rounding issues in the HQD data, as well as multiplicative effects that result from this approach.
Source: Exhibit IEc-2
DO YOU HAVE SPECIF IC RECOMMENDATIONS REGARDING REVENUE ALLOCATION 10 IN THIS PROCEEDING? 11 No. Such a proposal goes beyond my assignment in this proceeding. AQCIE/CIFQ 12 requested only that update my analysis of cross-subsidies, in order that this 13 information remain available to the Régie should it ever determine that differentiated 14 rate increases are appropriate. 15
WHAT ISSUES ARE YOU ADDRESSING WITH RESPECT TO THE RATE M/RATE L 16 TARIFF INTERFACE? 17 AQCIE/CIFQ asked me to consider, at a conceptual level, two rate issues that are 18 arising for some of their members who take service under Rate M. First, the larger, 19 high-load factor Rate M customers have experienced rate increases that are 20 disproportionate to those of other Rate M customers. Second, it is becoming 21 increasingly attractive for larger Rate M customers to consider increasing their 22 contract demands and switching to Rate L. In effect, HQD’s tariff design can allow a 23 particular type of customer to increase its peak demand and thereby actually reduce its 24 rates. 25
2. THE RATE M/
RATE L TARIFF
INTERFACE

Evidence of Robert D. Knecht Docket No. R-3740-2010
4
ARE THESE LEGIT IMATE CONCERNS? 1 I believe that they are. As part of my assignment in this proceeding, I compared the 2 basic service tariff rates in effect as of April 2004 with those currently in place. This 3 analysis confirms the observations of my clients. 4
With respect to intra-class Rate M increases, a 1,000 kW Rate M customer with a 40 5 percent load factor will have seen a rate increase of 12.3 percent since April 2004. In 6 contrast, a 4,000 kW Rate M customer with a 90 percent load factor will have 7 experienced an 18.3 percent increase, nearly half again as high. 8
In respect of the incentive to switch to Rate L, in April 2004, a 4,000 kW Rate M 9 customer with 90 percent load factor would have paid 3.5 percent more if it chose to 10 increase its contract demand to the Rate L minimum (5,000 kW) and switch to Rate L. 11 Under the rates in this proceeding, that same customer would now see a 0.6 percent 12 reduction in its bill. That is, the customer can increase its contract demand by 25 13 percent and get a rate decrease. 14
WHAT FACTORS ARE CAUSING THESE ISSUES? 15 These issues result from a number of at least partially inter-related policy decisions. 16
With respect to the disproportionate increase for larger Rate M customers, the direct 17 causative factors are (a) disproportionate increases to energy charges relative to 18 demand charges, and (b) disproportionate increases to the tail block energy charge 19 relative to the first block energy charge. Compared to 2004, the Rate M demand 20 charge has increased by 7.7 percent, while the first block energy charge increased by 21 15.9 percent and the tail block energy charge increased by 26.1 percent. 22
This policy may be motivated by two factors. First, it could result from a shift in the 23 classification of costs from demand-related to energy-related costs within the cost 24 allocation study. Thus, the Régie’s decision to modify the classification of 25 transmission costs (as they relate only to distribution cost allocation) may be 26 contributing to this trend. However, this explanation applies only if the Régie is using 27 the cost allocation classification analysis for the purposes of rate design. My 28 experience with Rate L indicates that this is likely not the case.4 29
Second, the Régie may be pursuing a rate design policy of shifting cost recovery more 30 onto energy charges and away from demand charges, in an effort to encourage energy 31 conservation. Such an approach will, of course, discourage efficient use of capacity, 32 and will discourage customers from trying to maintain higher load factors. It is my 33 understanding that HQD, with the Régie’s approval, has adopted just such a policy, 34
4 At this writing, I have not developed an analysis of the Rate M classification of costs into
demand, energy and customer components. While such analysis is possible, I cannot compare
these costs to the average energy-related revenues for Rate M, because HQD, unlike other
regulated utilities, is not obligated to provide a “proof of revenue” analysis for its rate design.

Evidence of Robert D. Knecht Docket No. R-3740-2010
5
and is deliberately imposing disproportionate increases on energy charges, and plans 1 to phase out the rate differential between energy blocks over the next three years.5 2
As to the incentives to “trade up” to Rate L, the causative factors are as follows. 3
First, Rate M customers are responsible for a higher cross-subsidy requirement. The 4 revenue-cost ratio for Rate M will be 132 percent, compared to the Rate L revenue-5 cost ratio of 115 percent. All other factors being equal, a Rate M customer can reduce 6 its cross-subsidy obligation by trading up. If dollar value cross-subsidies were held 7 constant over time, this issue would be gradually declining in importance. However, 8 as shown in Exhibit IEc-2, because cross-subsidies from Rate M have increased more 9 than cross-subsidies from Rate L, the problem is worse than it otherwise would be. 10 Note further that one justification for a lower tail block energy charge for Rate M 11 would be to mitigate this problem, by implicitly requiring a somewhat lower cross-12 subsidy from larger Rate M customers, in order to smooth the rate transition between 13 the two rate classes. 14
Second, HQD has also been imposing disproportionate increases to the Rate L energy 15 charge, relative to the demand charges. Compared to 2004, the energy charge increase 16 has been 18.2 percent, compared to a demand charge increase of 6.8 percent. My 17 experience is that this policy is also motivated by energy conservation concerns, and I 18 have demonstrated on a number of occasions that this policy is not consistent with 19 HQD’s cost allocation study. By limiting the increase in Rate L demand charges, this 20 policy reduces the “penalty” imposed on a Rate M customer who trades up to Rate L 21 and absorbs higher contract demand charges. 22
WHAT ARE THE IMPLICATIONS OF THESE ISSUES? 23 The most obvious implication of HQD’s Rate M policy is that some Rate M 24 customers, who are already providing very substantial cross-subsidies to residential 25 customers, are facing rate increases that are well in excess of system average. Unless 26 there is clear evidence from the cost allocation study or other cost analysis that the 27 costs for these larger, high load factor Rate M customers are increasing faster than the 28 costs for the other Rate M customers, this trend in inequitable. As I am not aware of 29 such intra-class cost evidence, it is difficult to explain to these customers why such an 30 approach is reasonable. 31
Second, the disproportionate rate increases applied to large Rate M customers are 32 presumably justified by HQD on the basis of better aligning marginal energy charges 33 with marginal energy costs. However, this policy comes with the parallel 34 disadvantage that the proposal discourages efficient use of system capacity, by 35 reducing the incentive for customers to maintain high load factors. This disadvantage 36 becomes greater when customers have the option to trade up to the next rate class, 37 which further reduces the incentive for efficient use of capacity. 38
5 Decision D-2009-106, page 92. I recognize that, in light of the zero rate increase this year
and the changes actually implemented in the past two years, this time frame may be expanded.

Evidence of Robert D. Knecht Docket No. R-3740-2010
6
For example, it is possible that allowing large Rate M customers to trade up to Rate L 1 will lower the overall load factor of the Rate L class. It is my understanding that HQD 2 has informally reported that the customers who may have an incentive to trade up are 3 high load factor customers, and there would be no negative impact on the Rate L class 4 as a whole from such a shift. While this is a plausible argument, it must be recognized 5 that it is based on static, rather than dynamic, assumptions. That is, it assumes that 6 customer behavior will not change as a result of the class transition. In practice, 7 however, this assumption is likely not justified. Consider a 4,000 kW customer who 8 shifts to Rate L and is paying a demand charge based on 5,000 kW. That customer 9 essentially has 1,000 kW of free capacity. That customer will have no incentive not to 10 increase demand up to that amount whenever it wants, with no economic penalty. As 11 such, there is a very real possibility that Rate M customers who shift to Rate L will (a) 12 use the system less efficiently than they currently do, and (b) they will inequitably 13 attract more costs to the Rate L class in HQD’s cost allocation study as a result of their 14 lower average load factors. 15
DO YOU HAVE ANY RATE DESIGN RECOMMENDATIONS REGARDING THESE ISSUES? 16 Because HQD has proposed no increases in this proceeding, I have no specific tariff 17 recommendations at this time. However, based on my evaluation of these issues, I 18 encourage both HQD and the Régie to consider the following questions before 19 continuing to follow the existing policies over the longer term: 20
Will arresting the increase in cross-subsidies from Rates M and L, and 21 possibly rolling back the increases in cross-subsidies that have accrued 22 over the past five years, reduce the inefficient incentives for Rate M 23 customers to trade up to Rate L? 24
Should HQD consider retaining differentiated energy block charges in 25 Rate M in order to keep a smoother transition between Rate M and Rate 26 L, to reflect the different cross-subsidy requirements? 27
Should HQD re-examine the disproportionate Rate M energy charge 28 increases, particularly to the tail block, or at least reconsider the 29 magnitude of the changes? 30
Should HQD consider establishing differentiated energy block charges 31 for Rate L, in order to smooth the transition between rate classes. Or, in 32 the alternative, should HQD’s policy of applying disproportionate 33 increases to Rate L energy charges be reduced or eliminated? 34
BEFORE PRESENTING YOUR ANALYSIS OF HQD’S PENSION COST CLAIM, DO YOU 35 HAVE ANY CAVEATS REGARDING THIS EVIDENCE? 36 I have two. First, I am neither an accountant nor an actuary, and I do not have 37 specialized expertise with respect to pension cost accounting. This evidence is 38 therefore based upon my experience with utility rate regulation, in balancing the 39 interests of ratepayers and utility shareholders, rather than on any technical pension 40 cost expertise. Second, my review is not complete, as certain information request 41
3. PENSION COSTS

Evidence of Robert D. Knecht Docket No. R-3740-2010
7
responses are not yet available. To the extent my review of those responses results in 1 modifications to the conclusions and recommendations in this evidence, I will provide 2 an update promptly. 3
WHAT EVENTS PRECIPITATED THIS EVIDENCE? 4 In preparing its test year cost claim, HQD develops a forecast of its expected pension 5 expense, generally in the spring of the preceding year. This forecast is then used in 6 the development of rates, as authorized by the Régie. As I understand it, this estimate 7 is then updated approximately one year later, to derive a “base year” expense. At the 8 end of the year, HQD updates and finalizes its pension costs based on an actuarial 9 review. 10
Over the past few years, AQCIE/CIFQ has observed that both the base year and the 11 actual expense have fallen well short of the authorized expense that is included in 12 rates. AQCIE/CIFQ has also expressed concern that the forecast pension cost for 13 2011 is well above the amount authorized for 2010, which itself appears to be 14 considerably higher than HQD’s current expectations for 2010 pension costs. 15
AQCIE/CIFQ also informed me that, in the past, it has proposed that a reconciliation 16 mechanism be adopted to true-up differences between actual and forecast pension 17 costs, but that this proposal has been rejected by the Régie. 18
IS AQCIE/CIFQ CORRECT THAT HQD’S ACTUAL PENSION EXPENSES HAVE FALLEN 19 WELL SHORT OF FORECAST EXPENSES IN THE PAST FEW YEARS? 20 Yes. Table IEc-2 below summarizes my understanding of authorized, base year and 21 actual pension expense. 22
TABLE IEC-2
HISTORICAL FORECAST AND ACTUAL HQD PENSION EXPENSE
$MILLIONS
Authorized Base Year Actual Base - Authorized
Actual - Authorized
2004 (18.2) 0.0 0.0 18.2 18.2
2005 18.2 48.7 47.8 30.5 29.6
2006 70.5 96.8 87.9 26.3 17.4
2007 96.8 90.5 98.3 -6.3 1.5
2008 78.2 62.8 50.4 -15.4 -27.8
2009 57.2 25.4 25.7 -31.8 -31.5
2010 55.6 17.8 NA -37.8 NA
04-09 Total
302.7 324.2 310.1 21.5 7.4
08-09 Total
135,4 88.2 76.1 -47.2 -59.3
04-10 Total
358.3 342.0 NA -16.3 NA
08-10 Total 191.0 106.0 NA -85.0 NA
Source: Exhibit HQD-13, Document 1, Table R-26.5

Evidence of Robert D. Knecht Docket No. R-3740-2010
8
Table IEc-2 demonstrates a number of features regarding HQD’s pension costs. First, 1 the actual pension costs vary considerably from year to year. It is unlikely that these 2 variations result from employment or compensation changes, and more likely result 3 from changes in actuarial assumptions and other factors beyond the control of HQD. 4
Second, the variances between actual and the authorized costs are considerable. As 5 AQCIE/CIFQ notes, the actual costs in the past three years have been well below 6 authorized costs. However, in the middle of the decade, the reverse was true. The 7 only consistency is that the variances are quite large relative to actual costs. 8
Third, the variances between the base year and the actual are relatively modest. It is 9 therefore not unreasonable to expect that the variance between the 2010 base and 10 authorized years is reasonably representative of the actual variance that HQD will 11 experience in 2010 when the actuarial analysis is completed. 12
Finally, I note that HQD forecasts 2011 pension costs at $67.3 million, more than 20 13 percent above the authorized amount for 2010 ($55.6 million), and almost four times 14 that of the 2010 “base year” cost ($17.8 million). 15
CONCEPTUALLY, WHAT SHOULD REGULATORS CONSIDER IN EVALUATING HOW 16 PENSION COSTS SHOULD BE REFLECTED IN UTILITY RATES? 17 Pension cost accounting is an extraordinarily complex matter (at least to a layman like 18 me). However, at its most fundamental level, a defined benefit pension plan is a 19 promise by a company to provide its employees with regular payments from 20 retirement until death. To provide these benefits, the company contributes cash to a 21 pension fund. That fund is usually invested in marketable securities. Therefore, the 22 cash contributions to the fund, plus the earnings on the fund, must be sufficient to 23 meet the promised benefits. 24
Because each employee earns these benefits over his or her working life, basic 25 accounting principles generally require that the expense associated with each 26 employee’s benefits be recorded on the company’s books over that employee’s tenure 27 with the company. Over the long-term, the expense incurred by the company matches 28 the cash contributions made to the pension fund. The objective of pension accounting 29 is to determine that expense. 30
The concept is straightforward, but the details are complicated. First, the company 31 needs to forecast the future benefits of each employee. Because benefits in defined 32 pension plans are typically developed based on service duration and ending salaries, 33 this forecast requires that the company make assumptions regarding how long 34 employees will remain with the company, when the employees will retire, what the 35 growth rate for salary will be, how long the employee (and often surviving spouse) is 36 expected to live, etc. Second, the company needs to make assumptions regarding the 37 return on investments in the pension fund. 38
In practice, even relatively small variations in many of these assumptions can have a 39 significant impact on the annual expense associated with the pension plan. 40

Evidence of Robert D. Knecht Docket No. R-3740-2010
9
Further, in determining pension expense, the general practice is to split the costs into a 1 normal cost and a past service cost. The normal cost represents some measure of a 2 regular contribution that the company should make to a pension fund for each 3 employee over his or her tenure in order to reasonably meet that employee’s benefit 4 requirements at retirement. The past service cost generally represents an amortization 5 of the difference between the actual pension fund balance and what the pension fund 6 balance should have been under normal funding and return assumptions. It is 7 therefore highly susceptible to changes in the market value of the assets in the fund, as 8 well as to changes in all other assumptions regarding pension benefits and returns. 9
WHAT DOES THIS BACKGROUND IMPLY FOR REGULATORS? 10 Pension (and other post-employment benefit) costs can pose problems for regulators, 11 particularly where a future test year ratemaking model is used. The future test year 12 regulatory model is intended to create incentives for utility efficiency. In this 13 approach, the regulator’s objective is to establish the utility’s revenue requirement 14 based on a reasonable forecast of the costs the utility is expected to incur in the future 15 test year. To the extent that the costs are under the utility’s control, the utility will 16 then have an incentive to minimize those costs, in order to increase the return to its 17 shareholders. Over the longer term, this incentive for efficiency should benefit 18 ratepayers. 19
However, for pension costs, this model may not work properly without additional 20 safeguards. To some extent, the test year model does create the correct incentives. 21 For example, pension costs are based on overall employment and compensation levels. 22 Therefore, maintaining an efficient staffing level with reasonable pay rates can serve 23 to minimize pension costs. Moreover, the test year method may provide some small 24 discouragement to the utility to expand pension benefits. 25
Unfortunately, however, the test year model can create perverse incentives. While 26 pension costs are related to employment costs, they are more subject to the myriad 27 assumptions that underpin the cost calculations, including in particular assumptions 28 regarding the return on plan assets (and the “discount rate” used for employee 29 benefits). This sensitivity of pension costs to actuarial assumptions creates the 30 potential for mischief. For example, a utility could set its rates based on pension cost 31 forecasts that rely on relatively conservative actuarial assumptions, but then reduce its 32 actual expense by modifying those assumptions to be more optimistic than those used 33 for setting rates. Unless there is some underlying change in the benefits that are being 34 offered, changing these assumptions does not reduce the long-run costs associated 35 with the pension plan. This strategy does, however, provide a boost to utility income 36 at the expense of ratepayers, with no longer term efficiency benefit. 37
Moreover, even without this kind of mischief, there is significant variability in 38 pension costs associated with parameters that are beyond the control of the utility. 39 Changes in these factors can result in significant differences between the pension costs 40 built into rates and the pension costs incurred by the utility. 41

Evidence of Robert D. Knecht Docket No. R-3740-2010
10
I therefore conclude that utility regulators have an interest in ensuring that, at least 1 over the longer term, pension expenses that are built into rates should match pension 2 expenses incurred by the utility. Moreover, because expenses incurred by the utility 3 must at least eventually match up with cash contributions to the pension fund, 4 regulators have an interest in ensuring that the cash contributions to the pension fund 5 are at least as large as the amounts recovered in rates. To the extent that historical 6 cash contributions have lagged amounts recovered in rates, the cash contributions 7 should exceed amounts charged in rates. 8
WHAT APPROACHES CAN REGULATORS USE TO ADDRESS THESE CONCERNS? 9 Regulators can consider either establishing reconciliation mechanisms, in which 10 variances between actual and forecast pension costs are trued up after the fact. In 11 addition, regulators can consider establishing minimum cash contribution 12 requirements for pension plans based at least in part on the pension expenses included 13 in rates.6 14
HOW DO HQD’S CASH CONTRIBUTIONS TO THE PENSION PLAN COMPARE WITH 15 AUTHORIZED COSTS? 16 I requested that information from HQD. However, the response to the information 17 request appears to provide the cash contribution made by HQ, in total. I infer that HQ 18 operates a single pension plan, and that costs are allocated among the various 19 operating divisions. Table IEc-3 below summarizes the information that I have 20 regarding authorized expense and cash contributions. 21
TABLE IEC-3
HQD PENSION COSTS AND HQ CASH CONTRIBUTIONS
$MILLIONS
Authorized HQD Cost
HQ Cash Contribution
Ratio
2004 (18.2) 25 -73%
2005 18.2 341 5%
2006 70.5 381 19%
2007 96.8 5 1936%
2008 78.2 440 18%
2009 57.2 665 9%
2010 55.6 560 10%
Source: Table IEc-2, HQD-13, Document 4.1, Table R-1D
Table IEc-3 demonstrates that HQ’s cash contributions also can vary enormously from 22 year to year. The table also implies that there is no correlation between HQ cash 23 contributions to the plan and the authorized pension expense in HQD’s rates. 24
6 For some utilities, the maximum pension contributions may be limited by income tax
deductibility considerations. I do not believe this is a concern for HQD.

Evidence of Robert D. Knecht Docket No. R-3740-2010
11
DO YOU HAVE ANY RECOMMENDATIONS FOR THE RÉGIE REGARDING HQD’S 1 PENSION COST CLAIM? 2 As a general matter, I conclude that the variability in pension costs associated with 3 both actuarial assumptions and other parameters beyond the control of the utility is 4 much greater than the variability in pension costs that are under a utility’s control. 5 Moreover, I conclude that, under test year regulation, utilities have sufficient incentive 6 to maintain efficient employment and compensation levels, without including pension 7 and other post-employment benefit costs into consideration. 8
HQD’s historical experience confirms these issues. Its pension costs vary 9 considerably from year to year, and the differences between authorized and actual 10 costs represent a significant percentage of the actual costs. Moreover, cash 11 contributions are also very erratic from year to year, and bear no obvious correlation 12 to the costs included in rates. 13
I therefore conclude that it would be reasonable for the Régie to reconsider its 14 rejection of a reconciliation mechanism, particularly in light of the substantial over-15 recovery of actual costs experienced in each of the past three years (2008 - 2010). In 16 the alternative, the Régie should direct HQD to investigate whether there would be 17 any value in establishing a minimum cash contribution mechanism, designed to ensure 18 that the costs borne by ratepayers are being fully contributed to the pension fund. I 19 recognize that developing such a mechanism may be difficult if HQ operates only a 20 single combined pension plan. However, without some regulatory protection, 21 ratepayers may continue to pay for pension costs that are not yet incurred by HQD, 22 but which they may need to pay for again in the future. 23
DOES THIS CONCLUDE YOUR EVIDENCE? 24 Yes it does, unless additional information gained in the discovery process results in a 25 need to modify my conclusions. 26

Evidence of Robert D. Knecht Docket No. R-3740-2010
EXHIBIT IEc-1
CURRICULUM VITAE AND
EXPERT TESTIMONY SCHEDULE
OF
ROBERT D. KNECHT

R O B E R T D . K N E C H T
Robert D. Knecht specializes in the practical application of economics, finance and management theory to issues facing public and private sector clients. Mr. Knecht has more than thirty years of consulting experience, focusing primarily on the energy, metals, and mining industries. He has consulted to industry, law firms, and government clients, both in the U.S. and internationally. He has participated in strategic and business planning studies, project evaluations, litigation and regulatory proceedings and policy analyses. His practice currently focuses primarily on utility regulation, and he has provided analysis and expert testimony in numerous U.S. and Canadian jurisdictions. In addition, as Treasurer of IEc since 1995, Mr. Knecht is responsible for the firm's accounting, finance and tax planning, as well as administration of the firm's retirement plans. Mr. Knecht's consulting assignments include the following projects:
C For the Pennsylvania Office of Small Business Advocate, Mr. Knecht provides analysis and expert testimony in industry restructuring, base rates and purchased energy cost proceedings involving electric, steam and natural gas distribution utilities. Mr. Knecht has analyzed the economics and financial issues of electric industry restructuring, stranded cost determination, fair rate of return, claimed utility expenses, cost allocation methods and rate design issues.
C For independent power producers and industrial customers in Alberta, Mr. Knecht has provided analysis and expert testimony in a variety of electric industry proceedings, including industry restructuring, cost unbundling, stranded cost recovery, transmission rate design, cost allocation and rate design.
C For industrial customers in Québec, Mr. Knecht has prepared economic analysis and expert testimony in regulatory proceedings regarding cost allocation, compliance with legislative requirements for cross-subsidization, and rate design.
C As a participant on various international teams of experts, Mr. Knecht has prepared the economic and financial analysis for industry restructuring studies involving the steel and iron ore industries in Venezuela, Poland, and Nigeria.
C For the U.S. Department of Justice and for several private sector clients, Mr. Knecht has prepared analyses of economic damages in a variety of litigation matters, including ERISA discrimination, breach of contract, fraudulent conveyance, natural resource damages and anti-trust cases.
C Mr. Knecht participates in numerous projects with colleagues at IEc preparing economic and environmental analyses associated with energy and utility industries for the U.S. Environmental Protection Agency.
Mr. Knecht holds a M.S. in Management from the Sloan School of Management at M.I.T., with concentrations in applied economics and finance. He also holds a B.S. in Economics from M.I.T. Prior to joining Industrial Economics as a principal in 1989, Mr. Knecht worked for seven years as an economic and management consultant at Marshall Bartlett, Incorporated. He also worked for two years as an economist in the Energy Group of Data Resources, Incorporated.
Industrial Economics, Incorporated
2067 Massachusetts Avenue
Cambridge, MA 02140 USA
617.354.0074 | 617.354.0463 fax
July 2010 www.indecon.com
ROBERT D. KNECHT
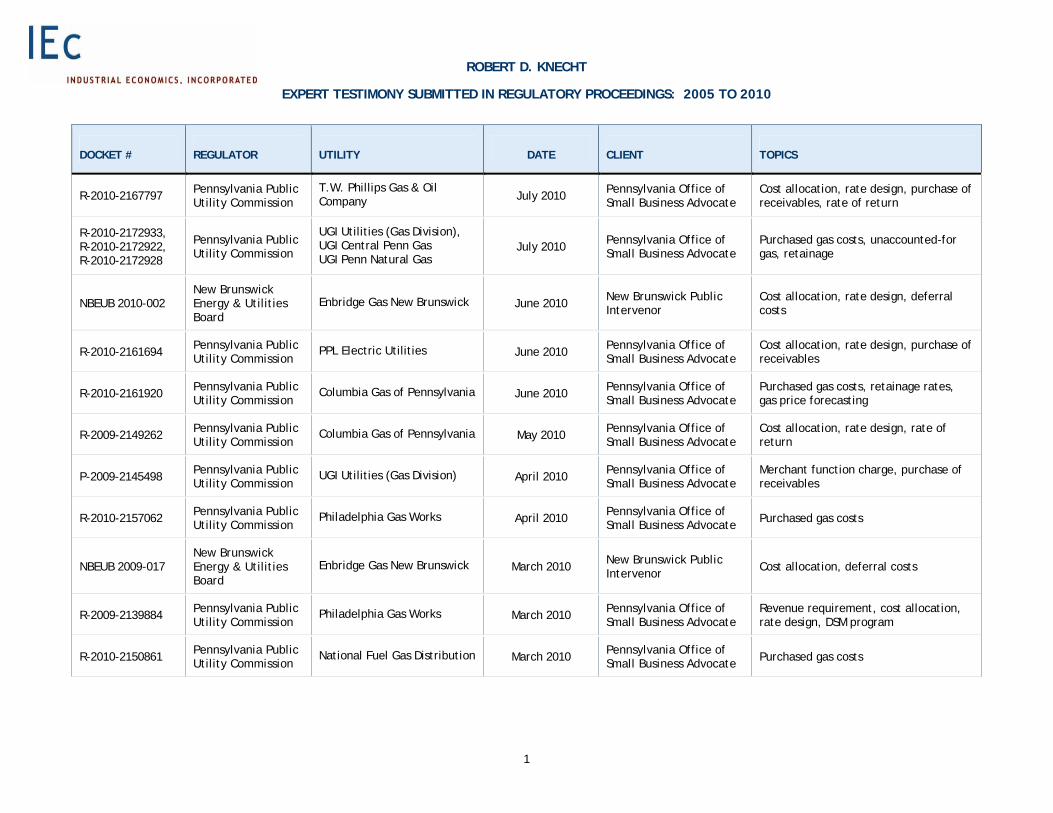
EXPERT TESTIMONY SUBMITTED IN REGULATORY PROCEEDINGS: 2005 TO 2010
1
DOCKET # REGULATOR UTILITY DATE CLIENT TOPICS
R-2010-2167797 Pennsylvania Public Utility Commission
T.W. Phillips Gas & Oil Company July 2010 Pennsylvania Office of
Small Business Advocate Cost allocation, rate design, purchase of receivables, rate of return
R-2010-2172933, R-2010-2172922, R-2010-2172928
Pennsylvania Public Utility Commission
UGI Utilities (Gas Division), UGI Central Penn Gas UGI Penn Natural Gas
July 2010 Pennsylvania Office of Small Business Advocate
Purchased gas costs, unaccounted-for gas, retainage
NBEUB 2010-002 New Brunswick Energy & Utilities Board
Enbridge Gas New Brunswick June 2010 New Brunswick Public Intervenor
Cost allocation, rate design, deferral costs
R-2010-2161694 Pennsylvania Public Utility Commission
PPL Electric Utilities June 2010 Pennsylvania Office of Small Business Advocate
Cost allocation, rate design, purchase of receivables
R-2010-2161920 Pennsylvania Public Utility Commission
Columbia Gas of Pennsylvania June 2010 Pennsylvania Office of Small Business Advocate
Purchased gas costs, retainage rates, gas price forecasting
R-2009-2149262 Pennsylvania Public Utility Commission
Columbia Gas of Pennsylvania May 2010 Pennsylvania Office of Small Business Advocate
Cost allocation, rate design, rate of return
P-2009-2145498 Pennsylvania Public Utility Commission
UGI Utilities (Gas Division) April 2010 Pennsylvania Office of Small Business Advocate
Merchant function charge, purchase of receivables
R-2010-2157062 Pennsylvania Public Utility Commission
Philadelphia Gas Works April 2010 Pennsylvania Office of Small Business Advocate Purchased gas costs
NBEUB 2009-017 New Brunswick Energy & Utilities Board
Enbridge Gas New Brunswick March 2010 New Brunswick Public Intervenor
Cost allocation, deferral costs
R-2009-2139884 Pennsylvania Public Utility Commission
Philadelphia Gas Works March 2010 Pennsylvania Office of Small Business Advocate
Revenue requirement, cost allocation, rate design, DSM program
R-2010-2150861 Pennsylvania Public Utility Commission
National Fuel Gas Distribution March 2010 Pennsylvania Office of Small Business Advocate Purchased gas costs
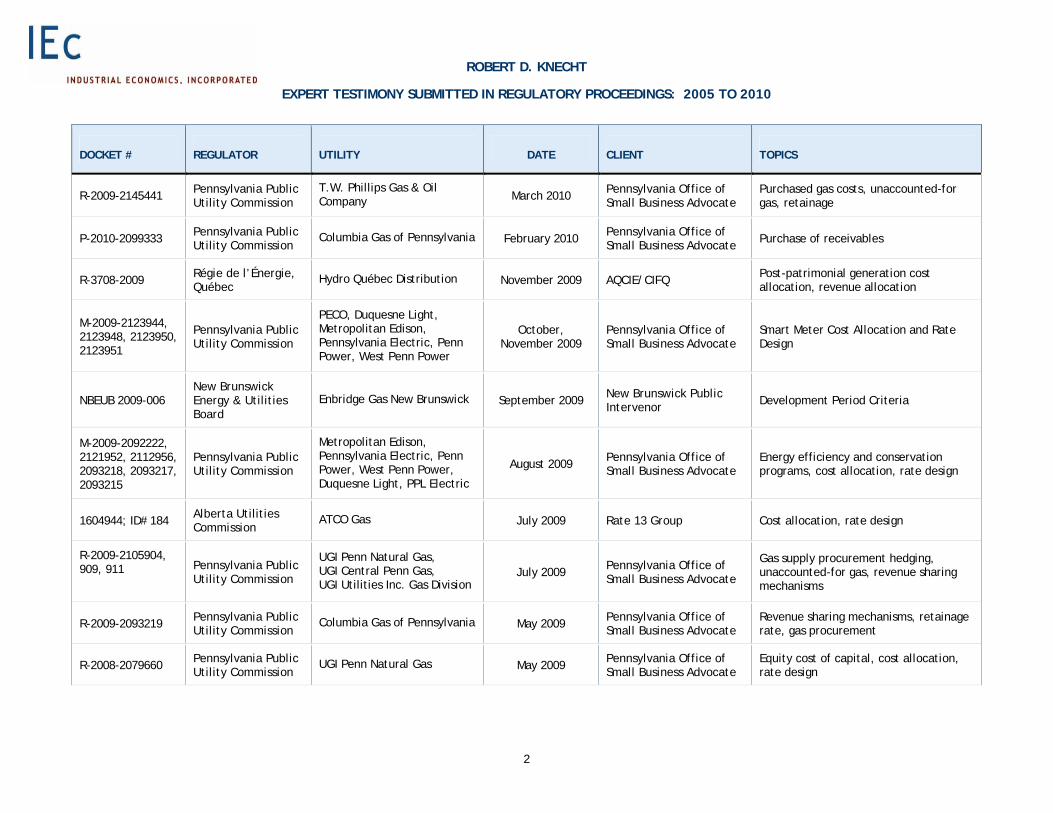
ROBERT D. KNECHT
EXPERT TESTIMONY SUBMITTED IN REGULATORY PROCEEDINGS: 2005 TO 2010
2
DOCKET # REGULATOR UTILITY DATE CLIENT TOPICS
R-2009-2145441 Pennsylvania Public Utility Commission
T.W. Phillips Gas & Oil Company March 2010 Pennsylvania Office of
Small Business Advocate Purchased gas costs, unaccounted-for gas, retainage
P-2010-2099333 Pennsylvania Public Utility Commission
Columbia Gas of Pennsylvania February 2010 Pennsylvania Office of Small Business Advocate Purchase of receivables
R-3708-2009 Régie de l’Énergie, Québec
Hydro Québec Distribution November 2009 AQCIE/CIFQ Post-patrimonial generation cost allocation, revenue allocation
M-2009-2123944, 2123948, 2123950, 2123951
Pennsylvania Public Utility Commission
PECO, Duquesne Light, Metropolitan Edison, Pennsylvania Electric, Penn Power, West Penn Power
October, November 2009
Pennsylvania Office of Small Business Advocate
Smart Meter Cost Allocation and Rate Design
NBEUB 2009-006 New Brunswick Energy & Utilities Board
Enbridge Gas New Brunswick September 2009 New Brunswick Public Intervenor Development Period Criteria
M-2009-2092222, 2121952, 2112956, 2093218, 2093217, 2093215
Pennsylvania Public Utility Commission
Metropolitan Edison, Pennsylvania Electric, Penn Power, West Penn Power, Duquesne Light, PPL Electric
August 2009 Pennsylvania Office of Small Business Advocate
Energy efficiency and conservation programs, cost allocation, rate design
1604944; ID# 184 Alberta Utilities Commission
ATCO Gas July 2009 Rate 13 Group Cost allocation, rate design
R-2009-2105904, 909, 911
Pennsylvania Public Utility Commission
UGI Penn Natural Gas, UGI Central Penn Gas, UGI Utilities Inc. Gas Division
July 2009 Pennsylvania Office of Small Business Advocate
Gas supply procurement hedging, unaccounted-for gas, revenue sharing mechanisms
R-2009-2093219 Pennsylvania Public Utility Commission
Columbia Gas of Pennsylvania May 2009 Pennsylvania Office of Small Business Advocate
Revenue sharing mechanisms, retainage rate, gas procurement
R-2008-2079660 Pennsylvania Public Utility Commission
UGI Penn Natural Gas May 2009 Pennsylvania Office of Small Business Advocate
Equity cost of capital, cost allocation, rate design

ROBERT D. KNECHT
EXPERT TESTIMONY SUBMITTED IN REGULATORY PROCEEDINGS: 2005 TO 2010
3
DOCKET # REGULATOR UTILITY DATE CLIENT TOPICS
R-2008-2079675 Pennsylvania Public Utility Commission
UGI Central Penn Gas May 2009 Pennsylvania Office of Small Business Advocate
Equity cost of capital, cost allocation, rate design
R-2008-2075250 Pennsylvania Public Utility Commission
T.W. Phillips Gas & Oil April 2009 Pennsylvania Office of Small Business Advocate
Retainage rates
R-2009-2088076 Pennsylvania Public Utility Commission
Philadelphia Gas Works April 2009 Pennsylvania Office of Small Business Advocate
Gas procurement
R-2009-2083181 Pennsylvania Public Utility Commission
National Fuel Gas Distribution March 2009 Pennsylvania Office of Small Business Advocate Retainage rates, gas procurement
P-2008-2060309 Pennsylvania Public Utility Commission
PPL Electric Utilities December 2008 Pennsylvania Office of Small Business Advocate Default electric supply procurement
R-2008-2073938 Pennsylvania Public Utility Commission
Philadelphia Gas Works December 2008 Pennsylvania Office of Small Business Advocate
Revenue requirement, financial cash flows, cost allocation, rate design.
P-2008-2044561 Pennsylvania Public Utility Commission
Pike County Light & Power October 2008 Pennsylvania Office of Small Business Advocate
Electric default service procurement
R-3673-2008 Régie de l’Énergie, Québec
Hydro Québec Distribution August 2008 AQCIE/CIFQ Electric supply contract modifications.
1550487 Alberta Utilities Commission
ENMAX Power Corporation July 2008 D410 Group Formula-based (performance-based) ratemaking; ratepayer-supplied equity contributions.
R-2008-2039417 et al.
Pennsylvania Public Utility Commission
UGI Utilities (Gas Division) July 2008 Pennsylvania Office of Small Business Advocate Design day demand forecast.
R-2008-2039284 Pennsylvania Public Utility Commission
UGI Penn Natural Gas July 2008 Pennsylvania Office of Small Business Advocate Revenue sharing, gas supply costs.
R-2008-2039634 Pennsylvania Public Utility Commission
PPL Gas Utilities July 2008 Pennsylvania Office of Small Business Advocate
Lost and unaccounted-for gas, gas supply costs.

ROBERT D. KNECHT
EXPERT TESTIMONY SUBMITTED IN REGULATORY PROCEEDINGS: 2005 TO 2010
4
DOCKET # REGULATOR UTILITY DATE CLIENT TOPICS
A-2008-2034045 Pennsylvania Public Utility Commission
UGI Utilities, PPL Gas Utilities June 2008 Pennsylvania Office of
Small Business Advocate Public benefits of proposed sale.
R-2008-2011621 Pennsylvania Public Utility Commission
Columbia Gas of Pennsylvania May 2008 Pennsylvania Office of Small Business Advocate
Cost allocation, revenue allocation, rate design.
R-2008-2028039 Pennsylvania Public Utility Commission
Columbia Gas of Pennsylvania May 2008 Pennsylvania Office of Small Business Advocate
Gas supply cost functionalization; cost reconciliation method, sharing mechanisms.
R-3648-2007 Régie de l’Énergie, Québec
Hydro Québec Distribution April 2008 AQCIE/CIFQ Electric supply contract modifications.
R-2008-2021348 Pennsylvania Public Utility Commission
Philadelphia Gas Works April 2008 Pennsylvania Office of Small Business Advocate
Sharing mechanisms, gas supply contracts.
R-2008-2012502 Pennsylvania Public Utility Commission
National Fuel Gas Distribution Company March 2008 Pennsylvania Office of
Small Business Advocate Transportation and sales customer rate design, design day forecasts.
R-2008-2013026 Pennsylvania Public Utility Commission
T.W. Phillips Gas and Oil Company March 2008 Pennsylvania Office of
Small Business Advocate Rate design treatment of capacity release revenues.
P-00072342 Pennsylvania Public Utility Commission
West Penn Power d/b/a Allegheny Power February 2008 Pennsylvania Office of
Small Business Advocate Default service electricity procurement, rate design, reconciliation.
2007-004
New Brunswick Board of Commissioners of Public Utilities
New Brunswick Power Distribution and Customer Service Corporation
November 2007 New Brunswick Public Intervenor
Cost allocation, revenue allocation, rate design.
R-3644-2007 Régie de l'Énergie, Québec
Hydro Québec Distribution October 2007 AQCIE/CIFQ Cost allocation, revenue allocation, rate design.
P-00072305 Pennsylvania Public Utility Commission
Pennsylvania Power Corporation July 2007 Pennsylvania Office of
Small Business Advocate Default electric service procurement.

ROBERT D. KNECHT
EXPERT TESTIMONY SUBMITTED IN REGULATORY PROCEEDINGS: 2005 TO 2010
5
DOCKET # REGULATOR UTILITY DATE CLIENT TOPICS
R-00072334 Pennsylvania Public Utility Commission
UGI Penn Natural Gas, Inc. July 2007 Pennsylvania Office of Small Business Advocate
Asset management arrangement, gas procurement.
R-00072333 Pennsylvania Public Utility Commission
PPL Gas Utilities Corporation July 2007 Pennsylvania Office of Small Business Advocate
Design day forecasting, gas procurement.
R-00072155 Pennsylvania Public Utility Commission
PPL Electric Utilities Corporation July 2007 Pennsylvania Office of
Small Business Advocate Cost allocation, revenue allocation, rate design, energy efficiency.
R-00049255 (Remand)
Pennsylvania Public Utility Commission
PPL Electric Utilities Corporation May 2007 Pennsylvania Office of
Small Business Advocate Revenue allocation.
R-00072175 Pennsylvania Public Utility Commission
Columbia Gas of Pennsylvania, Inc. May 2007 Pennsylvania Office of
Small Business Advocate Gas procurement.
R-00072110 Pennsylvania Public Utility Commission
Philadelphia Gas Works April 2007 Pennsylvania Office of Small Business Advocate
Gas procurement, margin sharing mechanisms.
R-00061931 Pennsylvania Public Utility Commission
Philadelphia Gas Works April 2007 Pennsylvania Office of Small Business Advocate
Cost allocation, revenue allocation, retail gas competition.
P-00072245 Pennsylvania Public Utility Commission
Pike County Light & Power Company March 2007 Pennsylvania Office of
Small Business Advocate Default service procurement, rate design.
R-00072043 Pennsylvania Public Utility Commission
National Fuel Gas Distribution Company March 2007 Pennsylvania Office of
Small Business Advocate Design day requirements.
C-20065942 Pennsylvania Public Utility Commission
Pike County Light & Power Company November 2006 Pennsylvania Office of
Small Business Advocate Wholesale power procurement by provider of last resort.
R-3610-2006 Régie de l'Énergie, Québec Hydro Québec Distribution November 2006 AQCIE/CIFQ
Post-patrimonial generation cost allocation; cross-subsidization; rate design.
P-00052188 Pennsylvania Public Utility Commission
Pennsylvania Power Company September 2006 Pennsylvania Office of
Small Business Advocate Affidavit: POLR rates, wholesale to retail.
R-00061493 Pennsylvania Public Utility Commission
National Fuel Gas Distribution Corporation September 2006 Pennsylvania Office of
Small Business Advocate
Rate of return, load forecasting, cost allocation, revenue allocation, rate design, revenue decoupling.

ROBERT D. KNECHT
EXPERT TESTIMONY SUBMITTED IN REGULATORY PROCEEDINGS: 2005 TO 2010
6
DOCKET # REGULATOR UTILITY DATE CLIENT TOPICS
R-00061398 Pennsylvania Public Utility Commission PPL Gas Utilities Corporation August 2006 Pennsylvania Office of
Small Business Advocate Cost allocation, revenue allocation, rate design.
R-00061365 Pennsylvania Public Utility Commission
PG Energy/Southern Union Company July 2006 Pennsylvania Office of
Small Business Advocate Merger savings, cost allocation, revenue allocation, rate design.
R-00061519 Pennsylvania Public Utility Commission PPL Gas Utilities Corporation July 2006 Pennsylvania Office of
Small Business Advocate Design day weather and throughput forecasts; gas supply hedging.
R-00061518 Pennsylvania Public Utility Commission
PG Energy/Southern Union Company
July 2006 Pennsylvania Office of Small Business Advocate
Design day weather and throughput forecasts; gas supply hedging.
A-125146 Pennsylvania Public Utility Commission
UGI Utilities, Inc., Southern Union Company June 2006 Pennsylvania Office of
Small Business Advocate
Public benefits of proposed sale of PG Energy to UGI; asset management agreement.
R-00061355 Pennsylvania Public Utility Commission
Columbia Gas of Pennsylvania May 2006 Pennsylvania Office of
Small Business Advocate Gas supply and hedging plan; procedural issues
R-00061296 Pennsylvania Public Utility Commission Philadelphia Gas Works April 2006 Pennsylvania Office of
Small Business Advocate Gas procurement and procedural issues.
R-00061246 Pennsylvania Public Utility Commission
National Fuel Gas Distribution March 2006 Pennsylvania Office of
Small Business Advocate Gas procurement; unaccounted for gas retention rates.
2005-002 Refiling
New Brunswick Board of Commissioners of Public Utilities
New Brunswick Power Distribution and Customer Service Company
February 2006 New Brunswick Public Intervenor Cost allocation, rate design.
P-00052188 Pennsylvania Public Utility Commission
Pennsylvania Power Company December 2005 Pennsylvania Office of
Small Business Advocate Cost allocation and rate design for POLR supplies.
R-3579-2005 Régie de l'Énergie, Québec Hydro Québec Distribution November 2005 AQCIE/CIFQ Generation cost allocation; cross-
subsidization; revenue allocation.
2005-002
New Brunswick Board of Commissioners of Public Utilities
New Brunswick Power Distribution and Customer Service Company
August 2005 New Brunswick Public Intervenor Cost allocation, rate design.
R-00050538 Pennsylvania Public Utility Commission PG Energy July 2005 Pennsylvania Office of
Small Business Advocate Gas procurement diversification.

ROBERT D. KNECHT
EXPERT TESTIMONY SUBMITTED IN REGULATORY PROCEEDINGS: 2005 TO 2010
7
DOCKET # REGULATOR UTILITY DATE CLIENT TOPICS
R-00050540 Pennsylvania Public Utility Commission PPL Gas Utilities Corporation July 2005 Pennsylvania Office of
Small Business Advocate Gas procurement, hedging, retention rates, sharing mechanism.
R-00050340 Pennsylvania Public Utility Commission
Columbia Gas of Pennsylvania May 2005 Pennsylvania Office of
Small Business Advocate Gas procurement, hedging and diversification.
R-3563-2005 Régie de l'Énergie, Québec Hydro Québec Distribution April 2005 AQCIE/CIFQ Generation cost allocation; industrial
demand response.
R-00050264 Pennsylvania Public Utility Commission
Philadelphia Gas Works April 2005 Pennsylvania Office of Small Business Advocate
Gas procurement, risk hedging, financing costs in the gas cost rate.
R-00050216 Pennsylvania Public Utility Commission
National Fuel Gas Distribution March 2005 Pennsylvania Office of
Small Business Advocate Gas supply procurement and forward pricing policies.
EB-2004-0542 Ontario Energy Board Union Gas Limited March 2005 Tribute Resources Inc. Cost allocation and rate design for
service to embedded storage pools.
R-00049884 Pennsylvania Public Utility Commission
Pike County Light and Power (Gas Service) January 2005 Pennsylvania Office of
Small Business Advocate Fair rate of return, cost allocation, class revenue assignment.
July 2010
Industrial Economics, Incorporated
2067 Massachusetts Avenue
Cambridge, MA 02140 USA
617.354.0074 | 617.354.0463 fax
www.indecon.com

Evidence of Robert D. Knecht Docket No. R-3740-2010
EXHIBIT IEc-2
ANALYSIS OF CUMULATIVE CHANGES IN
CROSS-SUBSIDIES AMONG RATE CLASSES

Exhibits of Robert D. Knecht Docket No. R-3740-2010
Increase with No Change in
Cross-Subsidy
Approved/ Proposed
Increase
Change in Cross-Subsidy
(Percent)
Base Revenues
($mm)
Change in Cross-Subsidy
($mm)
Cumulative Change with
No Change in Cross-Subsidy
Cumulative Approved/ Proposed
Increase
Single Year Cumulative Increase in
Subsidy2007 Test YearDomestique 2.83% 1.92% -0.91% 4,050 (36.7) 2.83% 1.92% (36.67) Petite Puissance 1.73% 1.92% 0.19% 1,275 2.5 1.73% 1.92% 2.45 Moyenne Puissance 1.03% 1.92% 0.89% 1,830 16.2 1.03% 1.92% 16.23 Grande Puissance 0.97% 1.92% 0.95% 1,971 18.7 0.97% 1.92% 18.71 Total 1.92% 1.92% 0.00% 9,126 0.7 1.92% 1.92% 0.72
2008 Test YearDomestique 4.31% 2.91% -1.40% 4,165 (58.5) 7.26% 4.88% (98.93) Petite Puissance 1.32% 2.94% 1.61% 1,294 20.9 3.07% 4.91% 23.80 Moyenne Puissance 2.75% 2.87% 0.12% 1,879 2.3 3.81% 4.85% 19.44 Grande Puissance 1.06% 2.90% 1.84% 1,929 35.5 2.04% 4.88% 54.72 Total 2.90% 2.90% 0.00% 9,267 0.2 4.88% 4.88% (0.95)
2009 Test YearDomestique 2.31% 1.22% -1.09% 4,317 (47.1) 9.74% 6.16% (154.35) Petite Puissance 1.50% 1.22% -0.28% 1,362 (3.9) 4.62% 6.19% 21.39 Moyenne Puissance -0.48% 1.22% 1.70% 1,905 32.3 3.32% 6.13% 53.52 Grande Puissance 0.20% 1.22% 1.02% 1,820 18.5 2.25% 6.16% 71.19 Total 1.22% 1.22% 0.00% 9,404 (0.1) 6.16% 6.16% (8.26)
2010 Test YearDomestique -0.44% 0.36% 0.81% 4,432 35.7 9.25% 6.54% (119.85) Petite Puissance 1.72% 0.33% -1.39% 1,388 (19.2) 6.42% 6.54% 1.73 Moyenne Puissance 0.74% 0.37% -0.36% 1,858 (6.8) 4.08% 6.52% 45.39 Grande Puissance 0.06% 0.36% 0.30% 1,771 5.3 2.31% 6.54% 74.96 Total 0.20% 0.36% 0.16% 9,449 15.0 6.37% 6.54% 15.74
2011 Test Year ProposedDomestique -0.40% 0.00% 0.40% 4,623 18.7 8.81% 6.54% (104.61) Petite Puissance 2.88% 0.00% -2.88% 1,241 (35.7) 9.48% 6.54% (36.48) Moyenne Puissance -1.57% 0.00% 1.57% 2,060 32.4 2.44% 6.52% 84.08 Grande Puissance 0.87% 0.00% -0.87% 1,759 (15.4) 3.20% 6.54% 58.70 Total 0.00% 0.00% 0.00% 9,683 - 6.37% 6.54% 16.13
Cumulative Four-Year Cross-Subsidy (excluding interest)Domestique (514.41) Petite Puissance 12.90 Moyenne Puissance 218.66 Grande Puissance 278.28 Total 23.37
EXHIBIT IEc-2a
ANALYSIS OF CUMULATIVE CHANGES IN CROSS-SUBSIDIES
Cross Subsidy Workpapers 2010.xls; Exhibit IEc-2a 10/21/2010

Exhibits of Robert D. Knecht Docket No. R-3740-2010
R-3740-2010 FilingCost Regul. Adj.
Before After 2010 2011 Change Growth Provision Total Subsidy2010 2011 2010 2011 $mm $mm % cts/kWh cts/kWh $mm 2008-09 $mm Before Proposed Cost-Based Percent Ch $mm
Domestic 5,326.0 5,552.8 61,346 63,809 4,623 4,623 0.00% 8.68 8.70 0.02 12.96 (13.77) (17.88) (18.69) 7.25 7.25 7.22 -0.40% (18.7) Small General 1,132.0 1,041.5 15,040 13,253 1,241 1,241 0.00% 7.53 7.86 0.33 44.00 (3.46) (4.80) 35.74 9.37 9.37 9.64 2.88% 35.7 Medium General 1,421.0 1,531.0 25,897 28,266 2,060 2,060 0.00% 5.49 5.42 (0.07) (19.99) (4.48) (7.97) (32.44) 7.29 7.29 7.17 -1.57% (32.4) Large Industrial 1,523.0 1,536.3 38,324 37,996 1,759 1,759 0.00% 3.97 4.04 0.07 26.33 (4.15) (6.80) 15.38 4.63 4.63 4.67 0.87% 15.4 Total 9,402.0 9,661.6 140,607 143,324 9,683 9,683 0.00% 6.69 6.74 0.05 63.31 (25.86) (37.45) - 6.76 6.76 6.76 0.00% (0.0) Sources: HQD-10, Document 3, Table 8B HQD-13, D1, p 176 HQD-13, D1, p 173 Calculations
R-3708-2009 ComplianceCost Regul. Adj.
Before After 2009 2010 Change Growth Provision Total Subsidy2009 2010 2009 2010 $mm $mm % cts/kWh cts/kWh $mm 2008-09 $mm Before Proposed Cost-Based Percent Ch $mm
Domestic 5,256.2 5,326.0 60,440 61,346 4,432 4,448 0.36% 8.70 8.68 (0.01) (8.99) (23.90) 13.18 (19.70) 7.22 7.25 7.19 -0.44% (35.7) Small General 1,095.6 1,132.0 14,896 15,040 1,388 1,393 0.33% 7.35 7.53 0.17 25.83 (6.11) 4.13 23.85 9.23 9.26 9.39 1.72% 19.2 Medium General 1,453.4 1,421.0 26,811 25,897 1,858 1,865 0.37% 5.42 5.49 0.07 17.13 (8.98) 5.53 13.68 7.17 7.20 7.23 0.74% 6.8 Large Industrial 1,582.7 1,523.0 39,948 38,324 1,771 1,777 0.36% 3.96 3.97 0.01 4.63 (8.82) 5.27 1.08 4.62 4.64 4.62 0.06% (5.3) Total 9,387.9 9,402.0 142,095 140,607 9,449 9,483 0.36% 6.61 6.69 0.08 38.60 (47.81) 28.11 18.90 6.72 6.74 6.73 0.20% (15.0) Sources: HQD-15 Doc. 1 pages 13-14 HQD-15, D1, page 13 HQD-13, Document 1, Table R-78.2-B Calculations
R-3708-2009 FilingCost Regul. Adj.
Before After 2009 2010 Change Growth Provision Total Subsidy2009 2010 2009 2010 $mm $mm % cts/kWh cts/kWh $mm 2008-09 $mm Before Proposed Cost-Based Percent Ch $mm
Domestic 5,256.2 5,317.2 60,440 61,346 4,432 4,441 0.20% 8.70 8.67 (0.03) (17.79) (23.90) 19.61 (22.08) 7.22 7.24 7.19 -0.50% (31.1) Small General 1,095.6 1,129.9 14,896 15,040 1,388 1,391 0.22% 7.35 7.51 0.16 23.73 (6.11) 6.14 23.76 9.23 9.25 9.39 1.71% 20.8 Medium General 1,453.4 1,418.5 26,811 25,897 1,858 1,862 0.22% 5.42 5.48 0.06 14.63 (8.98) 8.22 13.87 7.17 7.19 7.23 0.75% 9.9 Large Industrial 1,582.7 1,522.7 39,948 38,324 1,771 1,775 0.23% 3.96 3.97 0.01 4.33 (8.82) 7.84 3.35 4.62 4.63 4.63 0.19% (0.7) Total 9,387.9 9,388.3 142,095 140,607 9,449 9,469 0.21% 6.61 6.68 0.07 24.90 (47.81) 41.81 18.90 6.72 6.73 6.73 0.20% (1.1) Sources: HQD-10, Document 4, Table 1 HQD-12, Doc. 2, page 8 HQD-13, Document 1, Table R-78.2-B Calculations
Decision 2009-016Cost Regul. Adj.
Before After 2008 2009 Change Growth Provision Total Subsidy2008 2009 2008 2009 $mm $mm % cts/kWh cts/kWh $mm 2007-08 $mm Before Proposed Cost-Based Percent Ch $mm
Domestic 5,133.4 5,256.2 59,760 60,440 4,317 4,370 1.22% 8.59 8.70 0.11 64.40 16.10 19.31 99.81 7.14 7.23 7.31 2.31% 47.1 Small General 1,063.5 1,095.6 14,600 14,896 1,362 1,379 1.22% 7.28 7.35 0.07 10.55 3.83 6.09 20.47 9.14 9.25 9.28 1.50% 3.9 Medium General 1,505.2 1,453.4 27,331 26,811 1,905 1,928 1.22% 5.51 5.42 (0.09) (23.15) 5.54 8.52 (9.09) 7.11 7.19 7.07 -0.48% (32.3) Large Industrial 1,736.3 1,582.7 43,569 39,948 1,820 1,842 1.22% 3.99 3.96 (0.02) (9.27) 4.79 8.14 3.66 4.56 4.61 4.57 0.20% (18.5) Total 9,438.4 9,387.9 145,261 142,095 9,404 9,519 1.22% 6.50 6.61 0.11 42.53 30.26 42.06 114.85 6.62 6.70 6.70 1.22% 0.1 Sources: Calculated HQD-13, Document 4, Table R-9.b
Decision 2008-024 (Compliance for R-3644-2007)Cost Regul. Adj.
Before After 2007 2008 Change Growth Provision Total Subsidy2007 2008 2007 2008 $mm $mm % cts/kWh cts/kWh $mm 2006-07 $mm Before Proposed Cost-Based Percent Ch $mm
Domestic 4,845.8 5,133.4 59,232 59,760 4,165 4,286 2.91% 8.18 8.59 0.41 244.39 (43.87) (21.06) 179.46 6.97 7.17 7.27 4.31% 58.5 Small General 1,030.1 1,063.5 14,620 14,600 1,294 1,332 2.94% 7.05 7.28 0.24 34.78 (11.12) (6.54) 17.12 8.86 9.12 8.98 1.32% (20.9) Medium General 1,418.8 1,505.2 27,129 27,331 1,879 1,933 2.87% 5.23 5.51 0.28 75.84 (14.62) (9.50) 51.72 6.87 7.07 7.06 2.75% (2.3) Large Industrial 1,767.1 1,736.3 45,567 43,569 1,929 1,985 2.90% 3.88 3.99 0.11 46.67 (16.45) (9.75) 20.46 4.43 4.56 4.47 1.06% (35.5) Total 9,061.8 9,438.4 146,548 145,261 9,267 9,536 2.90% 6.18 6.50 0.31 401.68 (86.06) (46.85) 268.77 6.38 6.56 6.56 2.90% (0.2) Sources: Filing Filing
D-2007-12 (Compliance R-3610-2006)Cost Regul. Adj.
Before After 2006 2007 Change Growth Provision Total Subsidy2006 2007 2006 2007 $mm $mm % cts/kWh cts/kWh $mm 2006-07 $mm Before Proposed Cost-Based Percent Ch $mm
Domestic 59,232 4,050 4,128 1.92% 8.40 0.06 37.00 71.00 6.43 114.43 6.84 6.97 7.03 2.83% 36.7 Small General 14,620 1,275 1,299 1.92% 7.00 0.01 2.00 18.00 2.03 22.03 8.72 8.89 8.87 1.73% (2.5) Medium General 27,129 1,830 1,865 1.92% 5.10 (0.03) (8.00) 24.00 2.91 18.91 6.75 6.88 6.82 1.03% (16.2) Large Industrial 45,567 1,971 2,009 1.92% 3.80 (0.02) (10.00) 26.00 3.13 19.13 4.33 4.41 4.37 0.97% (18.7) Total - - - 146,548 9,126 9,301 1.92% 6.20 0.01 21.00 139.00 14.50 175.50 6.23 6.35 6.35 1.92% (0.7) Sources: HQD-12, Document 1, Table 28. HQD-15, Document 4, Table R-22(d), R-3644-2007
Shaded cells represent input values
Revenues Unit Revenue Req'mt Change in Cross SubsidiesCost of Service Sales Volume Unit Revenues
Revenues Unit Revenue Req'mt Change in Cross SubsidiesCost of Service Sales Volume Unit Revenues
Exhibit IEc-2b
Change in Cross SubsidiesCost of Service Sales Volume Unit Revenues
Supporting Workpapers for Historical Cross-Subsidy Calculations
Filing; HQD-11, Doc 1 Table 2, R-3677-2008
Cost of Service Sales Volume Unit RevenuesRevenues Unit Revenue Req'mt Change in Cross Subsidies
Revenues Unit Revenue Req'mt
Revenues Unit Revenue Req'mt Change in Cross SubsidiesCost of Service Sales Volume Unit Revenues
Calculated
Revenues Unit Revenue Req'mt Change in Cross SubsidiesCost of Service Sales Volume Unit Revenues
Cross Subsidy Workpapers 2010.xls; Exhibit IEc-2b 10/21/2010