Embed Size (px)
Citation preview

PECO ENERGY COMPANY STATEMENT NO. 5
BEFORE THE PENNSYLVANIA PUBLIC UTILITY COMMISSION
PENNSYLVANIA PUBLIC UTILITY COMMISSION
v.
PECO ENERGY COMPANY – ELECTRIC DIVISION
DOCKET NO. R-2015-2468981
____________________________________________
DIRECT TESTIMONY ____________________________________________
WITNESS: PAUL R. MOUL
SUBJECT: PECO’S OVERALL RATE OF RETURN INCLUDING CAPITAL STRUCTURE RATIOS, EMBEDDED COST OF DEBT, AND THE COST OF EQUITY
DATED: MARCH 27, 2015

-i-
TABLE OF CONTENTS
Page
I. INTRODUCTION AND SUMMARY OF RECOMMENDATIONS .................. 1
II. ELECTRIC UTILITY RISK FACTORS............................................................... 6
III. FUNDAMENTAL RISK ANALYSIS .................................................................. 9
IV. CAPITAL STRUCTURE RATIOS ..................................................................... 16
V. COSTS OF SENIOR CAPITAL .......................................................................... 20
VI. COST OF EQUITY – GENERAL APPROACH ................................................ 21
VII. DISCOUNTED CASH FLOW ANALYSIS ....................................................... 22
VIII. RISK PREMIUM ANALYSIS ............................................................................ 36
IX. CAPITAL ASSET PRICING MODEL ............................................................... 41
X. COMPARABLE EARNINGS APPROACH ....................................................... 45
XI. CONCLUSION ON COST OF EQUITY ............................................................ 49
Appendix A - Educational Background, Business Experience and Qualifications

GLOSSARY OF ACRONYMS AND DEFINED TERMS
ACRONYM DEFINED TERM
AFUDC Allowance for Funds Used During Construction β Beta
b represents the retention rate that consists of the fraction of earnings that are not paid out as dividends
b x r Represents internal growth
CAPM Capital Asset Pricing Model
CCR Corporate Credit Rating
CE Comparable Earnings
Company PECO Energy Company
CTC Competitive Transition Charge
CWIP Construction Work in Progress
DCF Discounted Cash Flow
FERC Federal Energy Regulatory Commission
FOMC Federal Open Market Committee
g Growth rate
IGF Internally Generated Funds
ITC Intangible Transition Charge
Lev Leverage modification
LT Long Term
MLP Master Limited Partnerships
OCI Other Comprehensive Income
PECO PECO Energy Company
PUC Pennsylvania Public Utility Commission
r Represents the expected rate of return on common equity
Rf Risk-free rate of return
Rm Market risk premium
RP Risk Premium
s Represents the new common shares expected to be issued by a firm
s x v Represents external growth
S&P Standard & Poor’s
v Represents the value that accrues to existing shareholders from selling stock at a price different from book value

2
GLOSSARY OF ACRONYMS AND DEFINED TERMS
ACRONYM DEFINED TERM
ytm Yield to maturity

DIRECT TESTIMONY 1 OF
PAUL R. MOUL
I. INTRODUCTION AND SUMMARY OF RECOMMENDATIONS 2
1. Q. Please state your name, occupation and business address. 3
A. My name is Paul Ronald Moul. My business address is 251 Hopkins Road, 4
Haddonfield, New Jersey 08033-3062. I am Managing Consultant at the firm 5
P. Moul & Associates, an independent financial and regulatory consulting 6
firm. My educational background, business experience and qualifications are 7
provided in Appendix A, which follows my direct testimony. 8
2. Q. What is the purpose of your testimony? 9
A. My testimony presents evidence, analysis, and a recommendation concerning 10
the appropriate cost of common equity and overall rate of return that the 11
Pennsylvania Public Utility Commission (“PUC” or the “Commission”) 12
should recognize in the determination of the revenues that PECO Energy 13
Company (“PECO Energy” or the “Company”) should realize as a result of 14
this proceeding. My analysis and recommendation are supported by the 15
detailed financial data contained in PECO Energy Exhibit PRM-1, which is a 16
multi-page document divided into fourteen (14) schedules. My testimony is 17
based upon my first-hand knowledge of PECO Energy, consisting of 18
information obtained from meetings with the Company's management and 19
Company-specific data that is widely disseminated within the financial 20
community. 21
2
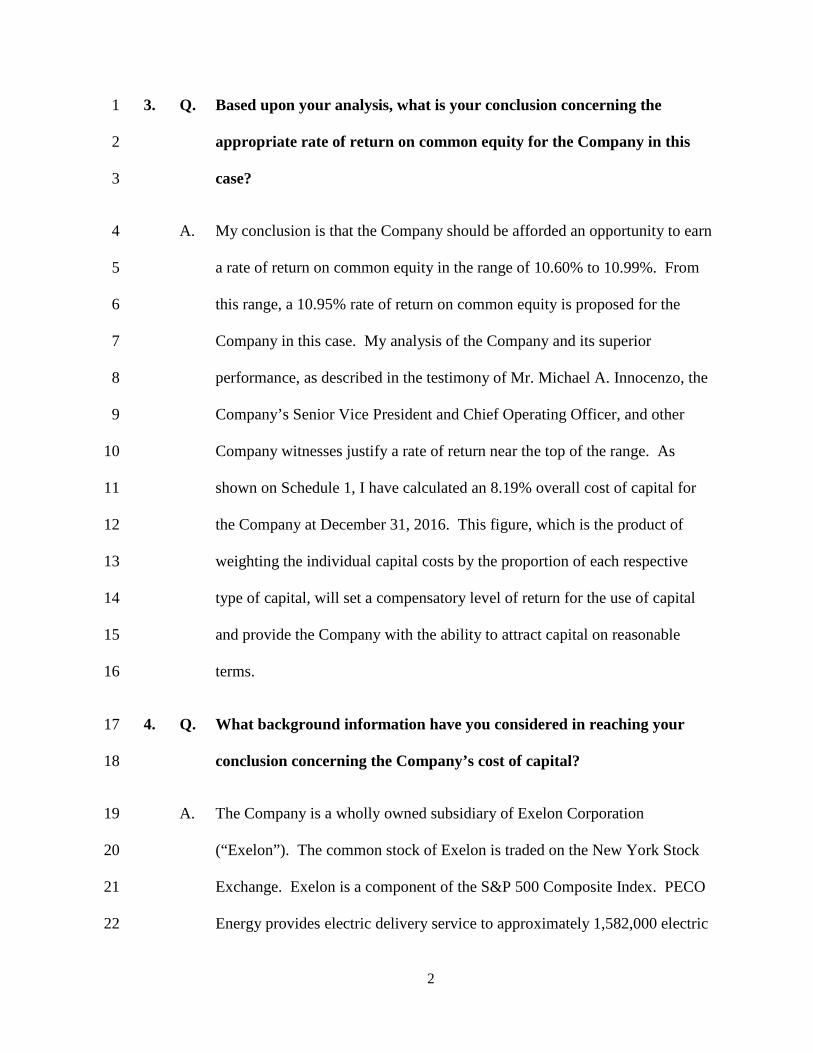
3. Q. Based upon your analysis, what is your conclusion concerning the 1
appropriate rate of return on common equity for the Company in this 2
case? 3
A. My conclusion is that the Company should be afforded an opportunity to earn 4
a rate of return on common equity in the range of 10.60% to 10.99%. From 5
this range, a 10.95% rate of return on common equity is proposed for the 6
Company in this case. My analysis of the Company and its superior 7
performance, as described in the testimony of Mr. Michael A. Innocenzo, the 8
Company’s Senior Vice President and Chief Operating Officer, and other 9
Company witnesses justify a rate of return near the top of the range. As 10
shown on Schedule 1, I have calculated an 8.19% overall cost of capital for 11
the Company at December 31, 2016. This figure, which is the product of 12
weighting the individual capital costs by the proportion of each respective 13
type of capital, will set a compensatory level of return for the use of capital 14
and provide the Company with the ability to attract capital on reasonable 15
terms. 16
4. Q. What background information have you considered in reaching your 17
conclusion concerning the Company’s cost of capital? 18
A. The Company is a wholly owned subsidiary of Exelon Corporation 19
(“Exelon”). The common stock of Exelon is traded on the New York Stock 20
Exchange. Exelon is a component of the S&P 500 Composite Index. PECO 21
Energy provides electric delivery service to approximately 1,582,000 electric 22
3
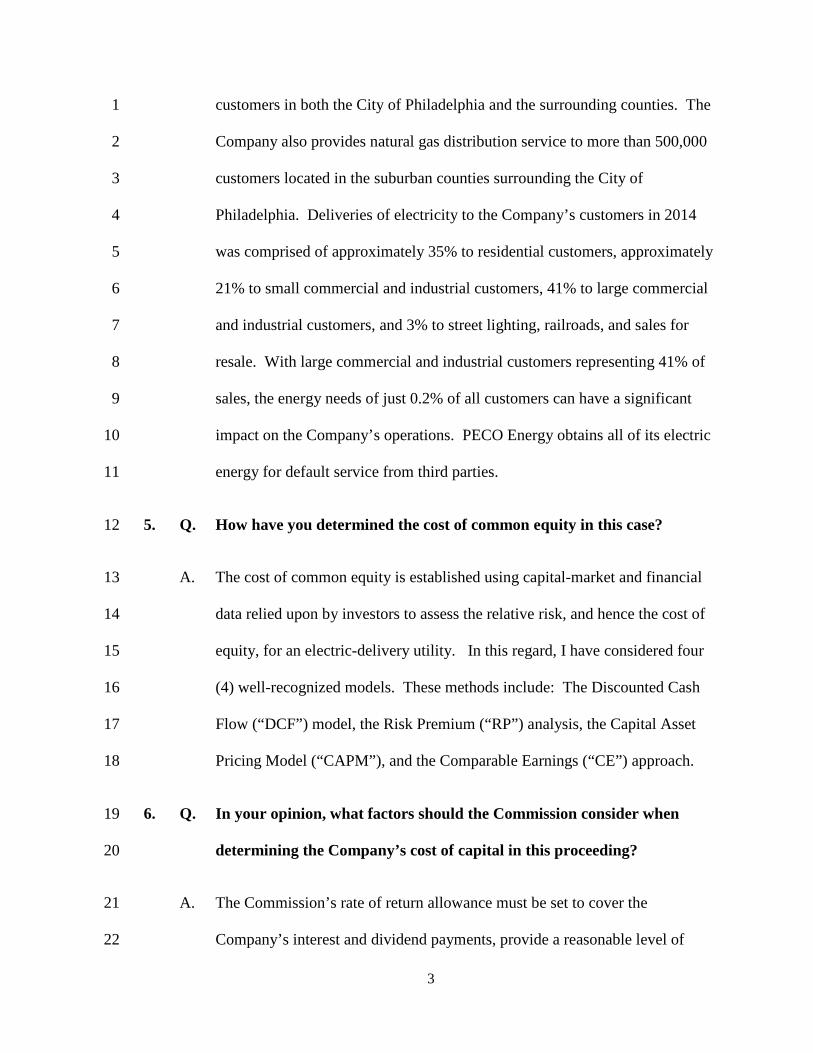
customers in both the City of Philadelphia and the surrounding counties. The 1
Company also provides natural gas distribution service to more than 500,000 2
customers located in the suburban counties surrounding the City of 3
Philadelphia. Deliveries of electricity to the Company’s customers in 2014 4
was comprised of approximately 35% to residential customers, approximately 5
21% to small commercial and industrial customers, 41% to large commercial 6
and industrial customers, and 3% to street lighting, railroads, and sales for 7
resale. With large commercial and industrial customers representing 41% of 8
sales, the energy needs of just 0.2% of all customers can have a significant 9
impact on the Company’s operations. PECO Energy obtains all of its electric 10
energy for default service from third parties. 11
5. Q. How have you determined the cost of common equity in this case? 12
A. The cost of common equity is established using capital-market and financial 13
data relied upon by investors to assess the relative risk, and hence the cost of 14
equity, for an electric-delivery utility. In this regard, I have considered four 15
(4) well-recognized models. These methods include: The Discounted Cash 16
Flow (“DCF”) model, the Risk Premium (“RP”) analysis, the Capital Asset 17
Pricing Model (“CAPM”), and the Comparable Earnings (“CE”) approach. 18
6. Q. In your opinion, what factors should the Commission consider when 19
determining the Company’s cost of capital in this proceeding? 20
A. The Commission’s rate of return allowance must be set to cover the 21
Company’s interest and dividend payments, provide a reasonable level of 22

4
earnings retention, produce an adequate level of internally generated funds to 1
meet capital requirements, be commensurate with the risk to which the 2
Company’s capital is exposed, assure confidence in the financial integrity of 3
the Company, support reasonable credit quality, and allow the Company to 4
raise capital on reasonable terms. The return that I propose fulfills these 5
established standards of a fair rate of return set forth by the landmark 6
Bluefield and Hope cases.1 That is to say, my proposed rate of return is 7
commensurate with returns available on investments having corresponding 8
risks. 9
7. Q. How have you measured the cost of equity in this case? 10
A. The models that I used to measure the cost of common equity for the 11
Company were applied with market and financial data developed from my 12
proxy group of ten (10) electric and combination utility companies. The 13
criteria that I used to assemble this proxy group will be described later in my 14
testimony. The companies that comprise the proxy group are identified on 15
page 2 of Schedule 3. I will refer to these companies as the “Electric Group” 16
throughout my testimony. 17
8. Q. How have you performed your cost-of-equity analysis with the market 18
data for the Electric Group? 19
A. I have applied the models/methods for estimating the cost of equity using the 20
1 Bluefield Water Works & Improvement Co. v. P.S.C. of West Virginia, 262 U.S. 679 (1923) and F.P.C. v. Hope Natural Gas Co., 320 U.S. 591 (1944).

5
average data for the Electric Group. I have not measured separately the cost 1
of equity for the individual companies within the Electric Group because the 2
determination of the cost of equity for an individual company can be 3
problematic. The use of group average data will reduce the effect of 4
potentially anomalous results for an individual company if a company-by-5
company approach were utilized. 6
9. Q. Please summarize your cost-of-equity analysis. 7
A. My cost of equity determination was derived from the results of the 8
methods/models identified above. In general, the use of more than one 9
method provides a superior foundation to arrive at the cost of equity. At any 10
point in time, any single method can provide an incomplete measure of the 11
cost of equity. The specific application of these methods/models will be 12
described later in my testimony. The following table provides a summary of 13
the indicated costs of equity using each of these approaches. 14
Electric Group
DCF 10.32%
RP 11.25%
CAPM 10.22%
CE 12.15%
Based on various combinations of the model results shown above, the average 15
of the DCF and RP methods is 10.79% (10.32% + 11.25% = 21.57% ÷ 2), the 16
6
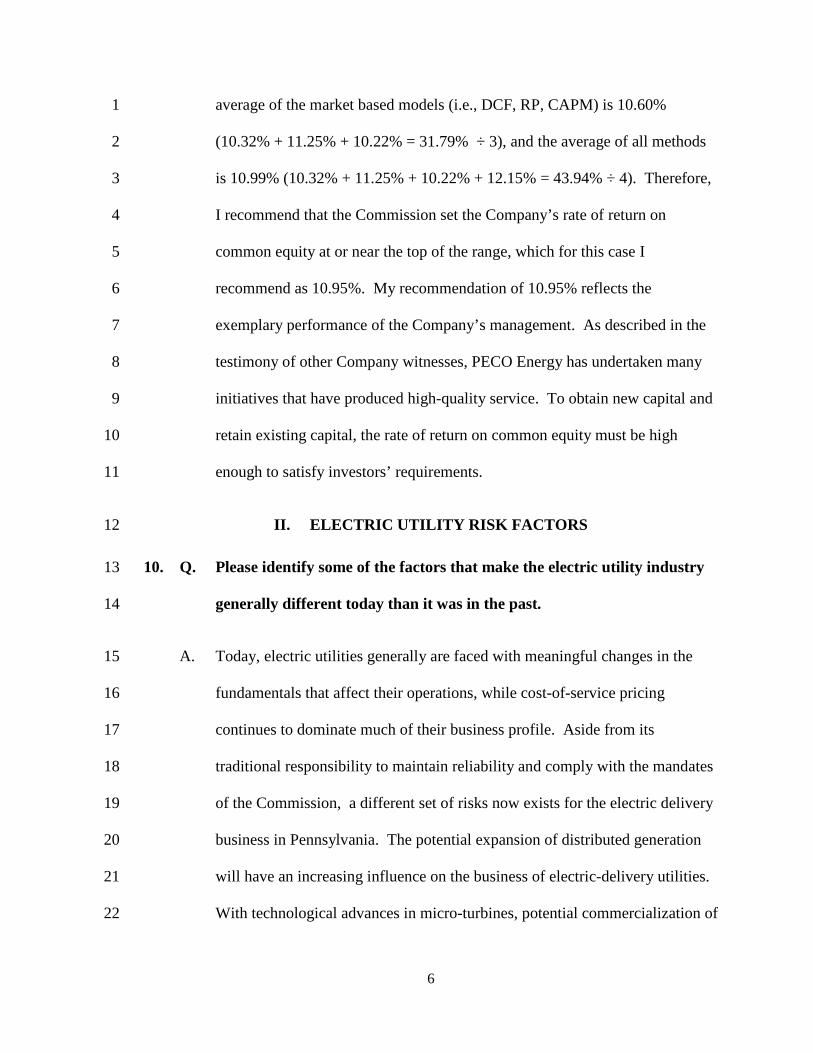
average of the market based models (i.e., DCF, RP, CAPM) is 10.60% 1
(10.32% + 11.25% + 10.22% = 31.79% ÷ 3), and the average of all methods 2
is 10.99% (10.32% + 11.25% + 10.22% + 12.15% = 43.94% ÷ 4). Therefore, 3
I recommend that the Commission set the Company’s rate of return on 4
common equity at or near the top of the range, which for this case I 5
recommend as 10.95%. My recommendation of 10.95% reflects the 6
exemplary performance of the Company’s management. As described in the 7
testimony of other Company witnesses, PECO Energy has undertaken many 8
initiatives that have produced high-quality service. To obtain new capital and 9
retain existing capital, the rate of return on common equity must be high 10
enough to satisfy investors’ requirements. 11
II. ELECTRIC UTILITY RISK FACTORS 12
10. Q. Please identify some of the factors that make the electric utility industry 13
generally different today than it was in the past. 14
A. Today, electric utilities generally are faced with meaningful changes in the 15
fundamentals that affect their operations, while cost-of-service pricing 16
continues to dominate much of their business profile. Aside from its 17
traditional responsibility to maintain reliability and comply with the mandates 18
of the Commission, a different set of risks now exists for the electric delivery 19
business in Pennsylvania. The potential expansion of distributed generation 20
will have an increasing influence on the business of electric-delivery utilities. 21
With technological advances in micro-turbines, potential commercialization of 22

7
fuel cells, development of wind and solar power, and the creation of micro-1
grids, utilities face the potential for bypass and the resulting declines in 2
transmission and distribution revenues. At the same time, an electric utility 3
retains the obligation to provide reliable delivery service and must continue to 4
invest in its rate base to fulfill that obligation. 5
The obligation to serve also represents a key risk factor for the local 6
delivery of electricity. The risks facing the electric utilities are clearly 7
different from those that existed in the past. Investors generally are risk-8
averse, and with increased uncertainty will require compensation for higher 9
risk. 10
11. Q. What are the primary risk factors facing the electric-utility industry? 11
A. In the new environment, competitive issues have or will develop due to the 12
convergence of energy sources and bypass arising from self-generation or 13
distributed-generation. Regulatory risks include the overall framework of 14
ratesetting, cost allocation, and rate-design issues, and the level of return that 15
will be allowed. 16
The financial structure of the electric business is uncertain due to the 17
relationship with end-users, the adequacy of capital recovery, counter-party 18
risk, potential for financial penalties associated with operational problems, 19
and growth in the utilization of the transmission and distribution network by 20
non-affiliated generators and marketers. 21
22
8
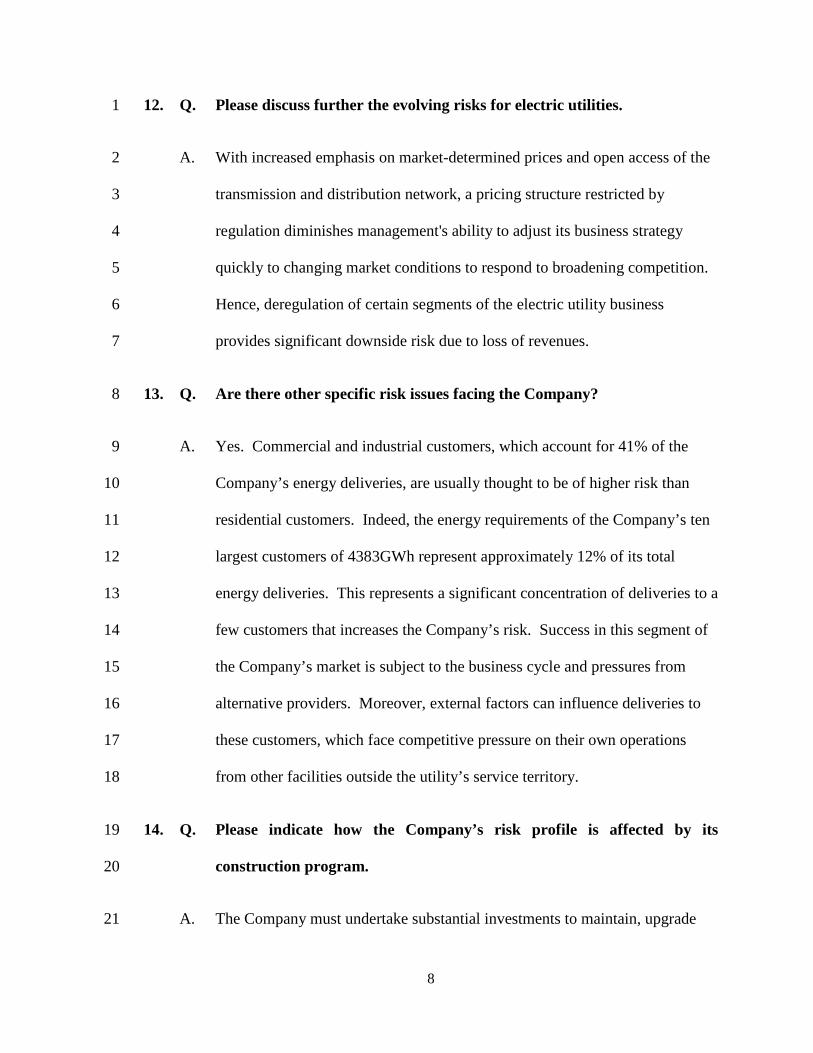
12. Q. Please discuss further the evolving risks for electric utilities. 1
A. With increased emphasis on market-determined prices and open access of the 2
transmission and distribution network, a pricing structure restricted by 3
regulation diminishes management's ability to adjust its business strategy 4
quickly to changing market conditions to respond to broadening competition. 5
Hence, deregulation of certain segments of the electric utility business 6
provides significant downside risk due to loss of revenues. 7
13. Q. Are there other specific risk issues facing the Company? 8
A. Yes. Commercial and industrial customers, which account for 41% of the 9
Company’s energy deliveries, are usually thought to be of higher risk than 10
residential customers. Indeed, the energy requirements of the Company’s ten 11
largest customers of 4383GWh represent approximately 12% of its total 12
energy deliveries. This represents a significant concentration of deliveries to a 13
few customers that increases the Company’s risk. Success in this segment of 14
the Company’s market is subject to the business cycle and pressures from 15
alternative providers. Moreover, external factors can influence deliveries to 16
these customers, which face competitive pressure on their own operations 17
from other facilities outside the utility’s service territory. 18
14. Q. Please indicate how the Company’s risk profile is affected by its 19
construction program. 20
A. The Company must undertake substantial investments to maintain, upgrade 21
9
and expand existing facilities in its service territory to ensure safe and reliable 1
service to its customers. In particular, the rehabilitation of the Company’s 2
infrastructure represents a non-revenue producing use of capital. The 3
Company projects its construction expenditures will approximate $2.687 4
billion during the period 2015-2019, which represents approximately 40% 5
($2.687 billion ÷ $6.789 billion) of its net utility plant at December 31, 2014.2 6
15. Q. How should the Commission respond to the evolving business 7
environment facing the Company? 8
A. In the situation where additional capital is required, as shown by the projected 9
construction expenditures indicated above, the regulatory process must 10
establish a return on equity that provides a reasonable opportunity for the 11
Company to actually achieve its cost of capital. Where ongoing capital 12
investment is required to meet the high quality of service that customers 13
demand, supportive regulation is essential. 14
III. FUNDAMENTAL RISK ANALYSIS 15
16. Q. Is it necessary to conduct a fundamental risk analysis to provide a 16
framework for determining a utility’s cost of equity? 17
A. Yes. It is necessary to establish a company’s relative risk position within its 18
industry through a fundamental analysis of various quantitative and qualitative 19
factors that bear upon investors’ assessment of overall risk. The qualitative 20
2 Looking solely at the electric delivery portion of the Company’s business, its construction expenditures as a percent of net utility plant are the same, i.e., 40%.
10
factors that bear upon the Company’s risk have already been discussed. The 1
quantitative risk analysis follows. The items that influence investors’ 2
evaluation of risk and their required returns were described above. For this 3
purpose, I compared PECO Energy to the S&P Public Utilities, an industry-4
wide proxy consisting of various regulated businesses, and to the Electric 5
Group. 6
17. Q. What are the components of the S&P Public Utilities? 7
A. The S&P Public Utilities is a widely recognized index that is comprised of 8
electric power and natural gas companies. These companies are identified on 9
page 3 of Schedule 4. 10
18. Q. What criteria did you employ to assemble the Electric Group? 11
A. The companies that comprise the Electric Group have the following common 12
characteristics: (i) their stock is traded on the New York Stock Exchange, (ii) 13
they are listed in the “Electric Utility (East)” section of The Value Line 14
Investment Survey, (iii) they have not recently reduced their common 15
dividend, and (iv) they are not currently the target of a publicly announced 16
merger or acquisition. As noted previously, these companies are listed on 17
page 2 of Schedule 3. Value Line is an investment advisory service that is a 18
widely used source in public utility rate cases. I should note that subsequent 19
to the selection of the members of the Electric Group, Iberdrole SA struck a 20
$3 billion deal to acquire UIL Holdings. The offer represented a premium of 21
24.6% to the stock price of UIL on February 25, 2015 and a 19.3% premium 22

11
to the average stock price over the past 30 days. However, none of these 1
events has any impact on my analysis because they all post-date the market 2
data that I used in my analysis that ended on December 31, 2014. The 3
identities of the companies are: Consolidated Edison, Inc., Dominion 4
Resources, Inc., Duke Energy Corp., NextEra Energy, Northeast Utilities, PPL 5
Corporation, SCANA Corp., Southern Company, TECO Energy, Inc., and 6
UIL Holdings. 7
19. Q. Is knowledge of a utility's bond rating an important factor in assessing its 8
risk and cost of capital? 9
A. Yes. Knowledge of a company’s credit-quality rating is important because the 10
cost of each type of capital is directly related to the associated risk of the firm. 11
So, while a company’s credit-quality risk is shown directly by the rating and 12
yield on its bonds, these relative risk assessments also bear upon the cost of 13
equity. This is because a firm's cost of equity is represented by its borrowing 14
cost plus compensation to recognize the higher risk of an equity investment 15
compared to debt. 16
20. Q. How do the bond ratings compare for PECO Energy, the Electric Group, 17
and the S&P Public Utilities? 18
A. Currently, the Long Term (“LT”) issuer rating for PECO Energy is A2 from 19
Moody’s Investors Services (“Moody’s”) and the corporate credit rating 20
(“CCR”) is BBB from Standard and Poor’s Corporation (“S&P”). The LT 21
issuer rating by Moody’s and CCR designation by S&P focus upon the credit 22
12
quality of the issuer of the debt, rather than upon the debt obligation itself. 1
The average credit quality of the Electric Group is A3 from Moody’s and 2
BBB+ from S&P. For the S&P Public Utilities, the average composite rating 3
is A3 by Moody’s and BBB+ by S&P. Many of the financial indicators that I 4
will subsequently discuss are considered during the rating process. 5
21. Q. How do the financial data compare for PECO Energy, the Electric 6
Group, and the S&P Public Utilities? 7
A. The broad categories of financial data that I will discuss are shown on 8
Schedules 2, 3, and 4. The data cover the five-year period 2009-2013. For 9
PECO Energy, the financial statements contained in SEC Form 10-K, which is 10
the source used by S&P Utility Compustat, include both its natural gas 11
distribution and electric delivery and transmission businesses. I have 12
modified the income statement and cash flow data for PECO Energy by 13
removing the unique effects of the Intangible Transition Charge (“ITC”) and 14
Competitive Transition Charge (“CTC”), which are unrelated to this case. I 15
have also adjusted the balance sheet to eliminate Accumulated Other 16
Comprehensive Income (“OCI”). The important categories of relative risk 17
may be summarized as follows: 18
Size. In terms of capitalization, PECO Energy is smaller than the 19
average size of the Electric Group and the S&P Public Utilities. All other 20
things being equal, a smaller company is riskier than a larger company 21
because a given change in revenue and expense has a proportionately greater 22
impact on a small firm. 23

13
Market Ratios. Market-based financial ratios, such as earnings/price 1
ratios and dividend yields, provide a partial measure of the investor-required 2
cost of equity. If all other factors are equal, investors will require a higher 3
rate of return for companies that exhibit greater risk, in order to compensate 4
for that risk. That is to say, a firm that investors perceive to have higher risks 5
will experience a lower price per share in relation to expected earnings.3 6
There are no market ratios available for PECO Energy because Exelon owns 7
its stock. The five-year average price-earnings multiple for the Electric Group 8
was fairly similar to that of the S&P Public Utilities. The five-year average 9
dividend yield for the Electric Group was also fairly similar to the S&P Public 10
Utilities, albeit the Electric Group’s yield was slightly higher. The five-year 11
average market-to-book ratio was somewhat higher for the Electric Group as 12
compared to the S&P Public Utilities. 13
Common-Equity Ratio. The level of financial risk is measured by 14
the proportion of long-term debt and other senior capital that is contained in a 15
company’s capitalization. Financial risk is also analyzed by comparing 16
common-equity ratios (the complement of the ratio of debt and other senior 17
capital). That is to say, a firm with a high common-equity ratio has lower 18
financial risk, while a firm with a low common equity ratio has higher 19
financial risk. The five-year average common-equity ratios, based on 20
permanent capital, were 54.2% for PECO Energy, 44.5% for the Electric 21
Group, and 45.3% for the S&P Public Utilities. For the purpose of calculating 22
3 For example, two otherwise similarly situated firms each reporting $1.00 in earnings per share would have different market prices at varying levels of risk (i.e., the firm with a higher level of risk will have a lower share value, while the firm with a lower risk profile will have a higher share value).

14
the weighted average cost of capital for this case, the Company is proposing a 1
53.36% common equity ratio. 2
Return on Book Equity. Greater variability (i.e., uncertainty) of a 3
firm’s earned returns signifies relatively greater levels of risk, as shown by the 4
coefficient of variation (standard deviation ÷ mean) of the rate of return on 5
book common equity. The higher the coefficients of variation, the greater 6
degree of variability. For the five-year period, the coefficients of variation 7
were 0.118 (1.5% ÷ 12.7%) for PECO Energy, 0.107 (1.1% ÷ 10.3%) for the 8
Electric Group, and 0.102 (1.0% ÷ 9.8%) for the S&P Public Utilities. Here, 9
PECO Energy displays more risk due to its higher coefficient of variation. 10
Operating Ratios. I have also compared operating ratios (the 11
percentage of revenues consumed by operating expense, depreciation, and 12
taxes other than income).4 The five-year average operating ratios were 13
83.1% for PECO Energy, 80.1% for the Electric Group, and 81.7% for the 14
S&P Public Utilities. 15
Coverage. The level of fixed-charge coverage (i.e., the multiple by 16
which available earnings cover fixed charges, such as interest expense) 17
provides an indication of the earnings protection for creditors. Higher levels 18
of coverage, and hence earnings protection for fixed charges, are usually 19
associated with superior grades of creditworthiness. The five-year average 20
interest coverage (excluding Allowance for Funds Used During Construction 21
(“AFUDC”) was 4.41 times for PECO Energy, 3.25 times for the Electric 22
4 The complement of the operating ratio is the operating margin which provides a measure of profitability. The higher the operating ratio, the lower the operating margin.

15
Group, and 3.09 times for the S&P Public Utilities. 1
Quality of Earnings. Measures of earnings quality usually are 2
revealed by the percentage of AFUDC related to income available for 3
common equity, the effective income tax rate, and other cost deferrals. These 4
measures of earnings quality usually influence a firm’s internally generated 5
funds because poor quality of earnings would not generate high levels of cash 6
flow. Quality of earnings has not been a significant concern for PECO 7
Energy, the Electric Group, or the S&P Public Utilities. 8
Internally Generated Funds. Internally generated funds (“IGF”) 9
provide an important source of new investment capital for a utility and 10
represent a key measure of credit strength. Historically, the five-year average 11
percentage of IGF to capital expenditures was 93.1% for PECO Energy, 12
83.2% for the Electric Group, and 90.6% for the S&P Public Utilities. 13
Betas. The financial data that I have been discussing relate primarily 14
to company-specific risks. Market risk for firms with publicly traded stock is 15
measured by beta coefficients. Beta coefficients attempt to identify 16
systematic risk, i.e., the risk associated with changes in the overall market for 17
common equities.5 Value Line publishes such a statistical measure of a 18
stock’s relative historical volatility to the rest of the market. A comparison of 19
market risk is shown by the Value Line beta of .70 as the average for the 20
Electric Group (see page 2 of Schedule 3), and .77 as the average for the S&P 21
5 The procedure used to calculate the beta coefficient published by Value Line is described in Appendix H. A common stock that has a beta less than 1.0 is considered to have less systematic risk than the market as a whole and would be expected to rise and fall more slowly than the rest of the market. A stock with a beta above 1.0 would have more systematic risk.

16
Public Utilities (see page 3 of Schedule 4). 1
22. Q. Based on your analysis, does the Electric Group provide a reasonable 2
basis to measure the Company’s cost of equity for this case? 3
A. Yes. Some risk indicators are higher for the Company, some are lower, and 4
others are about the same. On balance, the risk factors average out, indicating 5
that the cost of equity for the Electric Group provides a reasonable basis for 6
measuring the Company’s cost of equity. 7
IV. CAPITAL STRUCTURE RATIOS 8
23. Q. Please explain the selection of capital structure ratios for PECO Energy. 9
A. The capital structure ratios of PECO Energy should be employed for rate of 10
return purposes. In the situation where the operating public utility raises its 11
own debt directly in the capital markets, as is the case for the Company, it is 12
proper to employ the capital structure ratios and senior capital cost rates of the 13
regulated public utility for rate-of-return purposes. Furthermore, consistency 14
requires that the embedded cost rates of the Company’s senior securities also 15
be employed. This procedure is consistent with the ratesetting procedures 16
used by the Commission in prior rate cases for PECO Energy. 17
24. Q. Does Schedule 5 provide the Company’s capitalization and capital 18
structure ratios? 19
A. Yes. The December 31, 2014 capitalization corresponds with the end of the 20
historic test year in this case, December 31, 2015 date corresponds with the 21
end of the future test year, and December 31, 2016 date corresponds with the 22

17
end of the fully forecast test year. The Company plans to issue $350 million 1
of new long-term debt during the future test year. A forecast increase in 2
retained earnings by December 31, 2015 has also been included. For the fully 3
forecast test year, there is a $300 million debt maturity and a $350 million 4
planned issue of long-term debt. The build-up of retained savings is also 5
reflected. In presenting the Company's capital structure on Schedule 5, I have 6
removed several items for ratesetting purposes, including the treatment of the 7
call premiums on the early redemption of high-cost long-term debt and 8
preferred stock, which has been redeemed, and the accumulated Other 9
Comprehensive Income (“OCI”). 10
25. Q. Please describe the adjustment for the call premiums paid to redeem the 11
high-cost debt. 12
A. I have adjusted the principal amounts of long-term debt and preferred stock to 13
exclude the amounts used to finance premiums on the early redemption of 14
these securities. To do otherwise would deny PECO Energy the full return on 15
the premiums paid to redeem this high-cost capital since additional amounts 16
of capital were issued to pay the call premiums. The amounts issued to finance 17
the call premiums do not increase the Company's rate base. That is to say, no 18
additional rate base was created through additional debt and preferred stock 19
necessary to finance this transaction, and therefore an adjustment is required 20
to provide the return necessary to service this additional capital. Hence, 21
PECO Energy’s long-term debt and preferred stock amounts must be adjusted 22
for this disparity in order that the return necessary to service the capitalization 23

18
is produced from rate-base investment times the overall rate of return. 1
This adjustment is equitable because customers receive the cost 2
savings resulting from these refinancings in the form of a lower overall rate of 3
return, and PECO Energy recovers all costs incurred in providing these 4
benefits to customers. To produce these savings, the Company paid to the 5
debt and preferred stock holders a premium for surrendering their securities 6
prior to maturity. These premiums represented an investment made by PECO 7
Energy to reduce its overall cost of capital. Because the reduced interest costs 8
and preferred stock dividends are reflected in the lower cost of capital to 9
customers, it is appropriate that the Company recover the costs incurred to 10
produce these savings. This includes both a return of and return on the 11
unamortized premiums. Adjusting the principal amounts in the capital 12
structure provides a return on the premium as a part of the embedded cost 13
rates of capital. 14
26. Q. Please describe the OCI adjustment. 15
A. I have removed the accumulated OCI from the capital structure for ratesetting 16
purposes. OCI arises from a variety of sources, including: minimum pension 17
liability, foreign-currency hedges, unrealized gains and losses on securities 18
available for sale, interest-rate swaps, and other cash-flow hedges. For PECO 19
Energy, its OCI is represented by Unrealized Gains and Losses on Available-20
for-Sale Securities. The accounting entries that relate to accumulated OCI are 21
unrelated to the Company’s rate base determination and must be excluded 22
from the common-equity balance. That is to say, these accounting entries 23

19
neither produce nor consume cash, and hence they cannot impact the rate base 1
valuation. 2
27. Q. Should short-term debt be included in the capital structure for rate of 3
return purposes? 4
A. There is no need to consider short-term debt in the capital structure because 5
PECO Energy does not have any short-term debt at the end of the historical 6
and future test years. For the fully forecast test year, the Company forecasts 7
that $99.845 million of short-term debt will be outstanding. Since short-term 8
debt is typically assumed to finance construction work in progress (“CWIP”), 9
and that CWIP is forecast to be $150.592 million at the end of the fully 10
forecast test year, short-term debt must be excluded from the weighted 11
average cost of capital calculation in this case. 12
28. Q. What capital structure ratios do you recommend be adopted for rate of 13
return purposes in this proceeding? 14
A. Since ratesetting is prospective, the rate of return should, at a minimum, 15
reflect known or reasonably foreseeable changes which will occur during the 16
course of the test year. As a result, I will adopt the Company's future test 17
year-end capital structure ratios of 46.64% long-term debt and 53.36% 18
common equity. 19
20

20
V. COSTS OF SENIOR CAPITAL 1
29. Q. What cost rate have you assigned to the debt portion of PECO Energy's 2
capital structure? 3
A. The determination of the long-term debt cost rate is essentially an arithmetic 4
exercise. This is due to the fact that the Company has contracted for the use 5
of this capital for a specific period of time at a specified cost rate. As shown 6
on pages 1, 2 and 3 of Schedule 6, I have computed the embedded cost rate of 7
long-term debt at the end of each test year. On page 3 of Schedule 6, I have 8
shown the estimated embedded cost rate of long-term debt at December 31, 9
2016. The interest cost for the new issues of PECO Energy long-term debt are 10
developed later in my direct testimony and are associated with yield on 11
corporate debt used in my Risk Premium analysis. The development of the 12
individual effective cost rates for each series of long-term debt, using the cost 13
rate to maturity technique, is shown on page 4 of Schedule 6. The cost rate, or 14
yield to maturity (“ytm”), is the rate of discount that equates the present value 15
of all future interest and principal payments with the net proceeds of the bond. 16
In my calculation of the embedded cost of long-term debt, I have recognized 17
the costs associated with the Company's early redemption of high cost debt. 18
As previously explained, it is necessary to compensate PECO Energy for the 19
costs incurred to lower the embedded debt cost rate, which reduces the cost of 20
capital charged to customers. 21
22
21
30. Q. What cost rate have you determined for the Company’s long-term debt? 1
A. I will adopt the 5.04% embedded cost of long-term debt at December 31, 2
2016, as shown on page 3 of Schedule 6. This rate is related to the amount of 3
long-term debt shown on Schedule 5 which provides the basis for the 46.64% 4
long-term debt ratio. 5
VI. COST OF EQUITY – GENERAL APPROACH 6
31. Q. Please describe the process you employed to determine the cost of equity 7
for PECO Energy. 8
A. Although my fundamental financial analysis provides the required framework 9
to establish the risk relationships among PECO Energy, the Electric Group, 10
and the S&P Public Utilities, the cost of equity must be measured by standard 11
financial models that I identified above. Differences in risk traits, such as 12
size, business diversification, geographical diversity, regulatory policy, 13
financial leverage, and bond ratings must be considered when analyzing the 14
cost of equity. 15
It is also important to reiterate that no one method or model of the 16
cost of equity can be applied in an isolated manner. Rather, informed 17
judgment must be used to take into consideration the relative risk traits of the 18
firm. It is for this reason that I have used more than one method to measure 19
the Company’s cost of equity. As I describe below, each of the methods used 20
to measure the cost of equity contains certain incomplete and/or overly 21
restrictive assumptions and constraints that are not optimal. Therefore, I favor 22

22
considering the results from a variety of methods. In this regard, I applied 1
each of the methods with data taken from the Electric Group and arrived at a 2
range of the cost of equity of 10.60% to 10.99%. As explained previously, I 3
propose a rate of return on common equity of 10.95%. 4
VII. DISCOUNTED CASH FLOW ANALYSIS 5
32. Q. Please describe your use of the Discounted Cash Flow approach to 6
determine the cost of equity. 7
A. The DCF model seeks to explain the value of an asset as the present value of 8
future expected cash flows discounted at the appropriate risk-adjusted rate of 9
return. In its simplest form, the DCF return on common stock consists of a 10
current cash (dividend) yield and future price appreciation (growth) of the 11
investment. The dividend discount equation is the familiar DCF valuation 12
model and assumes future dividends are systematically related to one another 13
by a constant growth rate. The DCF formula is derived from the standard 14
valuation model: P = D/(k-g), where P = price, D = dividend, k = the cost of 15
equity, and g = growth in cash flows. By rearranging the terms, we obtain the 16
familiar DCF equation: k= D/P + g. All of the terms in the DCF equation 17
represent investors’ assessment of expected future cash flows that they will 18
receive in relation to the value that they set for a share of stock (P). The DCF 19
equation is sometimes referred to as the "Gordon" model.6 My DCF results 20
are provided on page 2 of Schedule 1 for the Electric Group. The DCF return 21
6 Although the popular application of the DCF model is often attributed to the work of Myron J. Gordon in the mid-1950’s, J. B. Williams exposited the DCF model in its present form nearly two decades earlier.

23
is 10.32%. 1
Among other limitations of the model, there is a certain element of 2
circularity in the DCF method when applied in rate cases. This is because 3
investors’ expectations for the future depend upon regulatory decisions. In 4
turn, when regulators depend upon the DCF model to set the cost of equity, 5
they rely upon investor expectations that include an assessment of how 6
regulators will decide rate cases. Due to this circularity, the DCF model may 7
not fully reflect the true risk of a utility. 8
33. Q. Please explain the dividend yield component of a DCF analysis. 9
A. The DCF methodology requires the use of an expected dividend yield to 10
establish the investor-required cost of equity. The monthly dividend yields for 11
the twelve months ended December 2014 are shown on Schedule 7 and 12
capture an adjustment to the month-end prices to reflect the buildup of the 13
dividend in the price that has occurred since the last ex-dividend date (i.e., the 14
date by which a shareholder must own the shares to be entitled to the dividend 15
payment – usually about two to three weeks prior to the actual payment). 16
For the twelve months ended December 2014, the average dividend 17
yield was 4.10% for the Electric Group based upon a calculation using 18
annualized dividend payments and adjusted month-end stock prices. The 19
dividend yields for the more recent six- and three-month periods were 4.01% 20
and 3.80%, respectively. I have used, for the purpose of the DCF model, the 21
six-month average dividend yield of 4.01% for the Electric Group. The use of 22
this dividend yield will reflect current capital costs, while avoiding spot 23

24
yields. For the purpose of a DCF calculation, the average dividend yield must 1
be adjusted to reflect the prospective nature of the dividend payments, i.e., the 2
higher expected dividends for the future. Recall that the DCF is an 3
expectational model that must reflect investor anticipated cash flows for the 4
Electric Group. I have adjusted the six-month average dividend yield in three 5
different, but generally accepted, manners and used the average of the three 6
adjusted values as calculated in the lower panel of data presented on Schedule 7
7. This adjustment adds eleven basis points to the six-month average 8
historical yield, thus producing the 4.12% adjusted dividend yield for the 9
Electric Group. 10
34. Q. Turning to the growth component of the DCF analysis, please explain the 11
underlying factors that influence investors’ growth expectations. 12
A. As noted previously, investors are interested principally in the future growth 13
of their investment (i.e., the price per share of the stock). Future earnings per 14
share growth represent the DCF model’s primary focus because under the 15
constant price-earnings multiple assumption of the model, the price per share 16
of stock will grow at the same rate as earnings per share. In conducting a 17
growth rate analysis, a wide variety of variables can be considered when 18
reaching a consensus of prospective growth, including: earnings, dividends, 19
book value, and cash flows stated on a per share basis. Historical values for 20
these variables can be considered, as well as analysts’ forecasts that are 21
widely available to investors. A fundamental growth rate analysis is 22
sometimes represented by the internal growth (“b x r”), where “r” represents 23
25
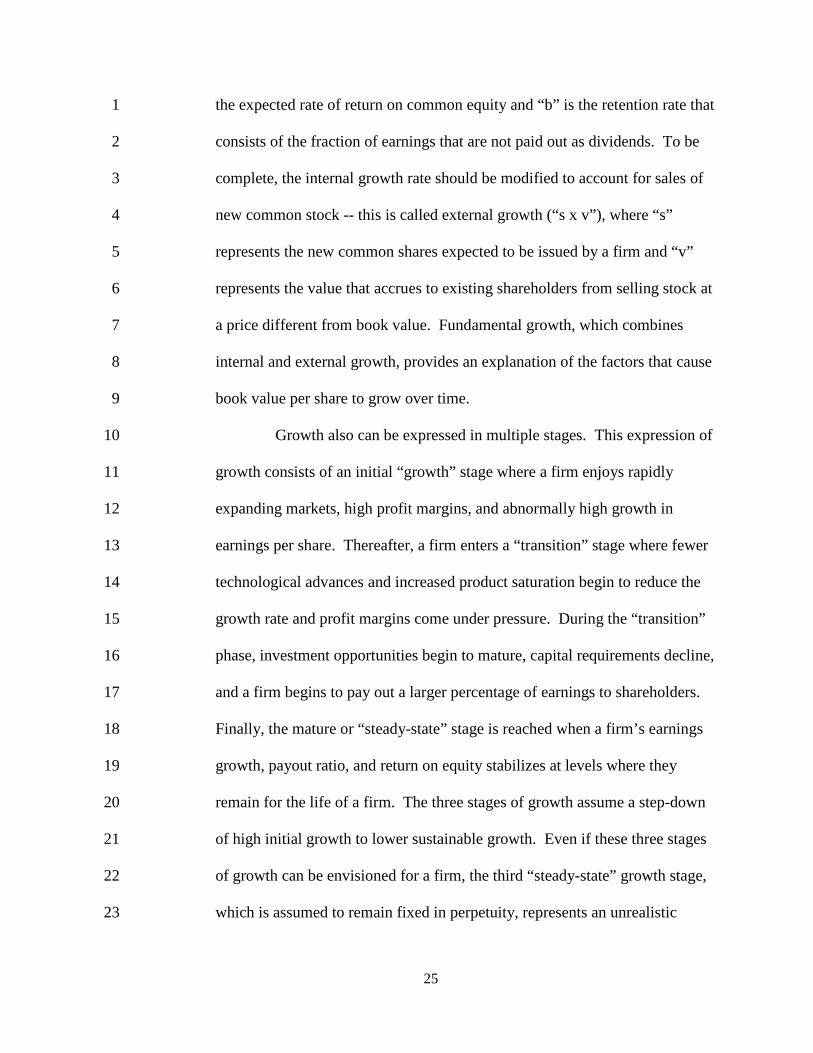
the expected rate of return on common equity and “b” is the retention rate that 1
consists of the fraction of earnings that are not paid out as dividends. To be 2
complete, the internal growth rate should be modified to account for sales of 3
new common stock -- this is called external growth (“s x v”), where “s” 4
represents the new common shares expected to be issued by a firm and “v” 5
represents the value that accrues to existing shareholders from selling stock at 6
a price different from book value. Fundamental growth, which combines 7
internal and external growth, provides an explanation of the factors that cause 8
book value per share to grow over time. 9
Growth also can be expressed in multiple stages. This expression of 10
growth consists of an initial “growth” stage where a firm enjoys rapidly 11
expanding markets, high profit margins, and abnormally high growth in 12
earnings per share. Thereafter, a firm enters a “transition” stage where fewer 13
technological advances and increased product saturation begin to reduce the 14
growth rate and profit margins come under pressure. During the “transition” 15
phase, investment opportunities begin to mature, capital requirements decline, 16
and a firm begins to pay out a larger percentage of earnings to shareholders. 17
Finally, the mature or “steady-state” stage is reached when a firm’s earnings 18
growth, payout ratio, and return on equity stabilizes at levels where they 19
remain for the life of a firm. The three stages of growth assume a step-down 20
of high initial growth to lower sustainable growth. Even if these three stages 21
of growth can be envisioned for a firm, the third “steady-state” growth stage, 22
which is assumed to remain fixed in perpetuity, represents an unrealistic 23

26
expectation because the three stages of growth can be repeated. That is to say, 1
the stages can be repeated where growth for a firm ramps-up and ramps-down 2
in cycles over time. It is quite apparent that the Company is going through an 3
expansion stage, because of substantial new investment. 4
35. Q. What investor-expected growth rate is appropriate in a DCF calculation? 5
A. Investors consider both company-specific variables and overall market 6
sentiment (i.e., level of inflation rates, interest rates, economic conditions, 7
etc.) when balancing their capital gains expectations with their dividend yield 8
requirements. I follow an approach that is not rigidly formatted because 9
investors are not influenced by a single set of company-specific variables 10
weighted in a formulaic manner. In my opinion, all relevant growth rate 11
indicators using a variety of techniques must be evaluated when formulating a 12
judgment of investor-expected growth. 13
36. Q. What data for the proxy group have you considered in your growth rate 14
analysis? 15
A. I have considered the growth in the financial variables shown on Schedules 8 16
and 9. The historical growth rates were taken from the Value Line publication 17
that provides this data. As shown on Schedule 8, the historical growth of 18
earnings per share was in the range of 3.28% to 3.45% for the Electric Group. 19
Schedule 9 provides projected earnings per share growth rates taken 20
from analysts’ forecasts compiled by IBES/First Call, Zacks, Morningstar, 21
SNL, and Value Line. IBES/First Call, Zacks, Morningstar, and SNL 22

27
represent reliable authorities of projected growth upon which investors rely. 1
The IBES/First Call, Zacks, and SNL growth rates are consensus forecasts 2
taken from a survey of analysts that make projections of growth for these 3
companies. The IBES/First Call, Zacks, Morningstar, and SNL estimates are 4
obtained from the Internet and are widely available to investors. First Call 5
probably is quoted most frequently in the financial press when reporting on 6
earnings forecasts. The Value Line forecasts also are widely available to 7
investors and can be obtained by subscription or free-of-charge at most public 8
and collegiate libraries. The IBES/First Call, Zacks, Morningstar, and SNL 9
forecasts are limited to earnings per share growth, while Value Line makes 10
projections of other financial variables. The Value Line forecasts of dividends 11
per share, book value per share, and cash flow per share have also been 12
included on Schedule 9 for the Electric Group. 13
37. Q. What specific evidence have you considered in the DCF growth analysis? 14
A. As to the five-year forecast growth rates, Schedule 9 indicates that the 15
projected earnings per share growth rates for the Electric Group are 5.21% by 16
IBES/First Call, 5.32% by Zacks, 6.24% by Morningstar, 5.12% by SNL, and 17
4.83% by Value Line. The Value Line projections indicate that earnings per 18
share for the Electric Group will grow prospectively at a more rapid rate (i.e., 19
4.83%) than the dividends per share (i.e., 3.94%), which translates into a 20
declining dividend payout ratio for the future. As noted earlier, with the 21
constant price-earnings multiple assumption of the DCF model, growth for 22
28
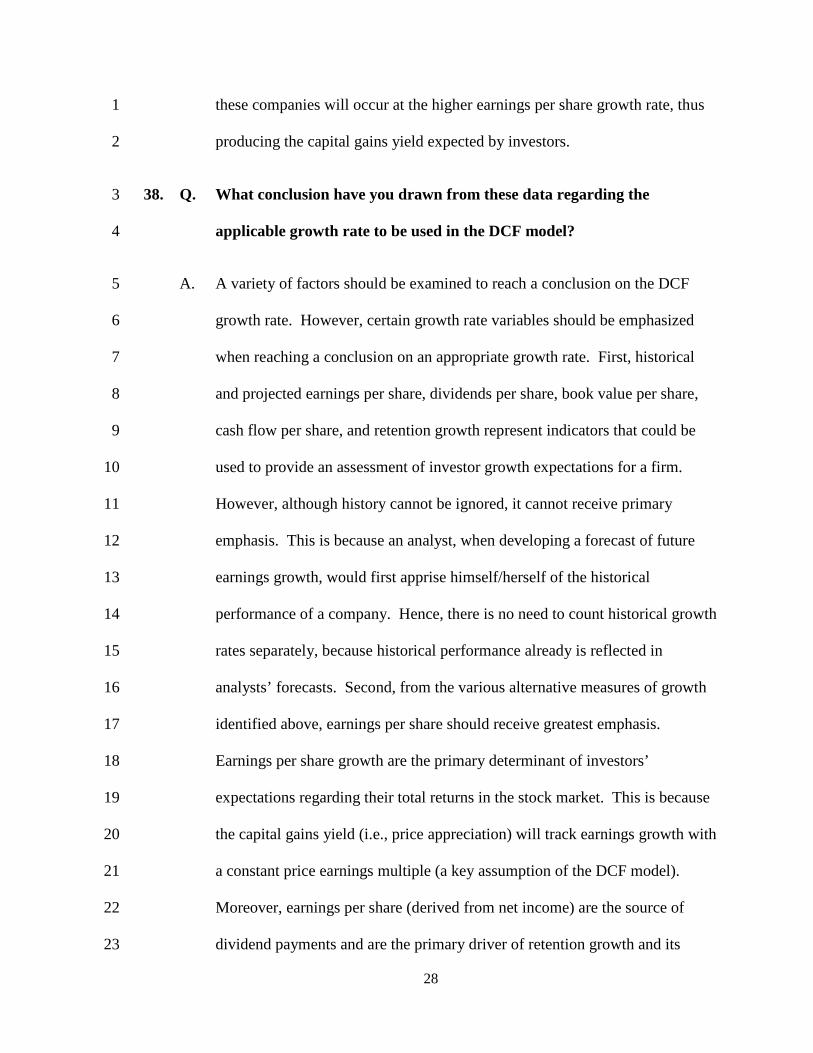
these companies will occur at the higher earnings per share growth rate, thus 1
producing the capital gains yield expected by investors. 2
38. Q. What conclusion have you drawn from these data regarding the 3
applicable growth rate to be used in the DCF model? 4
A. A variety of factors should be examined to reach a conclusion on the DCF 5
growth rate. However, certain growth rate variables should be emphasized 6
when reaching a conclusion on an appropriate growth rate. First, historical 7
and projected earnings per share, dividends per share, book value per share, 8
cash flow per share, and retention growth represent indicators that could be 9
used to provide an assessment of investor growth expectations for a firm. 10
However, although history cannot be ignored, it cannot receive primary 11
emphasis. This is because an analyst, when developing a forecast of future 12
earnings growth, would first apprise himself/herself of the historical 13
performance of a company. Hence, there is no need to count historical growth 14
rates separately, because historical performance already is reflected in 15
analysts’ forecasts. Second, from the various alternative measures of growth 16
identified above, earnings per share should receive greatest emphasis. 17
Earnings per share growth are the primary determinant of investors’ 18
expectations regarding their total returns in the stock market. This is because 19
the capital gains yield (i.e., price appreciation) will track earnings growth with 20
a constant price earnings multiple (a key assumption of the DCF model). 21
Moreover, earnings per share (derived from net income) are the source of 22
dividend payments and are the primary driver of retention growth and its 23

29
surrogate, i.e., book value per share growth. As such, under these 1
circumstances, greater emphasis must be placed upon projected earnings per 2
share growth. In this regard, it is worthwhile to note that Professor Myron 3
Gordon, the foremost proponent of the DCF model in rate cases, concluded 4
that the best measure of growth in the DCF model is a forecast of earnings per 5
share growth.7 Hence, to follow Professor Gordon’s findings, projections of 6
earnings per share growth, such as those published by IBES/First Call, Zacks, 7
Morningstar, and Value Line, represent a reasonable assessment of investor 8
expectations. 9
The forecasts of earnings per share growth, as shown on Schedule 9, 10
provide a range of average growth rates of 4.83% to 6.24%. Although the 11
DCF growth rates cannot be established solely with a mathematical 12
formulation, it is my opinion that an investor-expected growth rate of 5.25% is 13
reasonable. In addition, projected growth rates are likely understated because 14
they do not fully recognize the growth in earnings that will occur due to the 15
substantial increase in plant investment. Growth rates today should reflect the 16
expectation of growth generated by accelerated investment in infrastructure by 17
public utilities. Moreover, the stock market is one of the financial 18
components of the leading economic indicators compiled by The Conference 19
Board. “In the six-month period ending September 2014, the leading 20
economic index increased 3.5 percent (about a 7.1 percent annual rate), faster 21
than the growth of 2.7 percent (about a 5.6 percent annual rate) during the 22
7 Gordon, Gordon & Gould, “Choice Among Methods of Estimating Share Yield,” The Journal of Portfolio Management (Spring 1989).

30
previous six months. Also, the strengths among the components became more 1
widespread than weaknesses in the past six months.”8 This improving 2
economic growth argues for a higher DCF growth rate. 3
39. Q. Are the dividend yield and growth components of the DCF adequate to 4
explain the rate of return on common equity when it is used in the 5
calculation of the weighted average cost of capital? 6
A. Only if the capital structure ratios are measured with the market value of debt 7
and equity. In the case of the Electric Group, those average capital structure 8
ratios are 44.04% long-term debt, 0.30% preferred stock, and 55.66% 9
common equity, as shown on Schedule 10. If book values are used to 10
compute the capital structure ratios, then an adjustment is required. 11
40. Q. Please explain why. 12
A. If regulators use the results of the DCF (which are based on the market price 13
of the stock of the companies analyzed) to compute the weighted average cost 14
of capital based on a book value capital structure used for ratesetting 15
purposes, the utility will not, by definition, recover its risk-adjusted capital 16
cost. This is because market valuations of equity are based on market value 17
capital structures, which in general have more equity and less debt and 18
therefore reflect less risk than book value capital structures (see Schedule 10 19
for the comparison). The utility’s risk-adjusted cost of equity will necessarily 20
8 The Conference Board U.S. Business Cycle Indicators -The Conference Board Leading Economic Index (LEI) for the U.S. and Related Composite Economic Indexes for September 2014 [Press Release].Retrieved from http://www.conference-board.org/data/bci.cfm dated October 23, 2014.

31
be lower with the less risky market value capital structure than with the book 1
value capital structure. The difference represents that portion of the utility’s 2
cost of equity that it will not recover unless either the market value cost of 3
equity is applied to the utility’s market value capital structure or it is adjusted 4
to reflect the higher risk associated with the book value capital structure. By 5
the same token, if the utility’s market value capital structure is less than its 6
book value structure, then the utility’s market cost of equity should be 7
adjusted downward to reflect the lower risk associated with the book value 8
capital structure, or else the utility will over-recover its total cost of equity. 9
This shortcoming of the DCF has persuaded the Commission to 10
adjust the DCF determined cost of equity upward to make the return 11
consistent with the book value capital structure. Specific adjustments to 12
recognize this risk difference were made in the following cases: 13
Date Company Docket Number Basis Points
January 10, 2002 Pennsylvania-American Water Co. Docket No. R-00016339 60 basis points August 1, 2002 Philadelphia Suburban Water Co. Docket No. R-00016750 80 basis pointsJanuary 29, 2004 Pennsylvania-American Water Co. Docket No. R-00038304
(affirmed by the Commonwealth Court on November 8, 2004)
60 basis points
August 5, 2004 Aqua Pennsylvania, Inc. Docket No. R-00038805 60 basis pointsDecember 22, 2004 PPL Electric Utilities Corp. Docket No. R-00049255 45 basis points February 8, 2007 PPL Gas Utilities Corp. Docket No. R-00061398 70 basis points
In order to make the DCF results relevant to the capitalization measured at 14
book value (as is done for rate setting purposes), the market-derived cost rate 15
cannot be used without modification. 16
41. Q. Is your leverage adjustment dependent upon the market valuation or 17
book valuation from an investor’s perspective? 18
32
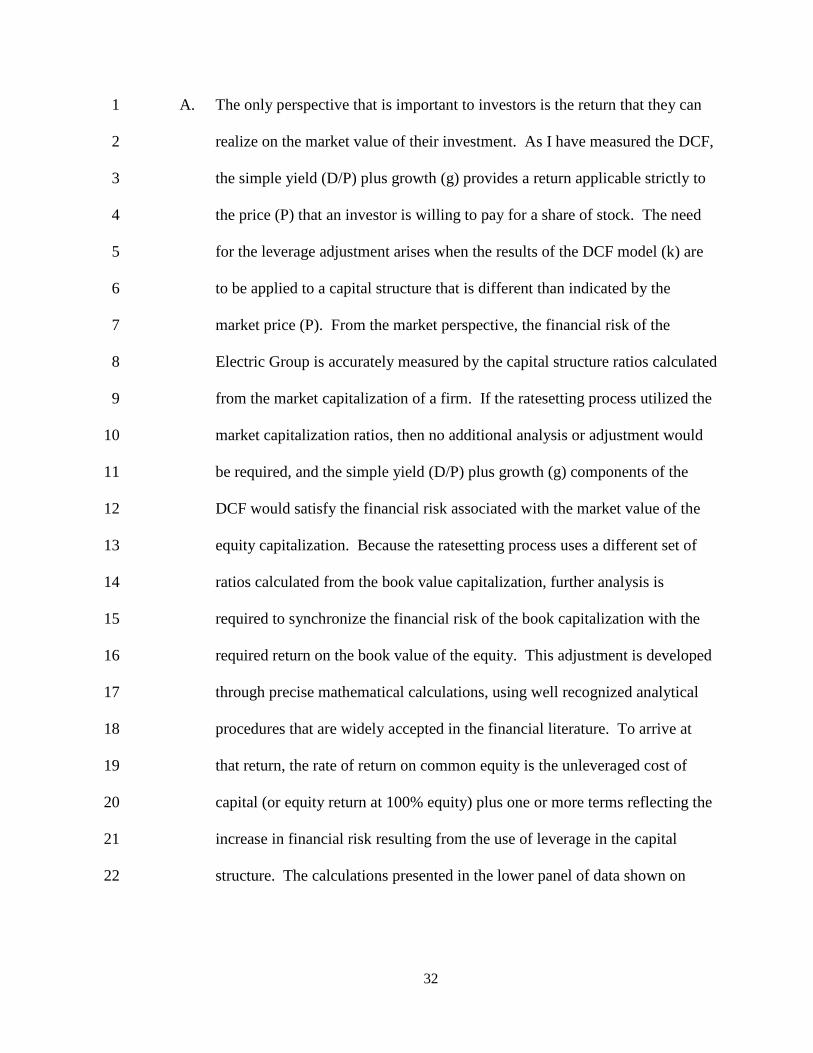
A. The only perspective that is important to investors is the return that they can 1
realize on the market value of their investment. As I have measured the DCF, 2
the simple yield (D/P) plus growth (g) provides a return applicable strictly to 3
the price (P) that an investor is willing to pay for a share of stock. The need 4
for the leverage adjustment arises when the results of the DCF model (k) are 5
to be applied to a capital structure that is different than indicated by the 6
market price (P). From the market perspective, the financial risk of the 7
Electric Group is accurately measured by the capital structure ratios calculated 8
from the market capitalization of a firm. If the ratesetting process utilized the 9
market capitalization ratios, then no additional analysis or adjustment would 10
be required, and the simple yield (D/P) plus growth (g) components of the 11
DCF would satisfy the financial risk associated with the market value of the 12
equity capitalization. Because the ratesetting process uses a different set of 13
ratios calculated from the book value capitalization, further analysis is 14
required to synchronize the financial risk of the book capitalization with the 15
required return on the book value of the equity. This adjustment is developed 16
through precise mathematical calculations, using well recognized analytical 17
procedures that are widely accepted in the financial literature. To arrive at 18
that return, the rate of return on common equity is the unleveraged cost of 19
capital (or equity return at 100% equity) plus one or more terms reflecting the 20
increase in financial risk resulting from the use of leverage in the capital 21
structure. The calculations presented in the lower panel of data shown on 22
33
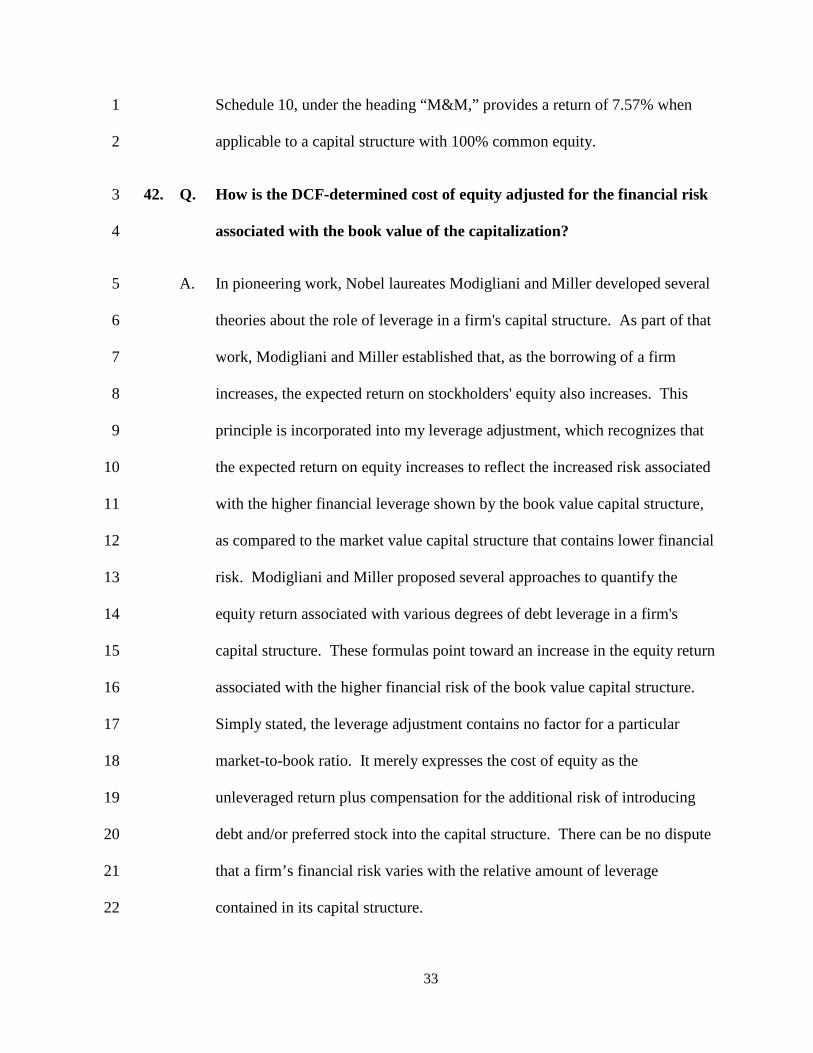
Schedule 10, under the heading “M&M,” provides a return of 7.57% when 1
applicable to a capital structure with 100% common equity. 2
42. Q. How is the DCF-determined cost of equity adjusted for the financial risk 3
associated with the book value of the capitalization? 4
A. In pioneering work, Nobel laureates Modigliani and Miller developed several 5
theories about the role of leverage in a firm's capital structure. As part of that 6
work, Modigliani and Miller established that, as the borrowing of a firm 7
increases, the expected return on stockholders' equity also increases. This 8
principle is incorporated into my leverage adjustment, which recognizes that 9
the expected return on equity increases to reflect the increased risk associated 10
with the higher financial leverage shown by the book value capital structure, 11
as compared to the market value capital structure that contains lower financial 12
risk. Modigliani and Miller proposed several approaches to quantify the 13
equity return associated with various degrees of debt leverage in a firm's 14
capital structure. These formulas point toward an increase in the equity return 15
associated with the higher financial risk of the book value capital structure. 16
Simply stated, the leverage adjustment contains no factor for a particular 17
market-to-book ratio. It merely expresses the cost of equity as the 18
unleveraged return plus compensation for the additional risk of introducing 19
debt and/or preferred stock into the capital structure. There can be no dispute 20
that a firm’s financial risk varies with the relative amount of leverage 21
contained in its capital structure. 22

34
43. Q. Is the leverage adjustment that you propose designed to transform the 1
market return into one that is designed to produce a particular market-2
to-book ratio? 3
A. No, it is not. The adjustment that I label as a “leverage adjustment” is merely 4
a convenient way of showing the amount that must be added to (or subtracted 5
from) the result of the simple DCF model (i.e., D/P + g), in the context of a 6
return that applies to the capital structure used in ratemaking, which is 7
computed with book value weights rather than market value weights, in order 8
to arrive at the utility’s total cost of equity. I specify a separate factor, which I 9
call the leverage adjustment, but there is no need to do so other than providing 10
identification for this factor. If I expressed my return solely in the context of 11
the book value weights that we use to calculate the weighted average cost of 12
capital, and ignore the familiar D/P + g expression entirely, then there would 13
be no separate element to reflect the financial leverage change from market 14
value to book value capitalization. As shown in the bottom panel of data on 15
Schedule 10, the equity return applicable to the book value common equity 16
ratio is equal to 7.57%, which is the return for the Electric Group applicable to 17
its equity with no debt in its capital structure (i.e., the cost of capital is equal 18
to the cost of equity with a 100% equity ratio) plus 2.73% compensation for 19
having a 54.69% debt ratio, plus 0.02% for having a 0.44% preferred stock 20
ratio. The sum of the parts is 10.32% (7.57% + 2.73% + 0.02%) and there is 21
no need to even address the cost of equity in terms of D/P + g. To express this 22
same return in the context of the familiar DCF model, I summed the 4.12% 23

35
dividend yield, the 5.25% growth rate, and the 0.95% for the leverage 1
adjustment in order to arrive at the same 10.32% (4.12% + 5.25% + 0.95%) 2
return. I know of no means to mathematically solve for the 0.95% leverage 3
adjustment by expressing it in the terms of any particular relationship of 4
market price to book value. The 0.95% (10.32% - 9.37%) adjustment is 5
merely a convenient way to compare the 10.32% return computed directly 6
with the Modigliani & Miller formulas to the 9.37% return generated by the 7
DCF model based on a market value capital structure. My point is that when 8
we use a market-determined cost of equity developed from the DCF model, it 9
reflects a level of financial risk that is different (in this case, lower) from the 10
capital structure stated at book value. This process has nothing to do with 11
targeting any particular market-to-book ratio. 12
44. Q. Please provide the DCF return based upon your preceding discussion of 13
dividend yield, growth, and leverage. 14
A. As explained previously, I have utilized a six-month average dividend yield 15
("D1 /P0") adjusted in a forward-looking manner for my DCF calculation. 16
This dividend yield is used in conjunction with the growth rate ("g") 17
previously developed. The DCF also includes the leverage modification 18
("lev.") required when the book value equity ratio is used in determining the 19
weighted average cost of capital in the ratesetting process rather than the 20
market value equity ratio related to the price of stock. 21

36
D 1 /P 0 + g + lev. = K
Electric Group 4.12% + 5.25% + 0.95% = 10.32%
The DCF result shown above represents the simplified (i.e., Gordon) form of 1
the model that contains a constant growth assumption. I should reiterate, 2
however, that the DCF-indicated cost rate provides an explanation of the rate 3
of return on common stock market prices without regard to the prospect of a 4
change in the price-earnings multiple. An assumption that there will be no 5
change in the price-earnings multiple is not supported by the realities of the 6
equity market, because price-earnings multiples do not remain constant. This 7
is one of the constraints of this model that makes it important to consider other 8
model results when determining a company's cost of equity. 9
VIII. RISK PREMIUM ANALYSIS 10
45. Q. Please describe your use of the Risk Premium approach to determine the 11
cost of equity. 12
A. With the Risk Premium approach, the cost of equity capital is determined by 13
corporate bond yields plus a premium to account for the fact that common 14
equity is exposed to greater investment risk than debt capital. The result of 15
my Risk Premium study is shown on page 2 of Schedule 1. That result is 16
11.25%. As with other models used to determine the cost of equity, the Risk 17
Premium approach has its limitations, including potential imprecision in the 18
assessment of the future cost of corporate debt and the measurement of the 19
risk-adjusted common equity premium. 20

37
46. Q. What long-term public utility debt cost rate did you use in your Risk 1
Premium analysis? 2
A. In my opinion, a 4.75% yield represents a reasonable estimate of the 3
prospective yield on long-term A-rated public utility bonds. 4
47. Q. What forecasts of interest rates have you considered in your analysis? 5
A. I have determined the prospective yield on A-rated public utility debt by using 6
the Blue Chip Financial Forecasts (“Blue Chip”) along with the spread in the 7
yields that I describe below. The Blue Chip is a reliable authority and 8
contains consensus forecasts of a variety of interest rates compiled from a 9
panel of banking, brokerage, and investment advisory services. In early 1999, 10
Blue Chip stopped publishing forecasts of yields on A-rated public utility 11
bonds because the Federal Reserve deleted these yields from its Statistical 12
Release H.15. To independently project a forecast of the yields on A-rated 13
public utility bonds, I have combined the forecast yields on long-term 14
Treasury bonds published on January 1, 2014, and a yield spread of 1.00%, 15
derived from historical data. 16
48. Q. What historical data have you analyzed? 17
A. I have analyzed the historical yields on the Moody’s index of long-term public 18
utility debt as shown on page 1 of Schedule 11. For the twelve months ended 19
December 2014, the average monthly yield on Moody’s index of A-rated 20
public utility bonds was 4.28%. For the six and three-month periods ended 21

38
December 2014, the yields were 4.12% and 4.03%, respectively. During the 1
twelve-months ended December 2014, the range of the yields on A-rated 2
public utility bonds was 3.95% to 4.63%. Page 2 of Schedule 11 shows the 3
long-run spread in yields between A-rated public utility bonds and long-term 4
Treasury bonds. As shown on page 3 of Schedule 10, the yields on A-rated 5
public utility bonds have exceeded those on Treasury bonds by 0.94% on a 6
twelve-month average basis, 1.00% on a six-month average basis, and 1.06% 7
on a the three-month average basis. From these averages, 1.00% represents a 8
reasonable spread for the yield on A-rated public utility bonds over Treasury 9
bonds. 10
49. Q. How have you used these data to project the yield on a-rated public utility 11
bonds for the purpose of your Risk Premium analyses? 12
A. Shown below is my calculation of the prospective yield on A-rated public 13
utility bonds using the building blocks discussed above, i.e., the Blue Chip 14
forecast of Treasury bond yields and the public utility bond yield spread. For 15
comparative purposes, I also have shown the Blue Chip forecasts of Aaa-rated 16
and Baa-rated corporate bonds. These forecasts are: 17
30-YearYear Quarter Aaa-rated Baa-rated Treasury Spread Yield2015 First 4.0% 4.9% 3.1% 1.00% 4.10%2015 Second 4.2% 5.1% 3.3% 1.00% 4.30%2015 Third 4.3% 5.3% 3.5% 1.00% 4.50%2015 Fourth 4.6% 5.5% 3.7% 1.00% 4.70%2016 First 4.8% 5.7% 3.9% 1.00% 4.90%2016 Second 5.0% 5.8% 4.0% 1.00% 5.00%
CorporateBlue Chip Financial Forecasts
A-rated Public Utility

39
50. Q. Are there additional forecasts of interest rates that extend beyond those 1
shown above? 2
A. Yes. Twice yearly, Blue Chip provides long-term forecasts of interest rates. 3
In its December 1, 2014 publication, Blue Chip published longer-term 4
forecasts of interest rates, which were reported to be: 5
30-YearAverages Aaa-rated Baa-rated Treasury2016-20 5.8% 6.6% 4.9%2021-25 6.1% 7.0% 5.1%
CorporateBlue Chip Financial Forecasts
Given these forecasted interest rates, a 4.75% yield on A-rated public utility 6
bonds represents a reasonable expectation. 7
51. Q. What equity Risk Premium have you determined for this case? 8
A. To develop an appropriate equity risk premium, I analyzed the results from 9
Stocks, Bonds, Bills and Inflation (“SBBI”) 2014 Classic Yearbook published 10
by Ibbotson Associates that is part of Morningstar. My investigation reveals 11
that the equity risk premium varies according to the level of interest rates. 12
That is to say, the equity risk premium increases as interest rates decline and it 13
declines as interest rates increase. This inverse relationship is revealed by the 14
summary data presented below and shown on page 1 of Schedule 12. 15
40
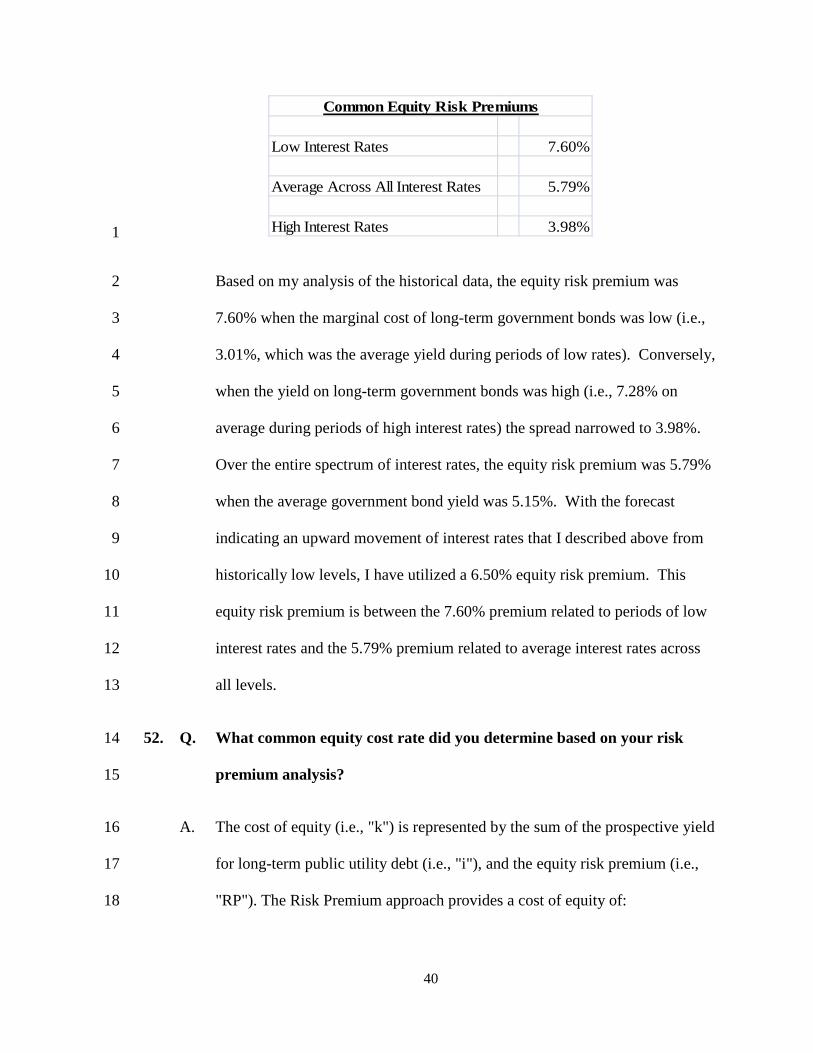
Low Interest Rates 7.60%
Average Across All Interest Rates 5.79%
High Interest Rates 3.98%
Common Equity Risk Premiums
1
Based on my analysis of the historical data, the equity risk premium was 2
7.60% when the marginal cost of long-term government bonds was low (i.e., 3
3.01%, which was the average yield during periods of low rates). Conversely, 4
when the yield on long-term government bonds was high (i.e., 7.28% on 5
average during periods of high interest rates) the spread narrowed to 3.98%. 6
Over the entire spectrum of interest rates, the equity risk premium was 5.79% 7
when the average government bond yield was 5.15%. With the forecast 8
indicating an upward movement of interest rates that I described above from 9
historically low levels, I have utilized a 6.50% equity risk premium. This 10
equity risk premium is between the 7.60% premium related to periods of low 11
interest rates and the 5.79% premium related to average interest rates across 12
all levels. 13
52. Q. What common equity cost rate did you determine based on your risk 14
premium analysis? 15
A. The cost of equity (i.e., "k") is represented by the sum of the prospective yield 16
for long-term public utility debt (i.e., "i"), and the equity risk premium (i.e., 17
"RP"). The Risk Premium approach provides a cost of equity of: 18

41
i + RP = k
Electric Group 4.75% + 6.50% = 11.25% 1
IX. CAPITAL ASSET PRICING MODEL 2
53. Q. What are the features of the CAPM as you have used it? 3
A. The CAPM uses the yield on a risk-free interest bearing obligation plus a rate 4
of return premium that is proportional to the systematic risk of an investment. 5
As shown on page 2 of Schedule 1, the result of the CAPM is 10.22%. To 6
compute the cost of equity with the CAPM, three components are necessary: 7
a risk-free rate of return (“Rf”), the beta measure of systematic risk (“β”), and 8
the market risk premium (“Rm-Rf”) derived from the total return on the 9
market of equities reduced by the risk-free rate of return. The CAPM 10
specifically accounts for differences in systematic risk (i.e., market risk as 11
measured by the beta) between an individual firm or group of firms and the 12
entire market of equities. 13
54. Q. What betas have you considered in the CAPM? 14
A. For my CAPM analysis, I initially considered the Value Line betas. As shown 15
on page 2 of Schedule 3, the average beta is 0.70 for the Electric Group. 16
55. Q. What betas have you used in the CAPM determined cost of equity? 17
A. The betas must be reflective of the financial risk associated with the 18
ratesetting capital structure that is measured at book value. Therefore, Value 19
Line betas cannot be used directly in the CAPM, unless the cost rate 20

42
developed using those betas is applied to a capital structure measured with 1
market values. To develop a CAPM cost rate applicable to a book-value 2
capital structure, the Value Line (market value) betas have been unleveraged 3
and releveraged for the book value common equity ratios using the Hamada 4
formula,9 as follows: 5
βl = βu [1 + (1 - t) D/E + P/E] 6
where ßl = the leveraged beta, ßu = the unleveraged beta, t = income tax rate, 7
D = debt ratio, P = preferred stock ratio, and E = common equity ratio. The 8
betas published by Value Line have been calculated with the market price of 9
stock and are related to the market value capitalization. By using the formula 10
shown above and the capital structure ratios measured at market value, the 11
beta would become 0.46 for the Electric Group if it employed no leverage and 12
was 100% equity financed. Those calculations are shown on Schedule 10 13
under the section labeled “Hamada,” who is credited with developing those 14
formulas. With the unleveraged beta as a base, I calculated the leveraged beta 15
of 0.83 for the book value capital structure of the Electric Group. The book 16
value leveraged beta that I will employ in the CAPM cost of equity is 0.83 for 17
the Electric Group. 18
56. Q. What risk-free rate have you used in the CAPM? 19
9 Robert S. Hamada, “The Effects of the Firm’s Capital Structure on the Systematic Risk of Common Stocks” The Journal of Finance Vol. 27, No. 2, Papers and Proceedings of the Thirtieth Annual Meeting of the American Finance Association, New Orleans, Louisiana, December 27-29, 1971. (May 1972), pp.435-452.

43
A. As shown on page 1 of Schedule 13, I provided the historical yields on 1
Treasury notes and bonds. For the twelve months ended December 2014, the 2
average yield on 30-year Treasury bonds was 3.34%. For the six- and three-3
months ended December 2014, the yields on 30-year Treasury bonds were 4
3.12% and 2.97%, respectively. During the twelve-months ended December 5
2014, the range of the yields on 30-year Treasury bonds was 2.83% to 3.77%. 6
The low yields that existed during recent periods can be traced to the financial 7
crisis and its aftermath commonly referred to as the Great Recession. The 8
resulting decline in the yields on Treasury obligations was attributed to a 9
number of factors, including: the sovereign debt crisis in the euro zone, the 10
potential for deflation, and the Federal Reserve’s large balance sheet that was 11
expanded through the purchase of Treasury obligations and mortgage-backed 12
securities (also known as QEI, QEII, and QEIII) and the reinvestment of the 13
proceeds from maturing obligations and the lengthening of the maturity of the 14
Fed’s bond portfolio through the sale of short-term Treasuries and the 15
purchase of long-term Treasury obligations (also known as “operation twist”). 16
Essentially, low interest rates were the product of the policy of the FOMC in 17
its attempt to deal with stagnant job growth, which is part of its dual mandate. 18
In 2014, the FOMC began reducing its bond purchasing program. The term 19
commonly used to describe this reduction in bond purchases is called 20
“tapering.” The FOMC completed its tapering program by ending its 21
quantitative easing in October 2014. As shown on page 2 of Schedule 12, 22
forecasts published by Blue Chip on January 1, 2015 indicate that the yields 23
44
on long-term Treasury bonds are expected to be in the range of 3.1% to 4.0% 1
during the next six quarters. The longer term forecasts described previously 2
show that the yields on 30-year Treasury bonds will average 4.9% from 2016 3
through 2020 and 5.1% from 2021 to 2025. For the reasons explained 4
previously, forecasts of interest rates should be emphasized at this time in 5
selecting the risk-free rate of return in CAPM. Hence, I have used a 3.75% 6
risk-free rate of return for CAPM purposes, which considers not only the Blue 7
Chip forecasts, but also the recent yields on long-term Treasury bonds. 8
57. Q. What market premium have you used in the CAPM? 9
A. As shown in the lower panel of data presented on page 2 of Schedule 13, the 10
market premium is derived from historical data and the Value Line and S&P 11
500 returns. For the historically based market premium, I have used the 12
arithmetic mean obtained from the data presented on page 1 of Schedule 12. 13
On that schedule, the market return was 12.17% on large stocks during 14
periods of low interest rates. During those periods, the yield on long-term 15
government bonds was 3.01% when interest rates were low. As I describe 16
above, interest rates are forecast to trend upward in the future. To recognize 17
that trend, I have given weight to the average returns and yields that existed 18
across all interest rate levels. As such, I carried over to page 2 of Schedule 13 19
the average large common stock returns of 12.11% (12.17% + 12.05% = 20
24.22% ÷ 2) and the average yield on long-term government bonds of 4.08% 21
(3.01% + 5.15% = 8.16% ÷ 2). These financial returns rest between those 22
experienced during periods of low interest rates and those experienced across 23

45
all levels of interest rates. The resulting market premium is 8.03% (12.11% - 1
4.08%) based on historical data, as shown on page 2 of Schedule 13. For the 2
forecast returns, I calculated a 10.88% total market return from the Value Line 3
data and a DCF return of 11.72% for the S&P 500. With the average forecast 4
return of 11.30% (10.88% + 11.72% = 22.60% ÷ 2), I calculated a market 5
premium of 7.55% (11.30% - 3.75%) using forecast data. The market 6
premium applicable to the CAPM derived from these sources equals 7.79% 7
(7.55% + 8.03% = 15.58% ÷ 2). 8
58. Q. What CAPM result have you determined? 9
A. Using the 3.75% risk-free rate of return, the leverage adjusted beta of 0.83 for 10
the Electric Group, and the 7.79% market premium, I derived the following 11
CAPM-indicated cost of equity: 12
Rf + ß x ( Rm-Rf ) = k
Electric Group 3.75% + 0.83 x ( 7.79% ) = 10.22%
X. COMPARABLE EARNINGS APPROACH 13
59. Q. How have you applied the Comparable Earnings approach in this case? 14
A. The Comparable Earnings approach determines the equity return based upon 15
results from non-regulated companies. It is the oldest of all rate of return 16
methods, having been around for about one-century. Because regulation is a 17
substitute for competitively determined prices, the returns realized by non-18

46
regulated firms with comparable risks to a public utility provide useful insight 1
into a fair rate of return. In order to identify the appropriate return, it is 2
necessary to analyze returns earned (or realized) by other firms within the 3
context of the Comparable Earnings standard. The firms selected for the 4
Comparable Earnings approach should be companies whose prices are not 5
subject to cost-based price ceilings (i.e., non-regulated firms) so that 6
circularity is avoided. 7
There are two avenues available to implement the Comparable 8
Earnings approach. One method involves the selection of another industry (or 9
industries) with comparable risks to the public utility in question, and the 10
results for all companies within that industry serve as a benchmark. The 11
second approach requires the selection of parameters that represent similar 12
risk traits for the public utility and the comparable risk companies. Using this 13
approach, the business lines of the comparable companies become 14
unimportant. The latter approach is preferable with the further qualification 15
that the comparable risk companies exclude regulated firms in order to avoid 16
the circular reasoning implicit in the use of the achieved earnings/book ratios 17
of other regulated firms. The United States Supreme Court has held that: 18
A public utility is entitled to such rates as will permit 19 it to earn a return on the value of the property which it 20 employs for the convenience of the public equal to 21 that generally being made at the same time and in the 22 same general part of the country on investments in 23 other business undertakings which are attended by 24 corresponding risks and uncertainties…. The return 25 should be reasonably sufficient to assure confidence 26 in the financial soundness of the utility and should be 27 adequate, under efficient and economical 28
47
management, to maintain and support its credit and 1 enable it to raise the money necessary for the proper 2 discharge of its public duties. Bluefield Water 3 Works vs. Public Service Commission, 262 U.S. 668 4 (1923). 5
It is important to identify the returns earned by firms that compete for capital 6
with a public utility. This can be accomplished by analyzing the returns of 7
non-regulated firms that are subject to the competitive forces of the 8
marketplace. 9
60. Q. How have you implemented the Comparable Earnings Approach? 10
A. In order to implement the Comparable Earnings approach, non-regulated 11
companies were selected from The Value Line Investment Survey for 12
Windows that have six categories of comparability designed to reflect the risk 13
of the Electric Group. These screening criteria were based upon the range as 14
defined by the rankings of the companies in the Electric Group. The items 15
considered were: Timeliness Rank, Safety Rank, Financial Strength, Price 16
Stability, Value Line betas, and Technical Rank. The definition for these 17
parameters is provided on page 3 of Schedule 14. The identities of the 18
companies comprising the Comparable Earnings group and their associated 19
rankings within the ranges are identified on page 1 of Schedule 14. 20
Value Line data was relied upon because it provides a 21
comprehensive basis for evaluating the risks of the comparable firms. As to 22
the returns calculated by Value Line for these companies, there is some 23
downward bias in the figures shown on page 2 of Schedule 14, because Value 24
Line computes the returns on year-end rather than average book value. If 25

48
average book values had been employed, the rates of return would have been 1
slightly higher. Nevertheless, these are the returns considered by investors 2
when taking positions in these stocks. Because many of the comparability 3
factors, as well as the published returns, are used by investors in selecting 4
stocks, and the fact that investors rely on the Value Line service to gauge 5
returns, it is an appropriate database for measuring comparable return 6
opportunities. 7
61. Q. What data have you used in your Comparable Earnings analysis? 8
A. I have used both historical realized returns and forecasted returns for non-9
utility companies. As noted previously, I have not used returns for utility 10
companies in order to avoid the circularity that arises from using regulatory-11
influenced returns to determine a regulated return. It is appropriate to 12
consider a relatively long measurement period in the Comparable Earnings 13
approach in order to cover conditions over an entire business cycle. A ten-14
year period (five historical years and five projected years) is sufficient to 15
cover an average business cycle. Unlike the DCF and CAPM, the results of 16
the Comparable Earnings method can be applied directly to the book value 17
capitalization. In other words, the Comparable Earnings approach does not 18
contain the potential misspecification contained in market models when the 19
market capitalization and book value capitalization diverge significantly. A 20
point of demarcation was chosen to eliminate the results of highly profitable 21
enterprises, which the Bluefield case stated were not the type of returns that a 22
utility was entitled to earn. For this purpose, I used 20% as the point where 23

49
those returns could be viewed as highly profitable and should be excluded 1
from the Comparable Earnings approach. The historical rate of return on 2
book common equity was 11.4% using only the returns that were less than 3
20%, as shown on page 2 of Schedule 14. The forecast rates of return as 4
published by Value Line are shown by the 12.9% also using values less than 5
20%, as provided on page 2 of Schedule 14. Using these data my Comparable 6
Earnings result is 12.15%, as shown on page 2 of Schedule 1. 7
XI. CONCLUSION ON COST OF EQUITY 8
62. Q. What is your conclusion regarding the Company's cost of common 9
equity? 10
A. Based upon the application of the variety of methods and models described 11
previously, I recommend that the Commission set the Company's rate of 12
return on common equity at 10.95%. The proposed rate of return on common 13
equity of 10.95%, which rate near the top of the 10.60% to 10.99% range, 14
would provide recognition of the exemplary performance of the Company's 15
management and the high quality of service provided to its customers. It is 16
essential that the Commission employ a variety of techniques to measure the 17
Company's cost of equity because of the limitations/infirmities that are 18
inherent in each method. 19
63. Q. Does this conclude your direct testimony at this time? 20
A. Yes, it does. 21

APPENDIX A TO DIRECT TESTIMONY OF PAUL R. MOUL
A-1
EDUCATIONAL BACKGROUND, BUSINESS EXPERIENCE AND QUALIFICATIONS
I was awarded a degree of Bachelor of Science in Business Administration by
Drexel University in 1971. While at Drexel, I participated in the Cooperative Education
Program which included employment, for one year, with American Water Works Service
Company, Inc., as an internal auditor, where I was involved in the audits of several
operating water companies of the American Water Works System and participated in the
preparation of annual reports to regulatory agencies and assisted in other general
accounting matters.
Upon graduation from Drexel University, I was employed by American Water
Works Service Company, Inc., in the Eastern Regional Treasury Department where my
duties included preparation of rate case exhibits for submission to regulatory agencies, as
well as responsibility for various treasury functions of the thirteen New England
operating subsidiaries.
In 1973, I joined the Municipal Financial Services Department of Betz
Environmental Engineers, a consulting engineering firm, where I specialized in financial
studies for municipal water and wastewater systems.
In 1974, I joined Associated Utility Services, Inc., now known as AUS
Consultants. I held various positions with the Utility Services Group of AUS
Consultants, concluding my employment there as a Senior Vice President.
In 1994, I formed P. Moul & Associates, an independent financial and regulatory
consulting firm. In my capacity as Managing Consultant and for the past twenty-nine
years, I have continuously studied the rate of return requirements for cost of service-

APPENDIX A TO DIRECT TESTIMONY OF PAUL R. MOUL
A-2
regulated firms. In this regard, I have supervised the preparation of rate of return studies,
which were employed, in connection with my testimony and in the past for other
individuals. I have presented direct testimony on the subject of fair rate of return,
evaluated rate of return testimony of other witnesses, and presented rebuttal testimony.
My studies and prepared direct testimony have been presented before thirty-seven
(37) federal, state and municipal regulatory commissions, consisting of: the Federal
Energy Regulatory Commission; state public utility commissions in Alabama, Alaska,
California, Colorado, Connecticut, Delaware, Florida, Georgia, Hawaii, Illinois, Indiana,
Iowa, Kentucky, Louisiana, Maine, Maryland, Massachusetts, Michigan, Minnesota,
Missouri, New Hampshire, New Jersey, New York, North Carolina, Ohio, Oklahoma,
Pennsylvania, Rhode Island, South Carolina, Tennessee, Texas, Virginia, West Virginia,
Wisconsin, and the Philadelphia Gas Commission, and the Texas Commission on
Environmental Quality. My testimony has been offered in over 200 rate cases involving
electric power, natural gas distribution and transmission, resource recovery, solid waste
collection and disposal, telephone, wastewater, and water service utility companies.
While my testimony has involved principally fair rate of return and financial matters, I
have also testified on capital allocations, capital recovery, cash working capital, income
taxes, factoring of accounts receivable, and take-or-pay expense recovery. My testimony
has been offered on behalf of municipal and investor-owned public utilities and for the
staff of a regulatory commission. I have also testified at an Executive Session of the
State of New Jersey Commission of Investigation concerning the BPU regulation of solid
waste collection and disposal.

APPENDIX A TO DIRECT TESTIMONY OF PAUL R. MOUL
A-3
I was a co-author of a verified statement submitted to the Interstate Commerce
Commission concerning the 1983 Railroad Cost of Capital (Ex Parte No. 452). I was
also co-author of comments submitted to the Federal Energy Regulatory Commission
regarding the Generic Determination of Rate of Return on Common Equity for Public
Utilities in 1985, 1986 and 1987 (Docket Nos. RM85-19-000, RM86-12-000, RM87-35-
000 and RM88-25-000). Further, I have been the consultant to the New York Chapter of
the National Association of Water Companies, which represented the water utility group
in the Proceeding on Motion of the Commission to Consider Financial Regulatory
Policies for New York Utilities (Case 91-M-0509). I have also submitted comments to
the Federal Energy Regulatory Commission in its Notice of Proposed Rulemaking
(Docket No. RM99-2-000) concerning Regional Transmission Organizations and on
behalf of the Edison Electric Institute in its intervention in the case of Southern California
Edison Company (Docket No. ER97-2355-000). Also, I was a member of the panel of
participants at the Technical Conference in Docket No. PL07-2 on the Composition of
Proxy Groups for Determining Gas and Oil Pipeline Return on Equity.
In late 1978, I arranged for the private placement of bonds on behalf of an
investor-owned public utility. I have assisted in the preparation of a report to the
Delaware Public Service Commission relative to the operations of the Lincoln and
Ellendale Electric Company. I was also engaged by the Delaware P.S.C. to review and
report on the proposed financing and disposition of certain assets of Sussex Shores Water
Company (P.S.C. Docket Nos. 24-79 and 47-79). I was a co-author of a Report on
Proposed Mandatory Solid Waste Collection Ordinance prepared for the Board of County
Commissioners of Collier County, Florida.

APPENDIX A TO DIRECT TESTIMONY OF PAUL R. MOUL
A-4
I have been a consultant to the Bucks County Water and Sewer Authority
concerning rates and charges for wholesale contract service with the City of Philadelphia.
My municipal consulting experience also included an assignment for Baltimore County,
Maryland, regarding the City/County Water Agreement for Metropolitan District
customers (Circuit Court for Baltimore County in Case 34/153/87-CSP-2636).