Embed Size (px)
Citation preview
8/17/2019 Beer Industry Draft Beer Update - 2012
http://slidepdf.com/reader/full/beer-industry-draft-beer-update-2012 1/17
Beer Institute Research
Washington, DC
Draft Beer Industry Update, 2012
Lester Jones
Chief Economist
Beer Institute, Washington, DC
8/17/2019 Beer Industry Draft Beer Update - 2012
http://slidepdf.com/reader/full/beer-industry-draft-beer-update-2012 2/17
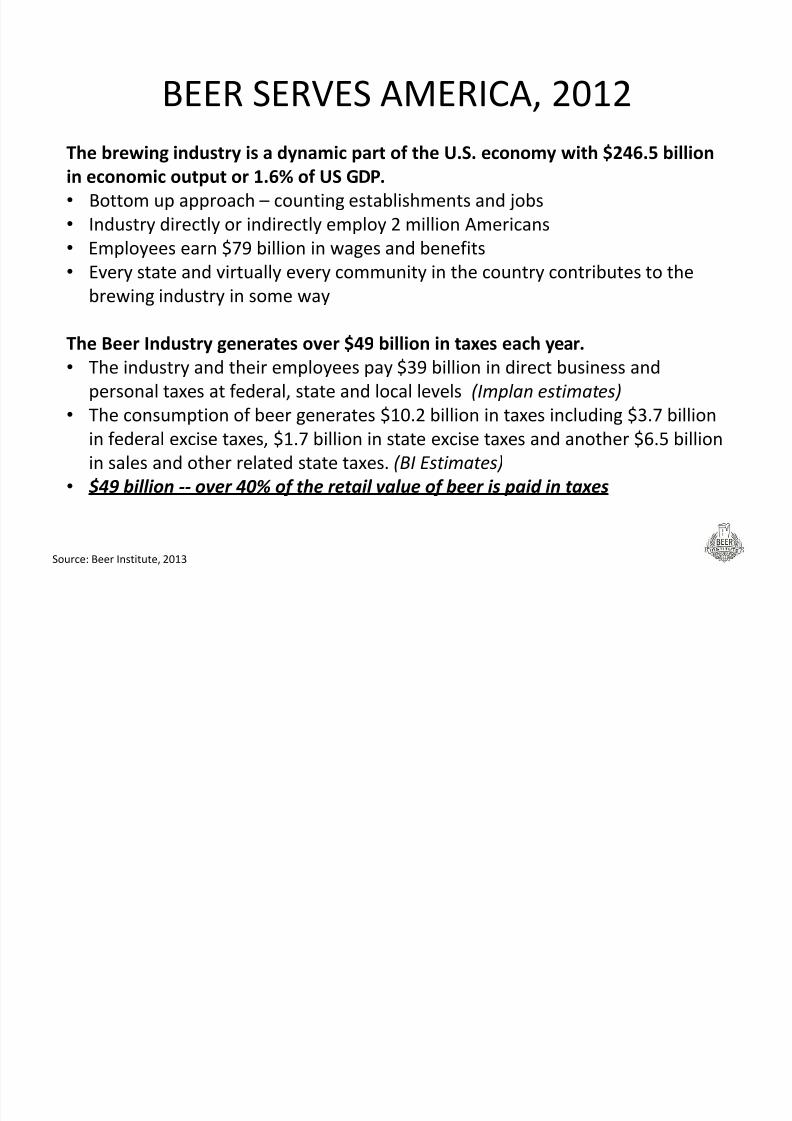
The
brewing
industry
is
a
dynamic
part
of
the
U.S.
economy
with
$246.5
billion
in
economic
output
or
1.6%
of
US
GDP.
• Bottom up approach – counting establishments and jobs
• Industry directly or indirectly employ 2 million Americans
• Employees earn $79 billion in wages and benefits
• Every state and virtually every community in the country contributes to the
brewing industry in some way
The
Beer
Industry
generates
over
$49
billion
in
taxes
each
year.
• The industry and their employees pay $39 billion in direct business and
personal taxes at federal, state and local levels (Implan estimates)
• The consumption of beer generates $10.2 billion in taxes including $3.7 billion
in federal excise taxes, $1.7 billion in state excise taxes and another $6.5 billion
in sales and other related state taxes. (BI Estimates)
• $49 billion ‐‐ over 40% of the retail value of beer is paid in taxes
BEER
SERVES
AMERICA,
2012
Source: Beer Institute, 2013
8/17/2019 Beer Industry Draft Beer Update - 2012
http://slidepdf.com/reader/full/beer-industry-draft-beer-update-2012 3/17
Drops of
Draft
Beer
Trivia
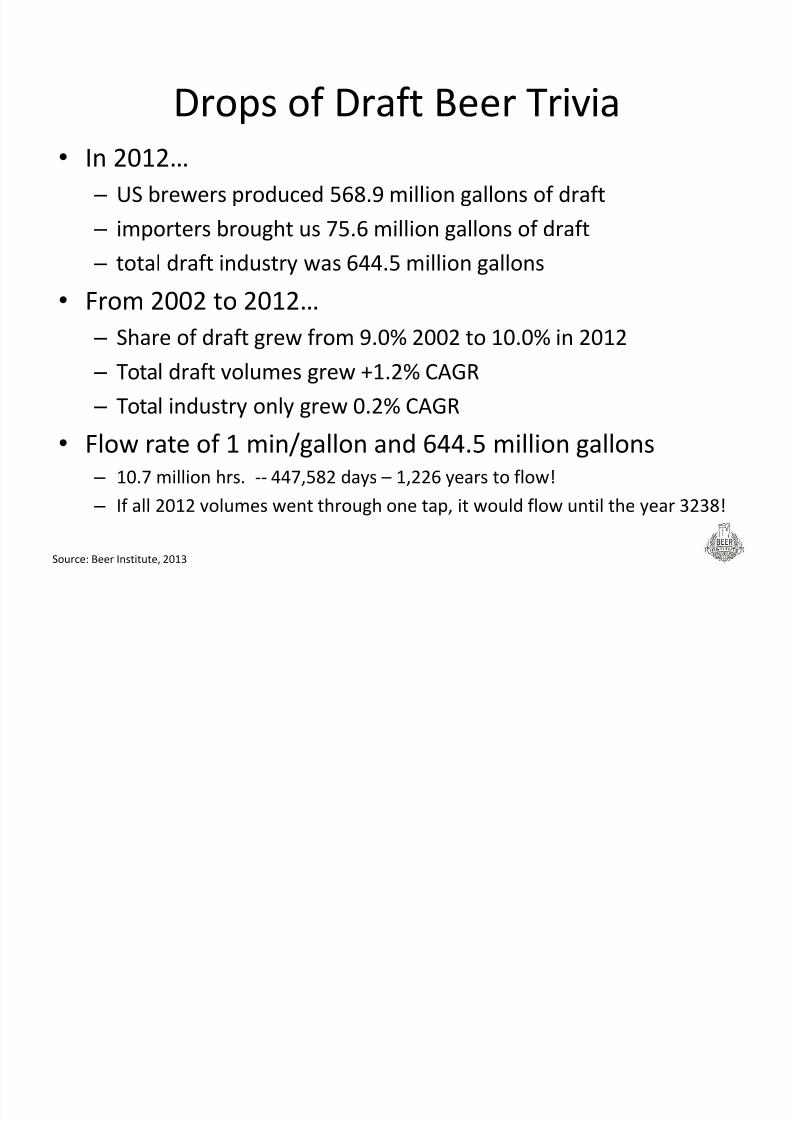
• In 2012…
– US brewers produced 568.9 million gallons of draft
– importers brought us 75.6 million gallons of draft
– total draft industry was 644.5 million gallons
• From 2002 to 2012…
– Share of draft grew from 9.0% 2002 to 10.0% in 2012
– Total draft volumes grew +1.2% CAGR
– Total industry only grew 0.2% CAGR
• Flow rate of 1 min/gallon and 644.5 million gallons – 10.7 million hrs. ‐‐ 447,582 days – 1,226 years to flow!
– If all 2012 volumes went through one tap, it would flow until the year 3238!
Source: Beer Institute, 2013
8/17/2019 Beer Industry Draft Beer Update - 2012
http://slidepdf.com/reader/full/beer-industry-draft-beer-update-2012 4/17
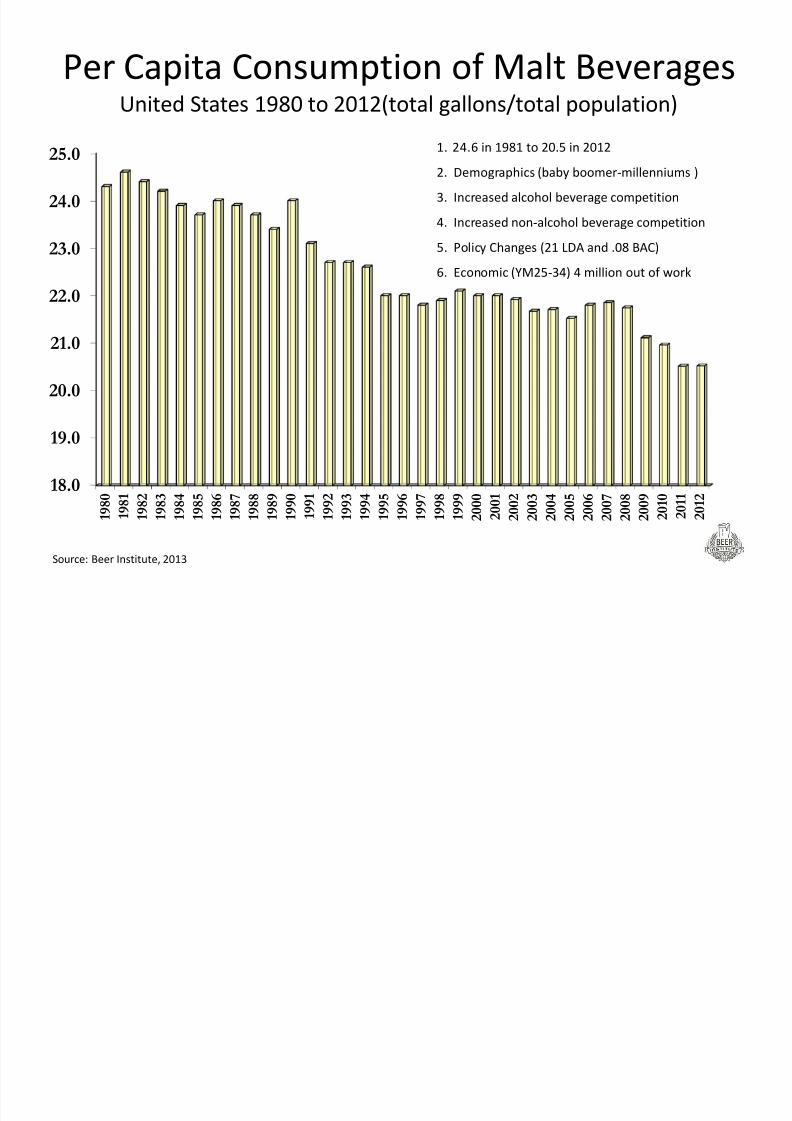
Per Capita Consumption of Malt Beverages
United States
1980
to
2012(total
gallons/total
population)
18.0
19.0
20.0
21.0
22.0
23.0
24.0
25.0
1 9 8 0
1 9 8 1
1 9 8 2
1 9 8 3
1 9 8 4
1 9 8 5
1 9 8 6
1 9 8 7
1 9 8 8
1 9 8 9
1 9 9 0
1 9 9 1
1 9 9 2
1 9 9 3
1 9 9 4
1 9 9 5
1 9 9 6
1 9 9 7
1 9 9 8
1 9 9 9
2 0 0 0
2 0 0 1
2 0 0 2
2 0 0 3
2 0 0 4
2 0 0 5
2 0 0 6
2 0 0 7
2 0 0 8
2 0 0 9
2 0 1 0
2 0 1 1
2 0 1 2
1. 24.6 in 1981 to 20.5 in 2012
2. Demographics (baby boomer‐millenniums )
3. Increased alcohol beverage competition
4. Increased non‐alcohol beverage competition
5. Policy Changes (21 LDA and .08 BAC)
6. Economic (YM25‐34) 4 million out of work
Source: Beer Institute, 2013
8/17/2019 Beer Industry Draft Beer Update - 2012
http://slidepdf.com/reader/full/beer-industry-draft-beer-update-2012 5/17
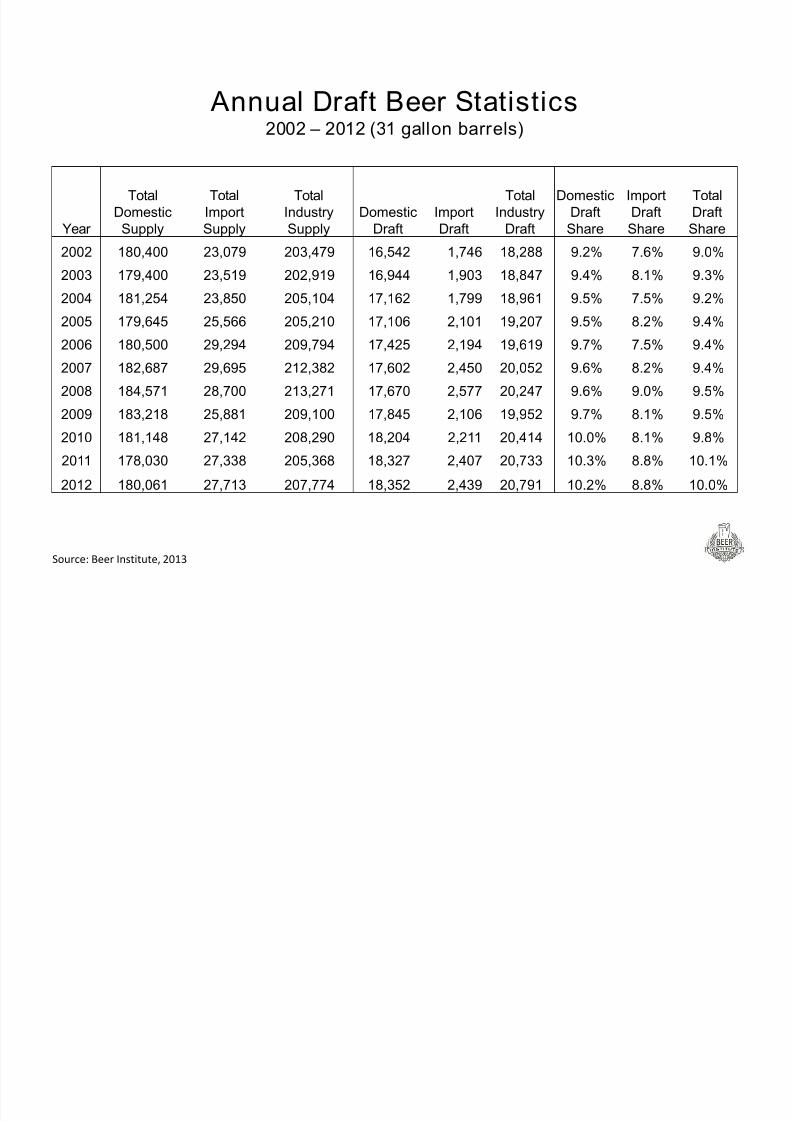
Annual Draft Beer Statistics2002 – 2012 (31 gallon barrels)
Year
Total
DomesticSupply
Total
ImportSupply
Total
IndustrySupply
DomesticDraft
ImportDraft
Total
IndustryDraft
Domestic
DraftShare
Import
DraftShare
Total
DraftShare
2002 180,400 23,079 203,479 16,542 1,746 18,288 9.2% 7.6% 9.0%
2003 179,400 23,519 202,919 16,944 1,903 18,847 9.4% 8.1% 9.3%
2004 181,254 23,850 205,104 17,162 1,799 18,961 9.5% 7.5% 9.2%
2005 179,645 25,566 205,210 17,106 2,101 19,207 9.5% 8.2% 9.4%
2006 180,500 29,294 209,794 17,425 2,194 19,619 9.7% 7.5% 9.4%
2007 182,687 29,695 212,382 17,602 2,450 20,052 9.6% 8.2% 9.4%
2008 184,571 28,700 213,271 17,670 2,577 20,247 9.6% 9.0% 9.5%
2009 183,218 25,881 209,100 17,845 2,106 19,952 9.7% 8.1% 9.5%
2010 181,148 27,142 208,290 18,204 2,211 20,414 10.0% 8.1% 9.8%
2011 178,030 27,338 205,368 18,327 2,407 20,733 10.3% 8.8% 10.1%
2012 180,061 27,713 207,774 18,352 2,439 20,791 10.2% 8.8% 10.0%
Source: Beer Institute, 2013
8/17/2019 Beer Industry Draft Beer Update - 2012
http://slidepdf.com/reader/full/beer-industry-draft-beer-update-2012 6/17
0
50
100
150
200
1 9 5 0
1 9 5 2
1 9 5 4
1 9 5 6
1 9 5 8
1 9 6 0
1 9 6 2
1 9 6 4
1 9 6 6
1 9 6 8
1 9 7 0
1 9 7 2
1 9 7 4
1 9 7 6
1 9 7 8
1 9 8 0
1 9 8 2
1 9 8 4
1 9 8 6
1 9 8 8
1 9 9 0
1 9 9 2
1 9 9 4
1 9 9 6
1 9 9 8
2 0 0 0
2 0 0 2
2 0 0 4
2 0 0 6
2 0 0 8
2 0 1 0
2 0 1 2
M i l l i o n s o
f B a r r e l s
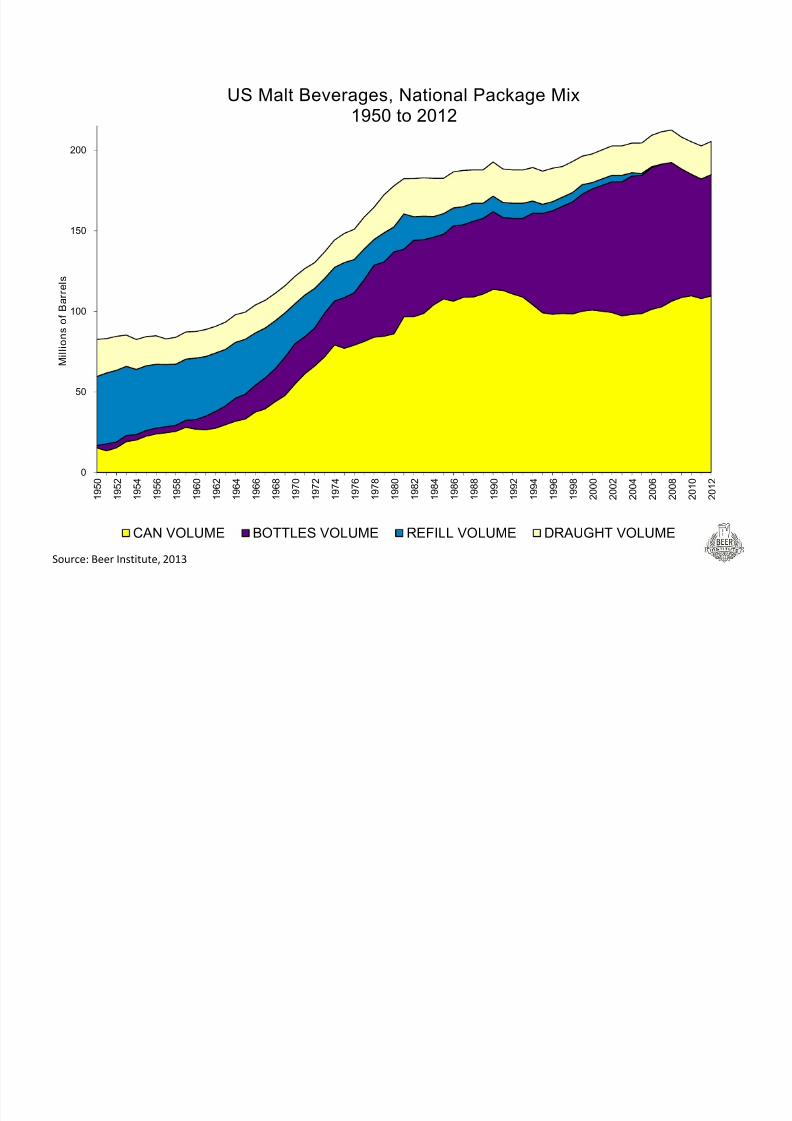
US Malt Beverages, National Package Mix1950 to 2012
CAN VOLUME BOTTLES VOLUME REFILL VOLUME DRAUGHT VOLUME
Source: Beer Institute, 2013
8/17/2019 Beer Industry Draft Beer Update - 2012
http://slidepdf.com/reader/full/beer-industry-draft-beer-update-2012 7/17
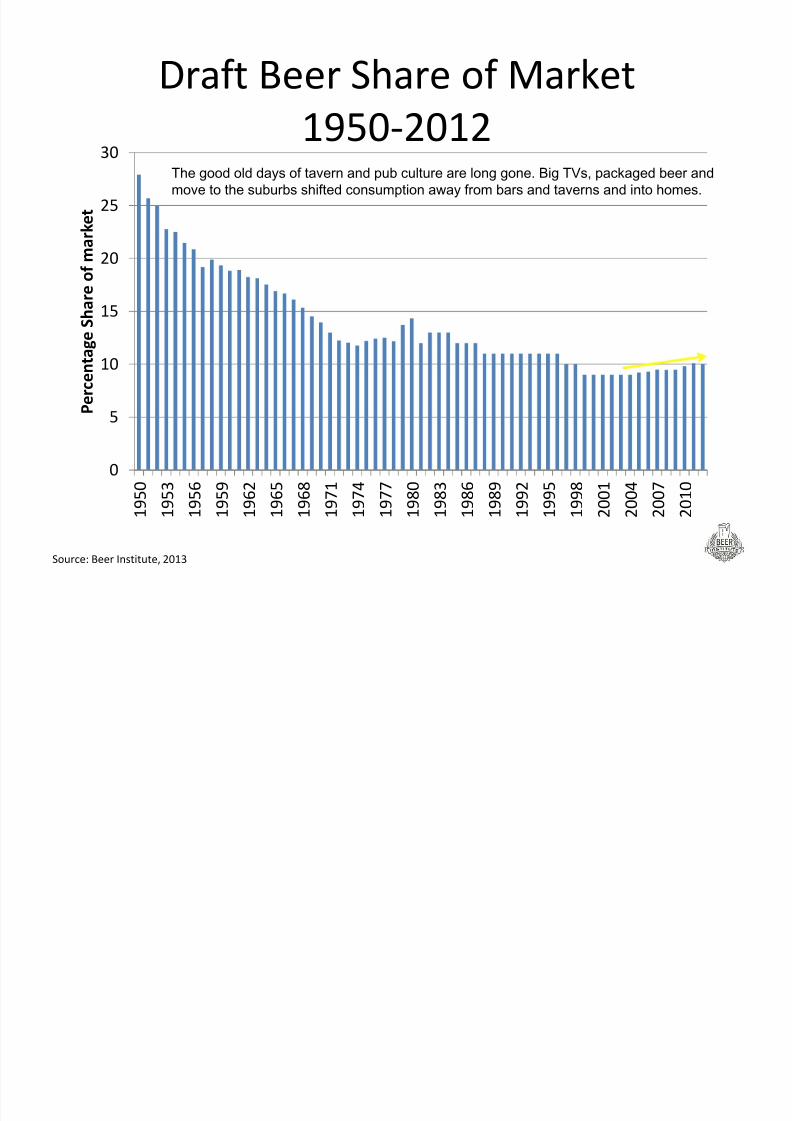
Draft Beer Share of Market
1950‐2012
0
5
10
15
20
25
30
1 9 5 0
1 9 5 3
1 9 5 6
1 9 5 9
1 9 6 2
1 9 6 5
1 9 6 8
1 9 7 1
1 9 7 4
1 9 7 7
1 9 8 0
1 9 8 3
1 9 8 6
1 9 8 9
1 9 9 2
1 9 9 5
1 9 9 8
2 0 0 1
2 0 0 4
2 0 0 7
2 0 1 0
P e r c e n t a g e S h a r e o f m a r k e t
The good old days of tavern and pub culture are long gone. Big TVs, packaged beer and
move to the suburbs shifted consumption away from bars and taverns and into homes.
Source: Beer Institute, 2013
8/17/2019 Beer Industry Draft Beer Update - 2012
http://slidepdf.com/reader/full/beer-industry-draft-beer-update-2012 8/17
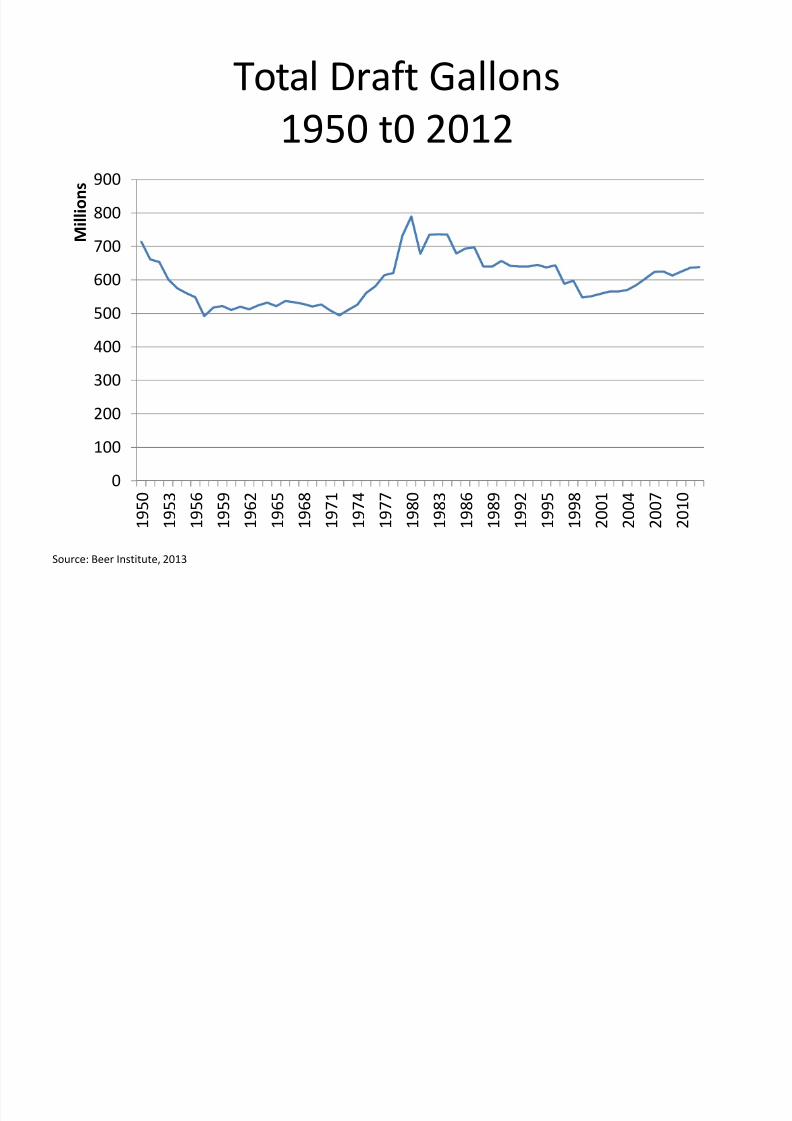
Total Draft Gallons
1950 t0
2012
0
100
200
300
400500
600
700
800
900
1 9 5 0
1 9 5 3
1 9 5 6
1 9 5 9
1 9 6 2
1 9 6 5
1 9 6 8
1 9 7 1
1 9 7 4
1 9 7 7
1 9 8 0
1 9 8 3
1 9 8 6
1 9 8 9
1 9 9 2
1 9 9 5
1 9 9 8
2 0 0 1
2 0 0 4
2 0 0 7
2 0 1 0
M i l l i o n s
Source: Beer Institute, 2013
8/17/2019 Beer Industry Draft Beer Update - 2012
http://slidepdf.com/reader/full/beer-industry-draft-beer-update-2012 9/17
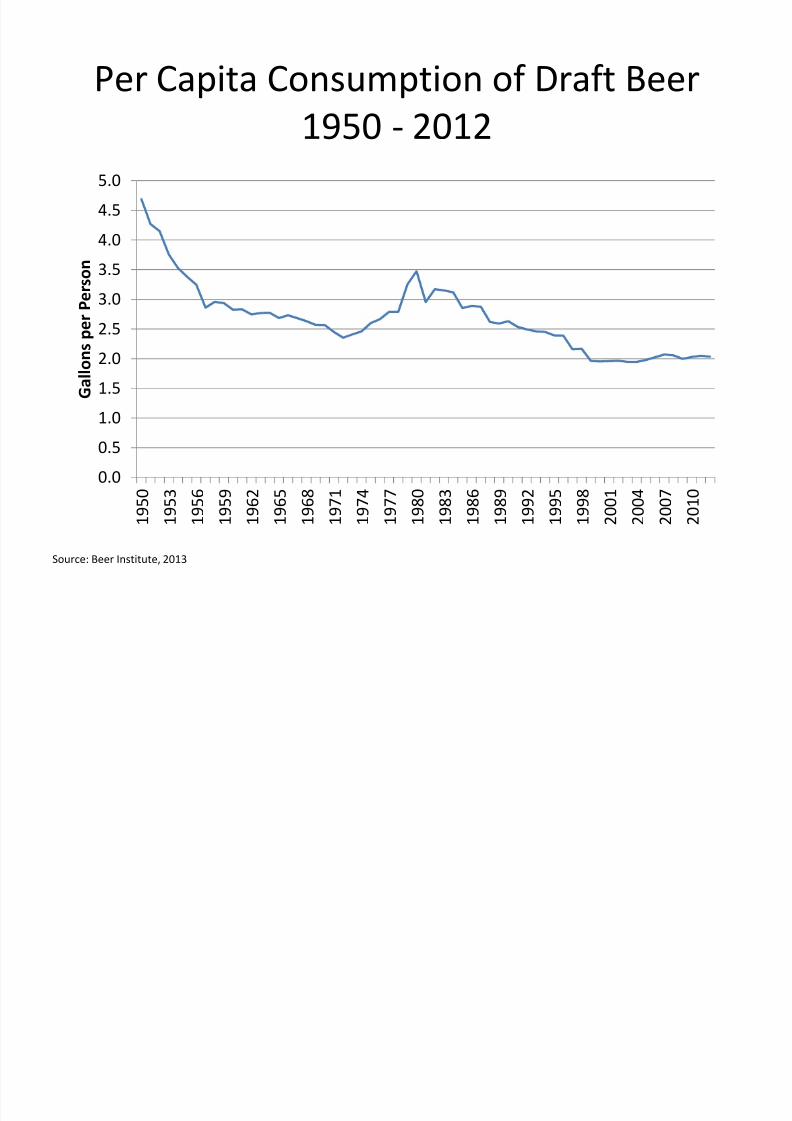
Per Capita Consumption of Draft Beer
1950 ‐
2012
0.0
0.5
1.0
1.5
2.0
2.5
3.0
3.5
4.04.5
5.0
1 9 5 0
1 9 5 3
1 9 5 6
1 9 5 9
1 9 6 2
1 9 6 5
1 9 6 8
1 9 7 1
1 9 7 4
1 9 7 7
1 9 8 0
1 9 8 3
1 9 8 6
1 9 8 9
1 9 9 2
1 9 9 5
1 9 9 8
2 0 0 1
2 0 0 4
2 0 0 7
2 0 1 0
G a l l o n s p e r P e r s o n
Source: Beer Institute, 2013

8/17/2019 Beer Industry Draft Beer Update - 2012
http://slidepdf.com/reader/full/beer-industry-draft-beer-update-2012 10/17
Growing US Draft Share
2002 ‐
2012
7.0%
7.5%
8.0%
8.5%
9.0%
9.5%
10.0%
10.5%
2002 2003 2004 2005 2006 2007 2008 2009 2010 2011 2012
Imports Domestic Total
Holding steady at 10 share in 2012.
Source: Beer Institute, TTB and US Dept. of Commerce 2013.
8/17/2019 Beer Industry Draft Beer Update - 2012
http://slidepdf.com/reader/full/beer-industry-draft-beer-update-2012 11/17
Source: TTB and Beer Institute, 2013
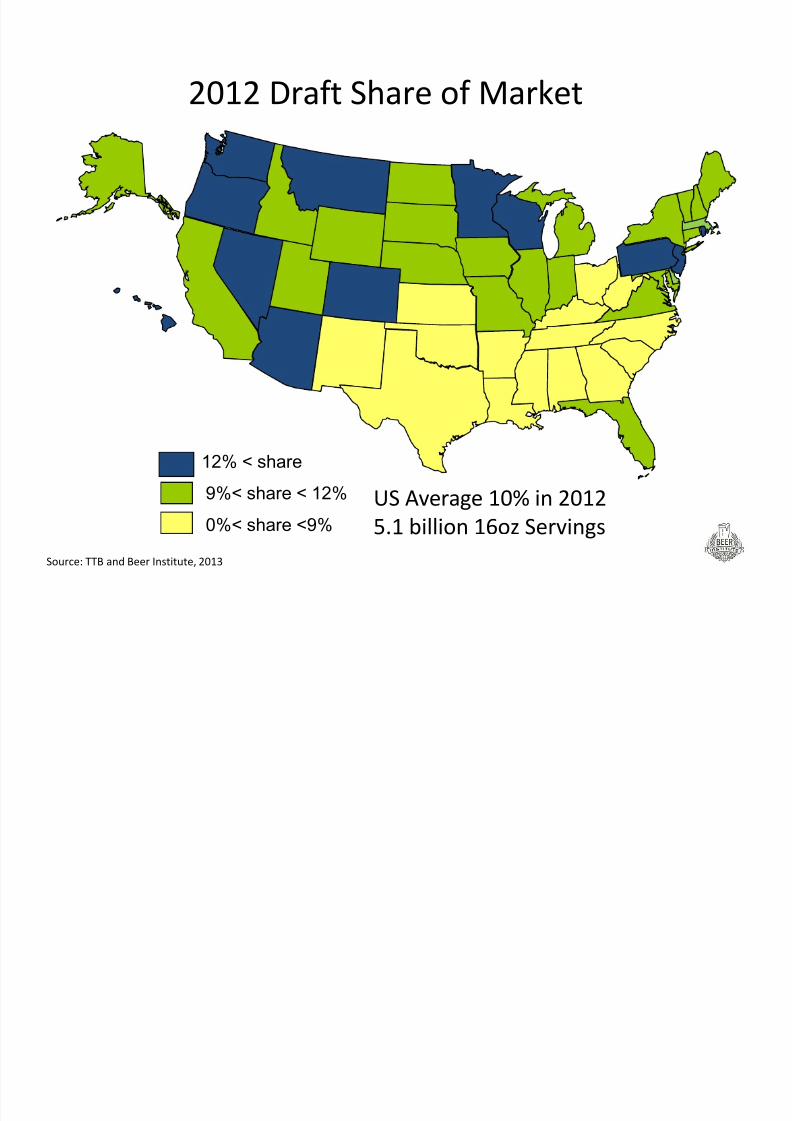
12% < share
2012
Draft
Share
of
Market
9%< share < 12%
0%< share <9%
US Average 10% in 2012
5.1
billion
16oz
Servings
8/17/2019 Beer Industry Draft Beer Update - 2012
http://slidepdf.com/reader/full/beer-industry-draft-beer-update-2012 12/17
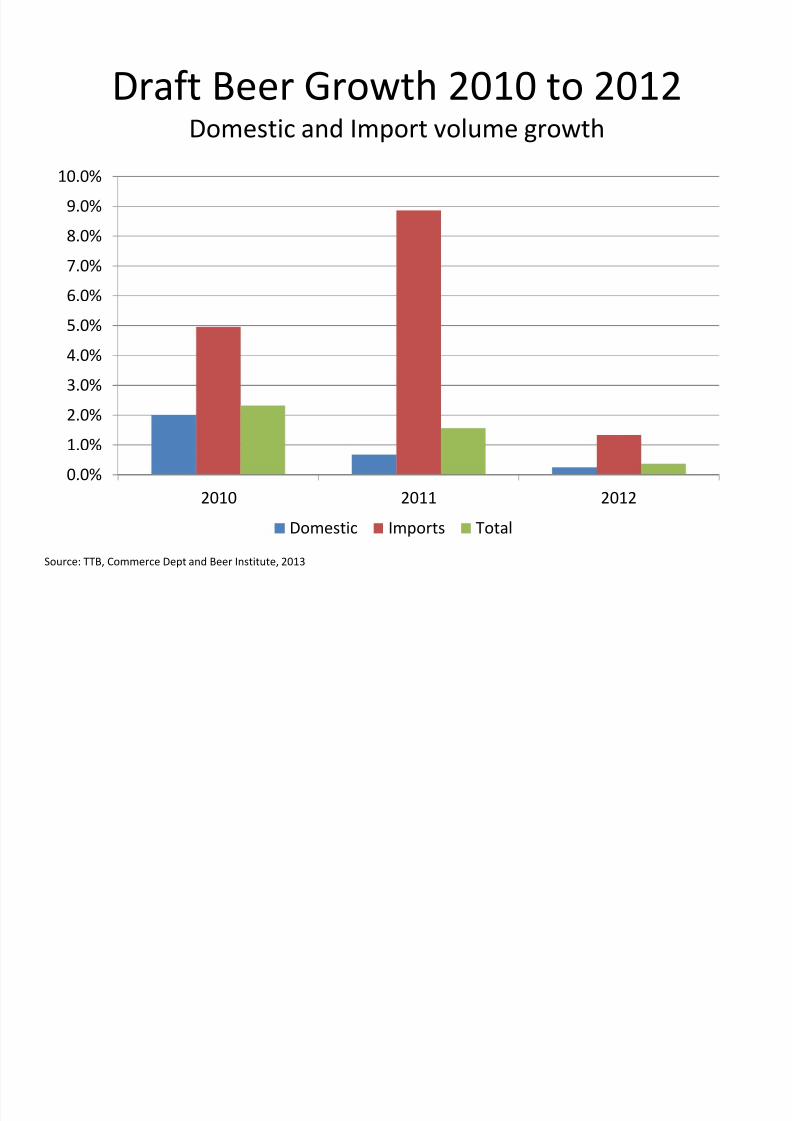
Draft Beer Growth 2010 to 2012Domestic and Import volume growth
0.0%
1.0%
2.0%
3.0%
4.0%
5.0%
6.0%
7.0%
8.0%
9.0%
10.0%
2010 2011 2012
Domestic Imports TotalSource: TTB, Commerce Dept and Beer Institute, 2013
8/17/2019 Beer Industry Draft Beer Update - 2012
http://slidepdf.com/reader/full/beer-industry-draft-beer-update-2012 13/17
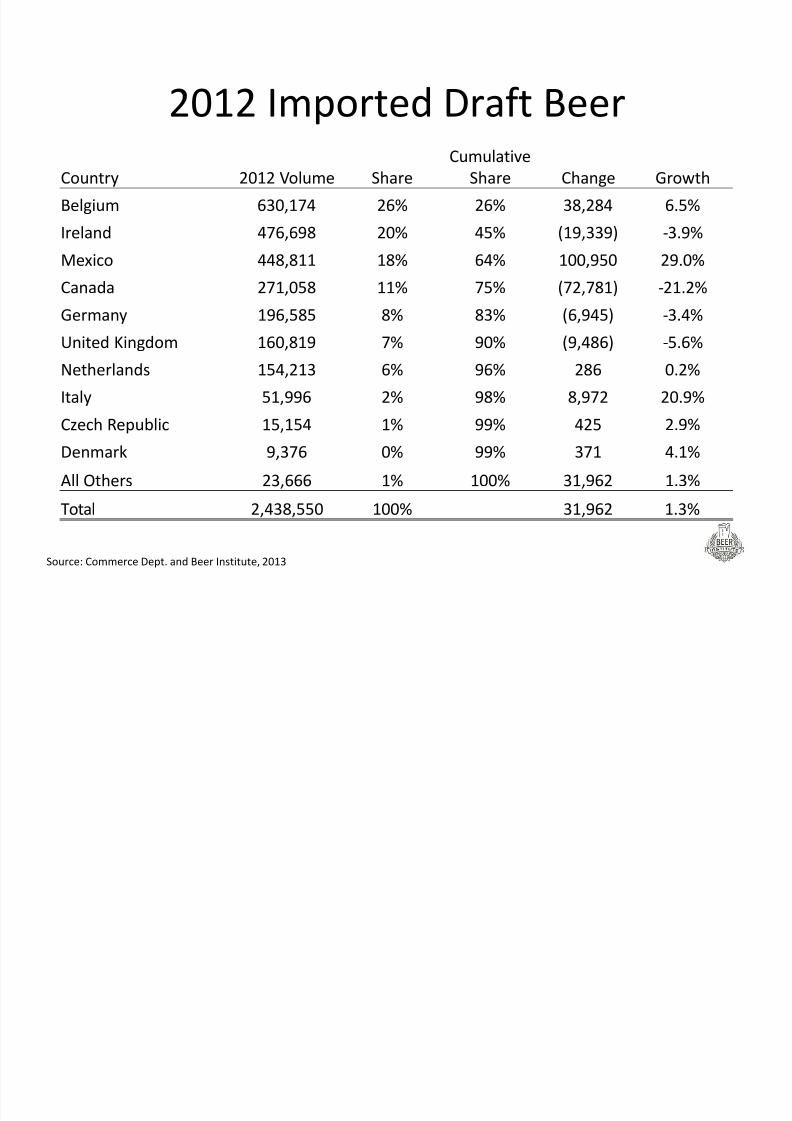
2012 Imported
Draft
Beer
Country 2012 Volume Share
Cumulative
Share Change Growth
Belgium 630,174 26% 26% 38,284 6.5%
Ireland 476,698 20% 45% (19,339) ‐3.9%
Mexico 448,811 18% 64% 100,950 29.0%
Canada 271,058 11% 75% (72,781) ‐21.2%
Germany 196,585
8% 83% (6,945) ‐
3.4%United Kingdom 160,819 7% 90% (9,486) ‐5.6%
Netherlands 154,213 6% 96% 286 0.2%
Italy 51,996 2% 98% 8,972 20.9%
Czech Republic 15,154
1% 99% 425
2.9%
Denmark 9,376 0% 99% 371 4.1%
All Others 23,666 1% 100% 31,962 1.3%
Total 2,438,550 100% 31,962 1.3%
Source: Commerce Dept. and Beer Institute, 2013
8/17/2019 Beer Industry Draft Beer Update - 2012
http://slidepdf.com/reader/full/beer-industry-draft-beer-update-2012 14/17
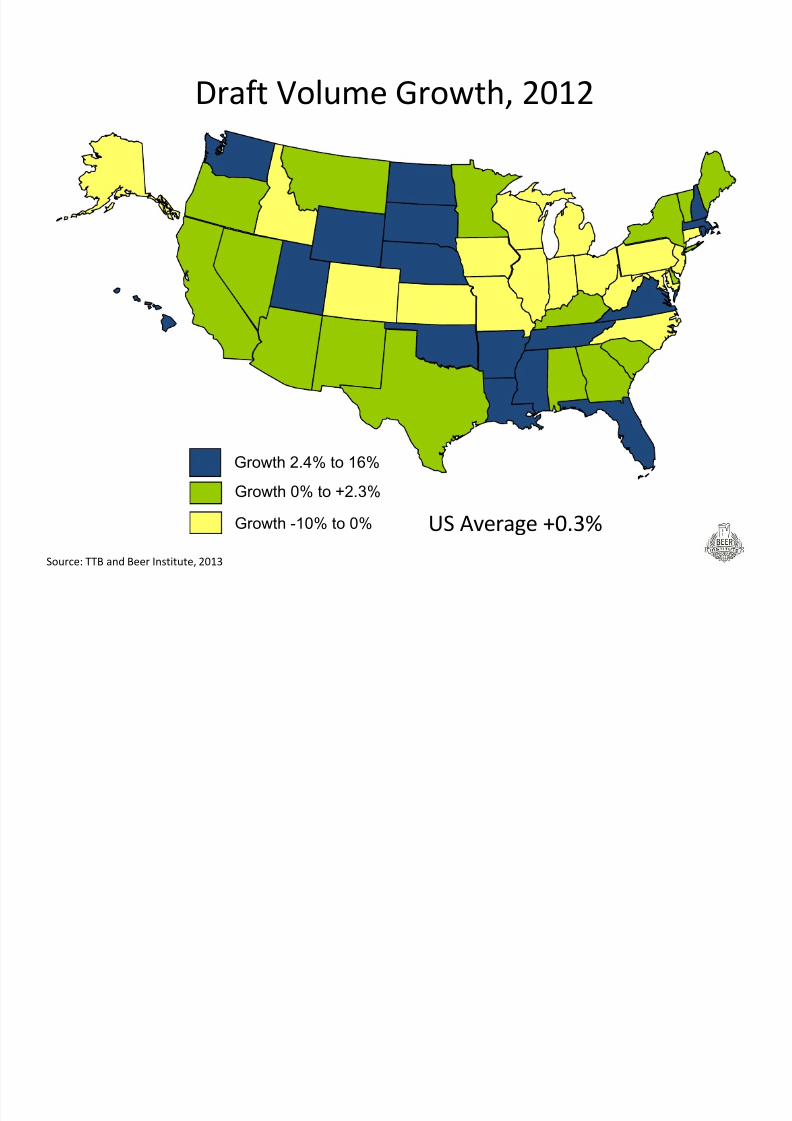
Source: TTB and Beer Institute, 2013
Growth 2.4% to 16%
Draft
Volume
Growth,
2012
Growth 0% to +2.3%
Growth -10% to 0% US Average +0.3%
8/17/2019 Beer Industry Draft Beer Update - 2012
http://slidepdf.com/reader/full/beer-industry-draft-beer-update-2012 15/17
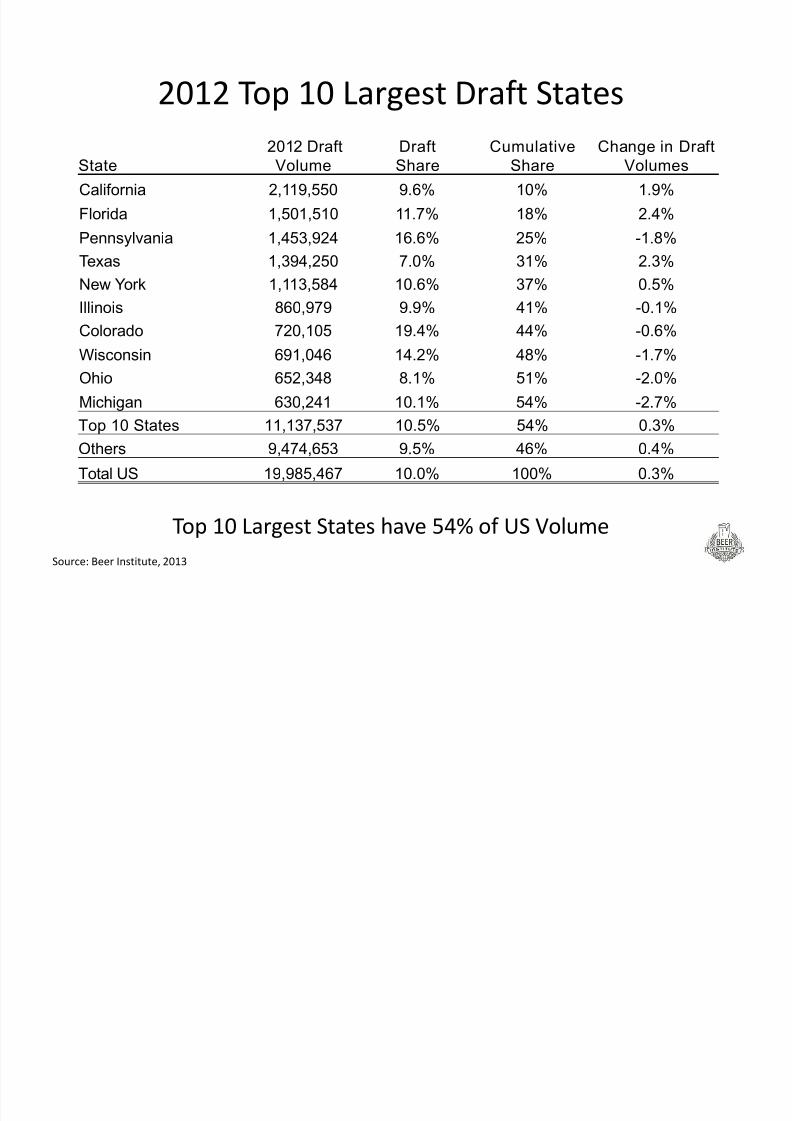
2012
Top
10
Largest
Draft
States
Top
10
Largest
States
have
54%
of
US
Volume
Source: Beer Institute, 2013
State
2012 Draft
Volume
Draft
Share
Cumulative
Share
Change in Draft
Volumes
California 2,119,550 9.6% 10% 1.9%
Florida 1,501,510 11.7% 18% 2.4%Pennsylvania 1,453,924 16.6% 25% -1.8%
Texas 1,394,250 7.0% 31% 2.3%
New York 1,113,584 10.6% 37% 0.5%
Illinois 860,979 9.9% 41% -0.1%
Colorado 720,105 19.4% 44% -0.6%
Wisconsin 691,046 14.2% 48% -1.7%
Ohio 652,348 8.1% 51% -2.0%
Michigan 630,241 10.1% 54% -2.7%
Top 10 States 11,137,537 10.5% 54% 0.3%Others 9,474,653 9.5% 46% 0.4%
Total US 19,985,467 10.0% 100% 0.3%
8/17/2019 Beer Industry Draft Beer Update - 2012
http://slidepdf.com/reader/full/beer-industry-draft-beer-update-2012 16/17
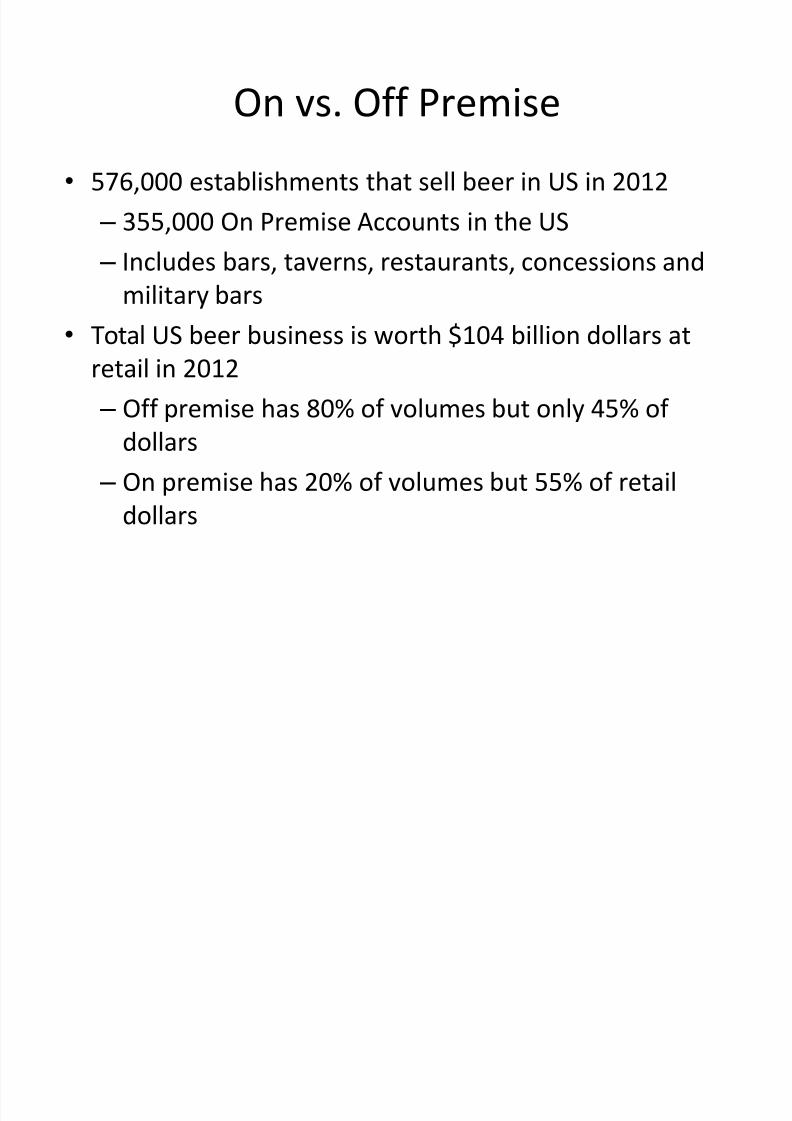
On vs.
Off
Premise
• 576,000 establishments that sell beer in US in 2012
– 355,000 On
Premise
Accounts
in
the
US
– Includes bars, taverns, restaurants, concessions and
military bars
• Total US
beer
business
is
worth
$104
billion
dollars
at
retail in 2012
– Off premise has 80% of volumes but only 45% of
dollars
– On premise has 20% of volumes but 55% of retail
dollars
8/17/2019 Beer Industry Draft Beer Update - 2012
http://slidepdf.com/reader/full/beer-industry-draft-beer-update-2012 17/17
Thank You
Lester Jones
Chief Economist
Beer Institute, Washington, DC