Embed Size (px)
Citation preview
ISeCureThe ISC Int'l Journal ofInformation Security
January 2012, Volume 4, Number 1 (pp. 25–39)
http://www.isecure-journal.org
BeeID: IntrusionDetection in AODV-basedMANETsUsing
Artificial Bee Colony andNegative SelectionAlgorithmsI
Fatemeh Barani 1 and Mahdi Abadi 1,∗1Faculty of Electrical and Computer Engineering, Tarbiat Modares University, Tehran, Iran
A R T I C L E I N F O.
Article history:
Received: 14 November 2011
Revised: 30 January 2012
Accepted: 31 January 2012
Published Online: 30 May 2012
Keywords:
Mobile Ad Hoc Network, RoutingAttack, Intrusion Detection,
Artificial Bee Colony, NegativeSelection, Monte Carlo Integration.
A B S T R A C T
Mobile ad hoc networks (MANETs) are multi-hop wireless networks of
mobile nodes constructed dynamically without the use of any fixed network
infrastructure. Due to inherent characteristics of these networks, malicious
nodes can easily disrupt the routing process. A traditional approach to detect
such malicious network activities is to build a profile of the normal network
traffic, and then identify an activity as suspicious if it deviates from this profile.
As the topology of a MANET constantly changes over time, the simple use
of a static profile is not efficient. In this paper, we present a dynamic hybrid
approach based on the artificial bee colony (ABC) and negative selection (NS)
algorithms, called BeeID, for intrusion detection in AODV-based MANETs.
The approach consists of three phases: training, detection, and updating. In the
training phase, a niching artificial bee colony algorithm, called NicheNABC,
runs a negative selection algorithm multiple times to generate a set of mature
negative detectors to cover the nonself space. In the detection phase, mature
negative detectors are used to discriminate between normal and malicious
network activities. In the updating phase, the set of mature negative detectors
is updated by one of two methods of partial updating or total updating. We
use the Monte Carlo integration to estimate the amount of the nonself space
covered by negative detectors and to determine when the total updating should
be done. We demonstrate the effectiveness of BeeID for detecting several
types of routing attacks on AODV-based MANETs simulated using the NS2
simulator. The experimental results show that BeeID can achieve a better
tradeoff between detection rate and false-alarm rate as compared to other
dynamic approaches previously reported in the literature.
c© 2012 ISC. All rights reserved.
I This article is an extended/revised version of an ISCISC’11paper.∗ Corresponding author.
Email addresses: [email protected] (F.Barani), [email protected] (M. Abadi).
ISSN: 2008-2045 c© 2012 ISC. All rights reserved.
1 Introduction
Mobile ad hoc networks (MANETs) are self-organizednetworks of wireless mobile nodes that communicatewith each other without the use of any fixed networkinfrastructure or centralized administration [1]. Everymobile node runs a common routing protocol suchas AODV and acts both as a terminal and a router,
ISeCure
26 BeeID: Intrusion Detection in AODV-based MANETs Using . . . — F. Barani and M. Abadi
forwarding packets from one node to another. Ad hocon-demand distance vector (AODV) [2] is a reactiverouting protocol that tries to minimize the require-ments of broadcast during a route discovery process.
MANETs can be described as open networks withhighly dynamic and constantly changing topology. Anymobile node with the proper hardware and enoughknowledge of routing protocols is able to connect tothem. These networks are suitable for applications inwhich no fixed network infrastructure exists, such asmilitary battlefield, emergency rescue, and vehicularcommunications [3].
Due to inherent characteristics of MANETs, It isdifficult to guarantee the correct execution of a routingprotocol by all nodes. A malicious node can easilylisten to the network traffic and launch attacks onother nodes with the purpose of disrupting the normaloperation of the network or stealing the information.Many different types of attacks against these networkshave been identified including Flooding, Blackhole,Neighbor, Rushing, and Wormhole attacks [4].
The intrusion detection (ID) techniques proposedfor MANETs can be grouped into two classes:signature-based detection and anomaly detection. Asignature-based detection technique compares currentnetwork behavior with known attack signatures anddetects an attack if there is a match. An anomalydetection technique builds a model of normal networkbehavior and then considers any deviation from thismodel as anomaly. The advantage of anomaly detec-tion techniques is that they do not require knownattack signatures and can thus detect new attacks [5].
In this paper, we use the negative selection mech-anism of biological immune system for intrusion de-tection in AODV-based MANETs. It is based on theprinciples of self/nonself discrimination [6, 7] in thebiological immune system, and models the matura-tion process of T cells in thymus without the partic-ipation of nonself cells and eliminates T cells thatreact against self cells [8]. In other words, it uses onlyself cells for learning and generates a set of detectorsfor detecting nonself cells [9]. Previous works haveused different techniques for generating detectors [10–13]. In this work, we extend the artificial bee colony(ABC) algorithm [14] for this purpose. It is a newswarm intelligence algorithm inspired by the behaviorof honey bees when searching for food sources. Manyextensions have been proposed to improve its perfor-mance [15, 16].
Mobility of nodes in a MANET causes the networktopology to change constantly over time. Hence, amalicious node can easily disrupt the routing processby injecting false routes into the network. A traditional
approach to detect such malicious network activitiesis to build a profile of the normal network traffic andthen identify an activity as suspicious if it deviatesfrom this profile. As the network topology dynamicallychanges over time, the simple use of a static profile isnot efficient.
In this paper, we present a dynamic hybrid approachbased on the ABC and NS algorithms, called BeeID,for intrusion detection in AODV-based MANETs. Inthis approach, every node first collects a set of fea-ture vectors of its own normal network traffic. Eachfeature vector is represented by a hypersphere withfixed radius in the feature space. The node then ap-plies the NicheNABC algorithm to generate a set ofmature negative detectors to cover the nonself space.The amount of the coverage is estimated using theMonte Carlo integration, a probabilistic and samplingmethod useful for estimating complex integrals. Thenegative detectors, represented by hyperspheres withvariable radii, are used to detect malicious network ac-tivities. The node eventually updates mature negativedetectors by one of two methods of partial updatingor total updating.
The remainder of this paper is organized as follows:Section 2 reviews related works. Section 3 providesa brief overview of ABC and AODV. Section 4 for-mally introduces the problem of intrusion detection inMANETs and Section 5 presents BeeID. Section 6 re-ports experimental results and finally Section 7 drawssome conclusions.
2 RelatedWorks
Gonzalez et al. [17] proposed a real-valued negativeselection (RNS) algorithm with constant-sized detec-tors and used the Monte Carlo integration to calculatethe number of detectors needed to cover the nonselfspace. Simulated annealing was employed to optimizethe distribution of detectors in the nonself space.
Ji et al. [11] presented a real-valued negative selec-tion algorithm with variable-sized detectors, calledV-detector. A naive method was used to automati-cally calculate the estimated coverage of the nonselfspace when the detector set is generated. They furtherimproved the coverage estimation by the hypothesistesting, and demonstrated that it has a higher detec-tion rate than the naive method, but generates moredetectors to cover the nonself space.
The security techniques proposed for MANETs canbe grouped into two classes: prevention and detection.Prevention techniques, such as secure and authenti-cated routing protocols [18, 19], are usually consideredas the first line of defense against attacks. However,these techniques do not provide a complete solution
ISeCure
January 2012, Volume 4, Number 1 (pp. 25–39) 27
for all attacks. Detection techniques can come intoplay when prevention techniques have failed.
Dasgupta et al. [12] proposed a technique inspiredby the negative selection algorithm for intrusion de-tection in wired networks. It uses a niching genetic al-gorithm (NGA) to generate a set of detectors to coverthe nonself space. The detectors are represented in theform of rules. The condition part of each rule definesa hyperrectangle in the feature space. A hypersphereis defined around each self sample. The raw fitness ofa rule is calculated based on the volume of its hyper-rectangle and the number of self samples covered by it.Ostaszewski et al. [20] presented another technique fornetwork intrusion detection in which both detectorsand self samples are represented by hyperrectangles.
Balachandran et al. [21] proposed a behavior-basedanomaly detection technique inspired by the biolog-ical immune system to detect malicious nodes inDSR-based MANETs. They generate the detector setthrough a structured genetic algorithm (sGA) that issuitable for encoding of multi-shape detectors. Sarafi-janovic et al. [22] used an artificial immune systembased on negative selection, danger theory, and clonalselection for detecting malicious nodes.
In some real-valued negative selection algorithms,the variability of self samples would result in theholes on the boundary between the self and nonselfspaces. Hence, nonself samples in these regions cannotbe detected. Wang et al. [13] proposed an improveddetector generation algorithm based on evolutionarysearch to generate a specific type of detectors, calledboundary detectors. These detectors cover the holeson the boundary and have an opportunity to detectnonself samples hidden in the self space.
Hang et al. [23] presented an approach of apply-ing both positive and negative selection algorithmsfor anomaly detection. They consider the problem ofanomaly detection as a problem of supervised learn-ing from imbalanced data sets and use re-samplingstrategies to balance data sets. The approach firstlearns the patterns of normal samples based on a co-evolutionary genetic algorithm, which is inspired fromthe positive selection algorithm, and then generatessynthetic anomalous samples based on the negativeselection algorithm. Both data sets are used for learn-ing a classifier. The main limitation of this approachis that it imposes a significant overhead for updatingthe boundary between normal and anomalous samplesand therefore is not appropriate for dynamic anomalydetection.
Nakayama et al. [24] proposed a dynamic anomalydetection approach, called WPCA, for AODV-basedMANETs that allows the profile of normal network
behavior to be updated at particular time intervals.It uses the principal component analysis (PCA) tocalculate the first principle component of normal sam-ples, which can be used as a profile of normal networkbehavior. The projection distance of new samples tothis principle component is used for detecting routingattacks. The global covariance of normal samples isused to update the profile at consecutive time inter-vals. The main drawback of this approach is that theglobal covariance is calculated inaccurately.
Alikhany et al. [5] proposed a dynamic clustering-based approach, called DCAD, for anomaly detectionin AODV-based MANETs. It uses a weighted fixed-width clustering algorithm to build a profile of normalnetwork behavior and to detect routing attacks. Italso uses a forgetting equation to periodically updatethe profile. The experimental results have shown thatDCAD has a high false-alarm rate.
3 Background Knowledge
3.1 Artificial Bee Colony
The artificial bee colony (ABC) algorithm [14] is a newswarm intelligence algorithm inspired by the behaviorof honey bees. Since it was proposed by Karaboga [25],many extensions have been made to improve it [15, 16].Karaboga et al. [16] compared the performance ofABC with that of some other popular metaheuris-tic optimization algorithms, such as particle swarmoptimization (PSO), genetic algorithms (GAs), anddifferential evolution (DE). The results showed that ithas a comparable performance with other algorithms.
The colony of artificial bees consists of three groupsof bees: employed, onlooker, and scout. The number ofemployed and onlooker bees is identical, and is equalto the number of food sources. Each employed beeis assigned to one of food sources, and in each cycleit finds a new food source in the neighborhood of itscurrent food source. If the new food source has morenectar, the employed bee will replace the current foodsource with it. There is only one scout bee in thecolony. The employed bee whose food source has beenabandoned becomes a scout bee, and carries out arandom search to find a new food source [14]. Afterall employed bees complete the search process, theyshare the information about the nectar amount andthe position of food sources with onlooker bees bydoing the waggle dance. Each onlooker bee watchesthe dance and selects a food source based on its nectaramount. The position of each food source representsa possible solution in the optimization problem andits nectar amount corresponds to the fitness of thesolution [16].
ISeCure
28 BeeID: Intrusion Detection in AODV-based MANETs Using . . . — F. Barani and M. Abadi
3.2 An Overview of AODV Protocol
Different routing protocols for MANETs have beenproposed in the literature, which can be classified intotwo types: table driven and on-demand routing proto-cols [26]. In on-demand routing protocols, routes arecreated only when required. Some of these protocolsare DSR [27], AODV [2], and TORA [28].
AODV [2], which is based on DSDV [26] and DSR,tries to minimize the requirements of broadcast duringa route discovery process when a source node wantsto send data to a destination node. The source nodebroadcasts a route request (RREQ) packet to its neigh-bors and then sets a timer to wait for a reply. A routereply (RREP) packet is sent back to the source nodeby the destination node or any intermediate node thathas a fresh route to the destination node. Every nodein the route between the source and destination nodesprocesses the RREQ packet to create a reverse routein its routing table for forwarding RREP packets tothe source node [5].
3.3 Typical Routing Attacks on AODVProtocol
Routing attacks on AODV are classified into fourclasses: (1) Route disruption, (2) Route invasion, (3)Node isolation, and (4) Resource consumption. In thefollowing, we shortly describe some of typical routingattacks on AODV [4, 24].
1. Flooding Attack : A malicious node sends a hugenumber of RREQ packets in an attempt to con-sume the network resources. The source IP ad-dress is forged to a randomly selected node andthe broadcast ID is intentionally increased.
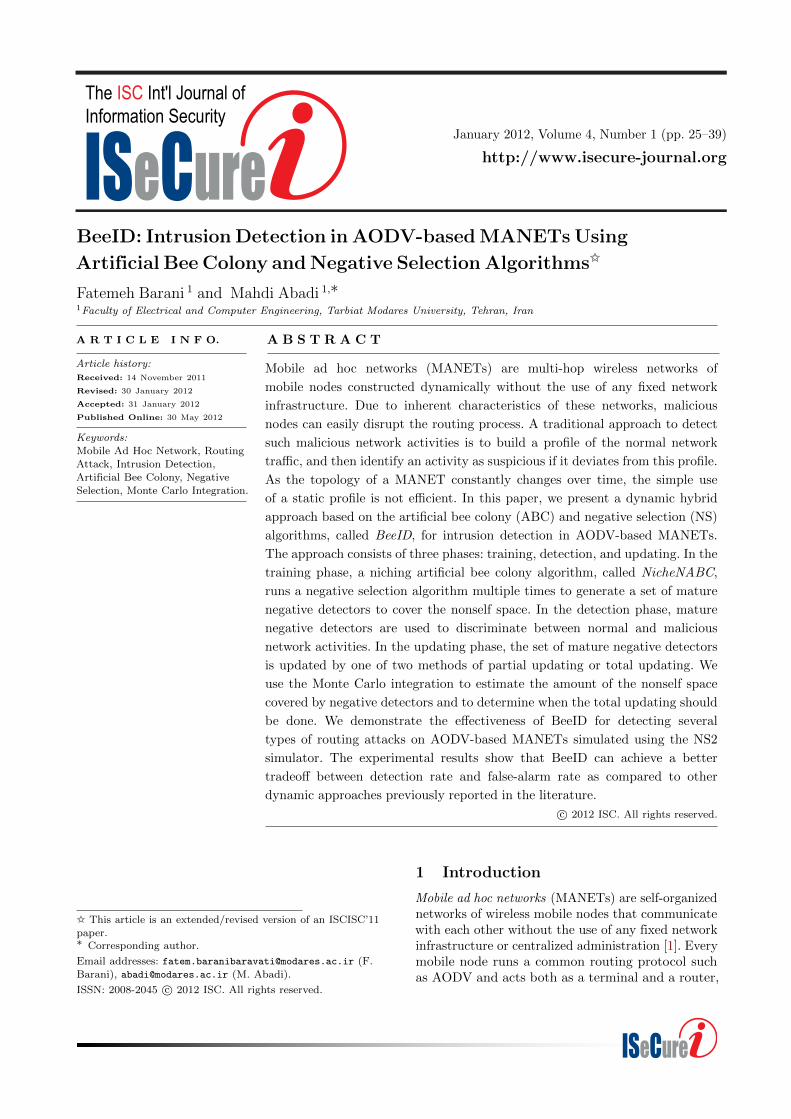
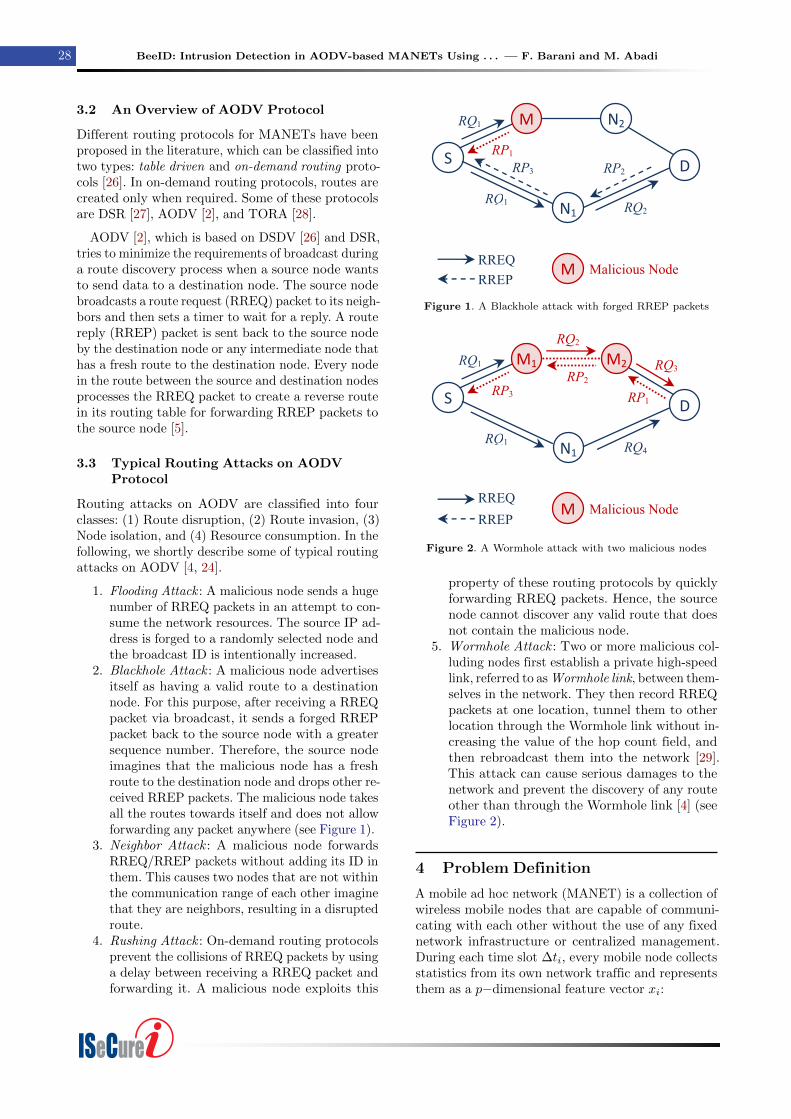
2. Blackhole Attack : A malicious node advertisesitself as having a valid route to a destinationnode. For this purpose, after receiving a RREQpacket via broadcast, it sends a forged RREPpacket back to the source node with a greatersequence number. Therefore, the source nodeimagines that the malicious node has a freshroute to the destination node and drops other re-ceived RREP packets. The malicious node takesall the routes towards itself and does not allowforwarding any packet anywhere (see Figure 1).
3. Neighbor Attack : A malicious node forwardsRREQ/RREP packets without adding its ID inthem. This causes two nodes that are not withinthe communication range of each other imaginethat they are neighbors, resulting in a disruptedroute.
4. Rushing Attack : On-demand routing protocolsprevent the collisions of RREQ packets by usinga delay between receiving a RREQ packet andforwarding it. A malicious node exploits this
S
RQ1
RQ1 RQ2
RP2 RP3 RP1
N2
D
N1
RREQ
RREP M Malicious Node
M
Figure 1. A Blackhole attack with forged RREP packets
S
RQ1
RQ1 RQ4
RP3
M1
D
N1
RREQ
RREP M Malicious Node
M2 RQ3 RP2
RP1
RQ2
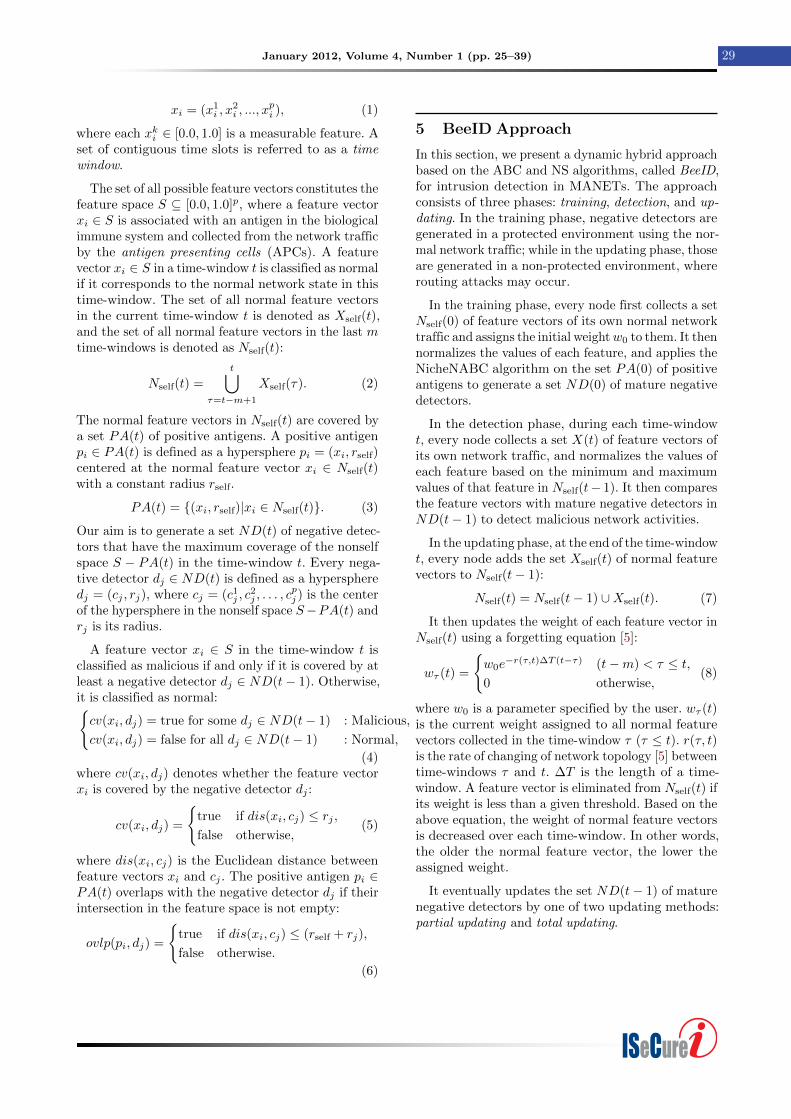
Figure 2. A Wormhole attack with two malicious nodes
property of these routing protocols by quicklyforwarding RREQ packets. Hence, the sourcenode cannot discover any valid route that doesnot contain the malicious node.
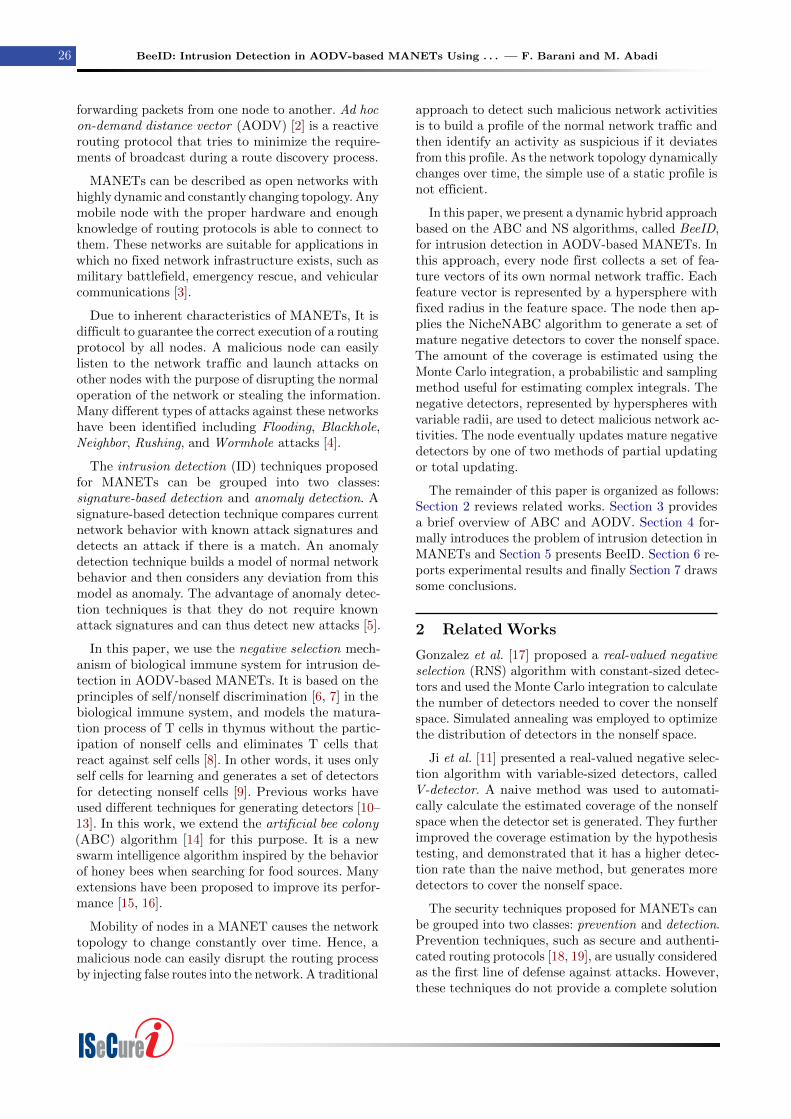
5. Wormhole Attack : Two or more malicious col-luding nodes first establish a private high-speedlink, referred to as Wormhole link, between them-selves in the network. They then record RREQpackets at one location, tunnel them to otherlocation through the Wormhole link without in-creasing the value of the hop count field, andthen rebroadcast them into the network [29].This attack can cause serious damages to thenetwork and prevent the discovery of any routeother than through the Wormhole link [4] (seeFigure 2).
4 Problem Definition
A mobile ad hoc network (MANET) is a collection ofwireless mobile nodes that are capable of communi-cating with each other without the use of any fixednetwork infrastructure or centralized management.During each time slot ∆ti, every mobile node collectsstatistics from its own network traffic and representsthem as a p−dimensional feature vector xi:
ISeCure
January 2012, Volume 4, Number 1 (pp. 25–39) 29
xi = (x1i , x
2i , ..., x
pi ), (1)
where each xki ∈ [0.0, 1.0] is a measurable feature. Aset of contiguous time slots is referred to as a timewindow.
The set of all possible feature vectors constitutes thefeature space S ⊆ [0.0, 1.0]p, where a feature vectorxi ∈ S is associated with an antigen in the biologicalimmune system and collected from the network trafficby the antigen presenting cells (APCs). A featurevector xi ∈ S in a time-window t is classified as normalif it corresponds to the normal network state in thistime-window. The set of all normal feature vectorsin the current time-window t is denoted as Xself(t),and the set of all normal feature vectors in the last mtime-windows is denoted as Nself(t):
Nself(t) =
t⋃τ=t−m+1
Xself(τ). (2)
The normal feature vectors in Nself(t) are covered bya set PA(t) of positive antigens. A positive antigenpi ∈ PA(t) is defined as a hypersphere pi = (xi, rself)centered at the normal feature vector xi ∈ Nself(t)with a constant radius rself.
PA(t) = {(xi, rself)|xi ∈ Nself(t)}. (3)
Our aim is to generate a set ND(t) of negative detec-tors that have the maximum coverage of the nonselfspace S − PA(t) in the time-window t. Every nega-tive detector dj ∈ ND(t) is defined as a hyperspheredj = (cj , rj), where cj = (c1j , c
2j , . . . , c
pj ) is the center
of the hypersphere in the nonself space S−PA(t) andrj is its radius.
A feature vector xi ∈ S in the time-window t isclassified as malicious if and only if it is covered by atleast a negative detector dj ∈ ND(t− 1). Otherwise,it is classified as normal:{cv(xi, dj) = true for some dj ∈ ND(t− 1) : Malicious,
cv(xi, dj) = false for all dj ∈ ND(t− 1) : Normal,
(4)where cv(xi, dj) denotes whether the feature vectorxi is covered by the negative detector dj :
cv(xi, dj) =
{true if dis(xi, cj) ≤ rj ,false otherwise,
(5)
where dis(xi, cj) is the Euclidean distance betweenfeature vectors xi and cj . The positive antigen pi ∈PA(t) overlaps with the negative detector dj if theirintersection in the feature space is not empty:
ovlp(pi, dj) =
{true if dis(xi, cj) ≤ (rself + rj),
false otherwise.
(6)
5 BeeID Approach
In this section, we present a dynamic hybrid approachbased on the ABC and NS algorithms, called BeeID,for intrusion detection in MANETs. The approachconsists of three phases: training, detection, and up-dating. In the training phase, negative detectors aregenerated in a protected environment using the nor-mal network traffic; while in the updating phase, thoseare generated in a non-protected environment, whererouting attacks may occur.
In the training phase, every node first collects a setNself(0) of feature vectors of its own normal networktraffic and assigns the initial weightw0 to them. It thennormalizes the values of each feature, and applies theNicheNABC algorithm on the set PA(0) of positiveantigens to generate a set ND(0) of mature negativedetectors.
In the detection phase, during each time-windowt, every node collects a set X(t) of feature vectors ofits own network traffic, and normalizes the values ofeach feature based on the minimum and maximumvalues of that feature in Nself(t− 1). It then comparesthe feature vectors with mature negative detectors inND(t− 1) to detect malicious network activities.
In the updating phase, at the end of the time-windowt, every node adds the set Xself(t) of normal featurevectors to Nself(t− 1):
Nself(t) = Nself(t− 1) ∪Xself(t). (7)
It then updates the weight of each feature vector inNself(t) using a forgetting equation [5]:
wτ (t) =
{w0e
−r(τ,t)∆T (t−τ) (t−m) < τ ≤ t,0 otherwise,
(8)
where w0 is a parameter specified by the user. wτ (t)is the current weight assigned to all normal featurevectors collected in the time-window τ (τ ≤ t). r(τ, t)is the rate of changing of network topology [5] betweentime-windows τ and t. ∆T is the length of a time-window. A feature vector is eliminated from Nself(t) ifits weight is less than a given threshold. Based on theabove equation, the weight of normal feature vectorsis decreased over each time-window. In other words,the older the normal feature vector, the lower theassigned weight.
It eventually updates the set ND(t− 1) of maturenegative detectors by one of two updating methods:partial updating and total updating.
ISeCure
30 BeeID: Intrusion Detection in AODV-based MANETs Using . . . — F. Barani and M. Abadi
5.1 Normalization Process
When calculating the distance between two featurevectors, features with larger values will dominate thosewith smaller values, and hence have a larger influenceon the calculated distance. To solve this problem, atthe end of each time-window t, we normalize the valuesof each feature in Nself(t).
As mentioned before, the feature space S is a unithypercube. To generate an optimized set of negativedetectors, the values of features in Nself(t) should benormalized such that positive antigens in PA(t) areaway from the sides of the unit hypercube S. For thispurpose, the minimum and maximum values of eachfeature in Nself(t) are determined and then the valueof the kth feature for each feature vector xi ∈ Nself(t)is scaled using the following equation:
xki =xki − (xkmin − 0.2 ∗ xkmin)
(xkmax + 0.2 ∗ xkmax)− (xkmin − 0.2 ∗ xkmin),
(9)where xkmin and xkmax are the minimum and maximumvalues of the kth feature.
5.2 NicheNABC Algorithm
The NicheNABC algorithm is composed of a numberof sequential and dependent niches of the NABC al-gorithm. The operation of the algorithm is similar tothat of the bone marrow and thymus in the biologicalimmune system.
Let t be the current time-window and PA(t) be theset of positive antigens corresponding to the normalfeature vectors in Nself(t). The NicheNABC algorithmtakes PA(t) as input and generates a set ND(t) ofmature negative detectors as output to cover the non-self space S − PA(t). In every niche i of the NABCalgorithm, an initial population F i = {f i1, f i2, . . . , f iL}of immature food sources is randomly generated. Eachimmature food source f ij ∈ F i consists of l immature
negative detectors dijs:
f ij = (dij1, dij2, . . . , d
ijl), (10)
where dijs is defined as a hypersphere dijs = (cijs, rijs)
whose center is a p-dimensional feature vector cijs ∈S−PA(t) and radius is rijs, calculated as the average
distance between cijs and its n nearest positive antigens
in PA(t). The position and size of f ij are denoted
by pij = (cij1, cij2, . . . , c
ijl) and sij = (rij1, r
ij2, . . . , r
ijl),
respectively.
The immature food sources are generated so thatthey have minimum overlap with positive antigens inPA(t). Hence, each center cijs ∈ pij is initially chosenrandomly from S − PA(t).
From Section 3.1, we know that each employed beeis assigned to only one of the food sources. In eachcycle of niche i, every employed bee j first produces amodification on the position pij of its own food source
f ij in its memory to discover a new food source f ij ,
and evaluates the nectar amount of f ij . To do this,
it modifies the center cijs of each negative detector
dijs ∈ f ij with probability Pe:
cijs =
{cijs + ϕjs(c
ijs − ciws) if U(0, 1) ≤ Pe,
cijs otherwise,(11)
where ciws is the center of negative detector diws of arandomly chosen food source f iw and ϕjs is a randomvalue in the range [−1, 1].
The employed bee j then forgets f ij and replaces
it with f ij , only if the nectar amount of f ij is equal
or more than that of f ij . In other words, a greedy
strategy is applied to select between f ij and f ij . Thenectar amount of each food source is evaluated by thefitness function ϑ, as in (13).
After all employed bees complete the search process,they share the information of the food sources in F i
with the onlooker bees on the dance area.
Each onlooker bee o first chooses a food source f ikusing a selection method such as roulette wheel ortournament selection, and then discovers a new foodsource f ik in the neighborhood of f ik. To this end, itmodifies the center ciks of each negative detector diks ∈f ik with probability Po:
ciks =
{ciks + ϕks(c
iks − cizs) if U(0, 1) ≤ Po,
ciks otherwise,(12)
where cizs is the center of negative detector dizs of arandomly chosen food source f iz, and ϕks is a randomvalue in the range [−1, 1]. It eventually applies a greedy
strategy to select between f ik and f ik, similar to thatof employed bees.
If the fitness of a food source cannot be improvedfurther for a given number of cycles, that food sourceis determined to be abandoned. Hence, the scout beechooses the abandoned food source with the lowestnectar amount and replaces it with a randomly gener-ated immature food source.
The above steps are repeated until a terminationcondition (e.g., the maximum cycle number) is met.At the end of every niche i, mature negative detectorsof the food source f iM with the highest nectar amountare added toND(t). If i is a multiple of ξ, the coverageof the nonself space by mature negative detectors inND(t) is estimated using the Monte Carlo integration[30, 31]. The sequential niches of the NABC algorithm
ISeCure
January 2012, Volume 4, Number 1 (pp. 25–39) 31
are continued until a termination condition (e.g., themaximum niche number or the target coverage of thenonself space) is met. Algorithm 1 shows the pseudo-code of NicheNABC. In the algorithm, Rmax is themaximum number of niches, cvest is the estimatedcoverage of the nonself space, and CRmin is the targetcoverage of the nonself space.
Algorithm 1 NicheNABC
Input:PA(t): Set of positive antigensRmax: Maximum number of nichesCRmin: Target coverage of the nonself space
Output:ND(t): Set of mature negative detectors
1: i := 1, ND(t) := φ2: repeat3: Initialize a population of immature food
sources4: repeat5: for each employed bee j do6: Produce a new food source f ij in the neigh-
borhood of f ij using Equation 11
7: if ϑ(f ij , PA(t), ND(t)) > ϑ(f ij , PA(t), ND(t))then
8: f ij := f ij9: end if
10: end for11: for each onlooker bee o do12: Select a food source f ik using tournament
selection and product a new food sourcef ik in the neighborhood of f ik using Equa-tion 12
13: if ϑ(f ik, PA(t), ND(t)) > ϑ(f ik, PA(t), ND(t))
then
14: f ik := f ik15: end if
16: end for17: Determine an abandoned food source and re-
place it with a new immature food source forthe scout bee
18: Find the best food source f iM19: until a termination condition is met20: ND(t) := ND(t) ∪ f iM21: i := i+ 122: if i is a multiple of ξ then23: Calculate the nonself space coverage estima-
tion cvest using the Monte Carlo integration24: end if25: until i > Rmax or cvest > CRmin
5.2.1 Fitness Function
The NicheNABC algorithm attempts to generate a setof mature food sources with high nectar amount, sothat they have the maximum coverage with the nonself
space, the minimum overlap with positive antigens,and the minimum overlap among themselves.
In every niche of the NABC algorithm, the nectaramount of a food source f is evaluated by the followingfitness function:
ϑ(f,A,D) = w1 · vol(f)− w2 · ovlpself(f,A)
−w3 · ovlpinner(f)− w4 · ovlpouter(f,D),(13)
where A is the set of positive antigens, D is the setof mature negative detectors generated in the pre-vious niches of the algorithm, w1, . . . , w4 are con-stants whose values are determined experimentally,and vol(f) denotes the approximate amount of thefeature space S covered by negative detectors in f :
vol(f) =
l∑s=1
rs√p, (14)
where l is the number of negative detectors in a foodsource, p is the dimension of S, and rs is the radius ofsth negative detector in f . The larger the radius, thelarger the amount of S covered by the negative detec-tor. Hence, the sum of the radii of negative detectorsin f is used to estimate the amount of S covered by it.
ovlpself(f,A) denotes the approximate amount ofoverlap between negative detectors in f and positiveantigens in A:
ovlpself(f,A) =
∑ls=1
∑|A|k=1(eδ(ds,pk) − 1)
l · |A|, (15)
where ds is the sth negative detector in f , pk is thekth positive antigen in A, and |A| is the number ofpositive antigens in it.
ovlpinner(f) denotes the approximate amount ofoverlap among negative detectors in f :
ovlpinner(f) =
∑ls=1
∑lk=s+1(eδ(ds,pk) − 1)
l · (l + 1). (16)
ovlpouter(f,D) denotes the approximate amount ofoverlap between negative detectors in f and maturenegative detectors in D:
ovlpouter(f,D) =
∑ls=1
∑|D|k=1(eδ(ds,mk) − 1)
l · |D|if D 6= ∅,
0 otherwise,
(17)where mk is the kth mature negative detector in D,and |D| is the number of mature negative detectorsin it.
Notice that δ(sj , sk) denotes the approximateamount of overlap between two hyperspheres sj =(cj , rj) and sk = (ck, rk), and its value is alwaysbounded between 0 and 1:
ISeCure
32 BeeID: Intrusion Detection in AODV-based MANETs Using . . . — F. Barani and M. Abadi
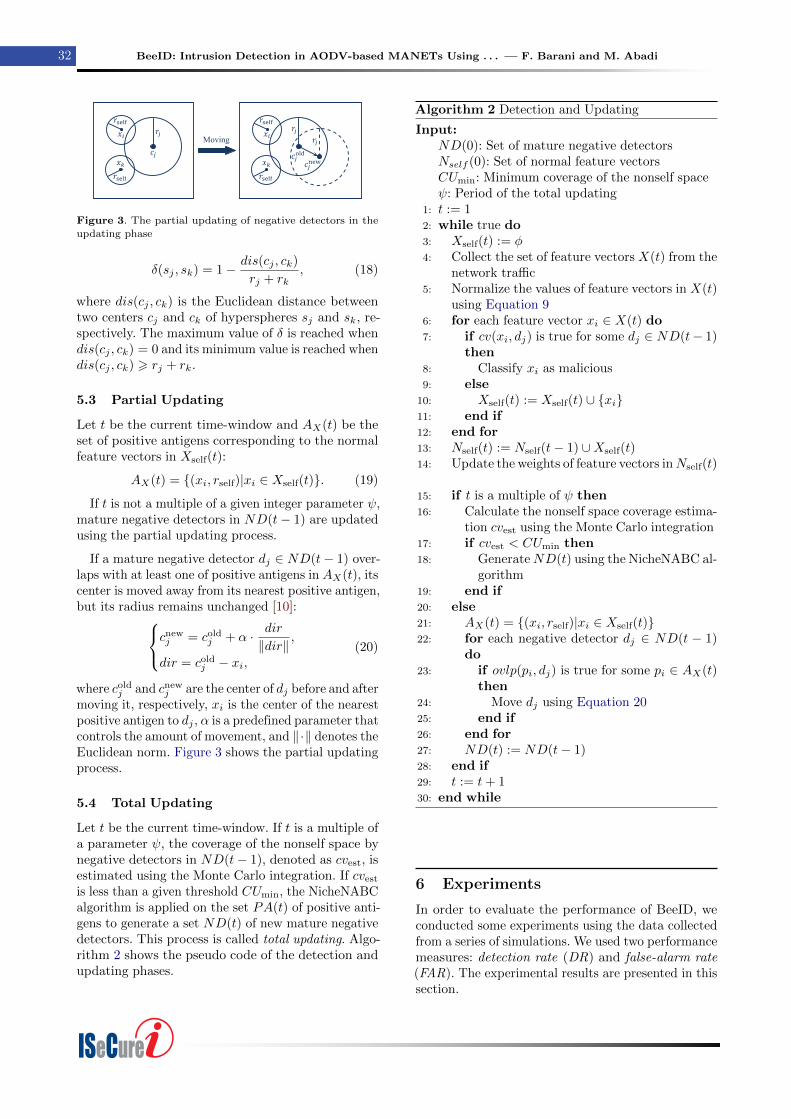
Moving
Figure 3. The partial updating of negative detectors in the
updating phase
δ(sj , sk) = 1− dis(cj , ck)
rj + rk, (18)
where dis(cj , ck) is the Euclidean distance betweentwo centers cj and ck of hyperspheres sj and sk, re-spectively. The maximum value of δ is reached whendis(cj , ck) = 0 and its minimum value is reached whendis(cj , ck) > rj + rk.
5.3 Partial Updating
Let t be the current time-window and AX(t) be theset of positive antigens corresponding to the normalfeature vectors in Xself(t):
AX(t) = {(xi, rself)|xi ∈ Xself(t)}. (19)
If t is not a multiple of a given integer parameter ψ,mature negative detectors in ND(t− 1) are updatedusing the partial updating process.
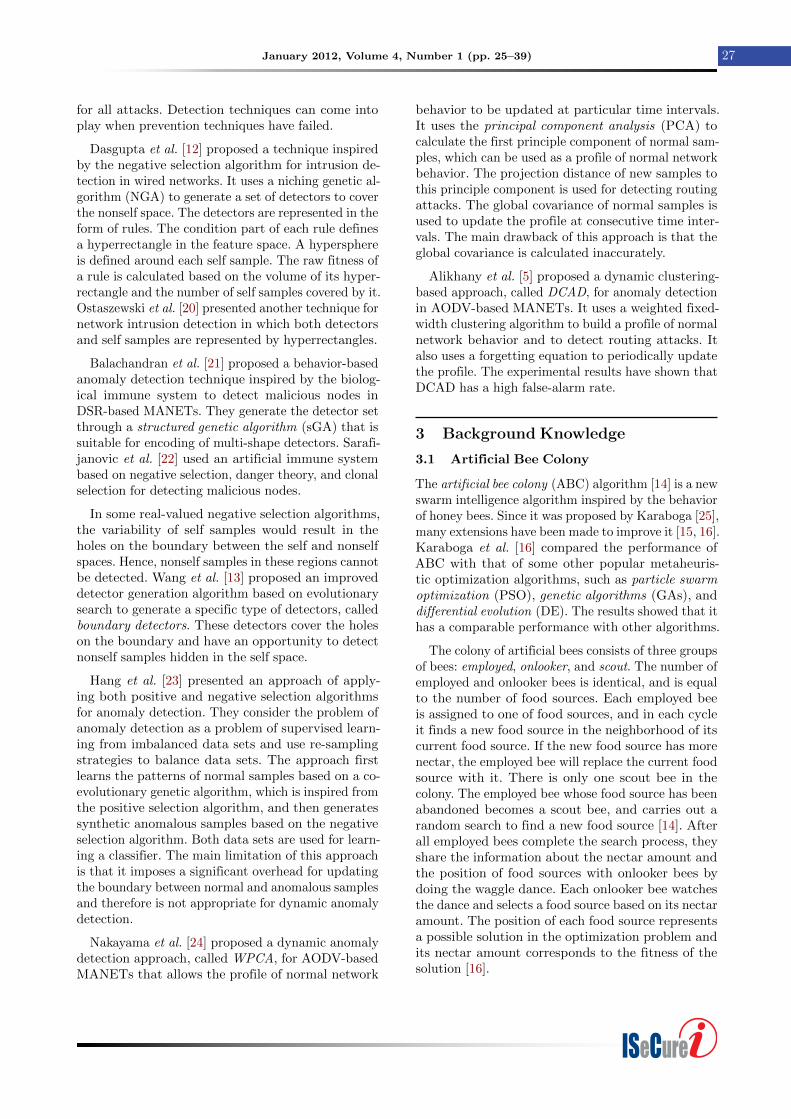
If a mature negative detector dj ∈ ND(t− 1) over-laps with at least one of positive antigens in AX(t), itscenter is moved away from its nearest positive antigen,but its radius remains unchanged [10]:cnew
j = coldj + α · dir
‖dir‖,
dir = coldj − xi,
(20)
where coldj and cnew
j are the center of dj before and aftermoving it, respectively, xi is the center of the nearestpositive antigen to dj , α is a predefined parameter thatcontrols the amount of movement, and ‖·‖ denotes theEuclidean norm. Figure 3 shows the partial updatingprocess.
5.4 Total Updating
Let t be the current time-window. If t is a multiple ofa parameter ψ, the coverage of the nonself space bynegative detectors in ND(t− 1), denoted as cvest, isestimated using the Monte Carlo integration. If cvest
is less than a given threshold CUmin, the NicheNABCalgorithm is applied on the set PA(t) of positive anti-gens to generate a set ND(t) of new mature negativedetectors. This process is called total updating. Algo-rithm 2 shows the pseudo code of the detection andupdating phases.
Algorithm 2 Detection and Updating
Input:ND(0): Set of mature negative detectorsNself (0): Set of normal feature vectorsCUmin: Minimum coverage of the nonself spaceψ: Period of the total updating
1: t := 12: while true do3: Xself(t) := φ4: Collect the set of feature vectors X(t) from the
network traffic5: Normalize the values of feature vectors in X(t)
using Equation 96: for each feature vector xi ∈ X(t) do7: if cv(xi, dj) is true for some dj ∈ ND(t− 1)
then8: Classify xi as malicious9: else
10: Xself(t) := Xself(t) ∪ {xi}11: end if12: end for13: Nself(t) := Nself(t− 1) ∪Xself(t)14: Update the weights of feature vectors inNself(t)
15: if t is a multiple of ψ then16: Calculate the nonself space coverage estima-
tion cvest using the Monte Carlo integration17: if cvest < CUmin then18: GenerateND(t) using the NicheNABC al-
gorithm19: end if20: else21: AX(t) = {(xi, rself)|xi ∈ Xself(t)}22: for each negative detector dj ∈ ND(t − 1)
do23: if ovlp(pi, dj) is true for some pi ∈ AX(t)
then24: Move dj using Equation 2025: end if26: end for27: ND(t) := ND(t− 1)28: end if29: t := t+ 130: end while
6 Experiments
In order to evaluate the performance of BeeID, weconducted some experiments using the data collectedfrom a series of simulations. We used two performancemeasures: detection rate (DR) and false-alarm rate(FAR). The experimental results are presented in thissection.
ISeCure
January 2012, Volume 4, Number 1 (pp. 25–39) 33
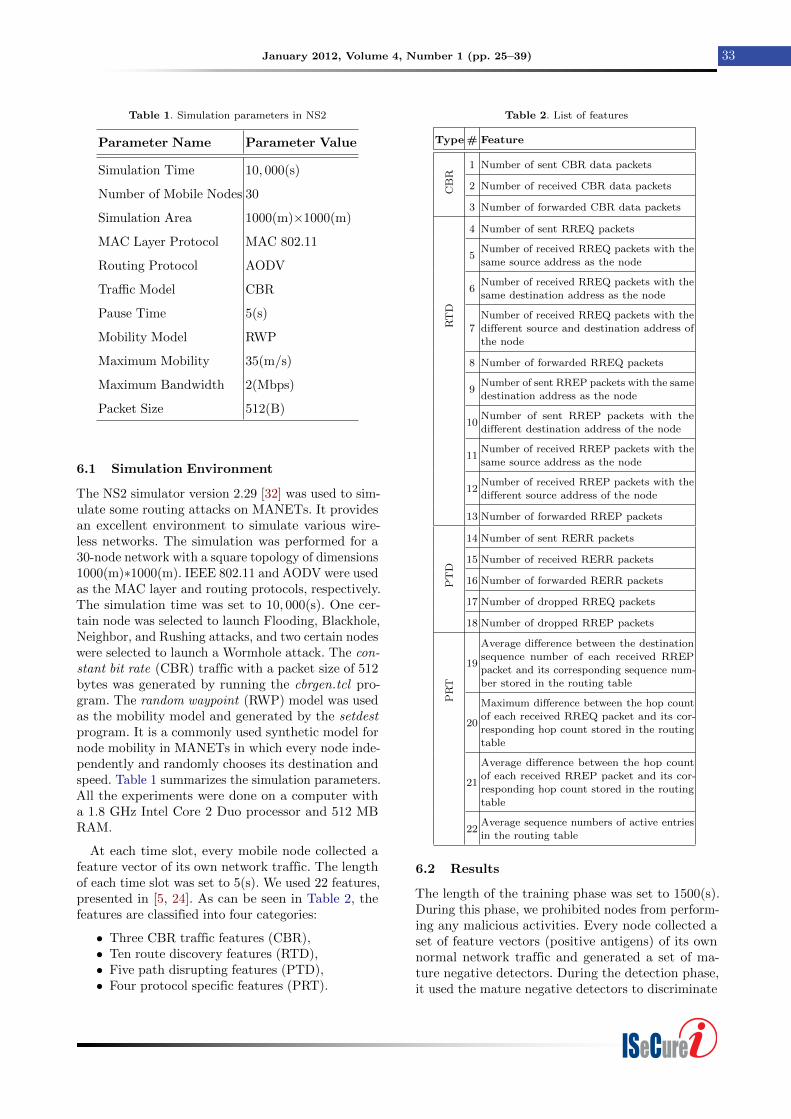
Table 1. Simulation parameters in NS2
Parameter Name Parameter Value
Simulation Time 10, 000(s)
Number of Mobile Nodes 30
Simulation Area 1000(m)×1000(m)
MAC Layer Protocol MAC 802.11
Routing Protocol AODV
Traffic Model CBR
Pause Time 5(s)
Mobility Model RWP
Maximum Mobility 35(m/s)
Maximum Bandwidth 2(Mbps)
Packet Size 512(B)
6.1 Simulation Environment
The NS2 simulator version 2.29 [32] was used to sim-ulate some routing attacks on MANETs. It providesan excellent environment to simulate various wire-less networks. The simulation was performed for a30-node network with a square topology of dimensions1000(m)∗1000(m). IEEE 802.11 and AODV were usedas the MAC layer and routing protocols, respectively.The simulation time was set to 10, 000(s). One cer-tain node was selected to launch Flooding, Blackhole,Neighbor, and Rushing attacks, and two certain nodeswere selected to launch a Wormhole attack. The con-stant bit rate (CBR) traffic with a packet size of 512bytes was generated by running the cbrgen.tcl pro-gram. The random waypoint (RWP) model was usedas the mobility model and generated by the setdestprogram. It is a commonly used synthetic model fornode mobility in MANETs in which every node inde-pendently and randomly chooses its destination andspeed. Table 1 summarizes the simulation parameters.All the experiments were done on a computer witha 1.8 GHz Intel Core 2 Duo processor and 512 MBRAM.
At each time slot, every mobile node collected afeature vector of its own network traffic. The lengthof each time slot was set to 5(s). We used 22 features,presented in [5, 24]. As can be seen in Table 2, thefeatures are classified into four categories:
• Three CBR traffic features (CBR),• Ten route discovery features (RTD),• Five path disrupting features (PTD),• Four protocol specific features (PRT).
Table 2. List of features
Type # Feature
CB
R
1 Number of sent CBR data packets
2 Number of received CBR data packets
3 Number of forwarded CBR data packets
RT
D
4 Number of sent RREQ packets
5Number of received RREQ packets with the
same source address as the node
6Number of received RREQ packets with thesame destination address as the node
7
Number of received RREQ packets with the
different source and destination address ofthe node
8 Number of forwarded RREQ packets
9Number of sent RREP packets with the samedestination address as the node
10Number of sent RREP packets with the
different destination address of the node
11Number of received RREP packets with thesame source address as the node
12Number of received RREP packets with the
different source address of the node
13 Number of forwarded RREP packets
PT
D
14 Number of sent RERR packets
15 Number of received RERR packets
16 Number of forwarded RERR packets
17 Number of dropped RREQ packets
18 Number of dropped RREP packets
PR
T
19
Average difference between the destination
sequence number of each received RREPpacket and its corresponding sequence num-
ber stored in the routing table
20
Maximum difference between the hop count
of each received RREQ packet and its cor-responding hop count stored in the routing
table
21
Average difference between the hop countof each received RREP packet and its cor-responding hop count stored in the routing
table
22Average sequence numbers of active entriesin the routing table
6.2 Results
The length of the training phase was set to 1500(s).During this phase, we prohibited nodes from perform-ing any malicious activities. Every node collected aset of feature vectors (positive antigens) of its ownnormal network traffic and generated a set of ma-ture negative detectors. During the detection phase,it used the mature negative detectors to discriminate
ISeCure
34 BeeID: Intrusion Detection in AODV-based MANETs Using . . . — F. Barani and M. Abadi
0.5
0.3
0.2
0.10.05
0.03
0.020.01
82
83.5
85
86.5
88
89.5
91
92.5
94
95.5
97
98.5
100
0 1 2 3 4 5 6 7 8 9 10 11 12
Ave
rage
D
etec
tion
R
ate
(%
)
Average False Alarm Rate (%)
Flooding Attack
Blackhole Attack
Neighbor Attack
Rushing Attack
Wormhole Attack
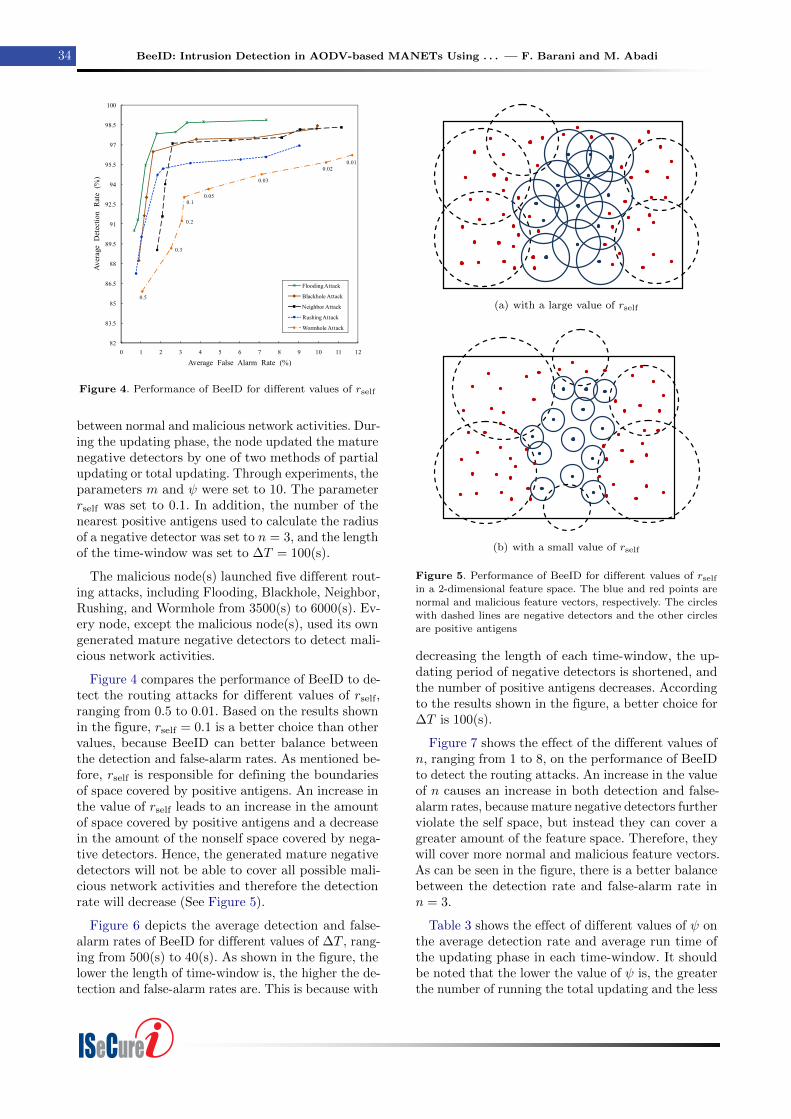
Figure 4. Performance of BeeID for different values of rself
between normal and malicious network activities. Dur-ing the updating phase, the node updated the maturenegative detectors by one of two methods of partialupdating or total updating. Through experiments, theparameters m and ψ were set to 10. The parameterrself was set to 0.1. In addition, the number of thenearest positive antigens used to calculate the radiusof a negative detector was set to n = 3, and the lengthof the time-window was set to ∆T = 100(s).
The malicious node(s) launched five different rout-ing attacks, including Flooding, Blackhole, Neighbor,Rushing, and Wormhole from 3500(s) to 6000(s). Ev-ery node, except the malicious node(s), used its owngenerated mature negative detectors to detect mali-cious network activities.
Figure 4 compares the performance of BeeID to de-tect the routing attacks for different values of rself,ranging from 0.5 to 0.01. Based on the results shownin the figure, rself = 0.1 is a better choice than othervalues, because BeeID can better balance betweenthe detection and false-alarm rates. As mentioned be-fore, rself is responsible for defining the boundariesof space covered by positive antigens. An increase inthe value of rself leads to an increase in the amountof space covered by positive antigens and a decreasein the amount of the nonself space covered by nega-tive detectors. Hence, the generated mature negativedetectors will not be able to cover all possible mali-cious network activities and therefore the detectionrate will decrease (See Figure 5).
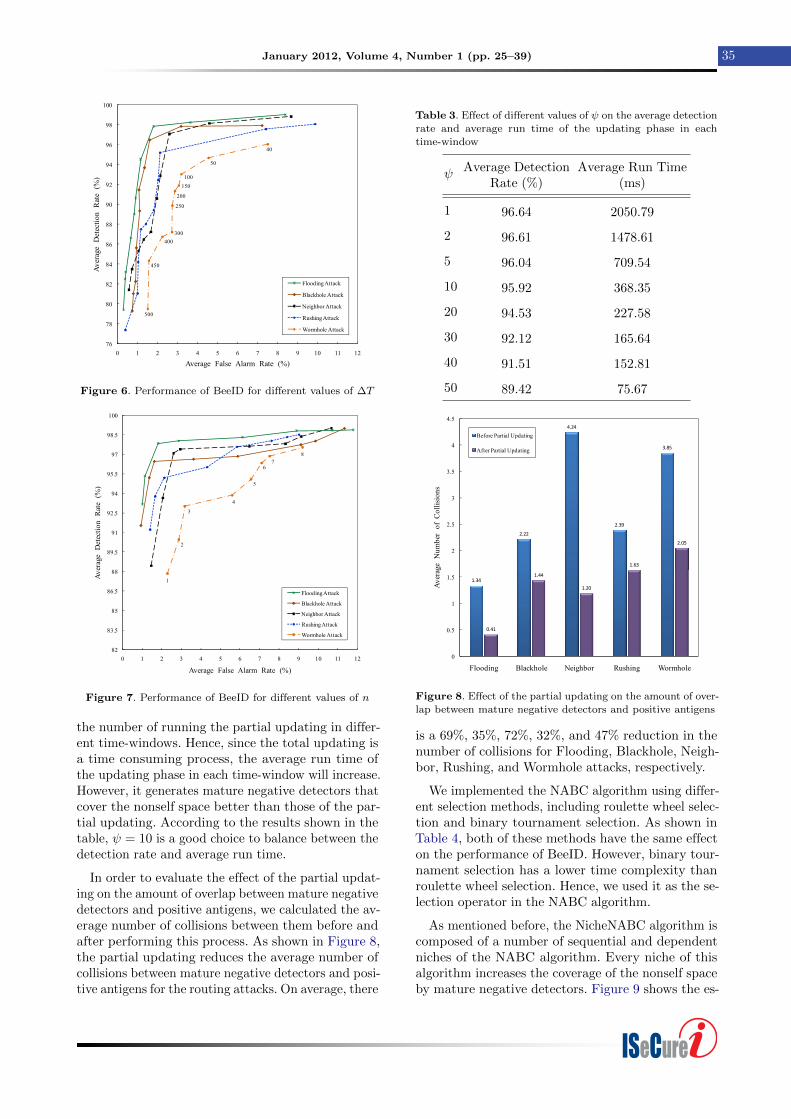
Figure 6 depicts the average detection and false-alarm rates of BeeID for different values of ∆T , rang-ing from 500(s) to 40(s). As shown in the figure, thelower the length of time-window is, the higher the de-tection and false-alarm rates are. This is because with
(a) with a large value of rself
(b) with a small value of rself
Figure 5. Performance of BeeID for different values of rselfin a 2-dimensional feature space. The blue and red points are
normal and malicious feature vectors, respectively. The circleswith dashed lines are negative detectors and the other circlesare positive antigens
decreasing the length of each time-window, the up-dating period of negative detectors is shortened, andthe number of positive antigens decreases. Accordingto the results shown in the figure, a better choice for∆T is 100(s).
Figure 7 shows the effect of the different values ofn, ranging from 1 to 8, on the performance of BeeIDto detect the routing attacks. An increase in the valueof n causes an increase in both detection and false-alarm rates, because mature negative detectors furtherviolate the self space, but instead they can cover agreater amount of the feature space. Therefore, theywill cover more normal and malicious feature vectors.As can be seen in the figure, there is a better balancebetween the detection rate and false-alarm rate inn = 3.
Table 3 shows the effect of different values of ψ onthe average detection rate and average run time ofthe updating phase in each time-window. It shouldbe noted that the lower the value of ψ is, the greaterthe number of running the total updating and the less
ISeCure
January 2012, Volume 4, Number 1 (pp. 25–39) 35
40
50
100
250
150
200
300
400
450
500
76
78
80
82
84
86
88
90
92
94
96
98
100
0 1 2 3 4 5 6 7 8 9 10 11 12
Ave
rage
D
etec
tion
R
ate
(%
)
Average False Alarm Rate (%)
Flooding Attack
Blackhole Attack
Neighbor Attack
Rushing Attack
Wormhole Attack
Figure 6. Performance of BeeID for different values of ∆T
1
2
3
4
5
67
8
82
83.5
85
86.5
88
89.5
91
92.5
94
95.5
97
98.5
100
0 1 2 3 4 5 6 7 8 9 10 11 12
Ave
rage
D
etec
tion
R
ate
(%
)
Average False Alarm Rate (%)
Flooding Attack
Blackhole Attack
Neighbor Attack
Rushing Attack
Wormhole Attack
Figure 7. Performance of BeeID for different values of n
the number of running the partial updating in differ-ent time-windows. Hence, since the total updating isa time consuming process, the average run time ofthe updating phase in each time-window will increase.However, it generates mature negative detectors thatcover the nonself space better than those of the par-tial updating. According to the results shown in thetable, ψ = 10 is a good choice to balance between thedetection rate and average run time.
In order to evaluate the effect of the partial updat-ing on the amount of overlap between mature negativedetectors and positive antigens, we calculated the av-erage number of collisions between them before andafter performing this process. As shown in Figure 8,the partial updating reduces the average number ofcollisions between mature negative detectors and posi-tive antigens for the routing attacks. On average, there
Table 3. Effect of different values of ψ on the average detection
rate and average run time of the updating phase in each
time-window
ψ Average DetectionRate (%)
Average Run Time(ms)
1 96.64 2050.79
2 96.61 1478.61
5 96.04 709.54
10 95.92 368.35
20 94.53 227.58
30 92.12 165.64
40 91.51 152.81
50 89.42 75.67
1.34
2.22
4.24
2.39
3.85
0.41
1.44
1.20
1.63
2.05
0
0.5
1
1.5
2
2.5
3
3.5
4
4.5
Flooding Blackhole Neighbor Rushing Wormhole
Ave
rage
N
umbe
r o
f C
olli
sion
sBefore Partial Updating
After Partial Updating
Figure 8. Effect of the partial updating on the amount of over-lap between mature negative detectors and positive antigens
is a 69%, 35%, 72%, 32%, and 47% reduction in thenumber of collisions for Flooding, Blackhole, Neigh-bor, Rushing, and Wormhole attacks, respectively.
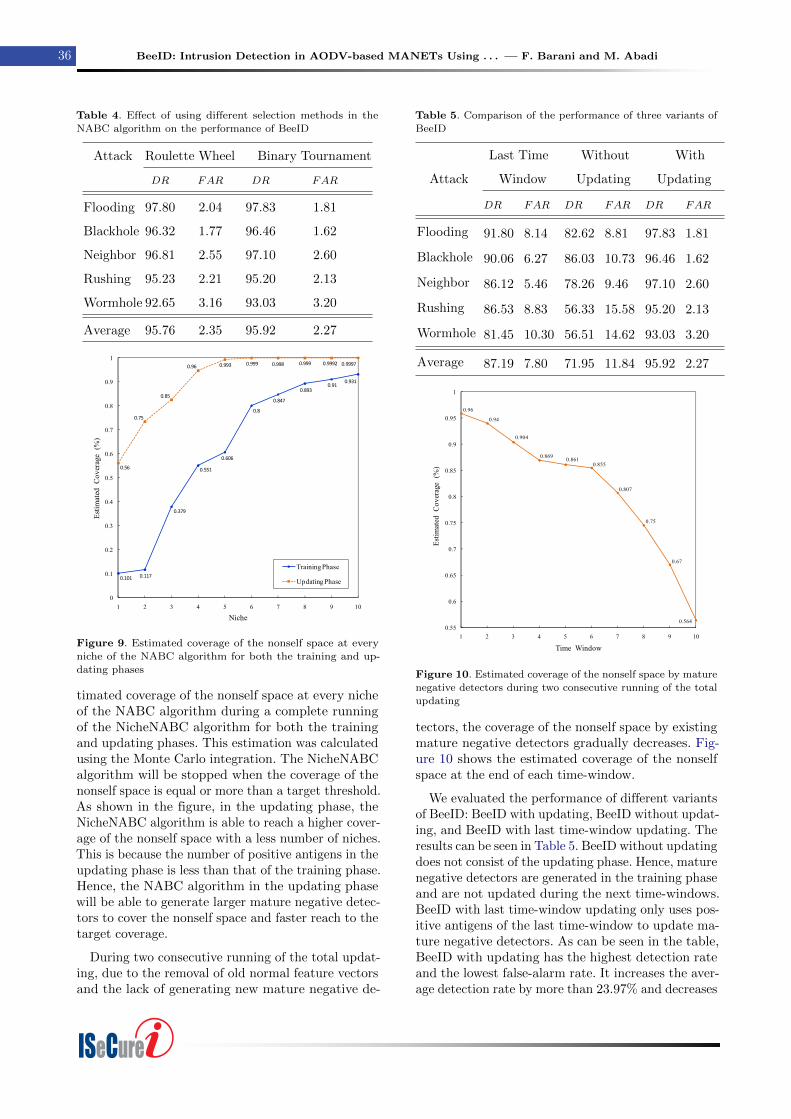
We implemented the NABC algorithm using differ-ent selection methods, including roulette wheel selec-tion and binary tournament selection. As shown inTable 4, both of these methods have the same effecton the performance of BeeID. However, binary tour-nament selection has a lower time complexity thanroulette wheel selection. Hence, we used it as the se-lection operator in the NABC algorithm.
As mentioned before, the NicheNABC algorithm iscomposed of a number of sequential and dependentniches of the NABC algorithm. Every niche of thisalgorithm increases the coverage of the nonself spaceby mature negative detectors. Figure 9 shows the es-
ISeCure
36 BeeID: Intrusion Detection in AODV-based MANETs Using . . . — F. Barani and M. Abadi
Table 4. Effect of using different selection methods in the
NABC algorithm on the performance of BeeID
Attack Roulette Wheel Binary Tournament
DR FAR DR FAR
Flooding 97.80 2.04 97.83 1.81
Blackhole 96.32 1.77 96.46 1.62
Neighbor 96.81 2.55 97.10 2.60
Rushing 95.23 2.21 95.20 2.13
Wormhole 92.65 3.16 93.03 3.20
Average 95.76 2.35 95.92 2.27
0.101 0.117
0.379
0.551
0.606
0.8
0.847
0.8930.91
0.931
0.56
0.75
0.85
0.96 0.993 0.999 0.998 0.999 0.9992 0.9997
0
0.1
0.2
0.3
0.4
0.5
0.6
0.7
0.8
0.9
1
1 2 3 4 5 6 7 8 9 10
Est
imat
ed C
over
age
(%
)
Niche
Training Phase
Updating Phase
Figure 9. Estimated coverage of the nonself space at every
niche of the NABC algorithm for both the training and up-dating phases
timated coverage of the nonself space at every nicheof the NABC algorithm during a complete runningof the NicheNABC algorithm for both the trainingand updating phases. This estimation was calculatedusing the Monte Carlo integration. The NicheNABCalgorithm will be stopped when the coverage of thenonself space is equal or more than a target threshold.As shown in the figure, in the updating phase, theNicheNABC algorithm is able to reach a higher cover-age of the nonself space with a less number of niches.This is because the number of positive antigens in theupdating phase is less than that of the training phase.Hence, the NABC algorithm in the updating phasewill be able to generate larger mature negative detec-tors to cover the nonself space and faster reach to thetarget coverage.
During two consecutive running of the total updat-ing, due to the removal of old normal feature vectorsand the lack of generating new mature negative de-
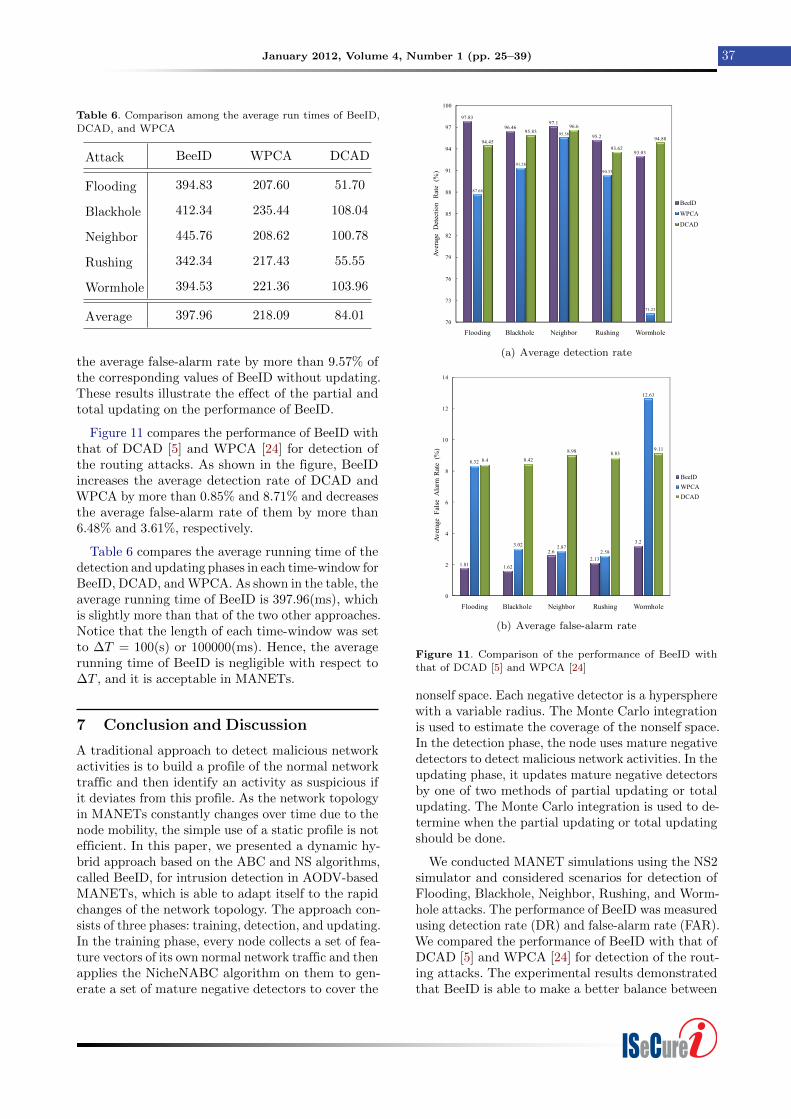
Table 5. Comparison of the performance of three variants of
BeeID
Last Time Without With
Attack Window Updating Updating
DR FAR DR FAR DR FAR
Flooding 91.80 8.14 82.62 8.81 97.83 1.81
Blackhole 90.06 6.27 86.03 10.73 96.46 1.62
Neighbor 86.12 5.46 78.26 9.46 97.10 2.60
Rushing 86.53 8.83 56.33 15.58 95.20 2.13
Wormhole 81.45 10.30 56.51 14.62 93.03 3.20
Average 87.19 7.80 71.95 11.84 95.92 2.27
0.96
0.94
0.904
0.8690.861
0.855
0.807
0.75
0.67
0.5640.55
0.6
0.65
0.7
0.75
0.8
0.85
0.9
0.95
1
1 2 3 4 5 6 7 8 9 10
Est
imat
ed C
over
age
(%
)
Time Window
Figure 10. Estimated coverage of the nonself space by mature
negative detectors during two consecutive running of the totalupdating
tectors, the coverage of the nonself space by existingmature negative detectors gradually decreases. Fig-ure 10 shows the estimated coverage of the nonselfspace at the end of each time-window.
We evaluated the performance of different variantsof BeeID: BeeID with updating, BeeID without updat-ing, and BeeID with last time-window updating. Theresults can be seen in Table 5. BeeID without updatingdoes not consist of the updating phase. Hence, maturenegative detectors are generated in the training phaseand are not updated during the next time-windows.BeeID with last time-window updating only uses pos-itive antigens of the last time-window to update ma-ture negative detectors. As can be seen in the table,BeeID with updating has the highest detection rateand the lowest false-alarm rate. It increases the aver-age detection rate by more than 23.97% and decreases
ISeCure
January 2012, Volume 4, Number 1 (pp. 25–39) 37
Table 6. Comparison among the average run times of BeeID,
DCAD, and WPCA
Attack BeeID WPCA DCAD
Flooding 394.83 207.60 51.70
Blackhole 412.34 235.44 108.04
Neighbor 445.76 208.62 100.78
Rushing 342.34 217.43 55.55
Wormhole 394.53 221.36 103.96
Average 397.96 218.09 84.01
the average false-alarm rate by more than 9.57% ofthe corresponding values of BeeID without updating.These results illustrate the effect of the partial andtotal updating on the performance of BeeID.
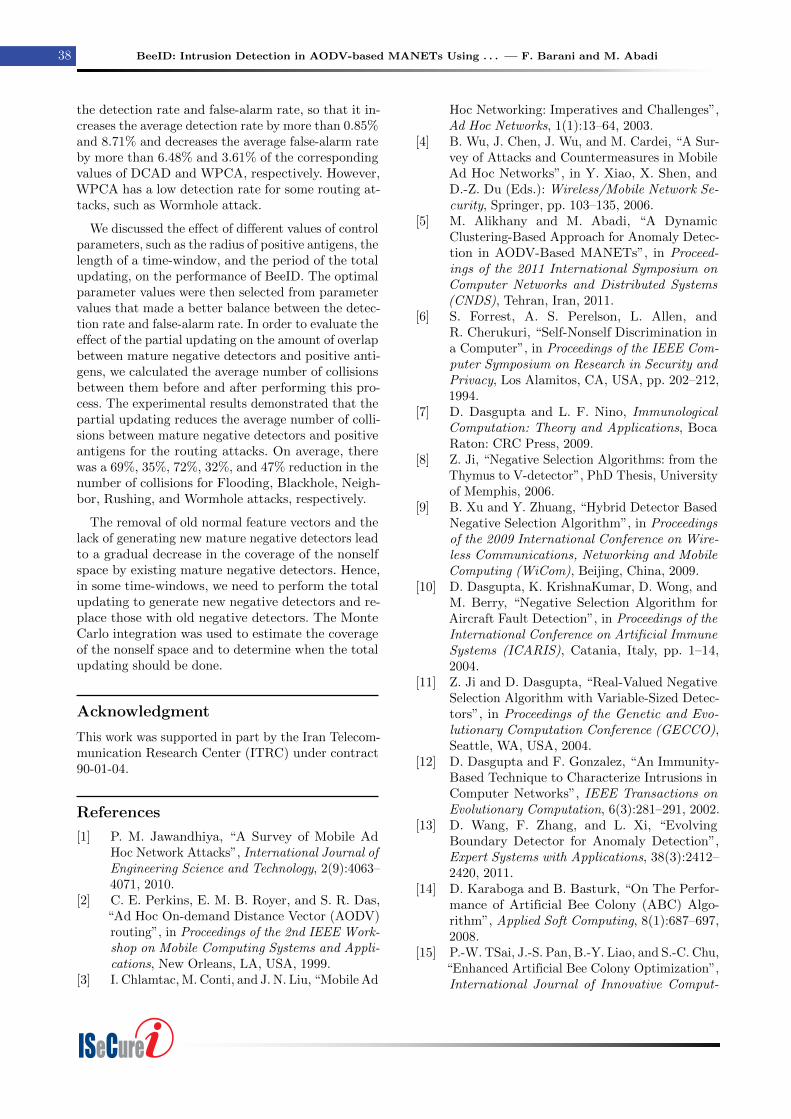
Figure 11 compares the performance of BeeID withthat of DCAD [5] and WPCA [24] for detection ofthe routing attacks. As shown in the figure, BeeIDincreases the average detection rate of DCAD andWPCA by more than 0.85% and 8.71% and decreasesthe average false-alarm rate of them by more than6.48% and 3.61%, respectively.
Table 6 compares the average running time of thedetection and updating phases in each time-window forBeeID, DCAD, and WPCA. As shown in the table, theaverage running time of BeeID is 397.96(ms), whichis slightly more than that of the two other approaches.Notice that the length of each time-window was setto ∆T = 100(s) or 100000(ms). Hence, the averagerunning time of BeeID is negligible with respect to∆T , and it is acceptable in MANETs.
7 Conclusion and Discussion
A traditional approach to detect malicious networkactivities is to build a profile of the normal networktraffic and then identify an activity as suspicious ifit deviates from this profile. As the network topologyin MANETs constantly changes over time due to thenode mobility, the simple use of a static profile is notefficient. In this paper, we presented a dynamic hy-brid approach based on the ABC and NS algorithms,called BeeID, for intrusion detection in AODV-basedMANETs, which is able to adapt itself to the rapidchanges of the network topology. The approach con-sists of three phases: training, detection, and updating.In the training phase, every node collects a set of fea-ture vectors of its own normal network traffic and thenapplies the NicheNABC algorithm on them to gen-erate a set of mature negative detectors to cover the
97.83
96.4697.1
95.2
93.03
87.68
91.28
95.56
90.33
71.23
94.45
95.8396.6
93.62
94.88
70
73
76
79
82
85
88
91
94
97
100
Flooding Blackhole Neighbor Rushing Wormhole
Ave
rage
D
etec
tion
R
ate
(%
)
BeeID
WPCA
DCAD
(a) Average detection rate
1.81 1.62
2.6
2.13
3.2
8.32
3.02 2.872.58
12.63
8.4 8.42
8.98 8.839.11
0
2
4
6
8
10
12
14
Flooding Blackhole Neighbor Rushing Wormhole
Ave
rage
F
alse
Ala
rm R
ate
(%
)
BeeID
WPCA
DCAD
(b) Average false-alarm rate
Figure 11. Comparison of the performance of BeeID withthat of DCAD [5] and WPCA [24]
nonself space. Each negative detector is a hyperspherewith a variable radius. The Monte Carlo integrationis used to estimate the coverage of the nonself space.In the detection phase, the node uses mature negativedetectors to detect malicious network activities. In theupdating phase, it updates mature negative detectorsby one of two methods of partial updating or totalupdating. The Monte Carlo integration is used to de-termine when the partial updating or total updatingshould be done.
We conducted MANET simulations using the NS2simulator and considered scenarios for detection ofFlooding, Blackhole, Neighbor, Rushing, and Worm-hole attacks. The performance of BeeID was measuredusing detection rate (DR) and false-alarm rate (FAR).We compared the performance of BeeID with that ofDCAD [5] and WPCA [24] for detection of the rout-ing attacks. The experimental results demonstratedthat BeeID is able to make a better balance between
ISeCure
38 BeeID: Intrusion Detection in AODV-based MANETs Using . . . — F. Barani and M. Abadi
the detection rate and false-alarm rate, so that it in-creases the average detection rate by more than 0.85%and 8.71% and decreases the average false-alarm rateby more than 6.48% and 3.61% of the correspondingvalues of DCAD and WPCA, respectively. However,WPCA has a low detection rate for some routing at-tacks, such as Wormhole attack.
We discussed the effect of different values of controlparameters, such as the radius of positive antigens, thelength of a time-window, and the period of the totalupdating, on the performance of BeeID. The optimalparameter values were then selected from parametervalues that made a better balance between the detec-tion rate and false-alarm rate. In order to evaluate theeffect of the partial updating on the amount of overlapbetween mature negative detectors and positive anti-gens, we calculated the average number of collisionsbetween them before and after performing this pro-cess. The experimental results demonstrated that thepartial updating reduces the average number of colli-sions between mature negative detectors and positiveantigens for the routing attacks. On average, therewas a 69%, 35%, 72%, 32%, and 47% reduction in thenumber of collisions for Flooding, Blackhole, Neigh-bor, Rushing, and Wormhole attacks, respectively.
The removal of old normal feature vectors and thelack of generating new mature negative detectors leadto a gradual decrease in the coverage of the nonselfspace by existing mature negative detectors. Hence,in some time-windows, we need to perform the totalupdating to generate new negative detectors and re-place those with old negative detectors. The MonteCarlo integration was used to estimate the coverageof the nonself space and to determine when the totalupdating should be done.
Acknowledgment
This work was supported in part by the Iran Telecom-munication Research Center (ITRC) under contract90-01-04.
References
[1] P. M. Jawandhiya, “A Survey of Mobile AdHoc Network Attacks”, International Journal ofEngineering Science and Technology, 2(9):4063–4071, 2010.
[2] C. E. Perkins, E. M. B. Royer, and S. R. Das,“Ad Hoc On-demand Distance Vector (AODV)routing”, in Proceedings of the 2nd IEEE Work-shop on Mobile Computing Systems and Appli-cations, New Orleans, LA, USA, 1999.
[3] I. Chlamtac, M. Conti, and J. N. Liu, “Mobile Ad
Hoc Networking: Imperatives and Challenges”,Ad Hoc Networks, 1(1):13–64, 2003.
[4] B. Wu, J. Chen, J. Wu, and M. Cardei, “A Sur-vey of Attacks and Countermeasures in MobileAd Hoc Networks”, in Y. Xiao, X. Shen, andD.-Z. Du (Eds.): Wireless/Mobile Network Se-curity, Springer, pp. 103–135, 2006.
[5] M. Alikhany and M. Abadi, “A DynamicClustering-Based Approach for Anomaly Detec-tion in AODV-Based MANETs”, in Proceed-ings of the 2011 International Symposium onComputer Networks and Distributed Systems(CNDS), Tehran, Iran, 2011.
[6] S. Forrest, A. S. Perelson, L. Allen, andR. Cherukuri, “Self-Nonself Discrimination ina Computer”, in Proceedings of the IEEE Com-puter Symposium on Research in Security andPrivacy, Los Alamitos, CA, USA, pp. 202–212,1994.
[7] D. Dasgupta and L. F. Nino, ImmunologicalComputation: Theory and Applications, BocaRaton: CRC Press, 2009.
[8] Z. Ji, “Negative Selection Algorithms: from theThymus to V-detector”, PhD Thesis, Universityof Memphis, 2006.
[9] B. Xu and Y. Zhuang, “Hybrid Detector BasedNegative Selection Algorithm”, in Proceedingsof the 2009 International Conference on Wire-less Communications, Networking and MobileComputing (WiCom), Beijing, China, 2009.
[10] D. Dasgupta, K. KrishnaKumar, D. Wong, andM. Berry, “Negative Selection Algorithm forAircraft Fault Detection”, in Proceedings of theInternational Conference on Artificial ImmuneSystems (ICARIS), Catania, Italy, pp. 1–14,2004.
[11] Z. Ji and D. Dasgupta, “Real-Valued NegativeSelection Algorithm with Variable-Sized Detec-tors”, in Proceedings of the Genetic and Evo-lutionary Computation Conference (GECCO),Seattle, WA, USA, 2004.
[12] D. Dasgupta and F. Gonzalez, “An Immunity-Based Technique to Characterize Intrusions inComputer Networks”, IEEE Transactions onEvolutionary Computation, 6(3):281–291, 2002.
[13] D. Wang, F. Zhang, and L. Xi, “EvolvingBoundary Detector for Anomaly Detection”,Expert Systems with Applications, 38(3):2412–2420, 2011.
[14] D. Karaboga and B. Basturk, “On The Perfor-mance of Artificial Bee Colony (ABC) Algo-rithm”, Applied Soft Computing, 8(1):687–697,2008.
[15] P.-W. TSai, J.-S. Pan, B.-Y. Liao, and S.-C. Chu,“Enhanced Artificial Bee Colony Optimization”,International Journal of Innovative Comput-
ISeCure
January 2012, Volume 4, Number 1 (pp. 25–39) 39
ing, Information and Control, 5(12):5081–5092,2009.
[16] D. Karaboga and C. Ozturk, “Fuzzy Cluster-ing with Artificial Bee Colony Algorithm”, Sci-entific Research and Essays, 5(14):1899–1902,2010.
[17] F. Gonzalez, D. Dasgupta, and L. F. Nino, “ARandomized Real-Valued Negative Selection Al-gorithm”, in Proceedings of the 2nd Interna-tional Conference on Artificial Immune Systems,Edinburgh, UK, pp. 261–272, 2003.
[18] P. Papadimitratos and Z. J. Haas, “Secure Rout-ing for Mobile Ad Hoc Networks”, in Proceed-ings of the SCS Communication Networks andDistributed Systems Modeling and SimulationConference (CNDS), San Antonio, TX, USA,2002.
[19] K. Sanzgiri, B. Dahill, B. N. Levine, C. Shields.,and E. M. Belding-Royer, “A Secure RoutingProtocol for Ad Hoc Networks”, in Proceedingsof the 10th IEEE International Conference onNetwork Protocols (ICNP), Paris, France, 2002.
[20] M. Ostaszewski, F. Seredynski, and P. Bouvry,“Immune Anomaly Detection Enhanced withEvolutionary Paradigms”, in Proceedings of theGenetic and Evolutionary Computation Confer-ence (GECCO), Seattle, WA, USA, 2006.
[21] S. Balachandran, D. Dasgupta, and L. Wang,“A Hybrid Approach for Misbehavior Detectionin Wireless Ad Hoc Networks”, in Proceedingsof the 1st Annual Symposium on InformationAssurance, New York, USA, 2006.
[22] S. Sarafijanovic, J. Boudec, “Secondary Re-sponse for Misbehavior Detection in Mobile AdHoc Networks”, IEEE Transaction on NeuralNetworks, 16(5):1076–1087, 2005.
[23] X. Hang and H. Dai, “Applying both Positiveand Negative Selection to Supervised Learningfor Anomaly Detection”, in Proceedings of Ge-netic and Evolutionary Computation (GECCO),Washington DC, USA, 2005.
[24] H. Nakayama, S. Kurosawa, A. Jamalipour,Y. Nemoto, and N. Kato, “A Dynamic AnomalyDetection Scheme for AODV-Based Mobile AdHoc Networks”, IEEE Transactions on Vehicu-lar Technology, 58(5):2471–2481, 2009.
[25] D. Karaboga, An Idea Based On Honey BeeSwarm for Numerical Optimization, TechnicalReport, TR-06, Erciyes University, 2005.
[26] S. Taneja and A. Kush, “A Survey of RoutingProtocols in Mobile Ad Hoc Networks”, Inter-national Journal of Innovation, Managementand Technology (IJIMT), 1(3):279–285, 2010.
[27] D. B. Johnson, D. A. Maltz, and Y.-C. Hu, “TheDynamic Source Routing Protocol for MobileAd Hoc Networks (DSR)”, Internet Draft, IETF
MANET Working Group, 2003.[28] V. Park and S. Corson, “Temporally-Ordered
Routing Algorithm (TORA)”, Functional Spec-ification, Internet Draft, IETF MANET Work-ing Group, 2001.
[29] X. Wang and J. Wong, “An End-to-end Detec-tion of Wormhole Attack in Wireless Ad HocNetworks”, in Proceedings of the 31st Annual In-ternational Computer Software and ApplicationsConference (COMPSAC), 1(1):39–48, 2007.
[30] G. S. Fishman, Monte Carlo: Concepts, Algo-rithms, and Applications, New York: Springer-Verlag, 1995.
[31] T. Stibor, J. Timmis, and C. Eckert, “On the Useof Hyperspheres in Artificial Immune Systems asAntibody Recognition Regions”, in Proceedingsof 5th International Conference on ArtificialImmune Systems (CARIS ), Oeiras, Portugal,Springer-Verlag, vol. 4163, pp. 215–228, 2006.
[32] NS2—The Network Simulator, http://
www.isi.edu/nsnam/ns/.
Fatemeh Barani received the B.Sc.degree in computer engineering fromFerdowsi University of Mashhad in2008 and is currently a M.Sc. stu-dent of computer engineering at Tar-biat Modares University. Her main re-
search interests are network security, intrusion detec-tion, evolutionary computation, and swarm intelli-gence. Currently, she works on her thesis on anomalydetection in mobile ad hoc networks using negativeselection and artificial bee colony algorithms.
Mahdi Abadi received the B.Sc. andM.Sc. degrees in computer engineeringfrom Ferdowsi University of Mashhadin 1998 and Tarbiat Modares Univer-sity in 2001, respectively. He also re-ceived the Ph.D. degree from TarbiatModares University in 2008, where he
worked on the network vulnerability analysis. Since2009, he has been an assistant professor in the Facultyof Electrical and Computer Engineering at TarbiatModares University. His main research interests arenetwork security, intrusion detection and prevention,malware detection and analysis, evolutionary algo-rithms, and data mining.
ISeCure