Embed Size (px)
Citation preview
Beef Rough Indicator and Calculator of Key performance indicators (BRICK)
Version 1.00
Queensland Department of Agriculture and Forestry Queensland Alliance for Agriculture and Food Innovation
Meat & Livestock Australia
Prototype 2011 - 2015
Version 1.00 (current) 2015
This document was prepared by Timothy Moravek of Queensland’s Department of Agriculture and Forestry.
Notice to users
This documentation is distributed on the following conditions:
Copyright © State of Queensland, 2015.
The Queensland Government supports and encourages the dissemination and exchange of its information. The copyright in this publication is licensed under a Creative Commons Attribution 3.0 Australia (CC BY) licence.
Under this licence you are free, without having to seek our permission, to use this publication in accordance with the licence terms.
You must keep intact the copyright notice and attribute the State of Queensland as the source of the publication.
For more information on this licence, visit http://creativecommons.org/licenses/by/3.0/au/deed.en
The information contained herein is subject to change without notice. The Queensland Government shall not be liable for technical or other errors or omissions contained herein. The reader/user accepts all risks and responsibility for losses, damages, costs and other consequences resulting directly or indirectly from using this information.
Your use of the BRICK Software and this manual are subject to the Software Licence available within the spreadsheet.
This manual was last updated September 2015.
i
Acknowledgements
The beef industry is plagued with ambiguous language. When we ask about cow herd performance, most gleefully respond with talk about “weaning rates”, “mortality rates” and the like. But how do they get these figures? And where is the evidence that they are indicative of business performance?
During the recently completed MLA-funded CashCow project managed by the University of Queensland, it was realised that for producers to use the recommendations from the project, they would have to know that they needed them. In other words, before setting about to improve some aspect of a beef business, a clear understanding is required of the business situation to then drive economic analyses of where the real opportunities are. The big breakthroughs are always made by asking the right question. The right questions include the likes of: What is the annual liveweight production per cow? Liveweight production is a direct indicator of income. But who measures it? It’s dead easy to measure in steers, but in cows? The good news is the BRICK can answer these questions using the absolute minimum amount of information: a standard livestock schedule and transaction records, combined with summary financial data. The BRICK is simply a big mob of mathematics you can do with a pencil, but takes away the pain by doing the calculations in a standardised way.
With strong support from the CashCow team led by Professor Michael McGowan (UQ), Geoffry Fordyce (QAAFI) conceived the idea and wrote the first versions of the BRICK. Well-respected farm business advisers Dr Phil Holmes and Tom Newsome provided technical support. Feedback from many, such as RCS and beef producers who tried early (clumsy) versions was gratefully received. Tim Moravek, a well-respected DAF (Queensland government) economist road tested the BRICK, and with assistance from Dave Smith (DAF), has polished and packaged it for general use. Gordon Simpson assisted with programming measures. All help was greatly appreciated.
Geoffry Fordyce
ii
Contents Contents .................................................................................................................................................. ii
Table of figures ...................................................................................................................................... iii
Getting started ........................................................................................................................................ 1
System requirements .......................................................................................................................... 1
Installing and uninstalling ................................................................................................................... 1
File management ................................................................................................................................ 1
Saving and loading .............................................................................................................................. 1
Copying data and text ......................................................................................................................... 1
About the BRICK program ....................................................................................................................... 2
A summary of the components .......................................................................................................... 2
Concepts underpinning the BRICK .......................................................................................................... 3
Management accounting .................................................................................................................... 3
Adult equivalents ................................................................................................................................ 3
Fixed and variable costs ...................................................................................................................... 3
CashCow key performance indicators ................................................................................................ 3
Using the BRICK ....................................................................................................................................... 4
Navigation ........................................................................................................................................... 4
Data entry ........................................................................................................................................... 5
Year entry ........................................................................................................................................ 5
Region ............................................................................................................................................. 6
The combined business ................................................................................................................... 6
Herd structure and mating age ....................................................................................................... 6
Class of cattle: description at closing .............................................................................................. 7
Cattle transactions and transactions entry ..................................................................................... 8
Calculators .......................................................................................................................................... 9
Livestock trading calculations, summary calculations and summary of results ................................. 9
Key performance indicators ................................................................................................................ 9
Error messages and alerts ..................................................................................................................... 11
Contact us and feedback ....................................................................................................................... 11
Recommended reading ......................................................................................................................... 11
Appendix ............................................................................................................................................... 12
List of definitions and terminology ................................................................................................... 13
iii
Table of figures Figure 1: Navigating the Worksheet tabs ............................................................................................... 4
Figure 2: The “Navigation” worksheet .................................................................................................... 4
Figure 3: Example of country type selection .......................................................................................... 6
Figure 4: Combined business table ......................................................................................................... 6
Figure 5: Mating management input ...................................................................................................... 6
Figure 6: Herd structure input table ....................................................................................................... 7
Figure 7: Example of inventory valuation ............................................................................................... 7
Figure 8: Example of a completed transaction entry table .................................................................... 8
Figure 9: Example of a summarised table of average sale weights ........................................................ 8
Figure 10: Calculator tab ......................................................................................................................... 9
Figure 11: Check Deaths section error .................................................................................................. 11
Figure 13: Map of CashCow productivity regions ................................................................................. 12
1
Getting started The BRICK is a business analysis spreadsheet that aims to assess the productivity and profitability of extensive grazing enterprises. This document will assist in navigating and using the spreadsheet, however, for interpretation of results and key performance indicators, please see recommended reading for links to CashCow final reports.
System requirements • Microsoft Excel 2010 and later. May work on Excel 2007, but is untested.
Installing and uninstalling The BRICK is downloadable from the FutureBeef website at www.futurebeef.com.
Since the BRICK is an excel spreadsheet it does not require installation. Uninstalling is not required. To remove the BRICK from your system, simply delete the excel file. However, this will cause data loss of any data contained in the file.
File management The BRICK is downloaded as a single excel formatted file. It is suggested that a master file be kept – see saving and loading below. However, a fresh copy can be downloaded from the above-mentioned address.
Saving and loading The BRICK uses the default ‘Save’ and ‘Save As’ procedures provided by Microsoft Excel. Any data entered saves into the file. It is therefore recommended that a master copy of the BRICK be stored and each business or enterprise uses a copy of the Master file. This can be achieved by copy and pasting a copy of the master file using Windows Explorer or using the ‘Save As’ function in Microsoft Excel to create a new version of BRICK.
Copying data and text No formal procedure exists to copy and paste texts between BRICK excel files. A normal copy and paste to relevant cells will work in the majority of cases.
2
About the BRICK program The BRICK spreadsheet consists of nine spreadsheet tabs. They are: licence, notes, data entry, calculators, livestock trading calculations, summary calculations, summary of results and key performance indicators. One of the tabs is hidden: lookups. The lookups tab contains information required for the program to run that is not relevant to the user.
A summary of the components The following summarises the use and importance of each tab.
• The Licence tab outlines the licence agreement for users of the product. • The Notes tab is a collection of handy tips and hints regarding the use of the spreadsheet. • The Data entry tab is where all data entry is ultimately done, including business, livestock
inventory and trading, country type etc. • The Lookups (Hidden) tab contains information relevant for the program to run. This tab is
hidden as it provides no extra information and is only used for reference points. • The Calculators tab assists in the calculation of variable costs, adjusted overheads if required
and pro-rata calculations of multi-property businesses. • The Livestock trading calculations tab shows the reconciliation of livestock trading schedule
and market valuations used for opening and closing inventory. All formulas are shown. • The Summary calculations tab shows the results and formulas of key performance
indicators. All formulas are shown. • The Summary of results tab shows a few key performance indicators, averaged over five
years, from the summary calculations tab. No formulas are shown, but can be seen in the summary calculations tab. This tab is useful as a quick reference tab.
• The Key performance indicator tab uses graphical displays each year of key performance indicators against regional indicators.
3
Concepts underpinning the BRICK This section will outline some of the important technical information underpinning the calculations and results BRICK uses and produces.
Management accounting The BRICK uses the concept of management accounting. A simple definition for management accounting is that managers can use the information in order to make better management decisions about their business. It also allows managers an intricate view of the internal structures of their enterprise to understand the performance of both the whole organisation and individual parts of the organisation.
To achieve this for beef enterprises the BRICK uses market valuations for inventory, as opposed to taxation values, which are then used for calculating key financial performance indicators such as gross margin, operating margin, cost of production and return on cattle capital for any or all of the entire herd, adult equivalent, or per kilogram metric.
Adult equivalents Another key concept underpinning BRICK calculations is that of adult equivalents. The calculation of the total adult equivalents for each herd indicates the relative grazing pressure exerted by the herd.
An immediate problem encountered in beef herds is that not all cattle are the same size and do not eat the same amount of feed, e.g. weaners eat less than bullocks. Likewise, a herd of 2000 cattle comprising breeders turning off weaners will most likely not eat the same amount as a herd of 2000 comprising fewer cows but turning off older steers.
To ensure that herds are compared equally based on consuming the same amount of feed, feed requirements are estimated for each class of cattle relative to an adult equivalent. For the BRICK program, an adult equivalent is a non-pregnant, non-lactating beast of an average weight of 450 kg.
Fixed and variable costs A variable cost is an input cost that increases for each unit of output. For beef enterprises, costs like vaccinations, supplementary feeding, tags, dips and drenches are all variable. A fixed cost is everything else, except finance and taxation costs.
CashCow key performance indicators Understanding the key performance indicators is important in the context of understanding the outputs of the BRICK. It is recommended to read the CashCow report, which can be located at www.mla.com.au.
4
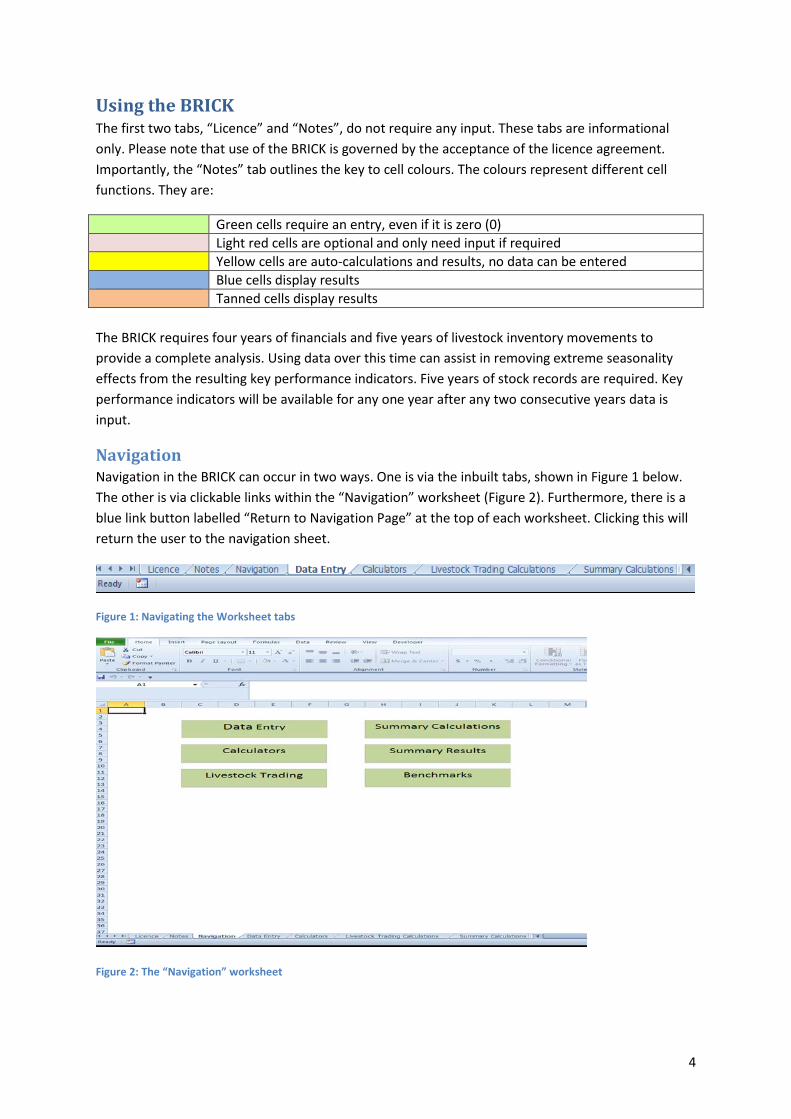
Using the BRICK The first two tabs, “Licence” and “Notes”, do not require any input. These tabs are informational only. Please note that use of the BRICK is governed by the acceptance of the licence agreement. Importantly, the “Notes” tab outlines the key to cell colours. The colours represent different cell functions. They are:
Green cells require an entry, even if it is zero (0) Light red cells are optional and only need input if required Yellow cells are auto-calculations and results, no data can be entered Blue cells display results Tanned cells display results The BRICK requires four years of financials and five years of livestock inventory movements to provide a complete analysis. Using data over this time can assist in removing extreme seasonality effects from the resulting key performance indicators. Five years of stock records are required. Key performance indicators will be available for any one year after any two consecutive years data is input.
Navigation Navigation in the BRICK can occur in two ways. One is via the inbuilt tabs, shown in Figure 1 below. The other is via clickable links within the “Navigation” worksheet (Figure 2). Furthermore, there is a blue link button labelled “Return to Navigation Page” at the top of each worksheet. Clicking this will return the user to the navigation sheet.
Figure 1: Navigating the Worksheet tabs
Figure 2: The “Navigation” worksheet
5
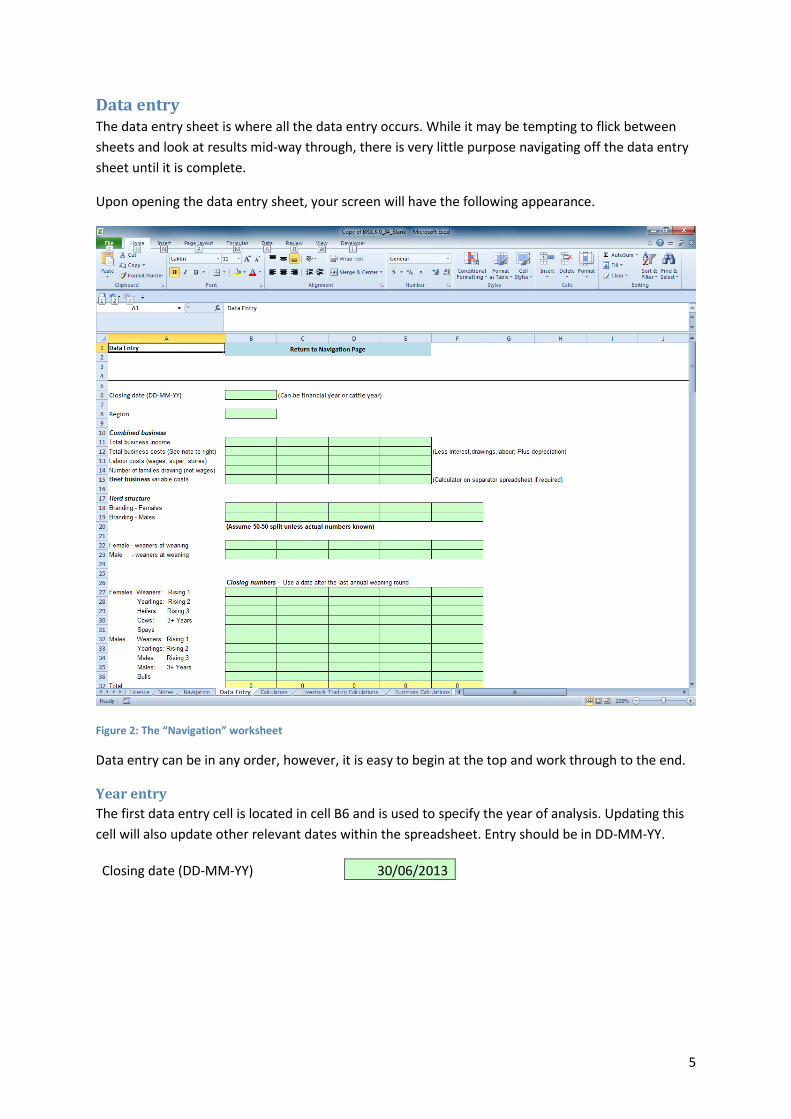
Data entry The data entry sheet is where all the data entry occurs. While it may be tempting to flick between sheets and look at results mid-way through, there is very little purpose navigating off the data entry sheet until it is complete.
Upon opening the data entry sheet, your screen will have the following appearance.
Figure 2: The “Navigation” worksheet
Data entry can be in any order, however, it is easy to begin at the top and work through to the end.
Year entry The first data entry cell is located in cell B6 and is used to specify the year of analysis. Updating this cell will also update other relevant dates within the spreadsheet. Entry should be in DD-MM-YY.
Closing date (DD-MM-YY) 30/06/2013
6
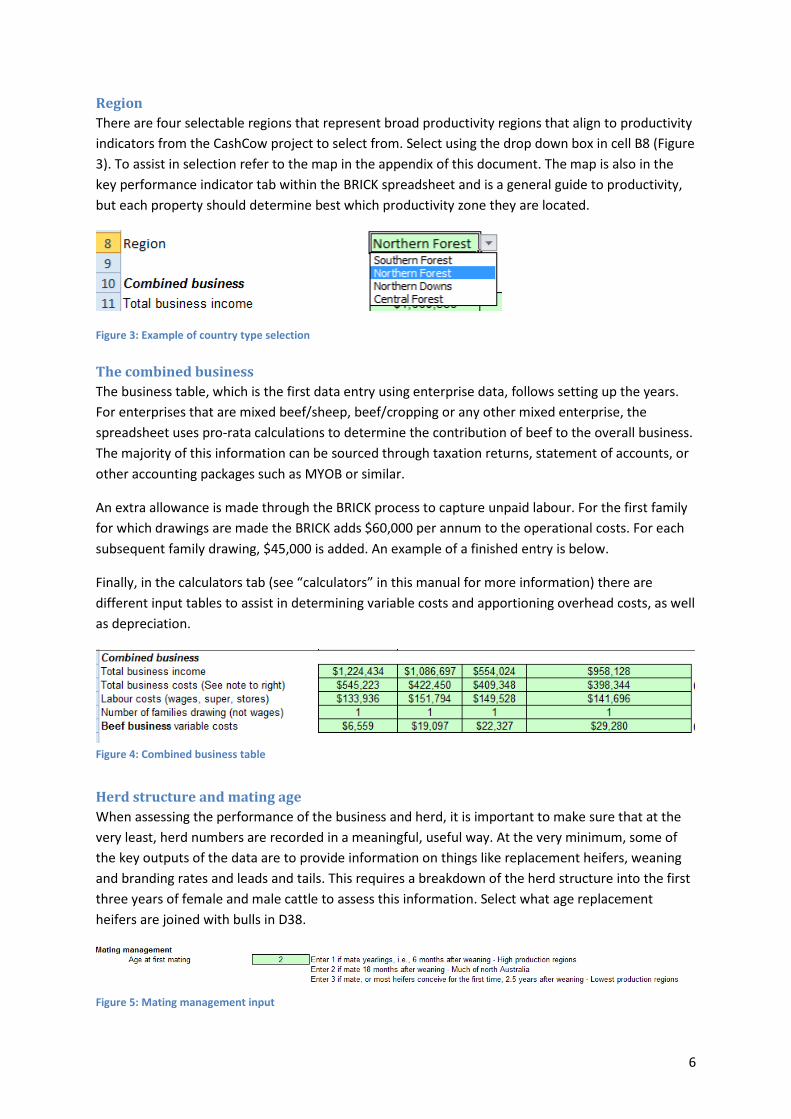
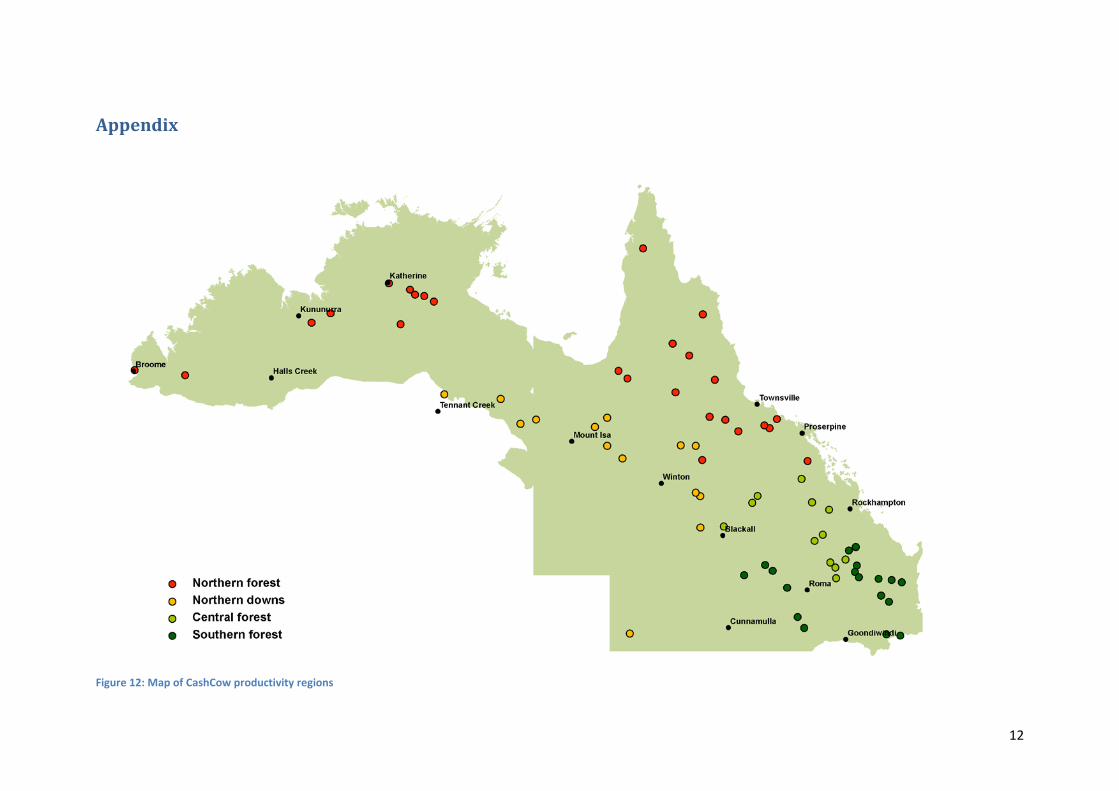
Region There are four selectable regions that represent broad productivity regions that align to productivity indicators from the CashCow project to select from. Select using the drop down box in cell B8 (Figure 3). To assist in selection refer to the map in the appendix of this document. The map is also in the key performance indicator tab within the BRICK spreadsheet and is a general guide to productivity, but each property should determine best which productivity zone they are located.
Figure 3: Example of country type selection The combined business The business table, which is the first data entry using enterprise data, follows setting up the years. For enterprises that are mixed beef/sheep, beef/cropping or any other mixed enterprise, the spreadsheet uses pro-rata calculations to determine the contribution of beef to the overall business. The majority of this information can be sourced through taxation returns, statement of accounts, or other accounting packages such as MYOB or similar.
An extra allowance is made through the BRICK process to capture unpaid labour. For the first family for which drawings are made the BRICK adds $60,000 per annum to the operational costs. For each subsequent family drawing, $45,000 is added. An example of a finished entry is below.
Finally, in the calculators tab (see “calculators” in this manual for more information) there are different input tables to assist in determining variable costs and apportioning overhead costs, as well as depreciation.
Figure 4: Combined business table
Herd structure and mating age When assessing the performance of the business and herd, it is important to make sure that at the very least, herd numbers are recorded in a meaningful, useful way. At the very minimum, some of the key outputs of the data are to provide information on things like replacement heifers, weaning and branding rates and leads and tails. This requires a breakdown of the herd structure into the first three years of female and male cattle to assess this information. Select what age replacement heifers are joined with bulls in D38.
Figure 5: Mating management input
7
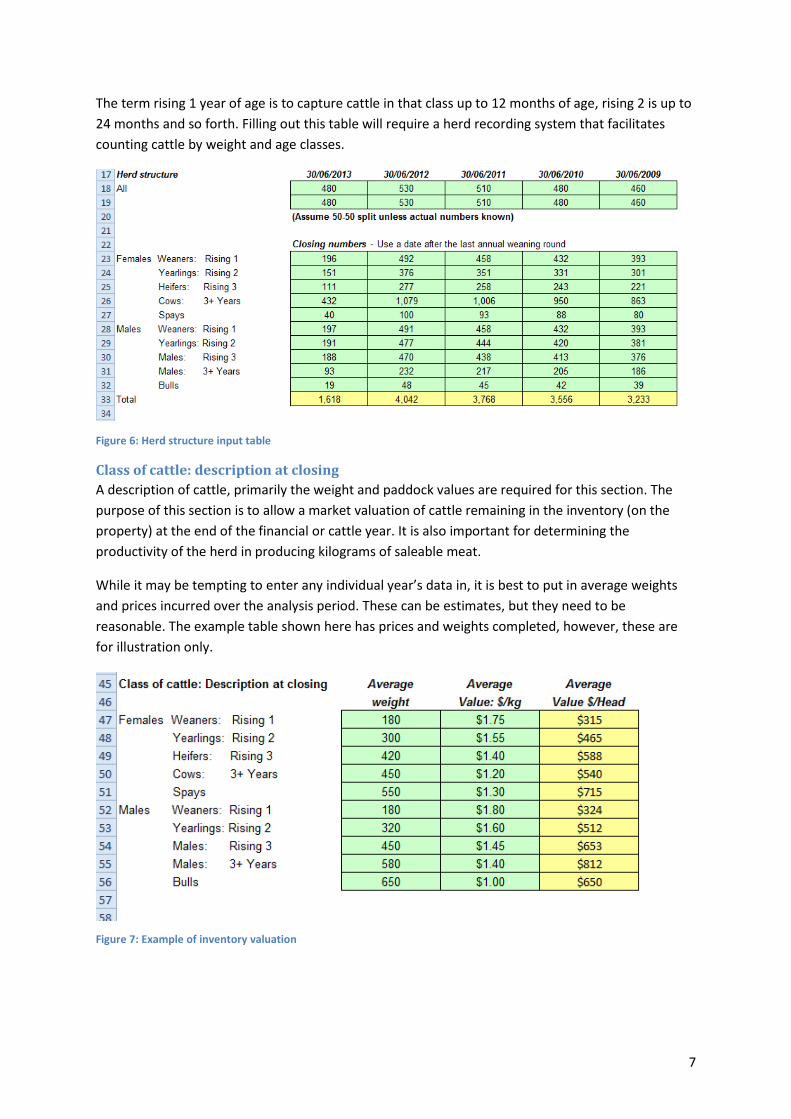
The term rising 1 year of age is to capture cattle in that class up to 12 months of age, rising 2 is up to 24 months and so forth. Filling out this table will require a herd recording system that facilitates counting cattle by weight and age classes.
Figure 6: Herd structure input table
Class of cattle: description at closing A description of cattle, primarily the weight and paddock values are required for this section. The purpose of this section is to allow a market valuation of cattle remaining in the inventory (on the property) at the end of the financial or cattle year. It is also important for determining the productivity of the herd in producing kilograms of saleable meat.
While it may be tempting to enter any individual year’s data in, it is best to put in average weights and prices incurred over the analysis period. These can be estimates, but they need to be reasonable. The example table shown here has prices and weights completed, however, these are for illustration only.
Figure 7: Example of inventory valuation
8
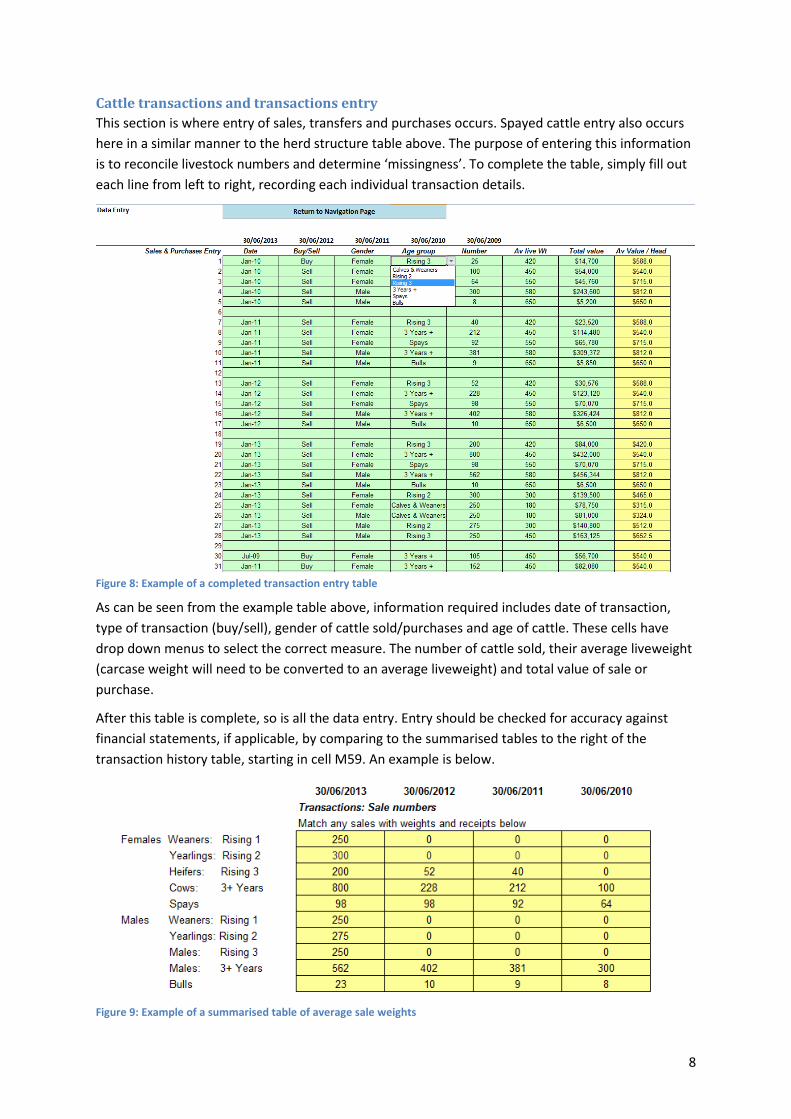
Cattle transactions and transactions entry This section is where entry of sales, transfers and purchases occurs. Spayed cattle entry also occurs here in a similar manner to the herd structure table above. The purpose of entering this information is to reconcile livestock numbers and determine ‘missingness’. To complete the table, simply fill out each line from left to right, recording each individual transaction details.
Figure 8: Example of a completed transaction entry table
As can be seen from the example table above, information required includes date of transaction, type of transaction (buy/sell), gender of cattle sold/purchases and age of cattle. These cells have drop down menus to select the correct measure. The number of cattle sold, their average liveweight (carcase weight will need to be converted to an average liveweight) and total value of sale or purchase.
After this table is complete, so is all the data entry. Entry should be checked for accuracy against financial statements, if applicable, by comparing to the summarised tables to the right of the transaction history table, starting in cell M59. An example is below.
Figure 9: Example of a summarised table of average sale weights
9
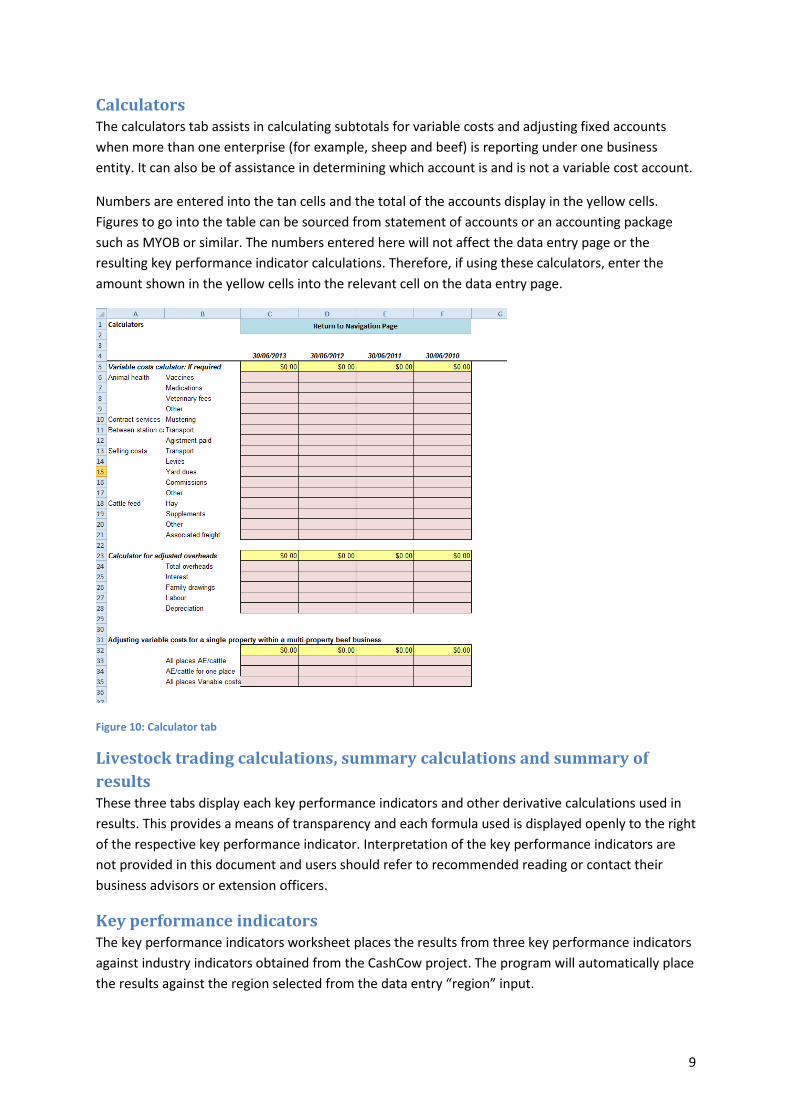
Calculators The calculators tab assists in calculating subtotals for variable costs and adjusting fixed accounts when more than one enterprise (for example, sheep and beef) is reporting under one business entity. It can also be of assistance in determining which account is and is not a variable cost account.
Numbers are entered into the tan cells and the total of the accounts display in the yellow cells. Figures to go into the table can be sourced from statement of accounts or an accounting package such as MYOB or similar. The numbers entered here will not affect the data entry page or the resulting key performance indicator calculations. Therefore, if using these calculators, enter the amount shown in the yellow cells into the relevant cell on the data entry page.
Figure 10: Calculator tab
Livestock trading calculations, summary calculations and summary of results These three tabs display each key performance indicators and other derivative calculations used in results. This provides a means of transparency and each formula used is displayed openly to the right of the respective key performance indicator. Interpretation of the key performance indicators are not provided in this document and users should refer to recommended reading or contact their business advisors or extension officers.
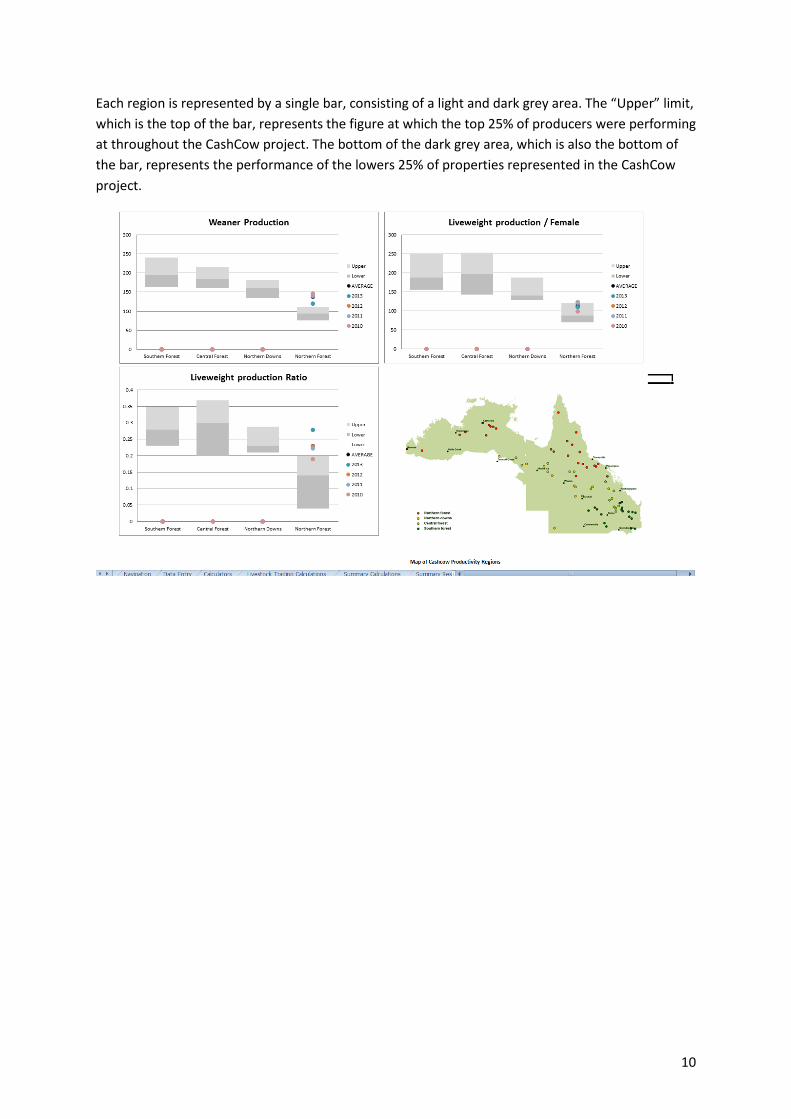
Key performance indicators The key performance indicators worksheet places the results from three key performance indicators against industry indicators obtained from the CashCow project. The program will automatically place the results against the region selected from the data entry “region” input.
10
Each region is represented by a single bar, consisting of a light and dark grey area. The “Upper” limit, which is the top of the bar, represents the figure at which the top 25% of producers were performing at throughout the CashCow project. The bottom of the dark grey area, which is also the bottom of the bar, represents the performance of the lowers 25% of properties represented in the CashCow project.
11
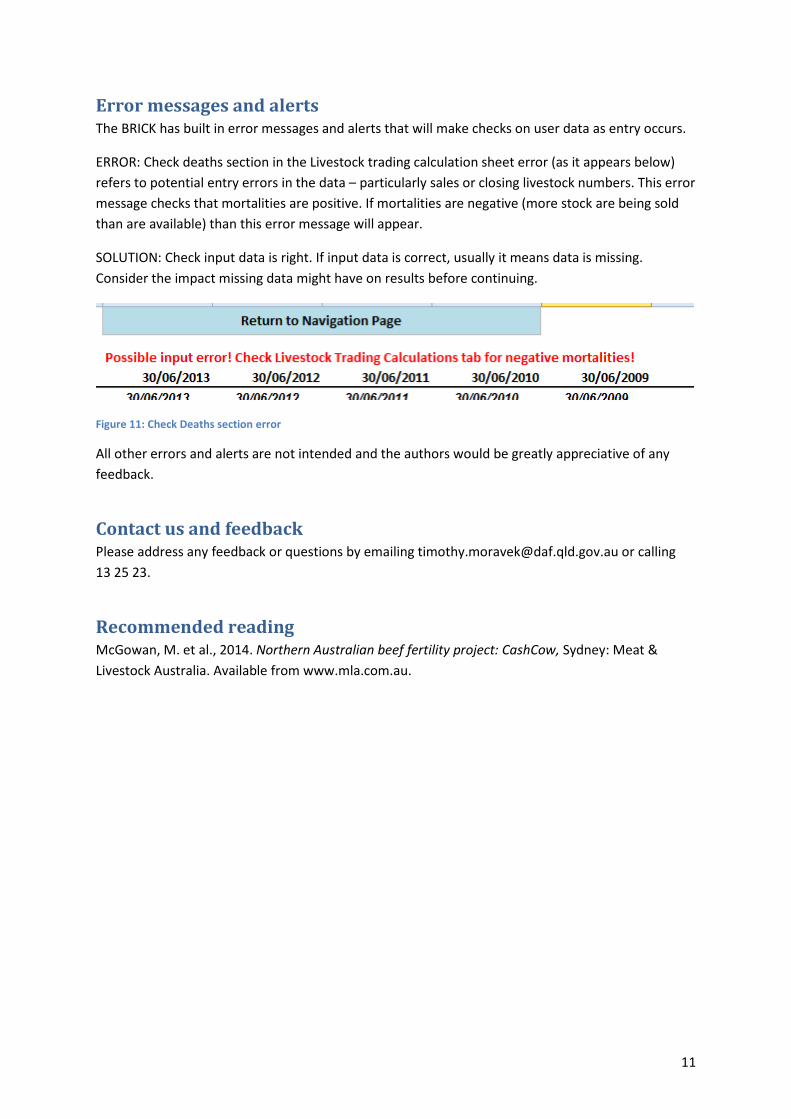
Error messages and alerts The BRICK has built in error messages and alerts that will make checks on user data as entry occurs.
ERROR: Check deaths section in the Livestock trading calculation sheet error (as it appears below) refers to potential entry errors in the data – particularly sales or closing livestock numbers. This error message checks that mortalities are positive. If mortalities are negative (more stock are being sold than are available) than this error message will appear.
SOLUTION: Check input data is right. If input data is correct, usually it means data is missing. Consider the impact missing data might have on results before continuing.
Figure 11: Check Deaths section error
All other errors and alerts are not intended and the authors would be greatly appreciative of any feedback.
Contact us and feedback Please address any feedback or questions by emailing [email protected] or calling 13 25 23.
Recommended reading McGowan, M. et al., 2014. Northern Australian beef fertility project: CashCow, Sydney: Meat & Livestock Australia. Available from www.mla.com.au.
12
Appendix
Figure 12: Map of CashCow productivity regions
13
List of definitions and terminology Some of this list of definitions and terminology are adapted from (McGowan, et al., 2014) and (Chudleigh, 2015).
Adult equivalent (AE): Cattle of different ages and body weight have different requirements for feed. In determining the composition and grazing pressure of a herd, it is necessary to work on a common animal unit. In this analysis an AE is defined as a 450 kg dry animal.
Note: Adult equivalents for dry cattle are based on relativity to a standard weight of beast carried for 12 months. AEs for breeders are based on weight, plus a loading for breeders that have (or wean) a calf. This loading represents the extra nutritional requirement of a cow that rears a calf, relative to a dry cow. The loading for rearing a calf can be between 20% and 35% of the loading given to the breeder depending upon the modelling process used and the age to which the cow calf unit is being assessed. The loading usually covers the extra load of pregnancy and lactation. In some models it will also cover the pasture consumed by the calf itself up to age five months, at which point the weaner can be rated in its own right. In the BRICK, the lactation allowance covers the weaner until six months of time.
Adult equivalents are calculated for a PERIOD of time, not for a point in time. Except for weaners and sale cattle, this will be 12 months, e.g. from age 12 months to 24 months. The weaner group will usually be rated up until weaning for keepers and (more or) less for those sold.
One adult equivalent can be thought of as the amount of feed consumed in 12 months by a non-lactating animal of average weight 450 kg. Therefore, if average feed consumption is 2.2% of bodyweight, this would be equivalent to approximately 3650 kg dry matter per year for one AE. Cattle supplemented with phosphorus or urea will eat more than un-supplemented cattle of the same bodyweight. For full-year supplementation, feed intake could be 20% higher than for un-supplemented cattle. When comparing herds with and without supplementation, reduce the total AE of the supplemented herd to ensure a fair comparison (17% reduction will equate to 20% extra feed consumption), applying pro-rata reduction for part-year supplementation.
Annual liveweight production: Annual net liveweight production per (retained) cow equals average liveweight of cows at the end of the measured period multiplied by (1 – mortality rate) plus average weight of weaners produced multiplied by lactation rate minus average cow liveweight at the start of the measurement period.
Average: Total divided by the number of observations. This may be similar or very different to the median.
14
Benefit-cost analysis (BCA): A conceptual framework that can be applied to the economic evaluation of projects and programs in the public sector. It differs from a private financial appraisal (sometimes termed investment analysis) in that it considers all gains (benefits) and all losses (costs), regardless of to whom they accrue.
Benefit-cost ratio (B/C ratio): The ratio of the present value of investment benefits to the present value of investment costs. A value greater than 1 suggests a profitable investment.
Body condition score: Subjective assessment of the body tissue (fat and muscle) reserves of an animal. Five-point scale (1 = poor, 2 = backward, 3 = moderate, 4 = forward/good, 5 = fat).
Branding rate: Defined as calves branded as a percentage of cows mated the previous year. It is very similar to weaning rate, but does not include calf mortality between branding and weaning.
Breeder: Synonym for a cow in a breeding herd.
Bulls: Entire male cattle.
Bullock: Steer after it reaches mature height and weight.
Calf output: Number of calves produced.
Cattle year: Twelve month period ending at a natural point in livestock transactions and handling, usually after the last weaning muster in north Australian beef business.
Central forest: Forested areas associated with the Brigalow areas of central Queensland.
Closing numbers: Number of cattle at the end of the cattle year.
Cows: Female cattle after first mating, whether non-pregnant or from mid-pregnancy.
Depreciation (as applied in estimating operating profit): It is a form of overhead cost that allows for the use or fall in value of assets that have a life of more than one production period. It is an allowance that is deducted from gross revenue each year so that all of the costs of producing an output in that year are set against all of the revenues produced in that year. Depreciation of assets is estimated by valuing them at either current market value or expected
15
replacement value, identifying their salvage value in constant dollar terms and then dividing by the number of years until replacement. Formula used in this analysis is (replacement cost minus salvage value) divided by the number of years until replacement.
Dry cow: Non-lactating cow, i.e. cow not suckling a calf.
Dry matter intake: Dry matter eaten daily by an animal, usually expressed as a percentage of liveweight, and typically between 1.5% (very poor diets) and 2.5% (feedlot diets).
Economics: Assessing the relative merits of business choices for the future.
Economically sustainable: The use of various strategies for employing existing resources optimally so that a responsible and beneficial balance can be achieved over the longer term. Within a business context, economic sustainability involves using the capital of the company efficiently to allow it to continue functioning over time.
Enterprise: Enterprise denotes the production of a particular commodity or group of related commodities for direct sale, thus by ‘wheat enterprise’ we imply the production and sale of a wheat crop but do not specify the method of production.
Enterprise (or activity) gross margin: The gross margin of an enterprise (or activity) is its gross income minus its variable costs.
Enterprise (or activity) variable costs: Costs directly attributable to an enterprise or activity and which vary in direct proportion to the scale of the enterprise or activity.
First-lactation cow: Cow during the period when the majority of her cohort is experiencing their first lactation.
Fixed (or overhead) costs: Defined as costs which are not affected by the scale of the activities in the farm business. They must be met in the operation of the farm.
Examples include: wages and employee on-costs, repairs, insurance, shire rates and land taxes, depreciation of plant and improvements, consultants fees and the operators allowance for labour and management. Some fixed costs (like depreciation or operator’s allowance) are not cash costs. It is usual to count the smaller amounts of interest on a typical overdraft or short-term working capital as an operating expense (fixed cost) and deducted in the calculation of operating profit. The returns to lenders of fixed capital (interest, rent, lease payments) are deducted in the calculation of net profit.
16
Gross margin: A gross margin is the gross income from an enterprise less the variable costs incurred in achieving it. It excludes fixed or overhead costs.
Growth rate: Change in weight divided by the time period.
Head (of): Colloquial term for number of cattle. Almost always can be excluded without loss of meaning.
Heifers: Young cohort of female cattle up to the time the majority should have calved, after which the cohort is classed as first-lactation cows.
Key performance indicators (KPIs): Tracking indicators used to measure the achievement of outputs against targets.
Lactation rate: Cows weaning a calf as a percentage of closing numbers (number of cattle at the end of the cattle year) within a group.
Live stock unit (LSU): see adult equivalent
Liveweight production ratio: Annual net liveweight production divided by the average liveweight of cattle in the paddock over a cattle year.
(The latter represents feed intake and equals average cow liveweight over the year plus average weight due to weaners over the year.) For example, a liveweight production ratio of 0.45 equates to 45 kg net increase in liveweight for every 100 kg of cattle grazing that paddock on average over a one-year period.)
Mean: Synonym for average.
Median: Point where half the population is higher and half is lower which is equal to the 50th percentile.
Missing (and ‘missingness’): Animals that fail to return for routine measures, but not including irregular absentees. It comprises mortalities, animals whose individual identity is lost, and those that permanently relocate either of their own accord or without being recorded by a manager.
Mob: A synonym for management group, in contrast to a herd which is the entire population of animals within a business entity.
Mortality rate: Cattle that have died as a percentage of the number known to be alive at a previous time.
Net profit: This is the reward to the farmers own capital. Net profit equals operating profit less the returns to outside capital. The returns to lenders of fixed capital (interest, rent, leases) are deducted from operating profit in the calculation of net profit. It is available to the owner of the business to pay taxes or
17
to provide living expenses (consumption) or can be used to reduce debt. Net profit minus income tax minus personal consumption (above operators allowance if it has already been deducted from operating profit) equals change in equity.
Nominal (current) terms: The impact of expected inflation is explicitly reflected in the cash flow projections.
Northern Australia: Queensland, the Northern Territory, and the Pilbara and Kimberley regions of Western Australia.
Northern Downs: Downs (naturally non-forested with black soil) areas of western Queensland, the Barkly Tableland and the Kimberley.
Northern forest: Non-downs areas, north of a line from approximately Bowen to Karratha.
Opening numbers: Same as closing numbers from the previous year.
Operating margin: The return per kilogram of liveweight sold minus the cost of producing a kilogram of liveweight, expressed as dollars per kilogram ($/kg).
Operating profit: This is the return to total capital invested after the variable and overhead (fixed) costs involved in earning the revenue have been deducted. Operating profit represents the reward to all of the owners of the capital tied up in the business. Operating profit equals (total receipts minus variable costs equals total gross margin) minus overheads. When operating profit is expressed as a percentage return to total capital it indicates the efficiency of the use of all of the capital invested in the farm business.
Opportunity cost: The benefit foregone by using a scarce resource for one purpose instead of its next best alternative use.
Other farm income: Income earned by the farm business but not attributable to a particular enterprise, such as income from contract work.
Overhead (or fixed) costs: see Fixed costs.
Pasture yield: Standing dry matter per hectare of a pasture.
Percentage points: When comparing the difference(s) between percentages for each measure of performance the absolute difference will be expressed in terms of percentage points increase or decrease. For example, the median percentage foetal/calf loss was eight percentage points higher in cows in the Northern forest (13%) compared to cows in the Southern forest (5%).
Percentile: Demarcation point for a specified percentage of a population; e.g., 75th percentile is the point below which there is 75% of the population.
18
Quartile: A range within which 25% of animals occur.
Rate of return on equity: Net profit expressed as a percentage of the average of the owner’s equity capital used in the business for the period under review (usually a year).
Rate of return on total capital: Operating profit expressed as a percentage of the average of the total capital employed for the period under review (usually a year).
Risk analysis: An analysis or an assessment of factors that affect or are likely to affect the successful achievement of an intervention’s objectives. A detailed examination of the potential unwanted and negative consequences to human life, health, property, or the environment posed by interventions; a systematic process to provide information regarding such undesirable consequences; the process of quantification of the probabilities and expected impacts for identified risks.
Second-lactation cow: A cow between confirmed pregnancy and weaning in the year after the majority of her cohort weaned their first calf.
Southern forest: Non-downs areas outside the Brigalow country of central and southern Queensland.
Steer: De-sexed bull prior to full maturity.
Supplement: Addition to the diet to balance primary deficiencies, speeding up digestion, thereby increasing the rate of pasture or hay consumption, thus energy intake.
Total capital: The total value of the capital of the farm business, such as land, improvements, livestock, plant and materials.
Total gross margin: The sum of the gross margins of all the enterprises or activities in the farm plan.
Total liabilities: The total value of the liabilities of the farm business, such as bank debt, unpaid accounts, tax due etc.
Vaccine: Injectable (usually) product that causes development of immunity against an antigen, usually an infectious disease agent.
Variable costs: Costs which change according to the size of an activity. The essential characteristic of a variable cost is that it changes proportionately to changes in enterprise size (or to change in components of the enterprise).
19
Weaner: Calf permanently prevented from suckling its dam at the end of the reproductive cycle.
Weaner production: Lactation rate (retained cows) multiplied by average weaner weight.
Weaning rate (mated cows): Cows weaning a calf as a percentage of those mated the previous year. Usually difficult to calculate as herd restructures and culling during pregnancy often prevents accurate information being available. Can be derived from multiplying annual pregnancy rate by (1-foetal and calf loss rate).
Weaning rate (retained cows): Cows weaning a calf as a percentage of closing numbers within a group.
Weight: Measure of body mass. Can be very precise, but weight recorded will vary with different weighing protocols, especially diet and time since eating and drinking.
Wet cow: Lactating cow or cow suckling a calf.