Embed Size (px)
Citation preview
Instruction Manual
Manfred Weber
Metra Mess- und Frequenztechnik in Radebeul e.K.
Meissner Str. 58 - D-01445 Radebeul
Tel. +49-351 836 2191 Fax +49-351 836 2940
Email: [email protected] Internet: www.MMF.de
Vibration Meter
VM25
Published by:Manfred WeberMetra Mess- und Frequenztechnik in Radebeul e.K.Meißner Str. 58D-01445 RadebeulTel. +49-351-836 2191Fax +49-351-836 2940Email [email protected] www.MMF.de
Note: The latest version of this manual can be found at http://www.mmf.de/product_literature.htm
Specification subject to change.© 2012 Manfred Weber Metra Mess- und Frequenztechnik in Radebeul e.K.Full or partial reproduction subject to prior written approval.
Sep/ 12
Contents1. Purpose..................................................................................................................4
2. Function.................................................................................................................42.1. The Vibration Sensor......................................................................................42.2. The Measuring Instrument..............................................................................5
3. Measuring Ranges.................................................................................................53.1. Measurable Vibration Quantities....................................................................53.2. Vibration Acceleration...................................................................................63.3. Vibration Velocity..........................................................................................63.4. Vibration Displacement..................................................................................83.5. Rolling Bearing Parameters K(t)....................................................................93.6. Rotational Speed..........................................................................................103.7. Temperature..................................................................................................10
4. The Batteries ......................................................................................................104.1. Inserting the Batteries...................................................................................104.2. Switching On and Off...................................................................................114.3. Battery Display and Battery Type.................................................................124.4. Shut-off Timer..............................................................................................13
5. Preparation of Measuring Points..........................................................................135.1. General Information on Measurement Point Choice.....................................135.2. ISO 10816-1 Recommendations...................................................................135.3. VMID Measurement Point...........................................................................15
5.3.1. How the VMID Measurement Point Functions.....................................155.3.2. Mounting the VMID Measurement Point..............................................15
6. Measurement.......................................................................................................166.1. Measurement Value Display.........................................................................166.2. Selecting the Display Quantity.....................................................................166.3. Measurement Point Detection.......................................................................17
6.3.1. Reading the VMID Data with the VM25..............................................176.3.2. Entering the Measurement Point Text...................................................176.3.3. Editing and Deleting Measurement Point Data.....................................19
6.4. Saving Measurands.......................................................................................196.5. Graphical Trend Display...............................................................................196.6. Viewing Saved Measurement Values...........................................................206.7. Deleting Saved Measurement Data ..............................................................216.8. K(t) Measurement.........................................................................................216.9. Frequency Analysis......................................................................................246.10. Rotation Speed Measurement.....................................................................25
1
6.11. Temperature Measurement.........................................................................26
7. Measurement Evaluation with Standard Values...................................................28
8. Setting the Date and Time....................................................................................30
9. Calibration...........................................................................................................31
10. Sensor Check.....................................................................................................33
11. Headphone Output.............................................................................................33
12. Reset Key...........................................................................................................34
13. Connection to a PC............................................................................................34
13. Firmware Update..............................................................................................35
14. Technical Data...................................................................................................37
Limited Warranty....................................................................................................40Appendix: Warranty
Declaration of CE Conformity
2
3
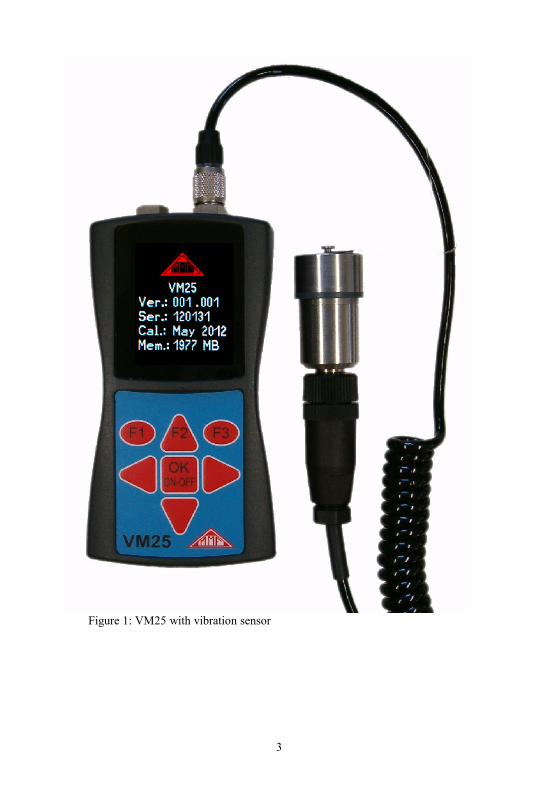
Figure 1: VM25 with vibration sensor
Thank you for choosing a Metra Vibration Measurement Instrument!
1. PurposeThe VM25 has been developed, particularly, for the measurement and monitoring of vibrations on rotating machines. The purpose of such measurements is to monitor the condition of the machine in order to avoid unscheduled shut-down. Furthermore vibration measurement is carried out prior to the distribution of new machinery and subsequently to repair with a view to quality control and the issuing of product guar-antees.The basis for successful machine condition monitoring is the measurement of the vi-bration severity over a longer period of time. Measurements are taken at regular in-tervals of time and recorded. The VM25 measures and records vibration acceleration, vibration velocity or vibra-tion displacement. The VM25 specification complies with the ISO 2954 regulations for machines that measure vibration velocity and is therefore suitable for measuring, among other things, machine vibrations in accordance with ISO 10816.In addition to vibration quantities the VM25 also measures the temperature and the rotation speed with contactless sensors.An external piezoelectric accelerometer is used as the sensor, and is provided to-gether with the instrument. The VM25 is fitted with an electronic measurement point detector (VMID) which enables it to take routine measurements of a large number of measurement points very effectively. A software package for transferring the measurement data to a PC is also available from Metra.In the common hierarchy of condition monitoring the VM25 is equivalent to 'Level 1'. This represents the long term monitoring of parameters with low technical and personnel requirements. For fault detection ('Level 2'), as a further step, spectral diagnostic measurements are taken, which require a large degree of expertise and sophisticated measurement tech-nology.In the development of the VM25 value was placed on simple operation and mainten-ance requirements, which enable trained personnel to operate the instrument without the need of being specially qualified.
2. Function2.1. The Vibration SensorThe VM25 operates with a piezo ceramic shear accelerometer. Piezoelectric vibra-tion transducers are characterized by high precision and resolution with great robust-ness. The accelerometer of the VM25 has an integrated electronic circuit for imped-ance conversion in accordance with the IEPE standard. At the base of the sensor a magnet has been integrated for mounting to the measurement point. In the center of the magnet there is a contact point from which the identification number can be read. The measurement point ID is saved in the available VMID measurement points.The coupling surface is protected by a metal cap which attaches to the sensors mag-netic base.
4
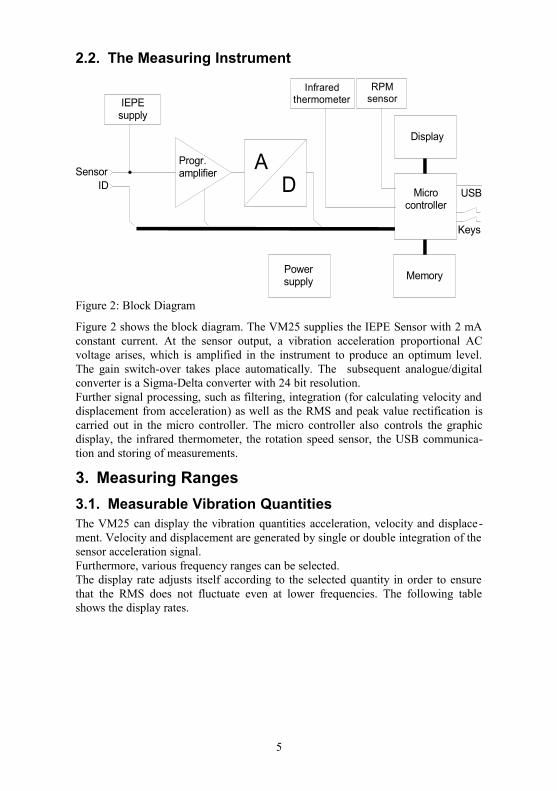
2.2. The Measuring Instrument
Figure 2 shows the block diagram. The VM25 supplies the IEPE Sensor with 2 mA constant current. At the sensor output, a vibration acceleration proportional AC voltage arises, which is amplified in the instrument to produce an optimum level. The gain switch-over takes place automatically. The subsequent analogue/digital converter is a Sigma-Delta converter with 24 bit resolution.Further signal processing, such as filtering, integration (for calculating velocity and displacement from acceleration) as well as the RMS and peak value rectification is carried out in the micro controller. The micro controller also controls the graphic display, the infrared thermometer, the rotation speed sensor, the USB communica-tion and storing of measurements.
3. Measuring Ranges3.1. Measurable Vibration QuantitiesThe VM25 can display the vibration quantities acceleration, velocity and displace-ment. Velocity and displacement are generated by single or double integration of the sensor acceleration signal.Furthermore, various frequency ranges can be selected.The display rate adjusts itself according to the selected quantity in order to ensure that the RMS does not fluctuate even at lower frequencies. The following table shows the display rates.
5
Figure 2: Block Diagram
IEPEsupply
Progr.amplifier
AD
Display
Memory
Keys
SensorID
Power supply
USB
RPMsensor
Infraredthermometer
Microcontroller
Measurand Frequency Range Display Rate
Vibration acceleration 0,2 Hz – 10 kHz 5.6 s
Vibration acceleration 3 Hz – 1 kHz 1.4 s
Vibration acceleration 1 kHz – 10 kHz 1.4 s
Vibration acceleration 2 Hz – 300 Hz 2.8 s
Vibration acceleration 10 Hz – 1 kHz 1.4 s
Vibration displacement 5 Hz – 200 Hz 2.8 s
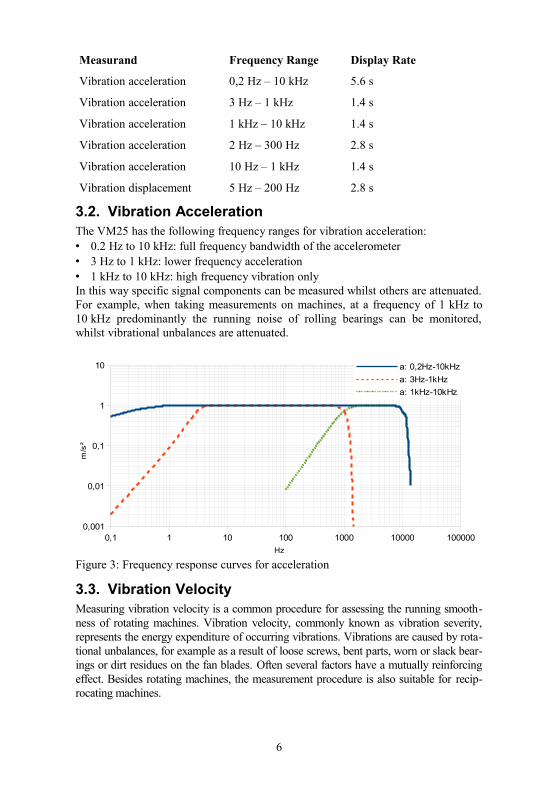
3.2. Vibration AccelerationThe VM25 has the following frequency ranges for vibration acceleration:• 0.2 Hz to 10 kHz: full frequency bandwidth of the accelerometer• 3 Hz to 1 kHz: lower frequency acceleration • 1 kHz to 10 kHz: high frequency vibration onlyIn this way specific signal components can be measured whilst others are attenuated. For example, when taking measurements on machines, at a frequency of 1 kHz to 10 kHz predominantly the running noise of rolling bearings can be monitored, whilst vibrational unbalances are attenuated.
3.3. Vibration VelocityMeasuring vibration velocity is a common procedure for assessing the running smooth-ness of rotating machines. Vibration velocity, commonly known as vibration severity, represents the energy expenditure of occurring vibrations. Vibrations are caused by rota-tional unbalances, for example as a result of loose screws, bent parts, worn or slack bear-ings or dirt residues on the fan blades. Often several factors have a mutually reinforcing effect. Besides rotating machines, the measurement procedure is also suitable for recip-rocating machines.
6
Figure 3: Frequency response curves for acceleration
0,1 1 10 100 1000 10000 1000000,001
0,01
0,1
1
10 a: 0,2Hz-10kHza: 3Hz-1kHza: 1kHz-10kHz
Hz
m/s
²
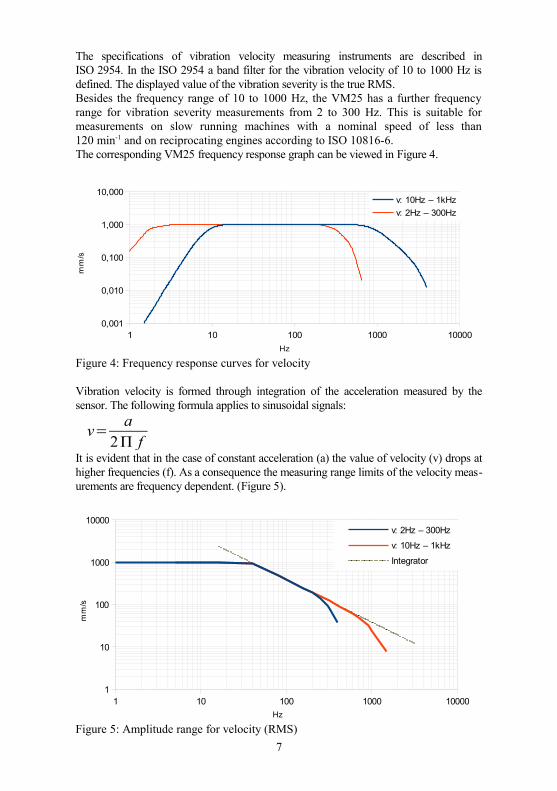
The specifications of vibration velocity measuring instruments are described in ISO 2954. In the ISO 2954 a band filter for the vibration velocity of 10 to 1000 Hz is defined. The displayed value of the vibration severity is the true RMS.Besides the frequency range of 10 to 1000 Hz, the VM25 has a further frequency range for vibration severity measurements from 2 to 300 Hz. This is suitable for measurements on slow running machines with a nominal speed of less than 120 min-1 and on reciprocating engines according to ISO 10816-6. The corresponding VM25 frequency response graph can be viewed in Figure 4.
Vibration velocity is formed through integration of the acceleration measured by the sensor. The following formula applies to sinusoidal signals:
v= a2Π f
It is evident that in the case of constant acceleration (a) the value of velocity (v) drops at higher frequencies (f). As a consequence the measuring range limits of the velocity meas-urements are frequency dependent. (Figure 5).
7
Figure 4: Frequency response curves for velocity
1 10 100 1000 100000,001
0,010
0,100
1,000
10,000v: 10Hz – 1kHzv: 2Hz – 300Hz
Hz
mm
/s
Figure 5: Amplitude range for velocity (RMS)
1 10 100 1000 100001
10
100
1000
10000v: 2Hz – 300Hz
v: 10Hz – 1kHz
Integrator
Hz
mm
/s
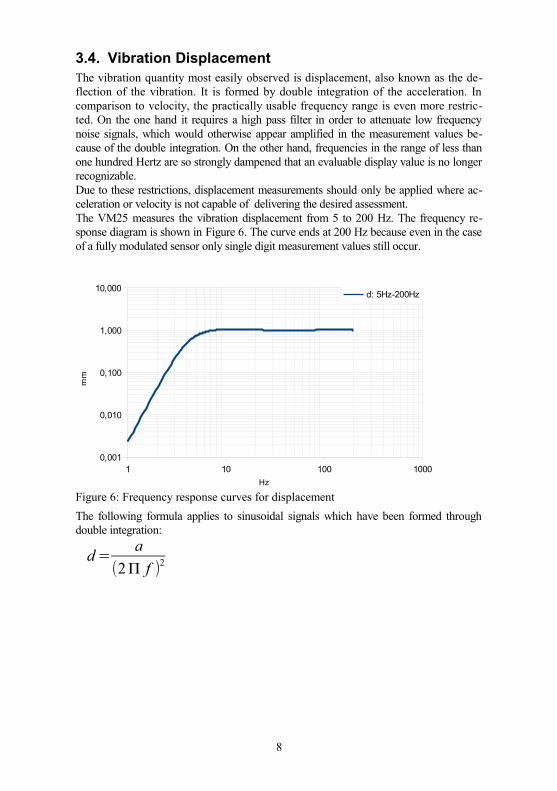
3.4. Vibration DisplacementThe vibration quantity most easily observed is displacement, also known as the de-flection of the vibration. It is formed by double integration of the acceleration. In comparison to velocity, the practically usable frequency range is even more restric-ted. On the one hand it requires a high pass filter in order to attenuate low frequency noise signals, which would otherwise appear amplified in the measurement values be-cause of the double integration. On the other hand, frequencies in the range of less than one hundred Hertz are so strongly dampened that an evaluable display value is no longer recognizable.Due to these restrictions, displacement measurements should only be applied where ac-celeration or velocity is not capable of delivering the desired assessment.The VM25 measures the vibration displacement from 5 to 200 Hz. The frequency re-sponse diagram is shown in Figure 6. The curve ends at 200 Hz because even in the case of a fully modulated sensor only single digit measurement values still occur.
The following formula applies to sinusoidal signals which have been formed through double integration:
d =a
(2Π f )2
8
Figure 6: Frequency response curves for displacement
1 10 100 10000,001
0,010
0,100
1,000
10,000d: 5Hz-200Hz
Hz
mm
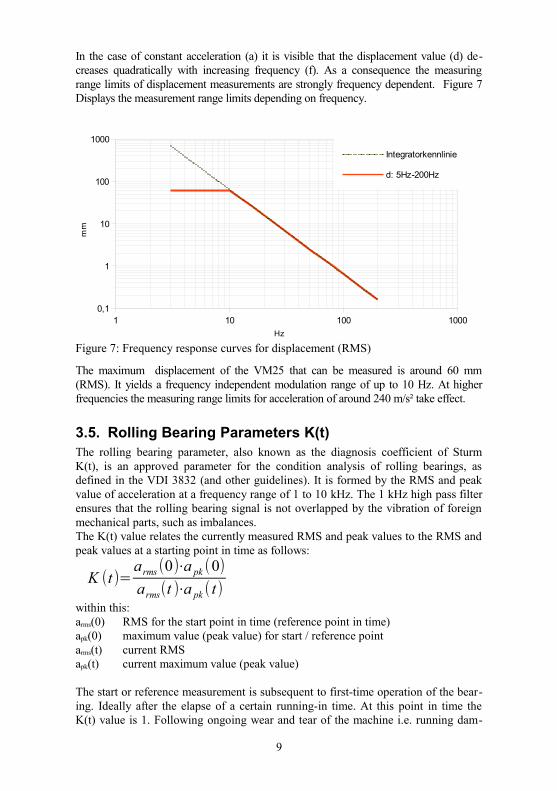
In the case of constant acceleration (a) it is visible that the displacement value (d) de-creases quadratically with increasing frequency (f). As a consequence the measuring range limits of displacement measurements are strongly frequency dependent. Figure 7 Displays the measurement range limits depending on frequency.
The maximum displacement of the VM25 that can be measured is around 60 mm (RMS). It yields a frequency independent modulation range of up to 10 Hz. At higher frequencies the measuring range limits for acceleration of around 240 m/s² take effect.
3.5. Rolling Bearing Parameters K(t)The rolling bearing parameter, also known as the diagnosis coefficient of Sturm K(t), is an approved parameter for the condition analysis of rolling bearings, as defined in the VDI 3832 (and other guidelines). It is formed by the RMS and peak value of acceleration at a frequency range of 1 to 10 kHz. The 1 kHz high pass filter ensures that the rolling bearing signal is not overlapped by the vibration of foreign mechanical parts, such as imbalances.The K(t) value relates the currently measured RMS and peak values to the RMS and peak values at a starting point in time as follows:
K (t)=arms (0)⋅a pk (0)arms(t )⋅a pk ( t)
within this:arms(0) RMS for the start point in time (reference point in time)apk(0) maximum value (peak value) for start / reference pointarms(t) current RMS apk(t) current maximum value (peak value)
The start or reference measurement is subsequent to first-time operation of the bear-ing. Ideally after the elapse of a certain running-in time. At this point in time the K(t) value is 1. Following ongoing wear and tear of the machine i.e. running dam-
9
Figure 7: Frequency response curves for displacement (RMS)
1 10 100 10000,1
1
10
100
1000
Integratorkennlinie
d: 5Hz-200Hz
Hz
mm
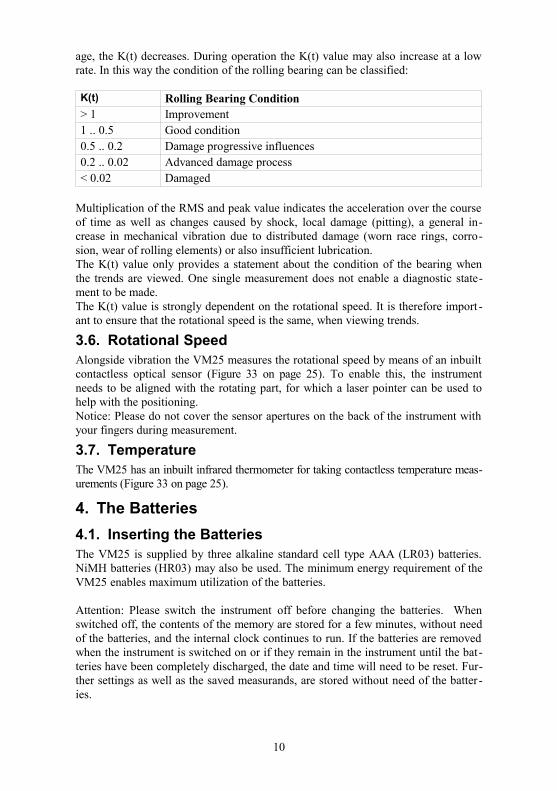
age, the K(t) decreases. During operation the K(t) value may also increase at a low rate. In this way the condition of the rolling bearing can be classified:
K(t) Rolling Bearing Condition> 1 Improvement1 .. 0.5 Good condition0.5 .. 0.2 Damage progressive influences0.2 .. 0.02 Advanced damage process< 0.02 Damaged
Multiplication of the RMS and peak value indicates the acceleration over the course of time as well as changes caused by shock, local damage (pitting), a general in-crease in mechanical vibration due to distributed damage (worn race rings, corro-sion, wear of rolling elements) or also insufficient lubrication.The K(t) value only provides a statement about the condition of the bearing when the trends are viewed. One single measurement does not enable a diagnostic state-ment to be made.The K(t) value is strongly dependent on the rotational speed. It is therefore import -ant to ensure that the rotational speed is the same, when viewing trends.
3.6. Rotational SpeedAlongside vibration the VM25 measures the rotational speed by means of an inbuilt contactless optical sensor (Figure 33 on page 25). To enable this, the instrument needs to be aligned with the rotating part, for which a laser pointer can be used to help with the positioning.Notice: Please do not cover the sensor apertures on the back of the instrument with your fingers during measurement.
3.7. TemperatureThe VM25 has an inbuilt infrared thermometer for taking contactless temperature meas-urements (Figure 33 on page 25).
4. The Batteries 4.1. Inserting the BatteriesThe VM25 is supplied by three alkaline standard cell type AAA (LR03) batteries. NiMH batteries (HR03) may also be used. The minimum energy requirement of the VM25 enables maximum utilization of the batteries.
Attention: Please switch the instrument off before changing the batteries. When switched off, the contents of the memory are stored for a few minutes, without need of the batteries, and the internal clock continues to run. If the batteries are removed when the instrument is switched on or if they remain in the instrument until the bat-teries have been completely discharged, the date and time will need to be reset. Fur-ther settings as well as the saved measurands, are stored without need of the batter-ies.
10
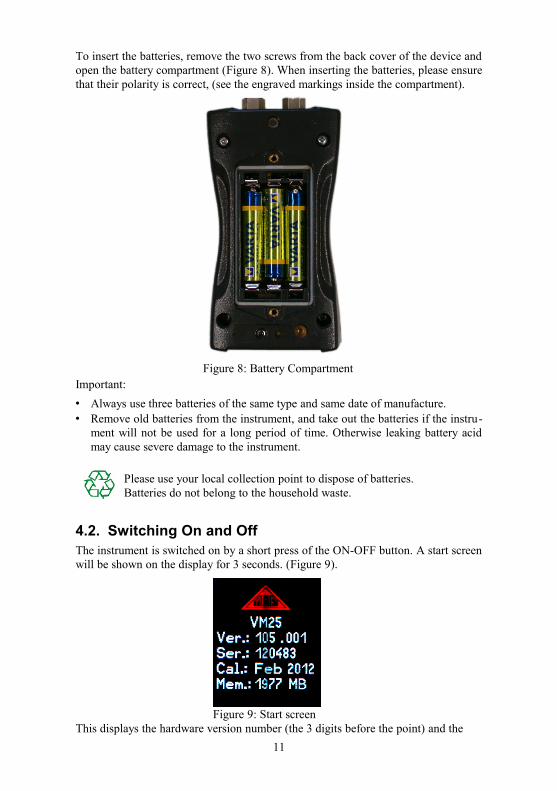
To insert the batteries, remove the two screws from the back cover of the device and open the battery compartment (Figure 8). When inserting the batteries, please ensure that their polarity is correct, (see the engraved markings inside the compartment).
Important:• Always use three batteries of the same type and same date of manufacture.• Remove old batteries from the instrument, and take out the batteries if the instru-
ment will not be used for a long period of time. Otherwise leaking battery acid may cause severe damage to the instrument.
Please use your local collection point to dispose of batteries. Batteries do not belong to the household waste.
4.2. Switching On and OffThe instrument is switched on by a short press of the ON-OFF button. A start screen will be shown on the display for 3 seconds. (Figure 9).
This displays the hardware version number (the 3 digits before the point) and the 11
Figure 8: Battery Compartment
Figure 9: Start screen
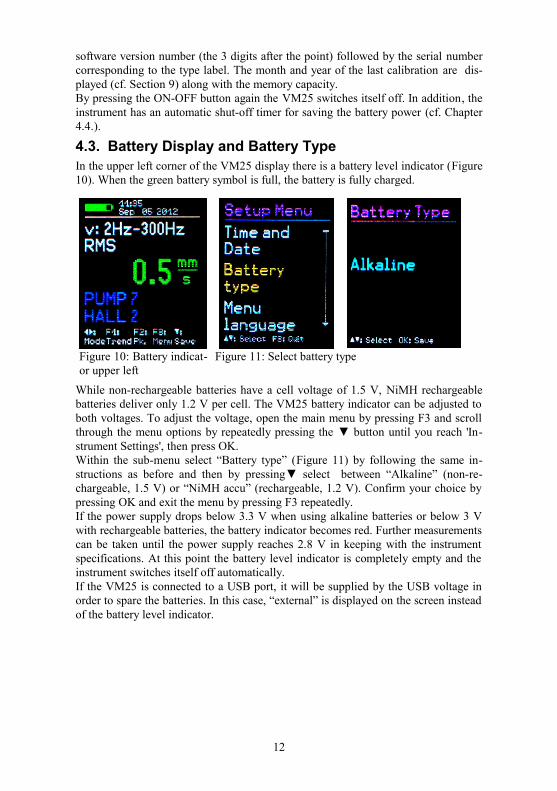
software version number (the 3 digits after the point) followed by the serial number corresponding to the type label. The month and year of the last calibration are dis-played (cf. Section 9) along with the memory capacity.By pressing the ON-OFF button again the VM25 switches itself off. In addition, the instrument has an automatic shut-off timer for saving the battery power (cf. Chapter 4.4.).
4.3. Battery Display and Battery TypeIn the upper left corner of the VM25 display there is a battery level indicator (Figure10). When the green battery symbol is full, the battery is fully charged.
While non-rechargeable batteries have a cell voltage of 1.5 V, NiMH rechargeable batteries deliver only 1.2 V per cell. The VM25 battery indicator can be adjusted to both voltages. To adjust the voltage, open the main menu by pressing F3 and scroll through the menu options by repeatedly pressing the ▼ button until you reach 'In-strument Settings', then press OK. Within the sub-menu select “Battery type” (Figure 11) by following the same in-structions as before and then by pressing▼ select between “Alkaline” (non-re-chargeable, 1.5 V) or “NiMH accu” (rechargeable, 1.2 V). Confirm your choice by pressing OK and exit the menu by pressing F3 repeatedly. If the power supply drops below 3.3 V when using alkaline batteries or below 3 V with rechargeable batteries, the battery indicator becomes red. Further measurements can be taken until the power supply reaches 2.8 V in keeping with the instrument specifications. At this point the battery level indicator is completely empty and the instrument switches itself off automatically.If the VM25 is connected to a USB port, it will be supplied by the USB voltage in order to spare the batteries. In this case, “external” is displayed on the screen instead of the battery level indicator.
12
Figure 10: Battery indicat-or upper left
Figure 11: Select battery type
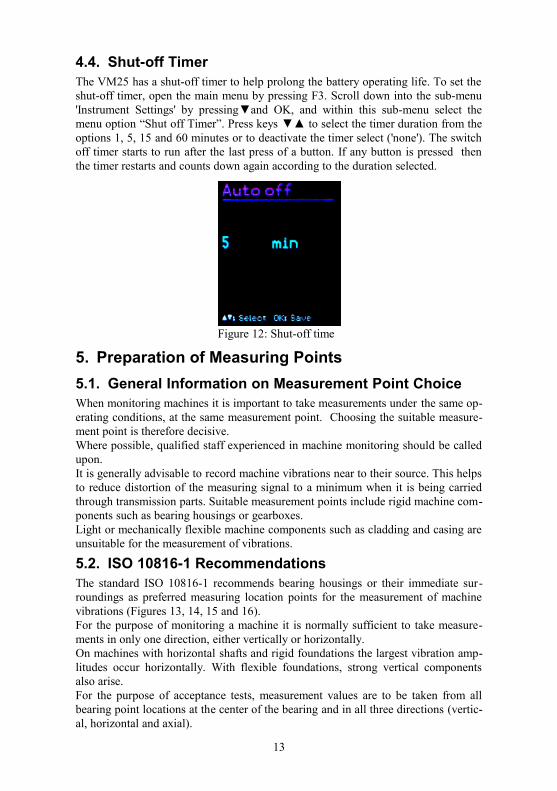
4.4. Shut-off TimerThe VM25 has a shut-off timer to help prolong the battery operating life. To set the shut-off timer, open the main menu by pressing F3. Scroll down into the sub-menu 'Instrument Settings' by pressing▼and OK, and within this sub-menu select the menu option “Shut off Timer”. Press keys ▼▲ to select the timer duration from the options 1, 5, 15 and 60 minutes or to deactivate the timer select ('none'). The switch off timer starts to run after the last press of a button. If any button is pressed then the timer restarts and counts down again according to the duration selected.
5. Preparation of Measuring Points5.1. General Information on Measurement Point ChoiceWhen monitoring machines it is important to take measurements under the same op-erating conditions, at the same measurement point. Choosing the suitable measure-ment point is therefore decisive.Where possible, qualified staff experienced in machine monitoring should be called upon. It is generally advisable to record machine vibrations near to their source. This helps to reduce distortion of the measuring signal to a minimum when it is being carried through transmission parts. Suitable measurement points include rigid machine com-ponents such as bearing housings or gearboxes. Light or mechanically flexible machine components such as cladding and casing are unsuitable for the measurement of vibrations.
5.2. ISO 10816-1 RecommendationsThe standard ISO 10816-1 recommends bearing housings or their immediate sur-roundings as preferred measuring location points for the measurement of machine vibrations (Figures 13, 14, 15 and 16). For the purpose of monitoring a machine it is normally sufficient to take measure-ments in only one direction, either vertically or horizontally. On machines with horizontal shafts and rigid foundations the largest vibration amp-litudes occur horizontally. With flexible foundations, strong vertical components also arise. For the purpose of acceptance tests, measurement values are to be taken from all bearing point locations at the center of the bearing and in all three directions (vertic-al, horizontal and axial).
13
Figure 12: Shut-off time
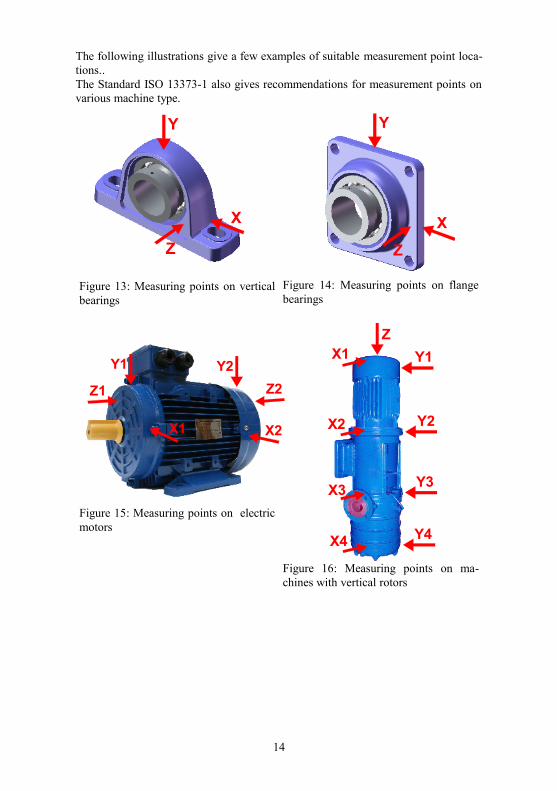
The following illustrations give a few examples of suitable measurement point loca-tions.. The Standard ISO 13373-1 also gives recommendations for measurement points on various machine type.
Figure 13: Measuring points on vertical bearings
Figure 14: Measuring points on flange bearings
Figure 15: Measuring points on electric motors
Figure 16: Measuring points on ma-chines with vertical rotors
14
X
Y
ZX
Y
Z
Z1 Z2
X2
Y1 Y2
X1
ZX1 Y1
X2 Y2
X3
X4
Y3
Y4
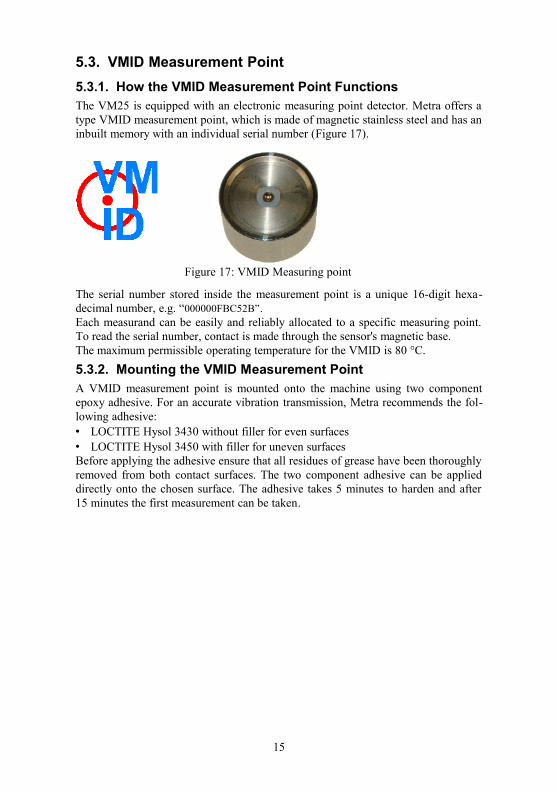
5.3. VMID Measurement Point5.3.1. How the VMID Measurement Point FunctionsThe VM25 is equipped with an electronic measuring point detector. Metra offers a type VMID measurement point, which is made of magnetic stainless steel and has an inbuilt memory with an individual serial number (Figure 17).
The serial number stored inside the measurement point is a unique 16-digit hexa-decimal number, e.g. “000000FBC52B”.Each measurand can be easily and reliably allocated to a specific measuring point. To read the serial number, contact is made through the sensor's magnetic base.The maximum permissible operating temperature for the VMID is 80 °C.
5.3.2. Mounting the VMID Measurement PointA VMID measurement point is mounted onto the machine using two component epoxy adhesive. For an accurate vibration transmission, Metra recommends the fol-lowing adhesive:• LOCTITE Hysol 3430 without filler for even surfaces• LOCTITE Hysol 3450 with filler for uneven surfacesBefore applying the adhesive ensure that all residues of grease have been thoroughly removed from both contact surfaces. The two component adhesive can be applied directly onto the chosen surface. The adhesive takes 5 minutes to harden and after 15 minutes the first measurement can be taken.
15
Figure 17: VMID Measuring point
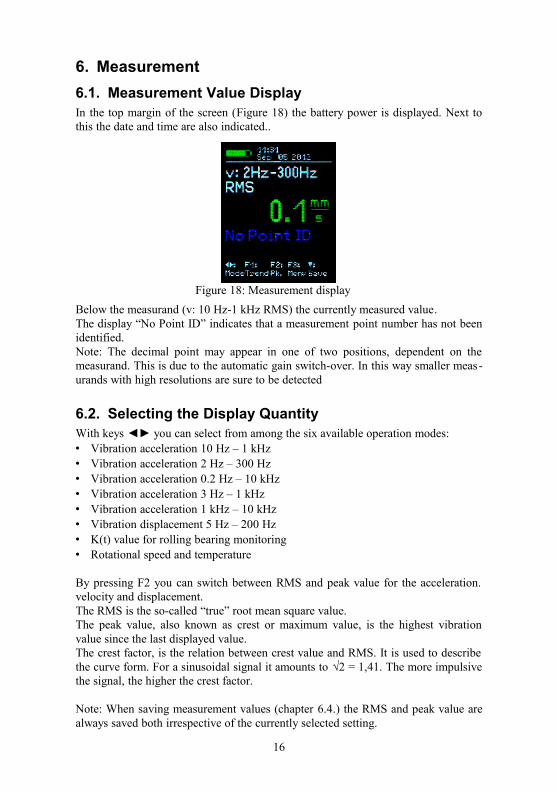
6. Measurement6.1. Measurement Value DisplayIn the top margin of the screen (Figure 18) the battery power is displayed. Next to this the date and time are also indicated..
Below the measurand (v: 10 Hz-1 kHz RMS) the currently measured value.The display “No Point ID” indicates that a measurement point number has not been identified.Note: The decimal point may appear in one of two positions, dependent on the measurand. This is due to the automatic gain switch-over. In this way smaller meas-urands with high resolutions are sure to be detected
6.2. Selecting the Display QuantityWith keys ◄► you can select from among the six available operation modes:• Vibration acceleration 10 Hz – 1 kHz• Vibration acceleration 2 Hz – 300 Hz• Vibration acceleration 0.2 Hz – 10 kHz• Vibration acceleration 3 Hz – 1 kHz• Vibration acceleration 1 kHz – 10 kHz• Vibration displacement 5 Hz – 200 Hz• K(t) value for rolling bearing monitoring• Rotational speed and temperature
By pressing F2 you can switch between RMS and peak value for the acceleration. velocity and displacement.The RMS is the so-called “true” root mean square value.The peak value, also known as crest or maximum value, is the highest vibration value since the last displayed value.The crest factor, is the relation between crest value and RMS. It is used to describe the curve form. For a sinusoidal signal it amounts to √2 = 1,41. The more impulsive the signal, the higher the crest factor.
Note: When saving measurement values (chapter 6.4.) the RMS and peak value are always saved both irrespective of the currently selected setting.
16
Figure 18: Measurement display
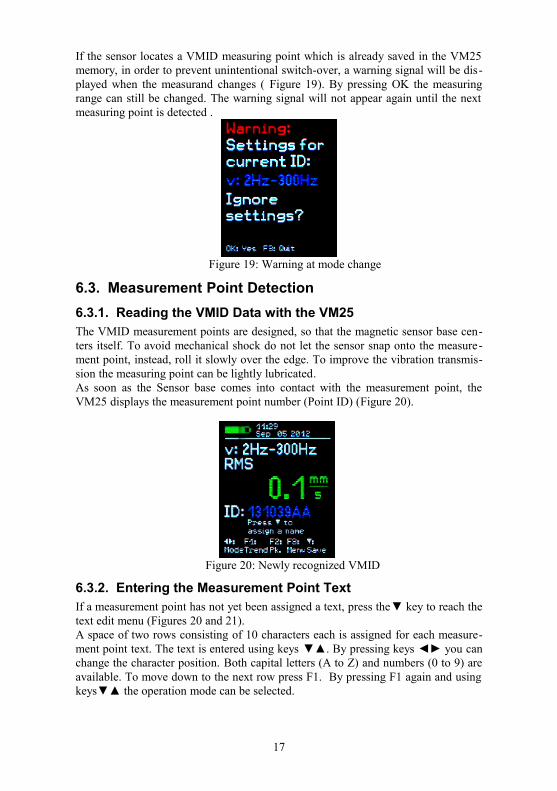
If the sensor locates a VMID measuring point which is already saved in the VM25 memory, in order to prevent unintentional switch-over, a warning signal will be dis-played when the measurand changes ( Figure 19). By pressing OK the measuring range can still be changed. The warning signal will not appear again until the next measuring point is detected .
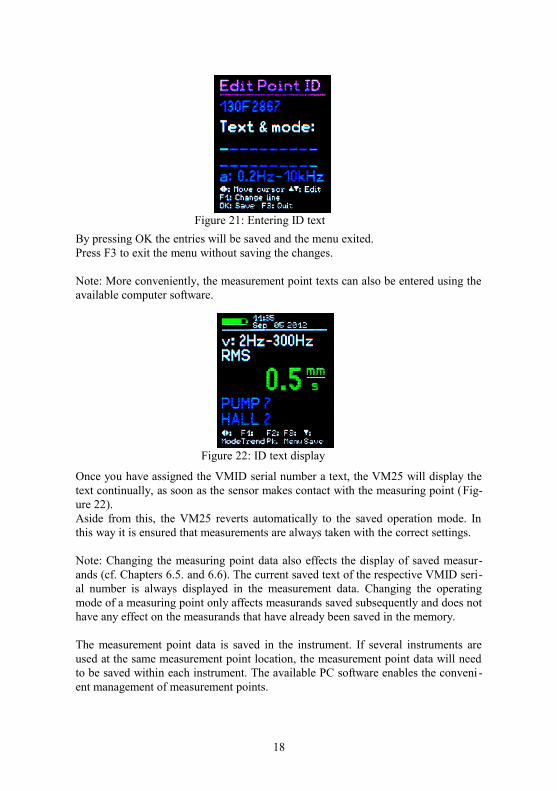
6.3. Measurement Point Detection6.3.1. Reading the VMID Data with the VM25The VMID measurement points are designed, so that the magnetic sensor base cen-ters itself. To avoid mechanical shock do not let the sensor snap onto the measure-ment point, instead, roll it slowly over the edge. To improve the vibration transmis-sion the measuring point can be lightly lubricated.As soon as the Sensor base comes into contact with the measurement point, the VM25 displays the measurement point number (Point ID) (Figure 20).
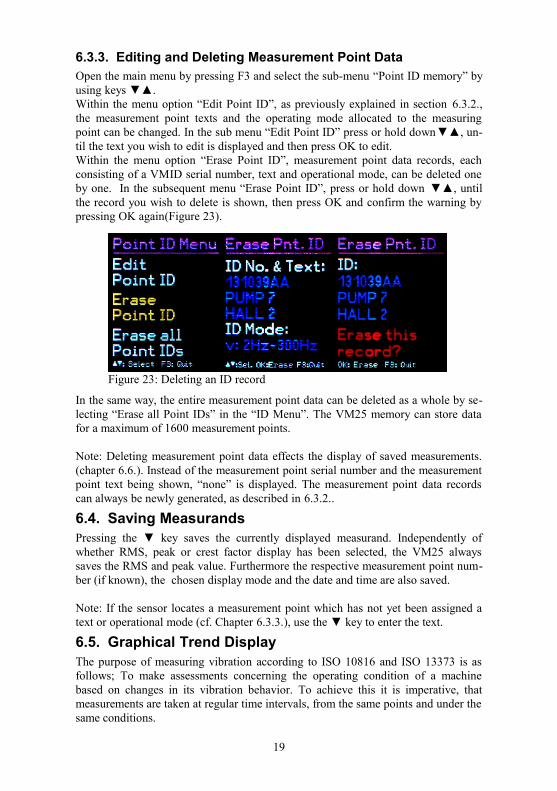
6.3.2. Entering the Measurement Point TextIf a measurement point has not yet been assigned a text, press the▼ key to reach the text edit menu (Figures 20 and 21).A space of two rows consisting of 10 characters each is assigned for each measure-ment point text. The text is entered using keys ▼▲. By pressing keys ◄► you can change the character position. Both capital letters (A to Z) and numbers (0 to 9) are available. To move down to the next row press F1. By pressing F1 again and using keys▼▲ the operation mode can be selected.
17
Figure 20: Newly recognized VMID
Figure 19: Warning at mode change
By pressing OK the entries will be saved and the menu exited.Press F3 to exit the menu without saving the changes.
Note: More conveniently, the measurement point texts can also be entered using the available computer software.
Once you have assigned the VMID serial number a text, the VM25 will display the text continually, as soon as the sensor makes contact with the measuring point (Fig-ure 22). Aside from this, the VM25 reverts automatically to the saved operation mode. In this way it is ensured that measurements are always taken with the correct settings.
Note: Changing the measuring point data also effects the display of saved measur-ands (cf. Chapters 6.5. and 6.6). The current saved text of the respective VMID seri-al number is always displayed in the measurement data. Changing the operating mode of a measuring point only affects measurands saved subsequently and does not have any effect on the measurands that have already been saved in the memory.
The measurement point data is saved in the instrument. If several instruments are used at the same measurement point location, the measurement point data will need to be saved within each instrument. The available PC software enables the conveni -ent management of measurement points.
18
Figure 21: Entering ID text
Figure 22: ID text display
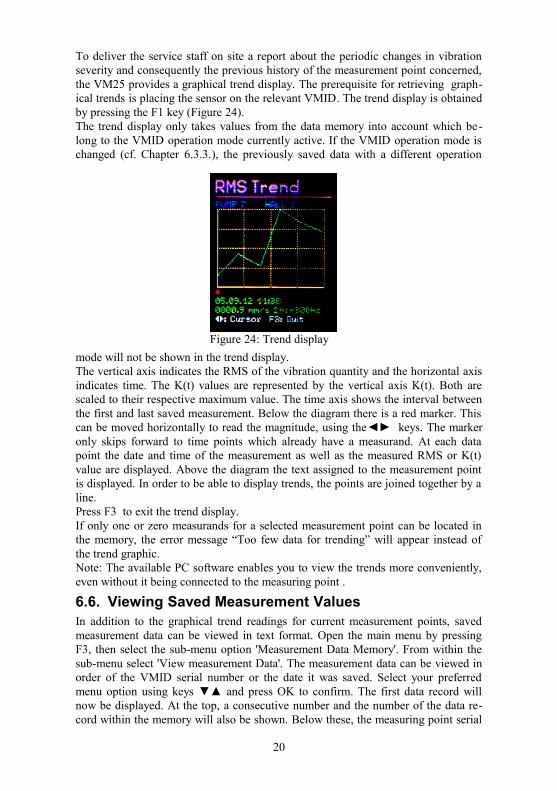
6.3.3. Editing and Deleting Measurement Point DataOpen the main menu by pressing F3 and select the sub-menu “Point ID memory” by using keys ▼▲.Within the menu option “Edit Point ID”, as previously explained in section 6.3.2., the measurement point texts and the operating mode allocated to the measuring point can be changed. In the sub menu “Edit Point ID” press or hold down▼▲, un-til the text you wish to edit is displayed and then press OK to edit.Within the menu option “Erase Point ID”, measurement point data records, each consisting of a VMID serial number, text and operational mode, can be deleted one by one. In the subsequent menu “Erase Point ID”, press or hold down ▼▲, until the record you wish to delete is shown, then press OK and confirm the warning by pressing OK again(Figure 23).
In the same way, the entire measurement point data can be deleted as a whole by se-lecting “Erase all Point IDs” in the “ID Menu”. The VM25 memory can store data for a maximum of 1600 measurement points.
Note: Deleting measurement point data effects the display of saved measurements. (chapter 6.6.). Instead of the measurement point serial number and the measurement point text being shown, “none” is displayed. The measurement point data records can always be newly generated, as described in 6.3.2..
6.4. Saving MeasurandsPressing the ▼ key saves the currently displayed measurand. Independently of whether RMS, peak or crest factor display has been selected, the VM25 always saves the RMS and peak value. Furthermore the respective measurement point num-ber (if known), the chosen display mode and the date and time are also saved.
Note: If the sensor locates a measurement point which has not yet been assigned a text or operational mode (cf. Chapter 6.3.3.), use the ▼ key to enter the text.
6.5. Graphical Trend DisplayThe purpose of measuring vibration according to ISO 10816 and ISO 13373 is as follows; To make assessments concerning the operating condition of a machine based on changes in its vibration behavior. To achieve this it is imperative, that measurements are taken at regular time intervals, from the same points and under the same conditions.
19
Figure 23: Deleting an ID record
To deliver the service staff on site a report about the periodic changes in vibration severity and consequently the previous history of the measurement point concerned, the VM25 provides a graphical trend display. The prerequisite for retrieving graph-ical trends is placing the sensor on the relevant VMID. The trend display is obtained by pressing the F1 key (Figure 24).The trend display only takes values from the data memory into account which be-long to the VMID operation mode currently active. If the VMID operation mode is changed (cf. Chapter 6.3.3.), the previously saved data with a different operation
mode will not be shown in the trend display.The vertical axis indicates the RMS of the vibration quantity and the horizontal axis indicates time. The K(t) values are represented by the vertical axis K(t). Both are scaled to their respective maximum value. The time axis shows the interval between the first and last saved measurement. Below the diagram there is a red marker. This can be moved horizontally to read the magnitude, using the◄► keys. The marker only skips forward to time points which already have a measurand. At each data point the date and time of the measurement as well as the measured RMS or K(t) value are displayed. Above the diagram the text assigned to the measurement point is displayed. In order to be able to display trends, the points are joined together by a line. Press F3 to exit the trend display.If only one or zero measurands for a selected measurement point can be located in the memory, the error message “Too few data for trending” will appear instead of the trend graphic.Note: The available PC software enables you to view the trends more conveniently, even without it being connected to the measuring point .
6.6. Viewing Saved Measurement ValuesIn addition to the graphical trend readings for current measurement points, saved measurement data can be viewed in text format. Open the main menu by pressing F3, then select the sub-menu option 'Measurement Data Memory'. From within the sub-menu select 'View measurement Data'. The measurement data can be viewed in order of the VMID serial number or the date it was saved. Select your preferred menu option using keys ▼▲ and press OK to confirm. The first data record will now be displayed. At the top, a consecutive number and the number of the data re-cord within the memory will also be shown. Below these, the measuring point serial
20
Figure 24: Trend display
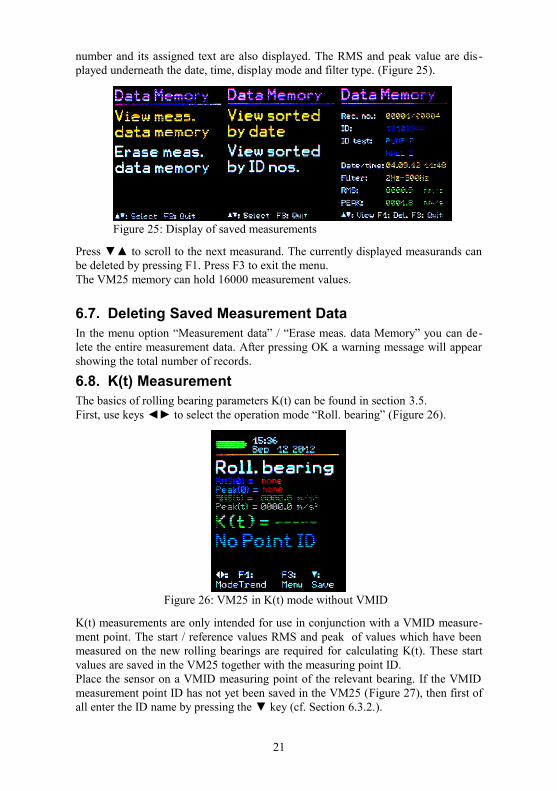
number and its assigned text are also displayed. The RMS and peak value are dis -played underneath the date, time, display mode and filter type. (Figure 25).
Press ▼▲ to scroll to the next measurand. The currently displayed measurands can be deleted by pressing F1. Press F3 to exit the menu.The VM25 memory can hold 16000 measurement values.
6.7. Deleting Saved Measurement Data In the menu option “Measurement data” / “Erase meas. data Memory” you can de-lete the entire measurement data. After pressing OK a warning message will appear showing the total number of records.
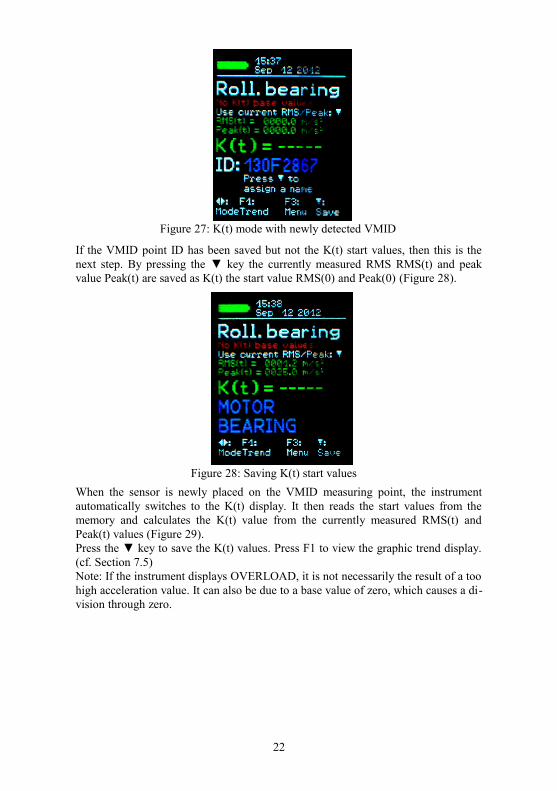
6.8. K(t) MeasurementThe basics of rolling bearing parameters K(t) can be found in section 3.5.First, use keys ◄► to select the operation mode “Roll. bearing” (Figure 26).
K(t) measurements are only intended for use in conjunction with a VMID measure-ment point. The start / reference values RMS and peak of values which have been measured on the new rolling bearings are required for calculating K(t). These start values are saved in the VM25 together with the measuring point ID.Place the sensor on a VMID measuring point of the relevant bearing. If the VMID measurement point ID has not yet been saved in the VM25 (Figure 27), then first of all enter the ID name by pressing the ▼ key (cf. Section 6.3.2.).
21
Figure 25: Display of saved measurements
Figure 26: VM25 in K(t) mode without VMID
If the VMID point ID has been saved but not the K(t) start values, then this is the next step. By pressing the ▼ key the currently measured RMS RMS(t) and peak value Peak(t) are saved as K(t) the start value RMS(0) and Peak(0) (Figure 28).
When the sensor is newly placed on the VMID measuring point, the instrument automatically switches to the K(t) display. It then reads the start values from the memory and calculates the K(t) value from the currently measured RMS(t) and Peak(t) values (Figure 29).Press the ▼ key to save the K(t) values. Press F1 to view the graphic trend display. (cf. Section 7.5)Note: If the instrument displays OVERLOAD, it is not necessarily the result of a too high acceleration value. It can also be due to a base value of zero, which causes a di-vision through zero.
22
Figure 27: K(t) mode with newly detected VMID
Figure 28: Saving K(t) start values
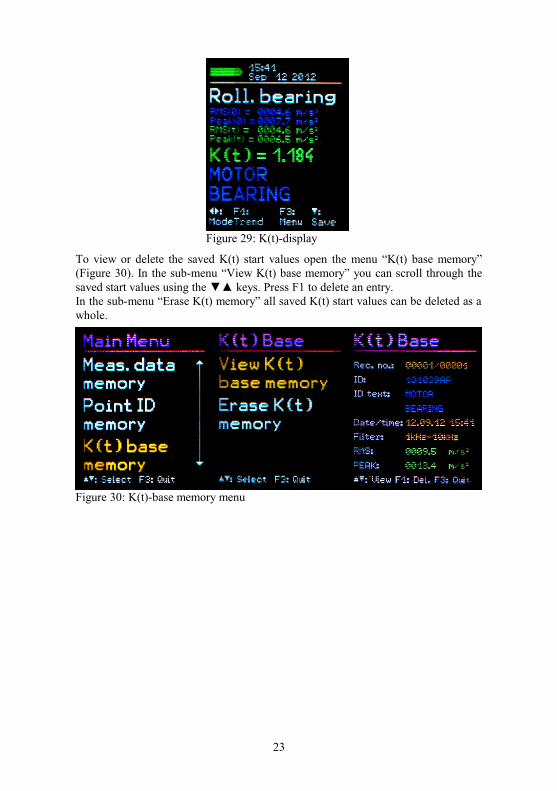
To view or delete the saved K(t) start values open the menu “K(t) base memory” (Figure 30). In the sub-menu “View K(t) base memory” you can scroll through the saved start values using the ▼▲ keys. Press F1 to delete an entry. In the sub-menu “Erase K(t) memory” all saved K(t) start values can be deleted as a whole.
23
Figure 29: K(t)-display
Figure 30: K(t)-base memory menu
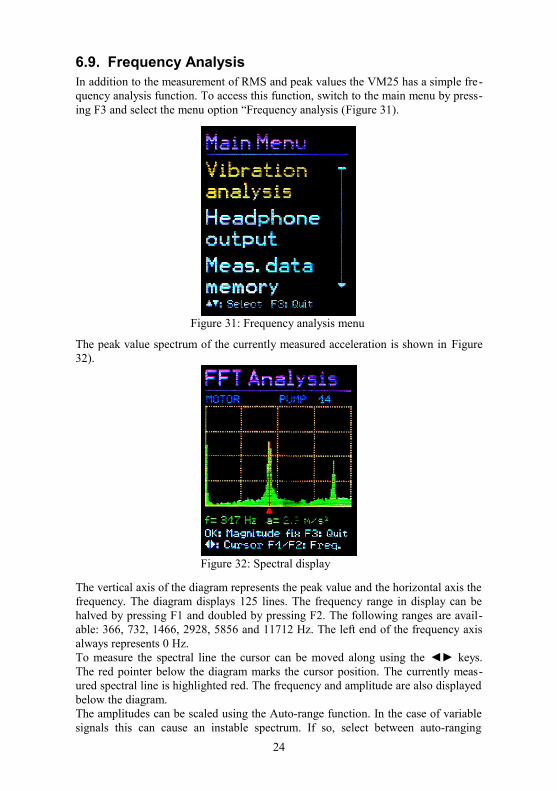
6.9. Frequency AnalysisIn addition to the measurement of RMS and peak values the VM25 has a simple fre-quency analysis function. To access this function, switch to the main menu by press-ing F3 and select the menu option “Frequency analysis (Figure 31).
The peak value spectrum of the currently measured acceleration is shown in Figure32).
The vertical axis of the diagram represents the peak value and the horizontal axis the frequency. The diagram displays 125 lines. The frequency range in display can be halved by pressing F1 and doubled by pressing F2. The following ranges are avail-able: 366, 732, 1466, 2928, 5856 and 11712 Hz. The left end of the frequency axis always represents 0 Hz.To measure the spectral line the cursor can be moved along using the ◄► keys. The red pointer below the diagram marks the cursor position. The currently meas-ured spectral line is highlighted red. The frequency and amplitude are also displayed below the diagram.The amplitudes can be scaled using the Auto-range function. In the case of variable signals this can cause an instable spectrum. If so, select between auto-ranging
24
Figure 31: Frequency analysis menu
Figure 32: Spectral display
(“Ampl. auto”) and fixed amplitude scaling (“Ampl. fixed”) by pressing OK re-peatedly. In the case of fixed amplitudes, the scaling type most recently selected is retained.Press F3 to exit the spectral view.
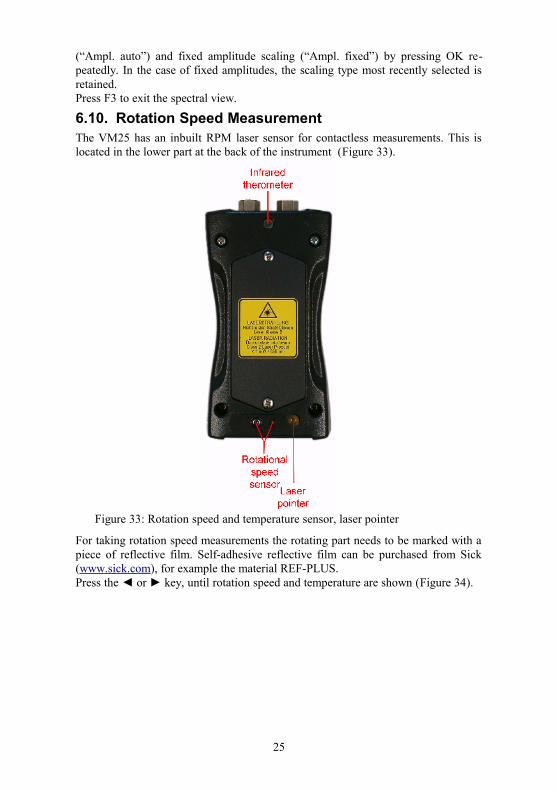
6.10. Rotation Speed MeasurementThe VM25 has an inbuilt RPM laser sensor for contactless measurements. This is located in the lower part at the back of the instrument (Figure 33).
For taking rotation speed measurements the rotating part needs to be marked with a piece of reflective film. Self-adhesive reflective film can be purchased from Sick (www.sick.com), for example the material REF-PLUS.Press the ◄ or ► key, until rotation speed and temperature are shown (Figure 34).
25
Figure 33: Rotation speed and temperature sensor, laser pointer
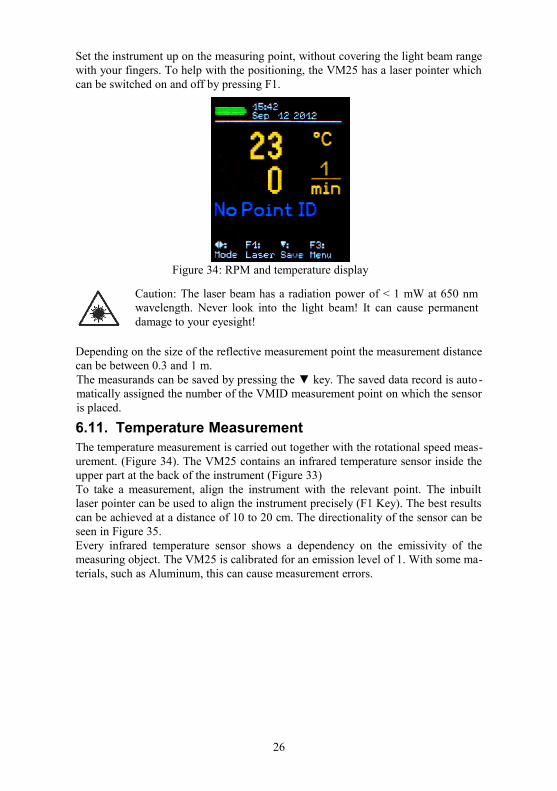
Set the instrument up on the measuring point, without covering the light beam range with your fingers. To help with the positioning, the VM25 has a laser pointer which can be switched on and off by pressing F1.
Caution: The laser beam has a radiation power of < 1 mW at 650 nm wavelength. Never look into the light beam! It can cause permanent damage to your eyesight!
Depending on the size of the reflective measurement point the measurement distance can be between 0.3 and 1 m.The measurands can be saved by pressing the ▼ key. The saved data record is auto -matically assigned the number of the VMID measurement point on which the sensor is placed.
6.11. Temperature MeasurementThe temperature measurement is carried out together with the rotational speed meas-urement. (Figure 34). The VM25 contains an infrared temperature sensor inside the upper part at the back of the instrument (Figure 33)To take a measurement, align the instrument with the relevant point. The inbuilt laser pointer can be used to align the instrument precisely (F1 Key). The best results can be achieved at a distance of 10 to 20 cm. The directionality of the sensor can be seen in Figure 35.Every infrared temperature sensor shows a dependency on the emissivity of the measuring object. The VM25 is calibrated for an emission level of 1. With some ma-terials, such as Aluminum, this can cause measurement errors.
26
Figure 34: RPM and temperature display
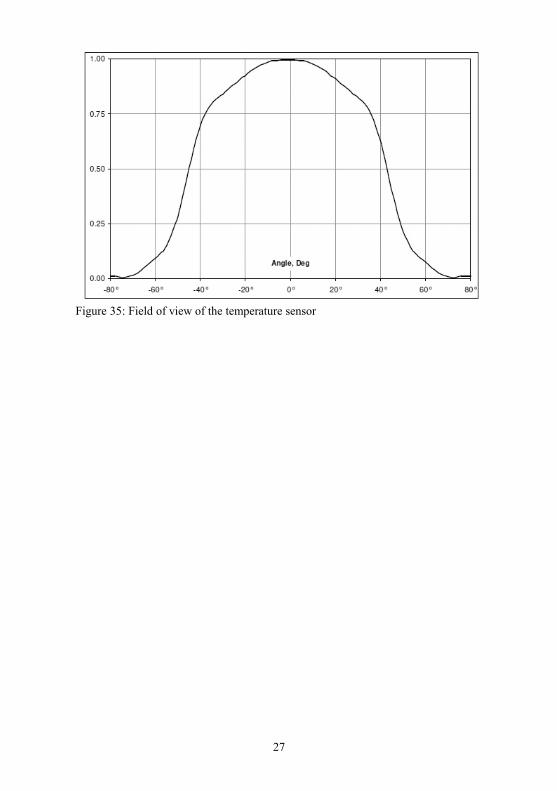
Figure 35: Field of view of the temperature sensor
27
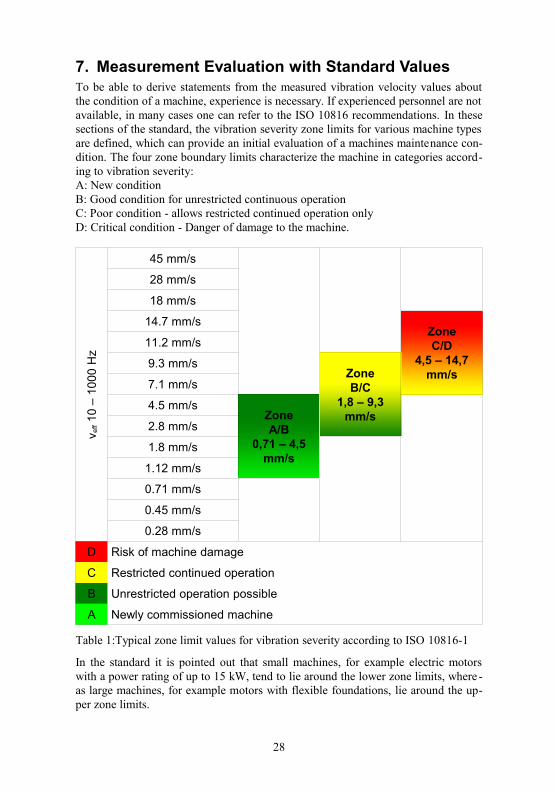
7. Measurement Evaluation with Standard ValuesTo be able to derive statements from the measured vibration velocity values about the condition of a machine, experience is necessary. If experienced personnel are not available, in many cases one can refer to the ISO 10816 recommendations. In these sections of the standard, the vibration severity zone limits for various machine types are defined, which can provide an initial evaluation of a machines maintenance con-dition. The four zone boundary limits characterize the machine in categories accord-ing to vibration severity:A: New conditionB: Good condition for unrestricted continuous operationC: Poor condition - allows restricted continued operation onlyD: Critical condition - Danger of damage to the machine.
v eff 1
0 –
1000
Hz
45 mm/s
28 mm/s
18 mm/s
14.7 mm/sZoneC/D
4,5 – 14,7 mm/s
11.2 mm/s
9.3 mm/sZoneB/C
1,8 – 9,3 mm/s
7.1 mm/s
4.5 mm/sZoneA/B
0,71 – 4,5 mm/s
2.8 mm/s
1.8 mm/s
1.12 mm/s
0.71 mm/s
0.45 mm/s
0.28 mm/s
D Risk of machine damage
C Restricted continued operation
B Unrestricted operation possible
A Newly commissioned machine
Table 1:Typical zone limit values for vibration severity according to ISO 10816-1
In the standard it is pointed out that small machines, for example electric motors with a power rating of up to 15 kW, tend to lie around the lower zone limits, where -as large machines, for example motors with flexible foundations, lie around the up-per zone limits.
28
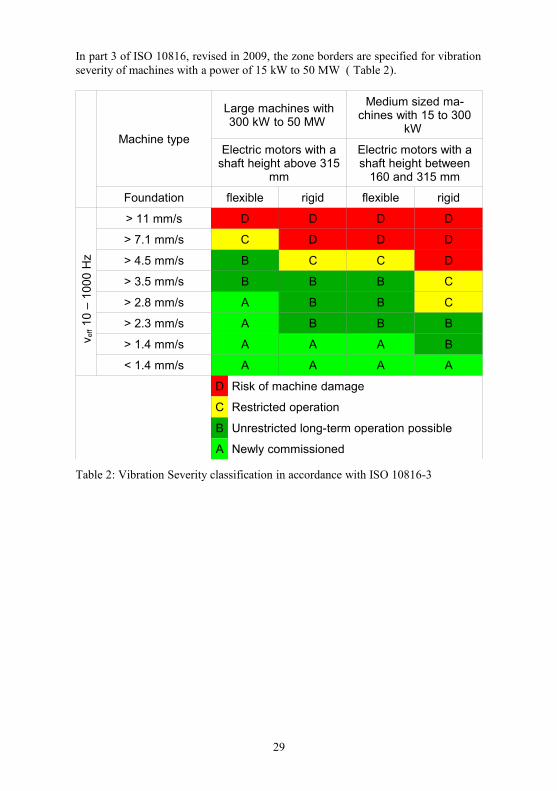
In part 3 of ISO 10816, revised in 2009, the zone borders are specified for vibration severity of machines with a power of 15 kW to 50 MW ( Table 2).
Machine type
Large machines with 300 kW to 50 MW
Medium sized ma-chines with 15 to 300
kW
Electric motors with a shaft height above 315
mm
Electric motors with a shaft height between
160 and 315 mm
Foundation flexible rigid flexible rigid
v eff 1
0 –
1000
Hz
> 11 mm/s D D D D
> 7.1 mm/s C D D D
> 4.5 mm/s B C C D
> 3.5 mm/s B B B C
> 2.8 mm/s A B B C
> 2.3 mm/s A B B B
> 1.4 mm/s A A A B
< 1.4 mm/s A A A A
D Risk of machine damage
C Restricted operation
B Unrestricted long-term operation possible
A Newly commissioned
Table 2: Vibration Severity classification in accordance with ISO 10816-3
29
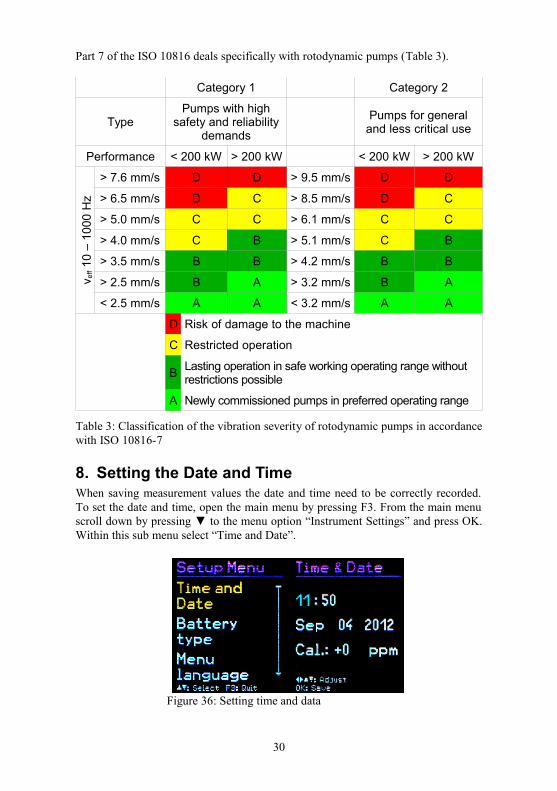
Part 7 of the ISO 10816 deals specifically with rotodynamic pumps (Table 3).
Category 1 Category 2
TypePumps with high
safety and reliability demands
Pumps for general and less critical use
Performance < 200 kW > 200 kW < 200 kW > 200 kW
v eff 1
0 –
1000
Hz
> 7.6 mm/s D D > 9.5 mm/s D D
> 6.5 mm/s D C > 8.5 mm/s D C
> 5.0 mm/s C C > 6.1 mm/s C C
> 4.0 mm/s C B > 5.1 mm/s C B
> 3.5 mm/s B B > 4.2 mm/s B B
> 2.5 mm/s B A > 3.2 mm/s B A
< 2.5 mm/s A A < 3.2 mm/s A A
D Risk of damage to the machine
C Restricted operation
B Lasting operation in safe working operating range without restrictions possible
A Newly commissioned pumps in preferred operating range
Table 3: Classification of the vibration severity of rotodynamic pumps in accordance with ISO 10816-7
8. Setting the Date and TimeWhen saving measurement values the date and time need to be correctly recorded. To set the date and time, open the main menu by pressing F3. From the main menu scroll down by pressing ▼ to the menu option “Instrument Settings” and press OK. Within this sub menu select “Time and Date”.
30
Figure 36: Setting time and data
Using keys ▲▼ you can adjust the chosen value. Upon reaching the maximum value, e.g. in the 23rd hour, the counter starts again from the beginning. Press ◄► to skip between hour, minute, month, day and year. The date takes the leap year into consideration. It is, however, important to ensure that no invalid day-month combin-ations are entered.Additionally, clock inaccuracy can be corrected. This can be done using the setting at “Cal.” in ppm (parts per million). The clock frequency can be increased with pos-itive values and decreased with negative. The sign changes to minus at +254 ppm. Example: The clock is 5 seconds slow. There are 24 * 60 * 60 s = 86400 seconds in a day. The difference amounts to 5 s / 86400 s = 58 * 10 -6 = 58 ppm. The adjustable value is -58 ppm.To exit the menu press OK followed by F3 repeatedly.
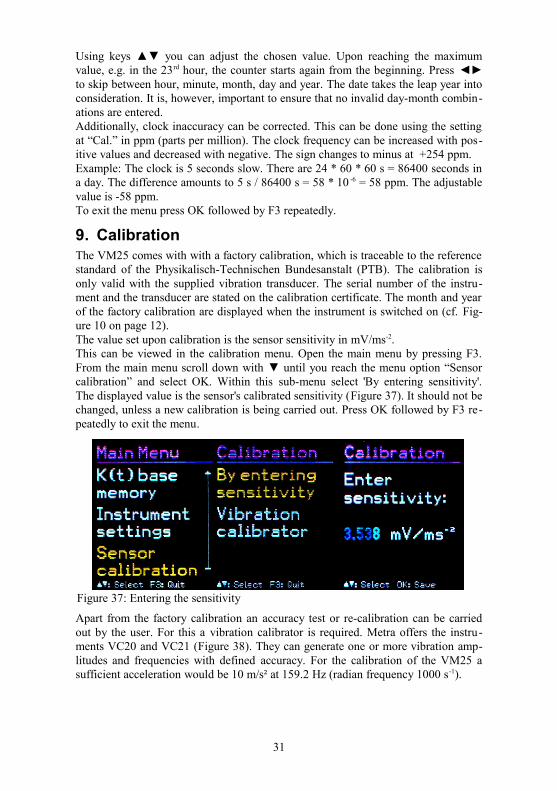
9. CalibrationThe VM25 comes with with a factory calibration, which is traceable to the reference standard of the Physikalisch-Technischen Bundesanstalt (PTB). The calibration is only valid with the supplied vibration transducer. The serial number of the instru-ment and the transducer are stated on the calibration certificate. The month and year of the factory calibration are displayed when the instrument is switched on (cf. Fig-ure 10 on page 12).The value set upon calibration is the sensor sensitivity in mV/ms-2.This can be viewed in the calibration menu. Open the main menu by pressing F3. From the main menu scroll down with ▼ until you reach the menu option “Sensor calibration” and select OK. Within this sub-menu select 'By entering sensitivity'. The displayed value is the sensor's calibrated sensitivity (Figure 37). It should not be changed, unless a new calibration is being carried out. Press OK followed by F3 re-peatedly to exit the menu.
Apart from the factory calibration an accuracy test or re-calibration can be carried out by the user. For this a vibration calibrator is required. Metra offers the instru-ments VC20 and VC21 (Figure 38). They can generate one or more vibration amp-litudes and frequencies with defined accuracy. For the calibration of the VM25 a sufficient acceleration would be 10 m/s² at 159.2 Hz (radian frequency 1000 s-1).
31
Figure 37: Entering the sensitivity
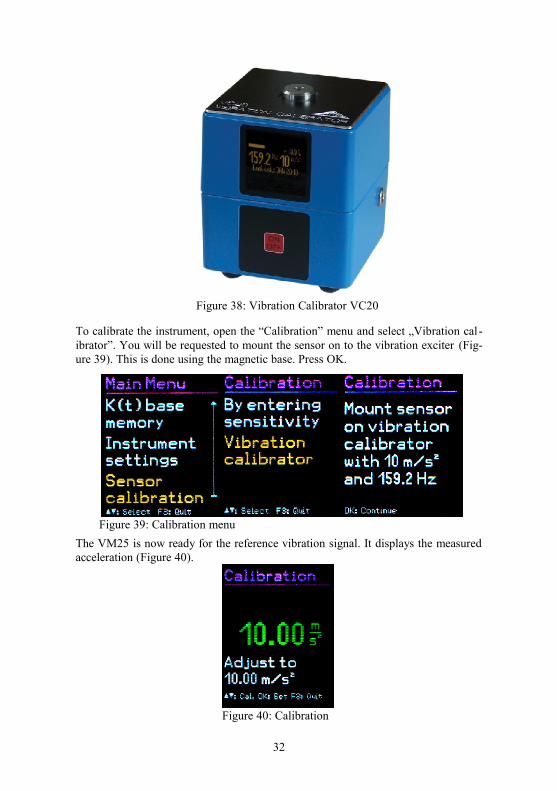
To calibrate the instrument, open the “Calibration” menu and select „Vibration cal -ibrator”. You will be requested to mount the sensor on to the vibration exciter (Fig-ure 39). This is done using the magnetic base. Press OK.
The VM25 is now ready for the reference vibration signal. It displays the measured acceleration (Figure 40).
32
Figure 38: Vibration Calibrator VC20
Figure 39: Calibration menu
Figure 40: Calibration
10. Sensor CheckThe VM25 input is designed for use with a low power IEPE accelerometer. These sensors are supplied by constant current, which produces a positive DC voltage po-tential at the output. Due to this DC voltage an assessment can be made of the sensor's operating condition. The VM25 detects three operational conditions:
< 0.1 V: short circuit0.1 – 11 V: in working order>11 V: open input, e.g. broken cable
If a short circuit occurs or the input is open the instrument will display “SENSOR ERROR” instead of the measurand.
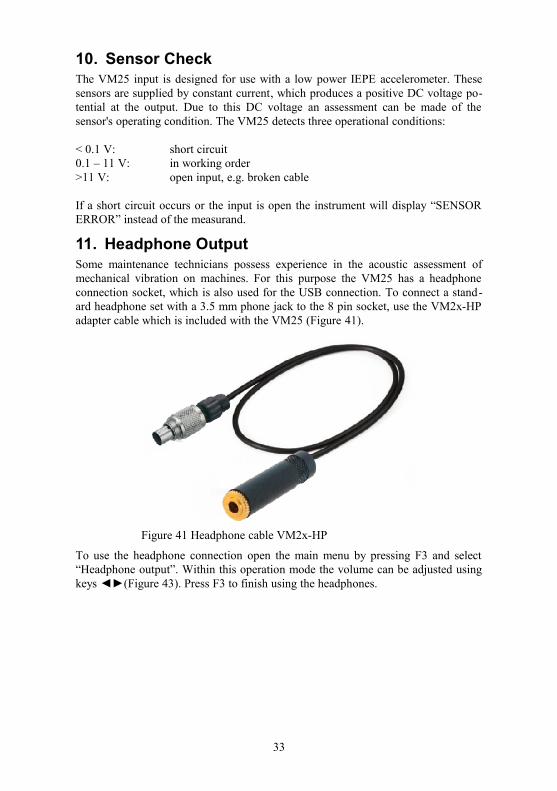
11. Headphone OutputSome maintenance technicians possess experience in the acoustic assessment of mechanical vibration on machines. For this purpose the VM25 has a headphone connection socket, which is also used for the USB connection. To connect a stand-ard headphone set with a 3.5 mm phone jack to the 8 pin socket, use the VM2x-HP adapter cable which is included with the VM25 (Figure 41).
To use the headphone connection open the main menu by pressing F3 and select “Headphone output”. Within this operation mode the volume can be adjusted using keys ◄►(Figure 43). Press F3 to finish using the headphones.
33
Figure 41 Headphone cable VM2x-HP
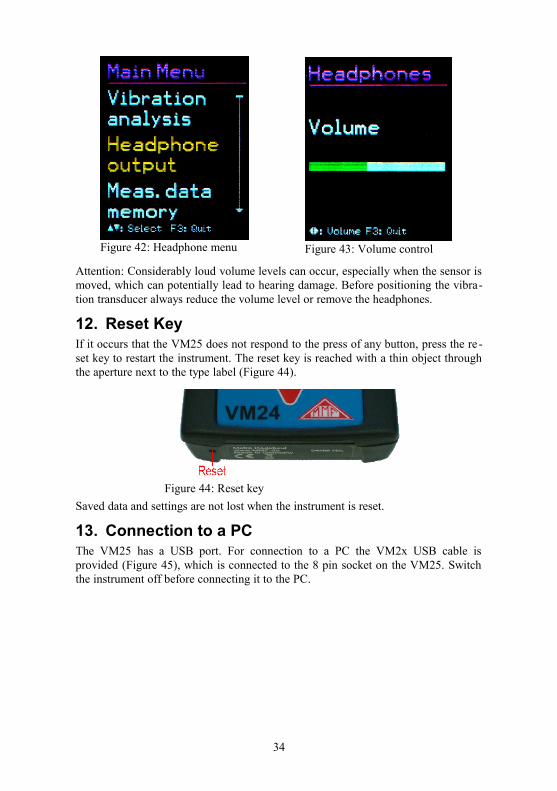
Attention: Considerably loud volume levels can occur, especially when the sensor is moved, which can potentially lead to hearing damage. Before positioning the vibra-tion transducer always reduce the volume level or remove the headphones.
12. Reset KeyIf it occurs that the VM25 does not respond to the press of any button, press the re -set key to restart the instrument. The reset key is reached with a thin object through the aperture next to the type label (Figure 44).
Saved data and settings are not lost when the instrument is reset.
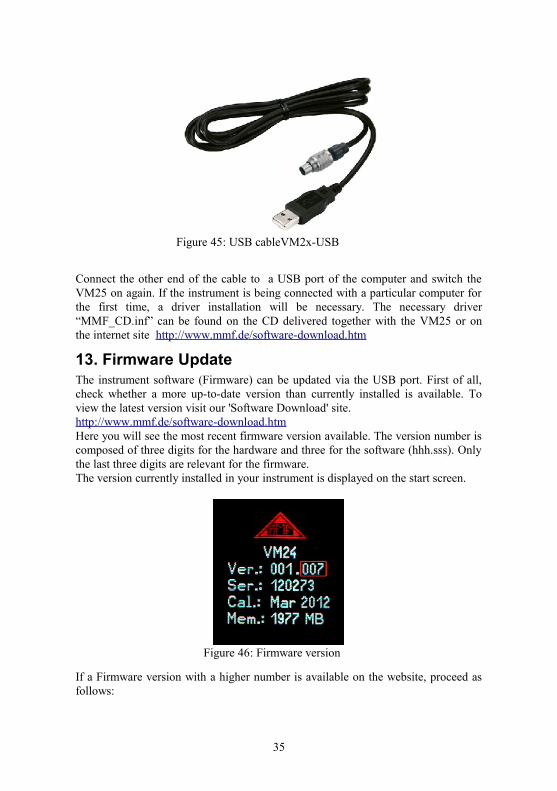
13. Connection to a PCThe VM25 has a USB port. For connection to a PC the VM2x USB cable is provided (Figure 45), which is connected to the 8 pin socket on the VM25. Switch the instrument off before connecting it to the PC.
34
Figure 44: Reset key
Figure 42: Headphone menu Figure 43: Volume control
Connect the other end of the cable to a USB port of the computer and switch the VM25 on again. If the instrument is being connected with a particular computer for the first time, a driver installation will be necessary. The necessary driver “MMF_CD.inf” can be found on the CD delivered together with the VM25 or on the internet site http://www.mmf.de/software-download.htm
13. Firmware UpdateThe instrument software (Firmware) can be updated via the USB port. First of all, check whether a more up-to-date version than currently installed is available. To view the latest version visit our 'Software Download' site.http://www.mmf.de/software-download.htmHere you will see the most recent firmware version available. The version number is composed of three digits for the hardware and three for the software (hhh.sss). Only the last three digits are relevant for the firmware. The version currently installed in your instrument is displayed on the start screen.
If a Firmware version with a higher number is available on the website, proceed as follows:
35
Figure 45: USB cableVM2x-USB
Figure 46: Firmware version
1. Download the firmware file vm2x.hex from the above named internet address. 2. Also download the program “Firmware Updater” from the above named inter-
net address and install it on your PC.3. Start the “Firmware Updater”, then select the instrument type “VM2x” and the
virtual COM port assigned by the PC. If you are not sure which of the available COM ports is correct, you can check in the Windows system control manager located within the instrument manager.
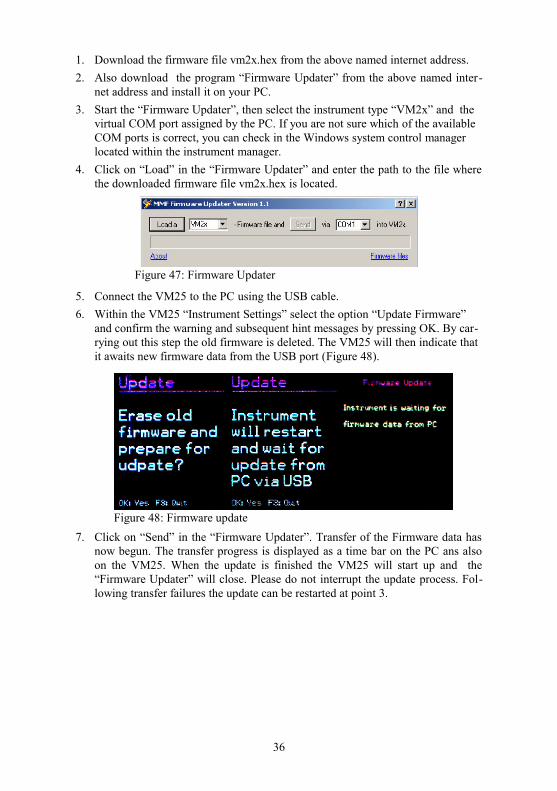
4. Click on “Load” in the “Firmware Updater” and enter the path to the file where the downloaded firmware file vm2x.hex is located.
5. Connect the VM25 to the PC using the USB cable.6. Within the VM25 “Instrument Settings” select the option “Update Firmware”
and confirm the warning and subsequent hint messages by pressing OK. By car-rying out this step the old firmware is deleted. The VM25 will then indicate that it awaits new firmware data from the USB port (Figure 48).
7. Click on “Send” in the “Firmware Updater”. Transfer of the Firmware data has now begun. The transfer progress is displayed as a time bar on the PC ans also on the VM25. When the update is finished the VM25 will start up and the “Firmware Updater” will close. Please do not interrupt the update process. Fol-lowing transfer failures the update can be restarted at point 3.
36
Figure 47: Firmware Updater
Figure 48: Firmware update
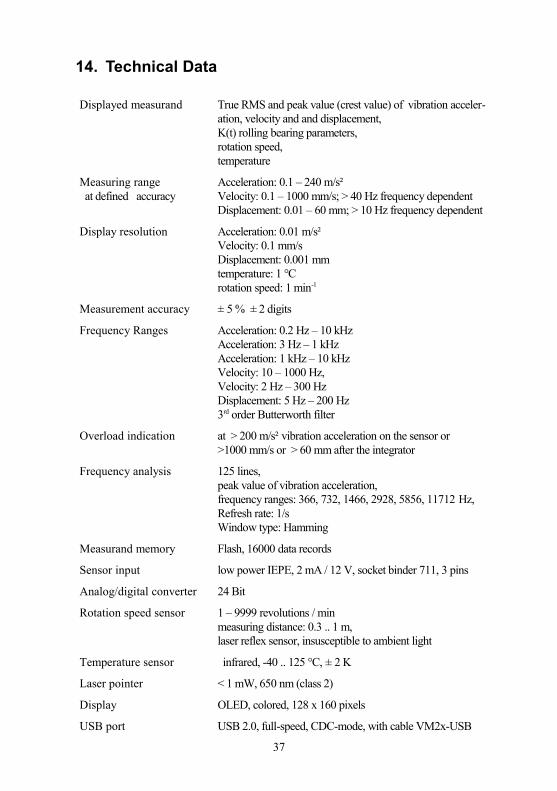
14. Technical Data
Displayed measurand True RMS and peak value (crest value) of vibration acceler-ation, velocity and and displacement,K(t) rolling bearing parameters,rotation speed,temperature
Measuring range at defined accuracy
Acceleration: 0.1 – 240 m/s²Velocity: 0.1 – 1000 mm/s; > 40 Hz frequency dependentDisplacement: 0.01 – 60 mm; > 10 Hz frequency dependent
Display resolution Acceleration: 0.01 m/s²Velocity: 0.1 mm/sDisplacement: 0.001 mmtemperature: 1 °Crotation speed: 1 min-1
Measurement accuracy ± 5 % ± 2 digits
Frequency Ranges Acceleration: 0.2 Hz – 10 kHzAcceleration: 3 Hz – 1 kHzAcceleration: 1 kHz – 10 kHzVelocity: 10 – 1000 Hz, Velocity: 2 Hz – 300 HzDisplacement: 5 Hz – 200 Hz3rd order Butterworth filter
Overload indication at > 200 m/s² vibration acceleration on the sensor or>1000 mm/s or > 60 mm after the integrator
Frequency analysis 125 lines, peak value of vibration acceleration,frequency ranges: 366, 732, 1466, 2928, 5856, 11712 Hz,Refresh rate: 1/sWindow type: Hamming
Measurand memory Flash, 16000 data records
Sensor input low power IEPE, 2 mA / 12 V, socket binder 711, 3 pins
Analog/digital converter 24 Bit
Rotation speed sensor 1 – 9999 revolutions / minmeasuring distance: 0.3 .. 1 m, laser reflex sensor, insusceptible to ambient light
Temperature sensor infrared, -40 .. 125 °C, ± 2 K
Laser pointer < 1 mW, 650 nm (class 2)
Display OLED, colored, 128 x 160 pixels
USB port USB 2.0, full-speed, CDC-mode, with cable VM2x-USB
37
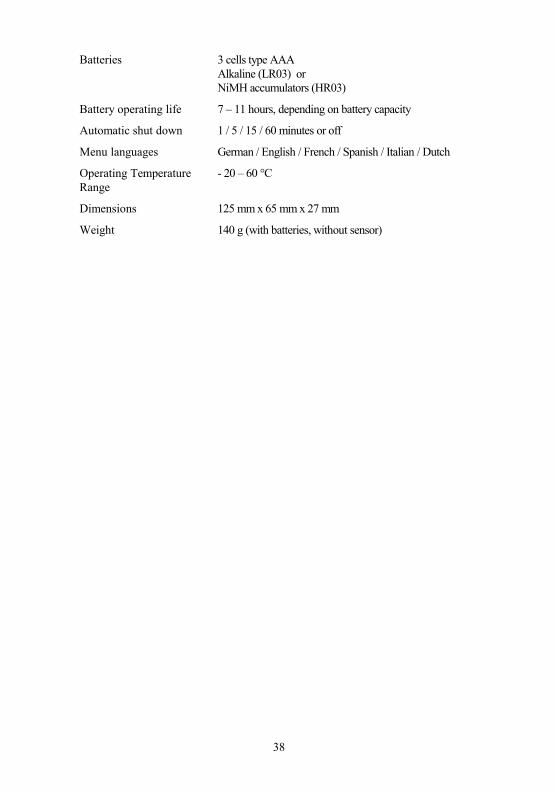
Batteries 3 cells type AAA Alkaline (LR03) or NiMH accumulators (HR03)
Battery operating life 7 – 11 hours, depending on battery capacity
Automatic shut down 1 / 5 / 15 / 60 minutes or off
Menu languages German / English / French / Spanish / Italian / Dutch
Operating Temperature Range
- 20 – 60 °C
Dimensions 125 mm x 65 mm x 27 mm
Weight 140 g (with batteries, without sensor)
38
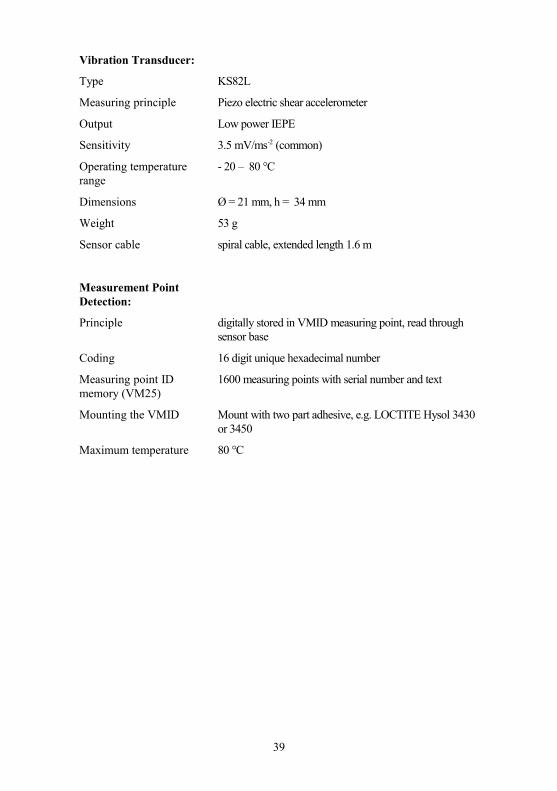
Vibration Transducer:
Type KS82L
Measuring principle Piezo electric shear accelerometer
Output Low power IEPE
Sensitivity 3.5 mV/ms-2 (common)
Operating temperature range
- 20 – 80 °C
Dimensions Ø = 21 mm, h = 34 mm
Weight 53 g
Sensor cable spiral cable, extended length 1.6 m
Measurement Point Detection:
Principle digitally stored in VMID measuring point, read through sensor base
Coding 16 digit unique hexadecimal number
Measuring point ID memory (VM25)
1600 measuring points with serial number and text
Mounting the VMID Mount with two part adhesive, e.g. LOCTITE Hysol 3430 or 3450
Maximum temperature 80 °C
39

Limited WarrantyMetra warrants for a period of
24 monthsthat its products will be free from defects in material or workmanship
and shall conform to the specifications current at the time of shipment.The warranty period starts with the date of invoice.
The customer must provide the dated bill of sale as evidence.The warranty period ends after 24 months. Repairs do not extend the warranty period.
This limited warranty covers only defects which arise as a result of normal use according to the instruction manual.
Metra’s responsibility under this warranty does not apply to any improper or inadequate maintenance or modification
and operation outside the product’s specifications.Shipment to Metra will be paid by the customer.
The repaired or replaced product will be sent back at Metra’s expense.
Declaration of Conformity
Product: Vibration Meter Type: VM25
Hereby is certified that the above mentioned products comply with the demands pursuant to the following standards
EN 61010-1: 2002 (Safety requirements)EN 61326-1: 2006 (EMC requirements)
The producer responsible for this declaration isMetra Mess- und Frequenztechnik
in Radebeul e.K.Meißner Str. 58, D-01445 Radebeul
Declared by
Michael Weber
Radebeul, 22nd March 2012
40