Embed Size (px)
Citation preview

Beclin-1 is required for chromosome congressionand proper outer kinetochore assemblyStephane Fremont1,2,3,4*, Annabelle Gerard1,2,3*, Marie Galloux1,2,3w, Katy Janvier1,2,3, Roger E. Karess4,5
& Clarisse Berlioz-Torrent1,2,3+
1Inserm, U1016, Institut Cochin, 2Cnrs, UMR8104, 3Universite Paris Descartes, 4Universite Paris Diderot, and 5Institut Jacques
Monod, CNRS, UMR 7592, Paris, France
The functions of Beclin-1 in macroautophagy, tumorigenesis andcytokinesis are thought to be mediated by its association with thePI3K-III complex. Here, we describe a new role for Beclin-1 inmitotic chromosome congression that is independent of the PI3K-III complex and its role in autophagy. Beclin-1 depletion in HeLacells leads to a significant reduction of the outer kinetochoreproteins CENP-E, CENP-F and ZW10, and, consequently, the cellspresent severe problems in chromosome congression. Beclin-1associates with kinetochore microtubules and forms discretefoci near the kinetochores of attached chromosomes. We showthat Beclin-1 interacts directly with Zwint-1—a component ofthe KMN (KNL-1/Mis12/Ndc80) complex—which is essentialfor kinetochore–microtubule interactions. This suggests thatBeclin-1 acts downstream of the KMN complex to influence therecruitment of outer kinetochore proteins and promotes accuratekinetochore anchoring to the spindle during mitosis.Keywords: Beclin-1; chromosome congression; kinetochoreassembly; mitosis; Zwint-1EMBO reports (2013) 14, 364–372. doi:10.1038/embor.2013.23
INTRODUCTIONThe mammalian class III phosphatidylinositol 3-kinase (PI3K-III)complex is involved in numerous membrane-trafficking events,cytokinesis and autophagy, and has been implicated in immunity,development, tumour suppression, lifespan extension and neuro-degeneration [1–5]. The core of the PI3K-III complex encompassesthree proteins, the kinase VPS34, the regulatory kinase VPS15 and
Beclin-1, and other regulatory proteins associate with the corecomplex [5–8] depending on the particular cell function it isexecuting. Interestingly, monoallelic depletion of Beclin-1reportedly causes chromosomal disorders such as aneuploidyand double-minute chromosomes [9]. An open question iswhether these phenotypes are a direct consequence of deficientautophagy, or whether they reflect other unidentified functions ofBeclin-1. Indeed, there is growing evidence suggesting non-autophagic roles for ‘autophagy’ proteins [10]. As aneuploidy iscaused by errors in chromosome segregation, we asked in thisstudy whether Beclin-1 might be directly involved in mitosis,beyond its already characterized role in cytokinesis (as part of thePI3K-III complex). We find that Beclin-1 does indeed have amitosis-specific function. Beclin-1 depletion leads to severechromosome congression defects, associated with a reduction inseveral outer kinetochore components, including ZW10, CENP-Eand CENP-F. We also detect a direct interaction between Beclin-1and the outer kinetochore component Zwint-1. None of thesefunctions is compromised by depletion of other subunits of thePI3K-III complex, suggesting that they are specific to Beclin-1.
RESULTS AND DISCUSSIONTo examine the involvement of Beclin-1 in cell cycle progression,we depleted Beclin-1 by small interfering RNA (siRNA) in HeLacells (Fig 1A). Beclin-1 depletion led to an increased number ofcells with 4n DNA content (56%) compared to control cells (25%),as determined by flow cytometry (Fig 1A, upper panel), togetherwith the appearance of multinucleated cells (as previouslyreported [3]). Importantly, the phenotype was significantlyrescued by expression of a haemagglutinin (HA)-Beclin-1construct resistant to the siRNA (Fig 1A, lower panel). Theseresults suggested that Beclin-1 knockdown impaired progressionthrough G2/M as well as cytokinesis. To differentiate between G2and mitotic delay, we analysed the ability of cells depleted ofBeclin-1 to resume mitosis following release from a nocodazoleblock. Whereas 40% of control cells reached G1 within 2 h ofrelease, more than 60% of Beclin-1-depleted cells remained inmitosis even 8 h after release (Fig 1B). Similar results wereobtained with a second siRNA targeting Beclin-1 (supplementaryFig S1A,B online). Cytological quantification of mitotic stages,
1Inserm, U1016, Institut Cochin, 27, Rue du faubourg Saint Jacques,75014 Paris, France2Cnrs, UMR8104, 75014 Paris, France3Universite Paris Descartes, 75014 Paris, France4Universite Paris Diderot, 75013 Paris, France5Institut Jacques Monod, CNRS, UMR 7592, 75013 Paris, France
+Corresponding author. Tel: +33 1 40 51 65 75; Fax: þ 33 1 40 51 65 70;E-mail: [email protected]
*These authors contributed equally to this work.wPresent address: INRA - Unite de Virologie et Immunologie Moleculaires,Domaine de Vilvert, 78352 Jouy-en-Josas, France.
Received 10 September 2012; revised 12 February 2013; accepted 13 February 2013;published online 12 March 2013
scientificreportscientific report
364 EMBO reports VOL 14 | NO 4 | 2013 &2013 EUROPEAN MOLECULAR BIOLOGY ORGANIZATION

using histone H3 phosphorylated on serine 10 (H3Ser10P) as amarker of mitosis, confirmed that Beclin-1 depletion significantlyincreased the mitotic index to 9.7% (compared to 3.4% in control)(Fig 1C), and most of these mitotic cells (88.5%) appeared to be inprometaphase (Fig 1D). In fact, we observed a 20-fold increase ofcells with several non-aligned chromosomes around recognizablemetaphase plates compared to the controls (Fig 1E; supplementaryFig S1C,D online). No obvious problems in nuclear envelopebreakdown or overall centrosome and spindle organization wereevident in Beclin-1 depleted cells (supplementary Fig S2 online).Altogether, these results show a major role for Beclin-1 in mitoticprogression, particularly during prometaphase.
We then investigated the function of Beclin-1 in chromosomealignment. To visualize both the microtubules and the chromo-
somes in living cells, we generated a HeLa cell line stablyexpressing YFP-a-tubulin and the histone H2B-Cherry (Fig 2A).In this cell line transfected with control siRNA, mitosis proceededfrom nuclear envelope breakdown to anaphase in about 60 min,with chromosomes perfectly aligned on the metaphase plate(Fig 2A,G). Following Beclin-1 depletion, progression fromnuclear envelope breakdown to anaphase in these cells tookmuch longer (110 min in Fig 2C, 190 min in Fig 2D,G) than the60 min seen in controls (Fig 2A,G). This delay in anaphase onset isregulated by the spindle checkpoint, as co-depleting Beclin-1 andthe checkpoint protein MAD2 (Fig 2B) resulted in rapid progres-sion through mitosis (Fig 2F–G). We observed three differentclasses of mitotic progression among the Beclin-1-depleted cells(Fig 2C–E). In the first class (7 of 23 cells), although prometaphase
Cel
l num
ber
t=0 h
t=2 h
t=8 h
DNA content
2n
2n
4n
4n
8n
8n
9%
65%
6%
5%
85%
4%
2n
4n
8n2%
91%
3%
s=6%
s=20%
2n
2n
4n
4n
39%
54%
2n
4n
1%
96%
s=6%
66%
11%
s=23%
siRNA Beclin-1siRNA Control
Cel
l num
ber
DNA content
siRNA Beclin-1siRNA Control
53%
25%
56%21%
4%
s=20% s=19%
2n
2n
4n
4n
8n
HeLa cellsA
C D E
B
HA-beclin-1-resistant HeLa cellsC
ell n
umb
er
71%
16%
2n
4n
s=13%DNA content
2n
4n
46%
38%
4%8n
s=12%
0
20
40
60
80
100
% C
ells
in m
itosi
s
siRNA: siRNA: siRNA:
***
02468
1012
010
30
50
70
90
Misaligned chromosomes
DAPI Merge
siRNA Control
DAPI Merge
siRNA Beclin-1C
ell n
umb
erC
ell n
umb
er
*****
-
-
-
- -
-
Control Beclin-1
n=1,627
n=1,356
% o
f mito
tic c
ells
in e
ach
pha
se
PrometaphaseMetaphase AnaphaseProphase
Control Beclin-1 Control Beclin-1
n=114
n=55
α-Tubulin
α-Tubulin
% o
f mito
tic c
ells
with
mis
alig
ned
chro
mos
omes
n=51
n=69
siCon
trol
siBec
lin-1
siCon
trol
siBec
lin-1
Beclin-1
α-Tubulin
α-Beclin-1
α-HA HA-Beclin-1
HA-Beclin-1Beclin-1
α-Tubulin
siRNA Beclin-1siRNA Control
s=2% s=4%
150 150
0 01023 1023
150 150
0 01023 1023
200 100
0 01023 1023
260 100
0 1023 0 1023
250 150
0 1023 0 1023
Fig 1 | Beclin-1 is required for proper mitotic progression. (A) Western blot of Beclin-1 and FACS profiles following siRNA treatment in HeLa cells and
cells stably expressing a HA-Beclin-1 construct resistant to the siRNA targeting endogenous Beclin-1. (B) FACS profiles of cells treated with indicated
siRNA following nocodazole blockage and release. (C,D) Quantification of cells in mitosis (C) and quantification of each step of mitosis (D) by
H3Ser10P staining for Control and Beclin-1 siRNA-treated cells. Error bars represent standard deviations (s.d.) (n¼number of counted cells)
calculated on three independent experiments. Two and three asterisks indicate significant results (P¼ 0.0028 and P¼ 0.0006, respectively).
(E) Knockdown of Beclin-1 increases the number of mitotic cells with misaligned chromosomes. siRNA-treated HeLa cells were fixed in PFA,
immunolabelled for a-tubulin (green) and stained with DAPI (blue). White arrows indicate misaligned chromosomes. Quantification of cells with
misaligned chromosomes is shown at the right (n¼number of counted cells). Three asterisks indicate significant results (P¼ 0.0001). Scale bar,
10 mm. DAPI, 40,6-diamidino-2-phenylindole; HA, haemagglutinin; PFA, paraformaldehyde; siRNA, small interfering RNA.
Beclin-1 contributes to outer kinetochore assembly
S. Fremont et al scientificreport
365&2013 EUROPEAN MOLECULAR BIOLOGY ORGANIZATION EMBO reports VOL 14 | NO 4 | 2013

siR
NA
(Bec
lin-1
+M
AD
2)
H2B
-ch
erry
NEB Prometaphase Mitotic exit
NEB to metaphase Metaphase to anaphase
NEB to anaphase NEB to mitotic exit
0 50 100 150 200 250 300 350
n=30
n=7
n=9
n=7
n=32
siRNA Control
C
siRNA(Beclin-1+MAD2)
D
E
Time (min)
siR
NA
Bec
lin-1
siControl siBeclin-1
-
- Beclin-1
2.5 nM 5 nM 10 nM 20 nM
20 40 60 80 100
2.5 nM
5 nM
10 nM
20 nM
n=43
n=55
n=59
n=23C
D
E
0 %
YFP
-α-
tub
ulin
YFP-α-tubulin/H2B-Cherry HeLa cells
siB
eclin
-1
α-Tubulin
NEBA
C
D
E
F
H
G
BPrometaphase Metaphase Anaphase
30 min -
- MAD2
α-Tubulin
α-Tubulin
- Beclin-1Beclin-1
-
-
H2B
-ch
erry
YFP
-α-
tub
ulin
siR
NA
Con
trol
YFP-α-tubulin/H2B-Cherry HeLa cells
siCon
trol
siCon
trol
siBec
lin-1
+siMAD2
siBec
lin-1
50 min
50 min
30 min20 min
20 min10 min
10 min
0 min
0 min
NEB Prometaphase Metaphase Anaphase
siR
NA
Bec
lin-1
H2B
-ch
erry
YFP
-α-
tub
ulin
110 min100 min90 min60 min30 min10 min0 min
110 min100 min90 min60 min30 min10 min0 min
siR
NA
Bec
lin-1
0 min
NEB Prometaphase Anaphase
H2B
-ch
erry
YFP
-α-
tub
ulin
190 min160 min100 min70 min30 min20 min10 min
0 min 190 min160 min100 min70 min30 min20 min10 min
NEB Prometaphase Mitotic exit
siR
NA
Bec
lin-1
H2B
-ch
erry
YFP
-α-
tub
ulin
250 min240 min170 min110 min70 min30 min20 min10 min0 min
250 min240 min170 min110 min70 min30 min20 min10 min0 min
40 min30 min20 min10 min0 min
40 min30 min20 min10 min0 min
Beclin-1 contributes to outer kinetochore assembly
S. Fremont et alscientificreport
366 EMBO reports VOL 14 | NO 4 | 2013 &2013 EUROPEAN MOLECULAR BIOLOGY ORGANIZATION

took longer, all the chromosomes ultimately aligned on themetaphase plate and anaphase proceeded normally (Fig 2C). Inthe second class (7 of 23 cells), anaphase began after a prolongedprometaphase even though some chromosomes had not yetcongressed to the metaphase plate. Anaphases in these cells wereabnormal with frequent lagging chromatids (Fig 2D). Finally, inthe third class (9 of 23 cells), chromosomes failed to align, andafter a long delay, the cells exited mitosis without undergoing aclear anaphase (Fig 2E). The relative frequency of the threedifferent classes depended on the efficiency of Beclin-1 knock-down (Fig 2H). The more complete the Beclin-1 depletion,the more cells that underwent mitotic exit without properanaphase (Fig 2H).
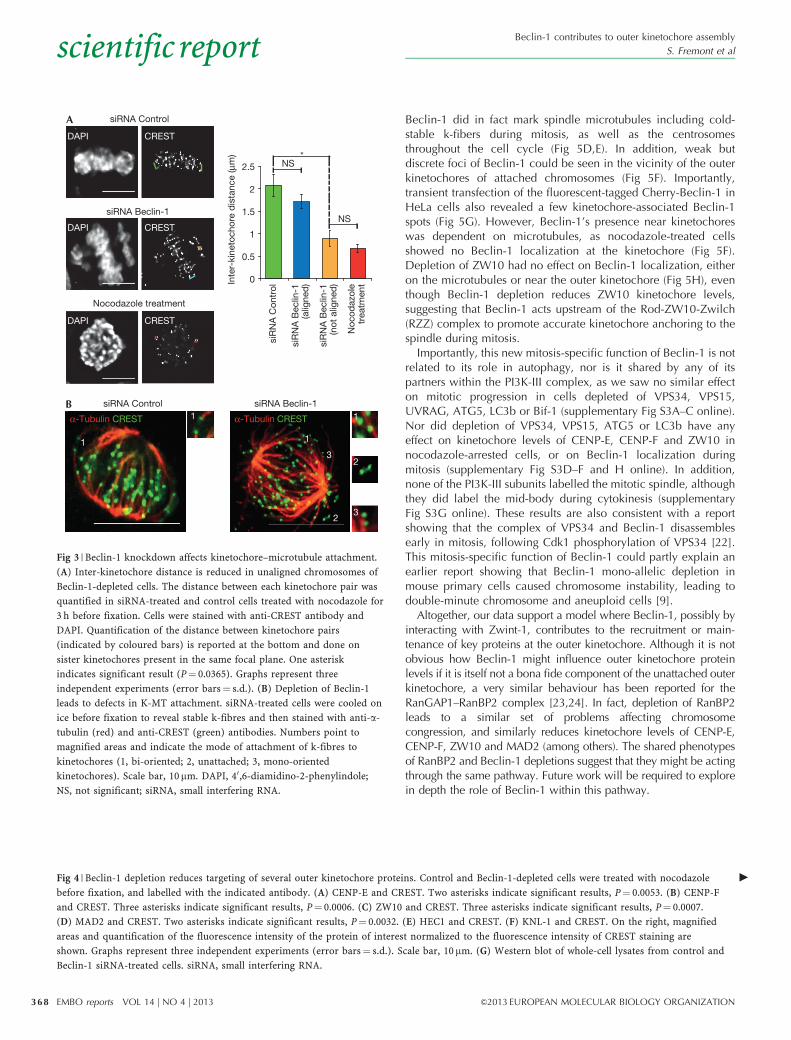
Defects in chromosome alignment suggest impairment of chromo-some attachment or failure to correct attachment errors [11]. Thetension exerted by microtubules on properly attached kinetochoresincreases the distance between sister kinetochores [11]. Toassess the role of Beclin-1 in kinetochore–microtubule(K-MT) attachment, we measured the distance between sisterkinetochores using CREST antisera, which recognize innerkinetochore proteins and the constitutive centromericproteins CENP-A, B and C (Fig 3A). A significant reductionin inter-kinetochore distance of non-aligned chromosomes inBeclin-1-depleted cells (0.9mm) was observed compared to that ofaligned chromosomes in the same cells (1.7 mm) or in control cells(2.1 mm) (Fig 3A). This reduced tension was comparable to theloss of tension in nocodazole-treated control cells (0.7 mm;Fig 3A). Together with the time-lapse video-microscopy(Fig 2C–E), this latter result suggested that Beclin-1 depletion isimpairing the ability of kinetochores to form proper K-MTattachments in a timely manner, providing an explanation forthe observed chromosome alignment problems. On average, eachBeclin-1-depleted cell had nine kinetochore pairs (range 3–15)that failed to align. To more closely examine K-MT interactions,control and Beclin-1-depleted cells were briefly cooled to 41C toreveal the cold-stable k-fibres that specifically retain mitoticchromosomes. Control cells showed proper localization of theCREST signal at the terminal end of k-fibres, indicative ofbi-oriented chromosomes (Fig 3B, number 1). In contrast, inBeclin-1-depleted cells, mono-oriented or totally unattachedchromosomes were frequently observed (Fig 3B, numbers 2and 3, respectively), indicating that Beclin-1 depletion delaysthe establishment of stable K-MT linkages. Nevertheless, as mostchromosomes do align, and with near-normal inter-kinetochore
tension (Fig 3), one plausible interpretation of our data is that innormal mitosis, Beclin-1 promotes an earlier stage in K-MTinteractions, but is not required once mature, load-bearingK-MT attachments develop.
We next examined the levels of several kinetochore compo-nents by immunofluorescence in Beclin-1-depleted cells (Fig 4).We found severe reductions of CENP-E (to 13.4% of control levels)and CENP-F (17.6%), as well as a moderate reduction of ZW10(35.3%) (Fig 4A–C). We also found a reduction in the amount ofMAD2 (28%) on unattached kinetochores (Fig 4D), consistentwith the reduction in ZW10, which is required for its recruit-ment [12]. As our earlier experiments (Fig 2F) showed that theprometaphase delay in Beclin-1-depleted cells is dependent onthe spindle checkpoint, this reduced amount of MAD2 must stillbe adequate for checkpoint function. Indeed, cytoplasmic levelsof MAD2 are unaffected when Beclin-1 is depleted (Fig 4D). HEC1(Ndc80) and KNL-1, two important components of the KMNnetwork, which forms the microtubule-binding module of thekinetochore [13], are still properly recruited to unattachedkinetochores in the absence of Beclin-1 (Fig 4E,F, respectively).Importantly, Beclin-1 depletion does not significantly affectoverall expression levels of CENP-E, CENP-F, Zwint-1, ZW10,MAD2, HEC1 or KNL-1 (Fig 4G). Thus, the reduced kinetochorelevels of CENP-E, CENP-F, ZW10 and, to a lesser extent,MAD2 reflect an important role for Beclin-1 in their recruitmentor maintenance.
One possible clue to understanding the mechanism by whichBeclin-1 is influencing kinetochore structure comes from an earlierreport [14] suggesting that a possible partner of Beclin-1 was Zwint-1, a component of the KMN network [12,15]. Perturbation of theKMN complex can reduce levels of other outer kinetochorecomponents, including CENP-F, CENP-E, ZW10 and thespindle checkpoint protein MAD2 [12,16–21]. We confirmedthe interaction between Zwint-1 and Beclin-1, as HA-taggedBeclin-1 transiently expressed in HeLa cells could beco-immunoprecipitated with antibodies to endogenous Zwint-1(Fig 5A). Moreover, this interaction appeared to be direct, asrecombinant purified His6-Beclin-1 interacted with recombinantpurified GST-Zwint-1 (Fig 5B). However, Beclin-1 depletion had noeffect on Zwint-1 kinetochore levels in nocodazole-arrested cells(Fig 5C), suggesting that Beclin-1 acts downstream of the KMNcomplex to influence the recruitment of outer kinetochore proteins.
Although Beclin-1 was not known to be a component of themitotic apparatus, our immunostaining studies revealed that
Fig 2 | Beclin-1 depletion prolongs prometaphase by delaying chromosome congression. (A–H) Time-lapse films of HeLa cells stably expressing
YFP-a-tubulin and H2B-Cherry and treated with the indicated siRNA. The pictures are acquired every 10 min. Time lapse starts at nuclear envelope
breakdown. (A) Mitosis in control cells. (B) Western blot of whole-cell lysates from Control, Beclin-1 and Beclin-1þMad2 siRNA-treated cells.
(C–E) Three different classes of mitotic progression were observed upon Beclin-1 depletion. Higher magnification of lagging chromatids in the
anaphase of Beclin-1-depleted cells is shown on the right of (D). (F) The prometaphase delay is dependent on MAD2 and the spindle checkpoint.
Cells treated simultaneously with siRNA targeting MAD2 and Beclin-1 rapidly exit mitosis. (G) Average duration of mitosis in different classes of
Beclin-1-depleted cells, compared to control and MAD2 depletions. n¼ number of counted cells in three independent experiments. Error bars on
graphs represent s.d. (H) The frequency of the different Beclin-1 phenotypes depended on the efficiency of Beclin-1 knockdown. Mitotic progression in
cells treated with increasing concentrations of Beclin-1 siRNA was followed by video-microscopy. Left panel: western blot of Beclin-1 upon RNAi
treatment; right panel: quantification of the appearance of the three different mitotic progression patterns, that is, prolonged mitosis with normal
anaphase (as C), with lagging chromatids (as D) and mitotic exit without clear anaphase (as E) upon increased Beclin-1 knockdown experiments.
NEB, nuclear envelop breakdown; RNAi, RNA interference; siRNA, small interfering RNA; YFP, yellow fluorescent protein.
b
Beclin-1 contributes to outer kinetochore assembly
S. Fremont et al scientificreport
367&2013 EUROPEAN MOLECULAR BIOLOGY ORGANIZATION EMBO reports VOL 14 | NO 4 | 2013
Beclin-1 did in fact mark spindle microtubules including cold-stable k-fibers during mitosis, as well as the centrosomesthroughout the cell cycle (Fig 5D,E). In addition, weak butdiscrete foci of Beclin-1 could be seen in the vicinity of the outerkinetochores of attached chromosomes (Fig 5F). Importantly,transient transfection of the fluorescent-tagged Cherry-Beclin-1 inHeLa cells also revealed a few kinetochore-associated Beclin-1spots (Fig 5G). However, Beclin-1’s presence near kinetochoreswas dependent on microtubules, as nocodazole-treated cellsshowed no Beclin-1 localization at the kinetochore (Fig 5F).Depletion of ZW10 had no effect on Beclin-1 localization, eitheron the microtubules or near the outer kinetochore (Fig 5H), eventhough Beclin-1 depletion reduces ZW10 kinetochore levels,suggesting that Beclin-1 acts upstream of the Rod-ZW10-Zwilch(RZZ) complex to promote accurate kinetochore anchoring to thespindle during mitosis.
Importantly, this new mitosis-specific function of Beclin-1 is notrelated to its role in autophagy, nor is it shared by any of itspartners within the PI3K-III complex, as we saw no similar effecton mitotic progression in cells depleted of VPS34, VPS15,UVRAG, ATG5, LC3b or Bif-1 (supplementary Fig S3A–C online).Nor did depletion of VPS34, VPS15, ATG5 or LC3b have anyeffect on kinetochore levels of CENP-E, CENP-F and ZW10 innocodazole-arrested cells, or on Beclin-1 localization duringmitosis (supplementary Fig S3D–F and H online). In addition,none of the PI3K-III subunits labelled the mitotic spindle, althoughthey did label the mid-body during cytokinesis (supplementaryFig S3G online). These results are also consistent with a reportshowing that the complex of VPS34 and Beclin-1 disassemblesearly in mitosis, following Cdk1 phosphorylation of VPS34 [22].This mitosis-specific function of Beclin-1 could partly explain anearlier report showing that Beclin-1 mono-allelic depletion inmouse primary cells caused chromosome instability, leading todouble-minute chromosome and aneuploid cells [9].
Altogether, our data support a model where Beclin-1, possibly byinteracting with Zwint-1, contributes to the recruitment or main-tenance of key proteins at the outer kinetochore. Although it is notobvious how Beclin-1 might influence outer kinetochore proteinlevels if it is itself not a bona fide component of the unattached outerkinetochore, a very similar behaviour has been reported for theRanGAP1–RanBP2 complex [23,24]. In fact, depletion of RanBP2leads to a similar set of problems affecting chromosomecongression, and similarly reduces kinetochore levels of CENP-E,CENP-F, ZW10 and MAD2 (among others). The shared phenotypesof RanBP2 and Beclin-1 depletions suggest that they might be actingthrough the same pathway. Future work will be required to explorein depth the role of Beclin-1 within this pathway.
0
0.5
1
1.5
2
2.5
siR
NA
Con
trol
siR
NA
Bec
lin-1
(not
alig
ned
)
Noc
odaz
ole
trea
tmen
t
siR
NA
Bec
lin-1
(alig
ned
)
NS
NS
1
α-Tubulin CREST 1siRNA Control
1
2
3
α-Tubulin CREST 1
2
3
siRNA Beclin-1
DAPI CREST
DAPI CREST
DAPI CREST
siRNA ControlA
B
siRNA Beclin-1
Nocodazole treatment
*
Inte
r-ki
neto
chor
e d
ista
nce
(μm
)
Fig 3 | Beclin-1 knockdown affects kinetochore–microtubule attachment.
(A) Inter-kinetochore distance is reduced in unaligned chromosomes of
Beclin-1-depleted cells. The distance between each kinetochore pair was
quantified in siRNA-treated and control cells treated with nocodazole for
3 h before fixation. Cells were stained with anti-CREST antibody and
DAPI. Quantification of the distance between kinetochore pairs
(indicated by coloured bars) is reported at the bottom and done on
sister kinetochores present in the same focal plane. One asterisk
indicates significant result (P¼ 0.0365). Graphs represent three
independent experiments (error bars¼ s.d.). (B) Depletion of Beclin-1
leads to defects in K-MT attachment. siRNA-treated cells were cooled on
ice before fixation to reveal stable k-fibres and then stained with anti-a-
tubulin (red) and anti-CREST (green) antibodies. Numbers point to
magnified areas and indicate the mode of attachment of k-fibres to
kinetochores (1, bi-oriented; 2, unattached; 3, mono-oriented
kinetochores). Scale bar, 10mm. DAPI, 40,6-diamidino-2-phenylindole;
NS, not significant; siRNA, small interfering RNA.
Fig 4 | Beclin-1 depletion reduces targeting of several outer kinetochore proteins. Control and Beclin-1-depleted cells were treated with nocodazole
before fixation, and labelled with the indicated antibody. (A) CENP-E and CREST. Two asterisks indicate significant results, P¼ 0.0053. (B) CENP-F
and CREST. Three asterisks indicate significant results, P¼ 0.0006. (C) ZW10 and CREST. Three asterisks indicate significant results, P¼ 0.0007.
(D) MAD2 and CREST. Two asterisks indicate significant results, P¼ 0.0032. (E) HEC1 and CREST. (F) KNL-1 and CREST. On the right, magnified
areas and quantification of the fluorescence intensity of the protein of interest normalized to the fluorescence intensity of CREST staining are
shown. Graphs represent three independent experiments (error bars¼ s.d.). Scale bar, 10mm. (G) Western blot of whole-cell lysates from control and
Beclin-1 siRNA-treated cells. siRNA, small interfering RNA.
c
Beclin-1 contributes to outer kinetochore assembly
S. Fremont et alscientificreport
368 EMBO reports VOL 14 | NO 4 | 2013 &2013 EUROPEAN MOLECULAR BIOLOGY ORGANIZATION

MAD2 CREST
CREST
DAPI
DAPIMAD2
Merge
Merge
siRNA: Control Beclin-10
20
40
60
80
100
ZW10
CREST
CREST DAPI
DAPIZW10
Merge
Merge
0
20
40
60
80
100
siRNA: Control Beclin-1
CENP-F
CENP-E
ZW10
Beclin-1
MAD2CENP-F
CREST
CREST DAPI
DAPICENP-F
Merge
Merge***
siRNA: Control Beclin-10
20
40
60
80
100
CENP-E
CREST
CREST DAPI
DAPICENP-E
Merge
Merge
A G
B
C
D
E
F
siRNA: Control Beclin-10
20
40
60
80
100
**
***
**
KNL1
Zwint-1
HEC1
HEC1
CREST
CREST DAPI
DAPIHEC1
Merge
Merge
KNL1
CREST
CREST DAPI
DAPIKNL1
Merge
Merge
siRNA: Control Beclin-10
20
40
60
80
100
siRNA: Control Beclin-10
20
40
60
80
100
CE
NP
-E r
elat
ive
fluor
esce
nce
inte
nsity
(% o
f con
trol
)
CE
NP
-F r
elat
ive
fluor
esce
nce
inte
nsity
(% o
f con
trol
)
ZW
10 r
elat
ive
fluor
esce
nce
inte
nsity
(% o
f con
trol
)
MA
D2
rela
tive
fluor
esce
nce
inte
nsity
(% o
f con
trol
)
HE
C1
rela
tive
fluor
esce
nce
inte
nsity
(% o
f con
trol
)
KN
L1 r
elat
ive
fluor
esce
nce
inte
nsity
(% o
f con
trol
)
siB
eclin
-1
siC
ontr
ol
siC
ontr
olsi
Bec
lin-1
siC
ontr
olsi
Bec
lin-1
siC
ontr
olsi
Bec
lin-1
siC
ontr
olsi
Bec
lin-1
siC
ontr
olsi
Bec
lin-1
siC
ontr
olsi
Bec
lin-1
α-Tubulin
Beclin-1 contributes to outer kinetochore assembly
S. Fremont et al scientificreport
369&2013 EUROPEAN MOLECULAR BIOLOGY ORGANIZATION EMBO reports VOL 14 | NO 4 | 2013

HA
-GFP
HA
-Bec
lin-1
InputA
C
D
F
H
G
E
B
HA
-GFP
HA
-Bec
lin-1
HA-Beclin-1
HA-GFP
Zwint-1
Input
GS
T-Z
win
t-1
GST
GS
T-Z
win
t-1
IP αZwint-1
GS
T
His
6-B
eclin
-1
Coomassie bluestaining
α-Beclin-1
α-GST
His6-Beclin-1
GST-Zwint-1
GS
T-Z
win
t-1
GS
T
GS
T
His
6-B
eclin
-1
His6-Beclin-1bound
siRNA: Control Beclin-10
20
40
60
80
100Zwint-1
CREST
CREST DAPI
DAPIZwint-1
Merge
Merge
siC
ontr
olsi
Bec
lin-1
Zw
int-
1 re
lativ
eflu
ores
cenc
e in
tens
ity(%
of c
ontr
ol)
siZ
W10
Beclin-1
Beclin-1
Beclin-1
ZW10
ZW10
ZW10
DAPI
DAPI
DAPI
CREST
CREST
CREST
Beclin-1
ZW10
Beclin-1
ZW10
Beclin-1
ZW10
Beclin-1
CREST
Beclin-1
CREST
Beclin-1
CREST
siC
ontr
olsi
Bec
lin-1
AnaphaseMetaphasePrometaphaseInterphase
Merge
Col
d t
reat
men
t
Beclin-1 MergeDAPI
Beclin-1 DAPI Merge
α-Tubulin
α-Tubulin
α-Tubulin
Beclin-1
Beclin-1Nocodazole treatmentBeclin-1 Zwint-1Zwint-1
Zwint-1
Cherry-Beclin-1
Zwint-1
Cherry
Beclin-1 contributes to outer kinetochore assembly
S. Fremont et alscientificreport
370 EMBO reports VOL 14 | NO 4 | 2013 &2013 EUROPEAN MOLECULAR BIOLOGY ORGANIZATION
METHODSFor detailed protocols, see supplementary information online.Cell culture, transfections, siRNA and mammalian expressionvectors. SiRNA (10 nM) transfections were performed on HeLacells using Lipofectamine RNAiMAX (Invitrogen), according to thereverse transfection procedure described by the manufacturer.HeLa cells were transfected using the FUGENE-6 reagent (RocheDiagnostics) as described by the manufacturer. HeLa cellsconstitutively expressing the YFP-a-tubulin and the H2B-Cherryhistone were generated to monitor mitotic progression in living cells.Fluorescence microscopy. Immunofluorescence microscopy wasperformed on HeLa cells grown on coverslips and transfected withsiRNA when indicated. To block cells in prometaphase, cells weretreated for 3 h before fixation with 3 mg/ml nocodazole (Sigma-Aldrich). Depending on the antibodies used, cells were fixedeither with methanol at � 20 1C for 5 min or with 4% parafor-maldehyde (PFA) in PBS for 25 min. For Beclin-1 and MAD2stainings, cells were permeabilized in PBS/0.1% bovine seraalbumin/0.05% saponin (Sigma-Aldrich) before fixation with 4%PFA in PBS for 25 min. To test the stability of MT capture atkinetochores, before fixation, cells were incubated for 5 min at4 1C in cold PBS, to destabilize most non-kinetochore MT. Forimmunofluorescence with Zwint-1, CENP-F, CENP-E and ZW10antibodies, cells were pre-extracted for 2 min at 37 1C in PEM(100 mM K-PIPES, pH 6.8, 5 mM EGTA, 2 mM MgCl2)–0.5%triton, and fixed in PEM/0.1% triton/4% PFA for 25 min,as described [12].Flow cytometry analysis. Forty-eight hours after siRNA transfec-tion, cells were washed with PBS, harvested and fixed in 70%ethanol. After fixation, cells were washed in PBS and then stainedwith propidium iodide (Sigma-Aldrich) for 30 min at 371C in abuffer containing 20 mM HEPES, 160 mM NaCl, 1 mM EGTA,0.2 mg/ml RNAse A and 50 mg/ml propidium iodide.Immunoprecipitation assay and pull-down assays. Coimmuno-precipitations were performed by incubating indicated whole-cellextracts for 4 h at 4 1C with anti-Zwint-1 antibody coupled withprotein G sepharose (GE Healthcare). Pull-down experimentswere performed by incubating 400 ng of GST and GST-Zwint-1(Abnova) proteins, and fixed on glutathione-sepharose beads(GE Healthcare), with 500 ng of purified His6-Beclin-1 in the
interaction buffer (20 mM Tris HCl pH 8, 250 mM NaCl, 0.25%NP-40) for 2 h at 41C.Quantification of kinetochore-bound proteins. To quantify theamount of kinetochore-bound protein, the average pixel inten-sities from 10 kinetochores or more on three nocodazole-treatedcells were measured using Image J software and background pixelintensities subtracted.Statistical analysis. Statistical significance was analysed by pairedtwo-tailed Student’s t-test and expressed as a P value. The numberof analysed samples (n) is indicated. All experiments wereperformed as three independent experiments. When indicated,standard deviations are represented as scale bars on graphs.
Supplementary information is available at EMBO reports online(http://www.emboreports.org).
ACKNOWLEDGEMENTSWe thank S. Emiliani, F. Margottin-Goguet and C. Transy for helpfuldiscussions, P. Bourdoncle and B. Durel from the Imaging Facility ofCochin Institute for technical assistance, the Almouzni lab (Institut Curie,Paris) for the CREST autoantibody, the Malim lab for the expressionvector HA-GFP, and E. Segeral for the GST protein. S.F. was supported bythe Ministere Francais de l’enseignement superieur et de la Recherche,and Fondation pour la Recherche Medicale, A.G. by a fellowship fromSIDACTION. This work is funded by the ANR-07-JCJC-0102 programmeand by ANRS.
Author contributions: S.F., A.G., M.G. and K.J. conceived, designedand performed the experiments. R.E.K. conceived and designed someexperiments. C.B.T. conceived and designed the experiments, andsupervised the study. All authors analysed the data and contributed to thewriting of the manuscript, with major writing contributions fromA.G., R.E.K. and C.B.T.
CONFLICT OF INTERESTThe authors declare that they have no conflict of interest.
REFERENCES1. Yang Z, Klionsky DJ (2010) Mammalian autophagy: core
molecular machinery and signaling regulation. Curr Opin Cell Biol 22:124–131
2. Thoresen SB, Pedersen NM, Liestol K, Stenmark H (2010) Aphosphatidylinositol 3-kinase class III sub-complex containing VPS15,
Fig 5 | Beclin-1 interacts directly with Zwint-1 and localizes to the mitotic apparatus. (A) Immunoprecipitation of endogenous Zwint-1 in HeLa cell
extracts expressing HA-Beclin-1 or HA-GFP. Input is 3.5% of the immunoprecipitated material. (B) GST-Zwint-1 or GST-beads were used to pull down
recombinant purified His6-Beclin-1. (Left) Coomassie-blue-stained gel of the purified recombinant proteins (1 mg). (Right) A western blot of GST
proteins and His6-Beclin-1 in the input and bound fractions. His6-Beclin-1 in the input represents 4% of the amount used for the pull-down.
(C) Zwint-1 levels do not change in Beclin-1-depleted cells. Cells were treated with nocodazole before fixation. On the right, magnified individual
kinetochore pairs stained for Zwint-1 (red) and CREST (green), and quantification of Zwint-1 levels normalized to CREST signal from three
independent experiments (error bars¼ s.d.). (D) Beclin-1 is associated with both the centrosome and the mitotic spindle during mitosis. HeLa cells
were permeabilized before fixation and immunostained for Beclin-1 (green), a-tubulin (red) and DNA (DAPI, blue). (E) Beclin-1 is retained on the
k-fibres. HeLa cells were cooled on ice before permeabilization and fixation, and stained with anti-a-tubulin (red) and anti-Beclin-1 (green) antibodies.
(F) Beclin-1 forms discrete foci in the vicinity of the outer kinetochore in a microtubule-dependent manner. Untreated cells (left) and nocodazole-
treated cells (right) were pre-extracted and fixed before labelling with Beclin-1 (green) and Zwint-1 (red) antibodies. (G) The fluorescent-tagged
Cherry-Beclin-1 forms foci in the vicinity of the outer kinetochore. HeLa cells transfected with indicated constructs were pre-extracted and fixed before
labelling with Zwint-1 (green) antibody. Magnified areas are shown on the right. (H) Beclin-1 localization close to the kinetochore does not depend on
the ZW10 protein. Cells treated with Control, Beclin-1 and ZW10 siRNA were pre-extracted and fixed before labelling with Beclin-1 (green),
CREST (blue) and ZW10 (red) antibodies. DNA was visualized with DAPI. (C–H) Scale bar, 10 mm. DAPI, 40,6-diamidino-2-phenylindole; DNA,
deoxyribonucleic acid; GFP, green fluorescent protein; GST, glutathione S-transferase; HA, haemagglutinin.
b
Beclin-1 contributes to outer kinetochore assembly
S. Fremont et al scientificreport
371&2013 EUROPEAN MOLECULAR BIOLOGY ORGANIZATION EMBO reports VOL 14 | NO 4 | 2013
VPS34, Beclin 1, UVRAG and BIF-1 regulates cytokinesis anddegradative endocytic traffic. Exp Cell Res 316: 3368–3378
3. Sagona AP, Nezis IP, Pedersen NM, Liestol K, Poulton J, Rusten TE,Skotheim RI, Raiborg C, Stenmark H (2010) PtdIns(3)P controlscytokinesis through KIF13A-mediated recruitment of FYVE-CENT to themidbody. Nat Cell Biol 12: 362–371
4. He C, Levine B (2010) The Beclin 1 interactome. Curr Opin Cell Biol 22:140–149
5. Funderburk SF, Wang QJ, Yue Z (2010) The Beclin 1-VPS34complex–at the crossroads of autophagy and beyond. Trends Cell Biol20: 355–362
6. Zhong Y, Wang QJ, Li X, Yan Y, Backer JM, Chait BT, Heintz N,Yue Z (2009) Distinct regulation of autophagic activity by Atg14L andRubicon associated with Beclin 1-phosphatidylinositol-3-kinasecomplex. Nat Cell Biol 11: 468–476
7. Matsunaga K et al (2009) Two Beclin 1-binding proteins, Atg14L andRubicon, reciprocally regulate autophagy at different stages. Nat Cell Bio11: 385–396
8. Abrahamsen H, Stenmark H, Platta HW (2012) Ubiquitination andphosphorylation of Beclin 1 and its binding partners: tuning class IIIphosphatidylinositol 3-kinase activity and tumor suppression. FEBS Lett586: 1584–1591
9. Mathew R, Kongara S, Beaudoin B, Karp CM, Bray K, Degenhardt K,Chen G, Jin S, White E (2007) Autophagy suppresses tumor progressionby limiting chromosomal instability. Genes Dev 21: 1367–1381
10. Subramani S, Malhotra V (2013) Non-autophagic roles of autophagy-related proteins. EMBO Rep 14: 143–151
11. Nezi L, Musacchio A (2009) Sister chromatid tension and the spindleassembly checkpoint. Curr Opin Cell Biol 21: 785–795
12. Kops GJ, Kim Y, Weaver BA, Mao Y, McLeod I, Yates JR 3rd, Tagaya M,Cleveland DW (2005) ZW10 links mitotic checkpoint signaling to thestructural kinetochore. J Cell Biol 169: 49–60
13. Cheeseman IM, Desai A (2008) Molecular architecture of thekinetochore-microtubule interface. Nat Rev Mol Cell Biol 9: 33–46
14. Behrends C, Sowa ME, Gygi SP, Harper JW (2010) Network organizationof the human autophagy system. Nature 466: 68–76
15. Obuse C, Iwasaki O, Kiyomitsu T, Goshima G, Toyoda Y, Yanagida M(2004) A conserved Mis12 centromere complex is linked toheterochromatic HP1 and outer kinetochore protein Zwint-1. Nat CellBiol 6: 1135–1141
16. Starr DA, Saffery R, Li Z, Simpson AE, Choo KH, Yen TJ, Goldberg ML(2000) HZwint-1, a novel human kinetochore component that interactswith HZW10. J Cell Sci 113(Pt 11): 1939–1950
17. Lin YT, Chen Y, Wu G, Lee WH (2006) Hec1 sequentially recruits Zwint-1 and ZW10 to kinetochores for faithful chromosome segregation andspindle checkpoint control. Oncogene 25: 6901–6914
18. Cheeseman IM, Niessen S, Anderson S, Hyndman F, Yates JR 3rd,Oegema K, Desai A (2004) A conserved protein network controlsassembly of the outer kinetochore and its ability to sustain tension.Genes Dev 18: 2255–2268
19. Wang H et al (2004) Human Zwint-1 specifies localization of ZesteWhite 10 to kinetochores and is essential for mitotic checkpointsignaling. J Biol Chem 279: 54590–54598
20. Bomont P, Maddox P, Shah JV, Desai AB, Cleveland DW (2005) Unstablemicrotubule capture at kinetochores depleted of the centromere-associated protein CENP-F. EMBO J 24: 3927–3939
21. Zhu X, Mancini MA, Chang KH, Liu CY, Chen CF, Shan B, Jones D,Yang-Feng TL, Lee WH (1995) Characterization of a novel 350-kilodaltonnuclear phosphoprotein that is specifically involved in mitotic-phaseprogression. Mol Cel Biol 15: 5017–5029
22. Furuya T et al (2010) Negative regulation of Vps34 by Cdk mediatedphosphorylation. Mol Cell 38: 500–511
23. Joseph J, Liu ST, Jablonski SA, Yen TJ, Dasso M (2004) TheRanGAP1–RanBP2 complex is essential for microtubule-kinetochoreinteractions in vivo. Curr Biol: CB 14: 611–617
24. Salina D, Enarson P, Rattner JB, Burke B (2003) Nup358 integratesnuclear envelope breakdown with kinetochore assembly. J Cell Biol162: 991–1001
Beclin-1 contributes to outer kinetochore assembly
S. Fremont et alscientificreport
372 EMBO reports VOL 14 | NO 4 | 2013 &2013 EUROPEAN MOLECULAR BIOLOGY ORGANIZATION