Embed Size (px)
Citation preview
BE
CK
MA
NQ
uantitative Applications of C
apillary Electrophoresis in P
harmaceutical A
nalysisV
olume V
IBECKMAN
Beckman Instruments, Inc. • 2500 Harbor Boulevard, Box 3100 • Fullerton, California 92634-3100
Sales: 1-800-742-2345 • Service: 1-800-551-1150 • TWX: 910-592-1260 • Telex: 678413 • Fax: 1-800-643-4366
Worldwide Offices: Africa, Middle East, Eastern Europe (Switzerland) (22) 994 07 07. Australia (61) 02 816-5288. Austria (2243) 85656-0.
Canada (800) 387-6799. China (861) 5051241-2. France (33) 1 43 01 70 00. Germany (49) 89-38871. Hong Kong (852) 814 7431.
Italy (39) 2-953921. Japan 3-3221-5831. Mexico 525 575 5200, 525 575 3511. Netherlands 02979-85651. Poland 408822, 408833.
Singapore (65) 339 3633. South Africa (27) 11-805-2014/5. Spain (1) 358-0051. Sweden (8) 98-5320. Switzerland (22) 994 07 07.
Taiwan (886) 02 378-3456. U.K. (0494) 441181. U.S.A. 1-800-742-2345.
XXXXX $14.95 Printed in U.S.A. ©Copyright 1994 Beckman Instruments, Inc. BECKMAN
Introduction to Quantitative Applicationsof Capillary Electrophoresis in
Pharmaceutical Analysis

Introduction to Quantitative Applicationsof Capillary Electrophoresis in
Pharmaceutical Analysis
Kevin D. Altria and Manus M. Rogan
Pharmaceutical Analysis DivisionGlaxo Research and Development
Park Road, WareHertfordshire, England

iii
Table of Contents
About the Authors...................................................................................vAcknowledgment....................................................................................vFront Cover.............................................................................................vAcronyms Used.................................................................................... vii
1 Introduction......................................................................................1
2 Determination of Drug-Related Impurities.......................................22.1 Overview................................................................................22.2 Benefits of CE Methods for Related Impurity
Determinations.......................................................................32.3 Applications.........................................................................10
3 Main Component Assay.................................................................153.1 Overview..............................................................................153.2 Benefits of CE Methods for Drug Assay...............................163.3 Applications.........................................................................19
4 Chiral Separations..........................................................................244.1 Overview..............................................................................244.2 Benefits of CE Methods for Chiral Analysis.........................244.3 Applications.........................................................................29
5 Stoichiometric Determinations.......................................................335.1 Overview..............................................................................335.2 Benefits of CE Methods for Stoichiometric Determinations ..345.3 Applications.........................................................................34
6 Quantitative Procedures.................................................................396.1 Overview..............................................................................396.2 Impurity Determinations.......................................................406.3 Main Component Assay........................................................406.4 Chiral Analysis.....................................................................406.5 Stoichiometric Analysis........................................................41
iv
7 Method Validation Considerations..................................................417.1 Overview..............................................................................417.2 Accuracy..............................................................................417.3 Precision...............................................................................427.4 Reproducibility.....................................................................427.5 Linearity...............................................................................427.6 Robustness...........................................................................43
8 Future Developments.....................................................................458.1 Overview..............................................................................458.2 Detection..............................................................................478.3 Electrochromatography.........................................................48
9 Conclusions....................................................................................49
Practical Hints.......................................................................................50Electrolyte/Sample.........................................................................50Sensitivity......................................................................................50Quantitation...................................................................................51Capillary Care................................................................................51
References.............................................................................................52

v
About the Authors
Kevin Altria commenced his Ph.D. studies at the University of London in 1986studying various aspects of capillary electrophoresis. Highlights of his researchinclude fundamental studies concerning electroosmotic flow, the first report ofpharmaceutical analysis by CE, and the development of a novel radioactivitydetector. Kevin has since joined Glaxo Research and Development and iscurrently concentrating on developing applications of CE for pharmaceuticalanalysis. He has authored or co-authored more than 40 CE-related publicationsand has edited a book on CE methodology and applications which is currentlyin press with Humana Press.
Manus Rogan graduated from Dublin City University with a B.Sc. inAnalytical Science in 1989. Since then, he has been working as an AnalyticalChemist at Glaxo Research and Development. Manus is near completion ofpart-time Ph.D. studies concerning use of CE for pharmaceutical analysis atthe University of York. He has been a co-author on over 10 papers and chap-ters on CE and has a particular interest in the theoretical aspects of chiral CE.
The authors have previously written a primer on the theory and applica-tions of chiral capillary electrophoresis.
Acknowledgment
Thanks are extended to Mrs. Larraine Horwood of Glaxo Research and Devel-opment for careful typing and continued patience.
Front Cover
Separation of 11 basic drugs by CE using a low-pH electrolyte with UV detec-tion at 200 nm (Altria, 1993f).
vi
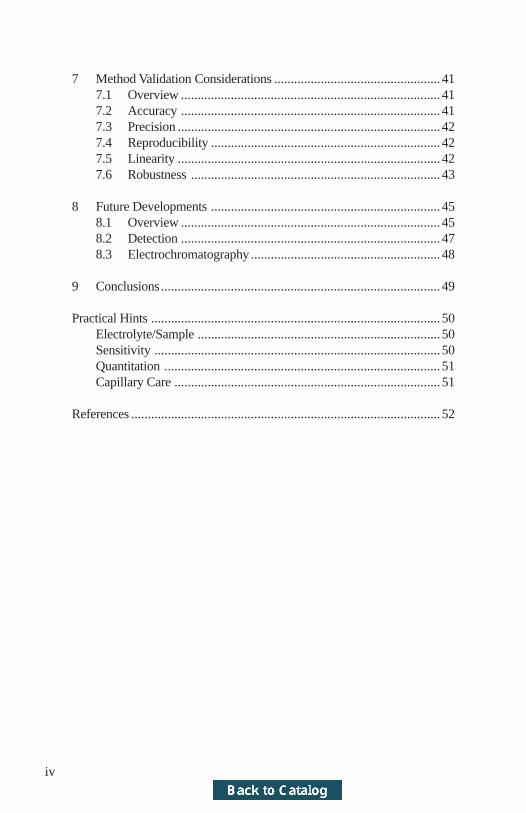
Other Beckman primers (Volumes I, II, III, IV, and V) oncapillary electrophoresis:
Title BeckmanPart Number
Introduction to Capillary Electrophoresis 360643
Introduction to Capillary Electrophoresisof Proteins and Peptides 266923
Micellar Electrokinetic Chromatography 266924
Introduction to the Theory and Applicationsof Chiral Capillary Electrophoresis 726388
Separation of Proteins and Peptides byCallipary Electrophoresis: Applicationto Analytical Biothechnology 727484
All trademarks and registered trademarks are the property of their respectiveowners.

vii
Acronyms Used
The following acronyms are used in this book.
CE capillary electrophoresisCIA capillary ion analysisDAD diode array detectorEDTA ethylene diamine tetra acetic acidEOF electroosmotic flowFSCE free-solution capillary electrophoresisGC gas chromatographyHPLC high-performance liquid chromatographyICP inductively coupled plasmaIEC ion-exchange chromatographyLIF laser-induced fluorescenceLOD limit of detectionLOQ limit of quantitationMECC micellar electrokinetic capillary chromatographyMS mass spectroscopyppb parts per billionppm parts per million (mg/L)RSD relative standard deviationr2 correlation coefficientSDS sodium dodecyl sulphateTLC thin-layer chromatography

1
1 IntroductionCapillary electrophoresis was popularized in the early 1980’s by Jorgensonand co-workers (Jorgenson and Lukacs, 1983) who demonstrated that excep-tional efficiencies could be obtained by performing electrophoresis in capillar-ies. Their early work on the electrophoretic separation of biomolecules spurreddevelopment of commercial instrumentation and the investigation of applica-tion areas where use of conventional electrophoresis was infrequent. One sucharea was that of pharmaceutical analysis where few applications of electro-phoresis were in routine use due to the cumbersome and semi-quantitativenature of this technique. However, the introduction of the capillary formatenables full quantitative and automated analysis to be conducted.
To ensure the safety and efficacy of the final marketed product, it is im-portant to characterize drug substance material and formulations. Full charac-terization involves the assessment of the drug material by both physical andchemical methods. The measurement of chemical properties such as purity,assay, chiral purity, inorganic ion content, and identity confirmation is rou-tinely performed by HPLC and other chromatographic techniques. Recently,capillary electrophoresis (CE) has been developed to perform these tests andshown to be a complementary and attractive alternative to the more establishedmethods.
The majority of drugs are either acidic and/or basic water-soluble com-pounds. The basis for separation in free solution CE (FSCE) relies upon anexploitation of differences between the analytes’ electrophoretic mobilities,which are related to the solutes’ charge and size. Consequently, the separationof many drugs is possible by FSCE. For example, an acidic drug may be ana-lyzed in its anionic form at high pH and basic drugs may be tested at low pH intheir cationic form. The front cover depicts the efficient separation of 11 basicdrugs using a low-pH electrolyte. Zwitterionic drugs (those containing bothacidic and basic groups) may be analyzed at either end of the pH range. Amixture of neutral drugs would be unresolved by FSCE. However, ionic,charged micelles can be incorporated into the electrolyte solution to add apartitioning element to the separation. This is the basic idea behind MECC(Terabe et al., 1984).
An important aspect of drug analysis involves the determination of drug-related impurities. This is generally performed by HPLC which has an estab-lished methodology and highly automated instrumentation available. It isimportant to ensure that a thorough and accurate impurity profile is generated.

2
This can be supplemented by cross-correlation of results obtained with thosefrom TLC or an alternative HPLC method. In all cases, the selectivity reliesupon a chromatographic interaction where co-elution or irreversible adsorptionmay occur. CE offers a completely different selectivity process and is, there-fore, truly a complementary and orthogonal technique to HPLC.
Given that an analytical method may be developed for long-term use andthus may be applied to several thousand samples, speed, simplicity, and auto-mation are key requirements. Both CE and HPLC can offer these facilities formany applications. Since the first application of CE to drug analysis in 1987(Altria and Simpson, 1987; Fujiwara and Honda, 1987), there have been over150 papers on this subject in the literature. This primer will cover aspects ofthe validation, application, and performance of CE methods in the analysis ofpharmaceuticals as reported in the literature.
A basic introduction to the theory and various CE separation modes of CEis covered in “Introduction to Capillary Electrophoresis.” Further primers givedetailed discussion on MECC and chiral separations. Review articles of phar-maceutical analysis (Altria 1993a; Rabel and Stobaugh, 1993) and chiral sepa-rations (Kuhn and Hoffstetter-Kuhn, 1992; Rogan et al., 1994) have recentlybeen published.
2 Determination of Drug-RelatedImpurities
2.1 OverviewThe determination of drug-related impurities is currently the principal role ofCE within pharmaceutical analysis and presents a challenge to both selectivityand sensitivity. The main component and structurally related impurities havesimilar chemical properties and thus make resolution difficult. However, anadvantage of CE over its chromatographic counterparts is that high separationefficiencies are achievable. The resulting peak sharpness often translates asmall degree of selectivity to acceptable resolution. A detection limit of 0.1%area/area is widely accepted as a minimum requirement for a related impuritiesdetermination method. This 0.1% level is possible by CE. For example, Figure1 (Swartz, 1991) shows determination of salicylamide-related impurities at0.1% area/area and below. HPLC can routinely decrease this level by up to anorder of magnitude (≈ 0.01%). Owing to the possibility that a formulation or

3
drug substance may contain a great number of low-level impurities, a methodcapable of resolving the required peaks within a defined analysis time isneeded. The high separation efficiencies offered by CE means that this is nowa real possibility.
5.85.65.45.25.04.8
Time (min)
4.64.44.24.04.4
4.8
5.2
5.4
mV
5.8
Figure 1. Salicylamide CE impurity profile. Electrolyte: 0.02 M sodium phos-phate, pH 11.0, 0.075 M SDS; capillary: 60 × 50 µm; voltage 20 kV; sampleconcentration: 0.1 mg/mL in water; injection: 10 s. Reproduced with permis-sion from Swartz, 1991.
When calculating impurity levels, it is necessary to divide the observedarea of each peak by its migration time (Altria, 1993b). This normalization isnecessary since faster-migrating peaks move through the detector at a greaterspeed than their slower counterparts. Therefore, faster-moving peaks havesmaller peak widths and correspondingly smaller peak areas. The sum of these“normalized peak areas” is used to calculate impurities as % area/area. Whenimpurity determinations are to be expressed as % w/w through the use of exter-nal standards, this normalization process is not required, providing the preci-sion of migration time is acceptable.
2.2 Benefits of CE Methods for Related ImpurityDeterminations
When adopting a CE method for determination of drug related impurities,possible features include complementary data to HPLC, low wavelength detec-
4
tion, speed, and simplicity. Other facilities include the ability to carry out on-line spiking experiments and the use of UV diode array detectors.
2.2.1 Complementary Data to HPLC
The data generated on impurity profiling is often compared to that obtained bychromatographic methods (typically HPLC). The principles of separation inCE are entirely different to HPLC and, therefore, a good agreement betweenthe two techniques strongly supports the integrity of the data. This techniquecombination is now established in many laboratories and has become a suitablereplacement for the conventional use of TLC and HPLC in combination. Apartfrom routine investigations, this combined use is of particular importanceduring method validation.
The differences in selectivity between CE and HPLC can result in discrep-ancies in results with one technique showing an underestimation in impuritylevels. This occurrence signifies that further method optimization is required.Critical events in the development of a formulation such as synthetic route orprocess changes or at key drug stability timepoints are times when this mayoccur. Literature examples include additional tetracycline (Zhang et al., 1992)and domperidone impurities (Pluym et al., 1992) resolved by CE. Figure 2shows an impurity profile for domperidone in which peaks 1 and 2 co-elutedusing both HPLC and TLC.

5
O O
N-CH2-CH2-CH2-NH-N N N-H
Cl
domperidone R 33812
b
c
a
4 53
21
0 17Time (min)
Figure 2. CE separation of Domperidone (R33812) and major known impuri-ties. (a) Batch G1A041; (b) 0.1% reference mixture; (c) 1% reference mixture.Peak numbers: 1 = R29676, 2 = R45771, 3 = domperidone R33812,4 = R48557, 5 = R52211. Separation conditions: citrate-phosphate, pH 4,+25kV, 30°C, 250 nm, 50 µm × 72 cm. Reproduced with permission fromPluym et al., 1992.
2.2.2 Low Wavelength Detection
Aqueous-based electrolytes (which have low UV absorbance coefficients) areoften employed in CE, allowing detection wavelengths such as 200 nm to beroutinely employed. Many impurities or small intermediates have poor chro-mophores making their quantitation at traditional HPLC wavelengths difficultor impossible. This may be of particular importance for degradative processeswhere reactions may lead to the loss of the functionality providing the chro-mophore.
Alternatively, the use of low UV wavelengths may compensate for theinherent poor sensitivity in CE. For example (Altria, 1993c), when operating at

6
200 nm there is a ten-fold increase in signal for salbutamol and its impuritiescompared with 276 nm which is the HPLC wavelength.
2.2.3 Speed
Use of short capillaries coupled with high voltages can allow extremely shortanalysis times to be attained. For example, Figure 3a (Altria, 1993d) shows theseparation of fluparoxan impurities within two minutes using a 27-cm capil-lary. Figure 3b shows the same separation using a 57-cm capillary. Althoughsome degree of resolution is sacrificed, a good indication of the purity of thetest substance is rapidly obtained.
12.00
11.00
10.00
9.00
8.00
7.00
6.00
5.00 6.00 7.00 8.00 9.00 10.00
18.00
16.00
14.00
12.00
10.00
8.00
1.40 1.60 1.80 2.00
a
Migration Time (min)
UV
Abs
orba
nce
UV
Abs
orba
nce
Migration Time (min)
b
(V)
(V)
Figure 3. High-speed separation of fluparoxan and related impurities.Conditions: 50 mM borax, pH 2.2, with conc H3PO4, sample concentration0.5 mg/mL in water, 214 nm, 10 s pressure injection, 10 kV.Peak V = fluparoxan. Figure 3a: 27-cm capillary. Figure 3b: 57-cm capillary.Reproduced with permission from Altria, 1993d.

7
2.2.4 Simplicity
The majority of methods employed involve use of aqueous-based electrolytesand uncoated fused-silica capillaries. This ensures that the methods are simpleto operate and relatively easy to transfer between laboratories.
2.2.5 On-Line Spiking
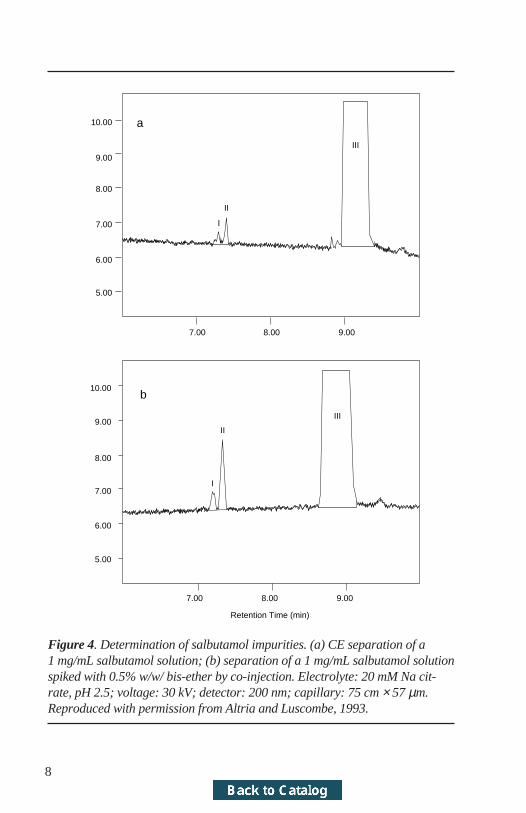
For a complex impurity separation, relative migration times are not alwayssufficient for making a positive identification of a peak. Confirmation of peakidentity can be achieved (Altria and Luscombe, 1993) by on-line spiking witha solution of the impurity. This can be programmed into the separationmethod. Figure 4a shows the separation of a salbutamol sample solution whichalso contains two dimeric impurities. Figure 4b shows the separation obtainedfrom a 5-second injection of the salbutamol sample solution followed immedi-ately by a 5-second injection of a solution of the impurity of interest. Follow-ing both injections, the voltage was applied and the separation given in Figure4b was produced. The impurity identity is clearly confirmed and no loss inresolution is observed from this dual-injection procedure.
8
10.00
9.00
8.00
7.00
6.00
5.00
10.00
9.00
8.00
7.00
6.00
5.00
7.00 8.00 9.00
7.00 8.00 9.00
Retention Time (min)
I
II
III
I
II
III
a
b
Figure 4. Determination of salbutamol impurities. (a) CE separation of a1 mg/mL salbutamol solution; (b) separation of a 1 mg/mL salbutamol solutionspiked with 0.5% w/w/ bis-ether by co-injection. Electrolyte: 20 mM Na cit-rate, pH 2.5; voltage: 30 kV; detector: 200 nm; capillary: 75 cm × 57 µm.Reproduced with permission from Altria and Luscombe, 1993.

9
2.2.6 UV Diode Array Detection
The recent advent of UV diode array detector (DAD) technology greatly as-sists in method development and peak assignment confirmation. Figure 5shows the use of this detector to measure the spectrum of a 0.1% impurity. Inconjunction with the on-line spiking procedure discussed previously, this givesadded confidence in peak assignments.
Figure 5. Spectra of an 0.1% area/area impurity. Reproduced with permissionfrom Altria, 1994 (unpublished results).
The principal disadvantages of the use of CE for determining relatedimpurities are the possible requirements for higher sample concentrations.When operating HPLC and CE at the same wavelength, it may be necessary touse two to five times more concentrated samples for CE to obtain an equiva-lent limit of detection. This may represent problems for poorly soluble drugs.

10
Due to the small sample volumes employed in CE, the possibility of con-ducting micropreparative scale separations are very limited. However a num-ber of reports have been published in the literature (Camilleri et al., 1991;Altria and Dave, 1993).
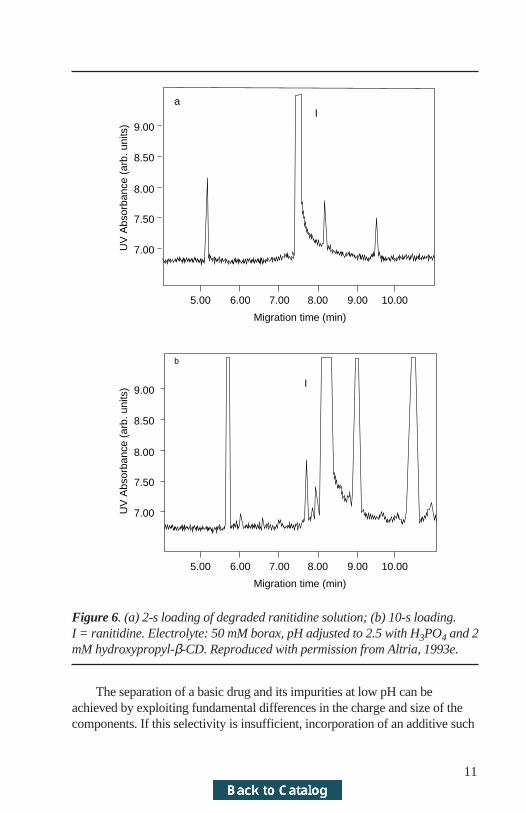
2.3 ApplicationsA number of applications have been reported, many at the 0.1% area/areadetection level. Figure 6 shows the impurity profile of ranitidine, using a two-second and ten-second injection. In this example (Altria, 1993e), a good corre-lation between CE and HPLC was obtained for the total number and level ofimpurities. Smaller impurities were quantified at the 0.1% level. Use of ahigher sample loading can extend this detection limit even lower. If a shortinjection time (i.e., one second) can be employed to produce a separation withthe main peak on-scale, a longer injection time (i.e., 10 seconds) will produce aseparation with the main peak off-scale but with considerably enhanced sensi-tivity for the minor components. The peak area of the off-scale peak is thencalculated by multiplying the peak area of the on-scale injection by the ratio ofthe injection times (i.e., 10:1). Impurities are quantified as % area/area of thecalculated area for the off-scale peak. This is demonstrated (Altria 1993e) inpractice for fluparoxan impurities where the LOD for the off-scale separationis 0.01%.
11
a
9.00
8.50
8.00
7.50
7.00
5.00 6.00 7.00 8.00 9.00 10.00
Migration time (min)
UV
Abs
orba
nce
(arb
. uni
ts)
9.00
8.50
8.00
7.50
7.00UV
Abs
orba
nce
(arb
. uni
ts)
5.00 6.00 7.00 8.00 9.00 10.00
Migration time (min)
b
I
I
Figure 6. (a) 2-s loading of degraded ranitidine solution; (b) 10-s loading.I = ranitidine. Electrolyte: 50 mM borax, pH adjusted to 2.5 with H3PO4 and 2mM hydroxypropyl-β-CD. Reproduced with permission from Altria, 1993e.
The separation of a basic drug and its impurities at low pH can beachieved by exploiting fundamental differences in the charge and size of thecomponents. If this selectivity is insufficient, incorporation of an additive such

12
as cyclodextrin (Ng et al., 1992; Altria, 1993d) or an ion-pair reagent (Nishiet al., 1990a) into the electrolyte may achieve the desired effect. Componentswill selectively interact with these additives, resulting in overall changes inseparation selectivity. Figure 7 shows the separation of ranitidine and relatedimpurities employing a low-pH electrolyte containing cyclodextrin. A 27-cmcapillary was utilized and, therefore, a rapid analysis was achieved.
30.00
25.00
20.00
15.00
10.00
0.60 0.70 0.80 0.90 1.00 1.10 1.20
UV
Abs
orba
nce
Retention Time (min)
(IV)
Figure 7. HSCE separation of degraded ranitidine syrup sample. Separationconditions: 25 mM borax with 2 mM dimethyl-β-cyclodextrin, pH 2.4, withconc. H3PO4; sample concentration, 15 mg/mL; 230 nm; 2-s pressure injec-tion; 15 kV. Peak IV = ranitidine. Reproduced with permission from Altria,1993d.
The complementary nature of HPLC and CE was highlighted in a study(Altria, 1993c) of the determination of dimeric salbutamol impurities. Theserelatively large impurities were strongly adsorbed onto the HPLC column andtherefore had lengthy retention times. However, in CE the dimeric impuritieshad a charge Z = +2 and therefore migrated before the salbutamol (Z = +1).Drug substance batches were tested by CE and HPLC using external standardsof the impurities for quantitation. Table 1 shows the good correlation betweenthe two techniques.

13
Table 1. Levels of Salbutamol Impurities inDrug Substance Determined by CE and HPLC
Good cross-correlation was obtained between the two techniques.
Bis Ether Dimer Batch (%w/w) (%w/w)
CE HPLC CE HPLC
1 0.14 0.16 0.08 0.080.14 0.16 0.08 0.08
2 0.10 0.11 0.06 0.070.10 0.11 0.07 0.06
3 0.20 0.19 0.13 0.110.20 0.19 0.14 0.10
4 0.12 0.13 0.07 0.060.15 0.14 0.08 0.05
5 0.13 0.14 0.08 0.060.12 0.13 0.07 0.05
6 0.31 0.28 0.18 0.170.31 0.26 0.19 0.15
7 0.07 0.09 0.05 0.040.08 0.10 0.06 0.03
8 0.38 0.38 0.20 0.180.44 0.38 0.22 0.19
9 0.37 0.38 0.19 0.180.37 0.35 0.19 0.19
10 0.75 0.66 0.39 0.330.77 0.67 0.40 0.35
(Altria, 1993c)
A worker from the FDA demonstrated (Flurer and Wolnik, 1994) thathigher levels of gentamycin impurities were detected using CE compared withthose achieved by the USP-registered HPLC method. Gentamycin has a poorchromophore and, therefore, needs to be derivatized prior to HPLC analysis.However, not all impurities appear to be derivatized to an equal extent. CEallowed the direct analysis of gentamycin and impurities with low UV wave-length detection.

14
The time-dependent degradation of an impurity of ranitidine was moni-tored by CE (Altria and Connolly 1993). Sample solution was reinjected sev-eral times over the course of 9.25 hours. After this storage, less than 2% of theoriginal substance remained. The initial sample solution was analyzed by bothCE and HPLC (8.2 and 8.7% area/area impurity content, respectively).
A stability-indicating method for enalapril has been reported (Qin et al.,1992) which gave detection limits of 0.2% for the monitored impurities.
Impurities have been determined in a water-insoluble quinolone antibiotic(Altria and Chanter, 1993). The compound was only soluble at pH extremes ofless than 2 and greater than 10. The sample was dissolved in NaOH solutionand analyzed with a pH-1.5 electrolyte. A detection limit of 0.1% was demon-strated during validation. Linearity was measured in two exercises (1 to 150%and 20 to 150% of target concentration); correlation coefficients of 0.9990 and0.9997 were obtained, respectively. A single sample was injected 10 times andprecision values of 0.4 and 0.6% RSD were obtained for migration time andpeak area, respectively.
Resolution of acidic or neutral drugs and impurities requires operation athigh pH and possibly the addition of a surfactant (SDS). Salicylamide impuri-ties at levels below 0.1% area/area have been shown (Swartz, 1991) usingSDS-based separation. Repeated analysis produced an RSD of 9.3% of thearea of a peak relating to an impurity spiked at the 0.1% level.
Nishi and Terabe (1990) showed use of MECC to determine impuritylevels in dilitazem drug substance. They reported detection limits of 0.1%.
Separation and quantitation of tetracycline impurities were achieved(Zhang et al., 1992) by on-capillary derivatization with EDTA. The anioniccomplexes were resolved and directly quantified. No performance data wasshown.
Levels of domperidone impurities were quantified by TLC, HPLC, andCE in drug substances (Pluym et al., 1992). Table 2 shows the results fromHPLC and CE for selected impurities determined in three drug substancebatches. Good agreement between the three techniques was obtained for totalimpurity levels. However, CE resolved two additional components which co-eluted in HPLC and TLC determinations.

15
Table 2. Levels of Domperidone Impurities in Drug Substance Determinedby CE and HPLC
CE resolved an additional unknown impurity.
Batch R45571 R48557 Unknown No. Content Content Impurity
CE HPLC CE HPLC CE HPLC
1 0.24 0.26 0.15 0.35 0.17 -2 0.22 0.23 0.15 0.34 0.24 -3 0.26 0.27 0.15 0.30 0.18 -
(Pluym et al., 1992)
3 Main Component Assay
3.1 OverviewThis is an important application area in drug analysis. Several reports haveappeared concerning the successful correlation of CE and HPLC assay resultsindicating that CE produces comparable results. The major drawback to CEbeing more widely adopted in this area is the perceived lack of precision sug-gested in early papers (5 to 10% RSD). However, it should be recognized thatthis data was typically generated on homemade apparatus or using instrumen-tation which has subsequently been developed considerably further. ExistingHPLC instrumentation can routinely achieve <1% RSD. The newly introducedcommercial CE equipment can approach this level of precision (Watzig andDette, 1993).
The major source of imprecision remaining when using commercial in-strumentation is injection volume variability. Reproducible nanoliter samplevolumes presents a formidable engineering challenge. Use of an internal stan-dard will reduce this effect (Dose and Guiochon, 1991).
Injection precision is also related (Ryder, 1992) to sample concentration,being worse at low sample concentrations. This is due to increased variancecontributions from factors such as integration errors and solute adsorption onto
16
the capillary surface. It is suggested, therefore, that a high sample concentra-tion and injection volume should be employed. This has the effect of reducingseparation efficiencies but improving precision. This use of high concentra-tions also allows the simultaneous determination of related impurities.
The volume of sample solution injected onto the capillary is related to thesample solution viscosity (Watzig and Dette, 1993). This does not represent aproblem when analyzing drug substances since equivalent sample weights aredissolved in an identical matrix. Tablet excipients such as cellulose, starch, orcyclodextrins can considerably increase solution viscosity and, therefore, lowerinjection volumes and potency for tablet assay solutions. This would be high-lighted by recovery experiments from tablet excipient mixtures. Employmentof an internal standard will alleviate this problem.
3.2 Benefits of CE for Drug AssayThe features of adopting a CE method for main peak assay include generationof data complementary to HPLC, possible reductions in sample preparation,reduced operating costs, and simplicity.
3.2.1 Complementary Data to HPLC
As with related impurities determinations, CE can be used to confirm assaydata generated by HPLC. Assay of identical samples by both CE and HPLCcan play an important part of method validation or result confirmation foreither technique. Several reports (Ackermans et al., 1992a; Altria and Filbey,1993; Pluym et al., 1992; Tsai et al., 1992) have shown equivalence betweenassay results obtained by HPLC and CE for a range of formulations. Theseresults are discussed later in section 3.3, “Applications.”
3.2.2 Sample Pretreatment Reductions
Many formulations contain components which are strongly retained and mayunduly affect the chromatographic performance of HPLC columns. Thereforeit is often necessary to pretreat sample solutions prior to HPLC analysis. Typi-cal procedures include solid phase extraction, filtration, and centrifugation.Use of guard columns can reduce this necessity.
However, in the CE analysis of a formulation containing a basic drug atlow pH, the majority of excipients, being neutral, will not migrate. These ex-cipients will remain at the injection end of the capillary and will be removed

17
during a rinse step. For example, direct injection of diluted syrup samples waspossible, minimizing sample pretreatment (Altria and Rogan, 1990).
Components with poor chromophores are generally not suitable for directanalysis by HPLC without sample derivatization. However, the use of low UVwavelengths or indirect detection in CE can overcome this difficulty. Seepage 13 for an example involving the antibiotic gentamycin. Severalaminoglycoside antibiotics including neomycin, streptomycin, and sisomycinwere separated (Ackermans et al., 1992b) by CE (Figure 8).
0.001
-0.000
-0.001
-0.002
-0.003
-0.0040 5 10 15
EOF
12
34
5
6
Time (min)
Abs
orba
nce
(AU
)
Figure 8. Electropherogram for the separation of (1) dihydrostreptomycin, (2)lividomycin, (3) amigacin, (4) kanamycin, (5) tobramycin, and (6) sisomycin(all 1.0 mg/mL) in the anionic mode with the reversed EOF applying a back-ground electrolyte of 0.1 M imidazole acetate at pH 5.0 containing the additiveFC 135 (50 µl/mL). Capillary length, 67 cm; applied voltage, 12.5 kV; pres-sure injection time, 2 s; UV detection wavelength, 214 nm .Reproduced withpermission from Ackermans et al., 1992b.
3.2.3 Operating Costs
In CE, consumable expense is relatively low. Typical methods employ aque-ous electrolyte solutions with 10 to 20 mL being a common daily requirement.Costs are minimal when compared to HPLC solvent purchase and disposal.Uncoated capillaries are generally employed which are a fraction of the cost ofa HPLC column.

18
3.2.4 Simplicity
Often a single set of operating parameters can be applied to a wide variety ofdrugs. Figure 9 shows the separation (Chee and Wan, 1993) of 17 basic drugsat a low pH. An additional 11 basic drugs are resolved (Altria, 1993f) usingsimilar conditions (see front cover for separation).
4 5 6 7 8 9 10 11
4
6
8
10
12
14
Time (min)
1
2
3
4
5
6
78
9
10
11
12
13
14
15
i
16
17
Figure 9. Electropherograms of a mixture of 17 basic drugs.(1) methapyrilene, (2) brompheniramine, (3) amphetamine, (4) methamphet-amine, (5) procaine, (6) tetrahydrozoline, (7) phenmetrazine, (8) butacaine, (9)medazepam, (10) lidocaine, (11) codeine, (12) acepromazine, (13) meclizine,(14) diazepam, (15) doxapram, (16) benzocaine, (17) methaqualone. Separa-tion conditions: 0.05 M sodium dihydrogenphosphate-phosphoric acid, pH2.35; capillary: 60 cm × 75 µm; injection: 10 s; hydrostatic loading; 22 kV;detection: 214 nm. Peak i is an artifact of benzocaine (peak 16). Reproducedwith permission from Chee and Wan, 1993.
Use of an MECC method to quantify seven ingredients of theophyllinetablets (and two possible internal standards) has been reported (Dang et al.,1993). Agreement between label claim and MECC results was demonstratedfor several components simultaneously.

19
A pH-7.0 electrolyte was shown to resolve 16 common sulphonamides(Ackermans et al., 1992c). Figure 10 shows the separation with an analysistime of 32 minutes. The method was applied to the testing of sulphonamidelevels in pork meat.
Abs
orba
nce
(arb
. uni
ts)
Time (min)
0 8 16 24 32
14
14
5 6
13
7 10
12 1116
2
15
Figure 10. Electropherogram of the separation of 16 sulphonamides(0.1 mg/mL) in the Beckman standard capillary and detection 50 cm, pressureinjection time 2 s (39 nL), applied voltage 10 kV of standard mixture electro-lyte 0.02 M imidazole acetate at pH 7. Reproduced with permission from Ack-ermans et al., 1992c.
3.3 ApplicationsMany reports have appeared and have been reviewed (Rabel and Stobaugh,1993; Altria, 1993g) on the use of CE for quantitative analysis of drug formu-lations. CE has been applied to the testing of a wide variety of formulationsincluding tablets, solutions for injection, infusion solutions, syrups, eardrops,creams, and rotacaps. The majority of reports have demonstrated equivalencebetween CE, HPLC, and/or label claim for the formulation.
Some noteworthy examples include the determination of threebronchodilators (fenoterol, salbutamol and terbutaline) in six different dosageforms (Ackermans, et al., 1992a). Comparisons were made between the CEdata, HPLC, isotachophoresis (an alternative electrokinetic separation tech-

20
nique), and label claim and all results obtained were deemed to be satisfactory.Correlation coefficients of better than 0.999 were reported between HPLC andCE results. Acceptable performance of the CE methods was also reported forlinearity (R = < 0.999) and precision for migration times and peak areas rangedbetween 0.3 to 2.2% RSD.
MECC was used (Nishi and Terabe, 1990) to test paracetamol, caffeineand ethenzamide content in tablets from two manufacturers. The results ob-tained were between 99 to 102% of the label content with precision of 1.0 to2.3% RSD for peak area and 0.5 to 0.9% RSD for migration time. An internalstandard was employed to achieve this precision.
In general, CE is not the first technique of choice when faced with theneed to separate non-water-soluble compounds due to problems with on-capil-lary precipitation. In some cases, MECC conditions can be appropriate. Forexample, the separation of benzothiazepines and corticosteroids has been re-ported (Nishi et al., 1990b). Dilitazem content in tablets by MECC was foundto be within 99 to 102% of label claim with area precision of 2.2% RSD. Inthis work, methanolic solutions of the samples (e.g., as a cream formulation)and standards were employed and injected directly on capillary.
Ackermans et al. (1992b) quantified various aminogylcoside antibioticsusing indirect UV detection. They reported correlation coefficients of < 0.9995in the range 0.1 to 1.0 mg/mL.
Alendronate levels in formulations were determined by CE. Separationand detection was achieved by virtue of on-capillary complexation withCa2+ ions in the running buffer (Tsai et al., 1992). HPLC, involving a chemicalderivatization, was also employed. An average recovery of 100.7% was ob-tained by CE in the range of 80 to 120% of target concentration. Equivalentassay results were obtained by both techniques. Ten tablets were analyzed byboth HPLC and CE to produce average assay results of 2.47 and 2.45 mg/tablet, respectively, with precision data of 0.8 and 0.7% RSD, respectively.However, the sample analysis took 8 minutes using CE, whereas HPLC re-quired 4 hours.
The content uniformity of enalapril-containing tablets has been assessedby a stability-indicating CE method (Qin et al., 1992). Detection limits of< 0.2% were reported with good precision (0.6% RSD). Detector linearity overthe range 50 to 150% of target concentration was shown (R2 = 0.999).

21
Ackermans et al. (1991a) determined levels of water-insoluble dapsonein tablets using methanol as the sample-dissolving solvent and fenbendazole asan internal standard. Average assays of 105.2 mg/tablet were obtained for a100 mg/tablet (no indication was available of possible tablet content overagevalues). Correlation coefficients of 0.999 were obtained for detector linearityin the range 10 to 100% of target concentration.
Various analgesics have been determined by MECC (Fujiwara andHonda, 1987). Recoveries of 98.7 to 101.0% were reported from excipients.Precision data for peak area ratios was shown to be 0.8 to 1.8% RSD. Assay oftablets gave precision data for drug content ranging from 0.9 to 1.4% RSD.The results obtained were in good agreement (99.3 to 100.6%) with the labelclaim for tablet content.
Levels of the anti-migraine agent sumatriptan in injection solutions weredetermined by CE and HPLC (Altria and Filbey, 1993). An internal standardwas employed to provide improved precision. Results generated by the twotechniques were in good agreement (Table 3). Detector linearity in the range of5 to 150% of target concentration was 0.9993. Peak area ratio data was 0.1 to0.8% and 0.5 to 0.7% RSD for sample and standard solutions, respectively.Inter-day repeatability gave assay data repeatability within 1%. A range ofsynthetic and degradative impurities was simultaneously separated and detec-tion limits of <0.1% were possible.
Table 3. Sumatriptan Contents in Injection Solutions asDetermined by CE and HPLC
Good agreement was obtained between the two techniques.
SampleSumatriptan content
(mg/mL)
CE HPLC
Batch 2 Sample 1 11.5, 11.6 11.6, 11.6Batch 2 Sample 2 11.6, 11.6 11.7, 11.7
Batch 3 Sample 1 11.7, 11.8 11.8, 11.8
Batch 3 Sample 2 11.6, 11.6 11.7, 11.7Batch 4 Sample 1 11.7, 11.8 11.8, 11.8
Batch 4 Sample 2 11.7, 11.6 11.7, 11.7
(Altria and Filbey 1993)

22
An inter-company collaboration program has been established to investi-gate the transfer and application of CE methods. Seven independent pharma-ceutical companies are involved in this study. One exercise involved thequantitative analysis of the paracetamol content in a commercial capsule for-mulation containing both paracetamol and caffeine. Using an internal standardand an SDS-based MECC method, all seven participating companies were able(Altria, 1994a) to repeat the separation. Figure 11 gives three representativeelectropherograms showing the repeatability of the separation. All companiesreported CE assay values equivalent to the HPLC data and the label claim(298.3, 302.5, and 300 mg/capsule, respectively). Relative migration precisiondata ranged between 0.3 to 0.8% RSD. The average precision data for thecalibration response factor was 1.5% RSD, while the assay results gave anRSD of 1.0% for 56 individual determinations.

23
0.020
0.010
0.000
-0.0050.00 4.00 8.00 12.00 16.00 20.00
Cha
nnel
A: A
bsor
banc
e
Time
Abs
orba
nce
(214
nm
)
0.030
0.020
0.010
0.000
0.00 5.00 10.00 15.00 20.00
11.6
4
13.9
3
17.6
3
5.0 10.0 15.0 20.0Time (min)
-1.00
100.00
UV
Abs
orba
nce
(arb
itrar
y sc
ale)
1
2
3
Figure 11. Separation of (1) paracetamol, (2) caffeine, and (3) 4-hydroxy-acetophenone (internal standard) by MECC. Instrument-specific settings:(a) ABI HT, (b) Beckman P/ACE, (c) Spectra Physics. Conditions: electrolyte,40 mM disodium tetraborate, 125 mM sodium lauryl sulphate; detection,210 or 214 nm; capillary, fused silica, 72 cm × 50 µm (a, c) 57 × 50 µm (b);temperature, 40°C. Reproduced with permission from Altria et al., 1994b.
b
a
c

24
A fully validated quality control method for hydrochlorothiazide andchlorothiazide drug substances has been reported (Thomas et al., 1994). TheMECC method also allowed the quantitation of a selection of synthetic impuri-ties at the 0.1% level. Injection precision of < 1% RSD was obtained withoutan internal standard. Careful control of rinse cycles and buffer replenishmentwere necessary to achieve this performance. The method was shown to con-form to USP validation guidelines. Validation included measurements of preci-sion, repeatability between analysts, capillaries and instruments. Othermeasurements included robustness testing and linearity of detector response(R2 = 0.995 to 0.999). Repeated analysis of various drug substance batches bydifferent analysts showed a little variability between assay values.
4 Chiral Separations
4.1 OverviewThis is an important application of CE in drug analysis as CE can offer distinctadvantages over alternative techniques. Several approaches to achieving chiralseparations by CE have been reviewed (Kuhn and Hoffstetter-Kuhn, 1992;Rogan et al., 1994). These include the use of chirally selective cyclodextrins,micelles, proteins, and crown ethers. The separation principles and theory aredescribed in depth in a previous primer.
4.2 Benefits of CE Methods for Chiral AnalysisChiral pharmaceuticals are generally synthesized as racemates or single enanti-omers. Analysis of a single enantiomeric form requires determination of levelsof the undesired enantiomer at less than 1% or even 0.1% in certain circum-stances. Quantitation at these levels presents a considerable challenge to cur-rent techniques since both appropriate sensitivity and selectivity are required.In fact, due to the poor peak efficiency and subsequent quantitative difficultiesin this type of HPLC, chiral analysis by CE is one area where CE typicallymatches, if not outperforms, HPLC.
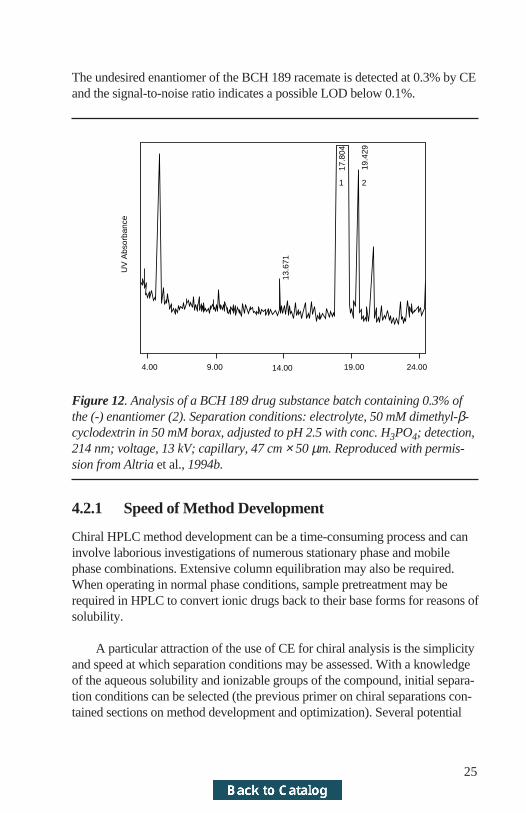
When compared to HPLC, CE has several attractive features for chiralanalysis. These include the potential for speed of method development andanalysis, robustness, simplicity, and cost. An example of the type of perfor-mance achievable by CE is shown (Altria et al., 1994c) in Figure 12.
25
The undesired enantiomer of the BCH 189 racemate is detected at 0.3% by CEand the signal-to-noise ratio indicates a possible LOD below 0.1%.
4.00 9.00 14.00 19.00 24.00
13.6
71
19.4
29
17.8
04
1 2
UV
Abs
orba
nce
Figure 12. Analysis of a BCH 189 drug substance batch containing 0.3% ofthe (-) enantiomer (2). Separation conditions: electrolyte, 50 mM dimethyl-β-cyclodextrin in 50 mM borax, adjusted to pH 2.5 with conc. H3PO4; detection,214 nm; voltage, 13 kV; capillary, 47 cm × 50 µm. Reproduced with permis-sion from Altria et al., 1994b.
4.2.1 Speed of Method Development
Chiral HPLC method development can be a time-consuming process and caninvolve laborious investigations of numerous stationary phase and mobilephase combinations. Extensive column equilibration may also be required.When operating in normal phase conditions, sample pretreatment may berequired in HPLC to convert ionic drugs back to their base forms for reasons ofsolubility.
A particular attraction of the use of CE for chiral analysis is the simplicityand speed at which separation conditions may be assessed. With a knowledgeof the aqueous solubility and ionizable groups of the compound, initial separa-tion conditions can be selected (the previous primer on chiral separations con-tained sections on method development and optimization). Several potential

26
electrolyte compositions can be assessed in an overnight sequence and themost appropriate optimized further.
4.2.2 Speed of Analysis
Short analysis times are possible when operating with short capillaries andcertain electrolyte compositions. Figure 13 (Sepaniak et al., 1992) shows theresolution of phenylalanine enantiomers within 90 seconds. The enantiomersof the bronchodilator picumeterol have been resolved (Altria, 1993f) in 2.5minutes using a 27-cm capillary.
Retention Time (sec) Retention Time (sec)
30 120 30 60 90
Figure 13. (a) Separation of DNS phenylalanine enantiomers from the compo-nents in a commercial formulation (35 kV applied). (b) Rapid separation ofDNS phenylalanine (25 kV). Conditions: electrolyte, 0.01 m disodium phos-phate, 0.006 M disodium borate (pH 9); detection, laser-induced fluorescence;capillary, 50 cm × 25 µm. Reproduced with permission from Sepaniak et al.,1992.
a b

27
4.2.3 Robustness
Chiral HPLC is flexible in terms of the number of stationary phases and mo-bile phase additives that can be employed (Allenmark, 1988). However, theruggedness of these methods can be questionable, especially when sensitiveprotein phases are employed.
In most reported circumstances, chiral separations in CE have beenachieved using untreated fused-silica capillaries which are simple and repro-ducible. The robustness of chiral CE methods was highlighted (Altria et al.,1993a) in an inter-company cross-validation of a method for the enantiomericresolution of clenbuterol. The separation was achieved using a low-pH electro-lyte containing a derivatized cyclodextrin. All seven independent pharmaceuti-cal companies achieved baseline resolution, or better, for the clenbuterolenantiomers. Figure 14 shows three specimen separations. Acceptable data forlinearity, migration time, and peak area precision was found in all cases. Apeak area ratio precision of < 1% RSD and a 50:50 enantiomeric ratio werealso shown.

28
9.98
10.2
9
En 1 En 2
Migration Time (min)
Migration Time (min)
0.0000
0.0100
0.0150 11.4
511
.90
En 1 En 2
Abs
orba
nce
(arb
itrar
y un
its)
Abs
orba
nce
(arb
itrar
y un
its)
0.0000
50.0000
100.0000
Cur
rent
0.0 2.0 4.0 6.0 8.0 10.0 12.0 14.0 16.0 18.0 20.00.022
0.027
0.031
0.035
0.040
0.044
0.048
0.052
0.057
0.061
En 1 En 2
Abs
orba
nce
(arb
itrar
y un
its)
Migration Time (min)
Figure 14. Specimen chiral separations of clenbuterol achieved at three com-panies. Electrolyte: 30 mM hydroxylpropyl-β-cyclodextrin (typically 0.83 g per20 mL) in 50 mM disodium tetraborate, pH adjusted to 2.2 with concentratedorthophosphoric acid. Reproduced with permission from Altria et al., 1993a.

29
4.2.4 Cost
Chiral HPLC columns generally employ specialized stationary phases and aretherefore expensive (≈ $600). On the other hand, uncoated fused-silica capillar-ies are relatively inexpensive. Daily electrolyte requirements may be as little as20 mL of electrolyte containing a chiral additive at millimolar concentrations.This compares favorably to liters of an organic solvent-based mobile phase.
The principal disadvantage when using CE for chiral analysis is the sepa-ration of water-insoluble compounds. Separations have been attempted withchirally selective bile salt micelles (Nishi et al., 1990a) or with electrolytecontaining both SDS and cyclodextrins (Terabe et al., 1993).
4.3 ApplicationsThe principal application area is the enantiomeric purity testing of drug sub-stances. For example CE is used for the optical purity testing of Sandoz drugEN792 with an LOD of 0.2% for the undesired enantiomer (Kuhn et al.,1992a). Similar separation conditions were employed (Nielen, 1993) for chiralseparation of norephedrine and ephedrine and allowed the enantiomeric puritytesting of both compounds at the 1% level with acceptable precision (1.2 to2.5% RSD for areas and 0.2 to 1.5% RSD for optical purity results) and linear-ity better than 0.9997.
A chirally selective MECC method was developed for the optical puritytesting of a trimequinol drug substance with an LOD of 1% (Nishi et al.,1990a).
A CE method was used to monitor an enantioselective enzymaticbiotransformation reaction (Rogan et al., 1993). The reaction produced therequired (+) enantiomer by selective deamination of the undesired (-) formusing an enzyme. The reaction of the (-) was monitored over a 51-hour periodand the final product found to contain less than 0.5% of the (-) enantiomer.Reaction rate and half-life information was generated.
A chiral CE method was shown (Soini et al., 1992a) to be capable ofdetermining 0.1% of the S-bupivacaine in the presence of R-bupivacaine.
CE and HPLC have been employed (Altria et al., 1994c) to test the opticalpurity of picumeterol drug substance batches. Detector linearity of 0.9993 wasobtained for peak area ratio data plotted against prepared mixtures of picu-meterol enantiomers. Good agreement between the results was obtained con-

30
firming the accuracy of both techniques (less than 0.4% difference betweentechniques).
Enantiomeric ratios can alter following storage. For example L-epi-nephrine can undergo enantiomeric inversion to its D-isomer during storage.CE has been employed (Peterson and Trowbridge, 1992) to test enantiomericpurity of stored formulations containing L-epinephrine and acceptable preci-sion (1.4 to 1.8% RSD for peak area ratios), linearity (0.9988 to 0.9998), andrecoveries (99 to 101%) were obtained.
A validated method for the chiral analysis of fluparoxan drug substanceshas been reported (Altria et al., 1993b). A typical separation of a test mixtureof a fluparoxan enantiomer spiked with 1% of its stereoisomer is given inFigure 15. The test mixture was a synthetic mixture of 60:40% w/w of the (+)enantiomer: (-) enantiomer) and the peak area ratio obtained accurately con-firmed the spiking level. Repeated analysis of mixtures containing enantiomersspiked at the 1% level confirmed this spiking (0.8 to 1.1% peak area). Thevalidation of this method included precision peak area (1.6 to 2.0% RSD),linearity (0.994), and limits of detection (0.3%) and quantitation (1.0%). Themethod was capable of determining 0.3% of either enantiomer in the presenceof the other.

31
10.00 12.00 14.00
14.60
14.40
14.20
14.00
13.80
16.00 18.00 20.00 22.00 24.00
(+)
(-)
Migration Time (min)
UV
Abs
orba
nce
(214
nm
)
Figure 15. Electropherogram of 1% (-) enantiomer in presence of (+) enanti-omer of fluparoxan. Separation conditions: 57 cm × 50 µm; electrolyte,10 mM borax, 10 mM tris, 150 mM β-cyclodextrin, 6 M urea-isopropanol(80:20) v/v; adjusted to pH 2.5 with H3PO4; temperature, 25°C; detection,15 kV. Reproduced with permission from Altria, 1993b.
Hohne et al. (1992) chirally resolved several aminoalcohols using electro-lyte-containing crown ethers. They reported a detection limit of 0.5% for theinactive enantiomer of methoxamine.
An inter-company cross-validation (Altria et al., 1993a) of a method forthe enantiomeric resolution of clenbuterol between seven independent pharma-ceutical companies showed good resolution (Figure 14). Linearity data fordetector response was assessed over the range 10 to 150% of target concentra-tion with correlation coefficients of 0.990 to 0.999. Precision for migrationtime and relative migration time was 0.2 to 1.3 and < 0.1% RSD respectively.Peak area and peak area ratio precision was found to be 0.8 to 2.5 and 0.2 to0.9% RSD. An average 50:50 enantiomeric ratio was obtained by the sevencompanies with an RSD of 0.6%.
32
Chiral separations of drugs in biofluids have also been reported (Gareilet al., 1993; Heuermann and Blaschke, 1993; Shibukawa et al., 1993). Thesimplicity and robustness of CE make it particularly attractive in this area.Examples include the quantitation of dimethindene enantiomers in urine, fol-lowing a single 4-mg dose (Heuermann and Blaschke, 1993), and the separa-tions of leucovorin and its major metabolite at therapeutic levels in plasma(Shibukawa et al., 1993).
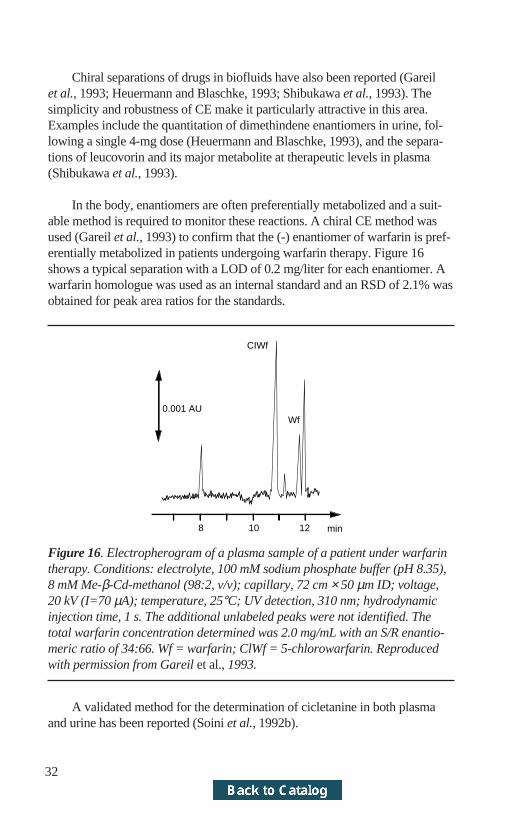
In the body, enantiomers are often preferentially metabolized and a suit-able method is required to monitor these reactions. A chiral CE method wasused (Gareil et al., 1993) to confirm that the (-) enantiomer of warfarin is pref-erentially metabolized in patients undergoing warfarin therapy. Figure 16shows a typical separation with a LOD of 0.2 mg/liter for each enantiomer. Awarfarin homologue was used as an internal standard and an RSD of 2.1% wasobtained for peak area ratios for the standards.
8 10 12
0.001 AUWf
CIWf
min
Figure 16. Electropherogram of a plasma sample of a patient under warfarintherapy. Conditions: electrolyte, 100 mM sodium phosphate buffer (pH 8.35),8 mM Me-β-Cd-methanol (98:2, v/v); capillary, 72 cm × 50 µm ID; voltage,20 kV (I=70 µA); temperature, 25°C; UV detection, 310 nm; hydrodynamicinjection time, 1 s. The additional unlabeled peaks were not identified. Thetotal warfarin concentration determined was 2.0 mg/mL with an S/R enantio-meric ratio of 34:66. Wf = warfarin; ClWf = 5-chlorowarfarin. Reproducedwith permission from Gareil et al., 1993.
A validated method for the determination of cicletanine in both plasmaand urine has been reported (Soini et al., 1992b).
33
5 Stoichiometric Determinations
5.1 OverviewTo modify the physiochemical properties such as solubility, bioavailabilty, andbiocompatability, many drugs are prepared as salts. Typically, acidic drugs areprepared as their sodium or potassium salts. The range of salt forms availablefor basic drugs is more diverse, including both inorganic counter-ions such aschloride or sulphate and organic counter-ions such as succinate or maleate.
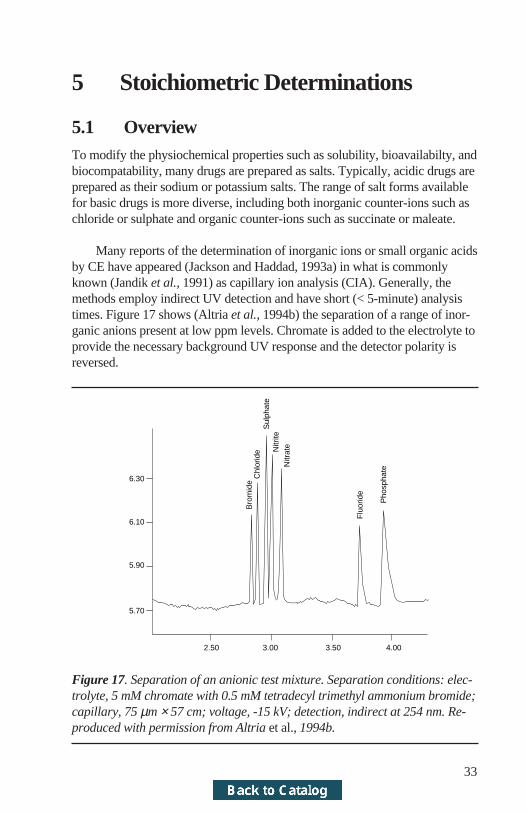
Many reports of the determination of inorganic ions or small organic acidsby CE have appeared (Jackson and Haddad, 1993a) in what is commonlyknown (Jandik et al., 1991) as capillary ion analysis (CIA). Generally, themethods employ indirect UV detection and have short (< 5-minute) analysistimes. Figure 17 shows (Altria et al., 1994b) the separation of a range of inor-ganic anions present at low ppm levels. Chromate is added to the electrolyte toprovide the necessary background UV response and the detector polarity isreversed.
2.50 3.00 3.50 4.00
6.30
6.10
5.90
5.70
Bro
mid
eC
hlor
ide
Sul
phat
eN
itrite
Nitr
ate
Flu
orid
e
Pho
spha
te
Figure 17. Separation of an anionic test mixture. Separation conditions: elec-trolyte, 5 mM chromate with 0.5 mM tetradecyl trimethyl ammonium bromide;capillary, 75 µm × 57 cm; voltage, -15 kV; detection, indirect at 254 nm. Re-produced with permission from Altria et al., 1994b.

34
5.2 Features of CE Methods for StoichiometricDeterminations
Drug:counter-ion stoichiometry is traditionally determined by ion-exchangechromatography (IEC) or titrimetry. CE represents an alternative techniqueand can offer advantages in terms of simplicity and cost.
5.2.1 Simplicity
In general uncoated fused-silica capillaries are employed in CIA which, asdiscussed in previous sections, are inexpensive. Aqueous-based electrolytes areused which can be prepared and stored for a long period of time prior to reuse.This compares to the preparation of IEC mobile phases and the use of IECcolumns which often require regeneration procedures. This testing is per-formed on standard CE equipment. Automated testing and data handling ispossible with both IEC and CIA, and both are therefore more desirable thantitrimetry.
5.2.2 Cost
Both sample solutions and electrolyte are aqueous and volume requirementsare minimal. The cost of a capillary, compared to a column, represents a fur-ther cost saving. A further advantage that may be overlooked is that the testingcan be performed on standard unmodified CE instrumentation.
The principal disadvantage of CE compared to IEC may be limits of de-tection. Low ppm levels of both cations and anions are possible by CIA whenemploying standard injection techniques. Single figure ppb levels are possible(Jackson and Haddad, 1993b) when electrokinetic injection is used. This sensi-tivity issue is irrelevant in stoichiometric determinations as high sample con-centrations (i.e., 100 to 200 ppm) are employed.
5.3 ApplicationsThis is a new CE application area and to-date few reports of the CIA analysisof pharmaceuticals have been reported. Undoubtedly more will appear as thetechnology matures. To illustrate possibilities, references to other applicationareas and, where possible, pharmaceuticals are given.

35
5.2.1 Anions
The two pharmaceutical application reports involve the determination of drugstoichiometry (Altria et al., 1994b) and monitoring of inorganic contaminantsin drug substances (Nair and Izzo, 1993). Other examples include the quantita-tive determination of inorganic anions in tap water (Motomizu, 1992) andbread (Ackermans, 1992c).
Stoichiometric testing of several drug substances has been conducted(Altria et al., 1994b). Figure 18 shows separations of a batch of a drug pre-pared as a chloride salt. Clearly this batch largely contains chloride but alsocontains low levels of other inorganic and organic anions as contaminants.
3.00 3.50 4.00 4.50
6.44
6.53
6.63
6.73
Chl
orid
e
Time (min)
Indi
rect
UV
at 2
54 n
m
Figure 18. Electropherogram of chloride assay of GGR1 drug substance.Conditions as per Figure 17. Reproduced with permission from Altria et al.,1994b.
Table 4 shows results for chloride and sulphate content in three drug sub-stances (denoted GRD1–3). Good agreement between CE, theoretical anioncontent, and microanalysis results are obtained (Altria et al., 1994b). Themethod performance in terms of linearity (R2 > 0.999) and RSD values of 1 to2% for peak area and migration time was also acceptable.

36
Table 4. Levels of Anionic Counter-Ions inDrug Substances Determined by CE
Good agreement was obtained between CE, microanalysis, and theoreticalcontent.
Sample Theoretical Microanalysis CE ResultsContent
Chloride (%w/w)
GRD 1 batch A 8.0 - 8.0 , 7.9
GRD 2 batch A 9.6 9.5 9.3 , 9.3
GRD 2 batch B 9.6 9.6 9.4 , 9.4
GRD 2 batch C 9.6 9.5 9.2 , 9.7
GRD 2 batch D 9.6 9.4 9.9 , 9.6
GRD 2 batch E 9.6 9.5 9.3 , 9.5
Sulphate (% w/w)
GRD 3 batch A 16.6 - 16.7
GRD 3 batch A 16.6 - 16.8
(Altria et al., 1994b)
When fully characterizing a drug substance, it is necessary to determinethe inorganic ion content which originates from synthetic reagents. If present,inorganic ions will contribute to the mass of the substance and will need to beassayed. CE has been employed (Nair and Izzo, 1993) to determine a range ofinorganic and organic ions present in drug substances. Limits of detection of< 0.1% w/w were reported. The method allowed the determination to be con-ducted on both water-soluble and insoluble drug substance materials. Insolubledrugs were dissolved in acetonitrile:water mixtures. Figure 19 shows the sepa-ration of a test mixture of inorganic ions dissolved in acetonitrile:water andanalysis of a 1-mg/mL solution of deuterated pravachol. Various validationcriteria were applied to the method including linearity (typically 0.999 in therange of 1 to 100 ppm), precision (1.3 to 6% RSD for anions spiked at the limitof quantitation, 0.1% w/w), and sensitivity (LOD of 0.05% w/w impurity inthe drug substance).

37
2.0 2.5 3.0 3.5 4.0 4.5 6.56.05.55.0
103.0
102.0
101.0
100.0
99.0
98.0
Inte
nsity
(m
V)
Time (min)
1mg/mL Deuterated Prava
1 µg/mL Anion Screen Standard
a
b
Figure 19. Electropherogram of (a) 1 µg/mL anion screen standard. Themigration order of the anions is bromide, chloride, sulphate, nitrite, citrate,fluoride, phosphate, carbonate and acetate. (b) 1 mg/mL deuterated pravachol.Separation conditions: electrolyte, chromate, dilute sulphuric acid and Wa-ters’ Anion-BT OFM; voltage, 20 kV; injection, 20 s, hydrostatic; detection,indirect UV at 254 nm. Reproduced with permission from Nair and Izzo, 1993.
5.3.2 Cations
Typical separation conditions employed (Beck and Engelhardt, 1992) involveuse of a low-pH electrolyte containing imidazole (or similar) as the UV back-ground electrolyte.
Figure 20 shows a typical separation of a standard metal ion test mixused in the determination of metal ions in vitamin tablets (Swartz, 1993).The method allowed low-ppm LODs to be obtained. Aspects of validationsuccessfully evaluated include linearity (better than 0.998), precision (< 1% formigration time and < 2% RSD for peak area), and sensitivity (1 ppm). Resultsfrom CE compared well with those obtained by ICP.

38
2.69
2.68
2.67
2.66
2.00 2.50 3.00 3.50
X 1
0 v
olts
-1
Time (min)
K
Na
Ba
Ca
MgLi
Figure 20. Separation of alkali metal and alkaline earth metal ions. Separa-tion conditions: 5 mM imidazole, pH 4.5; voltage, 25 kV; sample concentra-tion, 1 ppm (Swartz, 1993).
Levels of potassium and sodium content have been determined in variousacidic drug substances (Altria et al., 1994b). Table 5 shows that the resultsobtained by CE for three drug substance materials (denoted GRD4–6) agreewell with the theoretical and IEC results. Good method performance in termsof linearity (0.9999 over the range 10 to 500 mg/L), precision (0.3 to 1.5%RSD), and sensitivity (LOD of 1 ppm) was also obtained.

39
Table 5. Levels of Cationic Drug Counter-Ionsin Drug Substances Determined by CE
Good agreement was obtained between CE, HPLC (IEC) and theoretical con-tent.
Sample Theoretical HPLC CE ResultsContent
Sodium
GRD 4 batch A 5.2 - 5.2, 5.1
GRD 4 batch B 5.2 - 5.0, 4.8
GRD 4 batch C 5.2 - 4.9, 4.7
GRD 5 batch A 3.6 - 3.3, 3.4
Potassium
GRD 6 batch A 6.0 6.1 6.1
GRD 6 batch B 6.0 - 5.9
GRD 6 batch C 6.0 - 6.0
(Altria et al., 1994b)
Given the simplicity and robustness of the CE methods used for the deter-mination of drug stoichiometry, it is expected that there will be a significantincrease in application and perhaps even replacement of existing methods oftesting.
6 Quantitative Procedures
6.1 Overview
The options for conducting quantitative analysis are similar to those adopted inHPLC and have been reviewed (Altria, 1993g). The output format is similar toan HPLC chromatogram (i.e., a plot of UV absorbance versus time). There-fore, HPLC data handling and peak integration packages are generally appli-cable to CE. As discussed in the Introduction, it is important (Altria, 1993b) tonormalize peak areas in appropriate circumstances. Some important consider-ations and reminders essential for achieving good quantitative data are detailedbelow.

40
6.2 Impurity DeterminationsImpurity levels may be calculated and reported (Swartz, 1991) as a % of thetotal peak area of the electropherogram. This assumes an equal response factorfor all known and unknown impurities. Alternatively (Altria, 1993c), if iso-lated standards of impurities are available, then external standards can be pre-pared and response factors obtained. These response factors are then used tocalculate impurity levels as % w/w.
6.3 Main Component AssayAs with HPLC, sample solutions are analyzed against standards of knownconcentration. If an internal standard is employed as a means of increasingprecision (Dose and Guiochon, 1991), then ratios of the drug and internalstandard peak areas are used in the calculations.
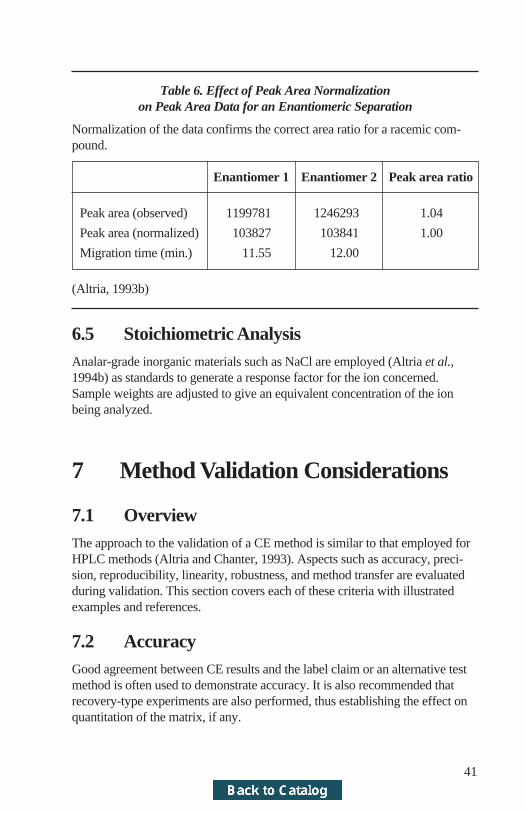
6.4 Chiral AnalysisEnantiomeric content can be reported in several ways. The most commonexpresses the peak area of the undesired enantiomer as a percentage of totalpeak area. Alternative approaches determine the enantiomeric excess or useexternal standards of either enantiomer. Irrespective of which method is used,it is essential to use normalized peak areas (Altria, 1993b). This is exemplifiedby the data obtained for the repeated analysis of a racemic drug (Table 6). Apeak-area ratio of 1.00 should be obtained for a racemic compound. The un-normalized areas indicate a ratio of 1.04, which suggests that more of the sec-ond detected enantiomer is present. However, the expected ratio of 1.00 isobtained (Altria, 1993b) when calculating using normalized areas. If low levelsof undesired enantiomer are to be quantified, it may be necessary to employsufficient sample concentration such that the main peak is off-scale. In thiscase, an external standard of either enantiomer at an appropriate concentrationwould be employed to generate a response factor.
41
Table 6. Effect of Peak Area Normalizationon Peak Area Data for an Enantiomeric Separation
Normalization of the data confirms the correct area ratio for a racemic com-pound.
Enantiomer 1 Enantiomer 2 Peak area ratio
Peak area (observed) 1199781 1246293 1.04
Peak area (normalized) 103827 103841 1.00
Migration time (min.) 11.55 12.00
(Altria, 1993b)
6.5 Stoichiometric AnalysisAnalar-grade inorganic materials such as NaCl are employed (Altria et al.,1994b) as standards to generate a response factor for the ion concerned.Sample weights are adjusted to give an equivalent concentration of the ionbeing analyzed.
7 Method Validation Considerations
7.1 OverviewThe approach to the validation of a CE method is similar to that employed forHPLC methods (Altria and Chanter, 1993). Aspects such as accuracy, preci-sion, reproducibility, linearity, robustness, and method transfer are evaluatedduring validation. This section covers each of these criteria with illustratedexamples and references.
7.2 AccuracyGood agreement between CE results and the label claim or an alternative testmethod is often used to demonstrate accuracy. It is also recommended thatrecovery-type experiments are also performed, thus establishing the effect onquantitation of the matrix, if any.

42
7.3 PrecisionPrecision in CE, as with HPLC, is dependent on the type of method and itsdegree of optimization. Poor peak shape and low loadings will obviously resultin unacceptable performance. Precision in CE is typically of the order 0.5 to2% RSD for main peak assay, with or without internal standard (Altria andFilbey, 1993, Ackermans et al., 1992a). For trace impurities, the precisionwould be expected to be < 10% RSD (Swartz, 1991; Altria and Chanter,1993). Migration time and relative migration times should be about 1% RSDand < 1% RSD respectively. For example, in the transfer of a method for deter-mining the enantiomeric ratio of clenbuterol (Altria et al., 1993a), peak areaprecision was 1 to 2% RSD, peak area ratio precision was < 1%, and migrationtime precision was ≈ 0.1% RSD across seven companies.
7.4 ReproducibilityIt is necessary to demonstrate that the method can be reproduced in a varietyof situations. As with HPLC, reproducibility between capillaries, instruments,analysts, days, and laboratories is required. As the method may be employedon CE instruments from various manufacturers, it is important to demonstratethat acceptable performance can be attained using different sample introduc-tion modes and capillary dimensions.
Examples of reproducibility studies include assessments of CE methodsfor the determination of sumatriptan (Altria and Filbey, 1993), and hydrochlo-rothiazide (Thomas et al., 1994).
7.5 LinearityIt is important to show that a linear relationship between detector response andsample concentration exists within the working range required, in both directand indirect modes. Typically, a range of 50 to 150% for main peak assay andof 0.1 to 10% for related impurities should be assessed. The literature containsnumerous reports of the good linearity that may be expected for direct andindirect measurements. For example, correlation coefficients of better than0.999 have been reported for sumatriptan (Altria and Filbey, 1993), severalbronchodilators (Ackermans et al., 1992a), and alendronate (Tsai et al., 1992).
When determining impurity levels or trace enantiomer content, it is alsonecessary to demonstrate detector rectilinearity. This involves maintaining themain component at a constant concentration and varying the content of theminor component. Acceptable rectilinearities have been reported for impurities

43
of salbutamol (Altria, 1993c) and a quinolone antibiotic (Altria and Chanter,1993). Correlation coefficients of > 0.99 have been reported (Altria et al.,1993b) for fluparoxan enantiomer levels of 1 to 10% of the desired enantiomercontent.
7.6 RobustnessMany definitions exist for this term but, in the context of this primer, it relatesto the sensitivity of the method to small, deliberate deviations from themethod. For instance, if the method states an operating temperature of 30°C,will acceptable performances be maintained at either 25°C or 35°C? Twoapproaches to method robustness are possible: uni-variate or multi-variate.The uni-variate approach involves systematically varying each parametersequentially. This “one-by-one” approach has been performed (Thomas andGhodbane, 1993) for the determination of enalapril content in tablets by CE.The multi-variate assessment involves simultaneous evaluation of severalparameters using a predefined matrix. Typical experimental designs that maybe employed include Placket-Burman (Vindevogel and Sandra, 1991) andCentral Composites.
CE has been employed (Altria and Filbey, 1994) to determine levels of4-guanidino-Neu5Ac2en and related impurities. Figure 21 shows separation ofthe main component from six impurities (denoted I1 to I6). Both fractionalfactorial and central composite designs were employed in the robustness test-ing of this method. Figure 21 also shows (Altria and Filbey, 1994) a Paretoplot of the resolution of 4-guanidino-Neu5Ac2en form I2 as a function ofelectrolyte pH and voltage.

44
16
15
14
11
12 13
main peak
12.00
0.7631
0.5593
0.3555
0.1517
12.0011.20
10.409.60
8.808.00
RES2 (1)
B: VOLTAGE 1.9001.980
2.0602.140
2.2202.300
12.50
13.00
13.50
14.00
14.50
0.00 10.00 20.00 30.00 40.00
A: pH
Figure 21. Application of experimental design in robustness testing of a re-lated impurity determination method. (a) Separation of 4-guanidino-Neu5Ac2en and related impurities. (b) Response surface showing thecombined effect of pH and voltage on the resolution between the main peakand impurity I2. Separation conditions: electrolyte, 50 mM NaH2PO4, pH 2.1;injection, 10 s; detection, 230 nm; voltage, 10 kV; temperature, ambient; cap-illary, 50 µm × 47cm; concentration, 1 mg/mL. Reproduced with permissionfrom Altria and Filbey, 1994.
The need to demonstrate repeatability on instruments from at least twoinstrument manufacturers is stressed. Given the infancy of CE, the need forcomplete validation of methods is essential to generate further confidence andincreased momentum.
a
b

45
8 Future Developments
8.1 OverviewThere has been a rapid development of CE since the launch of commercialinstrumentation. Improvements in detector sensitivity and the introduction ofdiode array technology are assisting continued developments. This sectioncontemplates potential development areas that will influence the use of CE forpharmaceutical analysis. It is anticipated that the principal areas are new sepa-ration options, detection possibilities, capillary technology, andelectrochromatography.
Currently, the separation options available in CE are not as extensive asHPLC. The introduction of new electrolyte additives and surface-modifiedcapillaries are expected to have a major part to play. The flexibility and lowcost involved in CE separations will facilitate these developments.
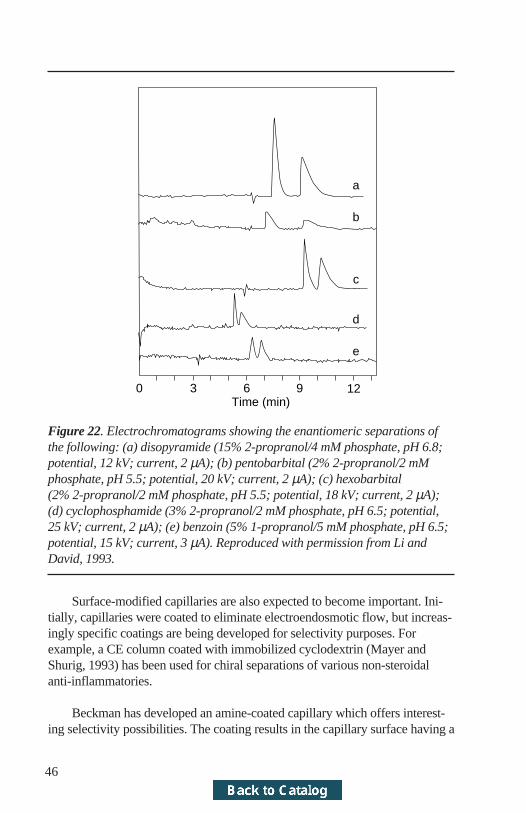
Some examples include reports on the use of ionizable cyclodextrins(Nardi et al., 1993) and crown ethers (Kuhn et al., 1992b). Ion-pair reagentsand non-aqueous solvent systems will also extend the possibilities to water-insoluble drugs. The authors also recognize that the area of MECC is as yetrelatively untapped. The variety of off-the-shelf surfactants and possible per-mutations are astronomical. Novel chiral selectors such as proteins (Li andLloyd, 1993) will receive increased attention and will expand the area of chiralanalysis further (Figure 22). These investigations will give the analytical chem-ist of the future many options for solving a separation problem.
46
0 3 6 9 12Time (min)
a
b
c
d
e
Figure 22. Electrochromatograms showing the enantiomeric separations ofthe following: (a) disopyramide (15% 2-propranol/4 mM phosphate, pH 6.8;potential, 12 kV; current, 2 µA); (b) pentobarbital (2% 2-propranol/2 mMphosphate, pH 5.5; potential, 20 kV; current, 2 µA); (c) hexobarbital(2% 2-propranol/2 mM phosphate, pH 5.5; potential, 18 kV; current, 2 µA);(d) cyclophosphamide (3% 2-propranol/2 mM phosphate, pH 6.5; potential,25 kV; current, 2 µA); (e) benzoin (5% 1-propranol/5 mM phosphate, pH 6.5;potential, 15 kV; current, 3 µA). Reproduced with permission from Li andDavid, 1993.
Surface-modified capillaries are also expected to become important. Ini-tially, capillaries were coated to eliminate electroendosmotic flow, but increas-ingly specific coatings are being developed for selectivity purposes. Forexample, a CE column coated with immobilized cyclodextrin (Mayer andShurig, 1993) has been used for chiral separations of various non-steroidalanti-inflammatories.
Beckman has developed an amine-coated capillary which offers interest-ing selectivity possibilities. The coating results in the capillary surface having a

47
positive charge, whereas an uncoated capillary is normally negatively chargeddue to dissociation of surface silanols. Application of a voltage across theamine coated capillary generates a strong EOF in the opposite direction to thatobtained with an uncoated capillary and thus offers the potential for a reversalof migration order to that normally obtained. Figure 23 shows a test mixture offour basic drugs separated at pH 4.6 using an amine-coated capillary and anegative voltage. This separation could not be achieved on an uncoated capil-lary at the same pH. Undoubtedly the development and application of coatedcolumns will expand the possibilities in CE method development.
33.00
32.00
31.00
30.00
29.00
28.00
27.00
5.00 6.00 7.00 8.00 9.00
3
2
1
4
Retention Time (min)
Figure 23. Separation of 4 basic drugs on amine-coated capillary. 25 mMNaH2PO4 (pH unadjusted), 200 nm, 2-second injection, 50 cm × 37 cm amine-coated capillary, -10 kV. Altria, 1994, unpublished results.
8.2 DetectionCurrently the vast majority of CE applications in pharmaceutical analysis haveinvolved the use of UV absorbance detection. Separation of pharmaceuticalshaving poor chromophores such as aminogyclosides (Figure 8) have involvedthe use of indirect UV detection and low UV wavelength detection.

48
New detection options on commercial instrumentation include diode array(DAD) and laser-induced fluorescence. DAD technology offers a number ofbenefits in areas such as peak identity confirmation and peak homogeneitytesting.
Currently the use of laser-induced fluorescence (LIF) detection is some-what limited in pharmaceutical analysis as few drugs have the required naturalfluorescence. The additional steps of preseparative sample derivatization isunattractive from a routine method perspective. However, appropriate pro-gramming of the separation method (Houben et al., 1993) can allow unat-tended on-column sample derivatization. The sample and the requiredderivatization reagents are injected into the capillary, allowed to react, and thederivatized sample components are then separated.
It is expected that more detection options will become commerciallyavailable to supplement those currently available. Most HPLC detection modeshave been reported for CE and include electrochemical (Yik and Li, 1992) andradioactivity detectors (Altria et al., 1990). The potential sensitivity and selec-tivity these offer will further widen the scope for application. The hyphenationof CE to MS is well established and a number of reports of CE-MS to druganalysis (Johansson et al., 1991) have appeared. Again, significant progress inthis area is expected.
8.3 ElectrochromatographyElectrochromatography is a technique in which a CE capillary packed withHPLC stationary phase material is employed for separations. The capillarycolumn is filled with electrolyte and a voltage applied. Application of thevoltage causes electroendosmotic flow to occur which effectively pumps elec-trolyte through the column. Solutes separate by virtue of their chromatographicinteractions with the packing and also by differences in electrophoretic mobili-ties. The technique is therefore essentially a combination of CE and HPLCand, as such, offers yet another dimension to method development options.
Electrochromatography can be operated on standard CE instruments andhas many of the features of CE in terms of reduced reagent purchase and sol-vent disposal costs but with the added advantage of good peak efficiencies.Little attention has been paid to this area as yet and the reports are limited(Yamamoto et al., 1992). Figure 24 shows the separation of israpidin whichillustrates the high separation efficiencies that are possible usingelectrochromatography using 3 mm ODS particles.

49
Abs
orba
nce
(220
nm
)
0.5 1.0 1.5 2.0
0.002 AU
Retention Time (min)
isra
dipi
din
thio
urea
Figure 24. Separation of isradipidin by electrochromatography. Reproducedwith permission from Yamamoto et al., 1992.
9 ConclusionsCapillary electrophoresis is now firmly established as a viable option for theanalysis of pharmaceuticals. Specific application areas include the determina-tion of drug-related impurities, drug potency, chiral analysis, and determina-tion of drug counter-ion content. CE is often viewed as an alternative orcomplementary technique to HPLC.
Validated CE methods are in routine use in many industrial pharmaceuti-cal analysis laboratories. Validation criteria for CE methods are similar tothose employed in evaluation of HPLC methods.
Use of CE for specific analysis such as chiral analysis can have benefits interms of method robustness and ruggedness, cost, and time. Current disadvan-tages are largely poorer sensitivity when directly compared to HPLC and thelimited preparative options. Undoubtedly, technological developments andadvances in methodology will strengthen and endorse the position of CEwithin pharmaceutical analysis. Of considerable note are the possibilities thatthe further development of new detector options, coated capillaries, andelectrochromatography may bring.
Without doubt, CE has been recognized as a valid means of testing phar-maceuticals. To date, over 150 references have appeared on the subject. Thisnumber will no doubt double or triple in the next two to three years as thenumber of application areas expands.

50
Practical HintsThe following section is intended to highlight a number of practical aspectswhich should be considered during the development and subsequent use ofCE-based methods in pharmaceutical analysis. While these are by no meansexhaustive, they serve to alert the user to potential problem areas, their possibleremedies, and relevant literature references containing further details.
Electrolyte/SampleAnalyte peak shape can be dramatically improved by:
• matching the mobility of the analyte and the buffer co-ion (Mikkers et al.,1979);
• having the sample a factor of 102 lower than the buffer concentration(Mikkers et al., 1979);
• dissolving the sample in a low concentration buffer (water if possible) andanalyzing with a high-concentration electrolyte (Chien and Burghi 1992);
• to avoid band broadening due to Joule heating effects, buffers with lowspecific conductance should be used (generally operation above ≈ 100 µAcan lead to problems of internal heating in the capillary);
• buffers and samples should be filtered prior to use to remove particulates.
SensitivityThe sensitivity of a method using standard CE equipment (i.e., UV detector)can improved by:
• employing a “high-low” injection technique (see Section 2.3, Altria,1993e);
• using low UV wavelengths such as 200 nm where many components havesignificantly enhanced UV activity (Altria, 1993d);
• employing large sample volumes (i.e., long injection times) under stack-ing conditions (Chien and Burghi, 1992);
• using larger-bore capillaries than the standard 50 or 75µm. Bores as highas 180µm have been employed (Altria, 1993f) to dramatically increasesensitivity. However, deleterious heating effects may occur and the bufferconcentration, voltage, and capillary length should be adjusted to give anacceptable level of current.

51
QuantitationThe following measures may improve peak area precision:
• methods should be run at constant temperature as the volume injected isproportional to temperature (Rose and Jorgenson, 1988).
• peak area normalization (Altria, 1993b) should always be conducted. Theexception to this is where migration time precision is very good and exter-nal standardization is employed.
• internal standards can be used to increase precision (Dose and Guiochon,1991).
• the volume injected onto the capillary is proportional (Rose andJorgenson, 1988) to the viscosity of the sample and calibration solutions.Viscosity differences can be introduced when components such as cellu-lose are in the sample which may lead to apparent imprecision. Use of aninternal standard eliminates this difficulty.
• high sample concentrations should be used to reduce the effect of integra-tion errors.
Capillary CareIt is recommended that:
• the capillary is rinsed for 30 minutes with 0.1 M NaOH on its initial use;• the capillary is flushed with 0.1 M NaOH (or acid) and equilibrated with
the running buffer prior to each injection;• the capillary is rinsed with water and air blown through it at the end of
each day. This prevents buffer precipitation and subsequent capillaryblockage;
• individual capillaries be dedicated to specific methods to avoid “memoryeffects” which may lead to non-reproducible separations;
• an initial injection of a blank, or sample solution, be performed prior tocommencing an analytical sequence to allow the system to equilibrate.

52
ReferencesAckermans, M. T., Everaerts, F. M., Beckers, J. L. J. Chromatogr. 585,123-131 (1991a)
Ackermans, M. T., Everaets, F. M., Beckers, J. L. J. Chromatogr. 549,345-355 (1991b)
Ackermans, M. T., Beckers, J. L., Everaerts, F. M., Seelen, I. G. J. A. J.Chromatogr. 590, 341-353 (1993a)
Ackermans, M. T., Everaerts, F. M., Beckers, J. L. J. Chromatogr. 606, 229-235 (1992b)
Ackermans, M. T., Beckers, J. L., Everaerts, F. M., Hoogland, H., Tomassen,M. J. H. J. Chromatogr. 596, 101-109 (1992c)
Ackermans, M. T., Ackermans-Loonen, J. C. J. M., Beckers, J. L.J. Chromatogr. 627, 273-279 (1992d)
Allenmark, S. G. in Chromatographic Enantioseparation Methods and Appli-cations. New York: John Wiley and Sons, 1988.
Altria, K. D., Simpson, C. F. Anal. Proc. 23, 453 (1986)
Altria, K. D., Simpson, C. F. 1st Int. Symp. Pharm. Biomed. Analysis,Barcelona (1987) J. Biomed. Pharm. Anal. 6, 801-807 (1988)
Altria, K. D., Rogan, M. M. J. Pharm. Biomed. Anal. 8, 1005-1008 (1990)
Altria, K. D., Simpson, C. F., Bharij, A. K., Theobald, A. E. Electrophoresis11, 732-734 (1990)
Altria, K. D., Harden, R. C., Hart, M., Hevizi, J., Hailey, P. A., Makwana, J.V., Portsmouth, M. J. J. Chromatogr. 641, 147-153 (1993a)
Altria, K. D. J. Chromatogr.652, 459-463 (1993a)
Altria, K. D. Chromatographia 35, 177-182 (1993b)
Altria, K. D., Walsh, A. R., Smith, N. W. J. Chromatogr. 645, 193-196(1993b)
Altria, K. D. J. Chromatogr. 634, 323-328 (1993c)
Altria, K. D. J. Chromatogr. 636, 125-132 (1993d)
Altria, K. D. Chromatographia 35, 493-496 (1993e)
Altria, K. D. LC-GC Int. 6, 616-620 (1993f)

53
Altria, K. D. J. Chromatogr. 646, 245-257 (1993g)
Altria, K. D., Chanter, Y. L. J. Chromatogr. 652, 459-463 (1993)
Altria, K. D., Clayton, N. G., Harden, R. C., Hart, M., Hevizi, J., Makwana,J. V., Portsmouth, M. J. Chromatographia 39, 180-184 (1994a)
Altria, K. D., Rogan, M. M., Goodall, D. M. Chromatographia 38, 637-642(1994b)
Altria, K. D., Goodall, D. M., Rogan, M. M. Electrophoresis 15, 824-827(1994c)
Altria, K. D., Connolly, P. Chromatographia 37, 176-178 (1993)
Altria, K. D., Dave, K. J. Chromatogr. 633, 221-225 (1993)
Altria, K. D., Filbey, S. D. J. Liq. Chromatography 16, 2281-2292 (1993)
Altria, K. D., Luscombe, D. C. M. J. Pharm. Biomed. Analysis 11, 415-420(1993)
Beck, W., Engelhardt, H. Chromatographia 33, 313-316 (1992)
Buckberger, W., Haddad, P. R. J. Chromatogr. 608, 59 (1992)
Camilleri, P., Okafo, G. N., Southan, C., Brown, R. Analytical Biochemistry198, 36-42 (1991)
Chee, G. I., Wan, T. S. M. J. Chromatogr. 612, 172-177 (1993)
Chien, R. L., Burghi, D. S. Anal. Chem. 64, 489a (1992)
Dang, Q., Yan, L., Sun, Z., Ling, D. J. Chromatogr. 630, 363-369 (1993)
Dose, E. V., Guiochon, G. A. Anal. Chem. 63, 1154-1158 (1991)
Flurer, C. L., Wolnik, K. A. J. Chromatogr. 663, 259-263, (1993)
Fujiwara, S., Honda, S. Anal. Chem. 59, 2773-2776, (1987)
Gareil, P., Gramond, J. P., Guyon, F. J. Chromatogr. 615, 317-325 (1993)
Heuermann, M., Blaschke, G. J. Chromatogr. 648, 267-274 (1993)
Hohne, E., Krauss, G.-J., Gubitz, G., JHRCC 15, 698-700 (1992)
Honda, S., Iwase, S., Fujiwara, S. J. Chromatog. 404, 313-320 (1987)
Houben, R. J. H., Gielen, H., Van der Wal, S. J. Chromatogr. 634, 317-322(1993)
Jackson, P. E., Haddad, P. R. TRAC 12, 231-238 (1993a)

54
Jackson, P. E., Haddad, P. R. J. Chromatogr. 640, 481-487 (1993b)
Jandik, P., Jones, W. R., Weston, A., Brown, P. R. LC-GC 9, 634 (1991)
Johnasson, M., Pavelka, R., Henion, J. J. Chromatogr. 559, 515-528 (1991)
Jorgenson, J. W., Lukacs, K. D. Science 222, 266 (1983)
Kuhn, R., Hoffstetter-Kuhn, S. Chromatographia 34, 501-512 (1992)
Kuhn, R., Stoecklin, F., Erni, F. Chromatographia 33, 32-36 (1992a)
Kuhn, R., Erni, F., Bereuter, T., Hausler, J. Anal. Chem. 64, 2815-2820(1992b)
Li, S., Lloyd, D. Anal. Chem. 65, 3684-3690 (1993)
Mayer, S., Schurig, V. J. Liq. Chromatogr. 16, 913-931 (1993)
Mikkers, F. E. P., Everaerts, F. M., Verheggen, T. P. E. M. J. Chromatogr.169, 1-10 (1979)
Motomizu, S., Oshima, M., Matsuda, S., Obata, Y., Tanaka, H. AnalyticalSciences 8, 619 (1992)
Nair, J. B., Izzo, C. G. J. Chromatogr. 640, 445 (1993)
Ng, Cl., Lee, H. K., Li, S. F. Y. J. Chromatogr. 598, 133-138 (1992)
Nielen, M. W. F. Anal. Chem. 65, 885-893 (1993)
Nishi, H., Fukuyama, T., Matsuo, M. J. Chromatogr. 515, 245-255 (1990)
Nishi, H., Fukuyama, T., Matsuo, M., Terabe, S. J. Chromatogr. 498, 313-323(1990)
Nishi, H., Fukuywara, T.,Matsuo, M., Terabe, S. J. Chromatogr. 515, 233-243(1990a)
Nishi, H., Fukuyama, T., Matsuo, M., Terabe, S. J. Chromatogr. 513, 279-295(1990b)
Nishi, H., Terabe, S. Electrophoresis 11, 691 (1990)
Nishi, H., Tsumagari, N., Kakimoto, T., Terabe, S. J. Chromatogr. 477,259-270 (1989)
Nishi, H., Tsumagari, N., Terabe, S. Anal. Chem. 61, 2434-2439 (1989a)
Peterson,T. E., Trowbridge, D. J. Chromatogr. 603, 298-301 (1992)
Pluym, A., Van Ael, W., De Smet, M. TRAC 11, 27 (1992)

55
Qin, X. Z., Ip, D. P., Tsai, E. W. J. Chromatogr. 626, 251-258 (1992)
Rabel, S. R., Stobaugh, J. F. Pharm. Res. 10, 171-186 (1993)
Rogan, M. M., Altria, K. D. Presentation at 2nd Int. Symp. Chiral Discr.Rome: May, 1991.
Rogan, M. M., Altria, K. D., Goodall, D. M. Chirality 6, 25-40 (1994)
Rogan, M. M., Drake, C., Goodall, D. M., Altria, K. D. Anal. Biochem. 208,343-347 (1993)
Rose, D. J., Jorgenson, J. W. Anal. Chem. 60, 642 (1988)
Ryder, S. J. Chromatogr. 605, 143 (1992)
Sepaniak, M. J., Cole, R. O., Clark, B. K. J. Liq.Chromatogr. 15, 1023-1040(1992)
Shibukawa, A., Lloyd, D. K., Wainer, I. W. Chromatographia 35, 419-429(1993)
Soini, H., Snopek, J., Novotony, M. V. Beckman Application Data Sheet DS-836 (1992a)
Soini, H., Riekkola, M. L., Novotony, M. V. J. Chromatogr. 608, 265 (1992b)
Swartz, M. E. J. Liq. Chromatogr. 14, 923-938 (1991)
Terabe, S., Otsuka, K., Ichikawa, K., Tsuchiya, A., Ando, T. Anal. Chem. 56,111-113 (1984)
Terabe, S., Miyashita, Y., Ishihama, Y., Shibata, O. J. Chromatogr. 636, 47-55 (1993)
Thomas, B. R., Ghodbane, S. J. Liq. Chromatogr. 16, 1983 (1993)
Thomas, B. R., Fang, X. G., Chen, X., Tyrell, R. J., Ghodbane, S.J. Chromatogr. 657, 383-394 (1994)
Tsai, E. W., Singh, M. M., Lu, H. H., Ip, D. P., Brooks, M. A. J. Chromatogr.626, 245-250 (1992)
Vindevogel, J., Sandra, P. Anal. Chem. 63, 1530 (1991)
Watzig, H., Dette, C. J. Chromatogr. 636, 31-38 (1993)
Yamamoto, H., Baumann, J., Erni, F. J. Chromatogr. 593, 313-319 (1992)
Yik, Y. F., Li, S. F. Y. TRAC 11, 325-332 (1992)
Zhang, C. X., Sun, Z. P., Ling, D. K., Zhang, Y. J. J. Chromatogr. 627, 281-286 (1992)