Embed Size (px)
Citation preview

Beaver Municipal Solutions
Municipally Controlled Corporation Due Diligence
October 2019

2
High-Level Considerations
Executive Summary
Market Landscape
Corporate & Governance Structure
Financial Analysis
Pricing Analysis
BMS’s proposed operations align with regulations and industry comparables. There are few areas to address
regarding their financial objectives and within the MGA requirements for Municipally Controlled Corporations.
BMS has not clearly identified what their corporate and governance structure will be as a Municipally Controlled
Corporation. MNP recognizes that BMS is still in the planning stage of this process and have provided a number of
best practices in this report to be considered in the finalizing of these structures, including the use of a qualified
publicly appointed Board of Directors.
BMS is well positioned in terms of maintaining current waste contracts, and their competitive position within the
industry.
BMS is either in line with financial benchmarks or outperforming them. Over the past five years BMS has seen a
decrease in revenue and margins and an increase in wages but still remain favourable compared to select
industry benchmarks. It would be prudent for the foundation of the MCC to review the cost structure to ensure
that costs do not further impact profitability. Assumptions made around the financial projections have been
included in this report and appear reasonable based on the nature of the industry and BMS’s current operations.
BMS currently has a Present Value of Cash Flows to Invested Capital between $53,200,000 and $58,800,000. A
sensitivity analysis has been included in this report identifying the impact of changing discount rates and
terminal EBITDA margin.

6
High-Level Considerations
Review and commentary on the high-level strategic considerations
that have driven the decision to form the MCC

8
Business Plan Review
MGA MCC Business Plan
Requirements
Addressed by BMS
Business Plan
(June 2019 version)
Location in BMS
Business PlanComments
The services the corporation intends to
provide Section 1: Executive
SummaryAdequate summary provided
The names of the shareholders of the
corporation Section 1: Major Players Complete
The geographic locations in and outside
Alberta in which the corporation intends
to provide services
Section 1: Executive
SummaryGood summary provided
Any potential environmental, financial,
labour or other liability risk in controlling
the corporation
Section 1: Implications or
Risk Factors – Cost
Drivers, and
Confidential Appendix
Risks are outlined and discussed in
the business plan and the
confidential appendix
There is minimal discussion
around liability risks
Information demonstrating that the
corporation will not be dependent on the
shareholders for its ongoing operations
Sections 1, 2, and 3. (e.g.,
financial projections,
other customers)
BMS has outlined their operating
plan throughout the business plan
The impact of controlling the corporation
on each municipality’s financial viability Section 1 : Key Financial
Goals
Discussed briefly but not in direct
relation to municipal financial
forecasts / budgets
The Alberta Municipal Government Act outlines twelve requirements of business plans for
Municipally Controlled Corporations.

9
Business Plan Review
MGA MCC Business Plan
Requirements
Addressed by BMS
Business Plan
(June 2019 version)
Location in BMS
Business PlanComments
In the case of a corporation that intends
to provide utility services, a projected
rate structure Schedule D: Fees
A sufficient rate structure is
included
A market impact analysis if municipal
control of the corporation would result in
competition with similar services
provided by the private sector
Section 1: The Market
Section 1: The
Competition
Highlights Competitors’ Strengths
and Market Advantage, but a
thorough MIA is not evident
Cashflow Projections for Next 3 Years of
MCC Operation
Five Year Business Plan
(2019-2023) Scenario
Summary in Appendix
Cashflow projections for 2019-
2023 have been included
Costs relating to establishing the MCC Not included
No discussion around costs
directly related to establishing the
MCC
The value of assets that are to be transferred to the MCC
Schedule B – 3
Schedule B – 4
The value of assets have been
outlined in detail
Financial statements for operating and capital budgets
Table 1.1 Summarized
operating results (2014-
2018)
Table 1.2 Net Capital
Expenditures (2014-2018)
Schedule B – 3 (2019-
2023) 5 Year Capital
Program
BMS provides financial statements
within the business plan
The Alberta Municipal Government Act outlines twelve requirements of business plans for
Municipally Controlled Corporations.

10
Financial Objectives – Commentary
The financial objectives from the BMS Strategic Plan Roadmap are:
No single customer providing more than 35%
of total revenues by 20221
MNP Comments:
Based on the projected revenue streams (slide 30), BMS’s
largest customer, the City of Edmonton will be providing
30% of total revenues in 2022.
Regional landfill revenue being no more than
60% of total revenue by 2022
MNP Comments:
BMS will have to adjust their practices to achieve this goal.
Management is aware of the importance for diversifying
their revenue streams to encourage greater long-term
sustainability and resiliency to changing market forces.
Minimum annual surplus distribution to
members of $2 million (with goal to increase)
MNP Comments:
BMS has projected $2 million in surplus distribution for
2020, $3 million for 2021, $3.5 million for 2022 and 2023.
Continued subsidy of local waste
management services
MNP Comments:
The business plan explains that from 2019-2023 rates to
local residents and to member municipalities, will not
change. BMS has held general disposal rates at current
levels in the 5 year financial projections.
3 4
2

11
Corporate & Governance Structure
Review and commentary on the proposed corporate structure and
cost/profit sharing of the MCC
Analysis of the appropriateness of the proposed governance
structure given the needs and characteristics of the shareholders

13
Corporate Structure
Key Points
MGA s.75.3 states: “If there is a proposed material change to the
business operations, including a change to its governance structure
or the types of services offered, the council must notify the
residents of the proposals and provide an opportunity for residents
to make representations. MGA s.75.3
In the MCCR s.7, a material change is further defined as: “the
information needed to be made available to the residents,
associated timelines, and the engagement and reporting
processes.”
• MNP Comment: This item should be codified in BMS Policy to
ensure that residents and Council have the ability to review any
proposed material changes to the MCC
Municipal controlled corporations are regulated by the Municipal
Government Act, Business Corporations Act, Control of
Corporations Regulation, and the Debt Limit Regulation.
• MNP Comment: Brownlee, LLP, a reputable Edmonton law-firm, is
preparing MCC related legal documentation such that it is
established in good-standing relative to all relevant regulations
BMSMCC and General Partner of
the Limited Partnership
“Municipalities” Limited Partnership
CommissionFor Employee / Pension
Needs
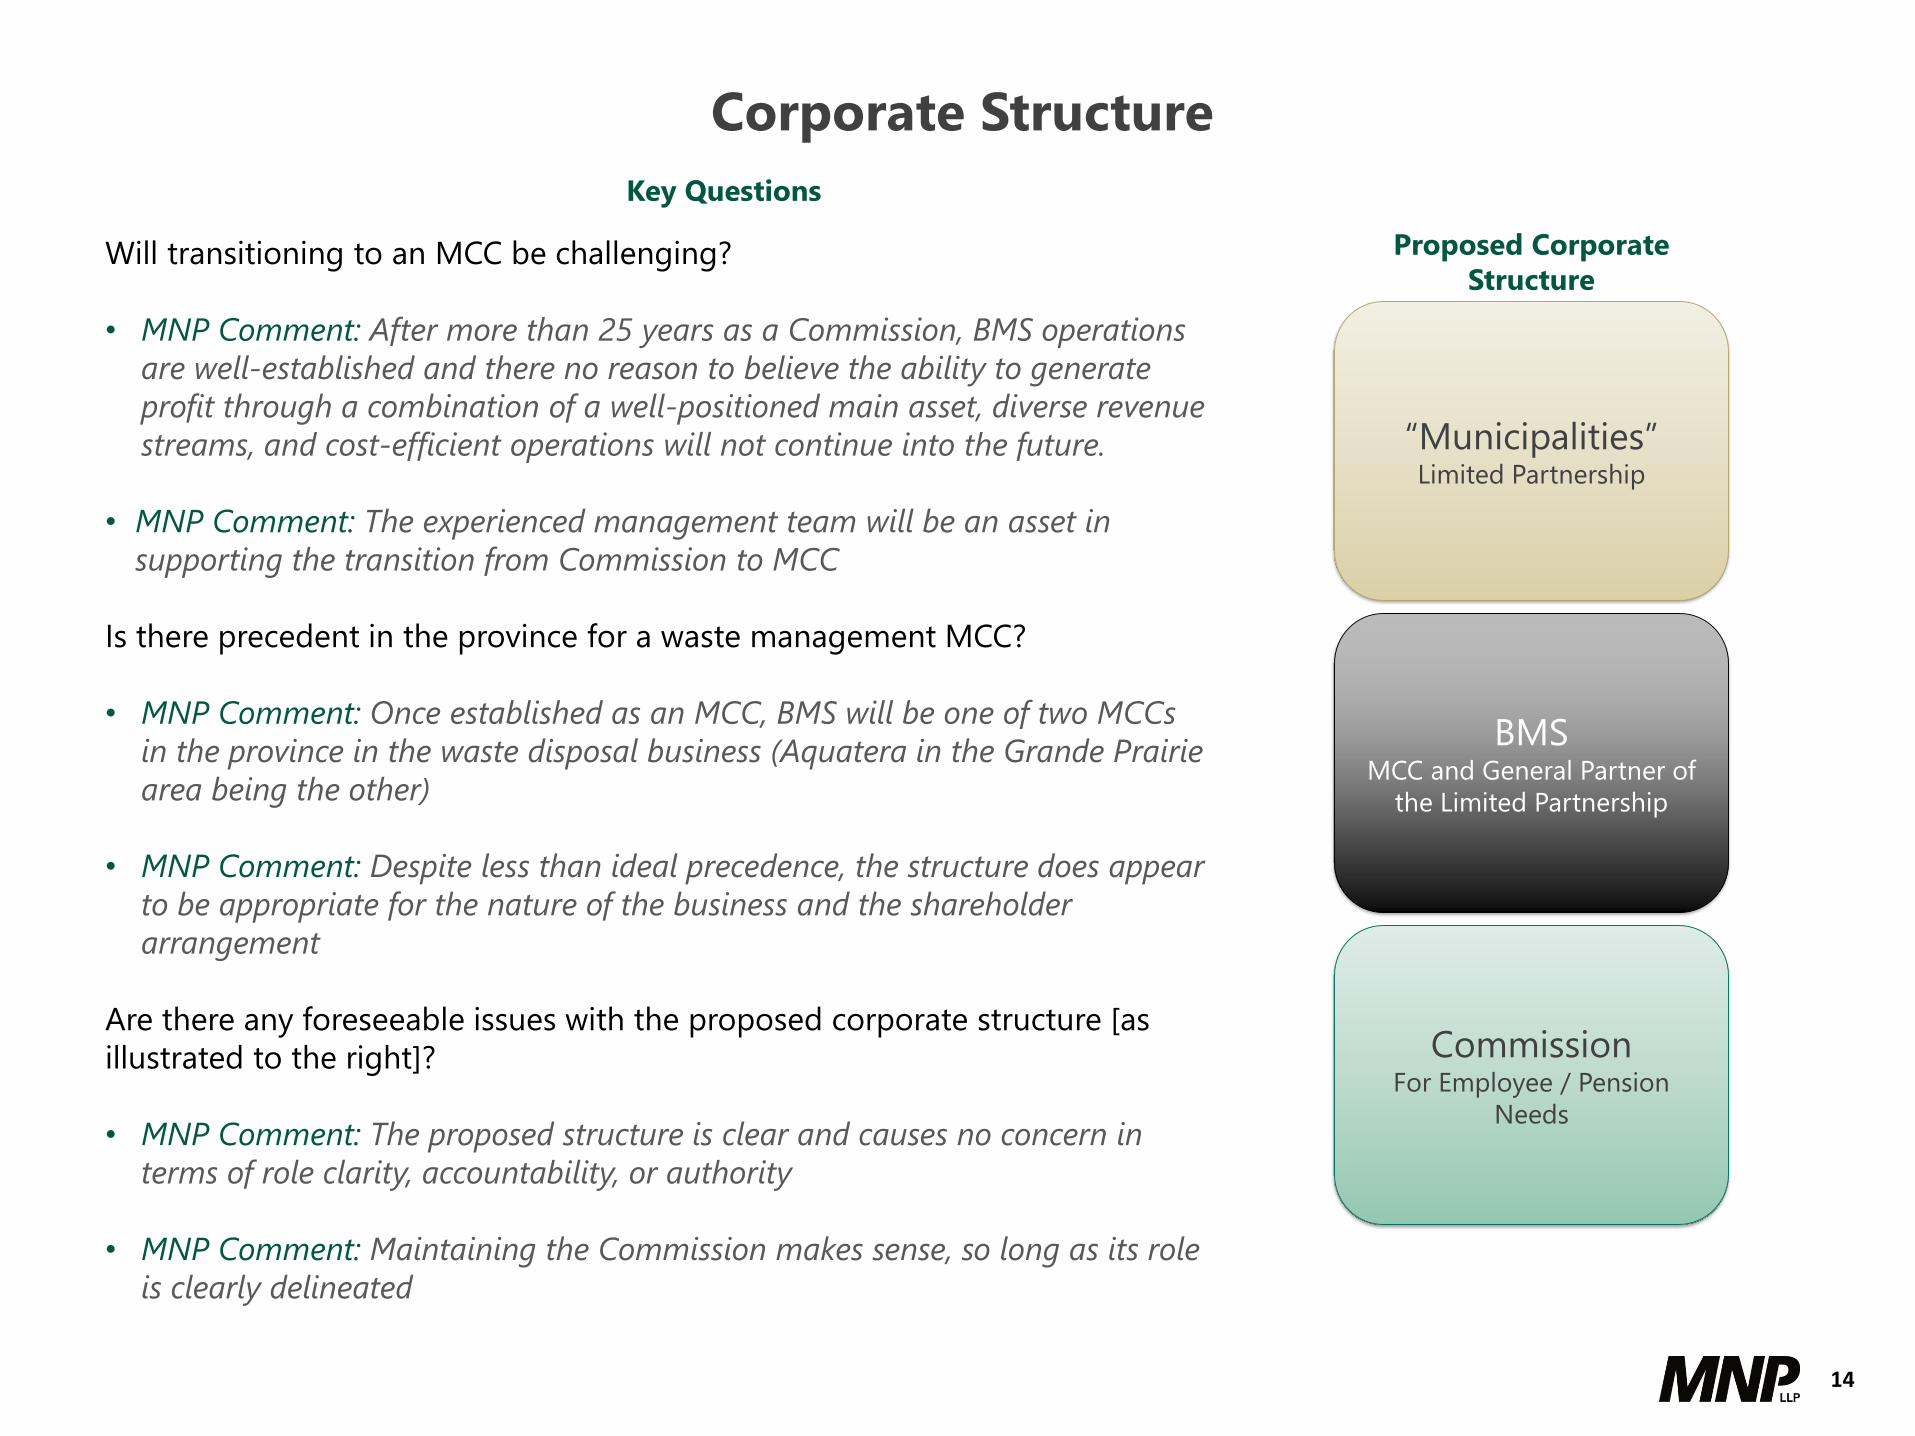
Proposed Corporate
Structure
14
Corporate Structure
Key Questions
BMSMCC and General Partner of
the Limited Partnership
“Municipalities” Limited Partnership
CommissionFor Employee / Pension
Needs
Proposed Corporate
StructureWill transitioning to an MCC be challenging?
• MNP Comment: After more than 25 years as a Commission, BMS operations
are well-established and there no reason to believe the ability to generate
profit through a combination of a well-positioned main asset, diverse revenue
streams, and cost-efficient operations will not continue into the future.
• MNP Comment: The experienced management team will be an asset in
supporting the transition from Commission to MCC
Is there precedent in the province for a waste management MCC?
• MNP Comment: Once established as an MCC, BMS will be one of two MCCs
in the province in the waste disposal business (Aquatera in the Grande Prairie
area being the other)
• MNP Comment: Despite less than ideal precedence, the structure does appear
to be appropriate for the nature of the business and the shareholder
arrangement
Are there any foreseeable issues with the proposed corporate structure [as
illustrated to the right]?
• MNP Comment: The proposed structure is clear and causes no concern in
terms of role clarity, accountability, or authority
• MNP Comment: Maintaining the Commission makes sense, so long as its role
is clearly delineated
16
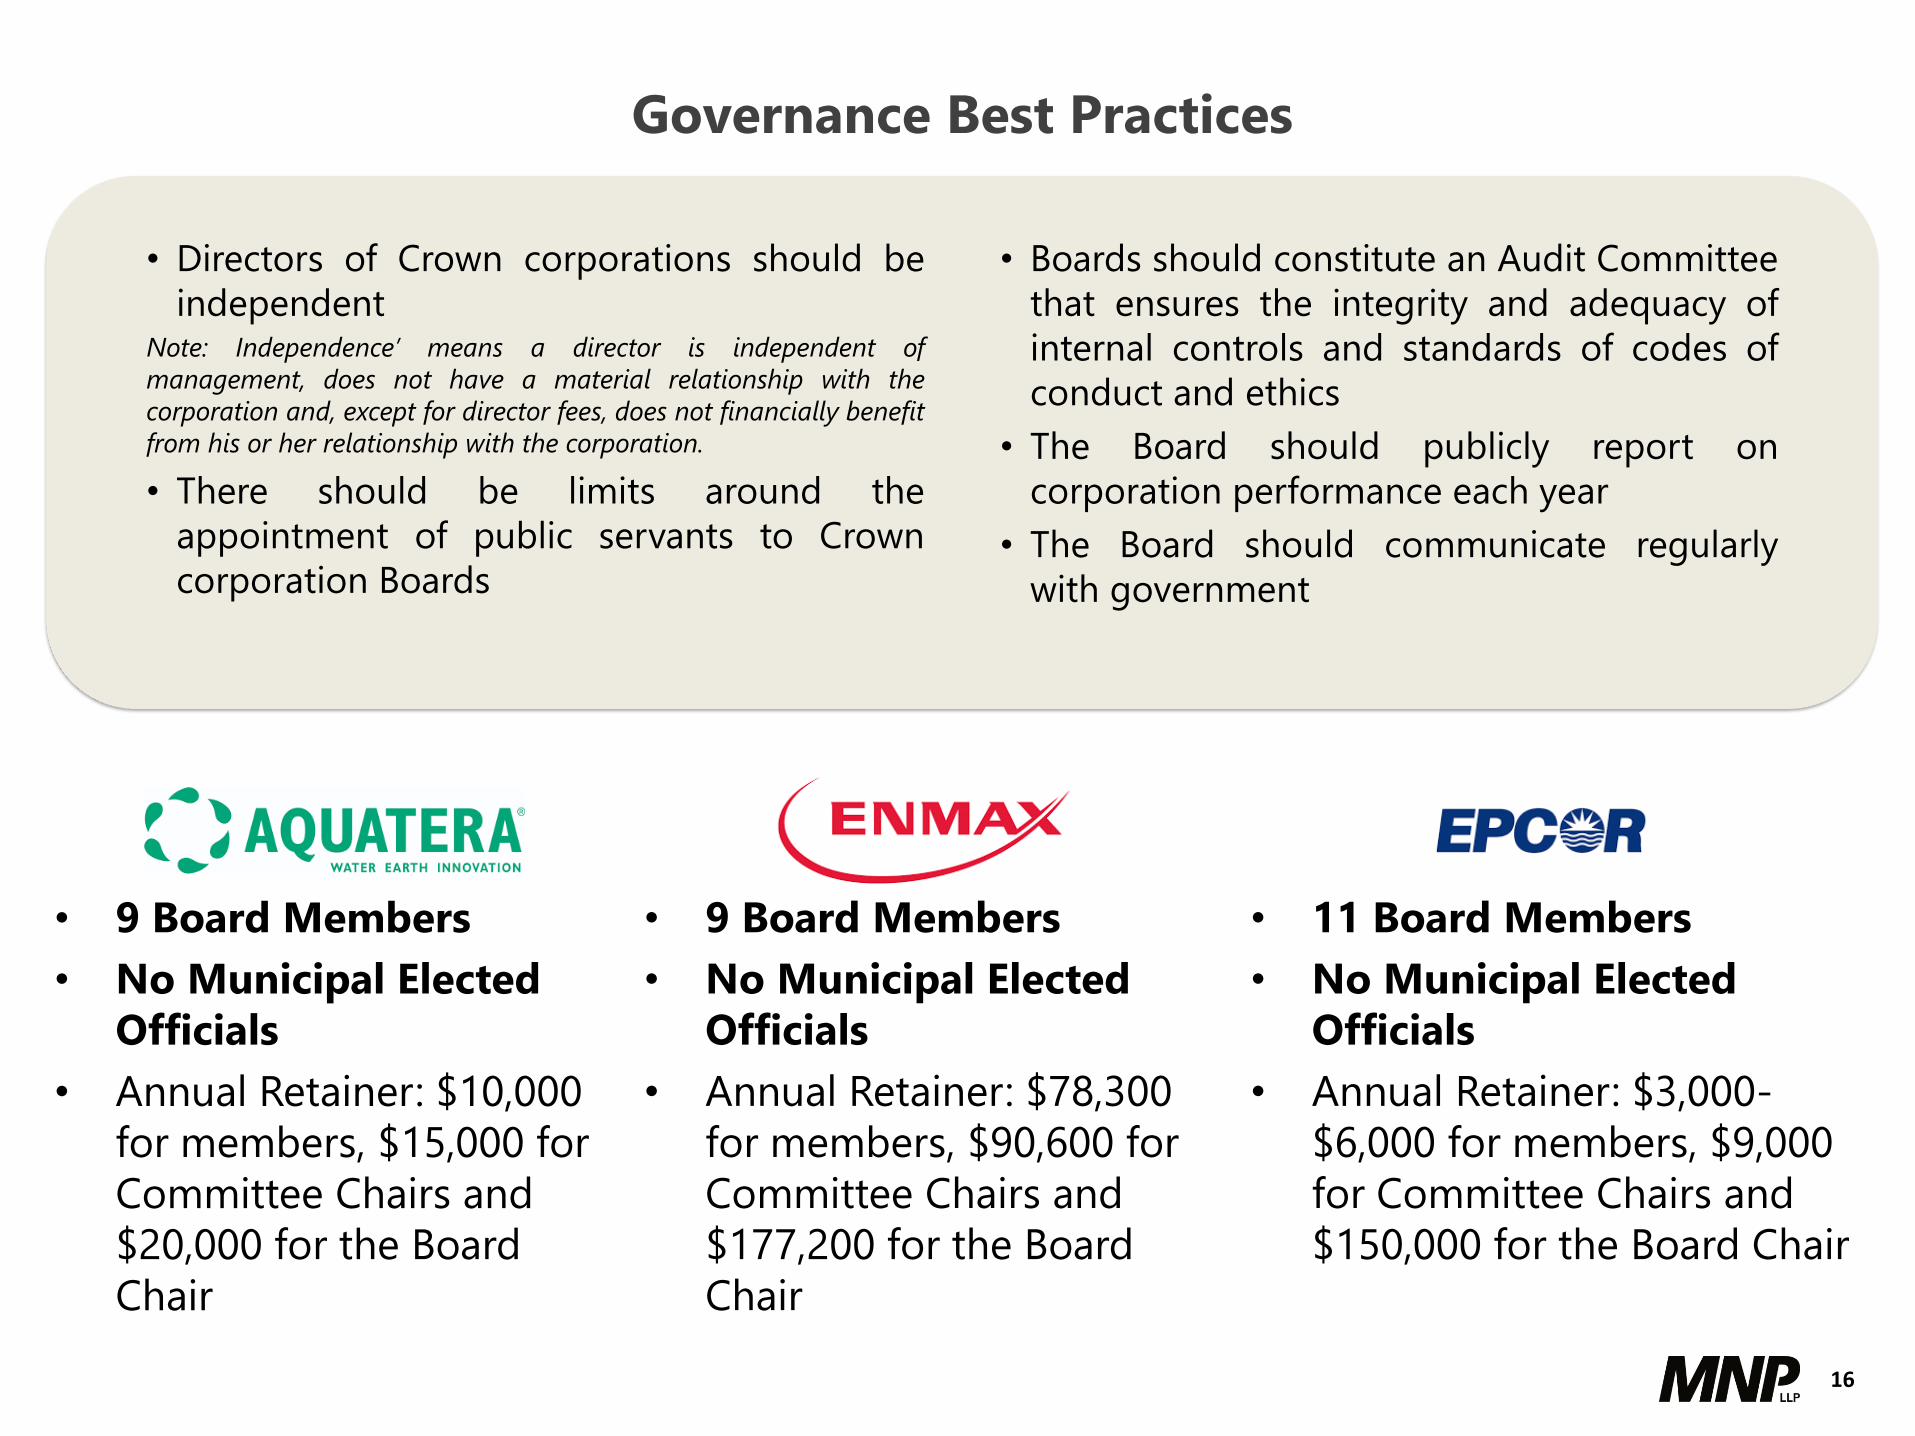
Governance Best Practices
• Directors of Crown corporations should be
independentNote: Independence’ means a director is independent of
management, does not have a material relationship with the
corporation and, except for director fees, does not financially benefit
from his or her relationship with the corporation.
• There should be limits around the
appointment of public servants to Crown
corporation Boards
• Boards should constitute an Audit Committee
that ensures the integrity and adequacy of
internal controls and standards of codes of
conduct and ethics
• The Board should publicly report on
corporation performance each year
• The Board should communicate regularly
with government
• 9 Board Members
• No Municipal Elected
Officials
• Annual Retainer: $10,000
for members, $15,000 for
Committee Chairs and
$20,000 for the Board
Chair
• 9 Board Members
• No Municipal Elected
Officials
• Annual Retainer: $78,300
for members, $90,600 for
Committee Chairs and
$177,200 for the Board
Chair
• 11 Board Members
• No Municipal Elected
Officials
• Annual Retainer: $3,000-
$6,000 for members, $9,000
for Committee Chairs and
$150,000 for the Board Chair
19
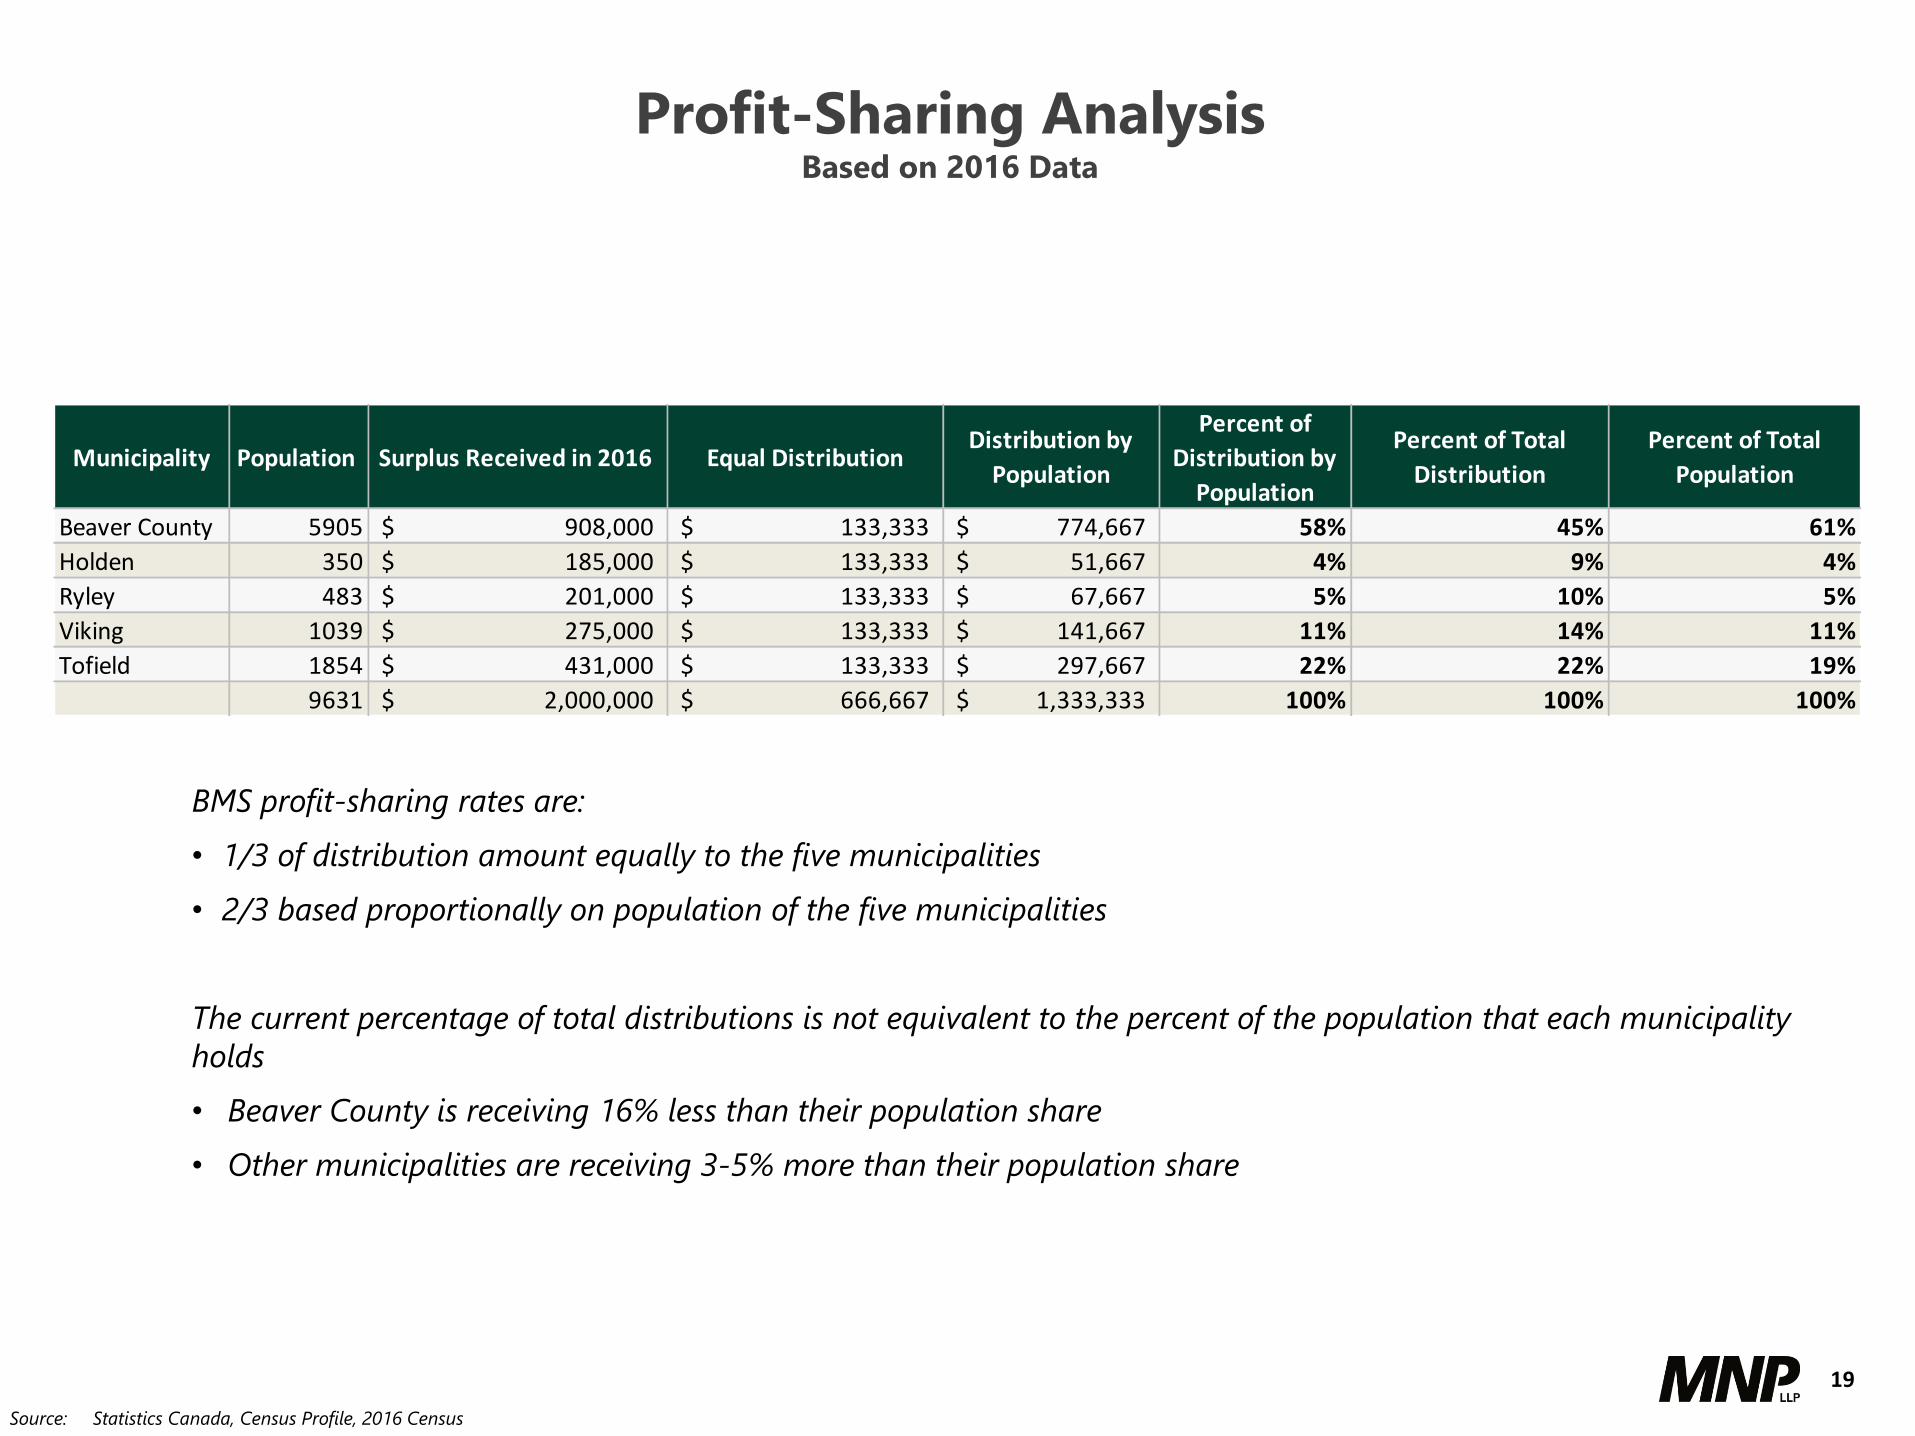
Profit-Sharing AnalysisBased on 2016 Data
BMS profit-sharing rates are:
• 1/3 of distribution amount equally to the five municipalities
• 2/3 based proportionally on population of the five municipalities
The current percentage of total distributions is not equivalent to the percent of the population that each municipality
holds
• Beaver County is receiving 16% less than their population share
• Other municipalities are receiving 3-5% more than their population share
Source: Statistics Canada, Census Profile, 2016 Census
Municipality Population Surplus Received in 2016 Equal DistributionDistribution by
Population
Percent of
Distribution by
Population
Percent of Total
Distribution
Percent of Total
Population
Beaver County 5905 908,000$ 133,333$ 774,667$ 58% 45% 61%
Holden 350 185,000$ 133,333$ 51,667$ 4% 9% 4%
Ryley 483 201,000$ 133,333$ 67,667$ 5% 10% 5%
Viking 1039 275,000$ 133,333$ 141,667$ 11% 14% 11%
Tofield 1854 431,000$ 133,333$ 297,667$ 22% 22% 19%
9631 2,000,000$ 666,667$ 1,333,333$ 100% 100% 100%

20
Market Landscape
Review and commentary on the market landscape including existing
and potential customers and competitors.

22
Waste Supply
• Despite the trends towards waste diversion initiatives, landfills will still be
needed to manage the high supply of waste.
• The City of Edmonton’s landfill waste supply is predicted to decrease upon
the operations of Enerkem Biofuels and the Anaerobic Digestion Facility,
but increasing construction within the area will help to maintain waste
supply.
Sources: Statistics Canada
The Conference Board of Canada
Neil Burkard, City of Edmonton
Government of Canada
Environment and Climate change Canada
IBIS World Report Waste Treatment & Disposal Services in Canada, Nathaniel. August 2018.
Alberta generated 4.2 million tonnes of waste in 2016
• The average Canadian produces 720 kg of waste annually
Industry waste volumes are increasing
• Consumer spending and consumption, residential construction, and population are key drivers
The City of Edmonton is failing to reach residential waste diversion targets
• In 2017 the single unit residential diversion rate was 39%, they are aiming to achieve 80% diversion by 2022
There is a current halt on waste diversion efforts from the City of Edmonton
• Enerkem Biofuels and the Anaerobic Digestion Facility are still in commissioning
• The City of Edmonton’s composting facility is closed for renovations
In 2016 86% of plastics in Canada were landfilled
• The Government of Canada is aiming to divert 75% of plastic waste by 2030

26
Key Market Advantages and Risks of BMS
Advantages
BMS is primely located to two main highways as well
as a major rail line. This allows them access to large
waste suppliers such as the City of Edmonton, Town of
Vermilion, and potential new opportunities with
distant customers such as the greater Vancouver area.
BMS’s landfill is approximately one hour away from
the City of Edmonton, and has established relations
with the municipality as well as secured contracts for
their waste supply. BMS is the City of Edmonton’s
primarily waste disposal facility.
BMS offers competitive rates and additional waste
hauling services which allows them to secure large,
long-term contracts.
BMS’s landfill has a potential 136 year lifespan from
2019, this would rely on neighbouring lands owned
by BMS to be utilized.
Risks
BMS currently relies heavily on the City of Edmonton for
their waste supply (61%). This poses a risk for future
operations as BMS is receiving this waste on a contract to
contract basis.
The five year projections developed are speculative and
rely on the assumptions that customers such as the City
of Edmonton will continue to use BMS’s services for both
municipal solid waste and construction waste. [see
Financial Projections section]
Management is actively seeking to mitigate these risks
and has strategies in places that will promote resiliency
and diversification of clients and services.

27
Financial Analysis
Review and commentary on the financial projections

30
Projected Revenue Streams
Analysis of Reasonability
City of Edmonton (MSW & Hauling)
• Projections are based on existing CoE Disposal Contract (to 2027) tonnages
and historical figures multiplied by average unit price
• Appears to be a conservative estimate given state of CoE capacity
• Excludes existing Hauling Contract (zero margin)
Contaminated Soil
• Projections are based on historical figures and include some variability to
reflect general volatility evident over the years
• Expecting more LRT construction in near-term to maintain / increase levels
Construction & Demolition (new)
• Facility west of Edmonton is gradually shutting down
• Increasing revenue based on BMS capturing this business
Special Waste
• Includes hydrovac, chemical industrial, non-hazardous, asbestos
• Estimates appears to be reasonably conservative given limited number of
facilities that can handle this type of waste
Other MSW
• Held at historical levels but with anticipated bump in 2022 from GFL
• Otherwise only includes existing non-CoE MSW (Parkland, Vermilion, etc.)
New
• Based on ability to capture alternative daily cover from CoE (i.e., waste
diversion), new MSW (e.g., Strathcona County), new C&D, Waste Connections
• Excludes potential Vancouver rail waste
$2.3MM $2.3MM $2.5MM $3.0MM $3.0MM2019-23:
$1.6MM $1.5MM $2.0MM $2.0MM $2.0MM2019-23:
$0.4MM $1.5MM $2.3MM $2.3MM $2.3MM2019-23:
$10.8MM $9.4MM $7.9MM $6.4MM $6.5MM2019-23:
$1.3MM $3.9MM $3.9MM $4.2MM $4.5MM2019-23:
$2.2MM $2.2MM $2.2MM $3.2MM $3.2MM2019-23:
Absolutely Reasonable
Fairly Reasonable
Somewhat Reasonable
Marginally Reasonable
Not Reasonable
Legend:

BMS Historical Performance
2014 2015 2016 2017 2018
Wage to
Revenue15.53% 23.93% 25.09% 30.38% 31.25%
Operating
Profit
Margin
64.16% 57.45% 56.93% 51.40% 49.41%
Net Profit
Margin50.47% 36.71% 35.15% 26.02% 26.38%
Last 5 Years
• 30% wage to revenue appears reasonable compared to the industry average (24.8%). If this ratio continues
to increase, it should be examined more critically.
• The Operating and Net Profit margins were exceptionally high in 2014 due to high amounts of waste from
Rogers Place construction.
• Decreasing trend in Net Profit Margin is a concern whether or not BMS operates as a MCC or a Commission.
31

BMS AquateraWaste
Management
Chestermere
Utilities Inc.
Prince
Albert
Utilities
Industry
Average
Wage to
Revenue31.25% 21.62% 24.54% 16.45% 24.57% 24.80%
Operating
Profit
Margin49.41% 32.95% 28.24% 13.15% 29.01% 17.88%
Net Profit
Margin26.38% 24.93% 12.89% -5.12% 8.44% 4.92%
Benchmarking Performance
2018 - Comparable Ratios (Solid Waste and Landfill Divisions ONLY)
• In most areas, BMS is leading its competitors
• The only area of concern is the comparably high Wage to Revenue ratio (which is not unreasonable compared to
industry averages).
• BMS exhibits a healthy Net Profit ratio32

33
Benchmarking Executive Compensation
MNP: Executive compensation for Waste, Refuse and Recycling companies ($20 Million Revenue Cap)
BMS: Executive compensation for Waste, Refuse and Recycling (Internal and Peers)
• As can be seen, the research into peers from both BMS and MNP match quite closely
• Both BMS and MNP Industry research show an average salary higher than what is currently being paid out at an executive
level at BMS
• While the wage to revenue ratio is quite high, compensation is not the source of that issue, and could be raised to be more
in line with Industry average
Additional Survey Data
Planning Date
of Data
Position Title
from ERI P40 P50 P60 Average P40 P50 P60 Average # of Incumbents (range)
08-19-19 CEO $ 211,521 $ 235,345 $ 266,368 $ 238,038 $ 230,484 $ 256,462 $ 290,285 $ 259,368 35 - 59
08-19-19 CFO $ 147,925 $ 163,236 $ 183,475 $ 165,196 $ 167,518 $ 185,176 $ 208,243 $ 187,358 20 -34
08-19-19 COO 169,490$ 190,268$ 212,305$ 188,055$ 183,357$ 203,510$ 229,781$ 205,880$ 35 - 59
Position Inforamtion Base Salary Total Cash
34
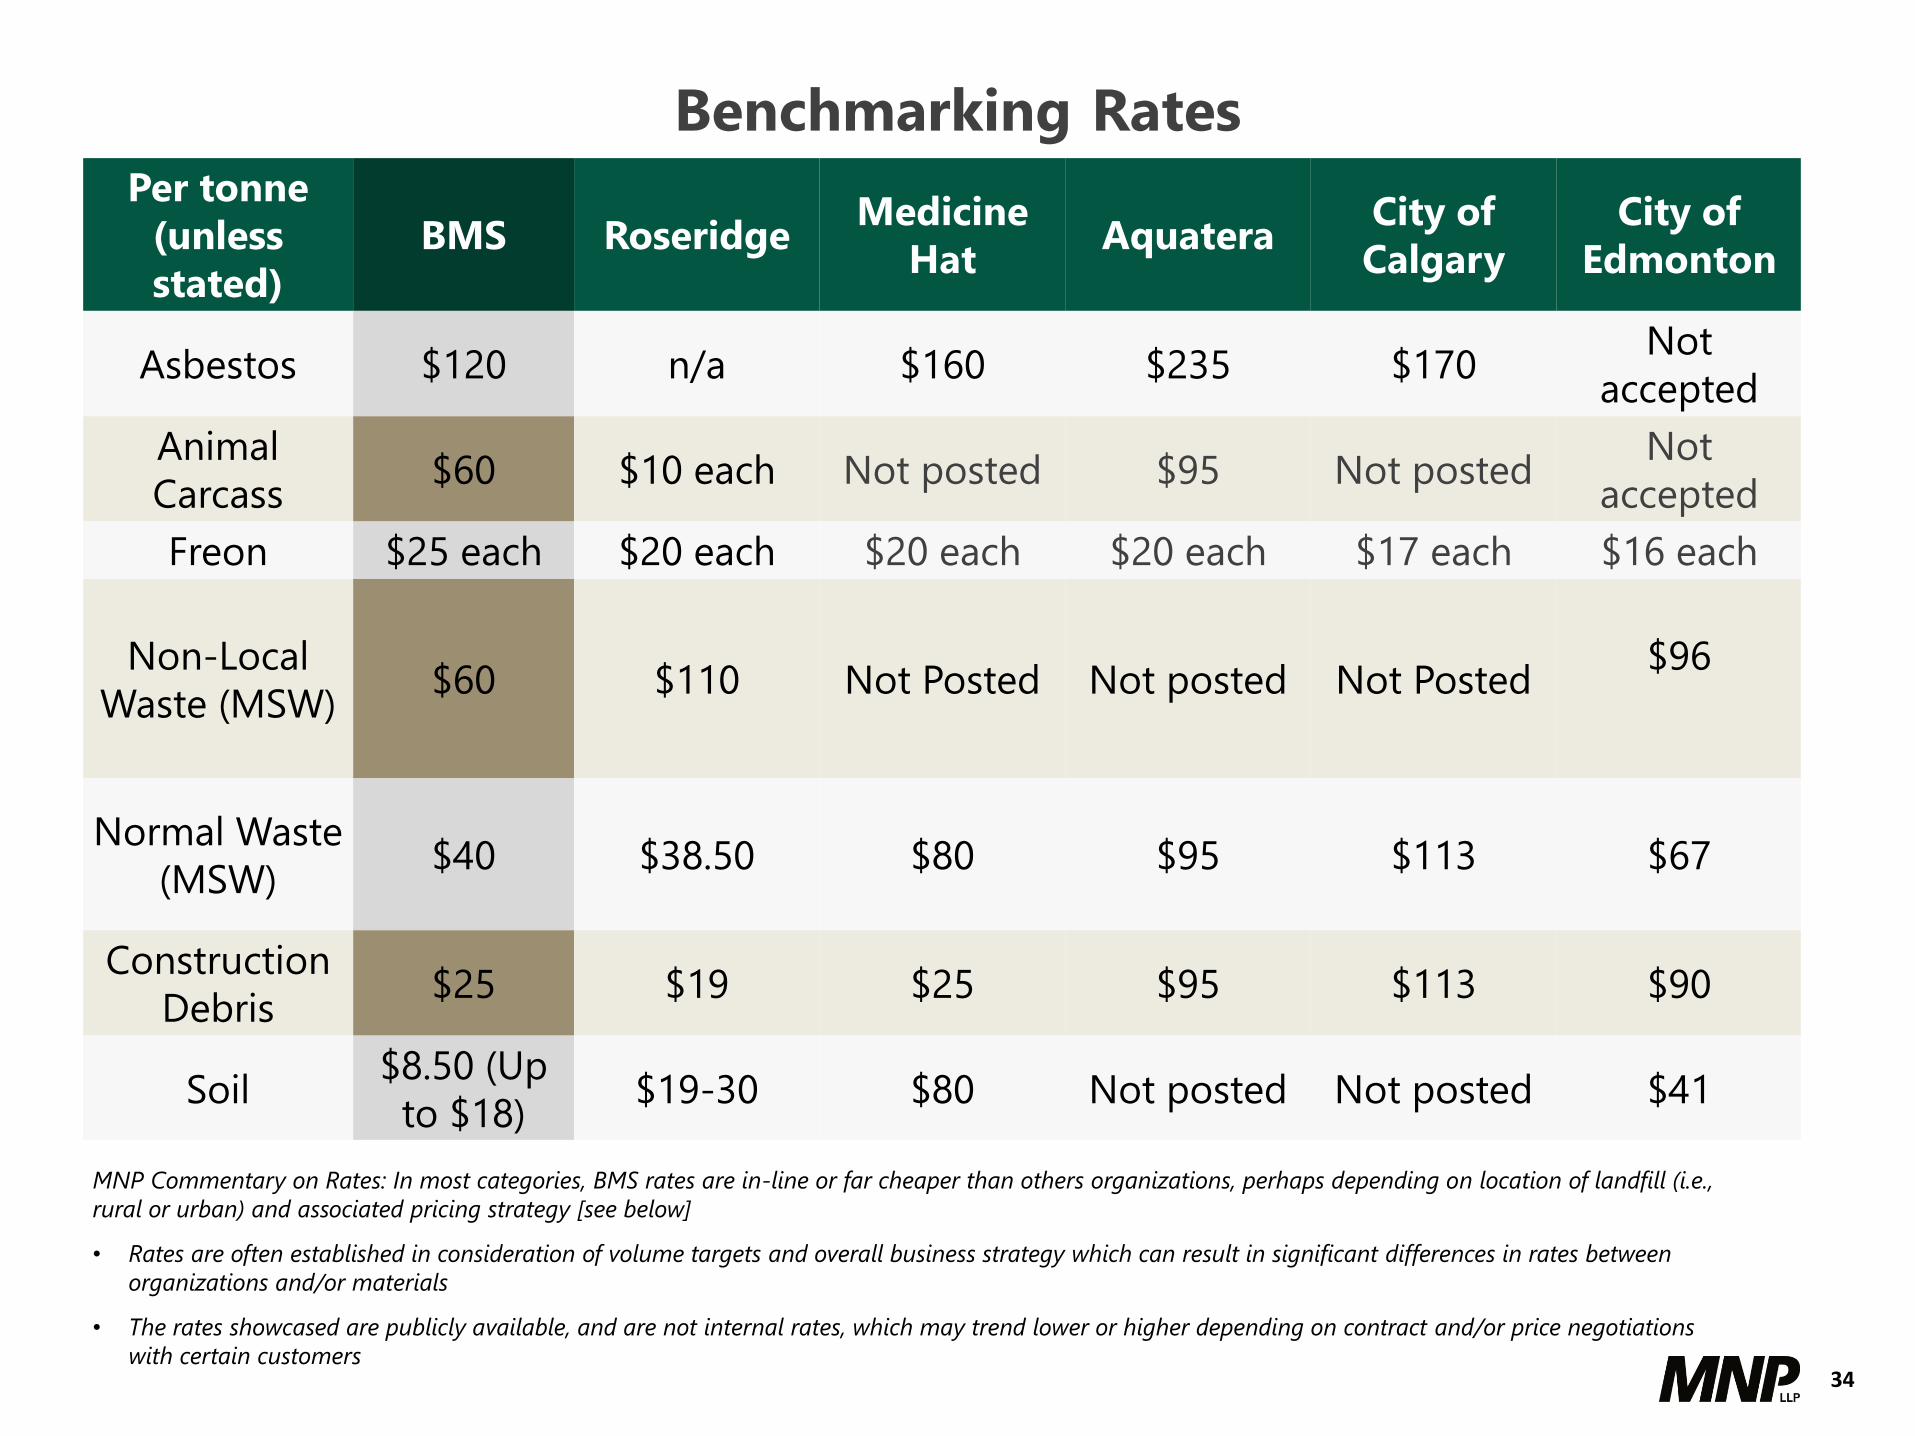
Per tonne
(unless
stated)
BMS RoseridgeMedicine
HatAquatera
City of
Calgary
City of
Edmonton
Asbestos $120 n/a $160 $235 $170Not
accepted
Animal
Carcass$60 $10 each Not posted $95 Not posted
Not
accepted
Freon $25 each $20 each $20 each $20 each $17 each $16 each
Non-Local
Waste (MSW)$60 $110 Not Posted Not posted Not Posted
$96
Normal Waste
(MSW)$40 $38.50 $80 $95 $113 $67
Construction
Debris$25 $19 $25 $95 $113 $90
Soil$8.50 (Up
to $18)$19-30 $80 Not posted Not posted $41
MNP Commentary on Rates: In most categories, BMS rates are in-line or far cheaper than others organizations, perhaps depending on location of landfill (i.e.,
rural or urban) and associated pricing strategy [see below]
• Rates are often established in consideration of volume targets and overall business strategy which can result in significant differences in rates between
organizations and/or materials
• The rates showcased are publicly available, and are not internal rates, which may trend lower or higher depending on contract and/or price negotiations
with certain customers
Benchmarking Rates

35
Pricing Analysis
Determine an accurate value of the Beaver Regional Landfill

38
Some of the changes and assumptions that were made to the original forecast include but
are not limited to:
• Carbon Competitiveness Investment Regulation Payments (CCIR) have been included to
reflect the potential amounts that will be paid out
• Capital Expenditures do not reflect another cycle of significant spending after the five-
year cycle but assumes a consistent capex
• Working capital provided by management has been replaced to reflect industry
standards working capital
• We understand the operation is tax exempt under section 149 of the income tax act. But
a corporate tax impact would decrease the value by approximately $19.4 million
• Terminal value assumes a stabilized level of operating cash flow
• We have applied the DCF methodology on an enterprise basis, based on management’s
projections
Assumptions

41
2019 2020 2021 2022 2023
Revenues
Disposal Contract 1 11,713,200 10,303,210 8,854,584 7,366,557 7,464,215
Disposal Contract 2 2,211,520 2,211,520 2,211,520 3,158,020 3,158,020
Dispsoal Revenue 1,585,000 1,500,000 2,000,000 2,000,000 2,000,000
Dispsoal Revenue 2 2,331,000 2,331,000 2,500,000 3,000,000 3,000,000
Disposal Revenue 3 1,253,232 3,892,918 3,928,000 4,215,622 4,518,050
Wastewater - - - - -
Others 2,971,568 2,972,000 2,972,000 2,972,000 2,972,000
New 374,480 1,500,000 2,250,000 2,250,000 2,250,000
Total revenues 22,440,000$ 24,710,648$ 24,716,104$ 24,962,199$ 25,362,286$
Operating expenses (11,240,000) (12,320,967) (12,326,298) (12,386,415) (12,435,547)
(operating expenses as a % of revenue) 50% 50% 50% 50% 49%
Operating Income 11,200,000 12,389,681 12,389,806 12,575,784 12,926,738
(operating income as a % of revenue) 50% 50% 50% 50% 51%
Depreciation - sustaining projects (2,090,271) (2,343,608) (2,405,833) (2,109,468) (2,362,791)
Amortization (airspace) & closure (2,590,804) (2,689,080) (2,755,793) (2,963,043) (2,985,496)
Depreciation - business growth projects (349,725) (841,223) (840,800) (863,105) (885,671)
Depreciation - Total (5,030,800) (5,873,911) (6,002,426) (5,935,616) (6,233,958)
(depreciation as a % of revenue) 22% 24% 24% 24% 25%
Net Income 6,169,200$ 6,515,770$ 6,387,380$ 6,640,168$ 6,692,780$
(net income as a % of revenue) 27% 26% 26% 27% 26%
Net Income 6,169,200 6,515,770 6,387,380 6,640,168 6,692,780
Adjustments
Depreciation - Total 5,030,800 5,873,911 6,002,426 5,935,616 6,233,958
Adjusted EBITDA 11,200,000$ 12,389,681$ 12,389,806$ 12,575,784$ 12,926,738$
(EBITDA as a % of revenue) 50% 50% 50% 50% 51%
Projected
• This slide reflects the items from projected revenue to Net income and is then adjusted to reflect the projected EBITDA
• This projected EBITDA later becomes the starting point of the DSC analysis on slide 42
Forecast (2019-2023)

42
• Slide 41 has EBITDA that reflects the amount before CCIR payments. After CCIR payments. The EBITDA for DCF purposes reflected above as CCIR
payments are not part of the operating expenses projected by the management
• Tax is shown as a line item even though it’s NIL (for visual purposes). Later we deduct Capex, one-time costs (e.g., landfill cell and admin building), post
closure costs and working capital investments. This leads to net cash flows to invested capital
• We use the discount rate to present value those cash flows. Leading to an Enterprise Value (EV) of $56m. We used +/-5% to show a range
• Further EV ranges are shown on the matrix tables in later slides
Discounted Cash Flow Analysis

43
The following table shows the projected return on capital over the next 5 years under the following scenarios:
1. Cash Flow Before Member Distribution
2. Cash Flow After Member Distribution
3. Cash Flow After Member Distribution and Corporate Taxes
Return on Invested Capital (ROIC) 2019 2020 2021 2022 2023
After-tax Cash Flows 10,641,820 11,591,921 11,269,206 11,103,884 11,383,238
Book value of equity 44,131,839 48,005,750 51,008,176 53,443,792 56,177,750
Return on Invested Capital (ROIC) - Cash flow before member distribution 24.1% 24.1% 22.1% 20.8% 20.3%
Estimated Rate of Return 12.8% 12.8% 12.8% 12.8% 12.8%
After member distribution: 2,000,000 2,000,000 3,000,000 3,500,000 3,500,000
Return on Invested Capital (ROIC) - Cash flow after member distribution 19.6% 20.0% 16.2% 14.2% 14.0%
After member distribution and corporate taxes: 2,000,000 2,000,000 3,000,000 3,500,000 3,500,000
Corporate taxes 2,870,000 3,130,000 3,040,000 3,000,000 3,070,000
Return on Invested Capital (ROIC) - Cash flow after member distibution and corporate taxes 13.1% 13.5% 10.3% 8.6% 8.6%
• Provided that there is no/before member distribution – ROIC will be the highest
• Provided that there is member distribution – ROIC will be in the middle
• Provided that there is member distribution and corporate taxes on the distribution – ROIC will be in the lowest
• Projected Book value of equity has been forecasted by the management
Return on Invested Capital (ROIC)

44
The following matrix table illustrates the impact on Enterprise Value, varying the discount rate and terminal EBITDA margin:
• Based on their current discount rate of 12.8%, BMS currently has a Present Value of Cash Flows to Invested Capital of $56,000,000 (slide 42)
• The above table identifies where BMS’s value is currently, based on the corresponding rates and margins
30% 35.0% 40.0% 45.0%
10% 47,600,000 58,100,000 68,600,000 79,200,000
11% 42,100,000 51,100,000 60,100,000 69,100,000
12% 37,700,000 45,500,000 53,200,000 61,000,000
13% 34,100,000 40,900,000 47,700,000 54,400,000
14% 31,000,000 37,000,000 43,000,000 49,000,000
15% 28,500,000 33,800,000 39,100,000 44,400,000
Dis
co
un
t R
ate
En
terp
rise
Va
lue
($)
Terminal EBITDA Margin
Matrix Analysis