Embed Size (px)
Citation preview
The Regents of the University of Colorado, a body corporate, contracting on behalfof the University of Colorado at Boulder for the benefit of INSTAAR
Beaver Damming and Palsa Dynamics in a Subarctic Mountainous Environment, Wolf Creek,Yukon Territory, CanadaAuthor(s): Antoni G. Lewkowicz and Tara L. CoultishSource: Arctic, Antarctic, and Alpine Research, Vol. 36, No. 2 (May, 2004), pp. 208-218Published by: INSTAAR, University of ColoradoStable URL: http://www.jstor.org/stable/1552163 .
Accessed: 10/06/2014 02:51
Your use of the JSTOR archive indicates your acceptance of the Terms & Conditions of Use, available at .http://www.jstor.org/page/info/about/policies/terms.jsp
.JSTOR is a not-for-profit service that helps scholars, researchers, and students discover, use, and build upon a wide range ofcontent in a trusted digital archive. We use information technology and tools to increase productivity and facilitate new formsof scholarship. For more information about JSTOR, please contact [email protected].
.
INSTAAR, University of Colorado and The Regents of the University of Colorado, a body corporate,contracting on behalf of the University of Colorado at Boulder for the benefit of INSTAAR are collaboratingwith JSTOR to digitize, preserve and extend access to Arctic, Antarctic, and Alpine Research.
http://www.jstor.org
This content downloaded from 62.122.73.248 on Tue, 10 Jun 2014 02:51:34 AMAll use subject to JSTOR Terms and Conditions
Arctic, Antarctic, and Alpine Research, Vol. 36, No. 2, 2004, pp. 208-218
Beaver Damming and Palsa Dynamics in a Subarctic Mountainous Environment, Wolf Creek, Yukon Territory, Canada
Antoni G. Lewkowicz and Tara L. Coultish
Department of Geography, University of Ottawa, Ottawa, Ontario, K1N 6N5, Canada. [email protected]
Introduction Beaver (Castor canadensis) are found throughout North America
south of the arctic treeline, on low-order streams where woody plants are available as food (Butler and Malanson, 1994; Gumell, 1998). The
population has rebounded from near-extinction at the beginning of the 20th century to an estimated 6 to 12 million individuals, approximately one-tenth of the pretrapping level (Naiman et al., 1988). Beaver are
recognized as a keystone species, strongly affecting the hydrology, vegetation and geomorphology of the regions in which they live (Butler and Malanson, 1995; Gurell, 1998). They modify habitat through the construction of dams which impound water along stream channels, create and maintain wetlands, and influence sediment transport and
deposition by decreasing stream velocity (Naiman et al., 1988; Woo and Waddington, 1990). Dams can remain active from decades to centuries and typically range from 15 to 70 m long and up to 2 m wide
(Butler and Malanson, 1995). In this paper, we explore the effects of beaver dams on palsas located at the altitudinal treeline in a mountainous catchment in the southern Yukon Territory.
Palsas are circular or oval permafrost mounds, 0.5 to 10 m in
height and >2 m in diameter (Washbur, 1983), most commonly found in areas of discontinuous permafrost. There has been considerable discussion in the literature concerning their definition (e.g., Washburn, 1983; Nelson et al., 1992; Harris, 1998). The International Permafrost Association Multi-Language Glossary defines a palsa as "a peaty permafrost mound possessing a core of alternating layers of segregated ice and peat or mineral soil material" (van Everdingen, 1998). A recent review, classifies palsas into four different types depending on the thickness of peat cover and the location of segregated ice within the mound: purely peat palsas, peat palsas, mineral-cored palsas, and mineral permafrost mounds (Gurey, 2001).
Palsas are cyclical in nature, and can be characterized as aggrading, stable, or degrading (Cummings and Pollard, 1990). Growth and decay are influenced by snow cover, peat cover, vegetation succession, and
regional climate (Kershaw and Gill, 1979; Seppaila, 1988). Of these, snow depth is generally judged to be most critical in influencing palsa inception and growth: the crests of palsas are frequently windswept in winter, allowing permafrost to aggrade (Kershaw and Gill, 1979; Cummings and Pollard, 1990; Seppala, 1990). An experiment in which snow was manually cleared from an area within a fen, for example, resulted in the growth of a 30-cm-high palsa (Seppila, 1982).
208 / ARCTIC, ANTARCTIC, AND ALPINE RESEARCH
Abstract The growth, longevity, and decay of mineral-cored palsas at an altitudinal treeline site in the southern Yukon all appear to be significantly affected by the activities of beaver
(Castor canadensis). The palsas are composed of stratified, fine-grained, organic-rich, frost-susceptible deposits, which are interpreted as originating from sedimentation in beaver ponds. Peat development, which is a precondition for mound formation, takes place in the adjacent wetland, in part due to poor drainage because of dams. Palsa degradation over the past 55 yr preferentially followed flooding due to dam construction. Drainage of
ponds by dam breach was succeeded by mound formation in aggrading permafrost. Unlike
previous studies, therefore, it is impossible to infer a clear climate signal from palsa dynamics at this location.
Widespread degradation of palsas has frequently been linked to
regional climatic amelioration. A trend towards degradation has been detected in palsa fields in northwest Canada (Kershaw and Gill, 1979; Horvath, 1998; Kershaw, 2003), easter Canada (Laberge and Payette, 1995), Norway (Matthews et al., 1997; Sollid and S0rbel, 1998), and Sweden (Zuidhoff and Kolstrup, 2000).
Despite extensive literatures on palsas and beaver, to our
knowledge this is the first paper to relate the two. The findings constitute an addition to publications on zoogeomorphology in polar and alpine regions (e.g., Price, 1971; Smith and Gardner, 1985; Hall, 1997; Hall et al., 1999) and identify an additional factor to be considered in the use of palsas as climate change indicators. A companion paper (Coultish and Lewkowicz, 2003) focuses on mound cryostratigraphy, snow
depths, and longevity, and only briefly introduces the effects of beaver
damming.
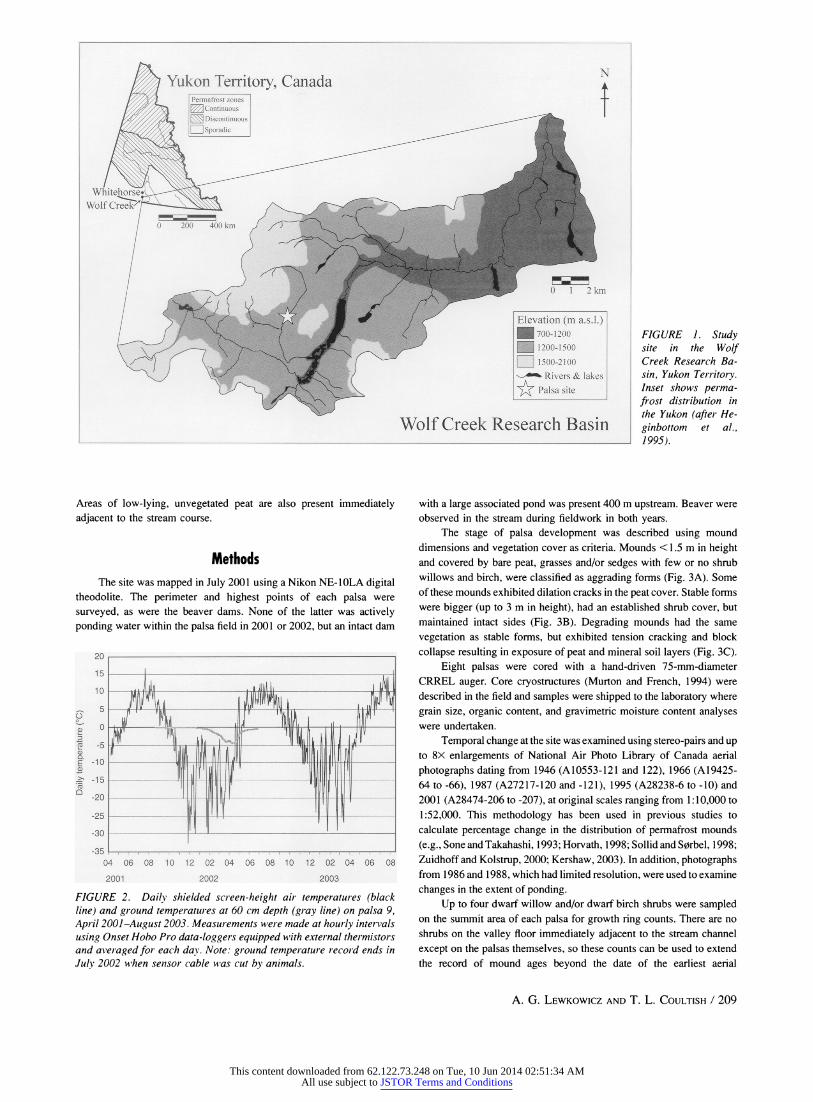
Study Site The Wolf Creek Research Basin is situated 20 to 30 km south of
Whitehorse, Yukon Territory, in the sporadic discontinuous permafrost zone (Heginbottom et al., 1995). About 40% of the basin is underlain
by permafrost (Lewkowicz and Ednie, 2004). The watershed occupies an area of 190 km2 with elevations ranging from 750 to 2080 m a.s.l. (Fig. 1). The basin has a subarctic continental climate characterized by large seasonal temperature amplitudes, low relative humidities and low
precipitation (Janowicz, 1999). The study site (60?30 N, 135?13 W) is at an elevation of 1235 m
a.s.l. in a northeast-southwest-trending U-shaped valley within the
subalpine zone. Thirty-six palsas are present within a wetland
bordering approximately 800 m of the main stream channel. Screen- height air temperatures monitored on one of them (palsa 9) from
April 2001 to August 2003 (Fig. 2) averaged -4.2?C for May 2001 to
April 2002 and -2.2?C for May 2002 to April 2003, with a mean daily range of 12?C and extreme hourly values of +25?C and -36?C. Air
temperature inversions occur in the basin in winter (Janowicz, 1999) and possibly during the growing season. They may be responsible for the inverted altitudinal treeline found at the site: white spruce (Picea glauca) are absent from the valley floor but are found scattered across the surrounding valley-side slopes. Vegetation on the valley floor includes shrub willows, shrub birches, and grass-sedge meadows, the last correlating with zones that are covered by icings in the winter.
? 2004 Regents of the University of Colorado 1523-0430/04 $7.00
This content downloaded from 62.122.73.248 on Tue, 10 Jun 2014 02:51:34 AMAll use subject to JSTOR Terms and Conditions
Yukon Territory, Canada Permafrost zones 7 Continuous
[ Discontinuous X I Sporadic
Wolf Creek Research Basin
Areas of low-lying, unvegetated peat are also present immediately adjacent to the stream course.
Methods The site was mapped in July 2001 using a Nikon NE-1OLA digital
theodolite. The perimeter and highest points of each palsa were
surveyed, as were the beaver dams. None of the latter was actively ponding water within the palsa field in 2001 or 2002, but an intact dam
20
15
10
5 o 0.
E -10
> -15 (a
-20
-25
-30
-35 0 )4 06 08 10 12 02 04 06 08 10 12 02 04 06 08
2001 2002 2003
FIGURE 2. Daily shielded screen-height air temperatures (black line) and ground temperatures at 60 cm depth (gray line) on palsa 9, April 2001-August 2003. Measurements were made at hourly intervals
using Onset Hobo Pro data-loggers equipped with external thermistors and averaged for each day. Note: ground temperature record ends in July 2002 when sensor cable was cut by animals.
FIGURE 1. Study site in the Wolf Creek Research Ba- sin, Yukon Territory. Inset shows perma- frost distribution in the Yukon (after He- ginbottom et al., 1995).
with a large associated pond was present 400 m upstream. Beaver were observed in the stream during fieldwork in both years.
The stage of palsa development was described using mound dimensions and vegetation cover as criteria. Mounds < 1.5 m in height and covered by bare peat, grasses and/or sedges with few or no shrub willows and birch, were classified as aggrading forms (Fig. 3A). Some of these mounds exhibited dilation cracks in the peat cover. Stable forms were bigger (up to 3 m in height), had an established shrub cover, but maintained intact sides (Fig. 3B). Degrading mounds had the same
vegetation as stable forms, but exhibited tension cracking and block
collapse resulting in exposure of peat and mineral soil layers (Fig. 3C).
Eight palsas were cored with a hand-driven 75-mm-diameter CRREL auger. Core cryostructures (Murton and French, 1994) were described in the field and samples were shipped to the laboratory where
grain size, organic content, and gravimetric moisture content analyses were undertaken.
Temporal change at the site was examined using stereo-pairs and up to 8x enlargements of National Air Photo Library of Canada aerial
photographs dating from 1946 (A10553-121 and 122), 1966 (A19425- 64 to -66), 1987 (A27217-120 and -121), 1995 (A28238-6 to -10) and 2001 (A28474-206 to -207), at original scales ranging from 1:10,000 to
1:52,000. This methodology has been used in previous studies to calculate percentage change in the distribution of permafrost mounds
(e.g., Sone and Takahashi, 1993; Horvath, 1998; Sollid and S0rbel, 1998; Zuidhoff and Kolstrup, 2000; Kershaw, 2003). In addition, photographs from 1986 and 1988, which had limited resolution, were used to examine
changes in the extent of ponding. Up to four dwarf willow and/or dwarf birch shrubs were sampled
on the summit area of each palsa for growth ring counts. There are no shrubs on the valley floor immediately adjacent to the stream channel
except on the palsas themselves, so these counts can be used to extend the record of mound ages beyond the date of the earliest aerial
A. G. LEWKOWICZ AND T. L. COULTISH / 209
N
T
This content downloaded from 62.122.73.248 on Tue, 10 Jun 2014 02:51:34 AMAll use subject to JSTOR Terms and Conditions
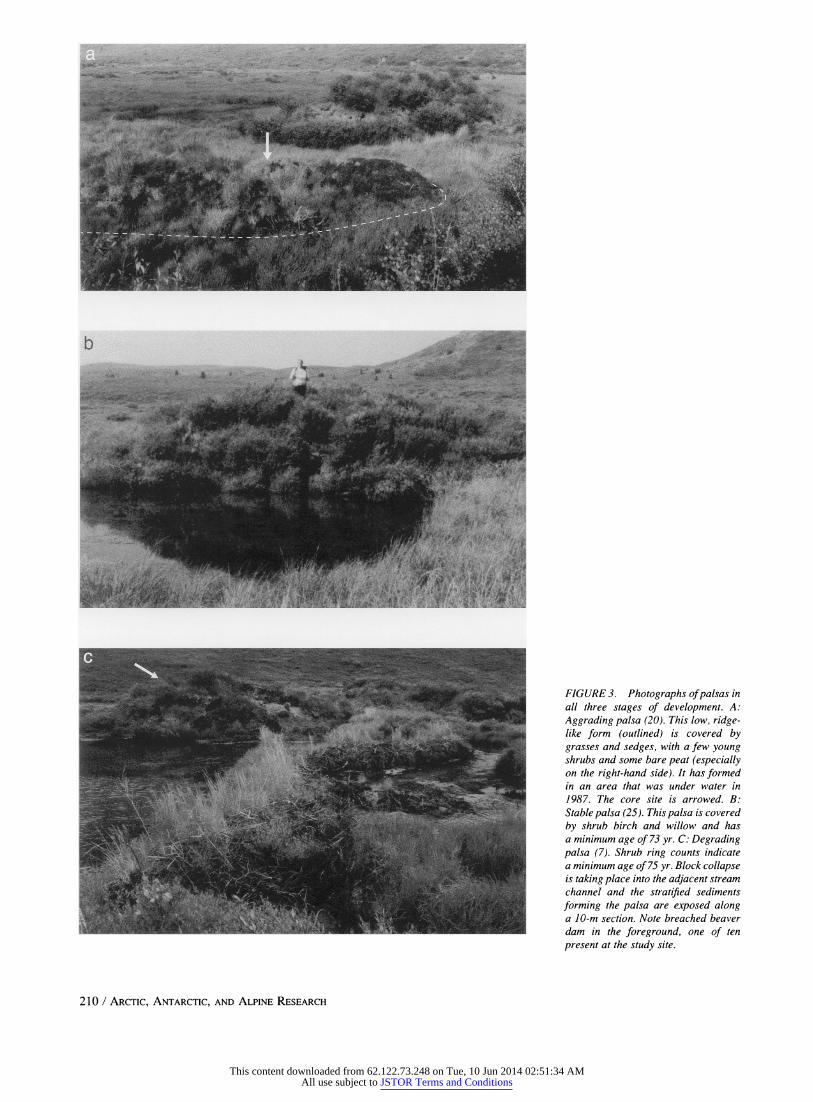
FIGURE 3. Photographs of palsas in all three stages of development. A: Aggrading palsa (20). This low, ridge- like form (outlined) is covered by grasses and sedges, with a few young shrubs and some bare peat (especially on the right-hand side). It has formed in an area that was under water in 1987. The core site is arrowed. B: Stable palsa (25). This palsa is covered by shrub birch and willow and has a minimum age of 73 yr. C: Degrading palsa (7). Shrub ring counts indicate a minimum age of 75 yr. Block collapse is taking place into the adjacent stream channel and the stratified sediments forming the palsa are exposed along a 10-m section. Note breached beaver dam in the foreground, one of ten present at the study site.
210 / ARCTIC, ANTARCTIC, AND ALPINE RESEARCH
This content downloaded from 62.122.73.248 on Tue, 10 Jun 2014 02:51:34 AMAll use subject to JSTOR Terms and Conditions
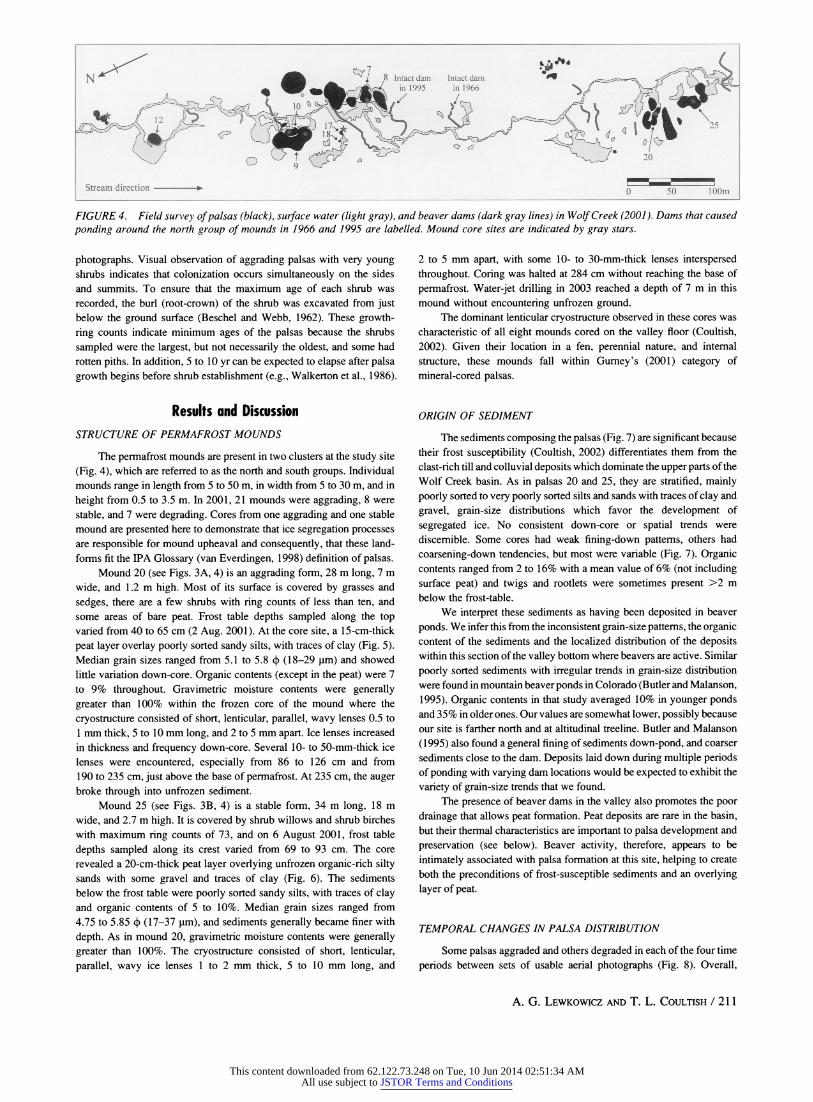
FIGURE 4. Field survey ofpalsas (black), surface water (light gray), and beaver dams (dark gray lines) in Wolf Creek (2001). Dams that caused
ponding around the north group of mounds in 1966 and 1995 are labelled. Mound core sites are indicated by gray stars.
photographs. Visual observation of aggrading palsas with very young shrubs indicates that colonization occurs simultaneously on the sides and summits. To ensure that the maximum age of each shrub was
recorded, the burl (root-crown) of the shrub was excavated from just below the ground surface (Beschel and Webb, 1962). These growth- ring counts indicate minimum ages of the palsas because the shrubs
sampled were the largest, but not necessarily the oldest, and some had rotten piths. In addition, 5 to 10 yr can be expected to elapse after palsa growth begins before shrub establishment (e.g., Walkerton et al., 1986).
Results and Discussion STRUCTURE OF PERMAFROST MOUNDS
The permafrost mounds are present in two clusters at the study site
(Fig. 4), which are referred to as the north and south groups. Individual mounds range in length from 5 to 50 m, in width from 5 to 30 m, and in
height from 0.5 to 3.5 m. In 2001, 21 mounds were aggrading, 8 were
stable, and 7 were degrading. Cores from one aggrading and one stable mound are presented here to demonstrate that ice segregation processes are responsible for mound upheaval and consequently, that these land- forms fit the IPA Glossary (van Everdingen, 1998) definition of palsas.
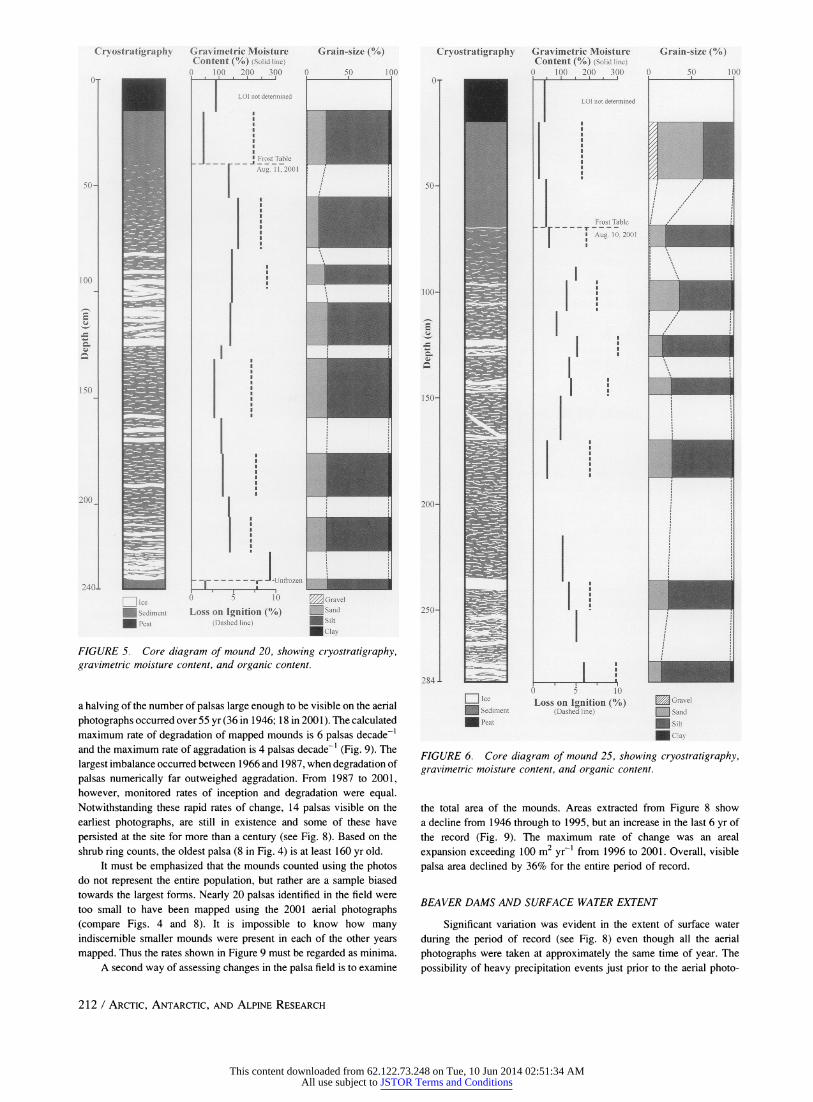
Mound 20 (see Figs. 3A, 4) is an aggrading form, 28 m long, 7 m
wide, and 1.2 m high. Most of its surface is covered by grasses and
sedges, there are a few shrubs with ring counts of less than ten, and some areas of bare peat. Frost table depths sampled along the top varied from 40 to 65 cm (2 Aug. 2001). At the core site, a 15-cm-thick
peat layer overlay poorly sorted sandy silts, with traces of clay (Fig. 5). Median grain sizes ranged from 5.1 to 5.8 ) (18-29 um) and showed little variation down-core. Organic contents (except in the peat) were 7 to 9% throughout. Gravimetric moisture contents were generally greater than 100% within the frozen core of the mound where the
cryostructure consisted of short, lenticular, parallel, wavy lenses 0.5 to 1 mm thick, 5 to 10 mm long, and 2 to 5 mm apart. Ice lenses increased in thickness and frequency down-core. Several 10- to 50-mm-thick ice lenses were encountered, especially from 86 to 126 cm and from 190 to 235 cm, just above the base of permafrost. At 235 cm, the auger broke through into unfrozen sediment.
Mound 25 (see Figs. 3B, 4) is a stable form, 34 m long, 18 m
wide, and 2.7 m high. It is covered by shrub willows and shrub birches with maximum ring counts of 73, and on 6 August 2001, frost table
depths sampled along its crest varied from 69 to 93 cm. The core revealed a 20-cm-thick peat layer overlying unfrozen organic-rich silty sands with some gravel and traces of clay (Fig. 6). The sediments below the frost table were poorly sorted sandy silts, with traces of clay and organic contents of 5 to 10%. Median grain sizes ranged from 4.75 to 5.85 4 (17-37 pm), and sediments generally became finer with
depth. As in mound 20, gravimetric moisture contents were generally greater than 100%. The cryostructure consisted of short, lenticular,
parallel, wavy ice lenses 1 to 2 mm thick, 5 to 10 mm long, and
2 to 5 mm apart, with some 10- to 30-mm-thick lenses interspersed throughout. Coring was halted at 284 cm without reaching the base of
permafrost. Water-jet drilling in 2003 reached a depth of 7 m in this mound without encountering unfrozen ground.
The dominant lenticular cryostructure observed in these cores was characteristic of all eight mounds cored on the valley floor (Coultish, 2002). Given their location in a fen, perennial nature, and internal
structure, these mounds fall within Gurney's (2001) category of mineral-cored palsas.
ORIGIN OF SEDIMENT
The sediments composing the palsas (Fig. 7) are significant because their frost susceptibility (Coultish, 2002) differentiates them from the clast-rich till and colluvial deposits which dominate the upper parts of the Wolf Creek basin. As in palsas 20 and 25, they are stratified, mainly poorly sorted to very poorly sorted silts and sands with traces of clay and
gravel, grain-size distributions which favor the development of
segregated ice. No consistent down-core or spatial trends were discernible. Some cores had weak fining-down patterns, others had
coarsening-down tendencies, but most were variable (Fig. 7). Organic contents ranged from 2 to 16% with a mean value of 6% (not including surface peat) and twigs and rootlets were sometimes present >2 m below the frost-table.
We interpret these sediments as having been deposited in beaver
ponds. We infer this from the inconsistent grain-size patterns, the organic content of the sediments and the localized distribution of the deposits within this section of the valley bottom where beavers are active. Similar
poorly sorted sediments with irregular trends in grain-size distribution were found in mountain beaver ponds in Colorado (Butler and Malanson, 1995). Organic contents in that study averaged 10% in younger ponds and 35% in older ones. Our values are somewhat lower, possibly because our site is farther north and at altitudinal treeline. Butler and Malanson
(1995) also found a general fining of sediments down-pond, and coarser sediments close to the dam. Deposits laid down during multiple periods of ponding with varying dam locations would be expected to exhibit the
variety of grain-size trends that we found. The presence of beaver dams in the valley also promotes the poor
drainage that allows peat formation. Peat deposits are rare in the basin, but their thermal characteristics are important to palsa development and
preservation (see below). Beaver activity, therefore, appears to be
intimately associated with palsa formation at this site, helping to create both the preconditions of frost-susceptible sediments and an overlying layer of peat.
TEMPORAL CHANGES IN PALSA DISTRIBUTION
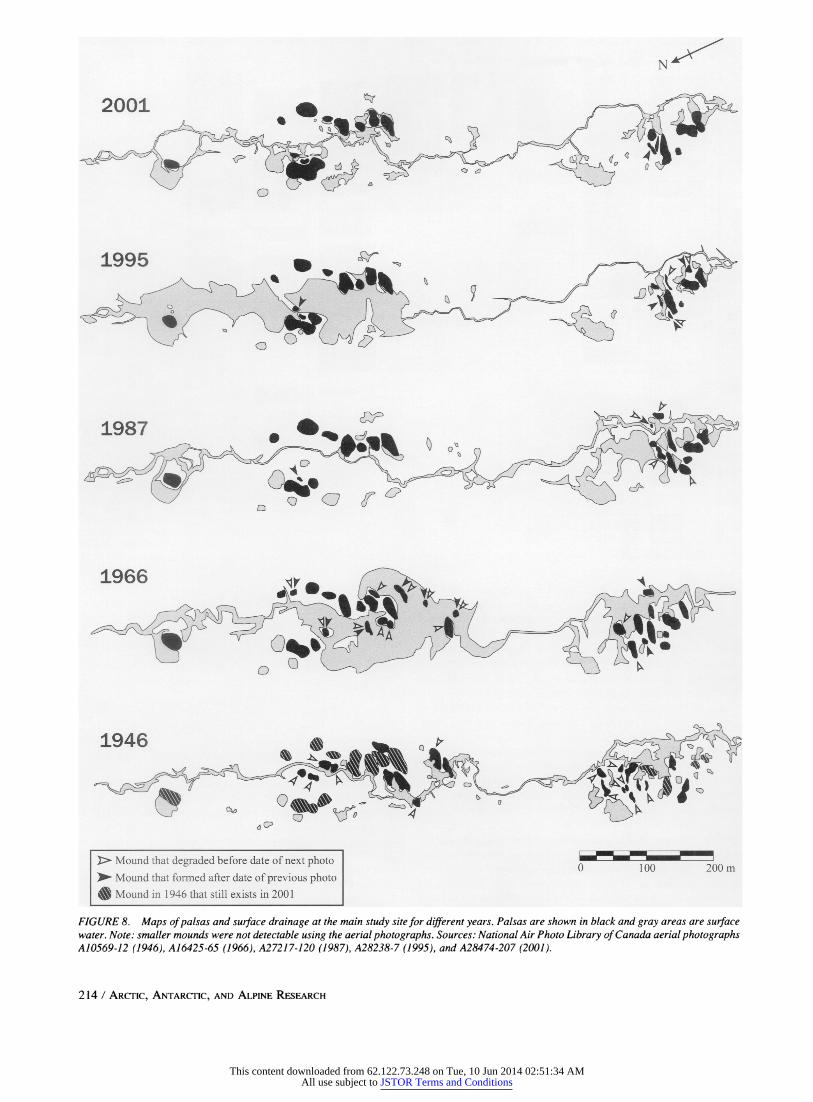
Some palsas aggraded and others degraded in each of the four time
periods between sets of usable aerial photographs (Fig. 8). Overall,
A. G. LEWKOWICZ AND T. L. COULTISH / 211
This content downloaded from 62.122.73.248 on Tue, 10 Jun 2014 02:51:34 AMAll use subject to JSTOR Terms and Conditions
Cryostratigraphy
0-
50-
100-
200 300 0 50 100
LOI not determined
Frost Table
* Aug. 10, 2001 1
I -
150- I
200-
D Ice 0 5 10o Gravel
1 Sediment Loss on Ignition (%) Sand M Peat (Dashed line) Silt
MClay
FIGURE 5. Core diagram of mound 20, showing cryostratigraphy, gravimetric moisture content, and organic content.
250-
284 -
a halving of the number of palsas large enough to be visible on the aerial
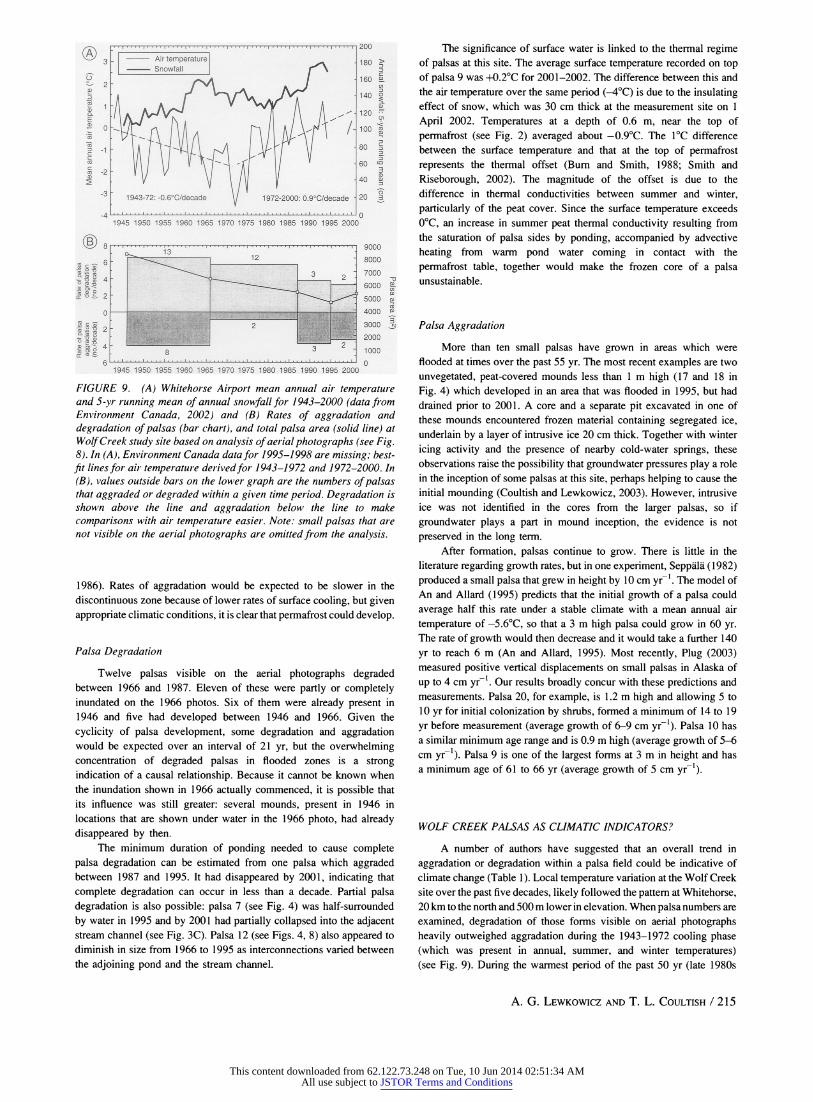
photographs occurred over 55 yr (36 in 1946; 18 in 2001). The calculated maximum rate of degradation of mapped mounds is 6 palsas decade-' and the maximum rate of aggradation is 4 palsas decade-l (Fig. 9). The
largest imbalance occurred between 1966 and 1987, when degradation of
palsas numerically far outweighed aggradation. From 1987 to 2001, however, monitored rates of inception and degradation were equal. Notwithstanding these rapid rates of change, 14 palsas visible on the earliest photographs, are still in existence and some of these have
persisted at the site for more than a century (see Fig. 8). Based on the shrub ring counts, the oldest palsa (8 in Fig. 4) is at least 160 yr old.
It must be emphasized that the mounds counted using the photos do not represent the entire population, but rather are a sample biased towards the largest forms. Nearly 20 palsas identified in the field were too small to have been mapped using the 2001 aerial photographs (compare Figs. 4 and 8). It is impossible to know how many indiscemible smaller mounds were present in each of the other years mapped. Thus the rates shown in Figure 9 must be regarded as minima.
A second way of assessing changes in the palsa field is to examine
I
I Ice Loss on Ignition (%) E Gravel * Sediment (Dashed line) Sand
Peat Silt * Clay
FIGURE 6. Core diagram of mound 25, showing cryostratigraphy, gravimetric moisture content, and organic content.
the total area of the mounds. Areas extracted from Figure 8 show a decline from 1946 through to 1995, but an increase in the last 6 yr of the record (Fig. 9). The maximum rate of change was an areal
expansion exceeding 100 m2 yr-1 from 1996 to 2001. Overall, visible
palsa area declined by 36% for the entire period of record.
BEAVER DAMS AND SURFACE WATER EXTENT
Significant variation was evident in the extent of surface water
during the period of record (see Fig. 8) even though all the aerial
photographs were taken at approximately the same time of year. The
possibility of heavy precipitation events just prior to the aerial photo-
212 / ARCTIC, ANTARCTIC, AND ALPINE RESEARCH
0-
H
50-
100
E c
150
200
240-
Cryostratigraphy Grain-size (%)
I I I I I I I I I I I
I
I I
11 II II / I Il I I
I I
I~~~~~
--
This content downloaded from 62.122.73.248 on Tue, 10 Jun 2014 02:51:34 AMAll use subject to JSTOR Terms and Conditions
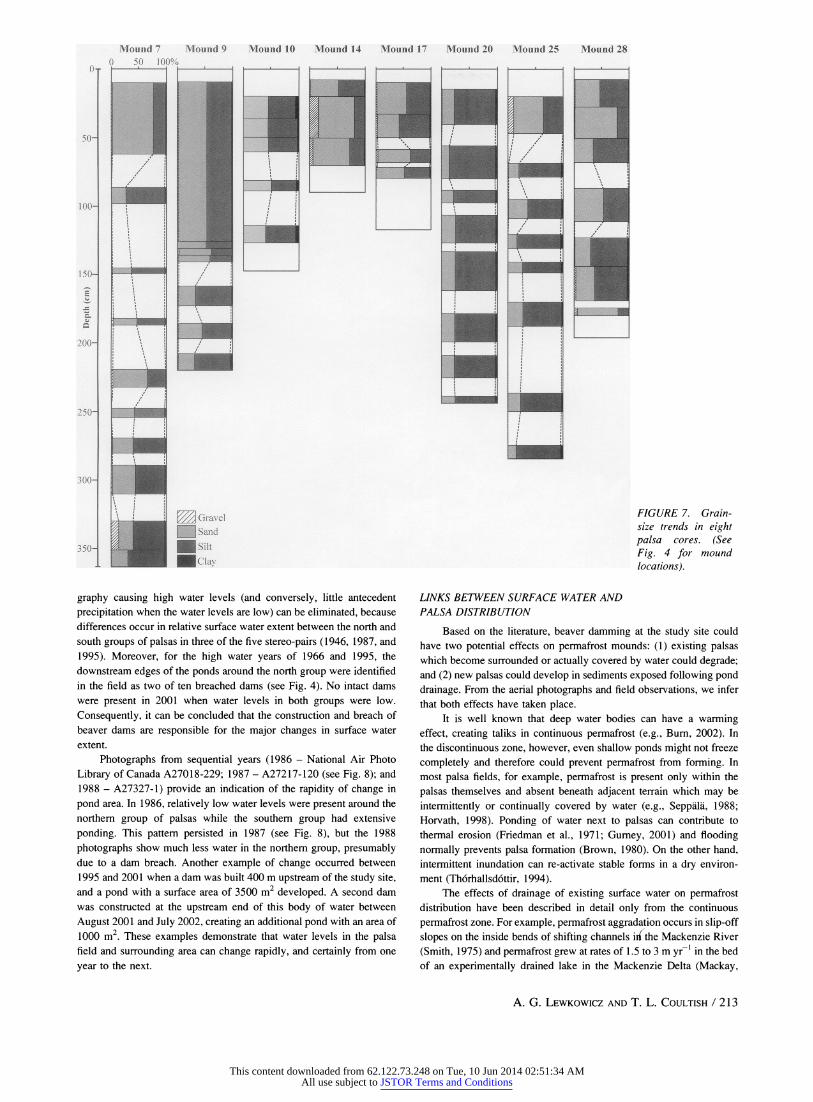
Mound 7 Mound 9 Mound 10 Mound 14 Mound 17 Mound 20 Mound 25 Mound 28
I ' I I I
.
I
: I I
I
I
LI1I? ?
\I \ I
FIGURE 7. Grain- size trends in eight palsa cores. (See Fig. 4 for mound locations).
graphy causing high water levels (and conversely, little antecedent
precipitation when the water levels are low) can be eliminated, because differences occur in relative surface water extent between the north and south groups of palsas in three of the five stereo-pairs (1946, 1987, and
1995). Moreover, for the high water years of 1966 and 1995, the downstream edges of the ponds around the north group were identified in the field as two of ten breached dams (see Fig. 4). No intact dams were present in 2001 when water levels in both groups were low.
Consequently, it can be concluded that the construction and breach of beaver dams are responsible for the major changes in surface water extent.
Photographs from sequential years (1986 - National Air Photo
Library of Canada A27018-229; 1987 - A27217-120 (see Fig. 8); and 1988 - A27327-1) provide an indication of the rapidity of change in
pond area. In 1986, relatively low water levels were present around the northern group of palsas while the southern group had extensive
ponding. This pattern persisted in 1987 (see Fig. 8), but the 1988
photographs show much less water in the northern group, presumably due to a dam breach. Another example of change occurred between 1995 and 2001 when a dam was built 400 m upstream of the study site, and a pond with a surface area of 3500 m2 developed. A second dam was constructed at the upstream end of this body of water between
August 2001 and July 2002, creating an additional pond with an area of 1000 m2. These examples demonstrate that water levels in the palsa field and surrounding area can change rapidly, and certainly from one
year to the next.
LINKS BETWEEN SURFACE WATER AND PALSA DISTRIBUTION
Based on the literature, beaver damming at the study site could have two potential effects on permafrost mounds: (1) existing palsas which become surrounded or actually covered by water could degrade; and (2) new palsas could develop in sediments exposed following pond drainage. From the aerial photographs and field observations, we infer that both effects have taken place.
It is well known that deep water bodies can have a warming effect, creating taliks in continuous permafrost (e.g., Bum, 2002). In the discontinuous zone, however, even shallow ponds might not freeze
completely and therefore could prevent permafrost from forming. In most palsa fields, for example, permafrost is present only within the
palsas themselves and absent beneath adjacent terrain which may be
intermittently or continually covered by water (e.g., Seppala, 1988; Horvath, 1998). Ponding of water next to palsas can contribute to thermal erosion (Friedman et al., 1971; Gumey, 2001) and flooding normally prevents palsa formation (Brown, 1980). On the other hand, intermittent inundation can re-activate stable forms in a dry environ- ment (Th6rhallsd6ttir, 1994).
The effects of drainage of existing surface water on permafrost distribution have been described in detail only from the continuous
permafrost zone. For example, permafrost aggradation occurs in slip-off slopes on the inside bends of shifting channels in the Mackenzie River
(Smith, 1975) and permafrost grew at rates of 1.5 to 3 m yr-' in the bed of an experimentally drained lake in the Mackenzie Delta (Mackay,
A. G. LEWKOWICZ AND T. L. COULTISH / 213
0-
50-
100-
150-
u
200-
250-
300-
350-
U Gravel
1 Sand U Silt
Clay
/I
! I
: i i ! I I I : : I i I I
, , iim t.
/. I !I
s/
i
il l ! .!I
Im I I
i ?~ I I I
m
/ i \
I
11 I
I I
I
I I
I III
This content downloaded from 62.122.73.248 on Tue, 10 Jun 2014 02:51:34 AMAll use subject to JSTOR Terms and Conditions
N
2001
m
0
1995
C
1987
1966
0
1946
V
> Mound that degraded before date of next photo - Mound that formed after date of previous photo
* Mound in 1946 that still exists in 2001
0 100 200m
FIGURE 8. Maps ofpalsas and surface drainage at the main study sitefor different years. Palsas are shown in black and gray areas are surface water. Note: smaller mounds were not detectable using the aerial photographs. Sources: National Air Photo Library of Canada aerial photographs A10569-12 (1946), A16425-65 (1966), A27217-120 (1987), A28238-7 (1995), and A28474-207 (2001).
214 / ARCTIC, ANTARCTIC, AND ALPINE RESEARCH
This content downloaded from 62.122.73.248 on Tue, 10 Jun 2014 02:51:34 AMAll use subject to JSTOR Terms and Conditions
1972-2000: 0.9?C/decade
* 180 >
* 160 D. cn
140 0
*120
100 (0
80 a
3 2 '
- 40 |
20
. z '1
1945 1950 1955 1960 1965 1970 1975 1980 1985 1990 1995 2000
9000
8000
7000
6000
5000
4000
3000
2000
1000
0
0) 0)
3 1
s9
1945 1950 1955 1960 1965 1970 1975 1980 1985 1990 1995 2000
FIGURE 9. (A) Whitehorse Airport mean annual air temperature and S-yr running mean of annual snowfall for 1943-2000 (data from Environment Canada, 2002) and (B) Rates of aggradation and degradation of palsas (bar chart), and total palsa area (solid line) at Wolf Creek study site based on analysis of aerial photographs (see Fig. 8). In (A), Environment Canada data for 1995-1998 are missing; best- fit lines for air temperature derivedfor 1943-1972 and 1972-2000. In (B), values outside bars on the lower graph are the numbers of palsas that aggraded or degraded within a given time period. Degradation is shown above the line and aggradation below the line to make comparisons with air temperature easier. Note: small palsas that are not visible on the aerial photographs are omitted from the analysis.
1986). Rates of aggradation would be expected to be slower in the discontinuous zone because of lower rates of surface cooling, but given appropriate climatic conditions, it is clear that permafrost could develop.
Palsa Degradation
Twelve palsas visible on the aerial photographs degraded between 1966 and 1987. Eleven of these were partly or completely inundated on the 1966 photos. Six of them were already present in 1946 and five had developed between 1946 and 1966. Given the
cyclicity of palsa development, some degradation and aggradation would be expected over an interval of 21 yr, but the overwhelming concentration of degraded palsas in flooded zones is a strong indication of a causal relationship. Because it cannot be known when the inundation shown in 1966 actually commenced, it is possible that its influence was still greater: several mounds, present in 1946 in locations that are shown under water in the 1966 photo, had already disappeared by then.
The minimum duration of ponding needed to cause complete palsa degradation can be estimated from one palsa which aggraded between 1987 and 1995. It had disappeared by 2001, indicating that
complete degradation can occur in less than a decade. Partial palsa degradation is also possible: palsa 7 (see Fig. 4) was half-surrounded
by water in 1995 and by 2001 had partially collapsed into the adjacent stream channel (see Fig. 3C). Palsa 12 (see Figs. 4, 8) also appeared to diminish in size from 1966 to 1995 as interconnections varied between the adjoining pond and the stream channel.
The significance of surface water is linked to the thermal regime of palsas at this site. The average surface temperature recorded on top of palsa 9 was +0.2?C for 2001-2002. The difference between this and the air temperature over the same period (-4?C) is due to the insulating effect of snow, which was 30 cm thick at the measurement site on 1
April 2002. Temperatures at a depth of 0.6 m, near the top of
permafrost (see Fig. 2) averaged about -0.9?C. The 1?C difference between the surface temperature and that at the top of permafrost represents the thermal offset (Burn and Smith, 1988; Smith and
Riseborough, 2002). The magnitude of the offset is due to the difference in thermal conductivities between summer and winter, particularly of the peat cover. Since the surface temperature exceeds
0?C, an increase in summer peat thermal conductivity resulting from the saturation of palsa sides by ponding, accompanied by advective
heating from warm pond water coming in contact with the
permafrost table, together would make the frozen core of a palsa unsustainable.
Palsa Aggradation
More than ten small palsas have grown in areas which were flooded at times over the past 55 yr. The most recent examples are two
unvegetated, peat-covered mounds less than 1 m high (17 and 18 in
Fig. 4) which developed in an area that was flooded in 1995, but had drained prior to 2001. A core and a separate pit excavated in one of these mounds encountered frozen material containing segregated ice, underlain by a layer of intrusive ice 20 cm thick. Together with winter
icing activity and the presence of nearby cold-water springs, these observations raise the possibility that groundwater pressures play a role in the inception of some palsas at this site, perhaps helping to cause the initial mounding (Coultish and Lewkowicz, 2003). However, intrusive ice was not identified in the cores from the larger palsas, so if
groundwater plays a part in mound inception, the evidence is not
preserved in the long term. After formation, palsas continue to grow. There is little in the
literature regarding growth rates, but in one experiment, Seppala (1982) produced a small palsa that grew in height by 10 cm yr-~. The model of An and Allard (1995) predicts that the initial growth of a palsa could
average half this rate under a stable climate with a mean annual air
temperature of -5.6?C, so that a 3 m high palsa could grow in 60 yr. The rate of growth would then decrease and it would take a further 140
yr to reach 6 m (An and Allard, 1995). Most recently, Plug (2003) measured positive vertical displacements on small palsas in Alaska of
up to 4 cm yr-~. Our results broadly concur with these predictions and measurements. Palsa 20, for example, is 1.2 m high and allowing 5 to 10 yr for initial colonization by shrubs, formed a minimum of 14 to 19
yr before measurement (average growth of 6-9 cm yr-). Palsa 10 has a similar minimum age range and is 0.9 m high (average growth of 5-6 cm yr-l). Palsa 9 is one of the largest forms at 3 m in height and has a minimum age of 61 to 66 yr (average growth of 5 cm yr-~).
WOLF CREEK PALSAS AS CLIMATIC INDICATORS?
A number of authors have suggested that an overall trend in
aggradation or degradation within a palsa field could be indicative of climate change (Table 1). Local temperature variation at the Wolf Creek site over the past five decades, likely followed the pattern at Whitehorse, 20 km to the north and 500 m lower in elevation. When palsa numbers are
examined, degradation of those forms visible on aerial photographs heavily outweighed aggradation during the 1943-1972 cooling phase (which was present in annual, summer, and winter temperatures) (see Fig. 9). During the warmest period of the past 50 yr (late 1980s
A. G. LEWKOWICZ AND T. L. COULTISH / 215
1943-72: -0.6?C/decade
(c
. 8
3
o
2'
0 C
2-
-3
-4
V
- D t l a, a -
i 0 C aT
This content downloaded from 62.122.73.248 on Tue, 10 Jun 2014 02:51:34 AMAll use subject to JSTOR Terms and Conditions
TABLE 1
Rates of degradation of palsas reported in the literature
Location Rate of Degradation Source
Macmillan Pass, Northwest Canada Two palsa fields completely degraded from thermal erosion Kershaw and Gill (1979); Horvath (1998); between 1944 and 1978; two other fields declined in area Kershaw (2003)
by 20% and 36% from 1949 to 1981; areal decreases of 1
to 1.5% yr-' were the norm over a 50-yr period. Norther Quebec, Easter Canada 49% decrease in total cover of palsas and collapsed scars Laprise and Payette (1987); Laberge and Payette (1995)
from 1957 to 1983; 33% decrease in permafrost within
the peatland from 1983 to 1993 but no significant change in shape and contour of the palsas.
Southern Norway Several small palsas found in 1972 had completely Sollid and S0rbel (1998)
degraded by 1997.
Northern Sweden 50% decrease in area of palsas and no new palsas developed Zuidhoff and Kolstrup (2000) from 1960 to 1997.
Daisetsu Mountains, Hokkaido, Japan A palsa field reduced by 36% in 27 yr; at the same time, Sone and Takahashi (1993) some palsas were not affected and some grew.
onwards), however, aggradation and degradation of the visible forms were balanced. The pattern is somewhat different if palsa area is used instead of numbers. Degradation outweighed aggradation from 1946
through to 1995, but the pattern reversed in the period until 2001. Field
mapping in 2001 showed aggrading forms to be in the great majority. Hence there is no link evident between air temperatures and palsa numbers or area at the Wolf Creek site.
Snowfall measured at Whitehorse increased from 1945 to 1966, decreased to 1981, then increased until 1995 (Fig. 9). Increasing snowfall until 1966 could be responsible for an initial corresponding decrease in palsa numbers. But if this is so, this negative correlation was not sustained through the subsequent decrease and further increase in snowfall. On the other hand, snowfall cannot be ruled out entirely as an influence on the palsas because the pattern of snowfall at the site
might be different from that measured at Whitehorse. We conclude, however, that the weight of evidence shows that it is far more probable that any sensitivity to climate is thoroughly masked by modifications to the surface water extent resulting from beaver dam construction and breach.
Summary More than 30 permafrost mounds, that fit Gumey's (2001)
category of mineral-cored palsas, are present at a site in Wolf Creek. We relate important aspects of their existence and persistence to beaver dam construction and breach for the following reasons.
First, the fine-grained, organic-rich sediments and associated peat cover comprising the palsas are interpreted as having been formed in and around beaver ponds. Groundwater pressures may play a role in mound initiation, but the frost susceptibility of the sediments permits the ice segregation that causes further growth, and the peat cover pro- vides the thermal offset necessary for preservation of the frozen core.
Second, water levels and areas of surface ponding in the palsa field, as revealed by the aerial photographic analyses, have varied
greatly as a consequence of beaver damming. Palsas present in flooded areas have subsequently degraded. Palsas have aggraded on the floors of drained ponds. We cannot conclusively demonstrate these as causal links, but the inferences appear reasonable given what is known about the effects of surface water bodies on ground thermal regime.
Third, rates of aggradation and degradation of those palsas visible on aerial photographs are unrelated to air temperature trends in the
region. Degradation, measured by palsa numbers and palsa area
outweighed aggradation from the 1940s to the early 1970s when summer, winter and annual temperatures were cooling. Aggradation and degradation of these larger forms are balanced in number at present while seasonal and annual air temperatures are warming. In addition, palsa area is growing and numerous aggrading mounds, not discernible on aerial photographs, were present in the field. It is possible that palsa development is insensitive to air temperature at this site, but the weight of circumstantial evidence is that any air temperature influences are masked by the effects of beaver activity. Consequently, palsa dynamics at this site cannot be used to indicate climate warming unless the
degree of change is sufficient to eliminate permafrost altogether. Finally, while several zoogeomorphological interactions have
been described for arctic and alpine regions, we believe this to be the first report of the influence of beaver activity on permafrost mounds. Given that beaver inhabit wetlands in the discontinuous permafrost zone where palsas develop, our findings may well pertain to other sites in subarctic North America.
Acknowledgments This study was supported financially by the Natural Sciences and
Engineering Research Council of Canada and the Northern Scientific
Training Program, DIAND. We are grateful to Rick Janowicz, DIAND, Whitehorse, for logistical support. The Geological Survey of Canada kindly gave access to their Laser Particle Analyser. Mark
Ednie, Christophe Kinnard, Dr. Marcia Phillips, and Andje Lewko- wicz-Lalonde, all generously provided assistance in the field. Helpful comments on an earlier version of the paper were made by G. P. Kershaw and an anonymous reviewer.
Refereices Cited
An, W. and Allard, M., 1995: A mathematical approach to modelling palsa formation: insights on processes and growth conditions. Cold
Regions Science and Technology, 23: 231-244.
Beschel, R. E. and Webb, D., 1962: Growth ring studies on arctic willows. In: Miiller, F. (ed.), Axel Heiberg Island: Preliminary
Report 1961-1962. Montreal: McGill University, 189-198. Brown, G., 1980: Palsas and other permafrost features in the lower
Rock Creek Valley, west-central Alberta. Arctic and Alpine Research, 12: 31-40.
216 / ARCTIC, ANTARCTIC, AND ALPINE RESEARCH
This content downloaded from 62.122.73.248 on Tue, 10 Jun 2014 02:51:34 AMAll use subject to JSTOR Terms and Conditions
Bur, C. R., 2002: Tundra-lakes and permafrost, Richards Island, western Arctic coast, Canada. Canadian Journal of Earth Sciences, 39: 1281-1298.
Bur, C. R. and Smith, C. A. S., 1988: Observations of the "thermal offset" in near-surface mean annual ground temperatures at several sites near Mayo, Yukon Territory, Canada. Arctic, 41: 99-104.
Butler, D. R. and Malanson, G. P., 1994: Canadian landform
examples-27. The Canadian Geographer, 38: 76-79.
Butler, D. R. and Malanson, G. P., 1995: Sedimentation rates and
patterns in beaver ponds in a mountainous environment. Geo-
morphology, 13: 255-269.
Coultish, T. L., 2002: Long-term development of palsas and other
permafrost-cored mounds in mountainous terrain, Wolf Creek, southern Yukon. Unpublished M.Sc. thesis. University of Ottawa, Ottawa. 128 pp.
Coultish, T. L. and Lewkowicz, A. G., 2003: Palsa dynamics in a subarctic mountainous environment, Wolf Creek, Yukon Territory, Canada. In Phillips, M., Springman, S. H., and Arenson, L. U. (eds.), Permafrost, Proceedings of the Eighth International Conference on
Permafrost, Ziirich. Lisse: Swets and Zeitlinger, 163-168.
Cummings, C. E. and Pollard, W. H., 1990: Cryogenetic categorization of peat and mineral cored palsas in the Schefferville area, Quebec. In: Proceedings, Fifth Canadian Permafrost Conference, Quebec
City. Nordicana No. 54, 95-102. Environment Canada, 2002:http://wftp.cmc.ec.gc.ca/cd2001west.zip Friedman, J. D., Johansson, C. E., Oskarsson, N., Svensson, H.,
Thorarinsson, S., and Williams, R. S., 1971: Observations on Icelandic polygon surfaces and palsa areas. Photo interpretation and field studies. Geografiska Annaler, 53A: 115-144.
Gurell, A. M., 1998: The hydrogeomorphological effects of beaver
dam-building activity. Progress in Physical Geography, 22:167-189.
Gumey, S. D., 2001: Aspects of the genesis, geomorphology and
terminology of palsas: perennial cryogenic mounds. Progress in
Physical Geography, 25: 249-260.
Hall, K., 1997: Zoological erosion in permafrost environments: a possible origin of dells? Polar Geography, 21: 1-9.
Hall, K., Boelhouwers, J., and Driscoll, K., 1999: Animals as erosion
agents in the alpine zone: some data and observations from Canada, Lesotho and Tibet. Arctic, Antarctic, and Alpine Research, 31: 436-446.
Harris, S. A., 1998: A genetic classification of the palsa-like mounds in western Canada. Biuletyn Peryglacjalny, 37: 115-130.
Heginbottom, J. A., Dubreuil, M. A., and Harker, P. A., 1995: Canada- Permafrost. In: National Atlas of Canada. 5th ed. National Atlas
Information Service, Natural Resource Canada, Ottawa, MCR 4177. Horvath, C. L., 1998: An evaluation of ground penetrating radar for
investigation of palsa evolution, MacMillan Pass, NWT, Canada. In Lewkowicz, A. G. and Allard, M. (eds.), Proceedings, Seventh International Conference on Permafrost. Quebec City: Universite
Laval, 473-478. Janowicz, J. R., 1999: Wolf Creek Research Basin - overview. In
Pomeroy, J. M. and Granger, R. J. (eds.), Wolf Creek Research Basin: Hydrology, Ecology, Environment. Environment Canada, 125-134.
Kershaw, G. P. and Gill, D., 1979: Growth and decay of palsas and peat meadows in MacMillan Pass- Tsichu River area, Northwest Territories, Canada. Canadian Journal of Earth
Sciences, 16: 1362-1374.
Kershaw, G. P., 2003: Permafrost landform degradation over more than half a century, Macmillan/Caribou Pass region, NWT/Yukon, Canada. In Phillips, M., Springman, S. H., and Arenson, L. U.
(eds.), Permafrost, Proceedings of the Eighth International
Conference on Permafrost, Ziirich. Lisse: Swets and Zeitlinger, 543-548.
Laberge, M.-J. and Payette, S., 1995: Long term monitoring of
permafrost change in a palsa peatland in northern Quebec, Canada: 1983-1993. Arctic and Alpine Research, 27: 167-171.
Laprise, D. and Payette, S., 1987: Evolution recente d'une tourbiere a
palses (Quebec subarctique): analyse cartographique et dendrochro-
nologique. Canadian Journal of Botany, 66: 2217-2227.
Lewkowicz, A. G., and Ednie, M., 2004: Probability mapping of mountain permafrost using the BTS method, Wolf Creek, Yukon
Territory, Canada. Permafrost and Periglacial Processes, 15: 67-80.
Mackay, J. R., 1986: The first seven years (1978-1985) of ice-wedge growth, Illisarvik experimental drained lake site, western Arctic coast. Canadian Journal of Earth Sciences, 23: 1782-1795.
Matthews, J. A, Dahl, S.-O., Berrisford, M. S., and Nesje, A., 1997:
Cyclic development and thermokarstic degradation of palsas in the
mid-alpine zone at Leirpullan, Dovrefjell, souther Norway. Permafrost and Periglacial Processes, 8: 107-122.
Murton, J. B. and French, H. M., 1994: Cryostructures in permafrost, Tuktoyaktuk coastlands, western Arctic Canada. Canadian Journal
of Earth Sciences, 31: 737-747.
Naiman, R. J., Johnston, C. A. and Kelley, J. C., 1988: Alteration of North American streams by beaver. BioScience, 38: 753-762.
Nelson, F. E., Hinkel, K. M., and Outcalt, S. I., 1992: Palsa-scale frost mounds. In Dixon, J. C. and Abrahams, A. D. (eds.), Periglacial Geomorphology: Proceedings of the 22nd Annual Binghamton
Symposium in Geomorphology. Chichester: John Wiley, 305-325.
Plug, L. J., 2003: Ground-ice features and depth of peat across a mire
chronosequence, NW Alaska. In Phillips, M., Springman, S. H., and Arenson, L. U. (eds.), Permafrost, Proceedings of the Eighth International Conference on Permafrost, Zurich. Lisse: Swets and
Zeitlinger, 901-906. Price, L. W., 1971: Geomorphic effect of the arctic ground squirrel in
an alpine environment. Geografiska Annaler, 53A: 100-106.
Seppala, M., 1982: An experimental study of the formation of palsas. In: Proceedings, Fourth Canadian Permafrost Conference. Ottawa: National Research Council of Canada, 36-42.
Seppila, M., 1988: Palsas and related forms. In Clark, M. J. (ed.), Advances in Periglacial Geomorphology. Chichester: John Wiley, 247-278.
Seppala, M., 1990: Depth of snow and frost on a palsa mire, Finnish
Lapland. Geografiska Annaler, 72A: 191-201.
Smith, D. J. and Gardner, J. S., 1985: Geomorphic effects of ground squirrels in the Mount Rae area, Canadian Rocky Mountains. Arctic and Alpine Research, 17: 205-210.
Smith, M. W., 1975: Microclimate influences on ground temperatures and permafrost distribution, Mackenzie Delta, Northwest Territories. Canadian Journal of Earth Sciences, 12: 1421-1438.
Smith, M. W. and Riseborough, D. W., 2002: Climate and the limits of
permafrost: a zonal analysis. Permafrost and Periglacial Processes, 13: 1-15.
Sollid, J. L. and S0rbel, L., 1998: Palsa bogs as a climate indicator-
examples from Dovrefjell, southern Norway. Ambio, 27: 287-291. Sone, T. and Takahashi, N., 1993: Palsa formation in the Daisetsu
Mountains. In: Proceedings, Sixth International Conference on
Permafrost, Beijing. Wushan, Guangzhou: South China University of Technology Press, vol. 2, 1231-1234.
Th6rhallsd6ttir, T. E., 1994: Effects of changes in groundwater levels on palsas in central Iceland. Geografiska Annaler, 76A: 161-167.
van Everdingen, R. 0., 1998: Multi-language Glossary of Permafrost
A. G. LEWKOWICZ AND T. L. COULTISH / 217
This content downloaded from 62.122.73.248 on Tue, 10 Jun 2014 02:51:34 AMAll use subject to JSTOR Terms and Conditions
and Related Ground-Ice Terms. International Permafrost Associa- tion. The Arctic Institute of North America, University of Calgary, Calgary. 268 pp.
Walkerton, L. R., Zasada, J. C., and Chapin, F. S., 1986: The role of life history processes in primary succession on an Alaskan
floodplain. Ecology, 67: 1243-1253. Washburn, A. L., 1983: What is a palsa? Abhandlungen der Akademie
der Wissenschaten in Gittigen, Mathematischen-Physikalische Klasse Dritte Folge, 35: 34-47.
Woo, M-K. and Waddington, J. M., 1990: Effects of beaver dams on subarctic wetland hydrology. Arctic, 43: 223-230.
Zuidhoff, F. S. and Kolstrup, E., 2000: Changes in palsa distribution in relation to climate change in Laivadalen, northern Sweden,
especially 1960-1997. Permafrost and Periglacial Processes, 11: 55-69.
Ms submitted December 2002 Revised ms submitted October 2003
218 / ARCTIC, ANTARCTIC, AND ALPINE RESEARCH
This content downloaded from 62.122.73.248 on Tue, 10 Jun 2014 02:51:34 AMAll use subject to JSTOR Terms and Conditions