Embed Size (px)
Citation preview
Beaufort Marine Hazards 2012 Field Expedition Report
CCGS Sir Wilfrid Laurier
September 18 – October 5, 2012
Institute of Ocean Sciences Cruise 2012-21
Pacific Geoscience Centre Cruise 2012-004
Humfrey Melling – Chief Scientist Supported by
Fisheries and Oceans Canada, Geological Survey of Canada
Federal Programme on Energy Research and Development (PERD B21-002, B21-003)
Beaufort Region Environmental Assessment (BREA: Beaufort Sea Observatories)
Monterey Bay Aquarium Research Institute (MBARI), ArcticNet
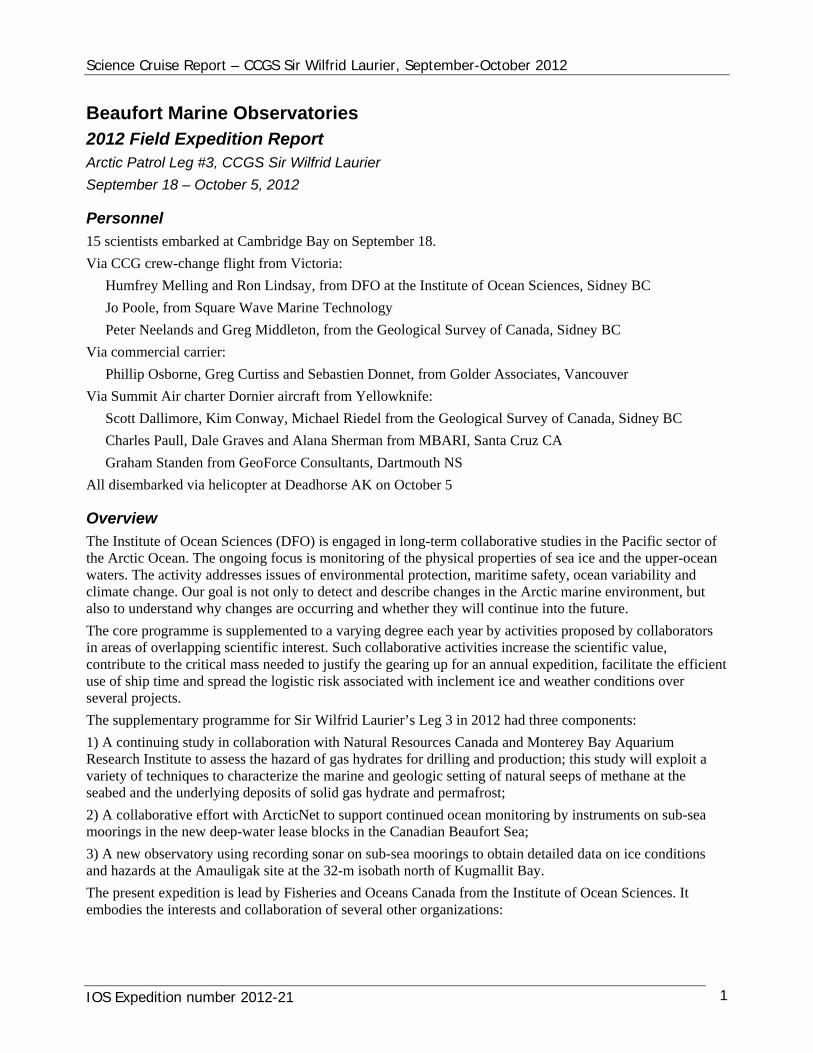
Cover picture:
Foredeck of CCGS Sir Wilfrid Laurier during the Leg-3 science programme. Equipment from left to right: IKU grab, Huntec seismic towed body with suspension system, coring winch (background), Huntec winch (black), ROV winch (yellow umbilical), core lab (blue shipping container), mooring anchors (train wheels).
Science Cruise Report – CCGS Sir Wilfrid Laurier, September-October 2012
Beaufort Marine Observatories 2012 Field Expedition Report Arctic Patrol Leg #3, CCGS Sir Wilfrid Laurier
September 18 – October 5, 2012
Personnel
15 scientists embarked at Cambridge Bay on September 18.
Via CCG crew-change flight from Victoria:
Humfrey Melling and Ron Lindsay, from DFO at the Institute of Ocean Sciences, Sidney BC
Jo Poole, from Square Wave Marine Technology
Peter Neelands and Greg Middleton, from the Geological Survey of Canada, Sidney BC
Via commercial carrier:
Phillip Osborne, Greg Curtiss and Sebastien Donnet, from Golder Associates, Vancouver
Via Summit Air charter Dornier aircraft from Yellowknife:
Scott Dallimore, Kim Conway, Michael Riedel from the Geological Survey of Canada, Sidney BC
Charles Paull, Dale Graves and Alana Sherman from MBARI, Santa Cruz CA
Graham Standen from GeoForce Consultants, Dartmouth NS
All disembarked via helicopter at Deadhorse AK on October 5
Overview
The Institute of Ocean Sciences (DFO) is engaged in long-term collaborative studies in the Pacific sector of the Arctic Ocean. The ongoing focus is monitoring of the physical properties of sea ice and the upper-ocean waters. The activity addresses issues of environmental protection, maritime safety, ocean variability and climate change. Our goal is not only to detect and describe changes in the Arctic marine environment, but also to understand why changes are occurring and whether they will continue into the future.
The core programme is supplemented to a varying degree each year by activities proposed by collaborators in areas of overlapping scientific interest. Such collaborative activities increase the scientific value, contribute to the critical mass needed to justify the gearing up for an annual expedition, facilitate the efficient use of ship time and spread the logistic risk associated with inclement ice and weather conditions over several projects.
The supplementary programme for Sir Wilfrid Laurier’s Leg 3 in 2012 had three components:
1) A continuing study in collaboration with Natural Resources Canada and Monterey Bay Aquarium Research Institute to assess the hazard of gas hydrates for drilling and production; this study will exploit a variety of techniques to characterize the marine and geologic setting of natural seeps of methane at the seabed and the underlying deposits of solid gas hydrate and permafrost;
2) A collaborative effort with ArcticNet to support continued ocean monitoring by instruments on sub-sea moorings in the new deep-water lease blocks in the Canadian Beaufort Sea;
3) A new observatory using recording sonar on sub-sea moorings to obtain detailed data on ice conditions and hazards at the Amauligak site at the 32-m isobath north of Kugmallit Bay.
The present expedition is lead by Fisheries and Oceans Canada from the Institute of Ocean Sciences. It embodies the interests and collaboration of several other organizations:
IOS Expedition number 2012-21 1
Science Cruise Report – CCGS Sir Wilfrid Laurier, September-October 2012
o Canadian Programme of Energy Research and Development: Northern Regulatory Research Programme: Changing sea ice constraints on hydrocarbon development in Canada's Arctic (NRCan via PERD B21.002)
o Canadian Programme of Energy Research and Development: Regional assessment of geohazards related to deep water hydrocarbon development, Beaufort Sea outer shelf/upper slope (NRCan via PERD B21.003)
o Geological Survey of Canada: Pacific Geoscience Centre (Scott Dallimore): Marine geohazards
o Monterey Bay Aquarium Research Institute, California (Charlie Paull): Marine gas hydrates
o US Army Cold regions Research Engineering Laboratory (CRREL: Dr Jackie Richter-Menge): Arctic ice thickness monitoring (AIM) and factors controlling the ice-mass balance
o US National Oceanic and Atmospheric Administration (NOAA: Dr Jim Overland): Same interest as CRREL
o ArcticNet: Beaufort Region Environmental Assessment (AANDC via BREA)
Objectives
One primary objective of this expedition was the recovery, servicing and re-deployment of internally recording instruments on sub-sea moorings – “ocean observatories”. The instruments had operated autonomously for 12 months, recording observations of ice thickness, ice ridging, ice drift, storm waves, storm surge, ocean current, temperature, salinity, ambient sound, acoustic back-scatter from plankton and sedimentation. There were 8 moorings for recovery during this leg (2 of about 650-m length; others less than 100 m) and 12 for deployment (including 3 of about 650-m length).
The other primary objective was the investigation of features on the seabed identified through study of a detailed bathymetric map of the outer shelf and slope of the Beaufort Sea acquired by multi-beam sonar. The map is the outcome of surveys funded by Government and the oil industry during the last few years. The investigation involved use of a Huntec shallow seismic profiling system, an ROV for visual exploration, piston and gravity corers and bottom grabs for sediment sampling.
A secondary objective was the mapping of selected properties of seawater, both continuously at the surface along the path of the ship and from surface to seabed at selected locations. Properties of surface water were to be measured continuously in water pumped from one of the ship’s sea bays to the main lab (temperature, salinity, chlorophyll fluorescence). The CTD probe with added sensors for dissolved oxygen, light transparency and chlorophyll fluorescence was to be used to measure ocean profiles, mainly at the sites of sub-sea moorings.
Ocean Observatories
Observations by autonomous instruments on oceanographic moorings provide continuous year-round ocean data that complement the detailed but short-lived surveys conducted from ships. The moorings enable affordable long-term, monitoring of the oceans that surround Canada.
DFO’s long-term sites (ocean observatories) are on the Mackenzie shelf north of the Delta and on the Chukchi Plateau. Activity this year includes the additional new ocean observatories, five in deeper water over the continental slope and one in shallower water in the Kugmallit sea valley. The former are supported by Aboriginal Affairs and Northern Development Canada as part of the Beaufort Region Environmental Assessment and other partners. All enhance the multi-national Arctic Ice Monitoring Project (AIM), active under the umbrella of the Arctic Climate System Study, the Climate and Cryosphere Study and the International Arctic Ocean Observing System, sponsored by the WCRP (World Climate Research Program) and the International Arctic Science Committee (IASC).
Through careful choice of instruments for moorings we are acquiring intriguing and ecosystem-relevant views of the polar ocean at times when humans cannot be there. Upward-looking sonar at the top of the mooring measures ice thickness and topography, revealing the presence of ridges, level ice and ecologically
IOS Expedition number 2012-21 2
Science Cruise Report – CCGS Sir Wilfrid Laurier, September-October 2012
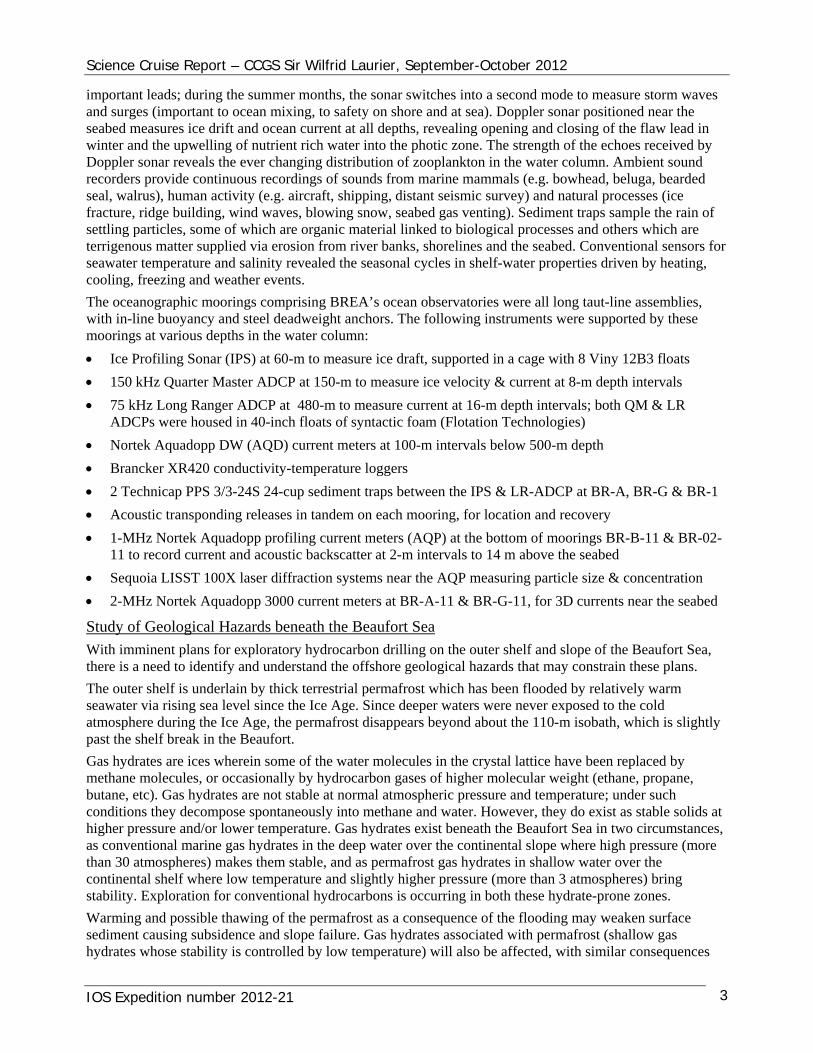
important leads; during the summer months, the sonar switches into a second mode to measure storm waves and surges (important to ocean mixing, to safety on shore and at sea). Doppler sonar positioned near the seabed measures ice drift and ocean current at all depths, revealing opening and closing of the flaw lead in winter and the upwelling of nutrient rich water into the photic zone. The strength of the echoes received by Doppler sonar reveals the ever changing distribution of zooplankton in the water column. Ambient sound recorders provide continuous recordings of sounds from marine mammals (e.g. bowhead, beluga, bearded seal, walrus), human activity (e.g. aircraft, shipping, distant seismic survey) and natural processes (ice fracture, ridge building, wind waves, blowing snow, seabed gas venting). Sediment traps sample the rain of settling particles, some of which are organic material linked to biological processes and others which are terrigenous matter supplied via erosion from river banks, shorelines and the seabed. Conventional sensors for seawater temperature and salinity revealed the seasonal cycles in shelf-water properties driven by heating, cooling, freezing and weather events.
The oceanographic moorings comprising BREA’s ocean observatories were all long taut-line assemblies, with in-line buoyancy and steel deadweight anchors. The following instruments were supported by these moorings at various depths in the water column:
Ice Profiling Sonar (IPS) at 60-m to measure ice draft, supported in a cage with 8 Viny 12B3 floats
150 kHz Quarter Master ADCP at 150-m to measure ice velocity & current at 8-m depth intervals
75 kHz Long Ranger ADCP at 480-m to measure current at 16-m depth intervals; both QM & LR ADCPs were housed in 40-inch floats of syntactic foam (Flotation Technologies)
Nortek Aquadopp DW (AQD) current meters at 100-m intervals below 500-m depth
Brancker XR420 conductivity-temperature loggers
2 Technicap PPS 3/3-24S 24-cup sediment traps between the IPS & LR-ADCP at BR-A, BR-G & BR-1
Acoustic transponding releases in tandem on each mooring, for location and recovery
1-MHz Nortek Aquadopp profiling current meters (AQP) at the bottom of moorings BR-B-11 & BR-02-11 to record current and acoustic backscatter at 2-m intervals to 14 m above the seabed
Sequoia LISST 100X laser diffraction systems near the AQP measuring particle size & concentration
2-MHz Nortek Aquadopp 3000 current meters at BR-A-11 & BR-G-11, for 3D currents near the seabed
Study of Geological Hazards beneath the Beaufort Sea
With imminent plans for exploratory hydrocarbon drilling on the outer shelf and slope of the Beaufort Sea, there is a need to identify and understand the offshore geological hazards that may constrain these plans.
The outer shelf is underlain by thick terrestrial permafrost which has been flooded by relatively warm seawater via rising sea level since the Ice Age. Since deeper waters were never exposed to the cold atmosphere during the Ice Age, the permafrost disappears beyond about the 110-m isobath, which is slightly past the shelf break in the Beaufort.
Gas hydrates are ices wherein some of the water molecules in the crystal lattice have been replaced by methane molecules, or occasionally by hydrocarbon gases of higher molecular weight (ethane, propane, butane, etc). Gas hydrates are not stable at normal atmospheric pressure and temperature; under such conditions they decompose spontaneously into methane and water. However, they do exist as stable solids at higher pressure and/or lower temperature. Gas hydrates exist beneath the Beaufort Sea in two circumstances, as conventional marine gas hydrates in the deep water over the continental slope where high pressure (more than 30 atmospheres) makes them stable, and as permafrost gas hydrates in shallow water over the continental shelf where low temperature and slightly higher pressure (more than 3 atmospheres) bring stability. Exploration for conventional hydrocarbons is occurring in both these hydrate-prone zones.
Warming and possible thawing of the permafrost as a consequence of the flooding may weaken surface sediment causing subsidence and slope failure. Gas hydrates associated with permafrost (shallow gas hydrates whose stability is controlled by low temperature) will also be affected, with similar consequences
IOS Expedition number 2012-21 3
Science Cruise Report – CCGS Sir Wilfrid Laurier, September-October 2012
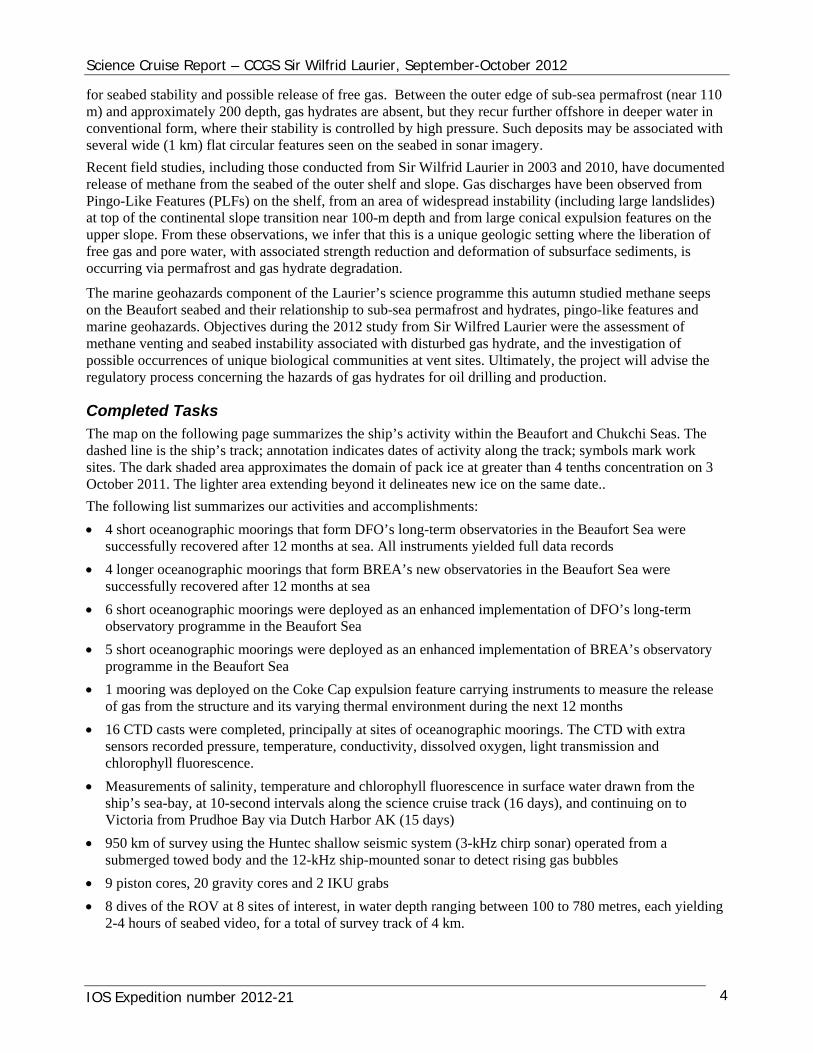
for seabed stability and possible release of free gas. Between the outer edge of sub-sea permafrost (near 110 m) and approximately 200 depth, gas hydrates are absent, but they recur further offshore in deeper water in conventional form, where their stability is controlled by high pressure. Such deposits may be associated with several wide (1 km) flat circular features seen on the seabed in sonar imagery.
Recent field studies, including those conducted from Sir Wilfrid Laurier in 2003 and 2010, have documented release of methane from the seabed of the outer shelf and slope. Gas discharges have been observed from Pingo-Like Features (PLFs) on the shelf, from an area of widespread instability (including large landslides) at top of the continental slope transition near 100-m depth and from large conical expulsion features on the upper slope. From these observations, we infer that this is a unique geologic setting where the liberation of free gas and pore water, with associated strength reduction and deformation of subsurface sediments, is occurring via permafrost and gas hydrate degradation.
The marine geohazards component of the Laurier’s science programme this autumn studied methane seeps on the Beaufort seabed and their relationship to sub-sea permafrost and hydrates, pingo-like features and marine geohazards. Objectives during the 2012 study from Sir Wilfred Laurier were the assessment of methane venting and seabed instability associated with disturbed gas hydrate, and the investigation of possible occurrences of unique biological communities at vent sites. Ultimately, the project will advise the regulatory process concerning the hazards of gas hydrates for oil drilling and production.
Completed Tasks
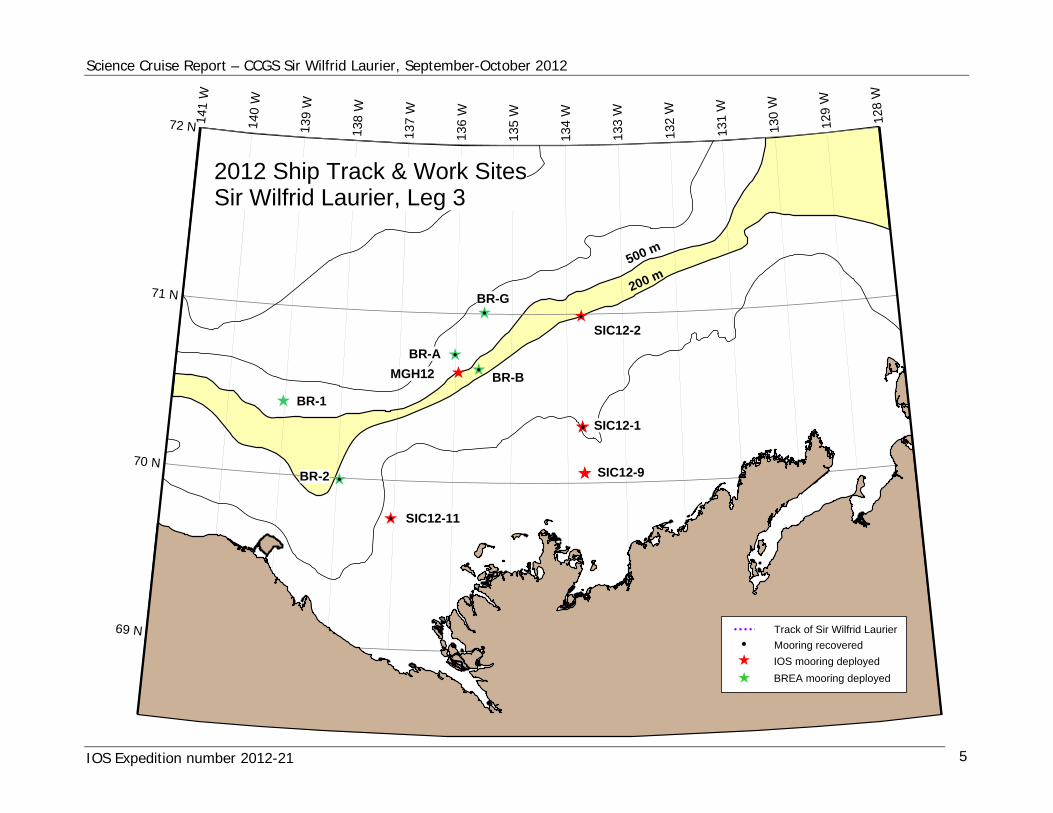
The map on the following page summarizes the ship’s activity within the Beaufort and Chukchi Seas. The dashed line is the ship’s track; annotation indicates dates of activity along the track; symbols mark work sites. The dark shaded area approximates the domain of pack ice at greater than 4 tenths concentration on 3 October 2011. The lighter area extending beyond it delineates new ice on the same date..
The following list summarizes our activities and accomplishments:
4 short oceanographic moorings that form DFO’s long-term observatories in the Beaufort Sea were successfully recovered after 12 months at sea. All instruments yielded full data records
4 longer oceanographic moorings that form BREA’s new observatories in the Beaufort Sea were successfully recovered after 12 months at sea
6 short oceanographic moorings were deployed as an enhanced implementation of DFO’s long-term observatory programme in the Beaufort Sea
5 short oceanographic moorings were deployed as an enhanced implementation of BREA’s observatory programme in the Beaufort Sea
1 mooring was deployed on the Coke Cap expulsion feature carrying instruments to measure the release of gas from the structure and its varying thermal environment during the next 12 months
16 CTD casts were completed, principally at sites of oceanographic moorings. The CTD with extra sensors recorded pressure, temperature, conductivity, dissolved oxygen, light transmission and chlorophyll fluorescence.
Measurements of salinity, temperature and chlorophyll fluorescence in surface water drawn from the ship’s sea-bay, at 10-second intervals along the science cruise track (16 days), and continuing on to Victoria from Prudhoe Bay via Dutch Harbor AK (15 days)
950 km of survey using the Huntec shallow seismic system (3-kHz chirp sonar) operated from a submerged towed body and the 12-kHz ship-mounted sonar to detect rising gas bubbles
9 piston cores, 20 gravity cores and 2 IKU grabs
8 dives of the ROV at 8 sites of interest, in water depth ranging between 100 to 780 metres, each yielding 2-4 hours of seabed video, for a total of survey track of 4 km.
IOS Expedition number 2012-21 4
5
200 m500 m
141
W
140
W
139
W
138
W
137
W
136
W
135
W
134
W
133
W
132
W
131
W
130
W
129
W
128
W
69 N
70 N
71 N
72 N
2012 Ship Track & Work SitesSir Wilfrid Laurier, Leg 3
SIC12-9
SIC12-11
SIC12-2
MGH12
SIC12-1
BR-B
BR-G
BR-1
BR-2
BR-A
Mooring recovered
Track of Sir Wilfrid Laurier
IOS mooring deployed
BREA mooring deployed
Science Cruise Report – CCGS Sir Wilfrid Laurier, September-October 2012
IOS Expedition number 2012-21
Science Cruise Report – CCGS Sir Wilfrid Laurier, September-October 2012
IOS Expedition number 2012-21 6
Figis indicb
A
O
P
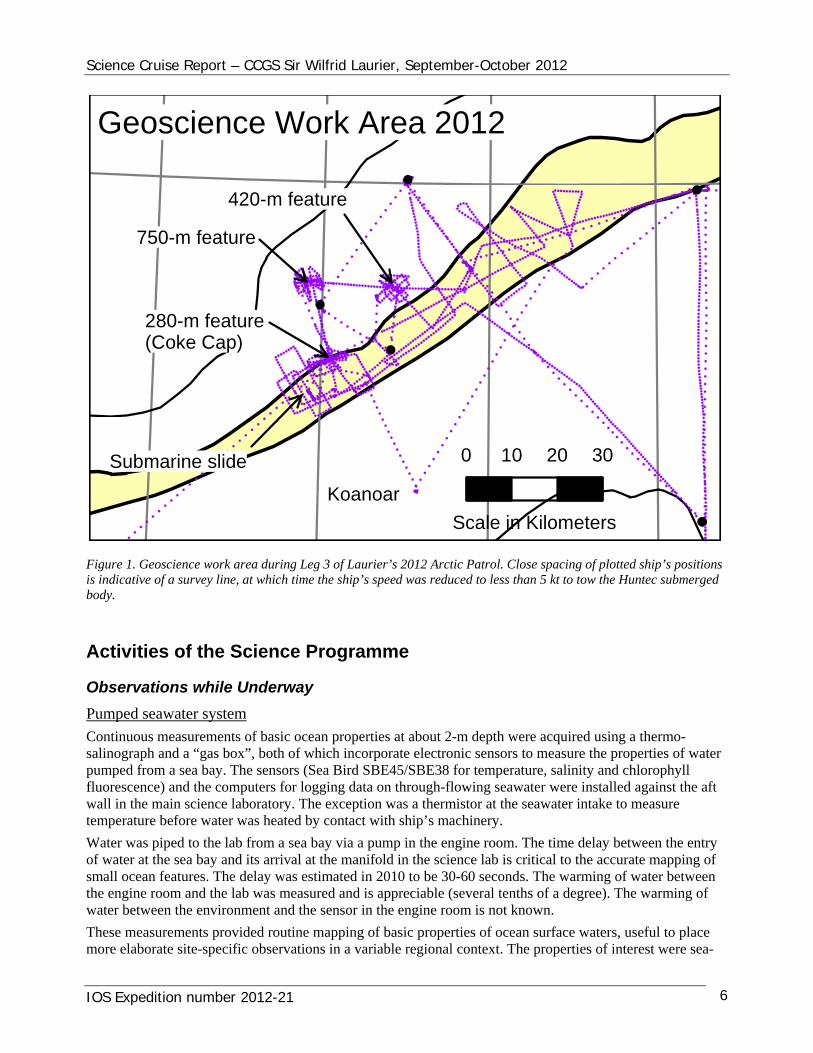
ure 1. Geoscience work area during Leg 3 of Laurier’s 2012 Arctic Patrol. Close spacing of plotted ship’s positions ative of a survey line, at which time the ship’s speed was reduced to less than 5 kt to tow the Huntec submerged
ody.
ctivities of the Science Programme
bservations while Underway
umped seawater system
Continusalinograph and a “gas boxpumfluorescence)wall in the main science lat
Water waof water at the sea baysmthe engine row
These m
ous measurements of basic ocean properties at about 2-m depth were acquired using a thermo-”, both of which incorporate electronic sensors to measure the properties of water
ped from a sea bay. The sensors (Sea Bird SBE45/SBE38 for temperature, salinity and chlorophyll and the computers for logging data on through-flowing seawater were installed against the aft
boratory. The exception was a thermistor at the seawater intake to measure emperature before water was heated by contact with ship’s machinery.
s piped to the lab from a sea bay via a pump in the engine room. The time delay between the entry and its arrival at the manifold in the science lab is critical to the accurate mapping of
all ocean features. The delay was estimated in 2010 to be 30-60 seconds. The warming of water between om and the lab was measured and is appreciable (several tenths of a degree). The warming of
ater between the environment and the sensor in the engine room is not known.
measurements provided routine mapping of basic properties of ocean surface waters, useful to place ore elaborate site-specific observations in a variable regional context. The properties of interest were sea-
280-m feature(Coke Cap)
750-m feature
420-m feature
Geoscience Work Area 2012
Submarine slide
Koanoar
0 10
Scale in Kilom
20 30
eters
Science Cruise Report – CCGS Sir Wilfrid Laurier, September-October 2012
surface temperature, salinity, dissolved oxygen, carbon dioxide, nitrogen and methane and chlorophyll fluorescence.
From time to time we withdrew samples of seawater via the manifold in the science lab. These samples were stored and transported to IOS for analysis.
The flow rate through the system was adjusted to about 4.8 litres per minute. Slower flows did not properly flush the fluorescence sensor..
Digital recording of acoustic backscatter (12 kHz)
A Simrad sounder operating at an acoustic frequency of 12 kHz is installed on CCGS Sir Wilfrid Laurier. The high power rating and low frequency of this sounder provides the capability to measure full ocean depths via a hull-mounted 12-kHz sonar transducer.
Unfortunately, the out-dated Simrad sounder does not allow access digital to the detected echo strength. During this mission we connected an IOS sounder with digital recording capability to the hull-mounted transducer via the installed cable to the hydrography lab. This sounder was used to record echoes from gas bubbles rising through the water column from vents at the seabed.
This sounder was operated in tandem with the Huntec (below).
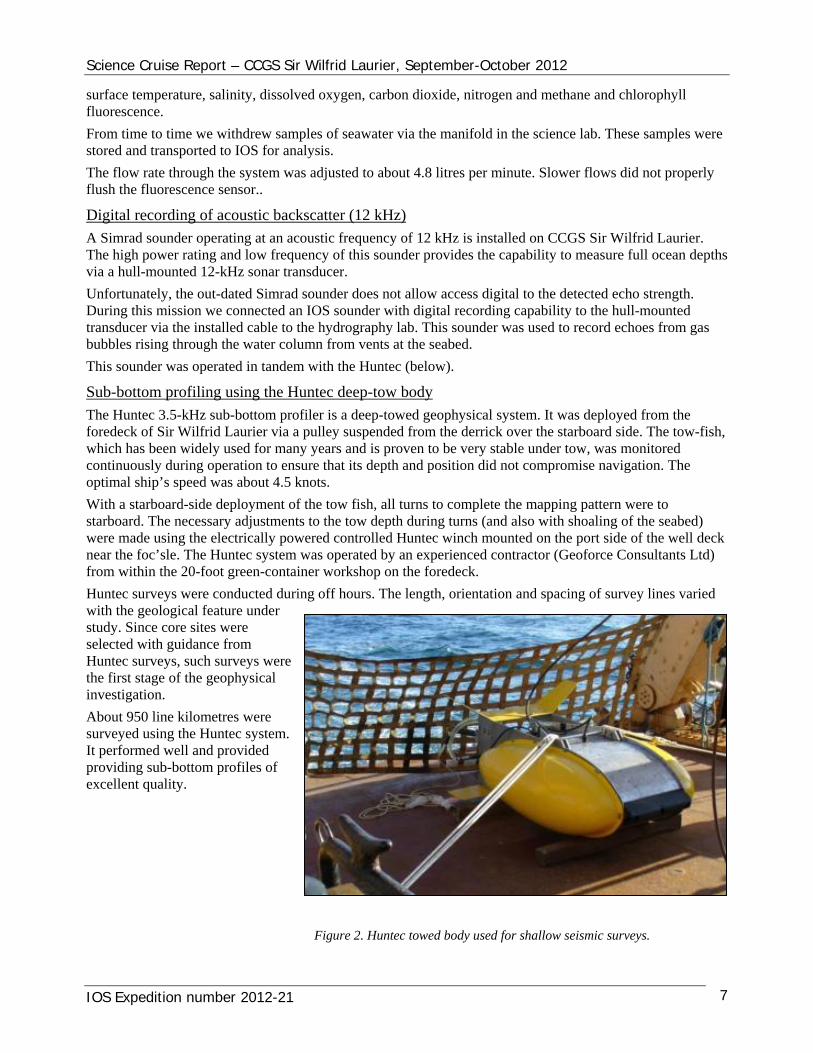
Sub-bottom profiling using the Huntec deep-tow body
The Huntec 3.5-kHz sub-bottom profiler is a deep-towed geophysical system. It was deployed from the foredeck of Sir Wilfrid Laurier via a pulley suspended from the derrick over the starboard side. The tow-fish, which has been widely used for many years and is proven to be very stable under tow, was monitored continuously during operation to ensure that its depth and position did not compromise navigation. The optimal ship’s speed was about 4.5 knots.
With a starboard-side deployment of the tow fish, all turns to complete the mapping pattern were to starboard. The necessary adjustments to the tow depth during turns (and also with shoaling of the seabed) were made using the electrically powered controlled Huntec winch mounted on the port side of the well deck near the foc’sle. The Huntec system was operated by an experienced contractor (Geoforce Consultants Ltd) from within the 20-foot green-container workshop on the foredeck.
Huntec surveys were conducted during off hours. The length, orientation and spacing of survey lines varied with the geological feature under study. Since core sites were selected with guidance from Huntec surveys, such surveys were the first stage of the geophysical investigation.
About 950 line kilometres were surveyed using the Huntec system. It performed well and provided providing sub-bottom profiles of excellent quality.
Figure 2. Huntec towed body used for shallow seismic surveys.
IOS Expedition number 2012-21 7
Science Cruise Report – CCGS Sir Wilfrid Laurier, September-October 2012
CTD and Rosette Casts
The CTD-rosette was deployed to measure vertical profiles of temperature and salinity (and other variables) at the site of each mooring. In situations where the delay between recovery and redeployment exceeded 12 hours, a second CTD profile was taken at the mooring site. The time required to complete a CTD cast was about 15 minutes.
The CTD (Sea Bird SBE9/SBE11) and rosette sampler (24x10-litre Model 1010 Niskin bottles, General Oceanics) was operated from the boom roughly amidships on the boat deck (port side). It was lowered on steel-jacketed conducting cable by the Hawboldt winch (under manual or automatic wire-speed control). The rosette was lowered to within 5 m of the seabed (distance measured by sonar altimeter).
The CTD provided continuous profiles of temperature, salinity, dissolved oxygen, light transmission and chlorophyll fluorescence. The sampling rosette was not used to collect water samples this year.
We use the CTD profile to calculate an accurate depth profile of sound speed, essential to the accurate calibration of ice thickness derived by sonar.
Sediment from the Seabed
Samples of sediment were collected via three methods, grab sampling, gravity coring and piston coring.
An IKU grab was used to collect bulk samples of surficial sediment. Solid carbonate concretions, shells and coarse granular material were of interest. The grab was deployed at sites that had been identified as candidates for the presence of such material through inspection using the ROV
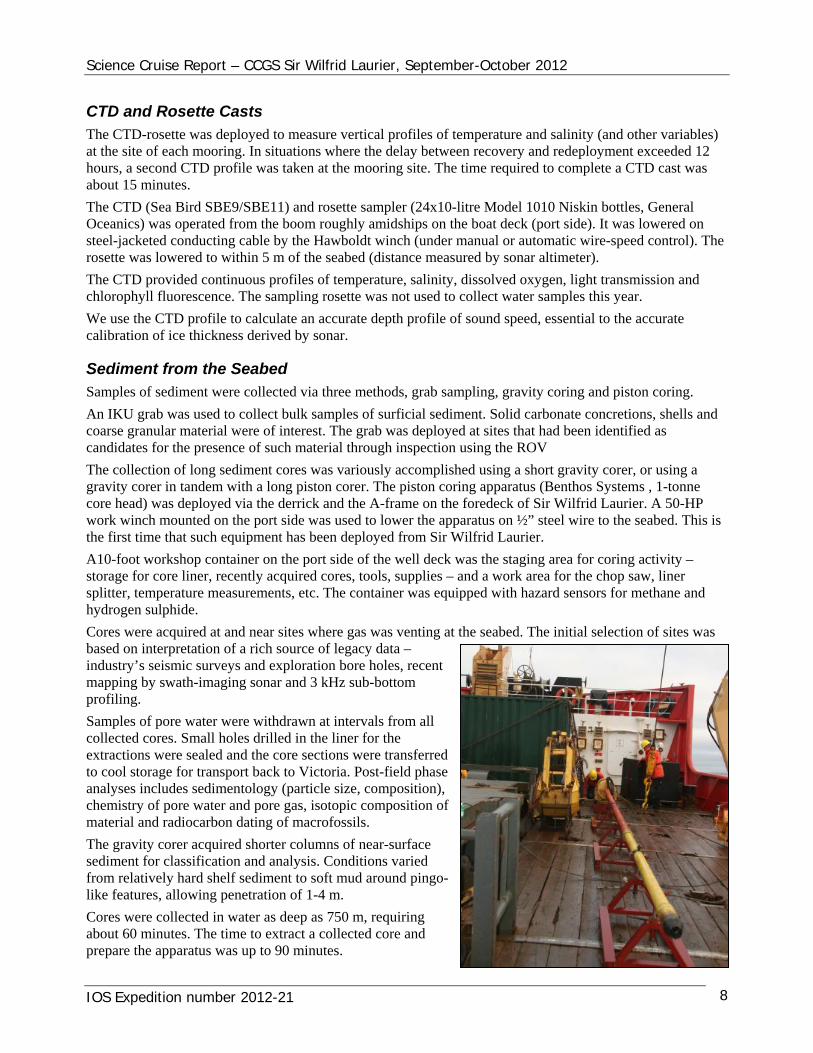
The collection of long sediment cores was variously accomplished using a short gravity corer, or using a gravity corer in tandem with a long piston corer. The piston coring apparatus (Benthos Systems , 1-tonne core head) was deployed via the derrick and the A-frame on the foredeck of Sir Wilfrid Laurier. A 50-HP work winch mounted on the port side was used to lower the apparatus on ½” steel wire to the seabed. This is the first time that such equipment has been deployed from Sir Wilfrid Laurier.
A10-foot workshop container on the port side of the well deck was the staging area for coring activity – storage for core liner, recently acquired cores, tools, supplies – and a work area for the chop saw, liner splitter, temperature measurements, etc. The container was equipped with hazard sensors for methane and hydrogen sulphide.
Cores were acquired at and near sites where gas was venting at the seabed. The initial selection of sites was based on interpretation of a rich source of legacy data – industry’s seismic surveys and exploration bore holes, recent mapping by swath-imaging sonar and 3 kHz sub-bottom profiling.
Samples of pore water were withdrawn at intervals from all collected cores. Small holes drilled in the liner for the extractions were sealed and the core sections were transferred to cool storage for transport back to Victoria. Post-field phase analyses includes sedimentology (particle size, composition), chemistry of pore water and pore gas, isotopic composition of material and radiocarbon dating of macrofossils.
The gravity corer acquired shorter columns of near-surface sediment for classification and analysis. Conditions varied from relatively hard shelf sediment to soft mud around pingo-like features, allowing penetration of 1-4 m.
Cores were collected in water as deep as 750 m, requiring about 60 minutes. The time to extract a collected core and prepare the apparatus was up to 90 minutes.
IOS Expedition number 2012-21 8
Science Cruise Report – CCGS Sir Wilfrid Laurier, September-October 2012
Dives by Remote Operated Vehicle (ROV)
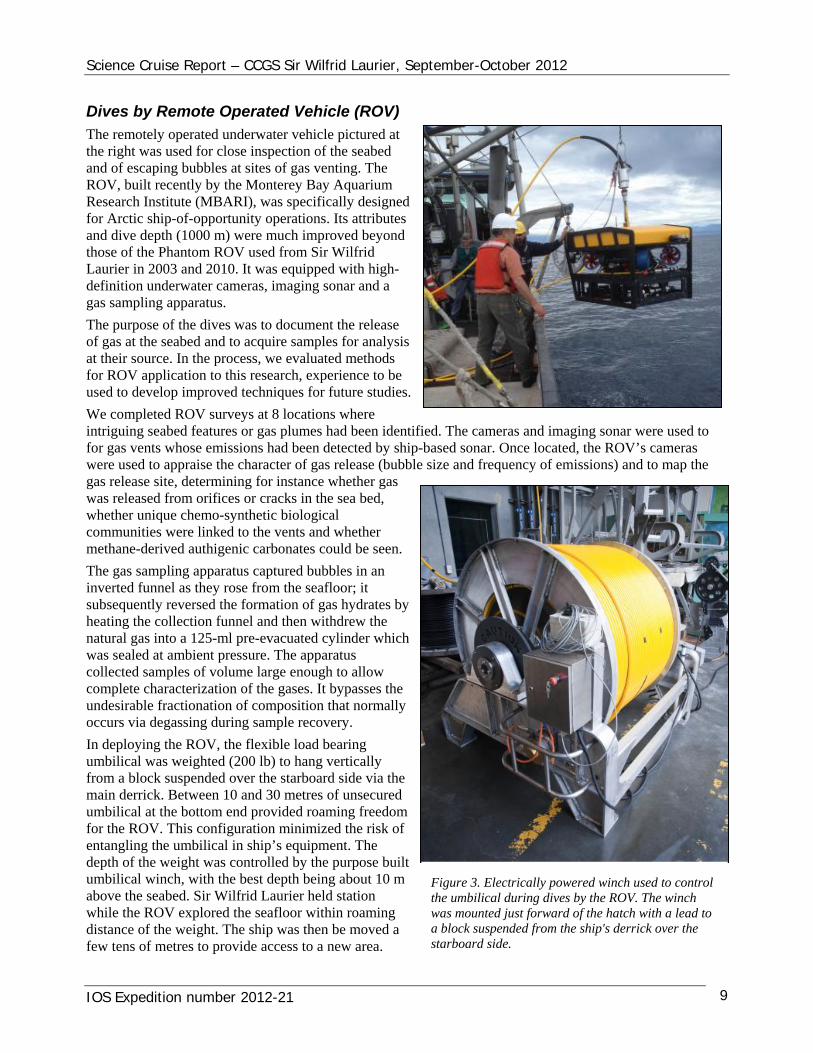
The remotely operated underwater vehicle pictured at the right was used for close inspection of the seabed and of escaping bubbles at sites of gas venting. The ROV, built recently by the Monterey Bay Aquarium Research Institute (MBARI), was specifically designed for Arctic ship-of-opportunity operations. Its attributes and dive depth (1000 m) were much improved beyond those of the Phantom ROV used from Sir Wilfrid Laurier in 2003 and 2010. It was equipped with high-definition underwater cameras, imaging sonar and a gas sampling apparatus.
The purpose of the dives was to document the release of gas at the seabed and to acquire samples for analysis at their source. In the process, we evaluated methods for ROV application to this research, experience to be used to develop improved techniques for future studies.
We completed ROV surveys at 8 locations where intriguing seabed features or gas plumes had been identified. The cameras and imaging sonar were used to for gas vents whose emissions had been detected by ship-based sonar. Once located, the ROV’s cameras were used to appraise the character of gas release (bubble size and frequency of emissions) and to map the gas release site, determining for instance whether gas was released from orifices or cracks in the sea bed, whether unique chemo-synthetic biological communities were linked to the vents and whether methane-derived authigenic carbonates could be seen.
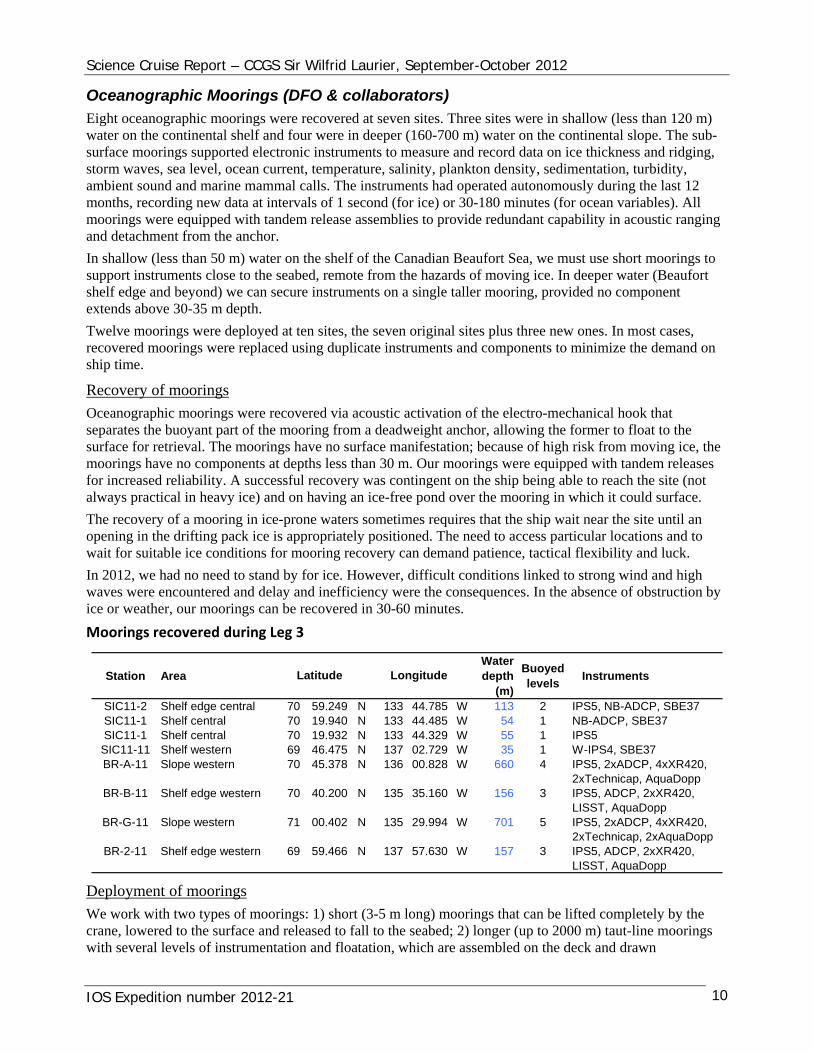
Figure 3. Electrically powered winch used to control the umbilical during dives by the ROV. The winch was mounted just forward of the hatch with a lead to a block suspended from the ship's derrick over the starboard side.
The gas sampling apparatus captured bubbles in an inverted funnel as they rose from the seafloor; it subsequently reversed the formation of gas hydrates by heating the collection funnel and then withdrew the natural gas into a 125-ml pre-evacuated cylinder which was sealed at ambient pressure. The apparatus collected samples of volume large enough to allow complete characterization of the gases. It bypasses the undesirable fractionation of composition that normally occurs via degassing during sample recovery.
In deploying the ROV, the flexible load bearing umbilical was weighted (200 lb) to hang vertically from a block suspended over the starboard side via the main derrick. Between 10 and 30 metres of unsecured umbilical at the bottom end provided roaming freedom for the ROV. This configuration minimized the risk of entangling the umbilical in ship’s equipment. The depth of the weight was controlled by the purpose built umbilical winch, with the best depth being about 10 m above the seabed. Sir Wilfrid Laurier held station while the ROV explored the seafloor within roaming distance of the weight. The ship was then be moved a few tens of metres to provide access to a new area.
IOS Expedition number 2012-21 9
Science Cruise Report – CCGS Sir Wilfrid Laurier, September-October 2012
Oceanographic Moorings (DFO & collaborators)
Eight oceanographic moorings were recovered at seven sites. Three sites were in shallow (less than 120 m) water on the continental shelf and four were in deeper (160-700 m) water on the continental slope. The sub-surface moorings supported electronic instruments to measure and record data on ice thickness and ridging, storm waves, sea level, ocean current, temperature, salinity, plankton density, sedimentation, turbidity, ambient sound and marine mammal calls. The instruments had operated autonomously during the last 12 months, recording new data at intervals of 1 second (for ice) or 30-180 minutes (for ocean variables). All moorings were equipped with tandem release assemblies to provide redundant capability in acoustic ranging and detachment from the anchor.
In shallow (less than 50 m) water on the shelf of the Canadian Beaufort Sea, we must use short moorings to support instruments close to the seabed, remote from the hazards of moving ice. In deeper water (Beaufort shelf edge and beyond) we can secure instruments on a single taller mooring, provided no component extends above 30-35 m depth.
Twelve moorings were deployed at ten sites, the seven original sites plus three new ones. In most cases, recovered moorings were replaced using duplicate instruments and components to minimize the demand on ship time.
Recovery of moorings
Oceanographic moorings were recovered via acoustic activation of the electro-mechanical hook that separates the buoyant part of the mooring from a deadweight anchor, allowing the former to float to the surface for retrieval. The moorings have no surface manifestation; because of high risk from moving ice, the moorings have no components at depths less than 30 m. Our moorings were equipped with tandem releases for increased reliability. A successful recovery was contingent on the ship being able to reach the site (not always practical in heavy ice) and on having an ice-free pond over the mooring in which it could surface.
The recovery of a mooring in ice-prone waters sometimes requires that the ship wait near the site until an opening in the drifting pack ice is appropriately positioned. The need to access particular locations and to wait for suitable ice conditions for mooring recovery can demand patience, tactical flexibility and luck.
In 2012, we had no need to stand by for ice. However, difficult conditions linked to strong wind and high waves were encountered and delay and inefficiency were the consequences. In the absence of obstruction by ice or weather, our moorings can be recovered in 30-60 minutes.
Moorings recovered during Leg 3
Station AreaWater depth
(m)
Buoyed levels
Instruments
SIC11-2 Shelf edge central 70 59.249 N 133 44.785 W 113 2 IPS5, NB-ADCP, SBE37SIC11-1 Shelf central 70 19.940 N 133 44.485 W 54 1 NB-ADCP, SBE37SIC11-1 Shelf central 70 19.932 N 133 44.329 W 55 1 IPS5
SIC11-11 Shelf western 69 46.475 N 137 02.729 W 35 1 W-IPS4, SBE37BR-A-11 Slope western 70 45.378 N 136 00.828 W 660 4 IPS5, 2xADCP, 4xXR420,
2xTechnicap, AquaDoppBR-B-11 Shelf edge western 70 40.200 N 135 35.160 W 156 3 IPS5, ADCP, 2xXR420,
LISST, AquaDoppBR-G-11 Slope western 71 00.402 N 135 29.994 W 701 5 IPS5, 2xADCP, 4xXR420,
2xTechnicap, 2xAquaDoppBR-2-11 Shelf edge western 69 59.466 N 137 57.630 W 157 3 IPS5, ADCP, 2xXR420,
LISST, AquaDopp
Latitude Longitude
Deployment of moorings
We work with two types of moorings: 1) short (3-5 m long) moorings that can be lifted completely by the crane, lowered to the surface and released to fall to the seabed; 2) longer (up to 2000 m) taut-line moorings with several levels of instrumentation and floatation, which are assembled on the deck and drawn
IOS Expedition number 2012-21 10
Science Cruise Report – CCGS Sir Wilfrid Laurier, September-October 2012
progressively away from the ship by the FRC (fast-response craft) as components are lifted over the side. The last lift is the release assembly with deadweight anchor, which is dropped when the mooring line is straight (no loops) and no longer attached to the FRC.
The time required to deploy two short moorings was about 15-30 minutes. Longer moorings required between 30 minutes and 2 hours, depending on complexity (number of lifts) and sea state.
It was desirable to determine the resting positions of moorings that were dropped in water deeper than 150 m. To do this, the ship was taken to three locations around the drop site, each about twice the depth from the site, and the slant range to the release transponders was measured acoustically. This triangulation procedure required as much as an hour of additional station time.
Preparation of moorings
The mooring team used the ‘tween-decks space in the hold of Sir Wilfrid Laurier to prepare mooring components, to disassemble recovered equipment, to stage and assemble new moorings before deployment. Preparation of the instruments for moorings was carried out in a cleaner space, a 20-foot laboratory container installed for this expedition beneath the davits on boat deck (starboard side).
It is necessary to calibrate compasses on the Work Horse ADCPs near their location of use because the geomagnetic field in the Beaufort and Chukchi Seas is weak. We measure the non-linearity in the compass’ response to changing azimuth under carefully controlled conditions. This year the compass swings for most instruments were completed in the North during a separate, earlier visit. There was no opportunity this year to complete the swing of the compass used at site SIC12-9; this must be done after recovery but before re-furbishing the instrument in October 2013.
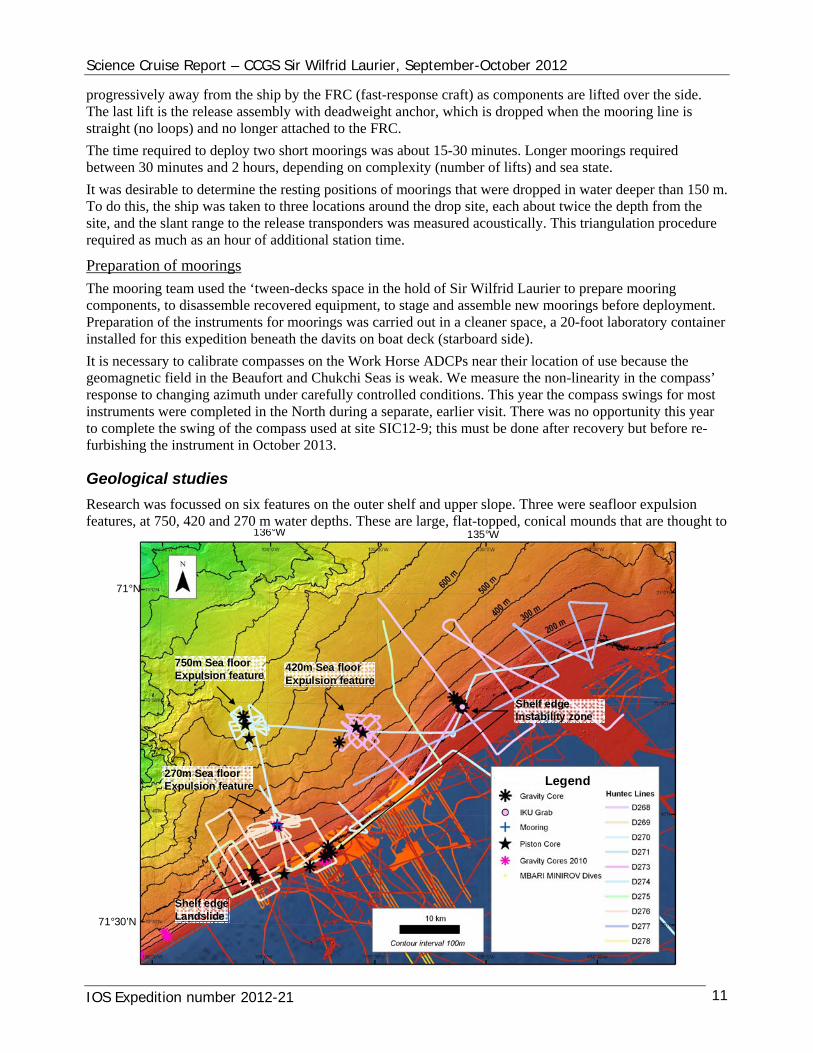
Geological studies
Research was focussed on six features on the outer shelf and upper slope. Three were seafloor expulsion features, at 750, 420 and 270 m water depths. These are large, flat-topped, conical mounds that are thought to
136°W 135°W
71°N
71°30’N
750m Sea floorExpulsion feature
420m Sea floorExpulsion feature
270m Sea floorExpulsion feature
Shelf edgeLandslide
Legend
Shelf edge Instability zone
IOS Expedition number 2012-21 11
Science Cruise Report – CCGS Sir Wilfrid Laurier, September-October 2012
be the consequence of upward movement of sediment, pore water and gas from depth. Other sites were associated with a terrain-failure feature at the shelf -slope transition. This zone of instability occupies a broad area with disturbed hummocky topography interspersed with small sediment expulsion features and depressions. Additional Huntec surveys were competed in the Mackenzie Trough to study its surficial geology.
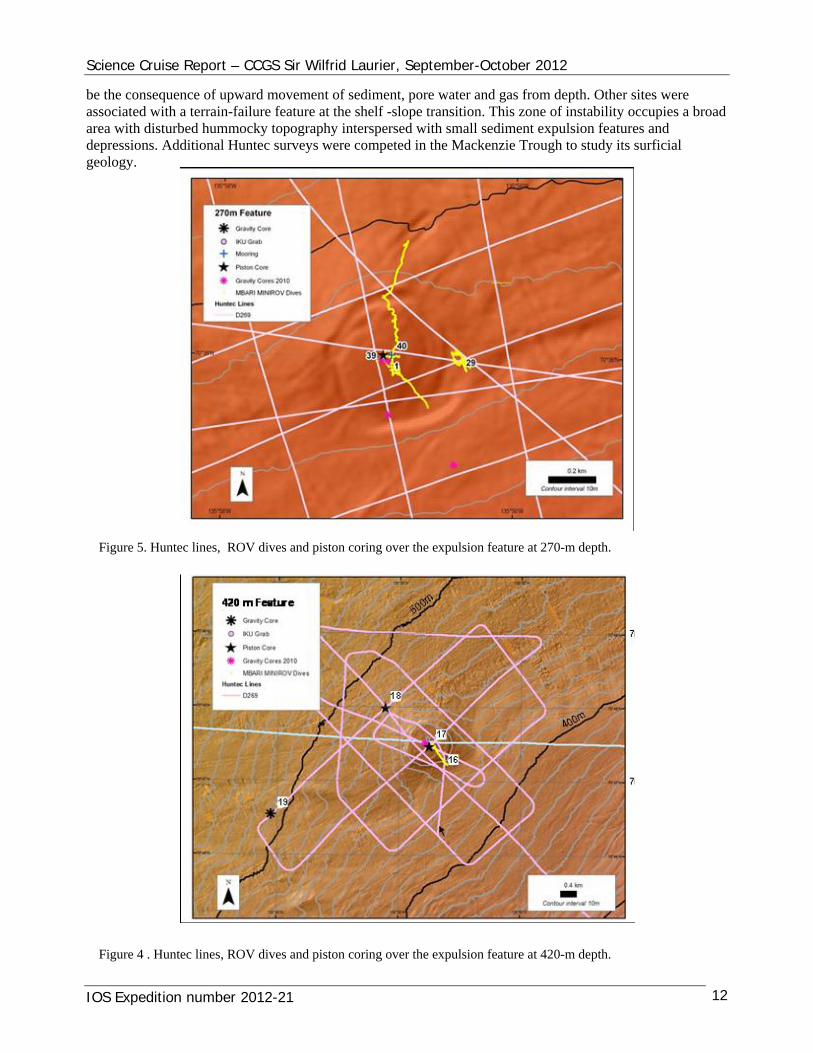
Figure 5. Huntec lines, ROV dives and piston coring over the expulsion feature at 270-m depth.
Figure 4 . Huntec lines, ROV dives and piston coring over the expulsion feature at 420-m depth.
IOS Expedition number 2012-21 12
Science Cruise Report – CCGS Sir Wilfrid Laurier, September-October 2012
IOS Expedition number 2012-21 13
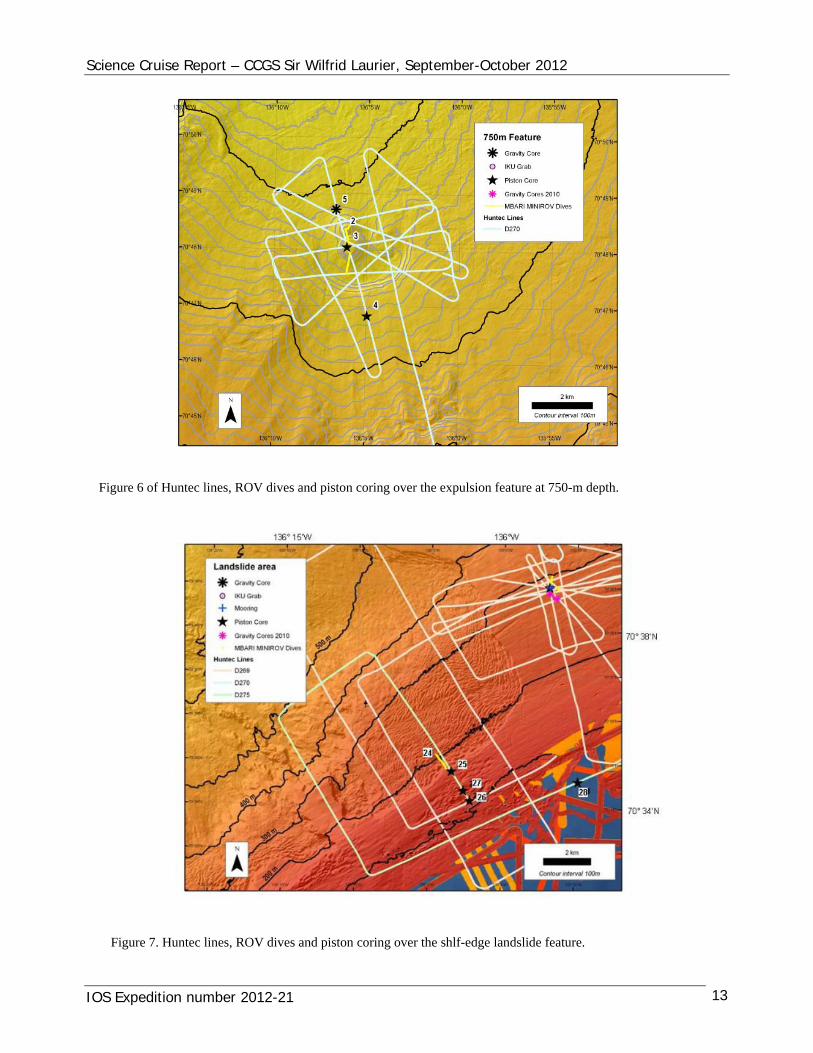
Figure 6 of Huntec lines, ROV dives and piston coring over the expulsion feature at 750-m depth.
Figure 7. Huntec lines, ROV dives and piston coring over the shlf-edge landslide feature.
Science Cruise Report – CCGS Sir Wilfrid Laurier, September-October 2012
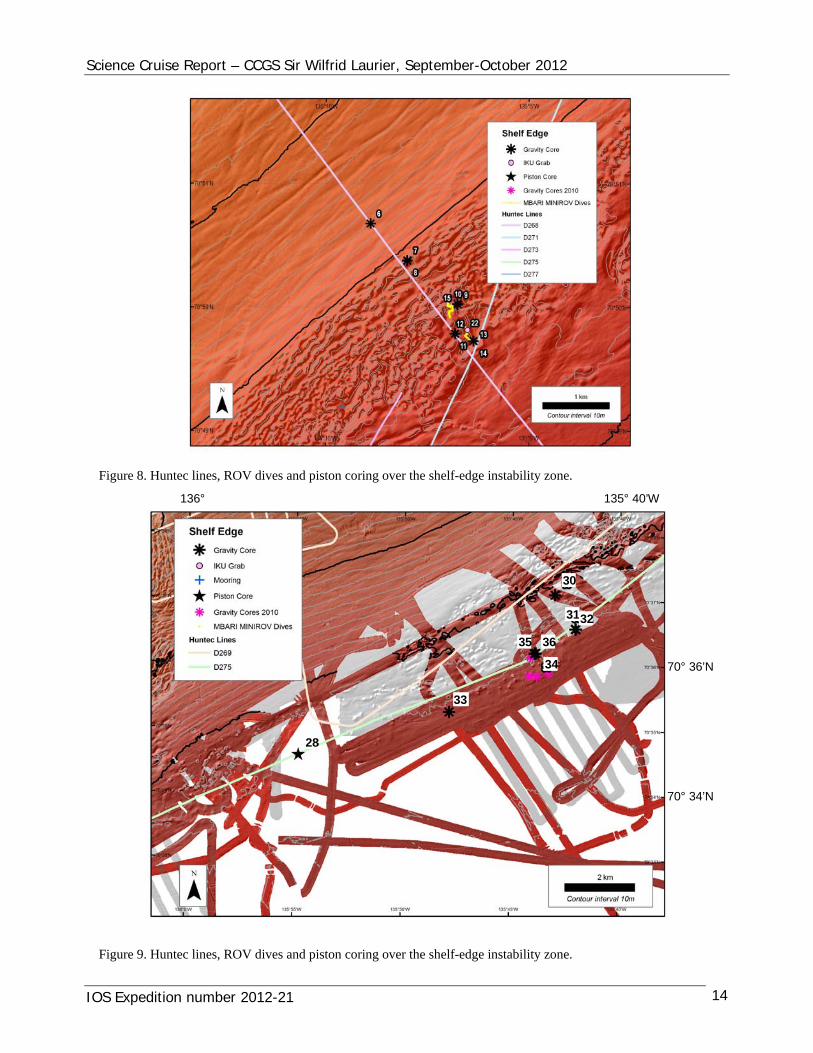
Figure 8. Huntec lines, ROV dives and piston coring over the shelf-edge instability zone.
70° 34’N
135° 40’W136°
70° 36’N
3030
3131
3636
3434
3535
2828
3333
3232
Figure 9. Huntec lines, ROV dives and piston coring over the shelf-edge instability zone.
IOS Expedition number 2012-21 14
Science Cruise Report – CCGS Sir Wilfrid Laurier, September-October 2012
IOS Expedition number 2012-21 15
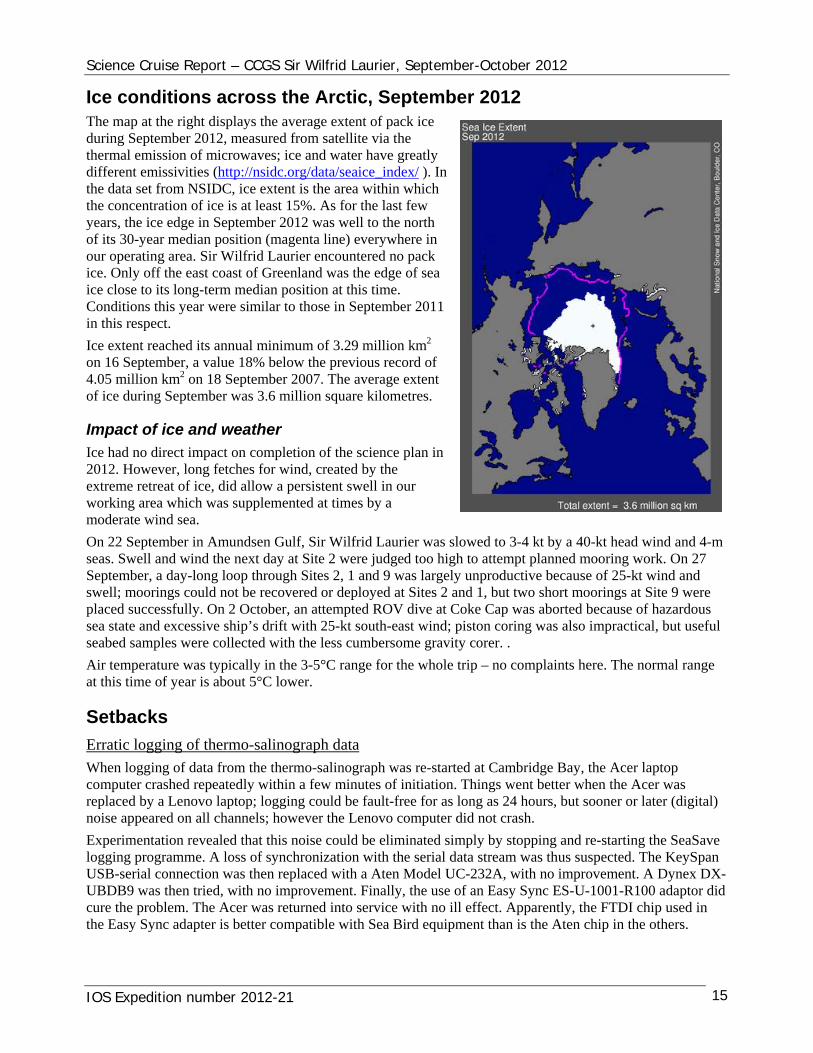
Ice conditions across the Arctic, September 2012 The map at the right displays the average extent of pack ice during September 2012, measured from satellite via the thermal emission of microwaves; ice and water have greatly different emissivities (http://nsidc.org/data/seaice_index/ ). In the data set from NSIDC, ice extent is the area within which the concentration of ice is at least 15%. As for the last few years, the ice edge in September 2012 was well to the north of its 30-year median position (magenta line) everywhere in our operating area. Sir Wilfrid Laurier encountered no pack ice. Only off the east coast of Greenland was the edge of sea ice close to its long-term median position at this time. Conditions this year were similar to those in September 2011 in this respect.
Ice extent reached its annual minimum of 3.29 million km2 on 16 September, a value 18% below the previous record of 4.05 million km2 on 18 September 2007. The average extent of ice during September was 3.6 million square kilometres.
Impact of ice and weather Ice had no direct impact on completion of the science plan in 2012. However, long fetches for wind, created by the extreme retreat of ice, did allow a persistent swell in our working area which was supplemented at times by a moderate wind sea.
On 22 September in Amundsen Gulf, Sir Wilfrid Laurier was slowed to 3-4 kt by a 40-kt head wind and 4-seas. Swell and wind the next day at Site 2 were judged too high to attempt planned mooring work. On 27September, a day-long loop through Sites 2, 1 and 9 was largely unproductive because of 25-kt wind and swell; moorings could not be recovered or deployed at Sites 2 and 1, but two short moorings at Site 9 were placed successfully. On 2 October, an attempted ROV dive at Coke Cap was aborted because of hazardous sea state and excessive ship’s drift with 25-kt south-east wind; piston cori
m
ng was also impractical, but useful
C range for the whole trip – no complaints here. The normal range at this time of year is about 5°C lower.
seabed samples were collected with the less cumbersome gravity corer. .
Air temperature was typically in the 3-5°
Setbacks
Erratic logging of thermo-salinograph data
When logging of data from the thermo-salinograph was re-started at Cambridge Bay, the Acer laptop computer crashed repeatedly within a few minutes of initiation. Things went better when the Acer was replaced by a Lenovo laptop; logging could be fault-free for as long as 24 hours, but sooner or later (digital)
id in
noise appeared on all channels; however the Lenovo computer did not crash.
Experimentation revealed that this noise could be eliminated simply by stopping and re-starting the SeaSave logging programme. A loss of synchronization with the serial data stream was thus suspected. The KeySpan USB-serial connection was then replaced with a Aten Model UC-232A, with no improvement. A Dynex DX-UBDB9 was then tried, with no improvement. Finally, the use of an Easy Sync ES-U-1001-R100 adaptor dcure the problem. The Acer was returned into service with no ill effect. Apparently, the FTDI chip used the Easy Sync adapter is better compatible with Sea Bird equipment than is the Aten chip in the others.
Science Cruise Report – CCGS Sir Wilfrid Laurier, September-October 2012
IOS Expedition number 2012-21 16
A different fault arose when the GPS feed via LAN to the logging computer failed shortly after we left the ship. The position became “frozen” at 71.62900°N, 157.48516°W after 15:16 utc on October 6 when jpast Barrow AK. The failure occu
ust rs in the file: Start-up on 05Oct (At 146 36 W).hex. In consequence, the
TSG during Laurier's journey home (samples every 5 ship's position will have to be borrowed for the seconds). The TSG data are fine.
Malfunctions of moored instruments
Narrow-band ADCP s/n 506 at SIC11-2:
The data in this instrument was recorded in 96 files. Only files numbered 81 and higher were of the expected length (293 kb). Lower numbered files were of various lengths: all those numbered evenly contained no dathose with odd numbers contained varying amounts of data. No data were lost; indeed the first ensemblesodd number
ta; in
ed files were frequently duplicates of data in the preceding odd numbered file. Since only the emory card in the first slot is
e instruments because the battery capacity was wo LISSTs and a Long Ranger ADCP, each operating about 8 months, and two
ediment traps. The cause appeared to be t
med via corrosion, allowing some damage to inum) and to the stainless steel pins that secure the bio-block motor. The
g BR-G-11 flooded. The carousel was positioned at cup #1 as clogged with sediment.
first 2-Mb of recorded data were affected in this way, malfunction of the msuspected.
Incomplete data recording during October 2011 through September 2012
In most cases the instruments placed on BREA moorings returned full records from the 12-month deployment. However shorter records were acquired by sominsufficient; these included tQuartermaster ADCPs which stopped after 10-11 months.
Corrosion of stainless steel
Corrosion was again an issue with stainless shackles on Technicapp scontact with a galvanized pear ring used for lifting the trap, which was not isolated from the stainless supporpost and shackle. This problem was corrected before re-deployment.
All anodes on the LISST cage (mooring BR-B-11) were consuthe LISST housing (anodized alumanodes on the instrument itself were only partially corroded.
No samples from a sediment trap
The motor of the lower sediment trap on moorinbeneath the funnel opening and did not turn further. The funnel w
Time-variable gain for the 12-kHz sounder
The Simrad hull-mounted 12-kHz transducer was driven via an echo sounder from IOS. Data were loggea laptop computer using the Sounder.exe programme provided by Svein Vagle. Unfortunately this programme and its interplay with controls on the echo sounder were poorly documented, particularlyrelation to gain control. It seemed too easy to saturate the amplifiers leaving very little dynamic range. Moreover, th
d to
in
e time-variable gain behaved quite strangely; standard inverse-square and exponential tude
y recorded data, this was only possible for files that closed at the specified
In consequence, the quality of the digital records from this sonar was not good. It is recommended that all ngs before reusing this setup.
corrections did not seem to be available; it was not clear whether adjustments were prescribed for amplior intensity.
The processing overheads within the programme were not documented. This may it difficult to choose operating parameters that optimized the characteristic of the recording for the domain under study.
Although Sounder.exe could replasize. Files that were smaller because of changes to operating parameters, or system crash, were inaccessiblefor viewing.
these shortcomi
Science Cruise Report – CCGS Sir Wilfrid Laurier, September-October 2012
IOS Expedition number 2012-21 17
Successes
All 8 moorings deployed from Sir Wilfrid Laurier and from Amundsen in 2011 were recovered. All IOS instruments yielded full records of data. Almost all instruments in the larger suite deployed on BREA moorings returned full records; 5 stopped 1-4 months early and only 1, a sediment trap, failed almost
ear’s high level of success is cause for congratulation. The data from these ous
l LISST instrument.
e A sample of near-surface sediment was acquired on each of these drops by
ere acquired at other sites. 2
Huntec survey were completed, during the first deployment of this apparatus in the Beaufort Sea
upper continental slope and subsequently inspected by ROV video and ct evidence of the presence of an ice sheet over the Mackenzie shelf ows the previously accepted non-glaciated character of this area into
immediately after deployment via flooding. Because the risk of loss or malfunction in ocean mooring projects is always present, this ymoorings contribute to the continuing record of sea ice and ocean in the Beaufort Sea, which is continuover 22 years at some sites.
Twelve moorings were placed at 9 sites, as planned. New sites offer the promise of more complete regional coverage in the years to come.
Two BREA moorings delivered the first time-series data from the Beaufort on the size distribution of suspended sediment particles, using the nove
A 10-m piston-coring apparatus was deployed for the first time from Sir Wilfrid Laurier. It was used for thsuccessful collection of 9 cores. the gravity corer that is part of the piston-coring apparatus. 11 gravity cores wsamples were collected using the IKU grab.
8 ROV dives were conducted, yielding hours of video for geological & biological characterization, over a combined survey path of 4 km.
Samples of gas were collected by ROV at in situ pressure from active vents
950 km of
Buried glacial till was detected on thesampled by the IKU grab. This is direduring the Ice Age. This discovery thrquestion.
Issues of Concern 2012
Deployment of the piston corer
The piston corer was used with a 30-foot core barrel. It was prepared on supports laid out on the starboard side of the foredeck, where it sat parallel to the rail between the hatch and the A-frame. It was lifted from the deck using two picks on the main derrick; the one doing most of the lifting was attached to the coring weight;
d its bution, the manoeuvre was only possible in modest seas.
e improved if the corer pports placed between the A-frame and the rail. A safe lift of only a foot or be moved over the side and the barrel promptly lowered into a vertical
the other was attached 2/3 of the way down the barrel. The corer had to be lifted in horizontal position to higher than the A-frame (i.e., 4-5 m) before it could be moved outboard over it, then lowered and secured to the ½-inch wire from the coring winch via the A-frame. Because of the great weight of the apparatus, anuneven distri
The practicality and safety of deploying the corer from Sir Wilfrid Laurier could bwere stowed and prepared on suso would then allow the corer toorientation.
I recommend that this possibility be explored before next use of the piston corer.
Side towing the Huntec fish
The fish can draw the line very close to the hull (and the screws) under certain conditions of wind, tow depth ossible to adjust the trim tabs on the fish sow that it always tows out slightly and ship’s speed. It should be p
to starboard.
Possibilities for improved control of the tow-fish should be explored. Some new capability to control how the fish flies should be installed before next use.
Science Cruise Report – CCGS Sir Wilfrid Laurier, September-October 2012
IOS Expedition number 2012-21 18
Heater in the rosette shelter
Fortunately, we had no reason to use the heater in the rosette shelter during this expedition; air temperaturewas always above freezing. However, the 4-kW electri
cal heater that was available in this work are has in the
possible source of injury. Moreover, warm air is blown sideways from this unit at a height of
tte most needing it, which are mounted t
d before next cold-weather use of the
last year been replaced by a much bulkier heat pump. The larger unit impedes work around the samplingrosette and is aalmost 2 m. the heat therefore completely misses the parts of the roseat the bottom of the rosette near deck level. The unit that was replaced directed heat downwards so that ispread over the deck and rose up through the rosette.
I recommend that possibilities for improving this setup be exploreCTD-rosette.
Computer-instrument communication via USB-serial adaptors
As described earlier in this report, we several times encountered difficulties in communicating between scientific instruments and computers using USB-serial adaptors.
r
e pdate to allow user’s control should be
med incapable of staying synchronized with the serial data stream from the instrument. nd a USB-serial and laptop combination that worked with the thermo-salinograph.
by
In some instances, the difficulties were traceable to the high baud rate – 115.2 kilobaud seems too fast fosome laptop/USB-serial combinations. We had repeated difficulties communicating with ASL Environmental’s IPS5 and AWSP5 instruments at 115 kilobaud via USB-serial connections. With thesinstruments, the user has no control over the baud rate. Perhaps an usought?
In our most inconvenient malfunction, that in logging data from the thermo-salinograph, the USB-serial adaptor seeEventually we fouHowever, we were fortunate to have options on board that worked.
I recommend that we equip the thermo-salinograph of each ship at least two working options for logging data, so that full records can be obtained from Arctic cruises, even when the system is not monitoredscientists.
Applying paint
Science’s green container lab on thdeck around the perimeter of the co
e foredeck seems to be shedding paint: a green powder accumulates on the ntainer during the course of the summer. I suggest exploring the
implication of this paint ablation on the durability of this container.
The boom used to deploy sonar transducers at 4-m depth on the port side of the foredeck is rusting badly. It needs to be sand-blasted and painted to inhibit further degradation.
Information where it is needed
Both scientific and ship’s operations during this expedition had need to view information in one place that
n; visualization of underwater bubble clouds, logged in the aft lab rk with the Huntec system and the ROV, or on the deck to
ts
was collected by sensors in another. Examples include: soundings at 12-kHz sounder, logged in the aft lab but needed on the bridge to guide navigatioand needed in the green container to guide womonitor the descent of the piston corer; ROV depth, position and heading, logged in the green container and needed on the bridge to inform ship manoeuvring.
I recommend discussion of possible solutions to these needs that have flexibility to meet changing interesand priorities of diverse scientific studies.
Suggestions from IMG-Golder personnel
The implementation of the mooring activity should be reviewed with the intent of staggering instruments so that those recovered can be brought back from the cruise for servicing and also be available for compass calibration (as needed). Such considerations would makes for a more streamlined process aboard ship in preparing moorings for deployment.
Science Cruise Report – CCGS Sir Wilfrid Laurier, September-October 2012
IOS Expedition number 2012-21 19
The use of silicone grease and duct tape to protect Impulse bulkhead connectors from corrosion of the powerpin on RDI ADCPs appears to be effective in preventing leaks, and should be continued..
Care is required in the deployment of sediment traps in relation to the isolation of stainless steel componeCorrosion of
nts. stainless shackles could easily be the cause of mooring separation and loss. The galvanized steel
t traps
less steel cages and fittings to provide corrosion resistance and corrosion observed on several stainless cages, especially the LISST cages on
amples. Spinning of the mooring can compromise the
lifting rings that were in direct contact with the stainless support should be removed from the sedimenand replaced with a rope loop, as was done before deployments this year.
Particular care is needed with stainmitigation. Severe anode corrosion was
R-B B and BR-2. This will be especially important if long term deployments of more than 12 months are considered.
Use of vanes and swivels on all current meters should be considered to minimize variance in current direction during the acquisition of time-average data saccuracy of current measurement.
Issues surviving from earlier years
This is needed to lower the heating bill for this container, and increase the level of comfort.
two
mo-salinograph operation freeze up when d have to shut down the system for several days when
ackside of the sensor should be heavily insulated with polystyrene foam from the warmth of engine room.
Thanks to CCGS Sir Wilfrid Laurier I thank Captain Stu Aldridge and the Laurier’s White Crew for their commitment to and roles in completing our work. As usual, Sir Wilfrid Laurier has played a critical and effective role in maintaining an Arctic marine science research programme within Fisheries and Oceans.
Institute a routine test procedure for Y-cables and bulkhead connectors associated with use of external supplementary batteries for Work Horse ADCPs
There was no malfunction from this cause during 2010-11. Apparently, our new practice last year of applying a thin layer of silicone grease to the connector’s seals has been effective in reducing leakage.
Corrosion of stainless steel parts of the CART releases
Only two of the CART releases recovered this year had appreciable damage from corrosion. Thesewere deployed before we rebuilt our inventory, with a generous application of “blue goop” to all components of stainless steel in close contact
Both the seawater pump and the seawater drain for the thersurface water reaches freezing temperature. We diin ice on this expedition, for the first time in several years. This issue has yet to be addressed.
Better results might be obtained by cementing the engine room sea-water temperature sensor with thermal-joint compound to the inside of the hull plating. The b
Science Cruise Report – CCGS Sir Wilfrid Laurier, September-October 2012
Inter-annual variation in the marine environment
Surface temperature and salinity in the Beaufort (late September)
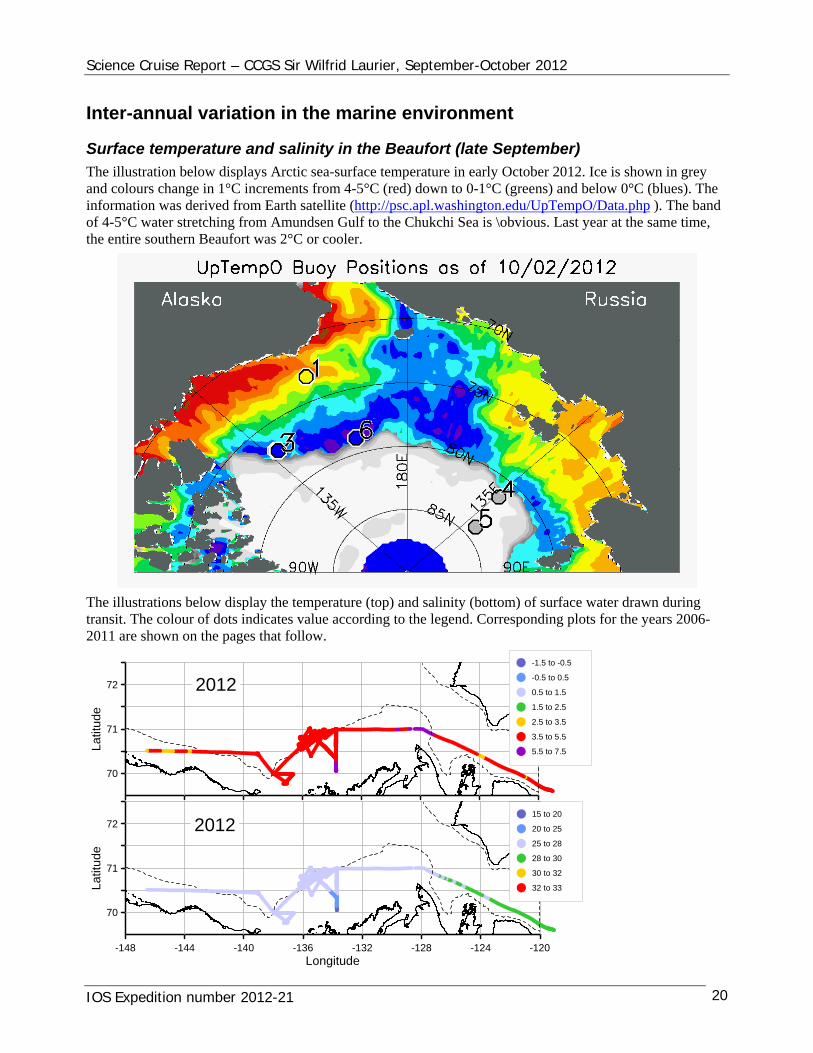
The illustration below displays Arctic sea-surface temperature in early October 2012. Ice is shown in grey and colours change in 1°C increments from 4-5°C (red) down to 0-1°C (greens) and below 0°C (blues). The information was derived from Earth satellite (http://psc.apl.washington.edu/UpTempO/Data.php ). The band of 4-5°C water stretching from Amundsen Gulf to the Chukchi Sea is \obvious. Last year at the same time, the entire southern Beaufort was 2°C or cooler.
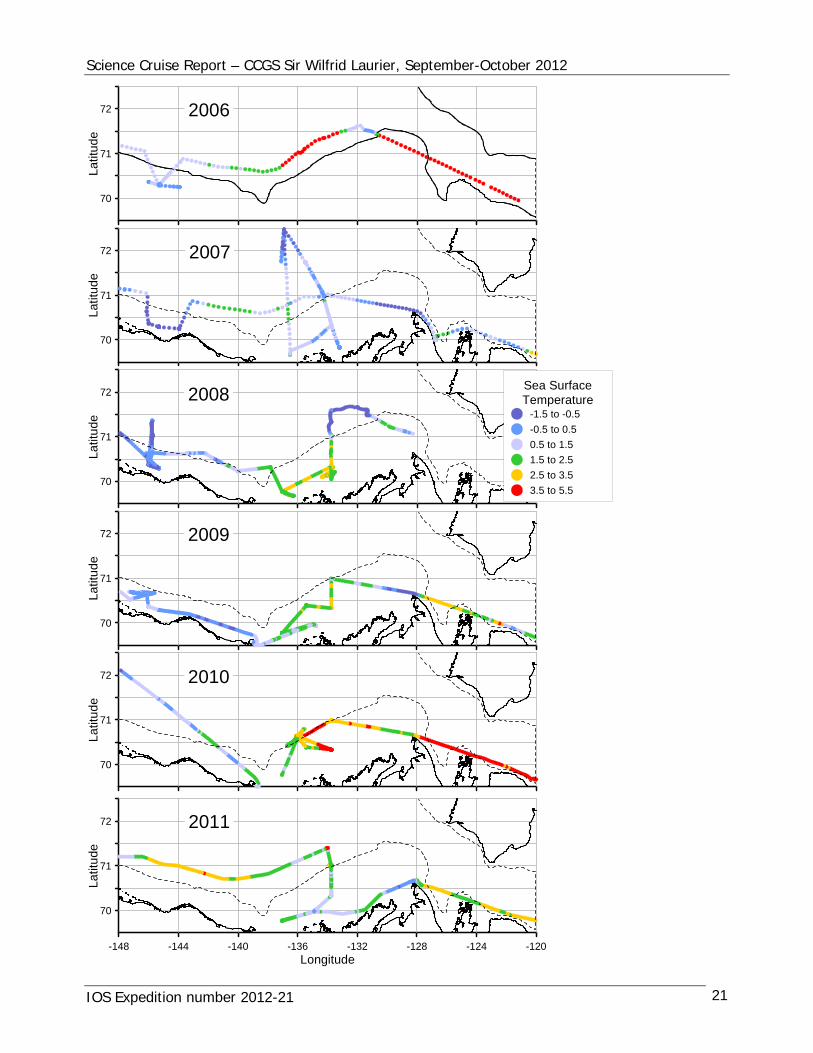
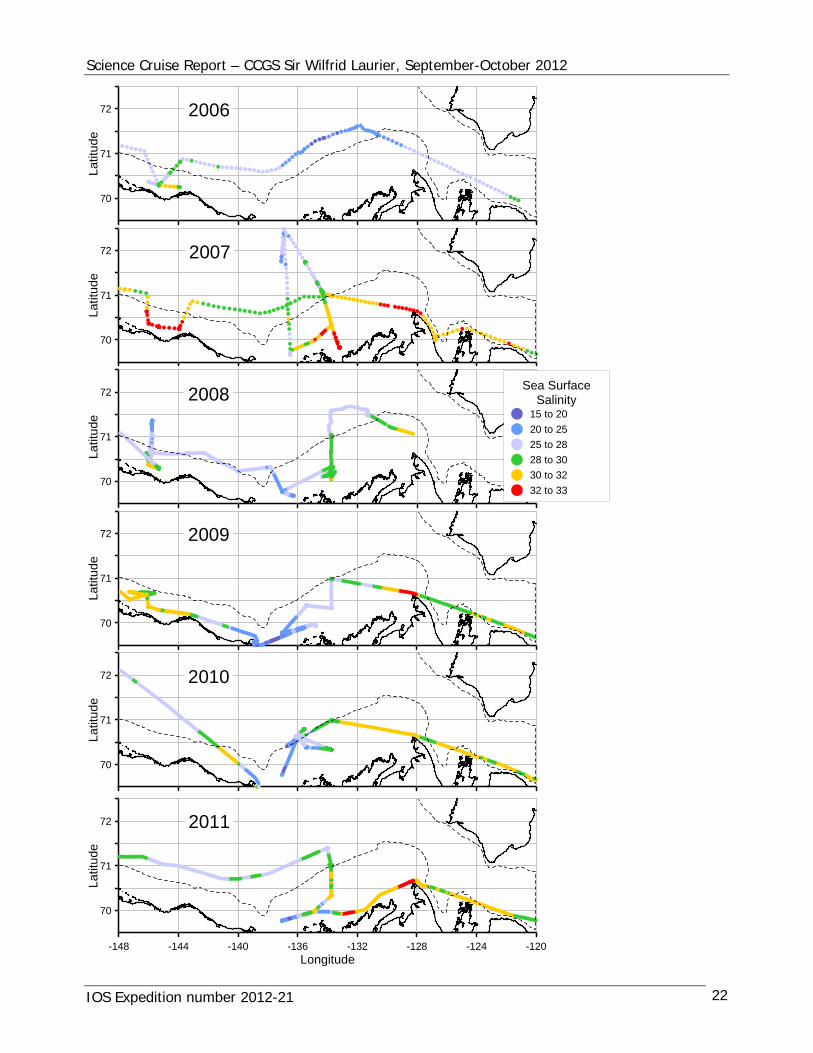
The illustrations below display the temperature (top) and salinity (bottom) of surface water drawn during transit. The colour of dots indicates value according to the legend. Corresponding plots for the years 2006-2011 are shown on the pages that follow.
70
71
72
Lat
itude
-1.5 to -0.5
-0.5 to 0.5
0.5 to 1.5
1.5 to 2.5
2.5 to 3.5
3.5 to 5.5
5.5 to 7.5
2012
-148 -144 -140 -136 -132 -128 -124 -120Longitude
70
71
72
Lat
itude
15 to 20
20 to 25
25 to 28
28 to 30
30 to 32
32 to 33
2012
IOS Expedition number 2012-21 20
Science Cruise Report – CCGS Sir Wilfrid Laurier, September-October 2012
-148 -144 -140 -136 -132 -128 -124 -120Longitude
70
71
72
Latit
ude
70
71
72
Lat
itude
70
71
72
Lat
itude
70
71
72
Lat
itude
70
71
72
Lat
itude
70
71
72
Lat
itude
Sea SurfaceTemperature
-1.5 to -0.5
-0.5 to 0.5
0.5 to 1.5
1.5 to 2.5
2.5 to 3.5
3.5 to 5.5
2006
2007
2008
2009
2010
2011
IOS Expedition number 2012-21 21
Science Cruise Report – CCGS Sir Wilfrid Laurier, September-October 2012
-148 -144 -140 -136 -132 -128 -124 -120Longitude
70
71
72
Latit
ude
70
71
72
Lat
itude
70
71
72
Lat
itude
70
71
72
Lat
itude
70
71
72
Lat
itude
70
71
72
Lat
itude
Sea SurfaceSalinity
15 to 20
20 to 25
25 to 28
28 to 30
30 to 32
32 to 33
2006
2007
2008
2009
2010
2011
IOS Expedition number 2012-21 22
Science Cruise Report – CCGS Sir Wilfrid Laurier, September-October 2012
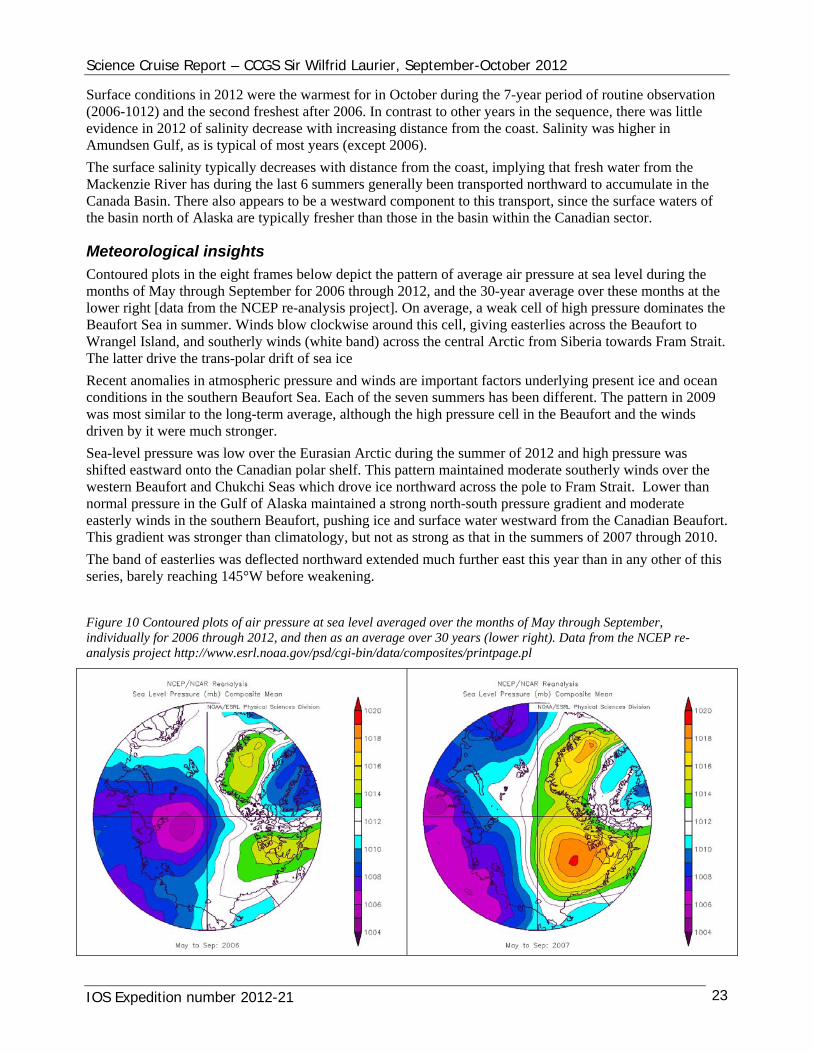
Surface conditions in 2012 were the warmest for in October during the 7-year period of routine observation (2006-1012) and the second freshest after 2006. In contrast to other years in the sequence, there was little evidence in 2012 of salinity decrease with increasing distance from the coast. Salinity was higher in Amundsen Gulf, as is typical of most years (except 2006).
The surface salinity typically decreases with distance from the coast, implying that fresh water from the Mackenzie River has during the last 6 summers generally been transported northward to accumulate in the Canada Basin. There also appears to be a westward component to this transport, since the surface waters of the basin north of Alaska are typically fresher than those in the basin within the Canadian sector.
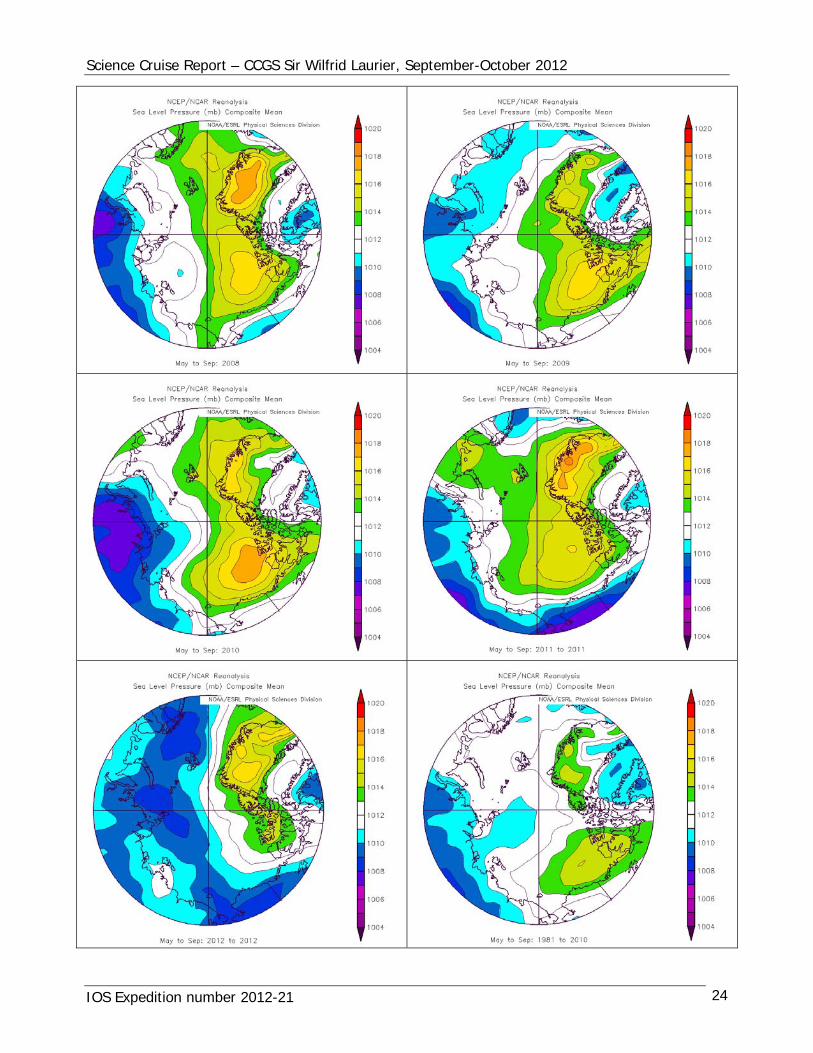
Meteorological insights
Contoured plots in the eight frames below depict the pattern of average air pressure at sea level during the months of May through September for 2006 through 2012, and the 30-year average over these months at the lower right [data from the NCEP re-analysis project]. On average, a weak cell of high pressure dominates the Beaufort Sea in summer. Winds blow clockwise around this cell, giving easterlies across the Beaufort to Wrangel Island, and southerly winds (white band) across the central Arctic from Siberia towards Fram Strait. The latter drive the trans-polar drift of sea ice
Recent anomalies in atmospheric pressure and winds are important factors underlying present ice and ocean conditions in the southern Beaufort Sea. Each of the seven summers has been different. The pattern in 2009 was most similar to the long-term average, although the high pressure cell in the Beaufort and the winds driven by it were much stronger.
Sea-level pressure was low over the Eurasian Arctic during the summer of 2012 and high pressure was shifted eastward onto the Canadian polar shelf. This pattern maintained moderate southerly winds over the western Beaufort and Chukchi Seas which drove ice northward across the pole to Fram Strait. Lower than normal pressure in the Gulf of Alaska maintained a strong north-south pressure gradient and moderate easterly winds in the southern Beaufort, pushing ice and surface water westward from the Canadian Beaufort. This gradient was stronger than climatology, but not as strong as that in the summers of 2007 through 2010.
The band of easterlies was deflected northward extended much further east this year than in any other of this series, barely reaching 145°W before weakening.
Figure 10 Contoured plots of air pressure at sea level averaged over the months of May through September, individually for 2006 through 2012, and then as an average over 30 years (lower right). Data from the NCEP re-analysis project http://www.esrl.noaa.gov/psd/cgi-bin/data/composites/printpage.pl
IOS Expedition number 2012-21 23
Science Cruise Report – CCGS Sir Wilfrid Laurier, September-October 2012
IOS Expedition number 2012-21 24
Science Cruise Report – CCGS Sir Wilfrid Laurier, September-October 2012
Narrative 18 September, Tuesday
Science team of 15 joins Sir Wilfrid Laurier at Cambridge Bay via various means. Temperature on arrival 4°C. Low broken cloud. Occasional sunshine.
Ship operating on Pacific Daylight Time (PDT).
HM tours the ship separately with Golder and with GSC personnel to view spaces available for science, and their possible uses.
Introductory meeting of all scientists, Captain and Chief Officer, at 6 pm for introductions, science programme overview and preliminary discussion of space allocations..
19 September, Wednesday
At anchor in Cambridge Bay. Overcast. Light dusting of snow.
Setup TSG & CTD-rosette system.
Crew thoroughly reorganizes the lower hold and ‘tween decks to provide more stowage for equipment on deck.
R/V Marty Bergmann comes alongside in the evening to transfer 9 bonnets of equipment for transport south.
20 September, Thursday
Broken stratus overcast. -1ºC. Sir Wilfrid Laurier lifts anchor at 8:10 am, westward bound.
21 September, Friday
Beautiful calm clear autumn day. Sir Wilfrid Laurier at Kugluktuk to collect channel marker buoys and anchors formerly used in the Coppermine River.
Sir Wilfrid Laurier underway about noon. Meeting to discuss deployment and operation of the Huntec towed body.
1:30 pm: Start rigging the derrick for a Huntec trial. Some challenge getting the wire far enough outboard. 2 deployments. Trial turns to starboard (preferred) and to port. Complete to everybody’s satisfaction by 4:30 pm.
6:00 pm: Meeting to discuss ROV operation – MBARI, plus Captain, Mate, Scott, Humfrey. 200-lb clump weight. Deploy from derrick, not A-frame. Ship to crab to port on recovery, to minimize possibility of collision. Trial scheduled for 8 am tomorrow.
22 September, Saturday
Sir Wilfrid Laurier is Amundsen Gulf at 118°W. 3-4 kt in 4-m seas and west wind, 45G50 kt. ROV trial not practical.
3:00 pm: Wind down to 25G30 kt. Still slow progress.
23 September, Sunday
7:00 am: Wind now ESE and developing a following sea. ROV trial remains impractical.
5:30 pm: At Site 2, but conditions judged too rough for mooring work here. Continue SW to the starting point for Huntec survey.
7:40 pm: Deploying the Huntec tow in 2-m seas (night #1).
24 September, Monday
7:00 am. Retrieving the Huntec tow. Wind and seas are down.
7:30 am: Meet to discuss the recovery of BREA mooring BR-G.
8:40 am: Hydrophone in water. Recovery completed at 9:48.
IOS Expedition number 2012-21 25
Science Cruise Report – CCGS Sir Wilfrid Laurier, September-October 2012
Defer the deployment of a replacement mooring because visibility deteriorating in fog and wind forecast to rise.
12:30 pm: Approaching BREA mooring BR-A.
12:50 pm: Hydrophone in water. Recovery completed at 1:43 pm.
3:00 pm: Trail launch and dive of the ROV. Some problem with the sea-catch caused its use to be abandoned. Going down at 3:37 pm, coming out at 4:21 pm. Winch drive belt slipped on recovery and dropped the ROV back into the sea.. Probel fixed by tightening the drive belt.
6:15 pm: Hydrophone in water for the recovery of BREA mooring BR-B. Recoery completed at 6:30 pm.
7:00 pm: Deploying the Huntec tow (night #2) at Coke Cap.
25 September, Tuesday
7:00 am. Wind NW5, light swell, 5°C. Retrieving the Huntec tow.
Overnight problem with the tow – the line streamed well back & pulled in towards the hull. Perhaps too deep?
7:30 am: Meeting to discuss possibilities for keeping the tow line well outboard. Settle on shallower depth (no more than 50 m) & slower speed (no more than 4.5 kt).
8:00 am: Meeting to discuss coring with Captain, Mate, Bosun, GSC people, Humfrey.
8:30 am: ROV dive #1, at Coke Cap. Dive complete at 1 pm.
2:30 pm: Strating deployment of mooring at BREA site BR-A. Complete at 3:30 pm. Triangulation of anchor position, CTD profile.
7:00 pm: Deploying the Huntec tow (night #3) at the 780-m expulsion feature.
26 September, Wednesday
7:00 am. Wind NE4, flat sea, light swell. SAT is 3.6°C. SST is 2°C higher.
7:30 am: Retrieving the Huntec tow.
7:40 am: ROV in water at 780-m feature. Dive complete at 1 pm.
1:30 pm: Start first piston coring operation. Lift at 1:42. Linked to winch wire at 1:48. Start descent at 1:53. Corer back at the surface at 2:44. Back on board at 3 pm. 1 ½ hours in total.
6:16 pm: Gravity coring at GC1
7:30 pm: Deploying the Huntec tow (night #4) on transect towards IOS Mooring Site 2
27 September, Thursday
7:00 am: Wind E24, 3.2°C, SST is 5°C
7:15 At Site 2, with Huntec on board. Captain recommends standby for wind and seas to come down before attempting mooring recovery.
11:30 am: Wind remains at 20G30. Depart for IOS Mooring Site 1, in the hope that seas will come down while in transit.
3:15 pm: At Site 1. Wind 084 at 25 kt. Proceed to Site 9.
5:25 pm: At Site 9. Wind & sea conditions not great, but 2 short moorings dropped here. Finished at 6:30 pm.
28 September, Friday
6:00 am: Approaching Site 2. Wind SW 21 kt. 1m swell. Air temperature is 2.6°C. SST is 5.3°C.
7:30 am: Ranging on SIC11-2 mooring. Recovery completed at 7:53 am.
8:14 am: Start re-deployment. Complete at 8:22 am.
IOS Expedition number 2012-21 26
Science Cruise Report – CCGS Sir Wilfrid Laurier, September-October 2012
8:45 am: On route to the upper slope near 135° 17’W to complete a gravity-coring transect.
12:14 pm: Start coring.
4:00 pm: Core section complete. ROV dive to 150-m depth during 4:00-6:30 pm, during which an exposure of glacial till was discovered.
6:45 pm: Launch Huntec for overnight survey.
29 September, Saturday
7:10 am: Huntec onboard. Wind N 5 kt. Light swell. SAT is 1.3°C
07:50 am: At site BR-B for deployment of BREA mooring. Complete at 8:40 am, then triangulation plus CTD drop.
10:00 am: Launch ROV at 420-m expulsion feature. Complete at 2:00 pm.
2:15-6:20 pm: Piston & gravity coring at EF-420m
7:00 pm: Huntec deployed for overnight transit to SIC11-1.
30 September, Sunday
7:00 am: Retrieving Huntec 5 miles from SIC11-1.
7:40 am: Enough daylight to start mooring recoveries at SIC11-1. Two recoveries completed at 8:10 am.
8:21 am: Start deployments, both completed by 8:26 am. Transit north-west to the geoscience area.
11:30 am: IKU grab at a linear seabed feature, suspected esker or relict beach. 70° 40.13’N 134° 43.609’W
1:10 pm: ROV dive near the shelf edge at 70° 49.725’N 135° 06.432’W
2:45 pm: Use of IKU grab at till exposure identified by ROV … 3rd drop successful at 3:37 pm.
4:40 pm: At site BR-G for deployment of BREA mooring. Complete at 7:08 pm including break for supper. Triangulate for position of mooring anchor.
Launch Huntec
1 October, Monday
6:30 am: 1.6ºC, NE15. SST is 4.6°C. Recover Huntec
8:40 am: At the Coke Cap expulsion feature, 280-m depth. Piston corer rigged & going down. Core head buried in very soft sediment.
9:20 am: On route south-west to the landslip area for an ROV dive to climb up the slump and for coring.
5:30 pm: Complete coring activity.
7:00 pm: Launch the Huntec for a box-like survey ending at Coke Cap.
2 October, Tuesday
7:00 am: At Coke Cap recovering Huntec. Wind south-east at 25 kt, developing sea. Air 3ºC & SST 4.6°C.
9:05 am: Recovering the ROV after a frustrating hour trying to tame the ship’s drift so as to traverse to the north-west across Coke Cap. Proceed to the shelf edge & then to Kopanoar for gravity coring & possibly an ROV dive.
3:30 pm: 3 cores collected at Kopanoar, but still to rough to launch the ROV. Proceed to the Huntec starting point at 70° 54.247’N 131° 50.756’W.
3 October, Wednesday
6:00 am: 11 miles from Coke Cap. Wind SSW at 6 kt. Air 3.6°C.
8:00 am: ROV in water at Coke Cap. Complete at 10:55 am.
12:20 pm: Start pull-out of the mooring at Coke Cap. Complete at 1:11 pm. Proceed to BR-2.
IOS Expedition number 2012-21 27
Science Cruise Report – CCGS Sir Wilfrid Laurier, September-October 2012
6:25 pm: Start mooring recovery at BR-2, in perfect conditions. Complete at 6:40 pm.
6:45 pm: Deploy Huntec for overnight traverse eastward onto the shelf and then south-west to SIC11-11.
4 October, Thursday
7:00 am: Recovering Huntec. Beautiful sunrise. 4.7°C
7:20 am: CTD profile while awaiting daylight.
7:56 am: Ranging on the mooring. Recovery complete at 8:04 am.
8:09 am: Ready to re-deploy. Complete at 8:11 am.
8:19 am: Underway to BR-2.
10:30 am: Start deployment at BR-2. Complete at 10:49 am, except for triangulation.
2:50 pm: Searching for desired depth of water near BR-1. Found at 3:30 pm, measuring ship’s drift.
3:50 pm: Start mooring deployment at BR-1. Complete at 4:22 pm, followed by triangulation & CTD profile.
5 October, Friday
10:00 am: Anchored in fog north-east of Cross Island.
1:00 pm: Last of 4 helicopter flights to get people in to Deadhorse. Overnight at the Aurora Hotel.
5 October, Saturday
09:40 am: Return flights via Anchorage and Seattle to Victoria, arriving at about midnight, or elsewhere
IOS Expedition number 2012-21 28
Science Cruise Report – CCGS Sir Wilfrid Laurier, September-October 2012
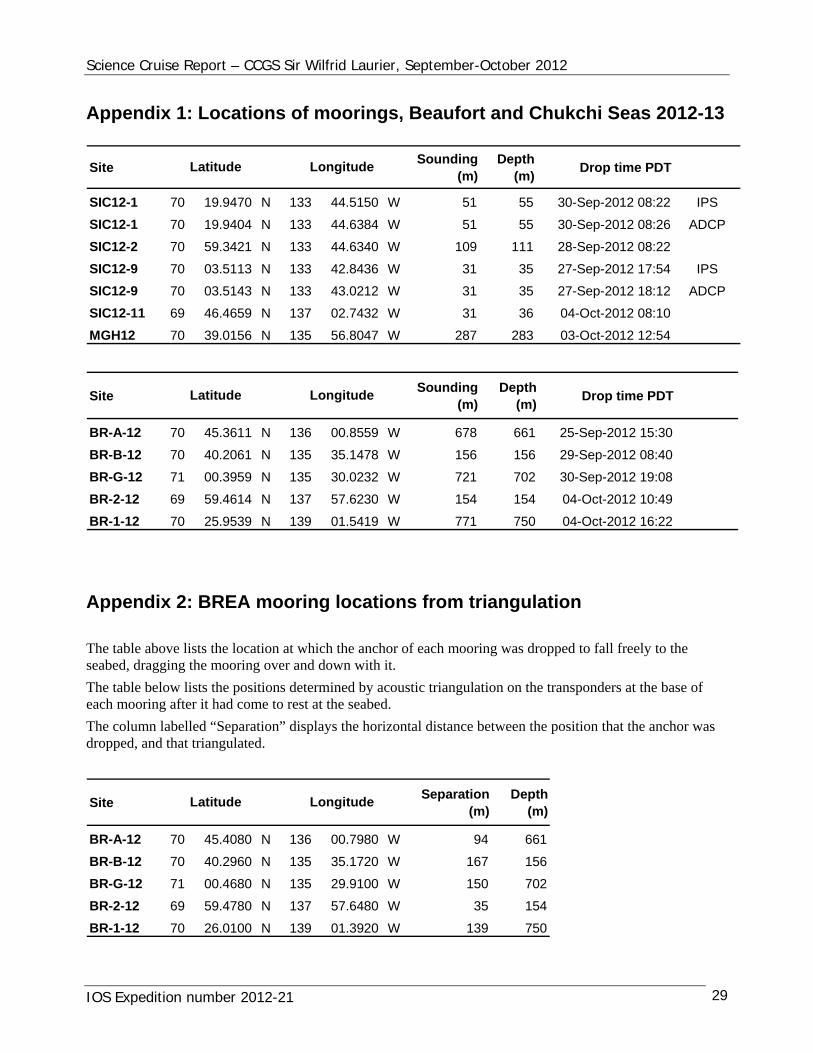
Appendix 1: Locations of moorings, Beaufort and Chukchi Seas 2012-13
SiteSounding
(m)Depth
(m)Drop time PDT
SIC12-1 70 19.9470 N 133 44.5150 W 51 55 30-Sep-2012 08:22 IPS
SIC12-1 70 19.9404 N 133 44.6384 W 51 55 30-Sep-2012 08:26 ADCP
SIC12-2 70 59.3421 N 133 44.6340 W 109 111 28-Sep-2012 08:22
SIC12-9 70 03.5113 N 133 42.8436 W 31 35 27-Sep-2012 17:54 IPS
SIC12-9 70 03.5143 N 133 43.0212 W 31 35 27-Sep-2012 18:12 ADCP
SIC12-11 69 46.4659 N 137 02.7432 W 31 36 04-Oct-2012 08:10
MGH12 70 39.0156 N 135 56.8047 W 287 283 03-Oct-2012 12:54
Latitude Longitude
SiteSounding
(m)Depth
(m)Drop time PDT
BR-A-12 70 45.3611 N 136 00.8559 W 678 661 25-Sep-2012 15:30
BR-B-12 70 40.2061 N 135 35.1478 W 156 156 29-Sep-2012 08:40
BR-G-12 71 00.3959 N 135 30.0232 W 721 702 30-Sep-2012 19:08
BR-2-12 69 59.4614 N 137 57.6230 W 154 154 04-Oct-2012 10:49
BR-1-12 70 25.9539 N 139 01.5419 W 771 750 04-Oct-2012 16:22
Latitude Longitude
Appendix 2: BREA mooring locations from triangulation
The table above lists the location at which the anchor of each mooring was dropped to fall freely to the seabed, dragging the mooring over and down with it.
The table below lists the positions determined by acoustic triangulation on the transponders at the base of each mooring after it had come to rest at the seabed.
The column labelled “Separation” displays the horizontal distance between the position that the anchor was dropped, and that triangulated.
SiteSeparation
(m)Depth
(m)
BR-A-12 70 45.4080 N 136 00.7980 W 94 661
BR-B-12 70 40.2960 N 135 35.1720 W 167 156
BR-G-12 71 00.4680 N 135 29.9100 W 150 702
BR-2-12 69 59.4780 N 137 57.6480 W 35 154
BR-1-12 70 26.0100 N 139 01.3920 W 139 750
Latitude Longitude
IOS Expedition number 2012-21 29
Science Cruise Report – CCGS Sir Wilfrid Laurier, September-October 2012
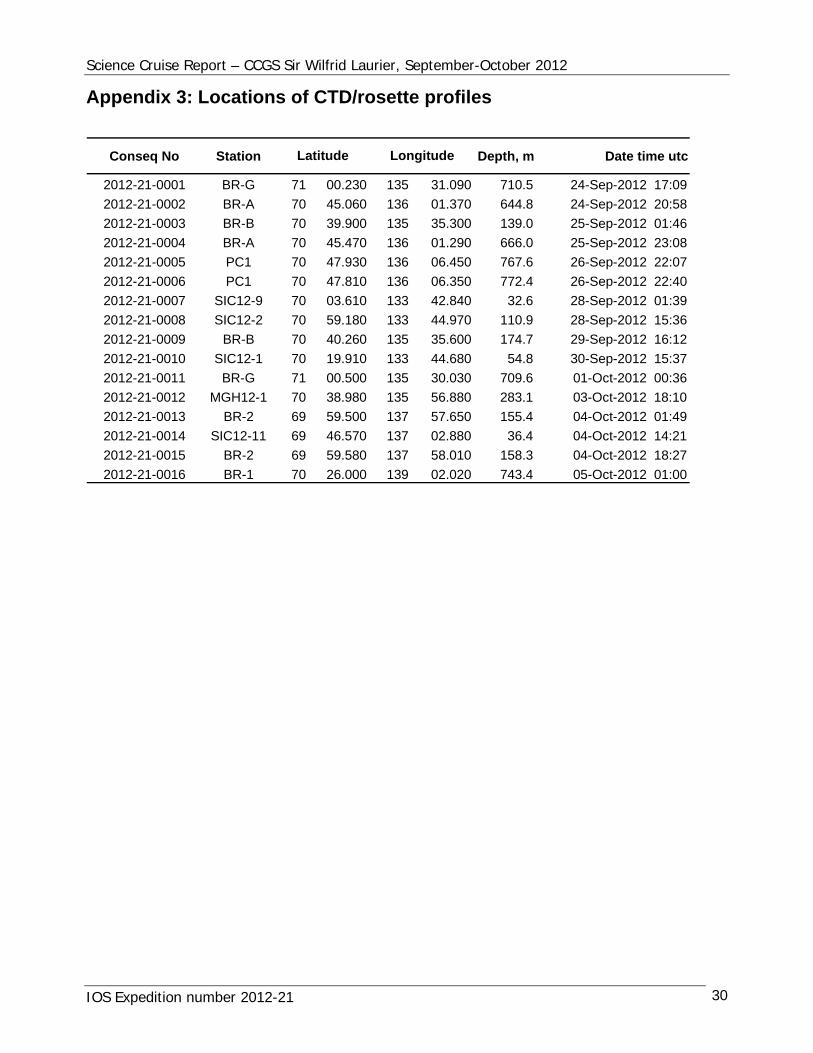
Appendix 3: Locations of CTD/rosette profiles
Conseq No Station Depth, m Date time utc
2012-21-0001 BR-G 71 00.230 135 31.090 710.5 24-Sep-2012 17:09
2012-21-0002 BR-A 70 45.060 136 01.370 644.8 24-Sep-2012 20:58
2012-21-0003 BR-B 70 39.900 135 35.300 139.0 25-Sep-2012 01:46
2012-21-0004 BR-A 70 45.470 136 01.290 666.0 25-Sep-2012 23:08
2012-21-0005 PC1 70 47.930 136 06.450 767.6 26-Sep-2012 22:07
2012-21-0006 PC1 70 47.810 136 06.350 772.4 26-Sep-2012 22:40
2012-21-0007 SIC12-9 70 03.610 133 42.840 32.6 28-Sep-2012 01:39
2012-21-0008 SIC12-2 70 59.180 133 44.970 110.9 28-Sep-2012 15:36
2012-21-0009 BR-B 70 40.260 135 35.600 174.7 29-Sep-2012 16:12
2012-21-0010 SIC12-1 70 19.910 133 44.680 54.8 30-Sep-2012 15:37
2012-21-0011 BR-G 71 00.500 135 30.030 709.6 01-Oct-2012 00:36
2012-21-0012 MGH12-1 70 38.980 135 56.880 283.1 03-Oct-2012 18:10
2012-21-0013 BR-2 69 59.500 137 57.650 155.4 04-Oct-2012 01:49
2012-21-0014 SIC12-11 69 46.570 137 02.880 36.4 04-Oct-2012 14:21
2012-21-0015 BR-2 69 59.580 137 58.010 158.3 04-Oct-2012 18:27
2012-21-0016 BR-1 70 26.000 139 02.020 743.4 05-Oct-2012 01:00
Latitude Longitude
IOS Expedition number 2012-21 30
Science Cruise Report – CCGS Sir Wilfrid Laurier, September-October 2012
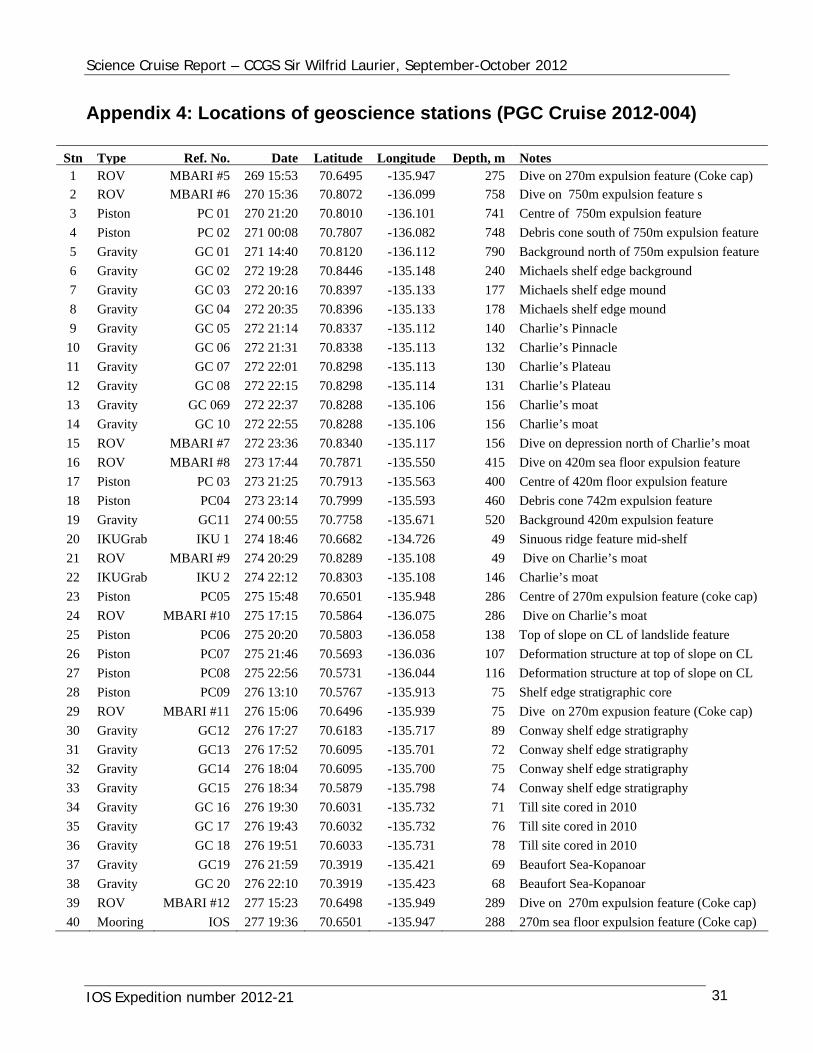
Appendix 4: Locations of geoscience stations (PGC Cruise 2012-004)
Stn Type Ref. No. Date Latitude Longitude Depth, m Notes 1 ROV MBARI #5 269 15:53 70.6495 -135.947 275 Dive on 270m expulsion feature (Coke cap)
2 ROV MBARI #6 270 15:36 70.8072 -136.099 758 Dive on 750m expulsion feature s
3 Piston PC 01 270 21:20 70.8010 -136.101 741 Centre of 750m expulsion feature
4 Piston PC 02 271 00:08 70.7807 -136.082 748 Debris cone south of 750m expulsion feature
5 Gravity GC 01 271 14:40 70.8120 -136.112 790 Background north of 750m expulsion feature
6 Gravity GC 02 272 19:28 70.8446 -135.148 240 Michaels shelf edge background
7 Gravity GC 03 272 20:16 70.8397 -135.133 177 Michaels shelf edge mound
8 Gravity GC 04 272 20:35 70.8396 -135.133 178 Michaels shelf edge mound
9 Gravity GC 05 272 21:14 70.8337 -135.112 140 Charlie’s Pinnacle
10 Gravity GC 06 272 21:31 70.8338 -135.113 132 Charlie’s Pinnacle
11 Gravity GC 07 272 22:01 70.8298 -135.113 130 Charlie’s Plateau
12 Gravity GC 08 272 22:15 70.8298 -135.114 131 Charlie’s Plateau
13 Gravity GC 069 272 22:37 70.8288 -135.106 156 Charlie’s moat
14 Gravity GC 10 272 22:55 70.8288 -135.106 156 Charlie’s moat
15 ROV MBARI #7 272 23:36 70.8340 -135.117 156 Dive on depression north of Charlie’s moat
16 ROV MBARI #8 273 17:44 70.7871 -135.550 415 Dive on 420m sea floor expulsion feature
17 Piston PC 03 273 21:25 70.7913 -135.563 400 Centre of 420m floor expulsion feature
18 Piston PC04 273 23:14 70.7999 -135.593 460 Debris cone 742m expulsion feature
19 Gravity GC11 274 00:55 70.7758 -135.671 520 Background 420m expulsion feature
20 IKUGrab IKU 1 274 18:46 70.6682 -134.726 49 Sinuous ridge feature mid-shelf
21 ROV MBARI #9 274 20:29 70.8289 -135.108 49 Dive on Charlie’s moat
22 IKUGrab IKU 2 274 22:12 70.8303 -135.108 146 Charlie’s moat
23 Piston PC05 275 15:48 70.6501 -135.948 286 Centre of 270m expulsion feature (coke cap)
24 ROV MBARI #10 275 17:15 70.5864 -136.075 286 Dive on Charlie’s moat
25 Piston PC06 275 20:20 70.5803 -136.058 138 Top of slope on CL of landslide feature
26 Piston PC07 275 21:46 70.5693 -136.036 107 Deformation structure at top of slope on CL
27 Piston PC08 275 22:56 70.5731 -136.044 116 Deformation structure at top of slope on CL
28 Piston PC09 276 13:10 70.5767 -135.913 75 Shelf edge stratigraphic core
29 ROV MBARI #11 276 15:06 70.6496 -135.939 75 Dive on 270m expusion feature (Coke cap)
30 Gravity GC12 276 17:27 70.6183 -135.717 89 Conway shelf edge stratigraphy
31 Gravity GC13 276 17:52 70.6095 -135.701 72 Conway shelf edge stratigraphy
32 Gravity GC14 276 18:04 70.6095 -135.700 75 Conway shelf edge stratigraphy
33 Gravity GC15 276 18:34 70.5879 -135.798 74 Conway shelf edge stratigraphy
34 Gravity GC 16 276 19:30 70.6031 -135.732 71 Till site cored in 2010
35 Gravity GC 17 276 19:43 70.6032 -135.732 76 Till site cored in 2010
36 Gravity GC 18 276 19:51 70.6033 -135.731 78 Till site cored in 2010
37 Gravity GC19 276 21:59 70.3919 -135.421 69 Beaufort Sea-Kopanoar
38 Gravity GC 20 276 22:10 70.3919 -135.423 68 Beaufort Sea-Kopanoar
39 ROV MBARI #12 277 15:23 70.6498 -135.949 289 Dive on 270m expulsion feature (Coke cap)
40 Mooring IOS 277 19:36 70.6501 -135.947 288 270m sea floor expulsion feature (Coke cap)
IOS Expedition number 2012-21 31
Science Cruise Report – CCGS Sir Wilfrid Laurier, September-October 2012
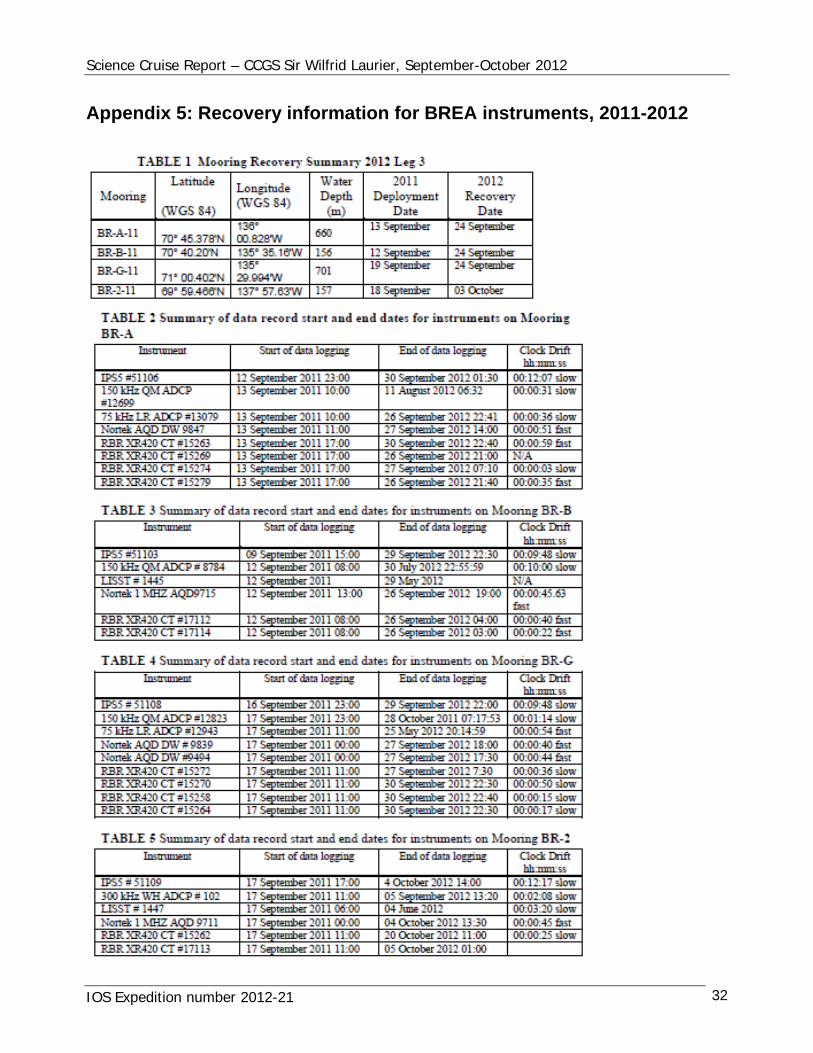
Appendix 5: Recovery information for BREA instruments, 2011-2012
IOS Expedition number 2012-21 32
Regional Operations Centre
Canadian Coast Guard – Pacific
Page 33 of 37
IOS Expedition number 2012-21 33
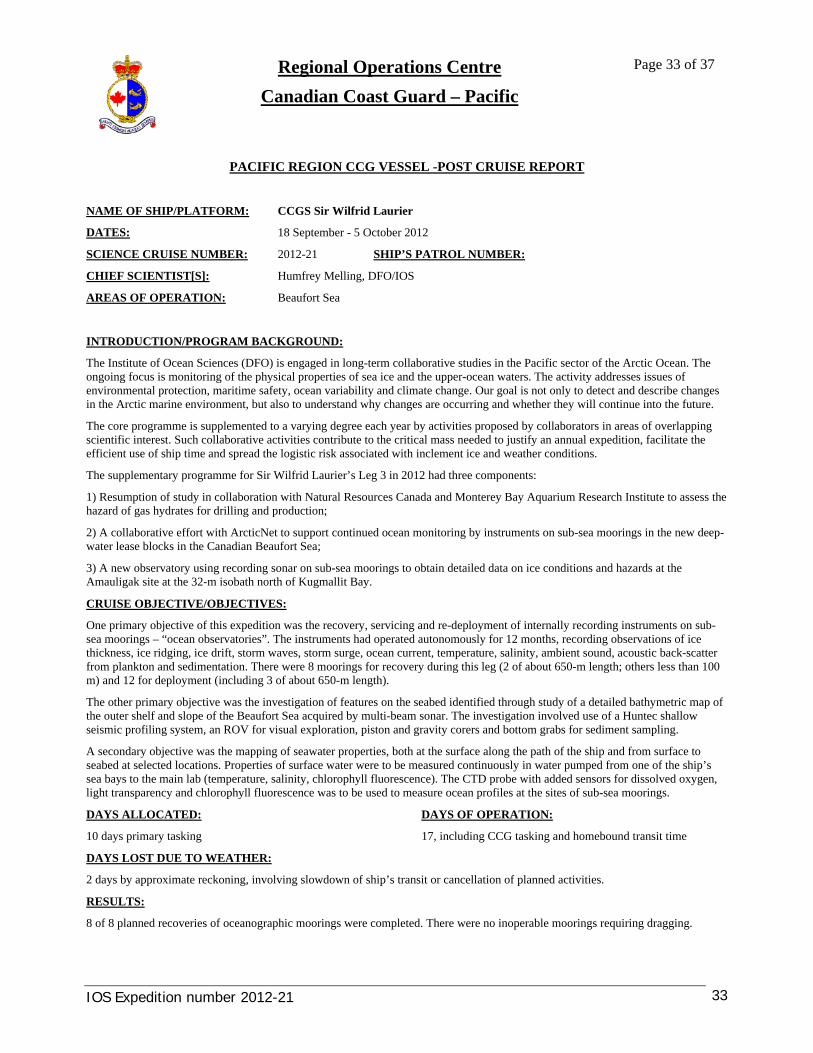
PACIFIC REGION CCG VESSEL -POST CRUISE REPORT
NAME OF SHIP/PLATFORM: CCGS Sir Wilfrid Laurier
DATES: 18 September - 5 October 2012
SCIENCE CRUISE NUMBER: 2012-21 SHIP’S PATROL NUMBER:
CHIEF SCIENTIST[S]: Humfrey Melling, DFO/IOS
AREAS OF OPERATION: Beaufort Sea
INTRODUCTION/PROGRAM BACKGROUND:
The Institute of Ocean Sciences (DFO) is engaged in long-term collaborative studies in the Pacific sector of the Arctic Ocean. The ongoing focus is monitoring of the physical properties of sea ice and the upper-ocean waters. The activity addresses issues of environmental protection, maritime safety, ocean variability and climate change. Our goal is not only to detect and describe changes in the Arctic marine environment, but also to understand why changes are occurring and whether they will continue into the future.
The core programme is supplemented to a varying degree each year by activities proposed by collaborators in areas of overlapping scientific interest. Such collaborative activities contribute to the critical mass needed to justify an annual expedition, facilitate the efficient use of ship time and spread the logistic risk associated with inclement ice and weather conditions.
The supplementary programme for Sir Wilfrid Laurier’s Leg 3 in 2012 had three components:
1) Resumption of study in collaboration with Natural Resources Canada and Monterey Bay Aquarium Research Institute to assess the hazard of gas hydrates for drilling and production;
2) A collaborative effort with ArcticNet to support continued ocean monitoring by instruments on sub-sea moorings in the new deep-water lease blocks in the Canadian Beaufort Sea;
3) A new observatory using recording sonar on sub-sea moorings to obtain detailed data on ice conditions and hazards at the Amauligak site at the 32-m isobath north of Kugmallit Bay.
CRUISE OBJECTIVE/OBJECTIVES:
One primary objective of this expedition was the recovery, servicing and re-deployment of internally recording instruments on sub-sea moorings – “ocean observatories”. The instruments had operated autonomously for 12 months, recording observations of ice thickness, ice ridging, ice drift, storm waves, storm surge, ocean current, temperature, salinity, ambient sound, acoustic back-scatter from plankton and sedimentation. There were 8 moorings for recovery during this leg (2 of about 650-m length; others less than 100 m) and 12 for deployment (including 3 of about 650-m length).
The other primary objective was the investigation of features on the seabed identified through study of a detailed bathymetric map of the outer shelf and slope of the Beaufort Sea acquired by multi-beam sonar. The investigation involved use of a Huntec shallow seismic profiling system, an ROV for visual exploration, piston and gravity corers and bottom grabs for sediment sampling.
A secondary objective was the mapping of seawater properties, both at the surface along the path of the ship and from surface to seabed at selected locations. Properties of surface water were to be measured continuously in water pumped from one of the ship’s sea bays to the main lab (temperature, salinity, chlorophyll fluorescence). The CTD probe with added sensors for dissolved oxygen, light transparency and chlorophyll fluorescence was to be used to measure ocean profiles at the sites of sub-sea moorings.
DAYS ALLOCATED: DAYS OF OPERATION:
10 days primary tasking 17, including CCG tasking and homebound transit time
DAYS LOST DUE TO WEATHER:
2 days by approximate reckoning, involving slowdown of ship’s transit or cancellation of planned activities.
RESULTS:
8 of 8 planned recoveries of oceanographic moorings were completed. There were no inoperable moorings requiring dragging.
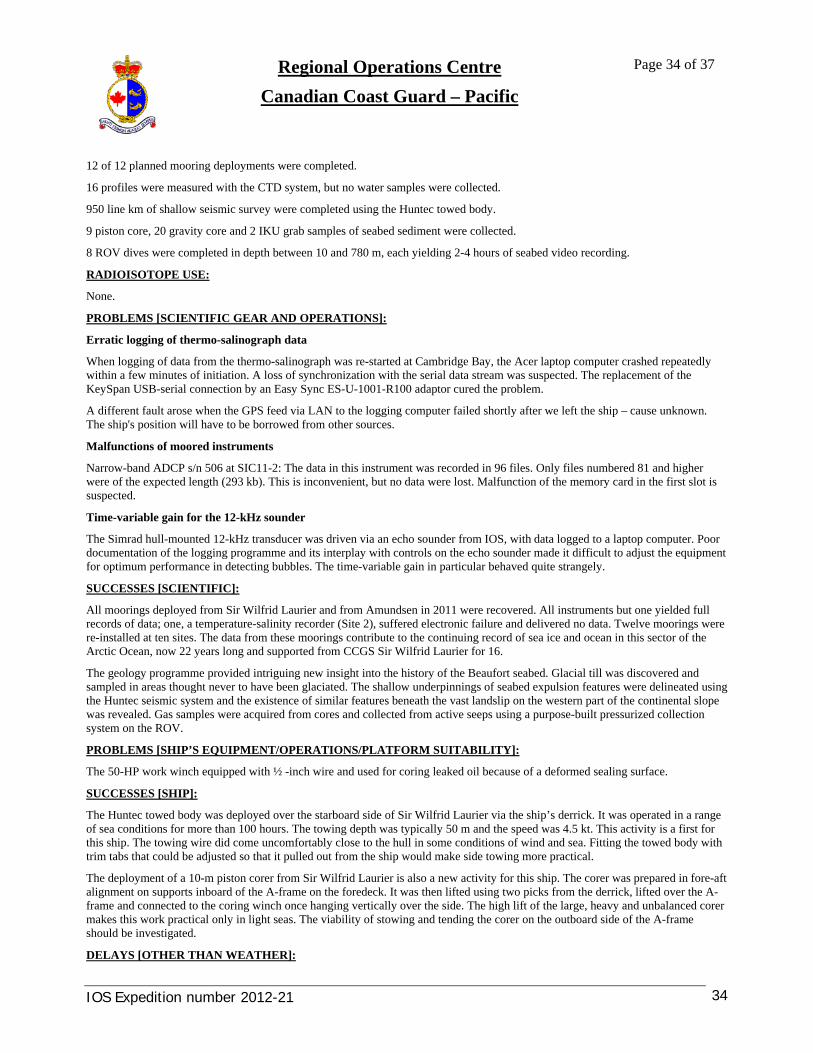
Regional Operations Centre
Canadian Coast Guard – Pacific
Page 34 of 37
IOS Expedition number 2012-21 34
12 of 12 planned mooring deployments were completed.
16 profiles were measured with the CTD system, but no water samples were collected.
950 line km of shallow seismic survey were completed using the Huntec towed body.
9 piston core, 20 gravity core and 2 IKU grab samples of seabed sediment were collected.
8 ROV dives were completed in depth between 10 and 780 m, each yielding 2-4 hours of seabed video recording.
RADIOISOTOPE USE:
None.
PROBLEMS [SCIENTIFIC GEAR AND OPERATIONS]:
Erratic logging of thermo-salinograph data
When logging of data from the thermo-salinograph was re-started at Cambridge Bay, the Acer laptop computer crashed repeatedly within a few minutes of initiation. A loss of synchronization with the serial data stream was suspected. The replacement of the KeySpan USB-serial connection by an Easy Sync ES-U-1001-R100 adaptor cured the problem.
A different fault arose when the GPS feed via LAN to the logging computer failed shortly after we left the ship – cause unknown. The ship's position will have to be borrowed from other sources.
Malfunctions of moored instruments
Narrow-band ADCP s/n 506 at SIC11-2: The data in this instrument was recorded in 96 files. Only files numbered 81 and higher were of the expected length (293 kb). This is inconvenient, but no data were lost. Malfunction of the memory card in the first slot is suspected.
Time-variable gain for the 12-kHz sounder
The Simrad hull-mounted 12-kHz transducer was driven via an echo sounder from IOS, with data logged to a laptop computer. Poor documentation of the logging programme and its interplay with controls on the echo sounder made it difficult to adjust the equipment for optimum performance in detecting bubbles. The time-variable gain in particular behaved quite strangely.
SUCCESSES [SCIENTIFIC]:
All moorings deployed from Sir Wilfrid Laurier and from Amundsen in 2011 were recovered. All instruments but one yielded full records of data; one, a temperature-salinity recorder (Site 2), suffered electronic failure and delivered no data. Twelve moorings were re-installed at ten sites. The data from these moorings contribute to the continuing record of sea ice and ocean in this sector of the Arctic Ocean, now 22 years long and supported from CCGS Sir Wilfrid Laurier for 16.
The geology programme provided intriguing new insight into the history of the Beaufort seabed. Glacial till was discovered and sampled in areas thought never to have been glaciated. The shallow underpinnings of seabed expulsion features were delineated using the Huntec seismic system and the existence of similar features beneath the vast landslip on the western part of the continental slope was revealed. Gas samples were acquired from cores and collected from active seeps using a purpose-built pressurized collection system on the ROV.
PROBLEMS [SHIP’S EQUIPMENT/OPERATIONS/PLATFORM SUITABILITY]:
The 50-HP work winch equipped with ½ -inch wire and used for coring leaked oil because of a deformed sealing surface.
SUCCESSES [SHIP]:
The Huntec towed body was deployed over the starboard side of Sir Wilfrid Laurier via the ship’s derrick. It was operated in a range of sea conditions for more than 100 hours. The towing depth was typically 50 m and the speed was 4.5 kt. This activity is a first for this ship. The towing wire did come uncomfortably close to the hull in some conditions of wind and sea. Fitting the towed body with trim tabs that could be adjusted so that it pulled out from the ship would make side towing more practical.
The deployment of a 10-m piston corer from Sir Wilfrid Laurier is also a new activity for this ship. The corer was prepared in fore-aft alignment on supports inboard of the A-frame on the foredeck. It was then lifted using two picks from the derrick, lifted over the A-frame and connected to the coring winch once hanging vertically over the side. The high lift of the large, heavy and unbalanced corer makes this work practical only in light seas. The viability of stowing and tending the corer on the outboard side of the A-frame should be investigated.
DELAYS [OTHER THAN WEATHER]:
Regional Operations Centre
Canadian Coast Guard – Pacific
Page 35 of 37
IOS Expedition number 2012-21 35
None
SAFETY CONCERNS:
None
HAZARDOUS OCCURRENCES:.
None
EVENT LOG:
See “Cruise Narrative” in the preceding science report
SUMMARY/FINAL COMMENTS:
Near the end of the short Arctic summer, as sudden storms and rough seas become frequent and difficult to predict, and daylight hours rapidly get shorter, it is frequently a challenge to complete the science mission objectives. Our thanks go to the captain, officers and crew, whose interest and commitment allowed us to work so productively.


![Beaufort Republican (Beaufort, S.C.).(Beaufort, S.C.) 1872-03-14 [p ]. · 2014-11-07 · i » AnIndependentFamilyNewspaper,devotedtoPolitics, Literature,andGeneralIntelligence. Our](https://img.pdfslide.us/doc/110x75/5f9843a157a435509e4492b8/beaufort-republican-beaufort-scbeaufort-sc-1872-03-14-p-2014-11-07.jpg)