Embed Size (px)
Citation preview

Beattie, V. and Brandt, R. and Fearnley, S. (1999) Perceptions of auditor independence: U.K. evidence. Journal of International Accounting, Auditing and Taxation 8(1):67-107. http://eprints.gla.ac.uk/archive/00000783/
Glasgow ePrints Service http://eprints.gla.ac.uk

Perceptions of Auditor Independence: U.K. Evidence
Vivien Beattie*, Richard Brandt** and Stella Fearnley***
* Vivien Beattie is Professor of Accounting in the Department of Accountancy and Finance,
University of Stirling. ** Richard Brandt is a Research Fellow in the Department of Accounting and Management
Science, University of Portsmouth. *** Stella Fearnley is a Principal Lecturer in Accounting in the Department of Accounting and
Management Science, University of Portsmouth.
Address for correspondence
Department of Accountancy and Finance, University of Stirling, Stirling, UK, FK9 4LA. Tel.
0044-1786 467306; Fax 0044-1786 467308.
Acknowledgements
The financial support of the Research Board of the Institute of Chartered Accountants in England
and Wales (ICAEW), and the support of the ICAEW's Audit Faculty and the Auditing Practices
Board is gratefully acknowledged. The paper has benefited greatly from the suggestions made by
anonymous referees and the journal's editor.

Perceptions of Auditor Independence: U.K. Evidence
ABSTRACT
The reality and perception of auditor independence is fundamental to public confidence in
financial reporting. A new Independence Standards Board was set up in the U.S. in 1997 and the
European Union (EU) is currently seeking to establish a common core of independence principles
(EC Green Paper 1996). This paper explores, using a questionnaire instrument, U.K. interested
parties' perceptions of the influence on auditor independence of a large set of 58 economic and
regulatory factors. Forty-six factors have a significant impact on independence perceptions for all
groups (finance directors, audit partners, and financial journalists). The principal threat factors
relate to economic dependence and non-audit service provision, while the principal enhancement
factor is the existence of an audit committee. Exploratory factor analysis reduces the factor set to a
smaller number of uncorrelated underlying dimensions. Perceptions regarding many independence
factors are found to be contingent upon characteristics of the respondents' ongoing audit
relationships (in particular, audit firm type and company size).
Keywords: audit committees; auditor independence; audit regulation; conflict; non-audit services

Perceptions of Auditor Independence: U.K. Evidence
INTRODUCTION
There has been a rise recently in the level of non-audit services (NAS) purchased from auditors as
auditors enter into new service areas and also increasing competition within the external audit
market (evidenced by aggressive fee renegotiation, tendering, and lowballing). In addition, a
further spate of highly publicised corporate collapses associated with alleged audit failures has
occured (e.g., the S&L crisis in the U.S.; and BCCI, Polly Peck, and the Mirror Group in the
U.K.). Such failures can arise from a lack of either technical competence or independence
(DeAngelo 1981a, 186). This has resulted in renewed concern about auditor independence among
interested parties in many countries (for example, in the U.S., the Kirk Report (POB 1994),
Jenkins Committee (AICPA 1994), and GAO (1996); and, in the U.K., Statement of Professional
Conduct 1 `Integrity, Objectivity and Independence' (ICAS 1996) in the U.K.).
The issue of auditor independence, in particular its nature and determinants, has been the subject
of investigation and pronouncements by policy-makers and the accountancy profession for several
decades; for example: U.S. Senate (1976 and 1985, the Metcalf and Dingall committees); AICPA
(1978 and 1987, the Cohen and Treadway commissions); and Public Oversight Board (1986) in
the U.S.; Canadian Institute of Chartered Accountants (1978); Statement of Auditing Practice
AUP 32 (AARF 1992) in Australia; and the Auditing Practices Board (APB 1992; 1994) in the
U.K. Most recently, the SEC and AICPA have announced that, in response to the increasing
challenge of addressing independence issues, a new private-sector body is to be created by the
AICPA to establish independence standards for the auditors of public companies. In the EC,
auditor independence has been discussed in a series of reports on the role, position, and liability of
the statutory auditor within the EU (FEE 1996; MARC 1996; and EC Green Paper 1996). The
extent and intensity of debate reflects the importance of this issue. Furthermore, most empirical
studies on the effect of auditor independence perceptions have found them to have a significant
impact on users' decisions and preparers/auditors' judgments (e.g., Firth 1980; and Farmer et al.
1987; but see McKinley et al. 1985 for contrary evidence). Thus, auditor independence

2
perceptions do appear to have economic consequences.
The concept of independence has proved, however, to be difficult to define precisely (Antle 1984,
1; Schuetze 1994, 69). Representative definitions are: `the ability to act with integrity and
objectivity' (AICPA 1985)1; `the ability to resist client pressure' (Knapp 1985); `an attitude/state of
mind' (Moizer 1994, 19; Schuetze 1994, 69); and (based on economic modelling) `the conditional
probability of reporting a discovered breach' (DeAngelo 1981a, 186).2 A subsidiary issue is
whether independence is an absolute concept (as implied by the structure of current relevant SEC
regulations and the AICPA Code of Professional Conduct) or is a matter of degree, with recent
empirical evidence supporting the latter view (Bartlett 1993). Furthermore, since third parties are
unable to observe directly independence in fact, the appearance of independence assumes prime
importance. This is recognised explicitly in most current professional conduct codes (e.g. AICPA
(1992, para.ET.55)) and in the EC Green Paper (1996, para. 4.8).
Research in this area has focused upon identifying the factors which potentially influence
independence, and assessing their impact upon perceived independence since independence in fact
is unobservable. These studies date from the mid-1960s (Schulte 1965) and typically employ a
mail questionnaire approach. Early studies, conducted before (or just after) ethical guidelines on
independence issues were put in place, focused on specific auditor-client relationships (typically
conflicts of interest), most of which are now prohibited. More recent studies focus on the
significant changes in the accounting and auditing environment. The four themes commonly
addressed are the economic dependence of the auditor on the client company, audit market
competition, the provision of NAS, and laxity in the regulatory framework. Of these, economic
dependence and NAS have grown in significance since the early studies, due to the general
reduction in other concerns (i.e., specific auditor-client relationships) and the changing
environment. Competition and changes in the regulatory framework to enhance PAI are more
recent issues. Three themes are sufficiently general to permit broad comparative analysis across
time and countries (economic dependence, competition, and NAS), while the accounting and
auditing regulatory framework is unique to each country at a point in time.

3
The primary objective of the present study is to investigate PAI in the accounting and auditing
environment currently prevailing in the U.K. The four broad themes of current interest will be
examined, using proxy measures which reflect the current U.K. regulatory environment. This will
permit a limited comparison with Firth (1980), which is the only U.K. study in this area to date,
and also with studies from other countries. Differences across countries may be attributable not
only to differences in the regulatory framework, but also differences in the economic, political, and
cultural environment. A secondary objective of the present study is to extend and develop
research into PAI in four ways. First, factors which potentially enhance PAI are considered (most
previous studies focus on threat factors). Second, within-group consensus (using a scaled response
variable) is explicitly considered. Third, factor analysis is used to uncover the principal,
independent dimensions affecting PAI. Finally, the contingent influence upon PAI of respondent-
specific characteristics related to the respondent's ongoing audit relationship (in particular, audit
firm type and company size) is explored. The contingent impact of these respondent-specific
characteristics has not previously been studied.
In addition to evaluating the impact of current regulatory mechanisms on PAI, a number of
proposed changes are considered. The views of two main groups (preparers and auditors) and a
small group of users are elicited and compared. Findings from this study can be expected to be of
use to policy-makers concerned with improving the perception of auditor independence. The EC
Green Paper has identified the `agreement on a common core of essential [independence]
principles in all Member States' as a priority (1996, para. 4.16).
Relevant Features of the U.K. Accountancy Profession
Historically, financial reporting in the U.K. has developed through a mixture of legislation and
professional pronouncements, with accounting standards being developed initially by the
professional bodies. The Accounting Standards Committee (ASC), whose membership consisted
entirely of accountants, was criticized as being self-serving. Moreover, there were no effective
enforcement mechanisms against companies other than audit report qualification. The 1989
Companies Act transferred control of the standard-setting and enforcement process from the

4
professional accounting bodies to the Financial Reporting Council (FRC), a legally mandated
body set up in January 1990. Subsidiary bodies include the Accounting Standards Board (ASB),
which deals with standard-setting, the Urgent Issues Task Force (UITF), which deals promptly
with emerging issues, and the Financial Reporting Review Panel (FRRP), which has the power to
take court proceedings against companies which are seen to depart from generally accepted
accounting principles, with a view to enforcing compliance.
A further change in the auditing environment arose from the Cadbury Committee, set up in the
wake of major corporate collapses to review the financial aspects of corporate governance, which
issued a Code of Best Practice in 1992. This Code included a recommendation that all listed
companies establish an audit committee, composed of non-executive directors, a majority of
whom are independent. Review of governance issues is ongoing. The report of the committee
established to review the implementation of the Cadbury recommendations (the Hampel
Committee) has, importantly, recommended that the limit of 10% of total practice income from
one client be reviewed with a view to further reduction, and has endorsed the importance of the
audit committee in enhancing auditor independence, especially in relation to non-audit services
(Hampel Committee 1998).
Finally, a system of audit regulation and pro-active monitoring was introduced in 1991, resulting
from the EC 8th directive concerning the mutual recognition of auditors. Previously, any
individual holding a recognised accounting qualification (and practising certificate awarded by
their professional body) was eligible to undertake company audits and was subject to the
disciplinary procedures of their professional body. Monitoring was undertaken by the professional
body, under delegated authority from the Department of Trade and Industry (DTI). A new set of
audit regulations was developed by the DTI in conjunction with the professional bodies, which,
inter alia, established a stronger framework for auditor independence. The new regime requires all
auditors to be licensed. Regulatory breaches render the audit firm liable to professional
disciplinary processes and the withdrawal of registration. The year 1991 also saw the replacement
of the Auditing Practices Committee (whose membership comprised auditors only) with the
Auditing Practices Board (APB), which has an equally balanced membership of auditors and non-
5
auditors. Importantly, the APB (in contrast to its predecessor body) does not require its standards
to be approved by its sponsoring bodies. The resultant improvement in the quality of auditing
standards, combined with the introduction of audit regulation (via the monitoring body), is
intended to improve audit practice and auditor independence.
The remainder of this paper is structured as follows. The next section reviews the relevant prior
literature and is followed by the hypotheses development, a description of the methods used, and a
discussion of the results. A final section summarizes and concludes.
PRIOR LITERATURE
No formal `theory' of auditor independence exists and thus, to date, analytical models concerning
independence are very limited. Factors affecting independence generally fall into two broad
categories: economic factors and regulatory factors. Certain economic factors are incorporated in
the model developed by DeAngelo (1981b), which concludes that lowballing does not impair
(actual) independence, however, this model fails to incorporate critical factors, such as the level of
NAS provided by the auditor. Thus, research into auditor independence has generally relied upon
rational argument to identify potential explanatory factors and empirical studies to assess their
significance. The four principal factors believed to impact auditor independence are: the economic
dependence of the auditor on the auditee, competition within the external audit market, the
provision of NAS by the auditor, and the degree of laxity of the regulatory framework. Each is
now considered briefly, in turn.
Audit firms obtain revenue directly from the auditee, with directors in many countries having de
facto control over the appointment and remuneration of the auditor. Further, incumbent auditors
earn client-specific quasi-rents which, by providing an incentive to `cheat' to retain the client
company, intuitively lower auditor independence. A countervailing force is the existence of
similar rents from other auditees, which may be lost if the auditor is `caught' (DeAngelo 1981b,
189-90). The relative strength of these incentives clearly depends upon the significance of the

6
auditee to the audit firm's portfolio. These incentives can operate at firm, office, and partner levels.
High levels of market competition are generally argued to increase the auditor's economic
dependence (AICPA 1978). In recent years, competition has increased due to excess supply and
the removal of solicitation restrictions in many countries. This can be reflected in the budget
pressures faced by auditors (Bartlett 1993, 57-58), tender threats by auditees (Moizer 1994, 19-
20), and competitive pricing by auditors (ICAEW 1995).
The provision of NAS by incumbent auditors is, without doubt, the single factor which has been
debated most intensively by policy-makers, the accountancy profession, practitioners, and
academics. Clearly, NAS provision increases the economic bond between the auditor and auditee,
however joint provision may be efficient due to knowledge spillovers. Joint provision is thus
generally favored by both auditors and auditees. No direct evidence that NAS provision by the
auditor impairs auditor independence has been uncovered by various congressional committees
and professional commissions (e.g., U.S. Senate 1976; AICPA 1978 and 1979). This does not,
however, preclude an impact upon perceived independence, due to a decline in the monitoring
value of the audit.
Regulatory factors concern both accounting and auditing. It is argued that independence is most
threatened where all auditors do not agree on the preferred accounting treatment, due to the
flexibility of accounting standards (Knapp 1985; Magee and Tseng 1990). Key aspects of audit
regulation argued to promote independence are: the existence of unlimited legal liability for
auditors (Farmer et al. 1987, 5); strong enforcement of standards; effective discipline of
companies and auditors; control over the appointment and remuneration of auditors being taken
from directors (ICAS 1993, 57; APB 1994); and the existence of an audit committee (Cadbury
Report 1992).
In addition to these principal factors, a wide variety of factors have been discussed. These include,
inter alia, long periods of tenure which are argued by some to reduce auditor independence
(Mautz and Sharaf 1961, 208; Beck et al. 1988; Teoh and Lim 1996). The auditee's financial
condition is proposed as a relevant factor by Knapp (1985), who argues that auditors'

7
independence will increase as the auditee's financial condition deteriorates, due to the greater risk
of legal exposure. Other factors considered are: the degree of acculturation to audit firm norms
(Farmer et al 1987), unpaid fees (Stamp and Moonitz 1978); existence of audit committee and
disclosure of non-audit fees (Teoh and Lim 1996); and financial interest in auditee, which is
prohibited in many countries (Pany and Reckers 1980; Dykxhoorn and Sinning 1982; Lindsay et
al. 1987). The impact of factors upon perceived auditor independence is, ultimately, an empirical
question. Moreover, the nature and impact of factors may be affected by changes in the socio-
economic and regulatory environments and, therefore, may not be stable over time.
Empirical investigation of factors has generally involved mail surveys (see, for example, Firth
1980; Dykxhoorn and Sinning 1982; Gul 1989; Lindsay 1990; Schleifer and Shockley 1990;
Bartlett, 1993; and Teoh and Lim 1996). A summary of the key features of these studies is
provided in Table 1. The perceptions of a range of interested parties have been studied, in
particular, professional accountants (in some cases specifically auditors) and user groups (mainly
loan officers and financial analysts). Independence perceptions are likely to vary with respondent
type, since different job roles are argued to result in different perceptual models (e.g., Bartlett
1993).
[Table 1 About Here]
In some cases, the questionnaires present a list of factors to be assessed individually. In other
cases, a limited number of factors are combined in `case studies' with a repeated-measures, fixed
effects design, allowing investigation of interaction effects. Thus, the type of stimulus provided to
the subjects could range from a statement of the factor, to a brief (typically one-line) description of
a specific auditor-client relationship resulting from the factor, to a fairly extensive (typically one-
half to one page) case study covering several factors. The factors examined are, in most studies,
restricted to potential threats to independence, with potential enhancement factors not being
considered.
The type of response required also varies depending, to some extent, on the type of respondent.

8
Some studies ask directly whether the factor/situation described would affect their perception of
the auditor's independence (or their ability to withstand pressure from the client), while other
studies ask how a particular decision (e.g., audit judgement, lending decision, investment decision)
would be affected. Responses are captured as either simple dichotomous variables (i.e.,
independent/not independent) or an importance score (typically a five or seven-point Likert scale).
Studies using binary responses typically investigate the issue of group consensus (defined in terms
of a simple majority) for individual factors. Studies also vary in focus, with some investigating
only one factor in detail, while others cover a subset, and yet others are based upon professional
guidelines/rules. Analysis takes the form of descriptive statistics, combined with statistical tests of
differences. All limited factor, factorial ANOVA studies have shown significant between-subjects
differences in responses (e.g., Lindsay 1990). Typically, four-factor models explain less than 30%
of the total variation in perceptions.
HYPOTHESES
Based on this review of the prior literature, we develop six hypotheses (stated in alternative form).
First, we test the impact of the eight factors most frequently included in other studies, using a
variety of operational measures for many factors. Hence:
H1: Interested parties' PAI are negatively affected by the economic dependence of the
auditor on the auditee (ECDEP), a high level of competition within the external audit
market (COMP), the provision of NAS by the auditor (NAS), flexibility of accounting
standards (FLEX), small audit firm size (AUDSIZE), lack of audit committee (AC),
financial interest in client (FININT), and strong financial condition of client.
It has been argued that auditors become `acculturised' to professional norms which include
independence (Farmer et al. 1987). Hence:
H2: Audit partners will have reduced concerns regarding auditor independence compared
to finance directors.
It is likely that auditors' PAI will exhibit greater consensus that those of other interested parties,
9
due to their greater understanding of the issues involved, and the strong influence of professional
norms on their beliefs. Hence:
H3: Auditors' PAI will exhibit greater consensus than those of other interested parties.
In addition to the eight general threat factors taken from the prior literature (see H1), a number of
existing and proposed factors are investigated which have been suggested by various U.K.
professional bodies and commentators to impact, positively or negatively, upon PAI (APB 1994;
Cadbury Report 1992; CAJEC 1991 and 1992a,b; Companies Act 1985; Darbyshire 1992; ICAS
1993; and Labour Party 1994). Hence:
H4: Interested parties PAI are negatively affected by directors' de facto control of auditors'
appointment and remuneration (DIRCON), directors' ability to seek a second opinion on
contentious issues, large size/high status of client (CLIENT), and audit partners' ability to
evade effective quality control procedures within the audit firm; and
H5: Interested parties' PAI are positively affected by costs to company of auditor change
(AUDCH), regulatory rights and requirements surrounding auditor change
(AUDCHREG), risks to auditor arising from poor quality audit (AUDRISK), regulations
concerning the appointment and remuneration of auditors (AUDREG), responsibility for
the negotiation and supply of NAS (NASPROV), disclosure of NAS fees, auditors' rights
at Annual General Meeting (AGM), limitation of auditors' liability, two-tier boards,
penalties for company staff deceiving the auditor, required interval between partner
leaving audit firm and joining client, and personal accountability of auditor.
It is likely that a significant proportion of between-subjects variation in perceptions is due to
respondent-specific auditor/auditee characteristics upon which all responses might be expected to
be contingent. This issue has not previously been examined. In particular, many studies have
shown audit firm size to be a powerful, direct determinant of PAI. Since large audit firms are
perceived to be more independent, we expect that respondents associated with large audit firms
will perceive reduced risks of auditor independence impairment. As a corollary, since the larger
the auditee, the smaller the relative size of the audit firm, we expect respondents associated with

10
large client companies to perceive increased risks of auditor independence impairment. Hence:
H6a: Respondents associated with larger audit firms will perceive reduced risks of auditor
impairment compared to other respondents; and
H6b: Respondents associated with smaller client companies will perceive reduced risks of
auditor impairment compared to other respondents.
METHODS
The research method employed in the present study is the standard mail questionnaire. This
method was chosen, despite its limitations, for two reasons. First, `inferences about people's
attitudes and opinions can be elicited most effectively and efficiently by survey methods'
(Carmichael and Swieringa 1968, 704). Second, since there is no recent study of PAI in the U.K.,
we wanted to provide a basis for further, more focused, research. This ruled out the use of
experimental designs using repeated-measures, fixed effects, since fatigue and boredom restricts
the number of factors which can be investigated. Further, repeated-measures designs can result in
spurious significant differences because the subjects are oversensitized to the variables and
hypotheses being tested and reply cooperatively. These learning and demand effects represent a
serious potential bias, as acknowledged by Pany and Reckers (1980, 58-59; and 1988, 32) and
Lindsay (1992, 361). Limited repeated measures questions were employed for key variables (i.e.,
size of audit firm, size of client company, and NAS provision).
Sample Selection
Two main samples, one of listed company finance directors (FDs) and one of listed company audit
partners (APs), were selected. These groups were selected because of their direct involvement in
the production of audited financial statements. FDs were surveyed because several writers have
recently criticised financial reporting studies generally for focusing on users and failing to
consider the perceptions of preparers (Bence et al. 1992; Edwards 1995). FDs and APs are
surveyed because of their proximity and insight into the issues involved (Imhoff 1978, 875). The
majority of FDs, and all APs, are professional accountants. Following Agacer and Doupnik (1991,
227), the study focuses on professional accountants rather than users `because of the familiarity of

11
this group with the concept of independence'. However, to provide a benchmark for comparison
purposes, all leading U.K. financial journalists (FJs), who proxy for sophisticated users, are
surveyed using the ICAEW's press release circulation list. Since the population of this group is
small, however, the results from this sample are reported on a limited basis.
The sample of FDs was taken from the population of domestic officially listed companies in the
UK as at 30 April 1996. A systematic sample of 300 was selected from an alphabetical listing of
company names. The sample of APs, similar in size to that for the FDs, was drawn from the top 20
audit firms (Accountancy Age, 8th June 1995), since this group audits in excess of 90% of this
population of companies (Beattie and Fearnley 1994). The number of partners selected from each
firm was in proportion to the number of partners in the firm/total number of top twenty firm
partners. Heads of audit were asked to identify partners acting for listed companies, as this
information is not publicly available. The cooperation of the Big Six firms was negotiated with the
assistance of the Audit Faculty of the ICAEW. Ninety-seven second tier (i.e., firms ranked 7-20)
and 210 big six partners were identified.

12
Research Instrument and Questionnaire Administration Procedures
The research instrument used primarily closed-form questions and contained four sections. Section
A contained general questions about the company/audit firm and the auditors/auditee. Section C
concerned the independence of auditors.3 The definition of independence included in the
questionnaire encompassed key aspects of definitions which appear in the literature and read as
follows: `acting with integrity and objectivity and being able to withstand pressure from
management to infringe professional standards'. Respondents were asked to indicate the extent to
which, in their opinion, each of factors listed has an impact on the independence of auditors. The
response scale was 1 - seriously undermines independence, 2 - slightly undermines independence,
3 - no effect on independence, 4 - slightly enhances independence, and 5 - strongly enhances
independence. A scale with a neutral mid-point was used since we did not want, a priori, to
assume the direction of impact which respondents would perceive. This scale also refines the
simple dichotomous response elicited in many prior studies.
The issue of group consensus was examined using dispersion measures. This list of economic and
regulatory factors was developed from the extant literature and from recent changes to the
accounting and auditing environment in the U.K. Existing audit environmental factors (45
including repeated measures) were presented to the respondents in two groups, economic factors
followed by regulatory factors. Thirteen recently proposed regulatory changes followed.
Together, these 58 specific factors proxy for the generic factors listed in H1, H4, and H5 above.
The relationship between both sets of variables, together with a generic factor name, is given in
Table 2. Respondents were also asked how important auditor independence (both perceived and
actual) was to them. The response scale was 1 - not important at all, 2 - of little importance, 3 -
fairly important, 4 - important, and 5 - very important.
[Table 2 About Here]
The remainder of the questionnaire forms part of a separate paper. A draft questionnaire was
pretested with the assistance of several finance directors and audit partners and the content,
ordering, and terminology was revised accordingly. All questionnaires were serially numbered to
13
allow non-respondents to be followed up, were accompanied by an explanatory letter which
included an assurance of confidentiality of responses and a return envelope, and were returned
direct to the researchers.4 Reminder letters were sent after 11 days and a second request (together
with another questionnaire and original covering letter) was sent after a further 15 days.
RESULTS AND DISCUSSION
Response Rates and Tests for Bias
For the FD sample of 300, 153 usable responses were received, a response rate of 51%. For the AP
sample of 307, 244 usable responses were received, a response rate of 80%. These rates are high
compared to those obtained in most studies based on these populations. For the FJ population of
50, 18 usable responses were received, a response rate of 36%.
To test for response bias in the two main samples, the size group of early and late responders (first
and last 75 FD respondents and first and last 55 AP respondents) were compared on the
assumption that late responders are similar to non-responders (Oppenheim 1966, 34). Size groups
were defined in terms of turnover (three groups) for the FD sample, and the audit fee of a specific
client company nominated for the purposes of the questionnaire (four groups) for the AP sample.
The hypothesis that early and late responders were drawn from the same population was tested
using a chi-square (χ2) test and was not rejected (α = 0.05). Although this test is limited in value
(see Wallace and Mellor (1988) for a discussion), we believe that, given the high response rates
obtained, response bias is not a serious threat. Table 3 provides an analysis of the respondents by
audit firm type, company size, and client industry group.
[Table 3 About Here]
The validity of questionnaires can also be affected by the suitability of individual respondents,
who should be both knowledgeable and involved in the relevant practices, usually at a senior level.
FD respondents, based on job title, were finance directors (56%), financial controllers (9%),
directors (5%); accountants (5%), chief accountants (3%), and other/non stated (22%). All AP

14
respondents were partners acting for listed companies. It can be concluded, therefore, that the risk
of uninformed respondent bias in this sample is minimal.
Importance of Auditor Independence
The importance of auditor independence to the respondents is shown in Table 4. Independence
(both perceived and actual) is, on average, rated between important and very important by all three
groups. Interestingly, APs and FJs rate independence in fact of more importance than perceived
independence, with this ranking being reversed (marginally) for FDs. This is likely to reflect the
groups' differing perspectives - the auditors' professional obligation is to be independent in fact,
and the true value of audit to users also depends upon independence in fact, while the priority for
FDs is the appearance of independence. APs rate both measures of independence of significantly
more importance than FDs, perhaps because it is a primary attribute of their professional life. In
addition, the variation in their responses is smaller, indicating a greater consensus of opinion
among this group. The mean scores of the FJ user group are very similar to the APs' scores.
Among the FJ group, there is widespread agreement on the importance of independence in fact,
however, a correspondingly low level of agreement on the importance of perceived independence.
[Table 4 About Here]
These ratings are comparable to those obtained in other studies in the U.S. and Germany which
ask this question and employ a five-point response scale. Hartley and Ross's (1972, 43) ratings
were 4.82, 4.81, and 4.70 for groups of U.S. CPAs, chartered financial analysts, and top financial
executives, respectively. Dykxhoorn and Sinning's (1982, 340) ratings were 4.76 and 4.73 for
groups of German bank loan department and investment department directors, respectively. In
both studies, the question referred implicitly to independence in fact.

15
Factors Influencing PAI
Table 5 sets out, for each of the two main samples, the rank (columns 3 and 4) and mean response
score (columns 6 and 7) for each of the 45 existing audit environmental factors identified in the
questionnaire. Panel A includes those factors which respondents believe to undermine
independence (i.e., mean is less than 3), while panel B includes those factors which respondents
believe to enhance independence (i.e., mean is greater than 3). Column 1 gives an identifying
number for each factor. Factors are listed in rank order for the FD sample (column 3). With few
exceptions, factor scores were statistically different from 3 (no effect on independence) at the 5%
level or higher (using a t-test).5 Thus, a wide range of factors influence PAI. The rank for the small
FJ group is shown in column 5.
[Table 5 About Here]
The following principal observations can be made regarding the findings shown in Table 5, panel
A. Both main groups identify the same five factors (although in a different order) as those which
most seriously undermine independence. Four of these factors measure the economic dependence
of the auditor on the auditee, and, importantly, include measures at the firm, office, and partner
level. Both groups clearly see audit firm size to be positively related to the level of independence,
with small local firms and regional firms undermining independence (ranked 5th and 14th by FDs
and third and 10th by APs, respectively). Surprisingly, the size and status of the client company
(operationalized as a `top 500' and `other listed' company) ranks near the bottom. The FJ group
select three economic dependence factors among their five most critical factors.
NAS provision by auditors in excess of 100% of audit fee is ranked 6th by FDs as an undermining
factor and only 12th= by APs. The corresponding ranks at the 50% level are 10th= and 17th=, and
at the 25% level are 18th and 20th, respectively. This factor is, however, ranked by FJs 2nd at the
100% level and 5th at the 50% level. In a sample of 100 listed U.K. companies, consultancy fees
in 1992 represented, on average, 73% of the audit fee (Peel and Brinn 1993). Thus, prevailing
levels of NAS provision by the auditor are likely to have an important impact on independence
perceptions. Competition among audit firms, together with audit fee discounting and lowballing,

16
both appear mid-way down the rankings (13th and 9th for FDs, 11th and 7th for APs, and 18th and
11th for FJs, respectively.
In panel B, both main groups rank highest the existence of an audit committee composed of non-
executive directors, a majority of whom are independent. Recommendations regarding the
formation of audit committees were introduced in the U.K. by the Cadbury Report (1992) and
subsequently reinforced by the Stock Exchange. The high ranking of this factor may, therefore, be
attributable partly to a recency effect, although a recent study found that, in Malaysia, the
existence of an audit committee was relatively important in explaining PAI (Teoh and Lim 1996).
The factor ranked second highest by both main groups is a Big Six audit firm. The only other
factor to appear in the top five of both groups is the risk of referral to the FRRP for the auditor
(ranked third by the FDs and 4th= by the APs. This suggests that the FRRP is proving to be a
effective deterrent/enforcement mechanism, although the high ranking may, again, be attributable
partly to a recency effect. While it is generally acknowledged that the ASB has reduced the
flexibility of accounting standards (Griffiths 1995), this new body does not appear high in the
rankings (15th for FDs and 16th for APs). Interestingly, the main respondent groups disagree on
the direction of impact for one factor (size and status of client company). FDs (and FJs) believe
that large size and listed status undermine independence, whereas APs believe that both factors
enhance independence.
The striking difference between the perceptions of the FJ sample and the two main groups relates
to audit firm size. In the FJ sample, neither Big Six nor other international or national audit firms
are perceived to enhance independence significantly, nor are regional audit firms perceived to
undermine independence significantly although (in common with FDs and APs) small audit firms
are so perceived. Thus, although the groups who are directly involved in the audit process perceive
audit firm size to affect auditor independence, users (who are further removed from the audit
process) do not. The FJ group ranks risk to audit firm of loss of Registered Auditor status as the
top enhancement factor. In common with both main groups, FJs also cite audit committee
existence and risk of referral to the FRRP for the auditor among their five most critical factors, in
addition to auditor change regulations and disclosure of non-audit fees paid to auditor.

17
Overall, hypothesis H1 is strongly supported. In particular, economic dependence, competition,
NAS, flexibility of accounting standards, small audit firm size (except for FJs), lack of audit
committee, unpaid audit fees, and strong financial condition of client all significantly reduce PAI.
Table 5 (column 8) tests for a significant difference between the two main groups' responses with
respect to existing audit environmental factors (proposed factors are dealt with in Table 7). A
significant difference (at the 5% level) is found for 23 out of the 45 factors. In only four of these
cases do the APs' scores fall below those of the FDs. Thus, APs generally perceive less threat (or
greater enhancement) to auditor independence than the FDs. This is consistent with the findings of
other studies in the U.S. and Canada which compared the perceptions of auditors (or professional
accountants generally) and other interested parties (especially less sophisticated users) (Imhoff
1978, 875; Reckers and Stagliano 1981; Lindsay et al. 1987, 184; and Bartlett 1993, 59). This
finding may be attributable partly to the different perspectives of the two groups. Hypothesis H2 is
broadly supported with respect to the 45 existing audit environmental factors. Despite these
individual absolute differences, the overall correlation between the rankings of the two main
samples is remarkably high (Spearman rank correlation = 0.949; p = 0.0001). This is comparable
to prior U.S. studies (e.g., Bartlett 1993, 59).
Table 5 also reports the standard deviation of responses for all three groups (columns 9 to 11),
which indicates the level of consensus among each group. (To date, consensus has been examined
explicitly only in those prior studies which employ a simple dichotomous response variable. In
these studies, the binomial test is used to test for consensus (defined as a statistically significant
majority of opinion) (e.g., Lindsay et al. 1987).) In the two main groups, a high level of consensus
(classified as standard deviation ≤ 0.55 and indicated by a single asterisk in Table 5) is found for
seven factors, whereas a low level of consensus (classified as standard deviation ≥ 0.85 and
indicated by two asterisks in Table 5) is found for six factors.6 Thus, there is relatively wide
disagreement among both groups on the impact of both formal regulatory, and economic,
disciplinary mechanisms. In the majority of cases (28 out of 45), the level of consensus among
APs exceeds that among FDs. This is consistent with Lindsay et al.(1987, 183), who find that in

18
Canada auditors demonstrate generally higher consensus than other interested parties.
In the small FJ group there is generally lower consensus: although a high level of consensus exists
for eight factors, a low level of consensus exists for 16 factors. Furthermore, the proportion of
`don't know' responses is highest for the FJ group, suggesting that even sophisticated users have an
incomplete understanding of the issues involved. However, notably strong agreement exists that
the dependence of a partner's income upon the retention of a specific audit client undermines
independence (standard deviation = 0.47) and that the requirement for an auditor ceasing to hold
office to file a statement of circumstances at Company Registry enhances independence (standard
deviation = 0.36). By contrast, notably weak agreement exists that ≥10% of total firm revenues
from one client undermines independence (standard deviation = 1.11). As with FDs, in the
majority of cases (29 out of 45), the level of consensus among APs equals or exceeds that among
FJs.
Thus, hypothesis H3 is supported with respect to the 45 existing audit environmental factors.
Factor Analysis
Many of the independence factors in Table 5 are likely to be highly correlated. In an attempt to
uncover the critical underlying dimensions, an exploratory factor analysis was performed for each
main group (using the principal components method with varimax rotation). No prior study utilises
this method of investigation. Fourteen and fifteen initial factors were extracted for the FD and AP
samples, respectively, based on the eigenvalue ≥1 criterion (Kim and Mueller 1978, 49). These
factors explained 76% and 72% of the variance among the independence factors for the FD and
AP samples, respectively. Not surprisingly, both samples' responses have very similar factor
structures, with 13 broadly similar factors. These factors are described in Table 6, which provides
a subjective factor label based on each factor's principal component independence factors. All
component factors with loadings ≥0.5 are shown, together with their factor loadings.
[Table 6 About Here]

19
Table 6 shows that FDs and APs have the same top four extracted factors, comprising two
regulatory and two economic factors. These factors relate to: recent regulatory enforcement
mechanisms; rights and requirements surrounding auditor change; importance of NAS (combined
with economic dependence on client for the FDs); and economic significance of client.
Interestingly, regulatory enforcement mechanisms are a less important factor for APs than for FDs
(ranking third for the APs and first for the FDs). Risk of referral to the FRRP for the auditor is a
principal component of this factor for both groups; however the risk of referral to the FRRP for the
company has no significant loadings for APs. It would appear that APs underestimate the risk
companies perceive for themselves. By contrast, the economic significance of the client is a more
important factor for APs than FDs (ranking second for the APs and fourth for the FDs).
There are four principal differences in the factor structures of the two groups. First, economic
dependence on client is linked positively by the FDs with the importance of NAS provision by the
auditor (FD factor 3), whereas the APs see these as independent factors (AP factors 4 and 14).
Second, competition among audit firms is positively linked with the size/status of the auditee by
FDs (FD factor 7), yet for the APs, the link (positive) is to budget pressures on audit staff (AP
factor 10). Third, non-executive directors' desire to protect their personal reputation (sole
component of FD factor 14) does not load significantly on any AP factor. Finally, the opportunity
to exploit flexible accounting standards (AP extracted factor 15), comprising directors' ability to
seek a second opinion on contentious issues and flexibility of accounting standards set by the
Accounting Standards Committee (SSAPs), has no equivalent FD extracted factor.
Several independence factors ranked highly in Table 5 do not load significantly on any extracted
factors. Specifically, the independence enhancement factor which both FDs and APs rank first
(existence of audit committee composed of non-executive directors, a majority of whom are
independent), does not emerge from the factor analysis. This corporate governance mechanism
appears to be multi-dimensional, being positively associated with factors 1, 5, 11, and 14, and
negatively associated with factors 8 and 9 for the FDs, and positively associated with factors 6 and
7 and negatively associated with factors 12 and 15 for the APs (using a cutoff of ≥ 0.20. Other
independence factors which do not emerge from the factor analysis for both groups are: partner's
20
ability to evade effective quality control procedures within audit firm (ranked 8th and 6th (panel
A) by the FDs and APs, respectively); audit fee discounting and low-balling (ranked 9th and 7th
(panel A) by the FDs and APs, respectively); and rotation of audit partners (at least every seven
years) (ranked 5th and 8th (panel B) by the FDs and APs, respectively).7
Recent Proposals for Regulatory Change
Thirteen proposals for regulatory change made recently by various bodies were identified and
respondents were asked to assess their impact upon auditor independence. Results for both main
groups are shown in Table 7, whose format corresponds to that of Table 5.
[Table 7 About Here]
Perhaps surprisingly, given the switching costs involved, compulsory rotation of audit firm is
ranked top by FDs, but (less surprisingly) only 9th by APs. The most important factor for APs was
the introduction of effective statutory penalties for company staff deceiving the auditor. Again,
proposals concerned with NAS restrictions are ranked more highly by FDs than APs, while the
FJs' top ranked factor was the imposition of a required interval between partner leaving audit firm
and joining client. APs do not believe that the audit opinion being personally signed by the AP
would have a significant impact, whereas FDs do not believe either periodic compulsory
competitive tendering for audit services or limitation of auditors' liability would have a significant
impact (at the 5% level). For eight factors, a significant difference exists between the responses of
both main samples, however in only three of these cases do APs believe that the factor enhances
auditor independence significantly more than FDs. Thus, in respect of proposed regulatory factors,
H2 is only partially supported.
Table 7 (columns 9 to 11) reports the standard deviation of responses for all three groups. A high
level of consensus exists among the AP group only for two factors, while a low level of consensus
exists among the FD group only for three factors. Furthermore, for all factors, the level of
consensus among APs equals or exceeds that among FDs. For the FJ group, a low level of
consensus exists for six factors and, as for the FDs, for all factors the level of consensus among
21
APs equals or exceeds that among FJs. Thus, hypothesis H3 is supported with respect to the 13
proposed audit environmental factors.
The results in Tables 5 and 7 also permit hypotheses H4 and H5 to be tested. With few minor
exceptions, both hypotheses are fully supported for the main groups, i.e., the factor has a
significant impact on PAI in the expected direction. (The exceptions are large size/high status of
client company, which APs perceive as significantly enhancing independence and six factors out
of the 33 which have no significant impact for one or both groups.8) Findings with respect to
employment with ex-client confirm those of Imhoff (1978), Firth (1980) and Koh and Mahathevan
(1993), while findings with respect to personal accountability of auditor confirm those of Lord
(1992) in the current U.K. setting. For the FJ group, the factors listed in hypotheses H4 and H5
have a significant impact in the expected direction for 27 out of 33 factors (results are not
significant for the remaining six factors), providing further support for H4 and H5.
Comparison with Selected Previous Single Country Studies
Table 8 provides a comparison between the results of the present study and the seven selected
single country studies summarized in Table 1. Panel A considers factors which may influence PAI,
while panel B considers inter- and intra-group differences. Only a broad comparison is possible,
since both the specific proxy measures used to capture general themes and the nature of the
response elicited varies considerably across studies. Moreover, within a single country, PAI are
likely to change over time, due to changes in the economic, political, cultural, and regulatory
environment. This also varies across countries at a single point in time.
The previous U.K. study (Firth 1980) examined 29 auditor-client relationships related to fees,
personal relationships, financial involvement with (or in the affairs of) clients, and conflicts of
interest. These relationships covered the examples contained in the ethical guidelines which had
been issued by the U.K. accountancy bodies shortly before the study was undertaken. Subsequent
changes to the U.K. regulatory framework have since prohibited many of the relationships studied
by Firth (1980), however three relationships (relating to economic dependence and NAS
provision) remain relevant to the present study. Panel A shows that in the present auditing

22
environment, economic dependence and NAS provision are both seen as dominant threat factors,
whereas these factors ranked only moderately in Firth's (1980) study. This is likely to be partially
due to the existence of issues (subsequently prohibited) which were regarded at the time as greater
threats.
[Table 8 About Here]
Turning to studies in other countries, economic dependence is viewed as the most critical threat
factor in both the U.K. (present study) and Malaysia (Teoh and Lim 1996). The perceived threat
appears to be much less in Germany (Dykxhoorn and Sinning 1982) and the U.S. (Bartlett 1993).
Dykxhoorn and Sinning (1982), like Firth (1980), was undertaken in the early 1980s, when the
focus in many countries was on the establishment of a set of guidelines on independence. Bartlett
(1993) uses a figure of only 1% of total firm revenues (compared to the ≥10% used in the present
study). It is concluded, therefore, that economic dependence has become a critical threat factor in
the 1990s.
Competition within the audit market is consistently seen to be a small but significant threat to
independence across New Zealand (Gul 1989), Canada (Lindsay 1990), the U.S. (Schleifer and
Shockley 1990), and the U.K. (present study). The provision of NAS by the auditor has become a
more significant threat factor over time, with studies in the U.S. (Schleifer and Shockley 1990;
Bartlett 1993), Canada (Lindsay 1990), Malaysia (Teoh and Lim 1996), and the U.K. (present
study) all indicating a significant impairment of PAI. Surprisingly, the New Zealand study (Gul
1989) finds a large positive impact on PAI. The flexibility of accounting standards emerges as the
most important factor in Canada (Lindsay 1990), but is not ranked highly in the U.K. (present
study). Audit firm size is consistently a key factor in New Zealand (Gul 1989), Canada (Lindsay
1990), and the U.K. (with the exception of the small user group) (present study).
Perceptions regarding the influence of audit committees would appear to have changed radically
over time. Gul (1989) does not find this factor to be significant in New Zealand, while it ranks
highly in more recent studies in Malaysia (Teoh and Lim 1996) and the U.K. (present study). This
23
finding is perhaps attributable to the heightened concern with corporate governance issues which
followed major corporate scandals in these latter countries in the late 1980s and early 1990s.
There is general support across countries for additional regulations concerning auditor
appointment, particularly by moving this responsibility to the audit committee (supported in the
U.S (Schleifer and Shockley 1990) and the U.K. (present study)). Audit firm rotation is less
strongly favored in the U.S., Malaysia, and the U.K. (with the exception of the preparer group in
the U.K.). Neither weak client financial condition, nor disclosure of audit fees, were seen to be key
enhancement factors (with the exception of U.K. users who ranked audit fee disclosure relatively
highly).
To the extent that the above noted differences can be taken to reflect systematic, underlying
country differences, it appears that economic dependence and NAS provision are the key threats to
PAI, with audit committees emerging as a critical enhancement factor. McKinnon (1984) argues
that intrinsic acceptance of independence in professional relationships is greater in Western
cultures that in Eastern cultures (such as Japan) where social relationships are premised on
interdependence and group orientation. However, the Malaysian study's results (Teoh and Lim
1996) are comparable with those from the Western countries, perhaps indicating a strong Western
influence.
In terms of group differences (see panel B), user groups consistently perceive the threats to auditor
independence as greater than preparers (auditors and finance directors). Few studies have
examined intra-group consensus, however there is a slight indication that consensus is greatest
among top tier (i.e., Big Eight or Big Six) auditors.
Contingent Influence of Respondent-Specific Characteristics upon PAI
Prior studies have generally not investigated whether PAI are contingent upon respondent-specific
auditor/auditee characteristics.9 Table 5 showed that audit firm type ranks highly among factors
impacting directly on PAI, although company size did not. Audit firms were classed as either Big
Six or non-Big Six, the percentage of Big Six respondents being 79% and 72% for the FD and AP
24
samples, respectively. Three company size groups were formed for the FD sample, based on
turnover (as reported in Table 3), while four company size groups were formed for the AP sample,
based on audit fees (receivable in the latest annual accounts from a specific client nominated for
the purposes of providing a context for answering the questionnaire).10 The results of association
tests for the main samples are shown in Tables 9 and 10.
[Tables 9 and 10 About Here]
A significant difference (at the 5% level) existed for at least one of the groups for 23 out of the 45
existing audit environmental factors with respect to audit firm type. Respondents associated with
Big Six firms generally believed that factors enhanced independence significantly more, or were a
less serious threat to independence. Turning to company size,
there were 12 factors for which a significant difference (at the 5% level) existed among the
three/four sub-group means for at least one of the groups. Multiple paired comparison tests
revealed that it was more common for respondents associated with larger auditees to perceive
reduced risks of auditor independence impairment. This result is not as expected and may be
because the cost (in terms of reputation damage) to the very top companies of `getting the
accounts wrong' is relatively higher than for other listed companies, due to their relatively higher
visibility.
In the case of three factors, results were inconsistent between the FD and AP samples. In
particular, NAS ≥100% audit fee was seen as less of a threat to independence by APs of the groups
of larger companies, rather than the group of smaller companies, whereas this factor was seen as
more of a threat by FDs of the group of larger companies, rather than the group of smaller
companies.
Thus, hypothesis H6a concerning audit firm size is broadly supported, whereas hypothesis H6b
concerning company size is not.
The impact was explored of four additional respondent-specific characteristics which may

25
influence the responses to selected, related factors only. First, audit committees have been found to
be generally supportive of auditors in conflict situations (Knapp 1987). We therefore investigated
whether respondents associated with companies having an audit committee, especially a strong
audit committee, perceived reduced risks of auditor independence impairment, in relation only to
factors concerning audit committees. The existence of an audit committee, as expected, resulted in
significantly reduced perceived risks of auditor independence impairment for four of the seven
factors examined (factors 23 and 36 were significant at the 1% level for FDs; and factors 51 and
54 were significant at the 1% level for APs).11 Audit committee strength (measured as the ratio of
non-executive to executive voting members) had no significant effect.
Second, since NAS provision has been shown by several studies to be a powerful, direct
determinant of PAI, we investigated whether respondents associated with companies purchasing
high levels of NAS (relative to audit services) from their auditor perceived increased risks of
auditor independence impairment, in relation only to factors concerning NAS. This characteristic
did not have the predicted effect for any of the eight factors examined.12 Thus, NAS do not appear
to undermine PAI. Certainly, prior studies have produced conflicting results regarding the impact
of this factor (see above).
Third, direct finance director responsibility for the appointment and remuneration of auditors has
been argued to reduce auditor independence. We therefore investigated whether respondents
associated with companies where finance directors (rather than other directors) have this
responsibility perceived increased risks of auditor independence impairment, in relation only to
those factors concerning auditor appointment and remuneration. Findings were mixed.
Respondents associated with companies where FDs have responsibility for the appointment of
auditors perceived significantly increased risk of auditor independence impairment for only one of
the 12 factors examined.13 However, no significant differences for any of the five factors tested
were found between companies where FDs have responsibility for the negotiation of the audit fee
and, contrary to expectations, respondents associated with companies where FDs have
responsibility for the negotiation of NAS fees from the auditor perceived significantly less risk of
auditor independence impairment for one of the eight factors examined.14
26
Finally, long periods of auditor tenure have been argued to reduce PAI (e.g., Hartley and Ross
1972), although most studies which investigated this factor found no significant impact (e.g., Firth
1981; and Shockley 1981). We therefore investigated whether respondents associated with
companies where the audit firm, signing partner, or principal contact partner had held office for a
long period perceived increased risks of auditor independence impairment, in relation only to
factors concerning appointment and tenure. Again, findings were mixed. Contrary to expectations,
respondents associated with audit firm tenure periods in excess of ten years perceived significantly
less risk of auditor independence impairment for two of the 15 factors examined.15 However, in
line with expectations, respondents associated with signing partner relationships in excess of ten
years did perceive significantly more risk of auditor independence impairment for two of these
factors (factors 7 and 10 were significant at the 5% level for APs) and respondents associated with
principal contact partner relationships in excess of five years did perceive significantly more risk
of auditor independence impairment for one of these 15 factors examined (factor 51 was
significant at the 5% level for FDs).
These findings provide weak evidence of the contingent influence of other respondent-specific
factors upon PAI. It appears that the existence of an audit committee, relatively high NAS fees
paid to the auditor, FD responsibility for NAS fee negotiation, and long audit firm tenure each
enhance PAI for a limited set of selected factors, whereas FD responsibility for auditor
appointment and long signing partner/principal contact partner relationship reduce PAI for a
limited set of selected factors.
SUMMARY AND CONCLUSIONS
This study investigates the beliefs and perceptions regarding auditor independence held by 153
U.K. listed company finance directors and 244 audit partners of U.K. listed companies using a
mail questionnaire. In addition to these two main samples, a small sample of 18 financial
journalists provides a user group benchmark. The impact of a large set of 58 existing and
proposed economic and regulatory factors on PAI is investigated. Previous research is extended by
27
including potential enhancement factors, examining within-group consensus, identifying a reduced
set of uncorrelated factors using multivariate analysis, and exploring the contingent influence of
respondent-specific characteristics upon perceptions. The only prior research in this area
conducted in a U.K. setting (Firth 1980) is updated, since significant changes in the economic and
regulatory environment have since occured.
Auditor independence, in both fact and appearance, is found to be important to all groups, with
APs and FJs rating independence in fact of greater importance than perceived independence, and
also rating both measures of greater importance than FDs. As hypothesised, APs generally
perceive issues to be significantly less of a threat to independence than FDs. Results indicate that a
wide range of generic factors have a significant impact upon PAI for all groups. Specifically, the
eight factors most commonly included in previous research are all found to affect PAI negatively,
as do four other generic factors. In addition, twelve generic factors are found to have a significant
positive impact on PAI. The principal threat factors relate to economic dependence and NAS
provision, while the principal enhancement factor is the existence of an audit committee. As
hypothesised, the AP group exhibited a generally higher level of consensus in their perceptions
than both the FD and FJ groups. These results confirm, within the current U.K. audit environment,
many of the findings from the U.S., Canada, and elsewhere.
This study also, for the first time, explores the context-dependency of PAI. Perceptions regarding
many independence factors are shown to be contingent upon audit firm type and company size.
Respondents associated with Big Six firms and larger auditees generally perceived issues to be
less of a threat to independence.
The original set of 45 existing audit environmental factors is reduced using factor analysis to a
smaller number of uncorrelated underlying dimensions (14 for the FDs and 15 for the APs). Both
main groups have similar factor structures, the four most important dimensions being: recent
regulatory enforcement mechanisms; regulatory rights and requirements surrounding auditor
change; importance of NAS; and economic significance of client. Audit committees are revealed
as a multi-dimensional factor.

28
Overall, this study has revealed the complexity of the independence concept (the principal
dimensions of which are identified) and the contingent nature of PAI. In interpreting its findings,
however, the well-known limitations of questionnaire research must be considered. The use of an
explicit definition of independence, and the high response rates obtained, serve to minimize the
key threats to validity.
The results should be of direct interest to policy-makers. In particular, this study's findings can
assist both EU policy-makers in the establishment of a common core of independence principles,
and can assist U.K. policy-makers in their evaluation of the impact of recent regulatory changes
and the likely impact of proposed changes. The factor analysis, in particular, shows clearly that the
establishment of the ASB and the FRRP, together with the introduction of audit regulation have
had a major impact upon the auditing environment. Findings will also be of interest to the new
U.S. Independence Standards Board. Results provide a rigorous basis for the selection of a smaller
factor set (i.e., those factors shown to have the greatest impact on PAI) for further detailed
analysis. This further research, possibly using a factorial ANOVA design, could usefully explore
interaction effects among these key factors.
NOTES
1. The revised Code of Professional Conduct (AICPA, 1988) omits a definition of independence, opting instead to defineimpairment by example.
2. Antle (1994) uses a formal principal-agent model, and game-theoretic concepts, to formulate two plausible definitions ofindependence using partial equilibrium analysis.
3. Section B (concerning the audit relationship) and Section D (concerning attitudes to regulatory changes) form part of aseparate paper.
4. Questionnaires to all FDs, and APs in second tier firms, were sent direct by the researchers. In the case of the big six firms,the sealed, prenumbered research packages supplied by the researchers were distributed internally by the firm (thus preservingthe APs', and their client's, anonymity).
5. The exceptions for the main samples were factors 19-22, 44, and 45 for the FDs and factors 18, 39, 43, and 45 for the APs.
6. High consensus factors were: budget pressures imposed by audit firm on staff (both groups); provision of executive searchand appointment services by incumbent auditor (APs only); non-audit services from incumbent ≥25% audit fee (both groups);unpaid audit fees (FDs only); requirement for incoming auditor to communicate with outgoing auditor before acceptingnomination or appointment (APs only); disclosure of non-audit fees paid to auditor (APs only); and management time and costsincurred in changing auditors (APs only). Low consensus factors were: risk of referral to the FRRP for the auditor (FDs only);risk to audit firm of loss of Registered Auditor status (both groups); risk to audit firm of disciplinary action by professional body(both groups); risk of adverse market reaction to frequent auditor changes (FDs only); risk of damage to auditor's reputationfrom public scandals (both groups); and risk of litigation against audit firm (both groups).
7. Independence factors which do not load significantly on any extracted factor for one group only are: client in a weak financialcondition (FD group); and provision of executive search and appointment services by incumbent auditor; unpaid audit fees; anddisclosure of non-audit fees paid to auditor (AP group).
8. The six factors which have no significant impact for one or both groups are: directors' ability to seek a second opinion oncontentious issues (FDs), requirement for auditors to be reappointed annually (APs), risk of litigation against audit firm (FDs),management time and costs incurred in changing auditors (both groups), periodic compulsory competitive tendering for auditservices (FDs), and limitation of auditors' liability (FDs).
9. Exceptions are Shockley (1981), Pearson and Ryans (1982), and Schleifer and Shockley (1990), who distinguish between theresponses of Big Eight and non-Big Eight CPAs.
10. Audit fees rather than turnover was used since it was felt (and piloting confirmed) that APs would be most familiar with thisfigure, and studies show a very high correlation between audit fees and company size (Pong and Whittington, 1994). The fourgroups were: less than £100,000, £100,001 - £250,000, £250,001 - £500,000, and more than £500,000, with the number ofrespondents in each group being 89, 67, 31, and 57, respectively.
11. Factors 10, 12, and 52 were not significant.
30
12. For factor 11, a significant (5%) positive association existed between the ratio of NAS fees to audit fees and auditorindependence scores for the FDs, which implies a negative association with perceived risks of auditor independence impairment(factors 6, 17, 18, 41, 47, 49, and 54 were not significant).
13. Factor 51 was significant at the 5% level for FDs and factors 10, 12, 27, 40, 43, 45, 46, 54, 55, 56, and 57 were notsignificant.
14. For audit fee negotiation, factors 12, 13, 16, 19, and 20 tested; for NAS fee negotiation, factor 18 was significant at the 5%level for FDs; and factors 6, 11, 17, 41, 47, 49, and 54 were not significant.
15. Factor 10 was significant at the 5% level for FDs; factor 45 was significant at the 1% level for APs; and factors 1, 2, 3, 4, 7,27, 40, 43, 46, 51, 55, 56, and 57 were not significant.

31
REFERENCES AARF. 1992. Statement of Auditing Practice, AUP 32: Audit Independence. Australian Accounting Research Foundation. Accountancy Age. 1995. Firms Move Out of Slump but Results Less Than Sparkling. 8th June. Agacer, G.M. and T.S. Doupnik. 1991. Perceptions of Auditor Independence: A Cross-Cultural Study. International Journal of Accounting 26: 220-237. AICPA. 1978. Commission on Auditors' Responsibilities: Report, Conclusions, and Recommendations (Cohen Commission). New York: American Institute of Certified
Public Accountants. . 1979. Public Oversight Board Report: Scope of Service by CPA Firms. New York: American Institute of Certified Public Accountants. . 1985. AICPA Professional Standards Volume B. New York: American Institute of Certified Public Accountants. . 1987. Report of the National Commission on Fraudulent Financial Reporting (Treadway
Commission). New York: American Institute of Certified Public Accountants. . 1988. Code of Professional Conduct. New York: American Institute of Certified Public
Accountants. . 1992. Professional Standards. New York: American Institute of Certified Public Accountants. . 1994. Improving Business Reporting - A Customer Focus: Meeting the Information Needs of Investors and Creditors (Jenkins Committee). New York: American Institute of
Certified Public Accountants. Antle, R. 1984. Auditor Independence. Journal of Accounting Research 22 (Spring):1-20. APB. 1992. The Future Development of Auditing: A Paper to Promote Public Debate (The MacFarlane Report. London: Auditing Practices Board. . 1994. The Audit Agenda. London: Auditing Practices Board. Bartlett, R.W. 1993. A Scale of Perceived Independence: New Evidence on an Old Concept', Accounting, Auditing & Accountability Journal 6(2): 52-67. Beattie, V. and S. Fearnley. 1994. The Changing Structure of the Market for Audit Services in the
32
U.K. - A Descriptive Study. British Accounting Review 26: 301-322. Beck, P.J., T.J. Frecka and I. Solomon. 1988. An Empirical Analysis of the Relationship Between MAS Involvement and Auditor Tenure : Implications for Auditor Independence. Journal of Accounting Literature 7: 65-84. Bence, D., R. Hussey and C. Wilkie. 1992. Producers, Investment Analysts and the Annual Report. British Accounting Association Conference Paper, 1993. Cadbury Report. 1992. Report of the Committee on the Financial Aspects of Corporate Governance. London: Gee and Co. CAJEC. 1991. Opinion Shopping, Discussion Paper. London: Chartered Accountants' Joint Ethics Committee. . 1992a. Changes in Professional Appointment, A Consultative Paper. London: Chartered Accountants' Joint Ethics Committee. . 1992b. Former Partner or Senior Employee Joining an Audit Client Company. London: Chartered Accountants' Joint Ethics Committee. Canadian Institute of Chartered Accountants. 1978. Report of the Special Committee to Examine the Role of the Auditor, CA Magazine (April): 33-70. Carmichael, D.R. and R.J. Swieringa. 1968. The Compatibility of Auditing Independence and Management Services - An Identification of the Issues. The Accounting Review 43(4) (October): 697-705. Companies Act. 1985. London: HMSO. Darbyshire, D. 1992. Cutting Auditors Noses off to Spite Clients' Faces. Accountancy 110(1192) (December): 101. DeAngelo, L.E. 1981a. Auditor Size and Audit Quality. Journal of Accounting and Economics 3: 183-199. 1981b. Auditor Independence, "Low Balling", and Disclosure Regulation. Journal of Accounting and Economics 3: 113-127. Dykxhoorn, H.J. and K.E. Sinning. 1982. Perceptions of Auditor Independence: Its Perceived
Effect on the Loan and Investment Decisions of German Financial Statement Users. Accounting, Organizations and Society 7(4): 337-347.
EC Green Paper. 1996. The Role, the Position and the Liability of the Statutory Auditor within the
33
European Union. Brussels: European Commission. Edwards, P. 1995. Segmental Reporting: A Preparers' Perspective. Accounting and Business
Research 25(99) (Summer): 151-161. Farmer, T.A., L.E. Rittenberg and G.M. Trompeter. 1987. An Investigation of the Impact of Economic and Organization Factors on Auditor Independence. Auditing: A Journal of Practice & Theory 7(1) (Fall): 1-14. FEE. 1996. The Role, Position and Liability of the Statutory Auditor in the European Union.
Brussels: Federation des Experts Comptables Europeens. Firth, M. 1980. Perceptions of Auditor Independence and Official Ethical Guidelines. The Accounting Review 55(3) (July): 451-466. 1981. Auditor-Client Relationships and Their Impact on Bankers' Perceived Lending Decisions. Accounting and Business Research (Summer): 179-188. GAO. 1996. The Accounting Profession - Major Issues: Progress and Concerns. Washington,
DC: U.S. General Accounting Office. Griffiths, I. 1995. New Creative Accounting. London: Macmillan. Gul, F.A. 1989. Bankers' Perceptions of Factors Affecting Auditor Independence. Accounting,
Auditing & Accountability Journal 2(3): 40-51. Hampel Report. 1998. Committee on Corporate Governance: Final Report. London: Gee Publishing Ltd. Hartley, R.V. and T.L. Ross. 1972. MAS and Audit Independence: An Image Problem. Journal of Accountancy (November): 42-51. ICAEW. 1995. Report to the Council of the ICAEW of the Working Group on Competitive Pricing. London: Institute of Chartered Accountants in England and Wales. ICAS. 1993. Auditing into the Twenty-First Century, McInnes, W.M. (ed.), Discussion Document. Edinburgh: Institute of Chartered Accountants of Scotland. . 1996. Statement of Professional Conduct 1, Integrity, Objectivity and Independence. Edinburgh, Institute of Chartered Accountants of Scotland. Imhoff, E.A. 1978. Employment Effects on Auditor Independence. The Accounting Review 53(4) (October): 869-881.

34
Kim, J.-O. and C.W. Mueller. 1978. Introduction to Factor Analysis: What It Is and How To Do It. Beverly Hills, CA: Sage Publications. Koh, H.C. and P. Mahathevan. 1993. The Effects of Client Employment on Auditor Independence. British Accounting Review 25: 227-242. Knapp, M.C. 1985. Audit Conflict: An Empirical Study of the Perceived Ability of Auditors to
Resist Management Pressure. The Accounting Review 60(2) (April): 202-211. 1987. An Empirical Study of Audit Committee Support for Auditors Involved in Technical Disputes with Client Management. The Accounting Review 62(3) (July): 578-588. Labour Party. 1994. Winning for Britain: Labour's Strategy for Industrial Success. London:
Labour Party. Lindsay, D. 1990. An Investigation of the Impact of Contextual Factors on Canadian Bankers' Perceptions of Auditors' Ability to Resist Management Pressure. Advances in International Accounting 3: 71-85. 1992. Auditor-Client Conflict Resolution: An Investigation of the Perceptions of the Financial Community in Australia and Canada. International Journal of Accounting 27: 342-365. , M. Rennie, G. Murphy and H. Silvester. 1987. Independence of External Auditors: A Canadian Perspective. Advances in International Accounting 1: 169-189. Lord, A.T. 1992. Pressure: A Methodological Consideration for Behavioural Research in Auditing. Auditing:A Journal of Practice and Theory 11(2) (Fall): 89-108. Magee, R. and M. Tseng. 1990. Audit Pricing and Independence. The Accounting Review (April): 315-336. MARC. 1996. The Role, Position and Liability of the Statutory Auditor Within the European
Union, Final Report. Maastricht Accounting and Auditing Research Centre. Mautz, R. and H. Sharaf. 1961. The Philosophy of Auditing. Sarasota, Fl: American Accounting Association. McKinley, S., K. Pany and P.M.J. Reckers. 1985. An Examination of the Influence of CPA Firm Type, Size, and MAS Provision on Loan Officer Decisions and Perceptions. Journal of Accounting Research 23(2) (Autumn): 887-896. McKinnon, J. 1984. Cultural Constraints on Audit Independence in Japan. The International
Journal of Accounting Education and Research 20: 17-44.

35
Moizer, P. 1994. Review of Recognised Supervisory Bodies: A Report to the Department of Trade and Industry on the Audit Monitoring Process'. Oppenheim, A.N. 1966. Questionnaire Design and Attitude Measurement. Heinemann. Pany, K. and P.M.J. Reckers. 1980. The Effect of Gifts, Discounts, and Client Size on Perceived Auditor Independence. The Accounting Review 55(1) (January): 50-61. 1988. Auditor Performance of MAS: A Study of Its Effects on Decisions and Perceptions. Accounting Horizons (June): 31-38. Pearson, M.A. and J.K. Ryans. 1982. Perceptions of an Auditor-Management Conflict. Review
of Business and Economic Research 17 (Winter): 1-10. Peel, M. and T. Brinn. 1993. Consultancy and Audit Fees in the UK Listed Market. Accountancy (August): 61-62. Pong, C.K.M. and Whittington, G. 1994. The Determinants of Audit Fees: Some Empirical
Models. Journal of Business Finance and Accounting 21(8): 1071-1095. Public Oversight Board. 1986. Public Perceptions of Management Advisory Services Performed by CPA Firms for Audit Clients, Securities and Exchange Commission Practice Section, American Institute of Certified Public Accountants. New York: Public Oversight Board. . 1994. Strengthening the Professionalism of the Independent Auditor (Kirk
Report), Report to the Public Oversight Board of the Securities and Exchange Commission Practice Section, American Institute of Certified Public Accountants. Stamford, CT: Public Oversight Board.
Reckers, P.M.J. and A.J. Stagliano. 1981. Non-Audit Services and Perceived Independence: Some
New Evidence. Auditing: A Journal of Practice & Theory 1(1) (Summer): 23-37. Schleifer, L.L.F. and R.A. Shockley. 1990. Policies to Promote Auditor Independence: More
Evidence on the Perception Gap. Journal of Applied Business Research 7(2): 10-17. Schuetze, W.P. 1994. A Mountain or a Molehill? Remarks by Walter P. Schuetze, Chief Accountant, Securities and Exchange Commission of the United States of America to AICPA's Twenty-First Annual National Conference on Current SEC Developments. Schulte, A.A. 1965. Compatibility of Management Consulting and Auditing. The Accounting
Review (July): 587-593. Shockley, R.A. 1981. Perceptions of Auditors' Independence: An Empirical Analysis. The Accounting Review 56(4) (October): 785-800.

36
Stamp, E. and M. Moonitz. 1978. International Auditing Standards. London: Prentice-Hall
International. Teoh, H.Y. and C.C. Lim. 1996. An Empirical Study of the Effects of Audit Committees. Disclosure of Non-Audit Fees, and other Issues on Auditor Independence: Malaysian Evidence. Journal of Accounting, Auditing and Taxation 5(2): 231-248. U.S. Senate. 1976. Subcommittee on Reports, Accounting and Management, Committee on
Governmental Operations, The Accounting Establishment: A Staff Study (Metcalf Committee), 95th Congress, 1st Session. Washington D.C.: Government Printing Office.
. 1985. Hearings Before the Subcommittee on Oversight and Investigations of the Committee on Energy and Commerce (Dingall Committee), 99th Congress, 1st Session on the Failure of E.S.M. Government Securities, Inc. Washington D.C.: Government Printing Office. Wallace, R.S.O. and C.J. Mellor. 1988. Non-response Bias in Mail Accounting Surveys: A Pedagogical Note. British Accounting Review (August): 131-139.

37
Table 1: Summary of Selected Empirical Single Country Studies of Auditor Independence Perceptions
Author and year
Country
Respondent type(s) and sample size
Response rate
Survey design
Factors investigated
Results
Firth (1980)
U.K. Big Eight auditors (n=92); other auditors (n=69); accountants in industry & commerce (n=90); financial analysts (n=68); loan officers (n=70)
53% 51% 47% 57% 54%
Mail questionnaire; dichotomous response variable
29 auditor-client relationships from U.K. Institute's ethical rules on independence & ASR No. 126 covering 4 areas: fees; personal relationships; financial relationships; conflicts of interest
Non-independence generally perceived to impair investment & lending decisions; users more skeptical of auditors' ability to maintain independence than auditors themselves, though accountants in industry & commerce less concerned that other user groups
Dykxhoorn & Sinning (1982)
Germany Directors of bank loan departments (n=55); directors of bank investment departments (n=31)
36% 20%
Mail questionnaire; 5-point response scale
27 auditor-client relationships: financial interest; NAS; family relationships; occupations with conflicting interests; business & other relationships
Users' PAI affects their financial decisions
Gul (1989)
New Zealand Bank lending officers (n=49) 76% Mail survey: factorial ANOVA with 3 repeated measures & 2 non-repeated measures; 8 cases; 7-point response scale
5 factors: audit committee; client financial condition; NAS; competition; audit firm size
NAS & competition have a significant positive impact on PAI; audit firm size has a significant negative impact; audit committee & client financial condition not significant
Lindsay (1990)
Canada Loan officers (n=55) 69% Mail survey: factorial ANOVA with repeated measures; 16 cases; 7-point response scale
4 factors: flexibility of accounting standards; NAS; competition; and audit firm size
All factors affected PAI in expected direction; flexibility of accounting standards explained most variation
Schleifer & Shockley (1990)
U.S. Big Eight auditors (n=22); other auditors (n=19); loan officers (n=17); financial analysts (n=12)
Not avail.5 Not avail.5; Dichotomous response variable
14 policies suggested in Cohen Commission Report as means to enhance independence
A majority in each group agrees with policies to ensure management of accounting firm designed to support independence, but disagrees with policies to give auditor protection from management influence; users agree with policies to restrict services provided by auditors, but CPAs disagree; the 4 groups differed significantly; users' views most aligned with position of Cohen Commission
Bartlett U.S. CPAs (n=143); 48% Mail questionnaire; 3 factors: relative size of client; NAS; All factors reduced PAI; overall, CPAs perceive

38 Table 1 (cont.): Summary of Selected Empirical Single Country Studies of Auditor Independence Perceptions
38
Author and year
Country
Respondent type(s) and sample size
Response rate
Survey design
Factors investigated
Results
(1993) loan officers (n=100)
33% 10 cases;1% to 100% response scale
specific audit-client relationships less threat to auditor independence than bankers
Teoh & Lim (1996)
Malaysia Auditors (n=69);accountants in industry (n=33)
51% Mail survey: factorial ANOVA with repeated measures; 32 cases (+ 3 for consistency checks); 10-point response scale
5 factors: NAS; establishment of audit committee; audit firm rotation; % firm revenues from client >15%; disclosure of NAS fees
All 5 factors significantly affect both groups' PAI in expected direction; size of audit fees explained most variation, followed by NAS & audit committee; PAI impairment more pronounced among accountants in industry
Notes: 1. Non-random group who agreed to participate when contacted. 2. Subjects solicited via audit firms. 3. Subjects solicited via key members in participating organisations. 4. Subjects attending training session. 5. Subject selection procedures and method of eliciting responses not reported.

39

40
Table 2: Generic Factors Hypothesized to Influence Perceptions of Auditor Independence and Proxy Measures
Generic factor name
Description
Proxy measure
ECDEP Economic dependence of the auditor on the auditee:
partner's income depends on the retention of a specific audit client
≥10% of total firm revenues from one client
partner's desire not to lose status by losing key client
≥10% of total office revenues from one client
client important to firm's overall portfolio
COMP High level of competition within the external audit market:
audit fee discounting and low-balling
competition among audit firms
budget pressures imposed by audit firm on staff
NAS provision of NAS by auditor:
NAS from incumbent ≥ 100% audit fee
NAS from incumbent ≥ 50% audit fee
NAS from incumbent ≥ 25% audit fee
provision of executive search and appointment services by incumbent auditor
FLEX
Flexibility of accounting standards: flexibility of accounting standards set by the Accounting Standards Committee (SSAPs)
risk of referral to the Financial Reporting Review Panel: for auditor
risk of referral to the Financial Reporting Review Panel: for company
effect of new accounting standards introduced by the Accounting Standards Board (FRSs)
effect of new pronouncements by the Urgent Issues Task Force
AUDSIZE audit firm size: small local firm
regional firm
a non-Big Six international or national firm
Big Six
AC Audit committee: existence of an audit committee composed of non-executive directors, a majority of whom are independent
non-executive directors' desire to protect their personal reputation
FININT Financial interest in client: unpaid audit fees
DIRCON Directors' de facto control of auditors' appointment and remuneration:
directors' de facto control of auditors' appointment
directors' de facto control of auditors' remuneration
CLIENT Large size/high status of client: top 500 company

41 Table 2 (cont.): Generic Factors Hypothesized to Influence Perceptions of Auditor Independence and Proxy Measures
41
Generic factor name
Description
Proxy measure
other listed company
AUDCH Costs to company of auditor change:
risk of adverse market reaction to frequent auditor changes
management time and costs incurred in changing auditors
AUDCHREG Regulatory rights and requirements surrounding auditor change:
auditors' right to require the statement of circumstances by auditor ceasing to hold office to be circulated to members
requirement for statement of circumstances by auditor ceasing to hold office,and this to be filed at Company Registry
requirement for incoming auditor to communicate with outgoing auditor before accepting nomination or appointment
auditors' removal from office requiring a Special Resolution at a General Meeting
AUDRISK Risks to auditor arising from poor quality audit:
risk to audit firm of loss of Registered Auditor status
risk to audit firm of disciplinary action by professional body
risk of damage to auditors' reputation from public scandals
risk of litigation against audit firm
AUDREG Regulations concerning the appointment and remuneration of auditors:
rotation of audit partners (at least every seven years)
compulsory rotation of audit firm
requirement for auditors to be reappointed annually
audit appointment to be for a fixed number of years in place of annual appointment
periodic compulsory competitive tendering for audit services
audit committee to have specific responsibility for the appointment and remuneration of auditors
external independent body to approve audit appointments for listed companies
NASPROV Responsibility for the negotiation and supply of NAS:
responsible audit partner to be prohibited from taking overall responsibility for marketing NAS to company
auditors of listed companies to be prohibited from supplying NAS
audit committee to have specific responsibility for the approval of NAS by the auditor

42
Table 3: Analysis of Main Sample Respondents by Audit Firm Type, Company Size and Client Industry Group
Finance director (FD) sample Audit partner (AP) sample
Audit firm type No. % Audit firm type No. %
Big six 117 76.5 Big six 176 72.1
Another international or national 21 13.7 Another international or national
67 27.5
Regional or local 9 5.9 Regional or local 0 0.0
Joint 4 2.6 Joint 0 N/A
Item non-response 2 1.3 Item non-response 1 0.4
153 100.0 244 100.0
Size group
Turnover (£m)
No.
%
Client industry group
No. %
Small <50 59 38.6 Capital goods 37 15.2
Medium 50 - 200 38 24.8 Consumer goods 80 32.8
Large >200 54 35.3 Financial 33 13.5
Item non-response 2 1.3 Other 92 37.7
153 100.0 Item non-response 2 0.8
244 100.0 Note: The sample of financial journalists comprised three from national dailies, three from national weeklies, two from provincial newspapers, three freelance journalists, and seven others.

43
Table 4: Importance of Auditor Independence
Mean score1
(no. of responses)
Standard deviation
Wilcoxon rank sum test of difference
between FD and AP main samples3
(prob.)
Main samples
Small user sample
Main samples Small user sample
Form of independence
FD2 (n=151)
AP2 (n=244)
FJ2 (n=18)
FD
AP
FJ
Perceived independence
4.37 4.65 4.61 0.74 0.59 0.78 -4.072 (0.000)
Independence in fact
4.34 4.81 4.83 0.82 0.43 0.38 -7.042 (0.000)
Notes: 1. Response scale is: 1(not important at all); 2(of little importance); 3(fairly important);
4(important); and 5(very important). 2. FD = finance directors; AP = audit partners; FJ = financial journalists. 3. The non-parametric Wilcoxon rank sum test (Z statistic) is used, rather than the
parametric t-test, since the assumption of equal variances is rejected at the 5% level of significance.
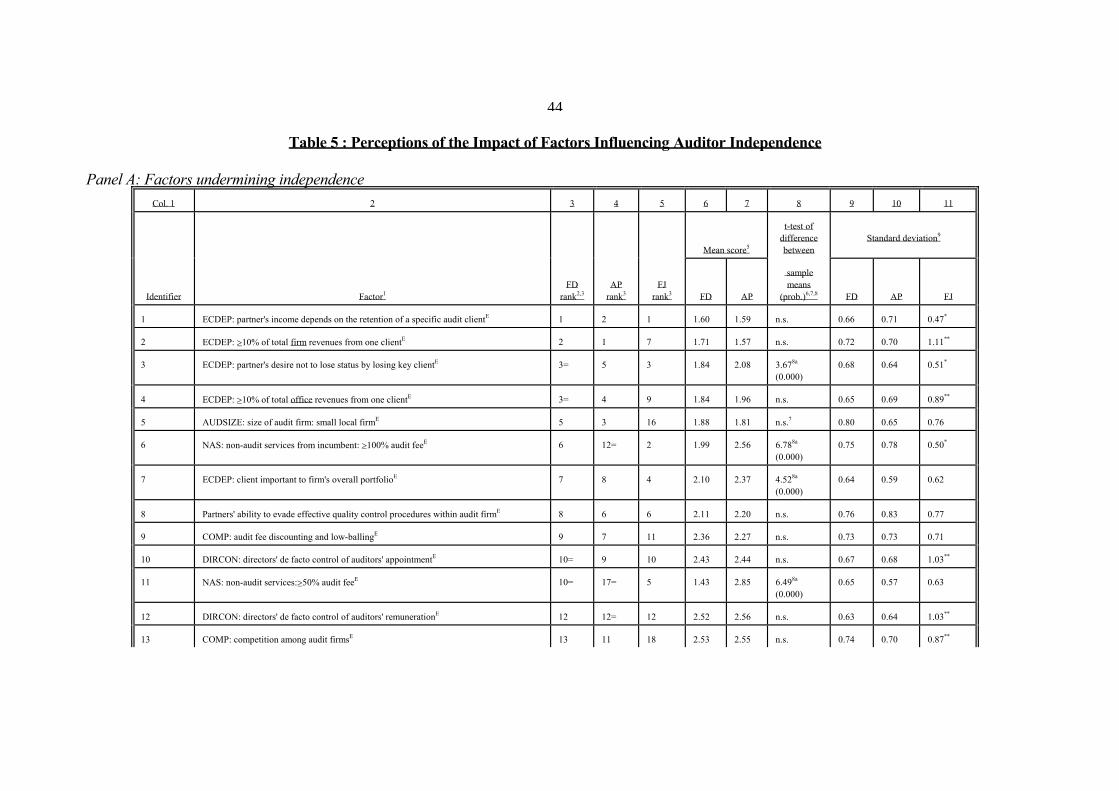
44
Table 5 : Perceptions of the Impact of Factors Influencing Auditor Independence Panel A: Factors undermining independence
Col. 1 2 3 4 5 6 7 8 9 10 11
Mean score5
t-test of difference between
Standard deviation9
Identifier
Factor1
FD
rank2,3
AP
rank3
FJ
rank3
FD
AP
sample means
(prob.)6,7,8
FD
AP
FJ
1 ECDEP: partner's income depends on the retention of a specific audit clientE 1 2 1 1.60 1.59 n.s. 0.66 0.71 0.47*
2 ECDEP: ≥10% of total firm revenues from one clientE 2 1 7 1.71 1.57 n.s. 0.72 0.70 1.11**
3 ECDEP: partner's desire not to lose status by losing key clientE 3= 5 3 1.84
2.08 3.678a (0.000)
0.68 0.64 0.51*
4 ECDEP: ≥10% of total office revenues from one clientE 3= 4 9 1.84 1.96 n.s. 0.65 0.69 0.89**
5 AUDSIZE: size of audit firm: small local firmE 5 3 16 1.88 1.81 n.s.7 0.80 0.65 0.76
6 NAS: non-audit services from incumbent: ≥100% audit feeE 6 12= 2 1.99 2.56 6.788a (0.000)
0.75 0.78 0.50*
7 ECDEP: client important to firm's overall portfolioE 7 8 4 2.10 2.37 4.528a (0.000)
0.64 0.59 0.62
8 Partners' ability to evade effective quality control procedures within audit firmE 8 6 6 2.11 2.20 n.s. 0.76 0.83 0.77
9 COMP: audit fee discounting and low-ballingE 9 7 11 2.36 2.27 n.s. 0.73 0.73 0.71
10 DIRCON: directors' de facto control of auditors' appointmentE 10= 9 10 2.43 2.44 n.s. 0.67 0.68 1.03**
11 NAS: non-audit services:≥50% audit feeE 10= 17= 5 1.43 2.85 6.498a (0.000)
0.65 0.57 0.63
12 DIRCON: directors' de facto control of auditors' remunerationE 12 12= 12 2.52 2.56 n.s. 0.63 0.64 1.03**
13 COMP: competition among audit firmsE 13 11 18 2.53 2.55 n.s. 0.74 0.70 0.87**

45 Table 5 (cont.): Perceptions of the Impact of Factors Influencing Auditor Independence
45
Col. 1 2 3 4 5 6 7 8 9 10 11
Mean score5
t-test of difference between
Standard deviation9
Identifier
Factor1
FD
rank2,3
AP
rank3
FJ
rank3
FD
AP
sample means
(prob.)6,7,8
FD
AP
FJ
14 AUDSIZE: size of audit firm: regional firmE size) 14 10 23 2.54 2.49 n.s. 0.66 0.63 0.58
15 COMP: budget pressures imposed by audit firm on staffE 15 17= 8 2.59 2.85 -5.258a (0.000)7
0.52* 0.39* 0.64
16 CLIENT: top 500E 16 2.67note 4 15 6.50 0.80- -8a (0.000)
0.87**
17 NAS: provision of executive search and appointment services by incumbent auditorE 17 16 13 2.70 2.83 n.s. 0.59 0.49* 0.81
18 NAS: non-audit services from incumbent: ≥25% audit feeE 18 20 14 2.86 3.00
-2.398a (0.017)7
0.55* 0.41* 0.90**
19 CLIENT: other listedE 19 note 4 19 2.93 0.57- 4.218a (0.000)
- 0.83
20 FININT: unpaid audit feesE 20 14 17 2.94 2.71 -3.358b (0.001)
0.55* 0.63 0.73
21 Directors' ability to seek a second opinion on contentious issuesE 21 19 20 2.97 2.88 n.s. 0.68 0.70 1.32**
22 FLEX: flexibility of accounting standards set by the Accounting Standards Committee (SSAPs)R
22 15 21 2.99 2.76 -3.658b (0.000)
0.59 0.63 0.65
39 Client in weak financial condition note 4 note 4 22 - - - - - 0.48*
45 AUDCH: management time and costs incurred in changing auditorsE note 4 note 4 24 - - - - - 0.54* Panel B: Factors enhancing independence

46 Table 5 (cont.): Perceptions of the Impact of Factors Influencing Auditor Independence
46
Col. 1 2 3 4 5 6 7 8 9 10 11
Mean score4 (no. of
responses)
t-test of difference between
Standard deviation5
Identifier
Factor1
FD
rank2,3
AP
rank3
FJ
rank3
FD
AP
sample means
(prob.)6,7,8
FD
AP
FJ
23 AC: existence of audit committee composed of non-executive directors, a majority of whom are independentE
1 1 2 3.99 4.22 3.368a (0.001)
0.66 0.62 0.56
24 AUDSIZE: size of audit firm: Big SixE 2 2 19= 3.233.73 0.713.99 0.768a (0.001)
0.72
25 FLEX: risk of referral to the Financial Reporting Review Panel: for auditorR 3 4= 5= 3.68 3.92 -2.768a (0.006)7
0.86** 0.71 0.83
26 AUDCHREG: auditors' right to require the statement of circumstances by auditor ceasing to hold office to be circulated to membersR
4 10 3 3.66 3.50 2.058b (0.040)7
0.68 0.57 0.58
27 AUDREG: rotation of audit partners (at least every seven years)R 5 8 13= 3.64 3.63 n.s. 0.60 0.66 0.70
28 AUDRISK: risk to audit firm of loss of Registered Auditor statusR 6 13 3.63 3.95 -2.088a (0.037)7
1.24** 1.01** 0.86**
29 FLEX: risk of referral to the Financial Reporting Review Panel: for companyR 7 6 7 3.61 3.88 -3.858a (0.000)7
0.75 0.65 0.68
30 AUDRISK: risk to audit firm of disciplinary action by professional bodyR 8 4= 3.608 3.92 -2.128a (0.034)7
1.16** 0.89** 1.09**
31 AUDCHREG: requirement for statement of circumstances by auditor ceasing to hold office, and this to be filed at Company RegistryR
9 12= 4 2.56 3.46 n.s. 0.67 0.58 0.36*
32 AUDCHREG: requirement for incoming auditor to communicate with outgoing auditor before accepting nomination or appointmentR
10 14 9 3.48 3.43 n.s.7 0.69 0.55* 0.55*
33 AUDSIZE: size of audit firm: a non-Big Six international or national firmE 11 11 21 3.483.45 n.s. 0.71 0.63 0.59
34 Auditors' right to attend and be heard at company AGMR 12 15 12 3.43 3.41 0.58n.s. 0.59 0.59
35 AUDCHREG: auditors' removal from office requiring a Special Resolution at a General MeetingR 13 17= 10 3.41 3.34 n.s. 0.66 0.58 0.89**
36 AC: non-executive directors' desire to protect their personal reputationE 14 16=7 3.40 3.69 3.148a (0.002)
0.76 0.83 1.10**
37 FLEX: effect of new accounting standards introduced by the Accounting Standards Board (FRSs)R 15 16 11 3.38 3.40 n.s. 0.67 0.61 0.60
38 FLEX: effect of pronouncements by the Urgent Issues Task ForceR 16 1512= 3.35 3.46 n.s. 0.65 0.520.62 *
39 Client in a weak financial conditionE 17 24= note 4 3.323.29 0.753.04 0.638b (0.001)7
-
40 AUDCH: risk of adverse market reaction to frequent auditor changesE 18= 1819 3.24 3.25 n.s.7 0.91** 0.65 0.93**
41 Disclosure of non-audit fees paid to auditorR 18= 22 3.155= n.s.3.24 0.59 0.55* 0.74

47 Table 5 (cont.): Perceptions of the Impact of Factors Influencing Auditor Independence
47
Col. 1 2 3 4 5 6 7 8 9 10 11
Mean score4 (no. of
responses)
t-test of difference between
Standard deviation5
Identifier
Factor1
FD
rank2,3
AP
rank3
FJ
rank3
FD
AP
sample means
(prob.)6,7,8
FD
AP
FJ
42 AUDRISK: risk of damage to auditors' reputation from public scandalsE 20 9 3.2116= 3.61 -3.238a (.001)7
1.14** 0.98** 0.89**
43 AUDREG: requirement for auditors to be reappointed annuallyR 21 13=23 3.13 n.s.3.05 0.590.57 0.95**
44 AUDRISK: risk of litigation against audit firmE 22 17= 3.3419= 2.193.11 8a (0.029)
1.07** 0.97** 0.92**
45 AUDCH: management time and costs incurred in changing auditorsE 23 note 424= 3.01 3.04 n.s.7 0.69 0.44* -
16 CLIENT: size and status of client company: top 500E note 4 20 note 4 - 3.23 6.508a (0.000)
- 0.80 -
19 CLIENT: size and status of client company: other listedE note 4 21 note 4 - 3.19 4.218a (0.000)
- 0.59 -
Notes: 1. Where applicable, the generic factor is given in parentheses following the description of the operational measure. E = economic factor; R = regulatory factor. 2. Factors are ranked in decreasing order of importance for the FD sample. 3. FD = finance directors; AP = audit partners; FJ = financial journalists. 4. See panel A/B . 5. Response scale is 1(seriously undermines independence); 2(slightly undermines independence); 3(no effect on independence); 4(slightly enhances independence); and 5(strongly enhances independence). 6. n.s. = not significant at the 5% level of significance. 7. The non-parametric Wilcoxon rank sum test (Z statistic) is used where the assumption of equal variances is rejected at the 5% level of significance. 8a.APs' mean response higher than FDs' mean response (i.e., APs believe factor enhances independence significantly more, or is a less serious threat to independence, than FDs). 8b.APs' mean response lower than FDs' mean response (i.e., FDs believe factor enhances independence significantly more, or is a less serious threat to independence, than APs). 9. * = standard deviation ≤0.55 (high consensus); ** = standard deviation ≥0.85 (low consensus).

48
Table 6: Factor Analysis of Auditor Independence Factors
FD sample AP sample
FD sample factor no.1
Descriptive label
Principal components2
Factor loading3
Table 4 rank4
Factor no.
Factor loading
Table 4 rank4
1 Recent regulatory enforcement mechanisms
Risk of referral to the FRRP for auditor; Risk of referral to the FRRP for company2a; Risk to audit firm of loss of Registered Auditor status; Risk to audit firm of disciplinary action by professional body; Effect of new accounting standards introduced by the ASB2a
0.82 0.81 0.80 0.75 0.50
3E 7E 6E 8E 15E
3 0.630.40 0.89 0.88 0.11
4=E 6E 3E 4=E 16E
2 Regulatory rights and requirements surrounding auditor change
Auditors' right to require the statement of circumstances by auditor ceasing to hold office to be circulated to members; Requirement for statement of circumstances by auditor ceasing to hold office, and this to be filed at Company Registry; Auditors' removal from office requiring a Special Resolution at a General Meeting; Requirement for incoming auditor to communicate with outgoing auditor before accepting nomination or appointment; Auditors' right to attend and be heard at company AGM
0.88 0.87 0.76 0.61 0.53
4E 9E 13E 10E 12E
1 0.850.84 0.78 0.59 0.65
10E 12=E 17=E 14E 15E
3 Importance of non-audit services (and, for FDs only, economic dependence on client)
Non-audit services from incumbent ≥ 50% audit fee; Non-audit services from incumbent ≥ 100% audit fee; Non-audit services from incumbent ≥ 25% audit fee; ≥ 10% of total firm revenues from one client; ≥ 10% of total office revenues from one client
0.85 0.80 0.73 0.65 0.54
10=U 6U 18U 2U 3=U
4 0.890.77 0.83 -0.07 0.14
17=U 12=U 20U 1U 4U
4 Economic significance of client Client important to firm's overall portfolio; Partner's desire not to lose status by losing key client; Partner's income depends on the retention of a specific audit client
0.92 0.85 0.76
7U 3=U 1U
2 0.740.75 0.78
8U 5U 2U
5 Control over auditors' appointment and remuneration
Directors' de facto control of auditors' appointment; Directors' de facto control over auditors' remuneration; Provision of executive search and appointment services by incumbent auditor2a
0.74 0.73 0.52
10U= 12U 17U
8 0.830.84 -0.08
9U 12=U 16U
6 Auditors' risk of reputation loss/litigation
Risk of damage to auditors' reputation from public scandals; Risk of litigation against audit firm; Client in a weak financial condition2b
0.85 0.82 -0.09
20E 22E 17E
5 0.630.67 0.71
9E 17=E 24=E
7 Size/status of auditee Size and status of client company: other listed; Size and status of client company: top 500; Competition among audit firms
0.78 0.74 0.55
19U 16U 13U
7 0.820.87 -0.06
21E 20E 11U
8 Costs of auditor change Management time and costs incurred in changing auditors; Risk of adverse market reaction to frequent auditor changes
0.82 0.80
23E 18=E
12 0.720.82
24=E 19E
9 Small local/regional audit firm Size of audit firm: regional firm; Size of audit firm: small local firm
0.85 0.84
14U 5U
11 0.800.85
10U 3U
10 International/national audit firm Size of audit firm: non-Big Six international or national audit firm; Size of audit firm: Big Six
0.82 0.80
11E 2E
9 0.730.79
11E 2E
11 Regulations surrounding auditors Requirement for auditors to be reappointed annually; Auditors' right to attend and be heard at company AGM;
0.82 0.59
21E 12E
13 0.800.29
23E 15E
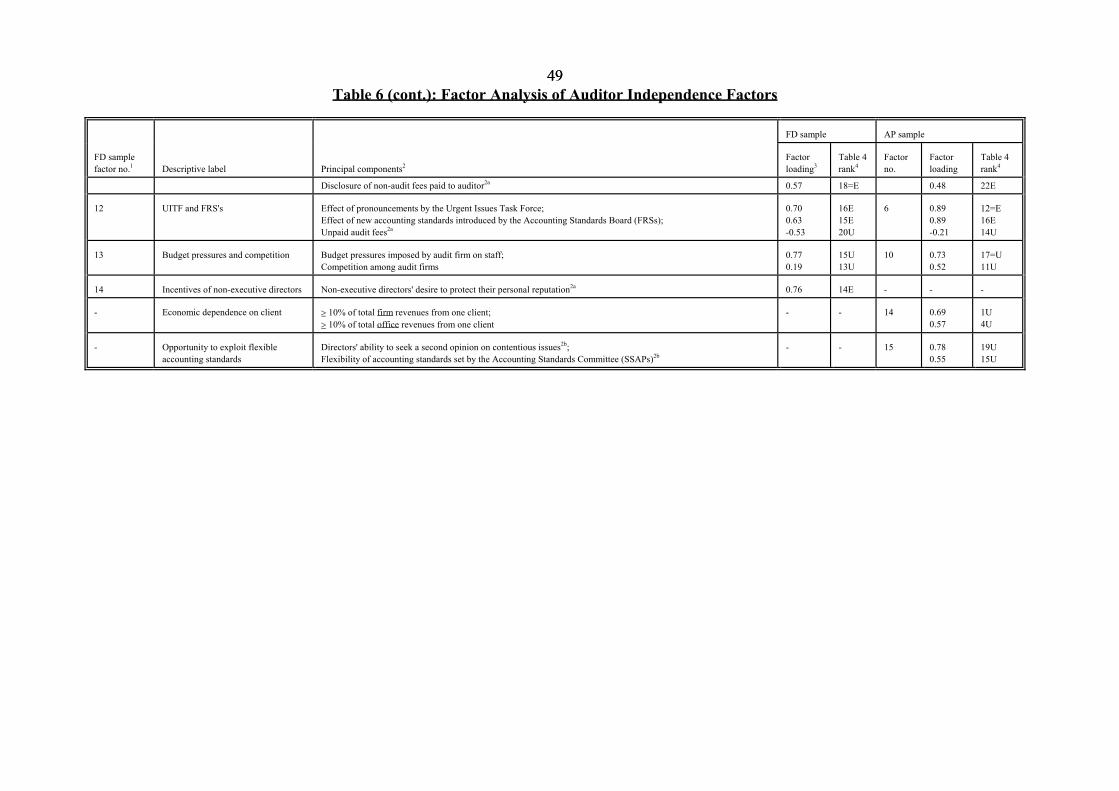
49 Table 6 (cont.): Factor Analysis of Auditor Independence Factors
49
FD sample AP sample
FD sample factor no.1
Descriptive label
Principal components2
Factor loading3
Table 4 rank4
Factor no.
Factor loading
Table 4 rank4
Disclosure of non-audit fees paid to auditor2a 0.57 18=E 0.48 22E
12 UITF and FRS's Effect of pronouncements by the Urgent Issues Task Force; Effect of new accounting standards introduced by the Accounting Standards Board (FRSs); Unpaid audit fees2a
0.70 0.63 -0.53
16E 15E 20U
6 0.890.89 -0.21
12=E 16E 14U
13 Budget pressures and competition Budget pressures imposed by audit firm on staff; Competition among audit firms
0.77 0.19
15U 13U
10 0.730.52
17=U 11U
14 Incentives of non-executive directors Non-executive directors' desire to protect their personal reputation2a 0.76 14E - - -
- Economic dependence on client ≥ 10% of total firm revenues from one client; ≥ 10% of total office revenues from one client
- - 14 0.690.57
1U 4U
- Opportunity to exploit flexible accounting standards
Directors' ability to seek a second opinion on contentious issues2b; Flexibility of accounting standards set by the Accounting Standards Committee (SSAPs)2b
- - 15 0.780.55
19U 15U

50 Table 6 (cont.): Factor Analysis of Auditor Independence Factors
50
Notes: 1. Factors are listed in rank order of significance for the FD sample. 2. a = component loading significantly (i.e., >0.5) for the FD sample, but not the AP sample; b = component loading significantly for the AP sample, but not the FD sample. 3. Components are listed in descending factor loading order within each factor. 4. E = enhances independence; U = undermines independence.

51
Table 7: Perceptions of the Impact of Recent Proposals for Regulatory Change on Auditor Independence
Col. 1 2 3 4 5 6 7 8 9 10 11
Mean score3 (no. of
responses)
t-test of difference between
Standard deviation7
Identifier
Factor
FD
rank1,2
AP
rank2
FJ
rank2
FD
AP
sample means
(prob.)4,5,6
FD
AP
FJ
46 AUDREG: compulsory rotation of audit firm 1= 9 9 3.51 3.20 4.445,6b (0.000)
0.88** 0.71 1.03**
47 NASPROV: responsible audit partner to be prohibited from taking overall responsibility for marketing non-audit services to company
1= 7 5= 3.51 3.26 3.815,6b (0.000)
0.64 0.55* 0.78
48 Effective statutory penalties for company staff deceiving the auditor 3 1 3 3.47 3.75 3.366a (0.001)
0.75 0.71 0.78
49 NASPROV: auditors of listed companies to be prohibited from supplying non-audit services 4= 10 8 3.46 3.19 -3.436b (0.001)
0.79 0.73 0.85**
50 Required interval between partner leaving audit firm and joining client 4= 5 1 3.46 3.37 n.s.5 0.73 0.60 0.81
51 AUDREG: audit committee to have specific responsibility for the appointment and remuneration of auditors
6 2 2 3.44 3.72 4.136a (0.000)
0.69 0.60 0.64
52 Two-tier boards - supervisory board to discharge duties of audit committee 7 3 11 3.34 3.46 n.s 0.68 0.59 0.62
53 Audit opinion to be personally signed by audit partner 8 12 4 3.31 3.07 4.175,6b (0.000)
0.67 0.54* 0.68
54 NASPROV: audit committee to have specific responsibility for the approval of non-audit services by the auditor
9 4 5= 3.30 3.42 n.s. 0.68 0.59 0.72
55 AUDREG: audit appointment to be for a fixed number of years in place of annual appointment
10 6 12 3.29 3.29 n.s. 0.79 0.79 0.92**
56 AUDREG: external independent body to approve audit appointments for listed companies 11 8 7 3.16 3.25 n.s.5 0.84 0.67 0.92**
57 AUDREG: periodic compulsory competitive tendering for audit services 12 13 10 3.01 2.66 -4.116b (0.000)
0.89** 0.77 0.99**
58 Limitation of auditors' liability 13 11 13 2.91 3.15 -2.175,6a (0.030)
1.03** 0.70 1.05**
Notes: 1. Factors are ranked in decreasing order of importance for the FD sample. 2. FD = finance directors; AP = audit partners; FJ = financial journalists.
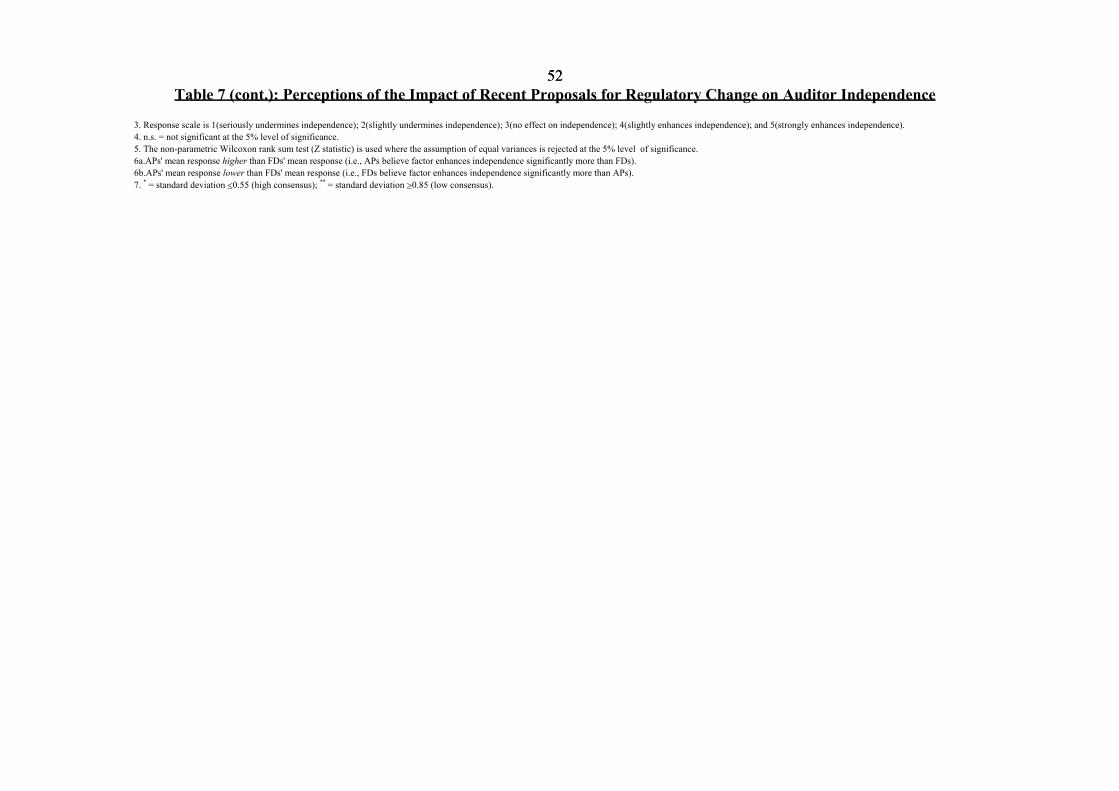
52 Table 7 (cont.): Perceptions of the Impact of Recent Proposals for Regulatory Change on Auditor Independence
52
3. Response scale is 1(seriously undermines independence); 2(slightly undermines independence); 3(no effect on independence); 4(slightly enhances independence); and 5(strongly enhances independence). 4. n.s. = not significant at the 5% level of significance. 5. The non-parametric Wilcoxon rank sum test (Z statistic) is used where the assumption of equal variances is rejected at the 5% level of significance. 6a.APs' mean response higher than FDs' mean response (i.e., APs believe factor enhances independence significantly more than FDs). 6b.APs' mean response lower than FDs' mean response (i.e., FDs believe factor enhances independence significantly more than APs). 7. * = standard deviation ≤0.55 (high consensus); ** = standard deviation ≥0.85 (low consensus).

53
Table 8: Comparison With Selected Previous Single Country Studies Panel A:Factors which may influence PAI
Generic factor name
Study (country)
Proxy measure used in study
Findings
ECDEP Firth (1980) (UK) ≥15% of total firm revenues from one client ≥20% of total office revenues from one client
Across the five groups, percentage who believed auditors independent ranged from: 9% for FAs to 52% for non-B8 auditors (5th & 8th most serious threat factors, respectively); 26% for FAs to 72% for non-B8 auditors (12th & 15th most serious threat factors, respectively)
Dykxhoorn & Sinning (1982) (Germany)
=10% of total firm revenues from one client 85% of bank lenders (& 81% of bank investment officers) believed the auditor to be independent & yet case had a negative influence on lending (investment) decision
Bartlett (1993) (US)
=1% of total firm revenues from one client =40% of audit partner's fee responsibilities
Average level of independence on a scale of 0% (not independent at all) to 100% (completely independent): 89% for CPAs & 75% for bankers; 72% for CPAs & 60% for bankers
Teoh & Lim (1996) (Malaysia) >15% of total firm revenues from one client Most important factor - explains 10% variance
Present study (UK) ≥10% of total firm revenues from one client ≥10% of total office revenues from one client partner's income depends on retention of client
2nd most important threat factor for FDs; 1st for APs; 7th for FJs; 3rd= most important threat factor for FDs; 4th for APs; 9th for FJs; most important threat factor for FDs; 2nd for APs; 1st for FJs
COMP Gul (1989) (New Zealand) Competition - high/low Unexpected, positive impact - explains 2% variance
Lindsay (1990) (Canada) Presence/absence of aggressive major competitors Explains 2% variance
Schleifer & Shockley (1990) (US)
Prohibition of low-balling Percentage agreeing with policy designed to enhance independence: 45% (B8 CPAs); 32% (other CPAs); 53% (loan officers); 50% (FAs)
Present study (UK) Competition among audit firms Audit fee discounting & low-balling
13th most important threat factor for FDs; 11th for APs; 18th for FJs; 9th most important threat factor for FDs; 7th for APs; 11th for FJs
NAS Firth (1980) (UK) Provision of accounting services Provision of MAS
Across the 5 groups, percentage who believed auditors independent ranged from: 15% for FAs to 88% for non-B8 auditors (7th= & 20th= most serious threat factors, respectively) 37% for FAs to 87% for non-B8 auditors (14th & 18th most serious threat factors, respectively)
Dykxhoorn & Sinning (1982) (Germany)
Provision of accounting services 70% of bank lenders (& 48% of bank investment officers) believed the auditor to be independent & case had significant positive influence on lending (investment) decision; the remainder believed the auditor to be notindependent & case had a significant negative influence on decision
Gul (1989) (New Zealand) Provision of MAS - yes/no Unexpected, positive impact - explains 9% variance
Schleifer & Shockley (1980) (US)
Prohibition of executive recruitment by auditor Percentage agreeing with policy designed to enhance independence: 23% (B8 CPAs); 26% (other CPAs); 65% (loan officers); 42% (FAs)
Lindsay (1990) (Canada) MAS = 40% audit fee Explains 1% variance
Bartlett (1993) (US) Auditor assists in CEO search & hiring Average level of independence on a scale of 0% (not independent at all) to 100% (completely independent): 75% for CPAs & 54% for bankers

54 Table 8 (cont.): Comparison with Selected Previous Single Country Studies
54
Generic factor name
Study (country)
Proxy measure used in study
Findings
NAS (cont.) Teoh & Lim (1996) (Malaysia) MAS >50% audit fee Second most important factor - explains 7% variance
Present study (UK) NAS ≥100% audit fee NAS ≥50% audit fee NAS ≥25% audit fee Provision of executive search & appointment services
6th most important threat factor for FDs; 12th= for APs; 2nd for FJs 10th= most important threat factor for FDs; 17th= for APs; 5th for FJs 18th most important threat factor for FDs; 20th for APs; 14th for FJs 17th most important threat factor for FDs; 16th for APs; 13th for FJs
FLEX Lindsay (1990)(Canada) Existence/flexibility of technical accounting standards on particular issues
Most important factor - explains 14% variance
Present study (UK) Flexibility of accounting standards set by the ASC Flexibility of accounting standards set by the ASB
22nd most important threat factor for FDs; 15th for APs; 21st for FJs 15th most important enhancement factor for FDs; 16th for APs; 11th for FJs
AUDSIZE Gul (1989) (New Zealand) Audit firm size - large/small Most important factor - explains 14% variance
Lindsay (1990) (Canada) Audit firm size -B8/local Second most important factor - explains 7% variance
Present study (UK) B6 firm Local firm
2nd most important enhancement factor for FDs & APs; 19th for FJs 5th most important threat factor for FDs; 3rd for APs; 16th for FJs
AC Gul (1989) (New Zealand) Audit committee - yes/no Not significant
Teoh & Lim (1996) (Malaysia) Existence of audit committee Third most important factor - explains 6% variance
Present study (UK) Existence of audit committee composed of NEDs, a majority of whom are independent
Most important enhancement factor for FDs & APs; 2nd for FJs
AUDREG Schleifer & Shockley (1990) (US)
Audit committee of independent NEDs to select auditor Compulsory firm rotation every 3-5 years
Percentage agreeing: 64% (B8 CPAs); 21% (other CPAs); 35% (loan officers); 91% (FAs) 0% (B8 CPAs); 5% (other CPAs); 53% (loan officers); 17% (FAs)
Teoh & Lim (1996) (Malaysia) Auditor retained for >5 years Explained 1% variance
Present study (UK) Audit committee to have specific responsibility for the appointment & remuneration of auditors Compulsory rotation of audit firm
6th most important proposed enhancement factor for FDs; 2nd for APs; 2nd for FJs Most important proposed enhancement factor for FDs; 9th for APs; 9th for FJs
Client financial condition
Gul (1989) (New Zealand) Client financial condition - good/poor Not significant
Present study (UK) Weak financial condition of client 17th most important enhancement factor for FDs; 24th= for APs; 22nd most important threat factor for FJs
Disclosure of NAS fees
Teoh & Lim (1996) (Malaysia) Disclosure of NAS fees Explained 1% variance
Present study (UK) Disclosure of NAS fees 18th= most important enhancement factor for FDs; 22nd for APs; 5th= for FJs

55 Table 8 (cont.): Comparison with Selected Previous Single Country Studies
55
Panel B:Group differences
Group difference Study (country) Findings
Inter-group differences
Firth (1980) (UK) User groups were more skeptical of auditor independence than auditors
Schleifer & Shockley (1990) (US) User groups more in favor of policies to enhance auditor independence that auditors
Bartlett (1993) (US) CPAs perceived less threat to auditor independence than users for eight out of 10 situations
Teoh & Lim (1996) (Malaysia) The 3 repeated variables had comparable explanatory power for public accountants & accountants in industry
Present study (UK) In general, users & preparers more skeptical of auditor independence than auditors, although several exceptions for specific factors (notably NAS)
Within-group consensus
Schleifer & Shockley (1990) (US) There is most diversity in the responses of the non-B8 CPA group.
Lindsay (1990) (Canada) Individual subject ANOVA models revealed `sizeable individual differences'
Present study (UK) Generally, higher consensus for APs, followed by FDs and then FJs, but varies across factors. The number of factors (out of 58) exhibiting high within-group consensus was 3(FDs), 8(APs) & 8(FJs), while the number exhibiting low within-group consensus was 9(FDs), 4(APs), & 22(FJs).

56 Table 8 (cont.): Comparison with Selected Previous Single Country Studies
56
Notes: FD = finance director; AP = audit partner; FJ = financial journalist; CPA = certified public accountant; FA = financial analyst; B8 = Big Eight; B6 = Big Six; MAS = management advisory services; ASC = Accounting Standards Committee; ASB = Accounting Standards Board; NED = non-executive director; AI = auditor independence.

57
Table 9: Associations Between Audit Firm Type and Perceptions of Auditor Independence (PAI) Factors Panel A: FD sample
Factor1
T-test of difference between means by audit firm type2,3,4
(prob.)
Size of audit firm: Big Six -2.655a**
Size and status of client company: top 500 -2.155a*
Rotation of audit partners (at least every seven years) -2.205a*
Auditors' removal from office requiring a Special Resolution at a General Meeting 2.115b*
Panel B: AP sample
Factor1
T-test of difference between means by audit firm type2,3,4
(prob.)
Non-executive directors' desire to protect their personal reputation -2.385a*
Directors' de facto control of auditors appointment -2.105a*
Directors' de facto control of auditors remuneration -2.035a*
Size of audit firm: Big Six -10.215a**
Size of audit firm: another international or national firm -4.095a**
Size and status of client company: top 500 -3.745a**
Size and status of client company: other listed -3.095a**
Competition among audit firms -1.985a*
Audit fee discounting and low-balling -6.825a**
Provision of executive search and appointment services by incumbent auditor -2.125a*
Non-audit services from incumbent: ≥ 25% audit fee -3.714,5a**
Non-audit services from incumbent: ≥ 50% audit fee -7.854,5a**
Non-audit services from incumbent: ≥ 100% audit fee -7.994,5a**
Partner's desire not to lose status by losing key client -2.404,5a*
Unpaid audit fees -4.184,5a**
Budget pressures imposed by audit firm on staff -2.144,5a*
Client in a weak financial condition -4.375a**
Risk of litigation against audit firm -2.505a*
Risk of damage to auditor's reputation from public scandals -2.625a**
Requirement for incoming auditor to communicate with outgoing auditor before accepting nomination or appointment
-2.445a*
Disclosure of non-audit fees paid to auditor 2.605b**
Notes: See Table 10.

58
Table 10: Associations Between Company Size and Perceptions of Auditor Independence (PAI) Factors Panel A: FD sample
Factor1
One-way ANOVA test of difference between means
by company size2,3,4 (prob.)
Non-executive directors' desire to protect their personal reputation 7.106a**
Size of audit firm: small local firm 4.846b**
Non-audit services from incumbent: ≥ 100% audit fee 3.686b*
Client in a weak financial condition 7.736b**
Panel B: AP sample
Factor1 One-way ANOVA test of difference between means
by company size2,3,4 (prob.)
Non-executive directors' desire to protect their personal reputation 3.1966*
Directors' de facto control of auditors appointment 2.646*
Management time and costs incurred in changing auditors 2.836a*
Size of audit firm: Big Six 8.936a**
Size of audit firm: another international or national firm 3.376a*
Size and status of client company: top 500 5.706a**
Non-audit services from incumbent: ≥ 25% audit fee 3.806a*
Non-audit services from incumbent: ≥ 50% audit fee 13.536a**
Non-audit services from incumbent: ≥ 100% audit fee 14.286a**
Client in a weak financial condition 4.026a**
Disclosure of non-audit fees paid to auditor 3.796b*
Notes: 1. Factors are listed in the order in which they appeared in the questionnaire. 2. * = significant at the 5% level; ** = significant at the 1% level. 3. The non-parametric Wilcoxon rank sum test (Z statistic) is used where the assumption of equal variances is rejected at the 5% level of
significance. 4. All reported results were also significant using the equivalent non-parametric test (Wilcoxon rank sum test for audit firm type and Kruskal-Wallis
one-way ANOVA for company size). 5a.FDs of Big Six firm clients/APs of Big Six firms mean response higher than non-Big Six firm (i.e., factor enhances independence significantly
more, or is a less serious threat to independence). 5b.FDs of Big Six firm clients/APs of Big Six firms mean response lower than non-Big Six firm (i.e., factor enhances independence significantly
less, or is a more serious threat to independence). 6. The ANOVA F-statistic indicates a significant difference among the group means at the 5% level. To investigate which group means differ,
Tukey's multiple comparison procedure was used to compare the means of each pair of size groups (three size groups based on turnover - large, medium, and small - for the FD sample; four size groups based on audit fees - very large, large, medium, and small - for the AP sample). The following key is used to indicate paired comparisons which were significant at the 5% level:
a = mean response of FDs/APs of at least one larger company size group higher than mean response of FDs/APs of a smaller company size group
b = mean response of FDs/APs of at least one larger company size group lower than mean response of FDs/APs of a smaller company size group.