Embed Size (px)
Citation preview

What a Nerd! Beating Students and Vector Cosine
in the ESL and TOEFL Datasets
Enrico Santus*, Tin-Shing Chiu
*, Qin Lu
*, Alessandro Lenci
§, Chu-Ren Huang
*
* The Hong Kong Polytechnic University, Hong Kong
[email protected], [email protected], {qin.lu, churen.huang}@polyu.edu.hk
§ University of Pisa, Italy
Abstract
In this paper, we claim that Vector Cosine – which is generally considered one of the most efficient unsupervised measures for
identifying word similarity in Vector Space Models – can be outperformed by a completely unsupervised measure that evaluates the
extent of the intersection among the most associated contexts of two target words, weighting such intersection according to the rank of
the shared contexts in the dependency ranked lists. This claim comes from the hypothesis that similar words do not simply occur in
similar contexts, but they share a larger portion of their most relevant contexts compared to other related words. To prove it, we
describe and evaluate APSyn, a variant of Average Precision that – independently of the adopted parameters – outperforms the Vector
Cosine and the co-occurrence on the ESL and TOEFL test sets. In the best setting, APSyn reaches 0.73 accuracy on the ESL dataset and
0.70 accuracy in the TOEFL dataset, beating therefore the non-English US college applicants (whose average, as reported in the
literature, is 64.50%) and several state-of-the-art approaches.
Keywords: Vector Space Models, VSMs, Distributional Semantic Models, DSMs, Semantic Relations, Words Similarity
1. Introduction
Word similarity detection plays an important role in
Natural Language Processing (NLP), as it is the backbone
of several applications, such as Paraphrasing, Query
Expansion, Word Sense Disambiguation, Automatic
Thesauri Creation, and so on (Terra and Clarke, 2003).
Several approaches have been proposed to measure word
similarity (Terra and Clarke, 2003; Jarmasz and
Szpakowicz, 2003; Mikolov et al., 2013; Levy et al.,
2015; Santus et al. 2016a). Some of them rely on
knowledge resources (such as lexicons or semantic
networks), while others are corpus-based.
The latter approaches generally exploit the Distributional
Hypothesis, according to which words that occur in
similar contexts also have similar meanings (Harris,
1954). Although these approaches extract statistics from
large corpora, they vary in the way they define what has to
be considered context (i.e. lexical context, syntactic
context, documents, etc.), how the association with such
context is measured (e.g. frequency of co-occurrence,
association measures like Pointwise Mutual Information,
etc.), and how the association with the contexts is used to
identify the similarity (Terra and Clarke, 2003; Hearst,
1992; Santus et al., 2014a; Santus et al., 2014b; Santus et
al., 2016a).
A common way to represent word meaning in NLP is by
using vectors to encode the association between the target
words and their contexts. The resulting vector space is
generally referred as Vector Space Model (VSM) or, more
specifically, as Distributional Semantic Model (DSM). In
such vector space, word similarity can be calculated by
using the Vector Cosine, which measures the angle
between the vectors (Turney and Pantel, 2010). Other
measures – such as Manhattan Distance, Dice’s
Coefficient, Euclidean Distance, Jaccard Similarity and
Matching Coefficient – can be used to calculate the
distance between the vectors (Gomaa and Fahmy, 2013),
but the Vector Cosine is generally considered to be the
optimal choice (Bullinaria and Levy 2007).
Another common way to represent word meaning is using
word embeddings, which are vector-space word
representations that are implicitly learned by the
input-layer weights of neural networks. These models
have shown a strong ability to capture synonymy and
analogies (such as in the famous “King - Man + Woman =
Queen” example, where Mikolov et al. (2013) subtract the
vector of “Man” from the one of “King”, and then add the
vector of “Woman”, obtaining a very similar vector to the
one of “Queen”), even though Levy et al. (2015) have
claimed that traditional count-based DSMs can achieve
the same results if their hyperparameters are properly
optimized.
A well-known problem with the distributional approaches
is that they rely on a very loose definition of similarity. In
fact, vectors have as nearest neighbours not only
synonyms, but also hypernyms, co-hyponyms, antonyms,
as well as a wide range of other semantically related items
(Santus et al., 2015).
For this reason, several datasets have been proposed by
the NLP community to test distributional similarity
measures. Among the most common ones, there are the
English as a Second Language1 dataset (ESL; Turney,
1
For the state-of-the-art on the ESL, see:
4565

2001) and the Test of English as Foreign Language2
(TOEFL; Landauer and Dumais, 1997). The former
consists of 50 multiple-choice synonym questions, with 4
choices each, while the latter consists of 80
multiple-choice synonym questions, with 4 choices each.
In this paper, we describe and evaluate APSyn, a
completely unsupervised measure that calculates the
extent of the intersection among the N most related
contexts of two target words, weighting such intersection
according to the rank of the shared contexts in a mutual
dependency ranked list.
In our experiments, APSyn outperforms the Vector Cosine
and the co-occurrence frequency, reaching 0.73 accuracy
on the ESL dataset and 0.70 accuracy in the TOEFL
dataset, beating therefore the non-English US college
applicants (whose average, as reported in the literature, is
64.50%) and several state-of-the-art approaches.
2. Background
Word similarity measures play a fundamental role in tasks
such as Information Retrieval (IR), Text Classification
(TC), Text Summarization (TS), Question Answering
(QA), Sentiment Analysis (SA), and so on (Terra and
Clarke, 2003; Tungthamthiti et al., 2015). They can be
either knowledge-based or corpus-based (Gomaa and
Fahmy, 2013). The former rely on lexicons or semantic
networks, such as WordNet (Fellbaum, 1998), measuring
the distance between the nodes in the network. The latter,
instead, compute the similarity between words relying on
statistical information about their distributions in large
corpora (Church and Hanks, 1990).
Knowledge based approaches generally exploit
hand-crafted resources. While being hand-crafted ensures
high quality, it also entails arbitrariness and high
development and update costs. This is the main reason
why these resources are known for their limited coverage
(Santus et al., 2015b). Such limitation has often prompted
researchers to pursue hybrid approaches (Turney, 2001).
A key assumption of corpus-based approaches is that
similarity between words can be measured by looking at
words co-occurrences. In particular, following the
Distributional Hypothesis (Harris, 1954; Firth, 1957),
these methods assume that words occurring in similar
contexts are also similar. These methods mainly vary
according to two dimensions: i) how they define the
contexts (e.g. document, paragraph, sentence, fixed-size
window, etc.); and ii) how they measure whether the
targets occur in similar contexts (e.g. weighted occurrence
frequency, extent of the intersection, etc.). These models
are generally referred as traditional count-based DSMs.
A well-known traditional count-based DSM applied to
synonymy identification is the Latent Semantic Analysis
http://aclweb.org/aclwiki/index.php?title=TOEFL_Synonym_Questions_(State_of_the_art) 2
For the state-of-the-art on the TOEFL, see: http://aclweb.org/aclwiki/index.php?title=ESL_Synonym_Questions_(State_of_the_art)
(LSA; Landauer and Dumais, 1997). This system was
tested on the 80 multiple-choice synonym questions of the
TOEFL, achieving an accuracy of 64.38%, which is very
close to the reported average of non-English US college
applicant (i.e. 64.50%).
Another interesting way to learn words statistics is
generally referred as word embeddings and is discussed in
Mikolov et al. (2013). The authors report that when a
neural network language model is trained, it is not only
the model that is obtained, but also distributed words
representations, which can be eventually used for other
goals, such as in Collobert and Weston (2008). In their
paper, Mikolov et al. (2013) show that these words
representations capture both syntactic and semantic
regularities, performing particularly well in word
similarity identification and analogies.
While such models have obtained an enthusiastic
reception, with a consequent boost of papers using word
embeddings, Levy et al. (2015) have demonstrated that
similar results can be also obtained with optimized
traditional count-based DSMs.
2.1 Distance Measures Independently from the approach that is used to learn
words statistics, corpus-based approaches represent word
meanings as vectors in vector spaces, generally called
semantic spaces. In such semantic spaces, words
similarity can be measured as the proximity between
vectors. Several measures have been adopted to this
scope. In the following rows, we briefly describe some of
them, while defining the Vector Cosine, which is
generally considered the most efficient one.
Manhattan Distance (L1) can be defined as the sum of the
differences of the dimensions. Euclidean Distance (L2) is
the square root of the sum of the squared differences of
the dimensions. Dice’s Coefficient is instead twice the
number of common dimensions, divided by the total
number of dimensions in the two vectors. Jaccard
Similarity is defined as the number of shared dimensions
divided by the number of unique dimensions in both the
vectors. Matching Coefficient is the number of
dimensions different from zero in both the vectors. Vector
Cosine looks instead at the normalized correlation
between the dimensions of two words, 𝑤1 and 𝑤2, and is
described by the following equation:
cos(𝑤1, 𝑤2) = ∑ 𝑓1𝑖 ×𝑛
𝑖=1 𝑓2𝑖
√∑(𝑓1𝑖)2 × √∑(𝑓2𝑖)2
where 𝑓𝑥𝑖 is the i-th dimension in the vector x.
This measure has been extensively used to identify word
similarity in vector spaces becoming a sort of de facto
standard in distributional semantics (Landauer and
Dumais, 1997; Jarmasz and Szpakowicz, 2003; Mikolov
et al., 2013; Levy et al., 2015).
4566
2.2 State-of-the-art in the ESL and TOEFL After its first use in Landauer and Dumais (1997), the
TOEFL dataset became one of the most common
benchmarks for vector space models testing: Karlgren and
Sahlgren (2001), Pado and Lapata (2007), Turney (2001),
Turney (2008), Terra and Clarke (2003), Bullinaria and
Levy (2007), Matveeva et al. (2005), Dobó and Csirik
(2013) and Rapp (2003). Bullinaria and Levy (2012) even
achieved 100% accuracy on this dataset. In their paper,
the authors extensively analyze numerous parameters,
including the influence of corpus size, window size,
stop-lists, stemming and Singular Values Decomposition
(SVD), until they find a perfectly optimized model. After
achieving perfect precision on the TOEFL, the authors
acknowledge that while these results are impressive for
the benchmark, they can hardly be generalized to new
tasks.
Few years after the introduction of TOEFL as a
benchmark, Turney (2001) proposed the ESL. These 50
multiple-choice synonym questions are provided in a
sentence context, to facilitate sense disambiguation. ESL
has soon become a very popular benchmark on which
several models have been evaluated. The best reported
corpus-based approaches in this benchmark were those of
Turney (2001), Terra and Clarke (2003) and Jarmasz and
Szpakowicz (2003). The latter achieving the best result of
82% accuracy.
3. Method
Given a traditional count-based DSM, where every word
is represented as a vector of weighted associations
between such word and contexts, we can re-think the
Distributional Hypothesis (Harris, 1954) by
hypothesizing that similar words not only occur in similar
contexts, but – more specifically – they share a larger
number of their most associated contexts, compared to
less similar ones.
A way to test this hypothesis is by: i) measuring the extent
of the intersection among the N most related contexts of
two target words, and ii) weighting such intersection
according to the rank of the shared contexts in the
dependency ranked lists. This can be done in several
steps. First of all, for every target word we rank the
contexts according to the Positive Pointwise Mutual
Information (PPMI; Levy et al., 2015), which is defined
as follows:
𝑃𝑀𝐼(𝑤, 𝑐) = log (𝑃(𝑤, 𝑐)
𝑃(𝑤) × 𝑃(𝑐)) = log (
|𝑤, 𝑐| × 𝐷
|𝑤| × |𝑐|)
𝑃𝑃𝑀𝐼(𝑤, 𝑐) = max (𝑃𝑀𝐼(𝑤, 𝑐), 0)
were 𝑤 is the target word, 𝑐 is the given context, 𝑃(𝑤, 𝑐)
is the probability of co-occurrence and 𝐷 is the collection
of observed word-context pairs.
Once the contexts are ranked according to their PPMI, for
every target word we pick the top N contexts and we
intersect them. At this point, for each shared context, we
add one divided by the average rank of the shared context
in the PPMI-ranked contexts lists. We formalize this as
the APSyn similarity measure:
𝐴𝑃𝑆𝑦𝑛(𝑤1, 𝑤2) = ∑1
(𝑟𝑎𝑛𝑘1(𝑓) + 𝑟𝑎𝑛𝑘2(𝑓))/2 𝑓∈𝑁(𝐹1)∩𝑁(𝐹2)
For every feature 𝑓 included in the intersection between
the top N features of 𝑤1, 𝑁(𝐹1), and 𝑤2, 𝑁(𝐹2), APSyn will
add 1 divided by the average rank of the feature, among
the top PPMI ranked features of 𝑤1, 𝑟𝑎𝑛𝑘1(𝑓1), and 𝑤2,
𝑟𝑎𝑛𝑘2(𝑓2).
The choice of the weighting function is a parameter of
APsyn. In previous experiments, published in Santus et al.
(2016a), we used Local Mutual Information (LMI; Evert,
2005) to rank the contexts, instead of using PPMI.
However, the LMI-ranked APSyn obtained worse results
than those reported in the current paper. Such results were
nonetheless still outperforming the Vector Cosine and the
co-occurrence frequency. In section 9, we will comment
on the differences.
4. Evaluation
In the following paragraphs we describe our DSMs, the
test sets and the task.
4.1 Distributional Semantic Model We use several window-based DSMs, recording word
co-occurrences within the K nearest content words to the
left and right of each target, where K has the following
values: 2, 3, 5 and 10. Co-occurrences are extracted from
a combination of ukWaC and WaCkypedia corpora
(around 2.7 billion words) for content words – namely
adjectives, nouns and verbs – occurring over 1,000 times,
and are weighted with PPMI. The model consists of
28,870 word vectors, each of which with 28.870
dimensions.
4.2 Test Sets In order to evaluate the proposed measure, we use both
the ESL (Turney, 2001) and TOEFL (Landauer and
Dumais, 1997) datasets. The former consists of 50
questions, while the latter of 80 questions. The ESL
sentences were not used in our experiments. An example
of ESL question is the following:
“An underground [passage] connected the house
to the garage.”
a. Hallway
b. Ticket
c. Entrance
d. Room
For both datasets, we have turned each question in four
pairs, each of which containing the problem word and
4567
apossible answer. Unfortunately, we do not have a full
coverage of the datasets, because our model was built for
content words with frequency over 1000,
Parts-Of-Speech-tagged either as adjectives, nouns or
verbs. In the ESL test set, 4 out of 50 questions were
excluded because the correct answers were not present in
the DSM. In the TOEFL test set, 20 out of 80 questions
were excluded for the same reason. Few questions,
moreover, have one missing choice. In order to keep them
for the evaluation, in case of correct answer, the score is
increased of 0.25 ∗ |𝑐ℎ𝑜𝑖𝑐𝑒𝑠 𝑖𝑛 𝐷𝑆𝑀| (where, 1 is added
only if all four choices are in the DSM).
4.3 Task We have assigned APSyn scores to all the pairs, and then –
for every problem word – we have sorted the possible
choices in a decreasing order. We considered positive
every problem word having the correct answer on top,
negative all the others.
5. Results
In Table 1, we report the results of APSyn and the
baselines in the ESL test.
APSyn Win 2 Win 3 Win 5 Win 10
N=100 0.73 0.69 0.67 0.62 N=200 0.71 0.69 0.67 0.62 N=300 0.71 0.69 0.69 0.62 N=400 0.71 0.69 0.67 0.62 N=500 0.71 0.69 0.67 0.62 N=600 0.71 0.69 0.65 0.62 N=700 0.71 0.69 0.65 0.67 N=800 0.71 0.69 0.67 0.67 N=900 0.69 0.65 0.67 0.65
N=1000 0.67 0.62 0.65 0.60 Baselines
Cosine 0.46 0.46 0.48 0.48 Co-occ 0.43 0.41 0.39 0.35
Table 1. Accuracy in the ESL test set for APSyn
(100<N<1000), Vector Cosine and co-occurrence,
in window 2, 3, 5 and 10 DSMs.
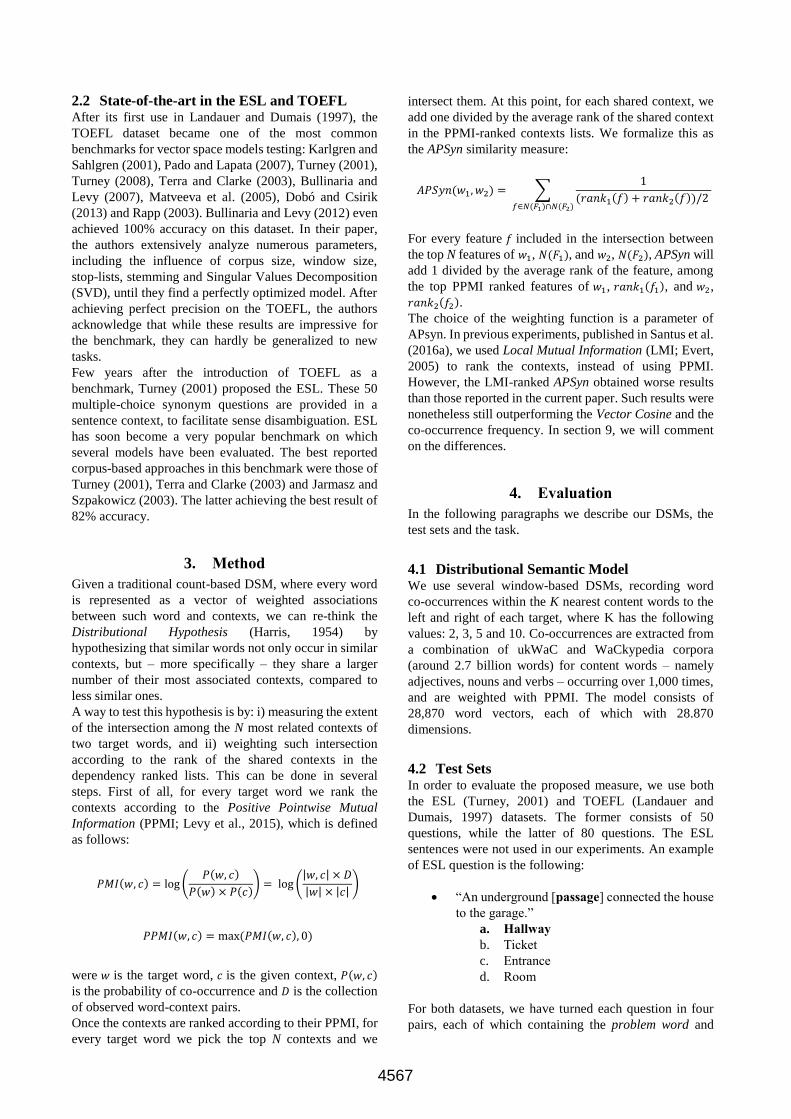
As it can be seen from Table 1 and from Figure 1, APSyn
always outperforms the baselines.
The window size and N have a certain impact on the
performance of APSyn. The former parameter has an
impact also on the baselines (Vector Cosine seems to
perform slightly better for larger windows, while the
co-occurrence frequency seems to prefer smaller ones).
Our measure, in particular, seems to perform better on
smaller windows and for N close to 100, while its
performance slightly drops for N close to 1000.
A possible reason for such drop may be that if too many
contexts are considered, some rumor is added. This
happens because with larger values of N, APSyn is forced
to consider less important contexts of the targets.
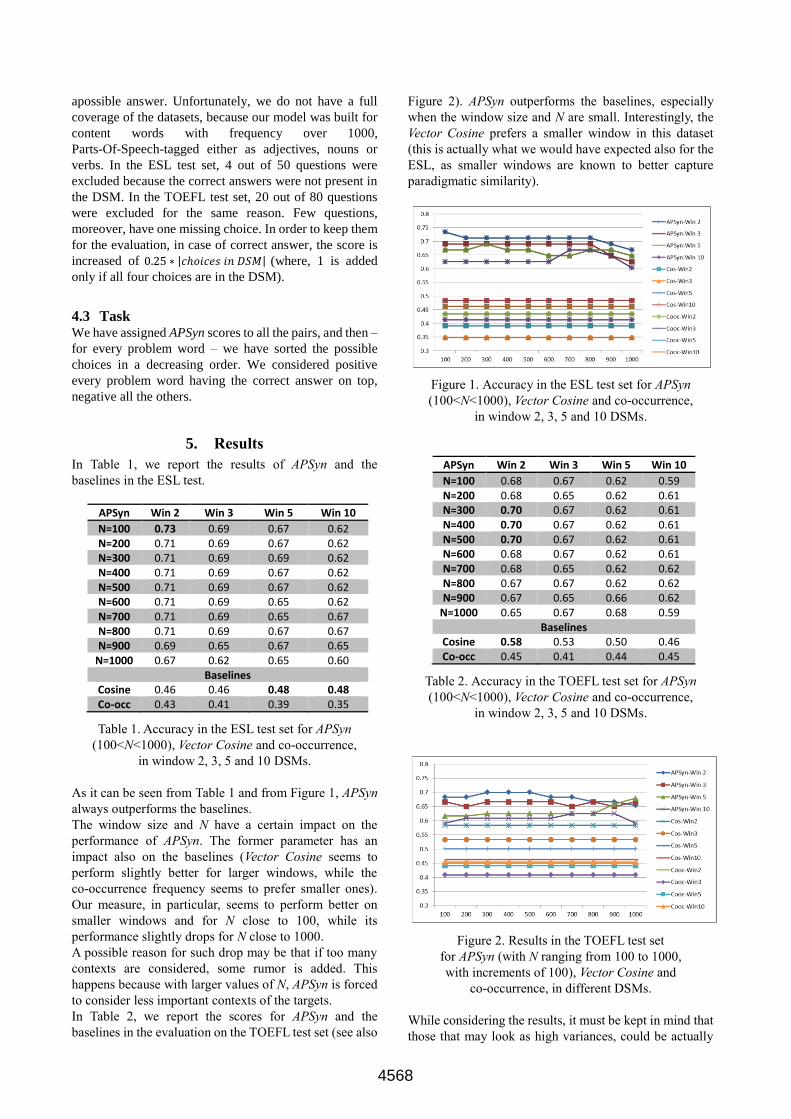
In Table 2, we report the scores for APSyn and the
baselines in the evaluation on the TOEFL test set (see also
Figure 2). APSyn outperforms the baselines, especially
when the window size and N are small. Interestingly, the
Vector Cosine prefers a smaller window in this dataset
(this is actually what we would have expected also for the
ESL, as smaller windows are known to better capture
paradigmatic similarity).
Figure 1. Accuracy in the ESL test set for APSyn
(100<N<1000), Vector Cosine and co-occurrence,
in window 2, 3, 5 and 10 DSMs.
APSyn Win 2 Win 3 Win 5 Win 10
N=100 0.68 0.67 0.62 0.59 N=200 0.68 0.65 0.62 0.61 N=300 0.70 0.67 0.62 0.61 N=400 0.70 0.67 0.62 0.61 N=500 0.70 0.67 0.62 0.61 N=600 0.68 0.67 0.62 0.61 N=700 0.68 0.65 0.62 0.62 N=800 0.67 0.67 0.62 0.62 N=900 0.67 0.65 0.66 0.62
N=1000 0.65 0.67 0.68 0.59 Baselines
Cosine 0.58 0.53 0.50 0.46 Co-occ 0.45 0.41 0.44 0.45
Table 2. Accuracy in the TOEFL test set for APSyn
(100<N<1000), Vector Cosine and co-occurrence,
in window 2, 3, 5 and 10 DSMs.
Figure 2. Results in the TOEFL test set
for APSyn (with N ranging from 100 to 1000,
with increments of 100), Vector Cosine and
co-occurrence, in different DSMs.
While considering the results, it must be kept in mind that
those that may look as high variances, could be actually
4568
be very small ones, given the small size of the test sets.
Guessing one more question, for example, would have a
large impact on the accuracy.
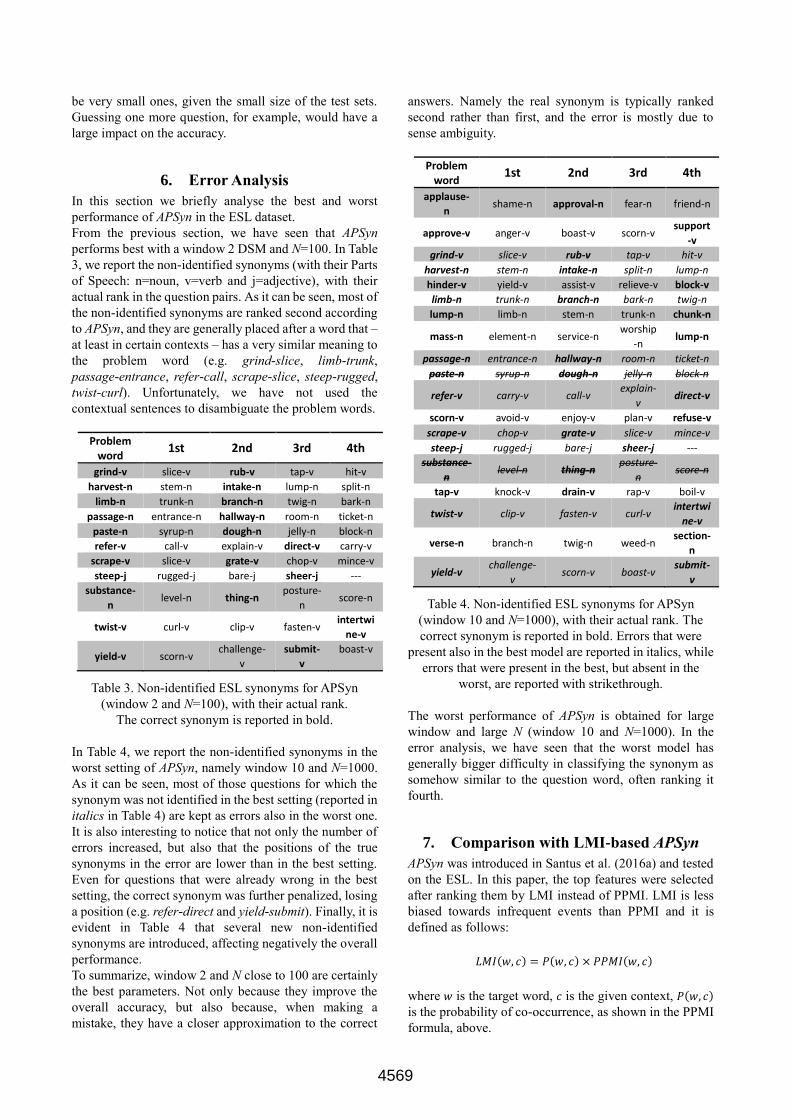
6. Error Analysis
In this section we briefly analyse the best and worst
performance of APSyn in the ESL dataset.
From the previous section, we have seen that APSyn
performs best with a window 2 DSM and N=100. In Table
3, we report the non-identified synonyms (with their Parts
of Speech: n=noun, v=verb and j=adjective), with their
actual rank in the question pairs. As it can be seen, most of
the non-identified synonyms are ranked second according
to APSyn, and they are generally placed after a word that –
at least in certain contexts – has a very similar meaning to
the problem word (e.g. grind-slice, limb-trunk,
passage-entrance, refer-call, scrape-slice, steep-rugged,
twist-curl). Unfortunately, we have not used the
contextual sentences to disambiguate the problem words.
Problem word
1st 2nd 3rd 4th
grind-v slice-v rub-v tap-v hit-v
harvest-n stem-n intake-n lump-n split-n
limb-n trunk-n branch-n twig-n bark-n
passage-n entrance-n hallway-n room-n ticket-n
paste-n syrup-n dough-n jelly-n block-n
refer-v call-v explain-v direct-v carry-v
scrape-v slice-v grate-v chop-v mince-v
steep-j rugged-j bare-j sheer-j ---
substance-
n level-n thing-n
posture-
n score-n
twist-v curl-v clip-v fasten-v intertwi
ne-v
yield-v scorn-v challenge-
v
submit-
v
boast-v
Table 3. Non-identified ESL synonyms for APSyn
(window 2 and N=100), with their actual rank.
The correct synonym is reported in bold.
In Table 4, we report the non-identified synonyms in the
worst setting of APSyn, namely window 10 and N=1000.
As it can be seen, most of those questions for which the
synonym was not identified in the best setting (reported in
italics in Table 4) are kept as errors also in the worst one.
It is also interesting to notice that not only the number of
errors increased, but also that the positions of the true
synonyms in the error are lower than in the best setting.
Even for questions that were already wrong in the best
setting, the correct synonym was further penalized, losing
a position (e.g. refer-direct and yield-submit). Finally, it is
evident in Table 4 that several new non-identified
synonyms are introduced, affecting negatively the overall
performance.
To summarize, window 2 and N close to 100 are certainly
the best parameters. Not only because they improve the
overall accuracy, but also because, when making a
mistake, they have a closer approximation to the correct
answers. Namely the real synonym is typically ranked
second rather than first, and the error is mostly due to
sense ambiguity.
Problem word
1st 2nd 3rd 4th
applause-
n shame-n approval-n fear-n friend-n
approve-v anger-v boast-v scorn-v support
-v
grind-v slice-v rub-v tap-v hit-v
harvest-n stem-n intake-n split-n lump-n
hinder-v yield-v assist-v relieve-v block-v
limb-n trunk-n branch-n bark-n twig-n
lump-n limb-n stem-n trunk-n chunk-n
mass-n element-n service-n worship
-n lump-n
passage-n entrance-n hallway-n room-n ticket-n
paste-n syrup-n dough-n jelly-n block-n
refer-v carry-v call-v explain-
v direct-v
scorn-v avoid-v enjoy-v plan-v refuse-v
scrape-v chop-v grate-v slice-v mince-v
steep-j rugged-j bare-j sheer-j ---
substance-
n level-n thing-n
posture-
n score-n
tap-v knock-v drain-v rap-v boil-v
twist-v clip-v fasten-v curl-v intertwi
ne-v
verse-n branch-n twig-n weed-n section-
n
yield-v challenge-
v scorn-v boast-v
submit-
v
Table 4. Non-identified ESL synonyms for APSyn
(window 10 and N=1000), with their actual rank. The
correct synonym is reported in bold. Errors that were
present also in the best model are reported in italics, while
errors that were present in the best, but absent in the
worst, are reported with strikethrough.
The worst performance of APSyn is obtained for large
window and large N (window 10 and N=1000). In the
error analysis, we have seen that the worst model has
generally bigger difficulty in classifying the synonym as
somehow similar to the question word, often ranking it
fourth.
7. Comparison with LMI-based APSyn
APSyn was introduced in Santus et al. (2016a) and tested
on the ESL. In this paper, the top features were selected
after ranking them by LMI instead of PPMI. LMI is less
biased towards infrequent events than PPMI and it is
defined as follows:
𝐿𝑀𝐼(𝑤, 𝑐) = 𝑃(𝑤, 𝑐) × 𝑃𝑃𝑀𝐼(𝑤, 𝑐)
where 𝑤 is the target word, 𝑐 is the given context, 𝑃(𝑤, 𝑐)
is the probability of co-occurrence, as shown in the PPMI
formula, above.
4569

As mentioned above, the performance of the LMI-based
APSyn on a window 5 DSM was worse than what reported
with PPMI. However, its 58.33% accuracy was much
above the Vector Cosine, which was instead blocked at
49.44%.
In Table 5 we show all the scores, recalculated with the
LMI-based APSyn. Note that the recall in the models used
for this paper is slightly higher, reaching 46 questions
rather than 45, so the scores can be slightly different.
Despite results are worse than those obtained with PPMI,
they are however relatively stable with reference to N, and
almost always above the baseline. Only with window 10
and N close to 100 the performance is the equal to the
Vector Cosine.
APSyn Win 2 Win 3 Win 5 Win 10 N=100 0.61 0.59 0.57
3 0.48
N=200 0.65 0.61 0.48 0.48 N=300 0.68 0.61 0.57 0.48 N=400 0.66 0.64 0.50 0.52 N=500 0.66 0.59 0.53 0.50 N=600 0.66 0.59 0.53 0.50 N=700 0.66 0.59 0.53 0.52 N=800 0.66 0.57 0.53 0.52 N=900 0.65 0.57 0.53 0.50
N=1000 0.64 0.57 0.534 0.50
Baselines Cosine 0.46 0.46 0.48 0.48 Co-occ 0.43 0.41 0.39 0.35
Table 5. Accuracy in the ESL test set for APSyn
(100<N<1000), Vector Cosine and co-occurrence,
in window 2, 3, 5 and 10 DSMs.
8. Conclusions
In this paper, we have described APSyn, a completely
unsupervised measure based on the evaluation of the
extent and the relevance of the intersection among the top
ranked distributional features of target words. APSyn was
tested on the ESL and TOEFL questions, outperforming
the Vector Cosine and the co-occurrence, plus several
lexicon-based and hybrid models. In particular, our
results are above those reported in the literature for
non-English US college applicants on the TOEFL test
(64.50%).
Our experiments show that the intersection among the N
most related contexts of the target words is in fact a
reliable index of similarity. In our evaluations we have
also mentioned the role of both the window size and N.
APSyn performs better on smaller windows and with N
3
Not differently from Santus et al. (2016a), the LMI-based APSyn guessed 26.25 questions (24 full and 3 partial), but being the recall higher in the current DSM, this number has been divided by 46. 4
Not differently from Santus et al. (2016a), the LMI-based APSyn guessed 24.25 questions (22 full and 3 partial), but being the recall higher in the current DSM, this number has been divided by 46.
close to 100. In fact, the larger the amount of considered
contexts, the lower the ability of identifying similarity
(exceptions to this consideration are minimal and can be
appreciated only because of the limited size of the test
sets). This also confirms our hypothesis that similar words
share a significantly larger number of top mutually
dependent contexts, but such intersection becomes less
significant when not only the top contexts are considered,
as rumor is introduced. Given that, it is important to notice
that APSyn performance is quite stable, in respect to N
variances.
APSyn has been recently used as one of the thirteen
features of ROOT13, a random-forest based supervised
system for the identification of hypernyms, co-hyponyms
and unrelated words. In a 10-fold evaluation on 9600 pairs
extracted from EVALuation (Santus et al., 2015a),
ROOT13 achieved 88.3% accuracy when the three classes
were present, 93.4% for hypernyms-co-hyponyms
discrimination, 92.3% for hypernyms-random
discrimination, 97.3% for co-hyponyms-random (Santus
et al., 2016b).
Possible improvements to the measure include changing
the numerator to a more significant value, rather than
simply using the constant 1. Moreover, it would be
important to test the measure on optimized DSMs, where
more parameters are investigated (e.g. stemming,
dependency, SVD, etc.). Moreover, since ESL and
TOEFL are small test sets, APSyn performance should be
further explored on larger datasets, such as the
Lenci/Benotto (Benotto, 2015), SimLex-999 (Hill et al.,
2014) and EVALuation (Santus et al., 2015a).
9. Acknowledgements
This work is partially supported by HK PhD Fellowship
Scheme under PF12-13656
10. Main References
Baroni, M. and Lenci, A. (2011). How we BLESSed
distributional semantic evaluation. Proceedings of the
EMNLP 2011 Geometrical Models for Natural
Language Semantics (GEMS 2011) Workshop.
Edinburg, UK. 1-10.
Benotto, Giulia. (2015). Distributional Models for
Semantic Relations: A Sudy on Hyponymy and
Antonymy. PhD Thesis, University of Pisa.
Bullinaria, J.A., and Levy, J.P. (2007). Extracting
semantic representations from word co-occurrence
statistics: A computational study. Behavior Research
Methods, 39(3), 510-526.
Bullinaria, J.A., and Levy, J.P. (2012). Extracting
semantic representations from word co-occurrence
statistics: stop-lists, stemming, and SVD. Behavior
Research Methods, 44(3):890-907.
Church, K. Ward, and Patrick Hanks. (1990). Word
association norms, mutual information, and
lexicography. In Journal Computational Linguistics,
Vol. 16 (1).
4570
Collobert, Robert, and Jason Weston. (2008). A Unified
Architecture for Natural Language Processing: Deep
Neural Networks with Multitask Learning. In
International Conference on Machine Learning,
ICML.
Dobó, A., and Csirik, J. (2013). “Computing semantic
similarity using large static corpora”. In: van Emde
Boas, P. et al. (eds.) SOFSEM 2013: Theory and
Practice of Computer Science. LNCS, Vol. 7741.
Springer-Verlag, Berlin Heidelberg, pp. 491-502
Evert, S. (2005). The Statistics of Word Cooccurrences:
Word Pairs and Collocations. Dissertation, University
of Stuttgart.
Fellbaum C. (1998). WordNet: An electronic lexical
database. Cambridge, MA: MIT Press.
Firth, J. R. (1957). Papers in Linguistics 1934–1951.
London: Oxford University Press.
Gomaa, Wael H. and Aly A. Fahmy. (2013). A survey of
text similarity approaches. In International Journal of
Computer Applications, Vol. 68 (13).
Harris, Z. (1954). Distributional structure. Word, Vol. 10
(23). 146-162.
Hearst, M. A. (1992). Automatic Acquisition of
Hyponyms from Large Text Corpora. Proceedings of
the 14th International Conference on Computational
Linguistics. Nantes, France. 539-545.
Hill, Felix, Roi Reichart and Anna Korhonen. (2014).
SimLex-999: Evaluating Semantic Models with
(Genuine) Similarity Estimation. In Computational
Linguistics.
Jarmasz, M. and Szpakowicz, S. (2003). Roget’s
thesaurus and semantic similarity, Proceedings of
RANLP 2003, Borovets, Bulgaria. 212-219.
Landauer, T. K. and Dumais, S.T. (1997). A solution to
Plato's problem: The latent semantic analysis theory of
the acquisition, induction, and representation of
knowledge. Psychological Review, 104(2):211-240.
Levy, O., Goldberg, Y. and Dagan I. (2015). Improving
Distributional Similarity with Lessons Learned from
Word Embeddings. TACL 2015.
Matveeva, I., Levow, G., Farahat, A., and Royer, C.
(2005). Generalized latent semantic analysis for term
representation. Proceedings of the International
Conference on Recent Advances in Natural Language
Processing (RANLP-05), Borovets, Bulgaria.
Mikolov, T., Yih, W. and Zweig G. (2013). Linguistic
Regularities in Continuous Space Word
Representations. Proceedings of HLT-NAACL,
746-751.
Karlgren, J., and Sahlgren, M. (2001). “From Words to
Understanding”. In Uesaka, Y., Kanerva, P., & Asoh, H.
(Eds.), Foundations of Real-World Intelligence,
Stanford: CSLI Publications, pp. 294–308.
Pado, S., and Lapata, M. (2007). Dependency-based
construction of semantic space models. Computational
Linguistics, Vol. 33 (2), pp. 161-199.
Rapp, R. (2003). Word sense discovery based on sense
descriptor dissimilarity. Proceedings of the Ninth
Machine Translation Summit, pp. 315-322.
Santus, E., Chiu, T.-S., Lu, Q., Lenci, A., and Huang,
C.-R. (2016a). Unsupervised Measure of Word
Similarity: How to Outperform Co-occurrence and
Vector Cosine in VSMs. In Proceedings of AAAI 2016,
Phoenix, Arizona (USA)
Santus, E., Chiu, T.-S., Lu, Q., Lenci, A., and Huang,
C.-R. (2016b). ROOT 13: Spotting Hypernyms,
Co-Hyponyms and Randoms. In Proceedings of AAAI
2016, Phoenix, Arizona (USA)
Santus, E., Yung, F., Lenci, A. and Huang C-R. (2015).
EVALution 1.0: an Evolving Semantic Dataset for
Training and Evaluation of Distributional Semantic
Models. Proceedings of the 4th Workshop on Linked
Data in Linguistics, ACL-IJCNLP 2015, 64
Santus, E., Lenci, A., Lu, Q., and Huang C-R.
(2015). When Similarity Becomes Opposition:
Synonyms and Antonyms Discrimination in
DSMs. Italian Journal on Computational Linguistics,
aAccademia University Press
Santus, E., Lenci, A., Lu, Q. and Schulte im Walde, S.
(2014a). Chasing Hypernyms in Vector Spaces with
Entropy. Proceedings of EACL 2014, 2:38–42,
Gothenburg, Sweden.
Santus, E., Lu, Q. Lenci, A. and Huang, C-R. (2014b).
Taking Antonymy Mask off in Vector
Space. Proceedings of PACLIC 2014, Phuket,
Thailand.
Terra, E. and Clarke, C.L.A. (2003). Frequency estimates
for statistical word similarity measures. Proceedings of
HLT/NAACL 2003. 244–251.
Tungthamthiti, Piyoros, Enrico Santus, Hongzhi Xu,
Chu-Ren Huang and Kiyoaki Shirai. 2015. Sentiment
Analyzer with Rich Features for Ironic and Sarcastic
Tweets. In Proceedings of PACLIC 2015, 178-187.
Turney, P.D. and Pantel, P. (2010). From Frequency to
Meaning: Vector Space Models of Semantics. Journal
of Articial Intelligence Research, Vol. 37. 141-188.
Turney, P.D. (2008). A uniform approach to analogies,
synonyms, antonyms, and associations. Proceedings of
the 22nd International Conference on Computational
Linguistics (COLING 2008), Manchester, UK, pp.
905-912.
Turney, P.D. (2001). Mining the Web for synonyms:
PMI-IR versus LSA on TOEFL. Proceedings of
ECML-2001, Freiburg, Germany. 491-502.
Language Resource References
ESL. In: Turney, P.D. (2001). Mining the Web for
synonyms: PMI-IR versus LSA on TOEFL.
Proceedings of ECML-2001, Freiburg, Germany.
491-502.
EVALution. In: Santus, E., Yung, F., Lenci, A. and
Huang C-R. (2015). EVALution 1.0: an Evolving
Semantic Dataset for Training and Evaluation of
Distributional Semantic Models. Proceedings of the 4th
Workshop on Linked Data in Linguistics, ACL-IJCNLP
2015, 64.
Lenci/Benotto. In: Benotto, Giulia. (2015).
4571
Distributional Models for Semantic Relations: A Sudy
on Hyponymy and Antonymy. PhD Thesis, University
of Pisa.
SimLex-999. In: Hill, Felix, Roi Reichart and Anna
Korhonen. (2014). SimLex-999: Evaluating Semantic
Models with (Genuine) Similarity Estimation.
In Computational Linguistics.
TOEFL. In: Landauer, T. K. and Dumais, S.T. (1997). A
solution to Plato's problem: The latent semantic
analysis theory of the acquisition, induction, and
representation of knowledge. Psychological Review,
104(2):211-240.
4572