Embed Size (px)
Citation preview

Beat-to-Beat Estimation of Blood Pressure by Artificial
Neural Network
By:
Azadeh Dastmalchi
A thesis submitted to the
Faculty of Graduate and Postdoctoral Studies
In partial fulfillment of the requirements for the degree of
Master of Applied Science in Biomedical Engineering
Department of Mechanical Engineering
Faculty of Engineering
University of Ottawa
© Azadeh Dastmalchi, Ottawa, Canada, 2015
2
ABSTRACT
High blood pressure is a major public health issue. However, there are many physical and non-
physical factors that affect the measurement of blood pressure (BP) over very short time spans.
Therefore, it is very difficult to write a mathematical equation which includes all relevant factors
needed to estimate accurate BP values. As a result, a possible solution to overcome these
limitations is the use of an artificial neural network (ANN). The aim of this research is to design
and implement a new ANN approach, which correlates the arterial pulse waveform shape to BP
values, for estimation of BP in a single heartbeat. To test the feasibility of this approach, a pilot
study was performed on an arterial pulse waveform dataset obtained from 11 patients with
normal BP and 11 patients with hypertension. It was found that the proposed method can
accurately estimate BP in single heartbeats and satisfy the requirements of the ANSI/AAMI
standard for non-invasive measurement of BP.
Keywords: arterial pulse waveform, blood pressure, artificial neural network

3
Acknowledgments
It is my pleasure to thank the many people who made this research possible, first and foremost
my family. My thanks go to my husband, Soroosh, my beloved parents, Kezam and Hamideh,
and my dear parents-in-law for their understanding, patience, and encouragement during the
period of my graduate studies. I am also grateful to my brother Mohammad Reza for his help in
drawing most of the graphics in this thesis. I should also thank my sister-in-law, Nafiseh Moshir
Ehteshami, who took care of editing the last draft of this thesis.
I wish to express my most sincere appreciation to Dr. Hilmi R. Dajani for his supervision,
constant support, and his constructive comments throughout the development of the project. The
work could also not have been completed without the aid of my colleague Dr. Mohamad
Forouzanfar. It has been a pleasure collaborating with each member of this team.
I would also like to thank and acknowledge my previous supervisor Professor Tofy Mussivand,
his lab manager Mr. Kevin Holmes, postdoctoral fellows Dr. Armin Sabri and my lab mate John
Szalas, my friends Alireza Sadr, Mohammad Faraji and Omid Gheibi who have been of
invaluable assistance when I hit a bottleneck during the period of completing this project.
I wish to express my last, but not least, wholehearted thanks to my friends Mana Shahirari,
Fahimeh Soleymani, Zahra Zangenehmadar, Helyeh Doutaghi, Mohammad Mahdi
Gharaeemanesh, Masoumeh Mirzaee and her family, for their motivation, encouragement and
support.

4
Contents
Introduction 13 1
Literature Review 16 2
2.1 Background 16
2.2 Factors Influencing Blood Pressure 20
2.2.1 Stroke Volume (SV) 21
2.2.2 Cardiac Output (CO) 22
2.2.3 Heart Rate (HR) 22
2.2.4 Blood Volume 22
2.2.5 Vessel Elasticity 23
2.2.6 Peripheral Resistance 23
2.2.7 Blood Viscosity 24
2.2.8 Vessel Length 24
2.2.9 Vessel Diameter 24
2.3 Blood Pressure Measurement Methods 25
2.4 Invasive Methods 27
2.4.1 Extravascular Sensor Method 28
2.4.2 Intravascular Sensor Method 29
2.5 Non-invasive Methods 29
2.5.1 The Auscultatory Method 32
2.5.2 The Oscillometric Technique 37
2.6 Cuffless blood pressure estimation methods 45
2.6.1 Applications 48

5
2.6.2 Limitations 48
Materials and Methods 53 3
3.1 Introduction 53
3.2 Arterial Blood Pressure (ABP) signal 55
3.3 Spline Interpolation 60
3.4 Normalization 61
3.5 Artificial Neural Network (ANN) architecture 62
3.6 Principal component analysis (PCA) 63
3.7 Feature Extraction 63
3.8 Analysis Procedures 65
3.8.1 Procedure 1: Raw Signal as input 66
3.8.2 Procedure 2: PCA of the Raw Signal as input 67
3.8.3 Procedure 3: 21 Extracted Features as input 67
3.8.4 Procedure 4: PCA of 21 Extracted Features as input 68
3.9 Optimization 69
Results and Discussion 72 4
4.1 Results 72
4.1.1 Bland-Altman Plots 74
4.2 Discussion 80
Conclusions and Future Work 84 5
5.1 Conclusions 84
5.2 Contributions 85
5.3 Limitations 86

6
5.4 Future work 88
Reference 90
Appendix 101

7
List of Figures
Figure 2.1 A flowchart of blood pressure divisions. 18
Figure 2.2 Systemic Blood Pressure. 19
Figure 2.3 Arterial pulse wave and its components. 20
Figure 2.4 Physiological factors that affect blood pressure. 21
Figure 2.5 The methods used to measure blood pressure. 26
Figure 2.6 The Auscultatory Method. 32
Figure 2.7 An example of Mercury Sphygmomanometer. 33
Figure 2.8 An example of Aneroid Sphygmomanometer. 34
Figure 2.9 An example of Hybrid Sphygmomanometer. 36
Figure 2.10 The Oscillometric Method. 37
Figure 2.11 An example arm device. 39
Figure 2.12 An example of wrist device. 40
Figure 2.13 An example of ambulatory device. 41
Figure 2.14 Pulse Arrival Time (PAT); PAT=PTT+PEP. 46
Figure 2.15 SBP vs. generalized PWV that is defined by the ratio of a subject's arm length over
PAT. 47
Figure 3.1 An example of ANN with the input layer, one hidden layer with 3 neurons, and one
output layer with two neurons. ABP is arterial blood pressure, SP and DP are systolic and
diastolic pressure, respectively. 54
Figure 3.2 A block diagram of the proposed ANN method. 55
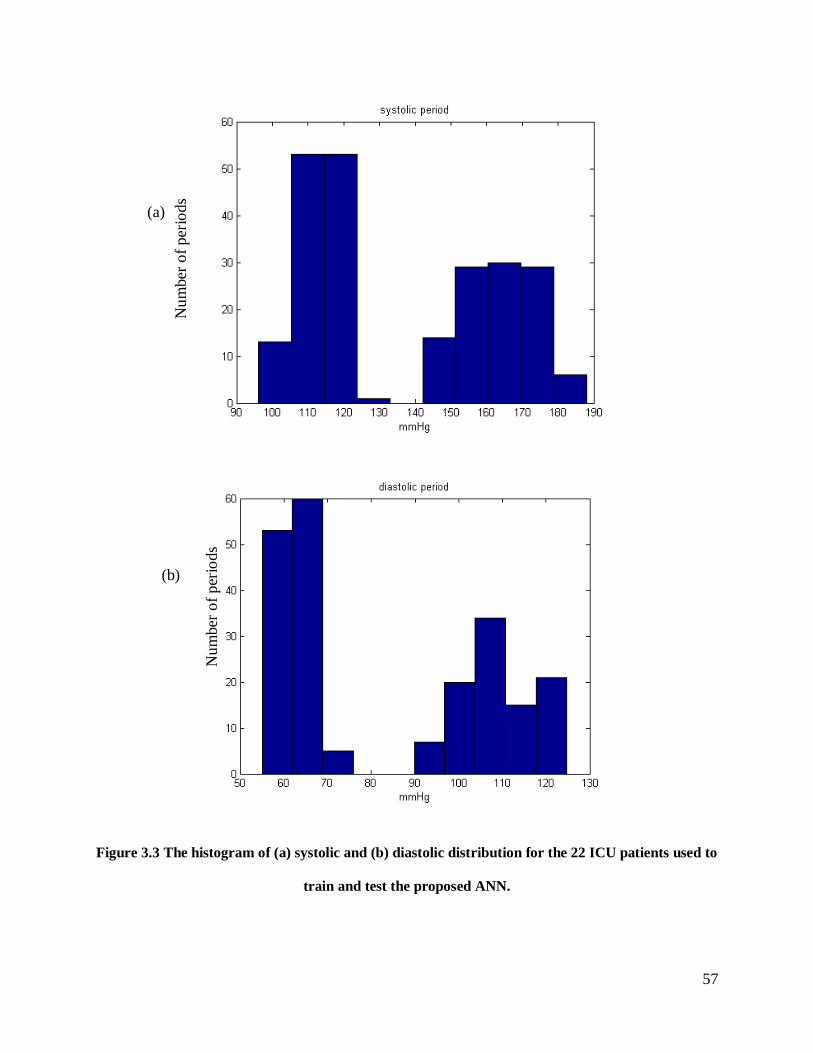
Figure 3.3 The histogram of (a) systolic and (b) diastolic distribution for the 22 ICU patients
used to train and test the proposed ANN. 57

8
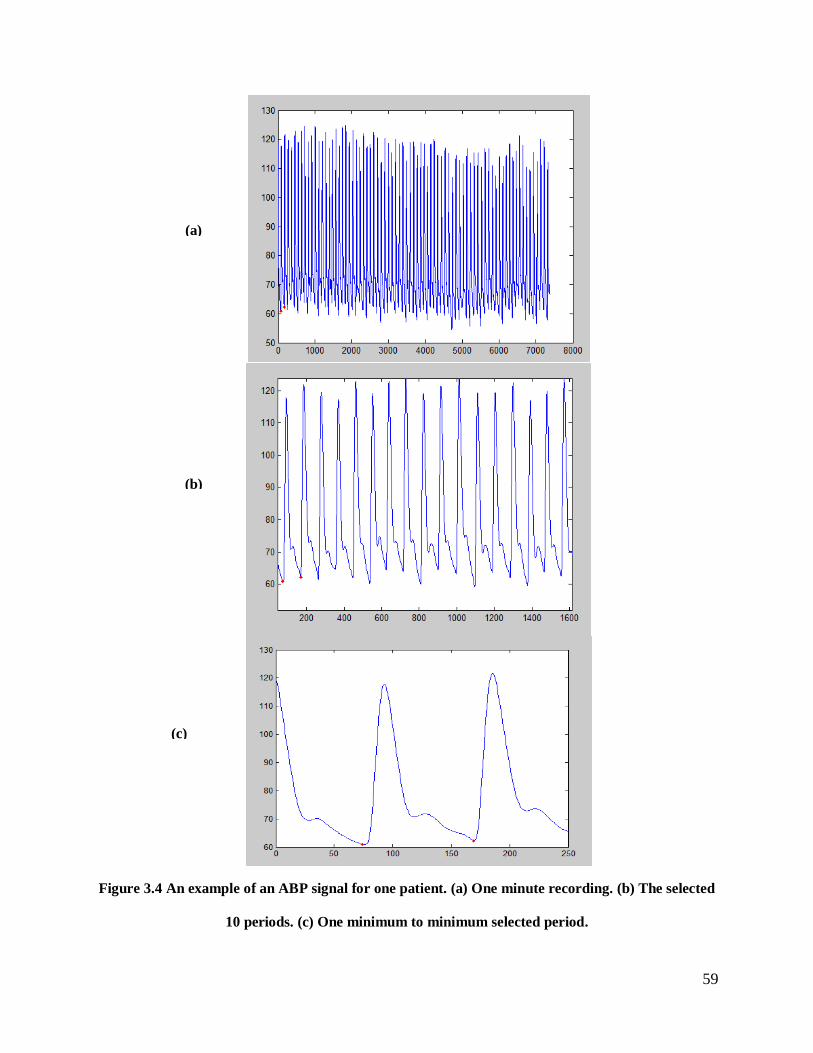
Figure 3.4 An example of an ABP signal for one patient. (a) One minute recording. (b) The
selected 10 periods. (c) One minimum to minimum selected period. 59
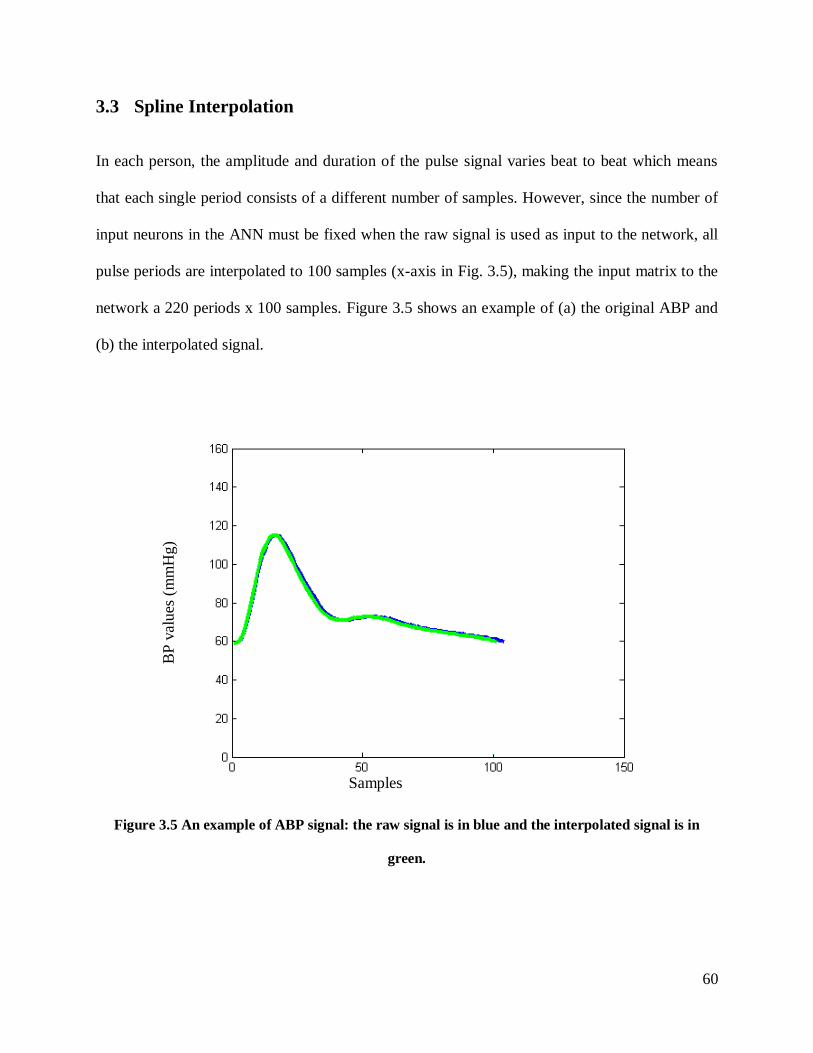
Figure 3.5 An example of ABP signal: the raw signal is in blue and the interpolated signal is in
green. 60
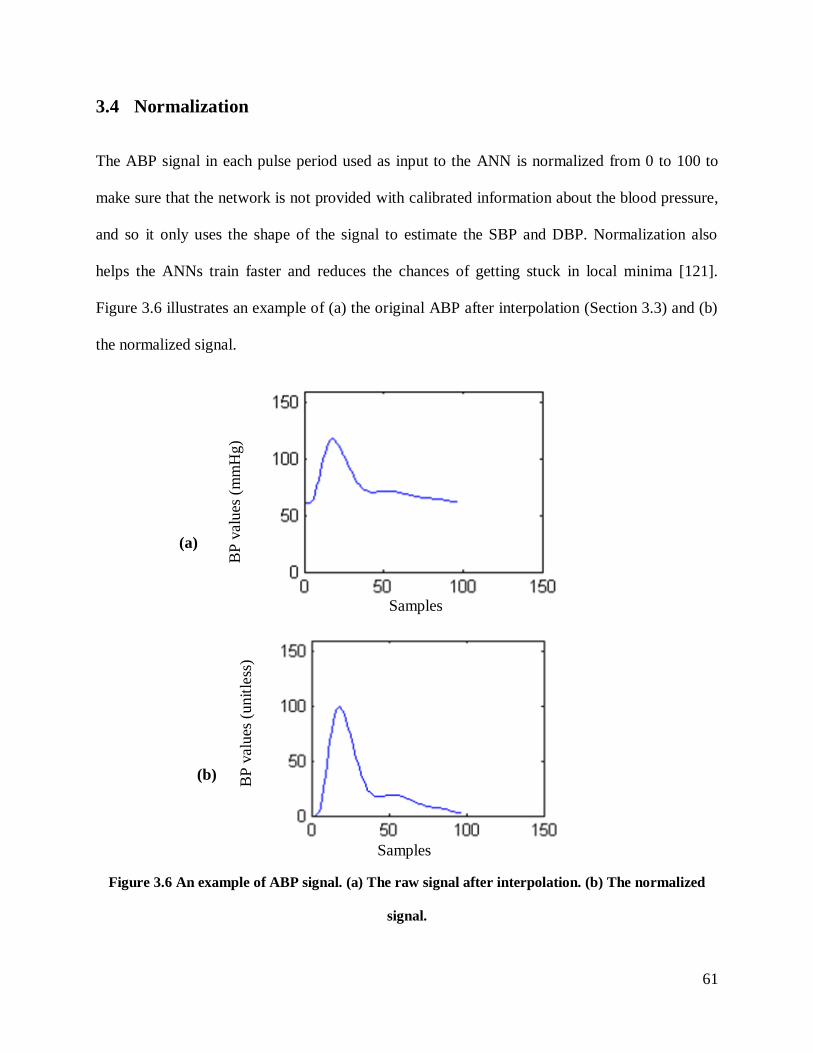
Figure 3.6 An example of ABP signal. (a) The raw signal after interpolation. (b) The normalized
signal. 61
Figure 3.7 The 21-features extracted from the ABP signal. 65
Figure 3.8 The block diagram of Procedure 1, with the raw signal as input. 66
Figure 3.9 The block diagram of Procedure 2 with the PCA of the raw signal as input. 67
Figure 3.10 The block diagram of Procedure 3, with 21 Extracted Feature as input. 68
Figure 3.11 The block diagram of Procedure 4, with PCA of 21 Extracted Features as input.
69
Figure 3.12 From the left to right, top to bottom: (a) An ANN network for systolic BP, one min
to min period is selected as input. The training function is L-M backpropagation and the network
has 3 hidden layers with 1, 3 and 4 neurons respectively. (b) An ANN network for diastolic BP,
one peak to peak period is selected as input. The training function is L-M backpropagation and
the network has 2 hidden layers with 7 and 6 neurons respectively. 70
Figure 4.1 The Bland–Altman plot for SBP estimates for the raw signal feature set. 75
Figure 4.2 The Bland–Altman plot for DBP estimates for the raw signal feature set. 75
Figure 4.3 The Bland–Altman plot for SBP estimates for feature set obtained by applying the
PCA applied on raw signal. 76
Figure 4.4 The Bland–Altman plot for DBP estimates for feature set obtained by applying the
PCA applied on raw signal. 77

9
Figure 4.5 The Bland–Altman plot for SBP estimates for the 21 Extracted Features. 78
Figure 4.6 The Bland–Altman plot for DBP estimates for the 21 Extracted Features. 78
Figure 4.7 The Bland–Altman plot for SBP estimates for features obtained by applying PCA on
the 21 Extracted Features. 79
Figure 4.8 The Bland–Altman plot for DBP estimates for features obtained by applying PCA on
the 21 Extracted Features. 80
Figure 5.1 Different blood pressure waveforms and amplitudes in the (1) brachialis, (2) radialis
and (3) digitalis along the arterial peripheral tree. 86

10
List of Tables
Table 2.1 Blood pressure values (in mmHg) and stages 17
Table 2.2 Issues with current methods and devices of blood pressure monitoring. 43
Table 3.1 The optimization of ANN architecture for 4 types of input. SDE is the standard
deviation of the error between the estimated value and the reference value obtained from the
calibrated ABP waveform (i.e. prior to normalization). The numbers in brackets indicate the
number of neurons in each hidden layer. 71
Table 4.1 Performance of the ANN with the four tested feature sets. SDE is the Standard
Deviation of the Error and ME is the Mean Error. 73
Table 4.2 Comparison of MAE obtained with by Kurylyak et al. 2013a and our ANN using the
same 21 Extracted features. 82

11
List of Abbreviations
AAMI: Association for the Advancement of Medical Instrumentation
ABP: Arterial Blood Pressure (signal)
ANN: Artificial Neural Network
ANSI: American National Standards Institute
BP: Blood Pressure
BPM: Blood Pressure Monitoring
bpm: beats per minute
BSN: Body Sensor Network
CO: Cardiac Output
DBP: Diastolic Blood Pressure
ECG: Electrocardiogram
EDV: End Diastolic Volume
ESV: End Systolic Volume
FF: Feed-Forward
FFNN: Feed-Forward Neural Network
HBP: High Blood Pressure or hypertension
HR: Heart Rate
mmHg: millimeter of mercury
LR: Linear Regression
MAE: Mean Absolute Error
MAP: Mean Arterial Pressure
ME: Mean Error

12
MLP: a multilayer perceptron
NN: Neural Network
PPG: Photoplethysmogram
PW: Pulse Wave
RF: Random Forest
SBP: Systolic Blood Pressure
SD: Standard Deviation
SDAE: Standard Deviation of Absolute Error
SDE: Standard Deviation of Error
SV: Stroke Volume
SVM: Support Vector Machine

13
Introduction 1
High blood pressure (hypertension) is a major public health issue [1]. It contributes to heart
disease, stroke and kidney failure and premature mortality and disability. Globally, one-third of
deaths are due to cardiovascular disease [2]. Hypertension is responsible for at least 45% of
deaths due to heart disease and 51% of death due to stroke [2]. According to Hypertension
Canada report, 25% of Canadians have hypertension [3]. Consequently, blood pressure
monitoring (BPM) is necessary for diagnosis and management of various health conditions.
There are two major groups of methods used for BPM: invasive and non-invasive. For invasive
BPM, a patient usually has to be hospitalized, and a catheter that is inserted into the artery
measures blood pressure (BP) directly. There are many methods for non-invasive blood pressure
monitoring which are more convenient and carry few risks such as auscultatory, oscillometric,
ultrasonic, unloaded vascular, tonometry, flush, and plethysmography, almost all of which use a
cuff as part of the device [4]. The main issues with current BPM devices are that 1) the cuff is a
demonstrablesourceoferrorduetoconsiderationssuchasapatient’sanxiety due to inflating the
cuff, size incompatibility and improper installation, and 2) all BPM devices are limited in terms
ofapplicability, i.e.wedon’thaveaspecificdevicetouseforallpopulationssuchaspregnant
women, children, the elderly, and obese patients [4]. Additionally, there are many physical and
non-physical factors (e.g. emotional state and posture of a person) that affect BP values even
within a few heartbeats [4]. Therefore, it is in practice not possible to write an analytic equation
which includes all relevant factors for estimating BP accurately. As a result, a possible solution
to overcome some of these limitations such as issues related to the cuff is the use of the Artificial
Neural Network (ANN) which is able to relate outputs (BP estimates) and inputs (arterial pulse
waveform data) without using an analytic formula. Moreover, by relying only on the morphology

14
of the arterial pulse waveform and not on its amplitude, the ANN may provide a way to
implement cuffless BP estimation where the arterial pulse waveform is measured non-invasively
using an appropriate sensor (such as a photoplethysmographic or tonometric sensor). In addition
to eliminating discomfort due to the inflating cuff, a cuffless BP device is highly desirable
clinically because it could allow tracking of BP changes continuously from beat to beat. Such a
development would have a number of applications, including beat-to-beat BP estimation during
surgery, in the intensive care unit (ICU), and during sleep.
The aim of this research study is to design and develop an ANN approach to estimating BP based
on the arterial pulse shape. The arterial pulse wave samples were obtained from normalized
invasive BP waveforms extracted from the online Multi-parameter Intelligent Monitoring in
Intensive Care (MIMIC) database. To test the feasibility of the proposed method, the dataset
used to train and test the ANN included 22 patients with 10 pulse periods each, of whom 11
patients have normal blood pressure and 11 patients have hypertension. A further set of 3
patients (2 with normal pressure and 1 with hypertension) with 10 pulse periods each, and with
whom the ANN had no prior exposure, were also used to test the performance of the method.
The accuracy of the BP estimates obtained with the proposed method was compared with the
requirements of the ANSI/AAMI standard protocol for non-invasive BP devices.
Because the proposed method is ultimately intended to be implemented in the software of a
cuffless BPM device, the computational complexity of the algorithms is one of the
considerations of this research study. Therefore, a multilayer perceptron (MLP), feed-forward
(FF) backpropagation is proposed for the ANN, which compared to other ANN architectures
such as radial basis function, counter propagation, and learning vector quantization, requires a
smaller number of neurons when the training set is large.

15
The structure of this thesis is as follows: Chapter 2 reviews the physiology of blood pressure,
factors that affect blood pressures, methods and devices for blood pressure measurement which
are currently available, and the current issues with these methods and devices. Chapter 3
describes the source of the data used in this work, how the pulse signal is selected,
normalization, interpolation, and feature extraction from the raw signal, and the ANN structure
that was used. Chapter 4 describes the performance of the proposed algorithm and compares the
results with current BP measurement standards as well as with the results of other research
groups. Chapter 5 summarizes the contributions of the thesis, limitations, and future work. A
table showing the estimated and reference blood pressure values in each individual heartbeat
analyzed in this study are provided in the appendix.

16
Literature Review 2
2.1 Background
Blood Pressure (BP) is a vital sign that is defined as the force that blood exerts against the wall
of blood vessels [5, 6]. Measuring BP is important because it is a significant indicator of the
health and function of an individual’s cardiovascular system, as well as an independent risk
factor for stroke, heart attack, blindness and renal diseases [5-9]. By measuring BP, hypertension
can be detected early and treated with changes in lifestyle choices and/or medications to improve
overall health before irreversible damage occurs to any of the relevant organs [5-9]. BP levels
help physicians determine the functional integrity of the cardiovascular system [10], and they are
typically expressed as the ratio of systolic and diastolic pressures. Systolic pressure is the
maximum pressure in the arteries when the heart beats (ventricular contraction), while diastolic
pressure is the minimum pressure in the arteries when the heart is at rest (ventricular relaxation),
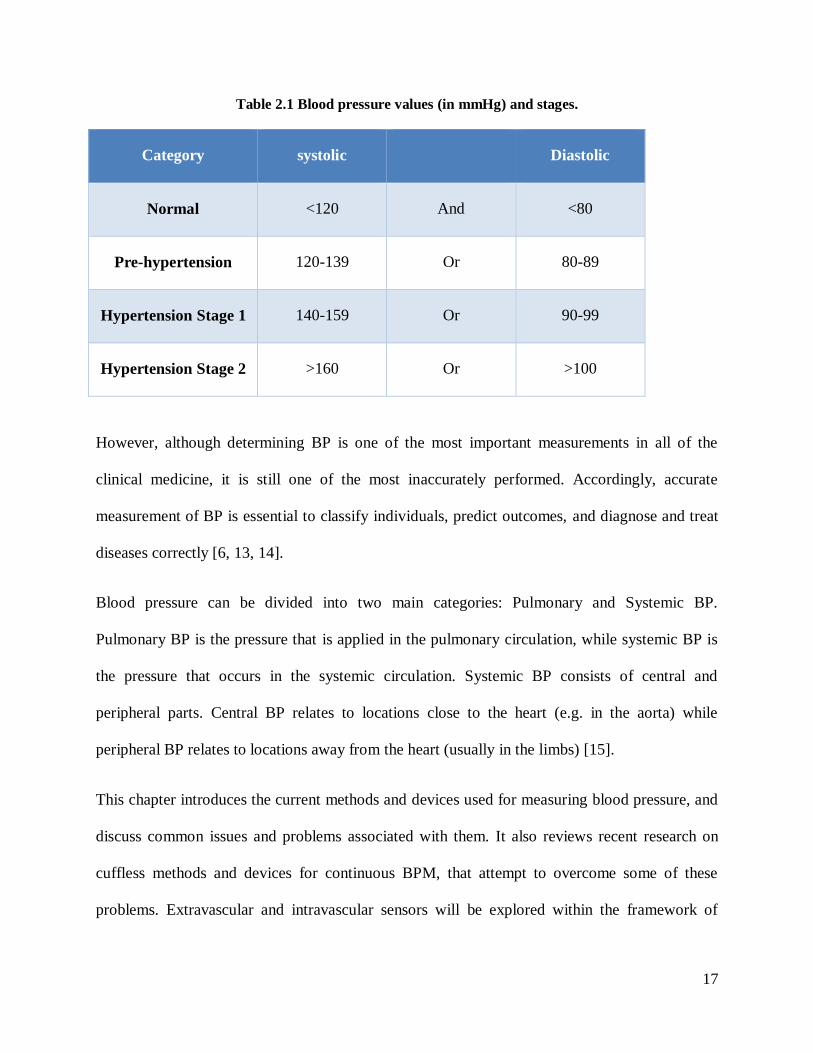
and they are both indicated in millimeters of mercury (mmHg). As shown in Table 2.1,
Hypertension has three stages, the Pre-hypertension stage with the systolic value between 120
and 139 mmHg or diastolic value between 80 and 89 mmHg. Stage 1 Hypertension with systolic
between 140 and 159 or diastolic between 90 and 99 ommHg, and Stage 2 Hypertension with
systolic more than 160 mmHg or diastolic more than 100 mmHg. Based on the World Health
Organization report in 2014, an estimated one fourth of adults worldwide were reported to suffer
from hypertension [11]. It is precisely for this reason that regular monitoring of high blood
pressure (HBP) is essential [5]. In addition, continuous blood pressure monitoring (BPM) would
help in treating other diseases such as aneurysms and spinal cord injury [12].
17
Table 2.1 Blood pressure values (in mmHg) and stages.
Category systolic Diastolic
Normal <120 And <80
Pre-hypertension 120-139 Or 80-89
Hypertension Stage 1 140-159 Or 90-99
Hypertension Stage 2 >160 Or >100
However, although determining BP is one of the most important measurements in all of the
clinical medicine, it is still one of the most inaccurately performed. Accordingly, accurate
measurement of BP is essential to classify individuals, predict outcomes, and diagnose and treat
diseases correctly [6, 13, 14].
Blood pressure can be divided into two main categories: Pulmonary and Systemic BP.
Pulmonary BP is the pressure that is applied in the pulmonary circulation, while systemic BP is
the pressure that occurs in the systemic circulation. Systemic BP consists of central and
peripheral parts. Central BP relates to locations close to the heart (e.g. in the aorta) while
peripheral BP relates to locations away from the heart (usually in the limbs) [15].
This chapter introduces the current methods and devices used for measuring blood pressure, and
discuss common issues and problems associated with them. It also reviews recent research on
cuffless methods and devices for continuous BPM, that attempt to overcome some of these
problems. Extravascular and intravascular sensors will be explored within the framework of
18
invasive techniques. Non-invasive methods such as the auscultatory and oscillometric methods
and their devices will also be discussed.
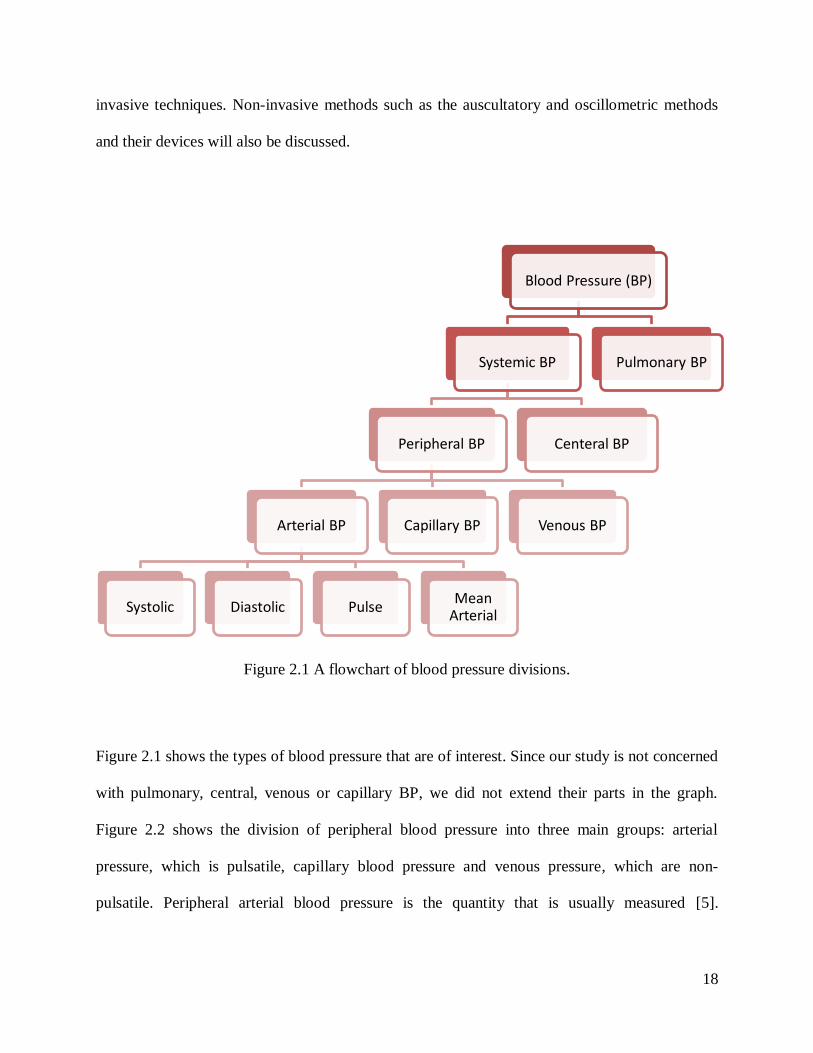
Figure 2.1 A flowchart of blood pressure divisions.
Figure 2.1 shows the types of blood pressure that are of interest. Since our study is not concerned
with pulmonary, central, venous or capillary BP, we did not extend their parts in the graph.
Figure 2.2 shows the division of peripheral blood pressure into three main groups: arterial
pressure, which is pulsatile, capillary blood pressure and venous pressure, which are non-
pulsatile. Peripheral arterial blood pressure is the quantity that is usually measured [5].
Blood Pressure (BP)
Systemic BP
Peripheral BP
Arterial BP
Systolic Diastolic Pulse Mean
Arterial
Capillary BP Venous BP
Centeral BP
Pulmonary BP
19
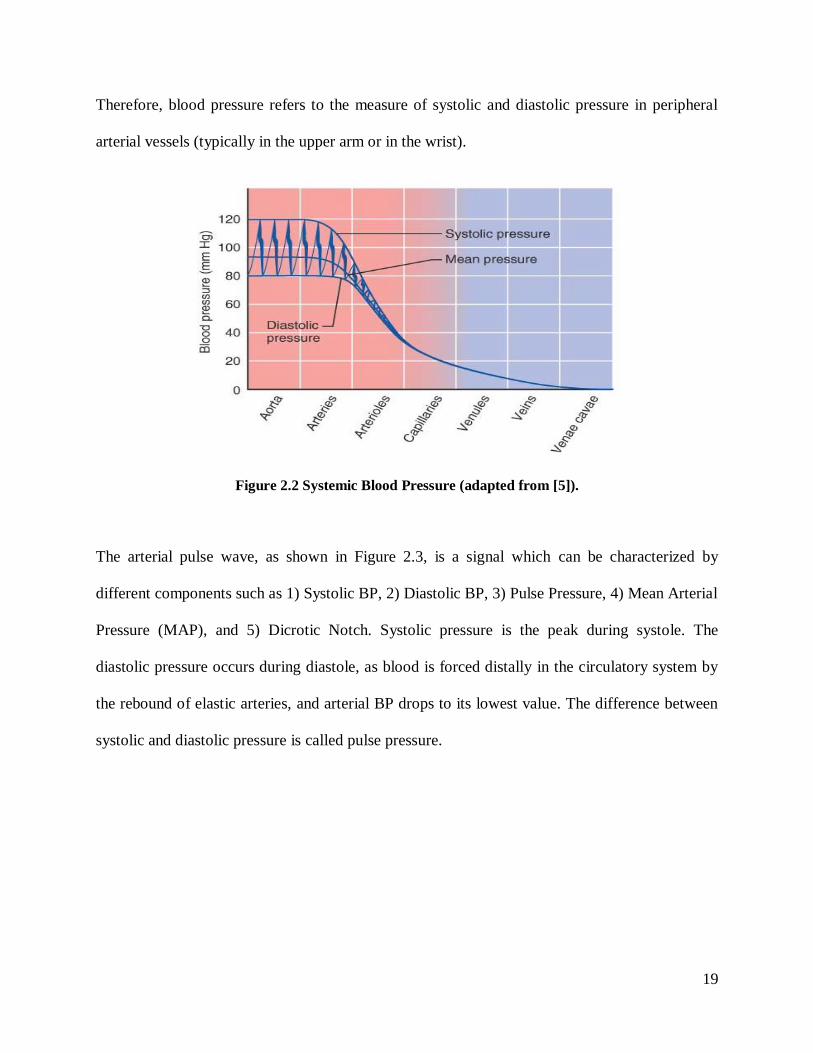
Therefore, blood pressure refers to the measure of systolic and diastolic pressure in peripheral
arterial vessels (typically in the upper arm or in the wrist).
Figure 2.2 Systemic Blood Pressure (adapted from [5]).
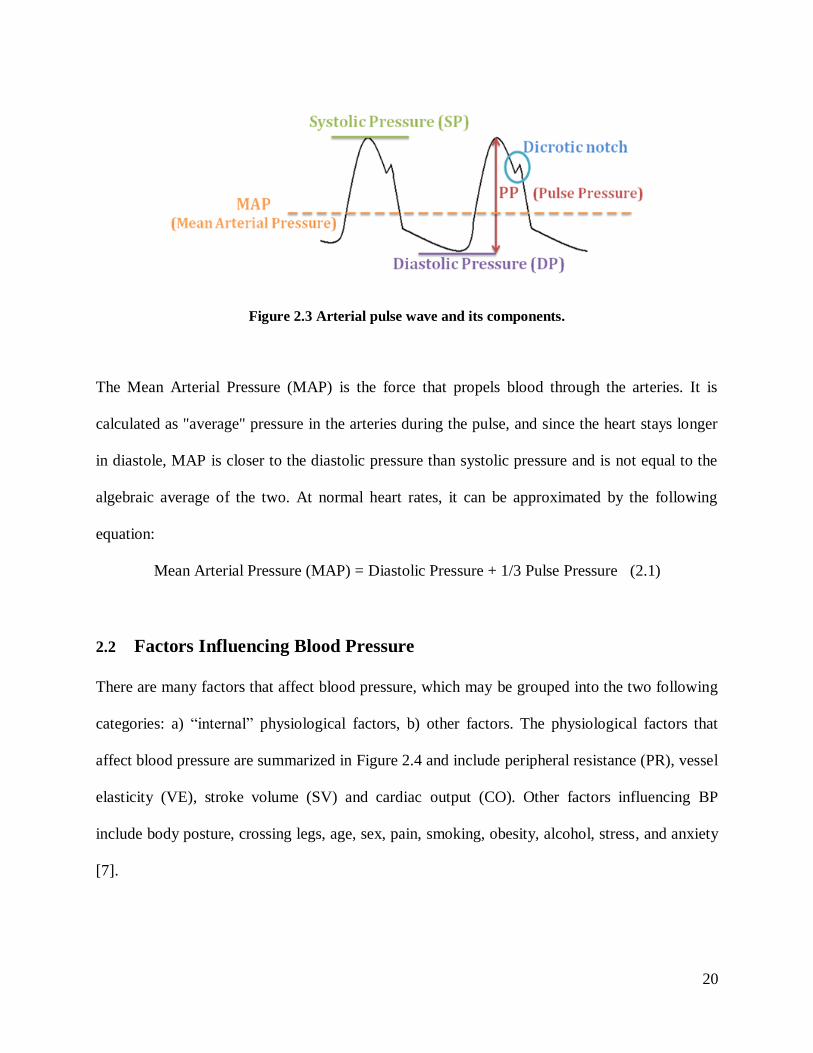
The arterial pulse wave, as shown in Figure 2.3, is a signal which can be characterized by
different components such as 1) Systolic BP, 2) Diastolic BP, 3) Pulse Pressure, 4) Mean Arterial
Pressure (MAP), and 5) Dicrotic Notch. Systolic pressure is the peak during systole. The
diastolic pressure occurs during diastole, as blood is forced distally in the circulatory system by
the rebound of elastic arteries, and arterial BP drops to its lowest value. The difference between
systolic and diastolic pressure is called pulse pressure.
20
Figure 2.3 Arterial pulse wave and its components.
The Mean Arterial Pressure (MAP) is the force that propels blood through the arteries. It is
calculated as "average" pressure in the arteries during the pulse, and since the heart stays longer
in diastole, MAP is closer to the diastolic pressure than systolic pressure and is not equal to the
algebraic average of the two. At normal heart rates, it can be approximated by the following
equation:
Mean Arterial Pressure (MAP) = Diastolic Pressure + 1/3 Pulse Pressure (2.1)
2.2 Factors Influencing Blood Pressure
There are many factors that affect blood pressure, which may be grouped into the two following
categories: a) “internal” physiological factors, b) other factors. The physiological factors that
affect blood pressure are summarized in Figure 2.4 and include peripheral resistance (PR), vessel
elasticity (VE), stroke volume (SV) and cardiac output (CO). Other factors influencing BP
include body posture, crossing legs, age, sex, pain, smoking, obesity, alcohol, stress, and anxiety
[7].

21
Figure 2.4 Physiological factors that affect blood pressure.
2.2.1 Stroke Volume (SV)
Stroke volume depends on the degree of stretch of cardiac muscle by venous return and is equal
to the difference between end diastolic volume (EDV) and end systolic volume (ESV) or
approximately 70 ml [5].
SV= EDV-ESV (2.2)
Anything that influences heart rate or blood volume influences venous return, and hence stroke
volume. If less blood is pumped from the heart with each beat, then blood pressure will be lower
because there is less blood pressing against the vessel walls. Blood volume directly affects end
diastolic volume (EDV) and stroke volume.
Physiological Factors Affecting Blood Pressure
Peripheral Resistance
Blood Diameter
Blood Viscosity
Total Vessel Lenght
Vessel Elasticity Blood Volume Cardiac output
Stroke Volume Heart Rate

22
2.2.2 Cardiac Output (CO)
Cardiac output is the amount of blood pumped out by each ventricle in one minute. Cardiac
output is directly proportional to the blood pressure. Average CO for resting healthy male is
equal to 5 L/min [5].
CO = HR x SV (2.3)
where CO = cardiac output, HR = heart rate, and SV = stroke volume
2.2.3 Heart Rate (HR)
Heart rate is the number of heart beats per minute (bpm). The normal resting heart rate for an
adult is around 75 bpm. As shown in Figure 2.4, there are several factors that influence heart rate
directly such as sympathetic, parasympathetic and chemical regulation [5].
2.2.4 Blood Volume
Blood volume directly affects blood pressure [5]. A greater volume of fluid presses against the
walls of the arteries resulting in greater sustained pressure. Accordingly, a lower volume of fluid
results in less pressure [5].

23
2.2.5 Vessel Elasticity
Blood vessel elasticity also affects blood pressure [5]. A healthy elastic artery expands and
absorbs the shock of systolic pressure. The elastic recoil of the vessel maintains the continued
flow of blood during diastole. An individual with arteriosclerosis suffers from calcified and rigid
arteries, preventing them from expanding as the pulse wave of systolic pressure passes through
the arteries. Consequently, the walls of the artery sustain higher pressures and become weaker.
2.2.6 Peripheral Resistance
One of the main factors that affect blood pressure is peripheral resistance [5]. Blood cells and
plasma encounter resistance when they come into contact with blood vessel walls. If resistance
increases, more pressure is needed to keep blood flowing. Three main sources of peripheral
resistance are, blood vessel diameter, blood viscosity, and total vessel length, which can be
formulated as below [5]:
R=8𝐿η
𝜋𝑟4 (2.4)
where η=viscosity,L=lengthofabloodvessel,r=insideradiusofabloodvessel

24
2.2.7 Blood Viscosity
The hematocrit is the percentage of red blood cells in the total blood volume. It affects blood
viscosity and resistance to flow. The more viscous the blood, the greater resistance it encounters
and the higher the blood pressure. The opposite holds true as well [5].
2.2.8 Vessel Length
Total vessel length directly affects peripheral resistance [5]. Increased fatty tissue requires more
blood vessels to service it and adds to the total vessel length in the body [5].
2.2.9 Vessel Diameter
As shown in Equation 2.4, resistance varies inversely with the fourth power of the vessel radius
(one-half the diameter, with the same volume). A smaller vessel diameter results in a greater
amount of fluid to come into contact with the vessel’swall increasing resistanceandpressure.
Vessel diameter is actively regulated by vasomotor fibers, sympathetic nerve fibers that
innervate the vessel's smooth muscle layer, causing constriction and dilation of blood vessels and
in turn an increase or decrease in blood pressure respectively [5]. Norepinephrine, epinephrine,
angiotensin II and vasopressin are chemicals which affect the blood vessel diameter (Figure 2.4)
[5].

25
2.3 Blood Pressure Measurement Methods
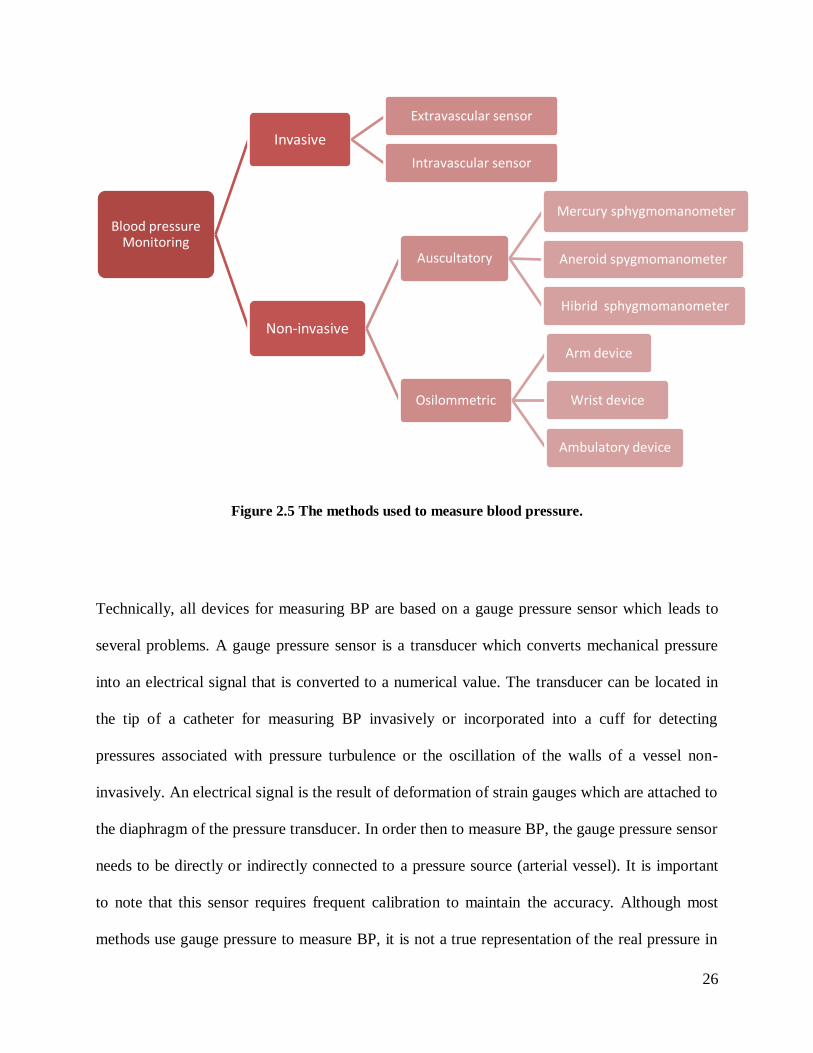
As illustrated in Figure 2.5, there are two different types of methods for blood pressure
monitoring: namely invasive and non-invasive methods [16]. The invasive method may be
divided into two categories. The first is the catheter system, which is comprised of extra-vascular
or intra-vascular pressure sensors, and the second concerns an implantable system, consisting of
extra-arterial or intra-arterial sensors.
Although invasive techniques produce the most accurate results, the patient usually has to be
hospitalized and a catheter is inserted into the artery which measures BP directly [16]. Therefore,
non-invasive BPM is usually used instead for more routine monitoring. There are several
methods for non-invasive blood pressure monitoring, such as auscultatory, oscillometry,
palpation, ultrasonic, photoplethysmography, tonometry, pulse wave velocity, vascular
unloading, and volume oscillometric [16]. Among these, the auscultatory and oscillometry
methods are the most commonly used.
26
Figure 2.5 The methods used to measure blood pressure.
Technically, all devices for measuring BP are based on a gauge pressure sensor which leads to
several problems. A gauge pressure sensor is a transducer which converts mechanical pressure
into an electrical signal that is converted to a numerical value. The transducer can be located in
the tip of a catheter for measuring BP invasively or incorporated into a cuff for detecting
pressures associated with pressure turbulence or the oscillation of the walls of a vessel non-
invasively. An electrical signal is the result of deformation of strain gauges which are attached to
the diaphragm of the pressure transducer. In order then to measure BP, the gauge pressure sensor
needs to be directly or indirectly connected to a pressure source (arterial vessel). It is important
to note that this sensor requires frequent calibration to maintain the accuracy. Although most
methods use gauge pressure to measure BP, it is not a true representation of the real pressure in
Blood pressure Monitoring
Invasive
Extravascular sensor
Intravascular sensor
Non-invasive
Auscultatory
Mercury sphygmomanometer
Aneroid spygmomanometer
Hibrid sphygmomanometer
Osilommetric
Arm device
Wrist device
Ambulatory device

27
the arteries. Measuring gauge pressure is an indirect method to characterize the actual
physiological forces that are due to the pumping of the heart. Consequently, current methods are
often unreliable and must be frequently validated according to certain standards [17, 18] in order
to maintain the accuracy [13]. Moreover, measurement accuracy depends on several significant
factors which must be considered by physicians during the measurement such as posture and cuff
size. Another problem with all available methods and devices is that each of them services a
limited client base when measuring BP. For example, the oscillometric method, which is the
most popular method used in automated devices, is not suitable for elderly and arrhythmia
patients [6]. Currently, there is not one unique device that may be used for all patients with
varying medical concerns, such as patients with hypertension or arrhythmia, elderly patients,
pregnant women, and children.
2.4 Invasive Methods
With the invasive catheter method, the physician gains access to the artery by inserting a catheter
inside it. Depending on the location of the pressure sensor, the catheter system can be divided
into two types: extra-vascular or intra-vascular sensor system. In an extra-vascular sensor
system, which is the most common clinical method, physicians connect the vascular pressure to
an extra sensor element by using a liquid-filled catheter. On the other hand, in the intra-vascular
pressure sensor, a pressure transducer is in the tip of the catheter and there is no need for liquid
connection [10].
Although the invasive catheter method is considered the gold standard for blood pressure
measurement, it is not routinely used because of several complications associated with it.

28
Consequently, it has been restricted to some surgical procedures, ICU monitoring, and some
research applications. Complications with this method include the following:
1. Radial artery thrombosis: The catheter can cause artery thrombosis in up to 35% of the
patients [19].
2. Pseudoaneurysm formation: Cannulation of the radial and dorsalis pedis arteries causes
pseudoaneurysm formation more often compared to larger vessels [19].
3. Exsanguination: The unexpected disconnection of catheter tubing and pseudoaneurysm
rupture may cause significant bleeding [19].
4. Peripheral nerve damage: This may occur from insertion direct trauma or by compression
of the median nerve or brachial plexus by hematoma [19].
5. Distal artery vasoconstriction: It could minimize the measured BP leading to
inappropriate use of vasopressors during shock [20].
6. Infection: Between 5 to 40% of patients experience infection at the insertion site as a
result of sampling port contamination [20].
7. Increased cost: Invasive techniques are expensive as opposed to more affordable non-
invasive counterparts. Because invasive methods require surgical cut-down or
percutaneous insertion, the patient needs to be held under hospital care [10].
2.4.1 Extravascular Sensor Method
In this system, there is a hydraulic connection via the catheter between the source of pressure and
the sensor element. The catheter, which is filled with a saline-heparin solution, must be flushed

29
with this solution every few minutes to prevent blood clotting at the tip. The following are
common issues associated with this method [10]:
1. Blood clotting inside the vessel as a result of high temperature.
2. Electric (signal) drift as a result of tissue attachment or change of catheter position.
3. Fragility of the catheter.
4. Destructive sterilization is required.
5. Time delay and low frequency response as a result of the hydraulic connection between
the pressure source and the sensor.
2.4.2 Intravascular Sensor Method
In this system, there is no hydraulic connection. The strain gauge has a flexible diaphragm which
is used as a sensor at the tip of the catheter. Although it has fewer complications than
extravascular sensor systems, the catheter may break after a few uses. This increases the cost per
use making it more expensive than other BPM methods [10]
2.5 Non-invasive Methods
A typical system for a non-invasive BPM has a pressure transducer and an occlusive cuff which
inflates to indirectly close the artery and then deflates. Pressure detection may be performed by a
sphygmomanometer which can be mercury-based, aneroid-based, or use an electronic circuit in
automated devices [10].

30
There are a number of techniques for non-invasive BPM such as auscultatory, oscillometry,
ultrasonic, vascular unloading, and photoplethysmography. These methods have several
shortcomings including:
1. They are less accurate than the invasive method [21]: The discrepancy between Korotkoff
auscultatory measurements and intra-arterial readings may be as much as 25 mmHg [22].
2. They are not applicable for all patients: Non-invasive BP can be inaccurate among
overweight and/or critically ill patients leading to erroneous interpretations of blood
pressure [23].
3. They require frequent calibration: Each of the non-invasive devices, with the exception of
mercury-based devices, need to be calibrated at least twice a year. Moreover, for
calibrations, the devices need to be sent to the manufacturer. This procedure is not
commonly performed in practice.
4. Incorrect cuff size is a major source of error [6, 7, 24-27]. An inflatable cuff bladder that
is too narrow or too short will result in an incorrect BP reading [7]. Surveys have
demonstrated that 96% of primary care physicians habitually use a cuff size that is
smaller than it should be, and 25% do not even have a large cuff available.[13, 28], even
though measurement errors tend to be smaller with larger cuffs [29].
5. Incorrect cuff placement [6, 13, 24-26]. It is necessary to place the cuff at the mid-point
between the shoulder and elbow.
6. Inappropriate rates of cuff deflation contribute to error [24-26, 30].
7. Not able to measure BP continuously [31, 32].
8. Potentially lead to bruising: The use of cuff devices can cause petechiae and hematomas
[33].

31
9. They are subject to the White Coat effect: All non-invasive BP devices can cause the
White Coat effect, where the individual’s BP increases artificially in the presence of
clinical personnel.
10. Anxiety: Inflating the cuff causes increased tension on muscles that forces the closure of
the artery. This is especially the case in patients suffering from hypertension, and more
specifically, in an ambulatory setting whereby the BP device is attached to the person for
24 hours. It can also be uncomfortable when the subject is asleep as cuff inflation and
deflation can interrupt sleep [34, 35].
11. Proper training for the caregiver or device monitor is required: It is necessary to have a
trained individual using the device so as to obtain accurate BPM whether it is used
clinically or at home [36].
12. There is typically a digit preference for numbers ending in a 5 or 0 [30].
13. With the exception of the mercury sphygmomanometer, there are differences in the
accuracy of different brands [6]. Some devices available on the market do not pass
accuracy protocol or validation standards [14, 37].
32
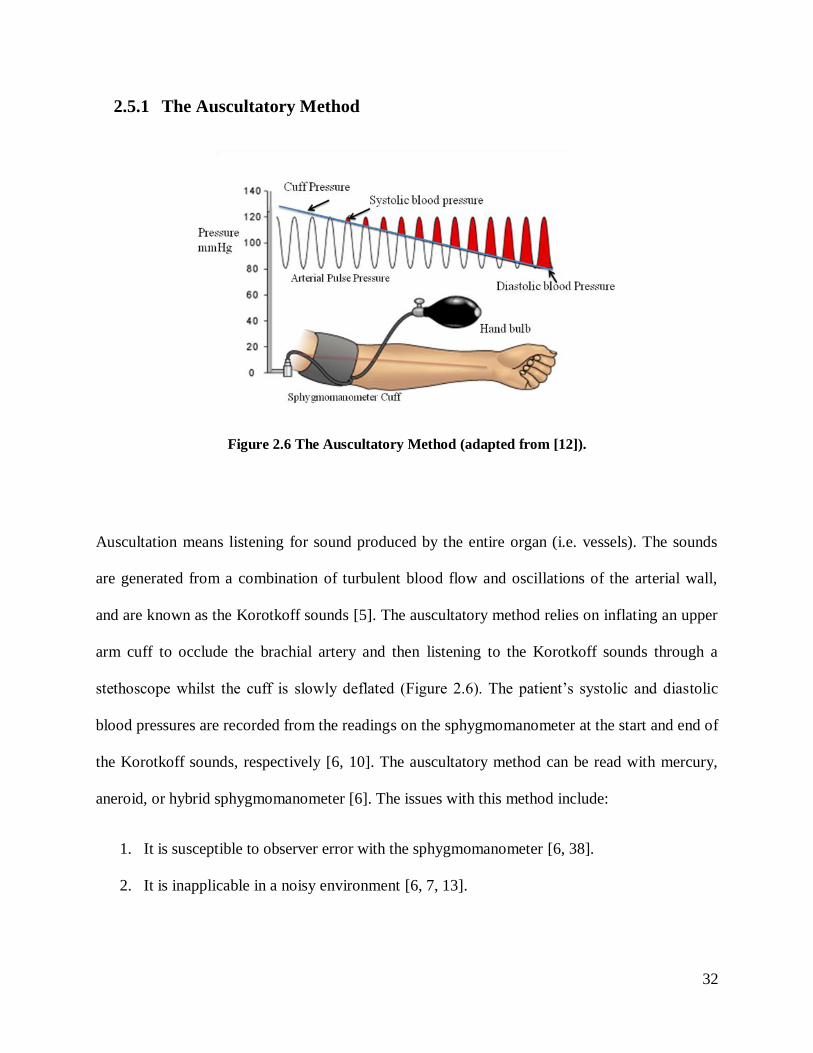
2.5.1 The Auscultatory Method
Figure 2.6 The Auscultatory Method (adapted from [12]).
Auscultation means listening for sound produced by the entire organ (i.e. vessels). The sounds
are generated from a combination of turbulent blood flow and oscillations of the arterial wall,
and are known as the Korotkoff sounds [5]. The auscultatory method relies on inflating an upper
arm cuff to occlude the brachial artery and then listening to the Korotkoff sounds through a
stethoscopewhilst the cuff is slowly deflated (Figure 2.6).The patient’s systolic and diastolic
blood pressures are recorded from the readings on the sphygmomanometer at the start and end of
the Korotkoff sounds, respectively [6, 10]. The auscultatory method can be read with mercury,
aneroid, or hybrid sphygmomanometer [6]. The issues with this method include:
1. It is susceptible to observer error with the sphygmomanometer [6, 38].
2. It is inapplicable in a noisy environment [6, 7, 13].

33
3. It is difficult to hear the sound in some conditions (e.g. in older patients who have an
auscultatory gap) [6], and is also not suitable for children under the age of five [7].
4. It underestimates systolic BP and overestimates diastolic BP [23], especially for obese
patients [39, 40].
Mercury Sphygmomanometers
The mercury sphygmomanometer (Figure 2.7)isthe‘goldstandard’fornon-invasive BPM. This
includes a mercury manometer, an upper arm cuff, and a manual inflation bulb with a pressure
control valve. It also requires the use of a stethoscope to listen to the Korotkoff sounds [8, 41].
Apart from the issues that are common with all auscultatory methods, the main issue with this
device is that it contains mercury, which is toxic and so associated with disposal problems [6, 8,
25]
Figure 2.7 An example of Mercury Sphygmomanometer.
34
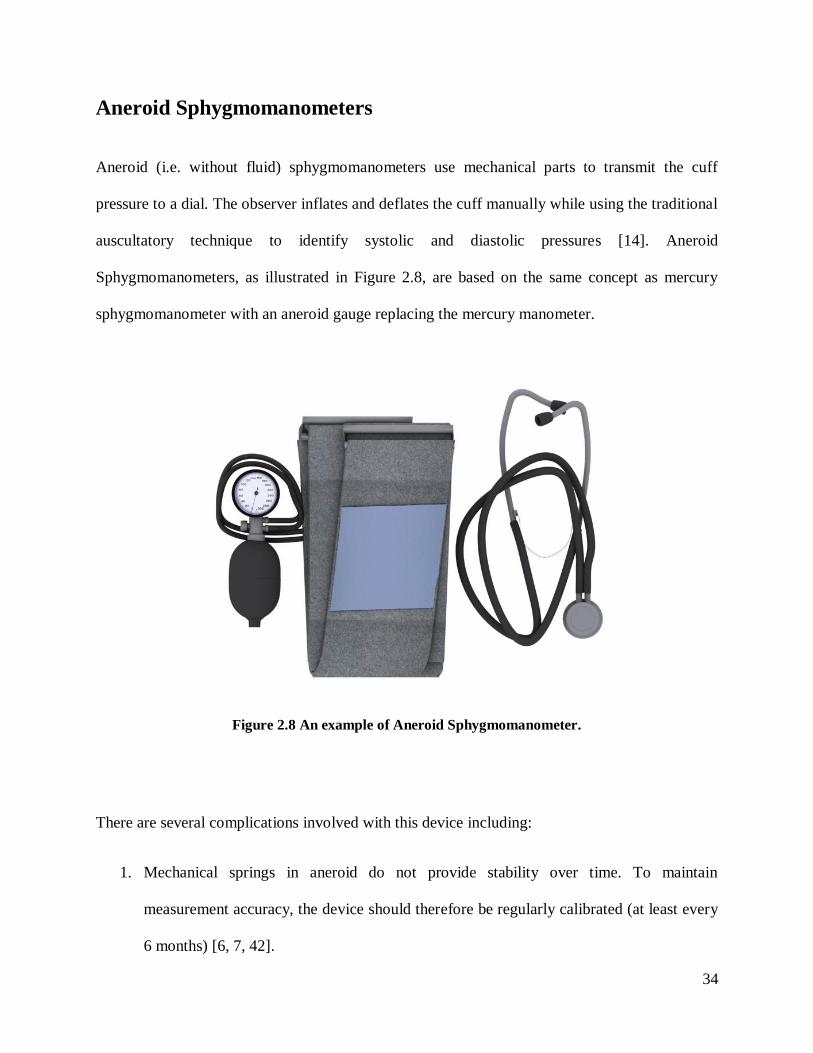
Aneroid Sphygmomanometers
Aneroid (i.e. without fluid) sphygmomanometers use mechanical parts to transmit the cuff
pressure to a dial. The observer inflates and deflates the cuff manually while using the traditional
auscultatory technique to identify systolic and diastolic pressures [14]. Aneroid
Sphygmomanometers, as illustrated in Figure 2.8, are based on the same concept as mercury
sphygmomanometer with an aneroid gauge replacing the mercury manometer.
Figure 2.8 An example of Aneroid Sphygmomanometer.
There are several complications involved with this device including:
1. Mechanical springs in aneroid do not provide stability over time. To maintain
measurement accuracy, the device should therefore be regularly calibrated (at least every
6 months) [6, 7, 42].

35
2. It is susceptible to mechanical damage, especially when dropped [6].The frequency of
defective devices in use can reach up to 35% [43-45].
3. It is less accurate than Mercury Sphygmomanometers [6, 42].
4. The accuracy of the manometers varies greatly from one manufacturer to another [6] with
a range of inaccuracy from 1-44% [45-47].
Hybrid Sphygmomanometer
Hybrid devices combine both oscillometric (automated) and auscultatory (manual) features in a
mercury-free device (Figure 2.9) [48]. The key feature is that the mercury column is replaced by
an electronic pressure gauge similar to that in oscillometric devices. There are two types of
hybrid sphygmomanometers. In the first, blood pressure is measured in the same way as mercury
or aneroid devices. Applying the auscultatory method, the observer proceeds to use a
stethoscope and listens to the Korotkoff sounds. The cuff pressure can be shown as a simulated
mercury column, a digital readout, or as a simulated aneroid display. It can also be switched to
the automatic oscillometric method. The second type consists of a button next to the deflation
knobthatispressedattheoperator’scommandattimepointscorrespondingtotheKorotkoff
sounds, which then freezes the digital display to show systolic and diastolic pressures. This has
the potential to minimize terminal digit preference, which is a major source of error with the
auscultatory method. The hybrid sphygmomanometer has the potential to become a replacement
of mercury because it combines some of the best features of both mercury and electronic devices.

36
Figure 2.9 An example of Hybrid Sphygmomanometer.
The disadvantages of these devices are as follows:
1. They are expensive [42]
2. They have not yet been fully validated.[4]
3. They underestimate BP, because of the delayed observer reaction and recognition time [6,
42, 48-50].
37
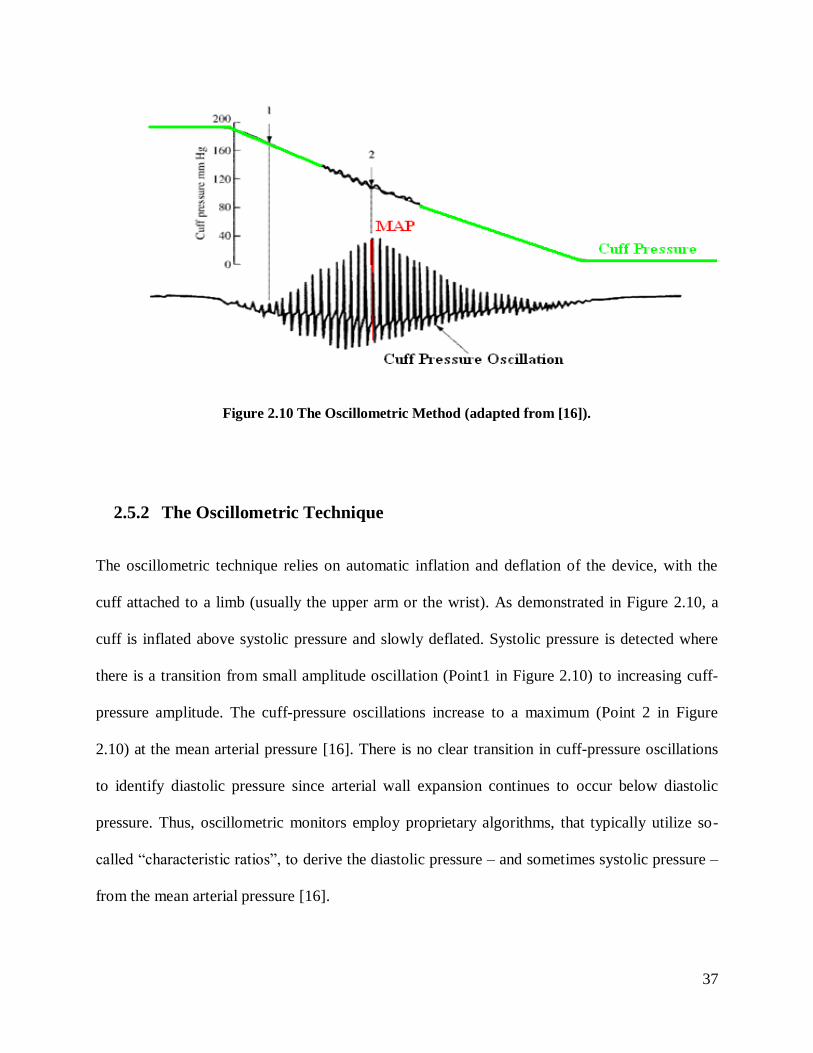
Figure 2.10 The Oscillometric Method (adapted from [16]).
2.5.2 The Oscillometric Technique
The oscillometric technique relies on automatic inflation and deflation of the device, with the
cuff attached to a limb (usually the upper arm or the wrist). As demonstrated in Figure 2.10, a
cuff is inflated above systolic pressure and slowly deflated. Systolic pressure is detected where
there is a transition from small amplitude oscillation (Point1 in Figure 2.10) to increasing cuff-
pressure amplitude. The cuff-pressure oscillations increase to a maximum (Point 2 in Figure
2.10) at the mean arterial pressure [16]. There is no clear transition in cuff-pressure oscillations
to identify diastolic pressure since arterial wall expansion continues to occur below diastolic
pressure. Thus, oscillometric monitors employ proprietary algorithms, that typically utilize so-
called“characteristicratios”,toderive the diastolic pressure – and sometimes systolic pressure –
from the mean arterial pressure [16].

38
There are several issues involving this method, including the following:
1. The oscillometric method can accurately detect mean arterial pressure, but the estimation
of systolic and diastolic is indirect and so is usually less accurate [51].
2. This technique is based on amplitude of the oscillation of the vessel wall which depends
on various factors other than BP, specifically the stiffness of the arteries [6]. BP is
significantly under-estimated in older people with stiff arteries and wide pulse pressures
[52].
3. The algorithm for calculating systolic and diastolic pressures differs between devices and
is not shared by the manufacturers.
4. There isaspecific“bleedrate”accordingtoeachmanufacture, which presumes a pulse
between bleed steps in order to determine systolic and diastolic pressure [6].
5. Gender is an important factor in the accuracy in oscillometric method; oscillometric
pressures accurately estimate diastolic BP in women, yet overestimate diastolic BP in
men and underestimate systolic BP in both sexes [6].
6. This method is inaccurate in peripheral circulatory disorders, arrhythmias, [9, 23],
diabetes, and many hypertensive /hypotensive patients.
7. There are many automated BPM devices that are readily available on the market, yet only
a portion of them have been independently validated [17, 53].
8. This device is very sensitive to motion artifacts, and so cannot be used during physical
activity [6].
39
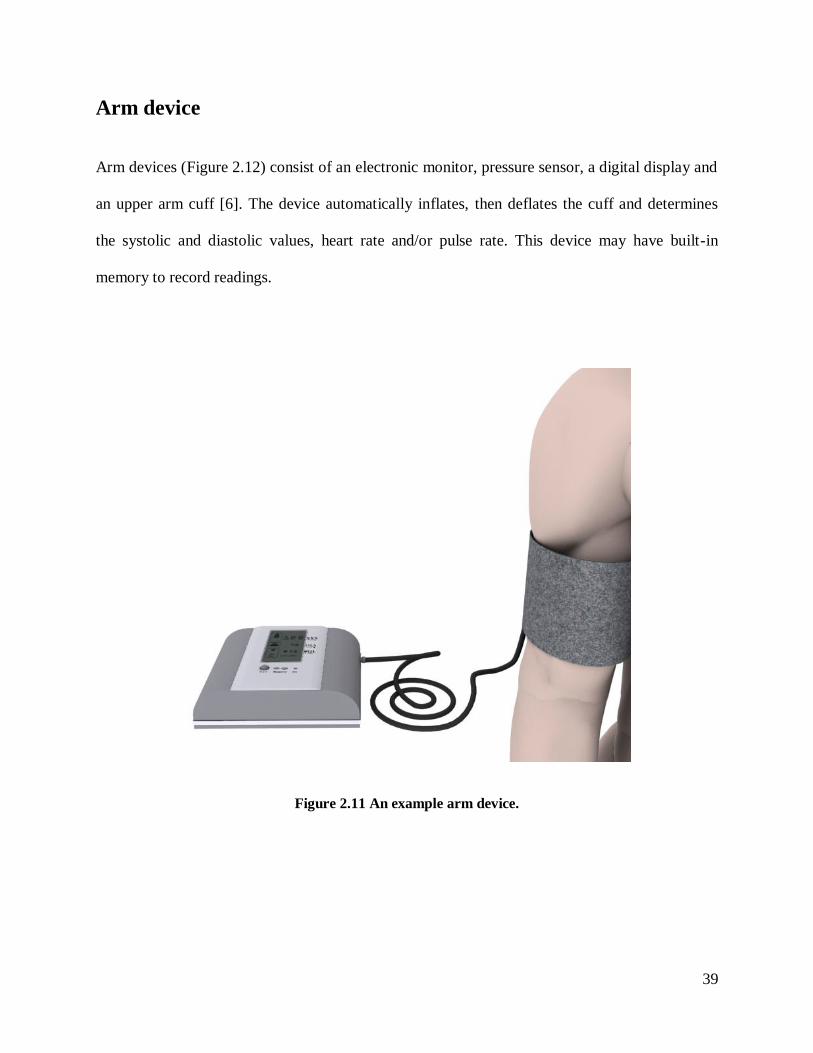
Arm device
Arm devices (Figure 2.12) consist of an electronic monitor, pressure sensor, a digital display and
an upper arm cuff [6]. The device automatically inflates, then deflates the cuff and determines
the systolic and diastolic values, heart rate and/or pulse rate. This device may have built-in
memory to record readings.
Figure 2.11 An example arm device.
40
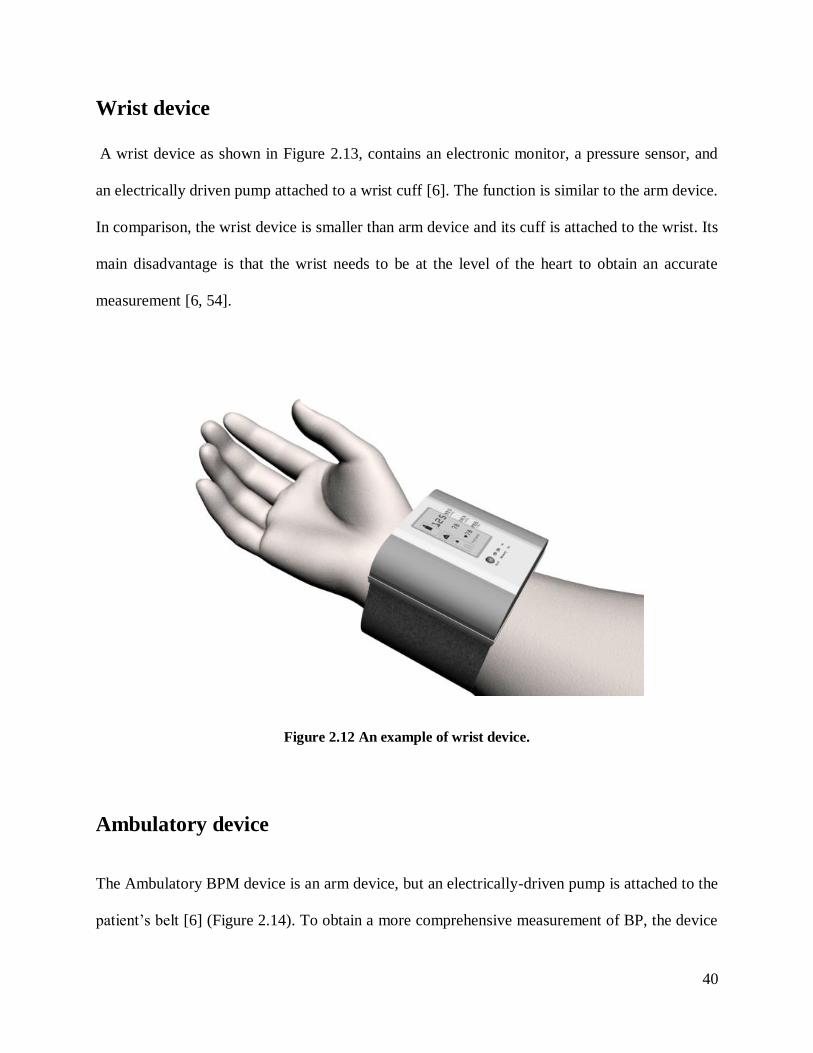
Wrist device
A wrist device as shown in Figure 2.13, contains an electronic monitor, a pressure sensor, and
an electrically driven pump attached to a wrist cuff [6]. The function is similar to the arm device.
In comparison, the wrist device is smaller than arm device and its cuff is attached to the wrist. Its
main disadvantage is that the wrist needs to be at the level of the heart to obtain an accurate
measurement [6, 54].
Figure 2.12 An example of wrist device.
Ambulatory device
The Ambulatory BPM device is an arm device, but an electrically-driven pump is attached to the
patient’sbelt[6] (Figure 2.14). To obtain a more comprehensive measurement of BP, the device
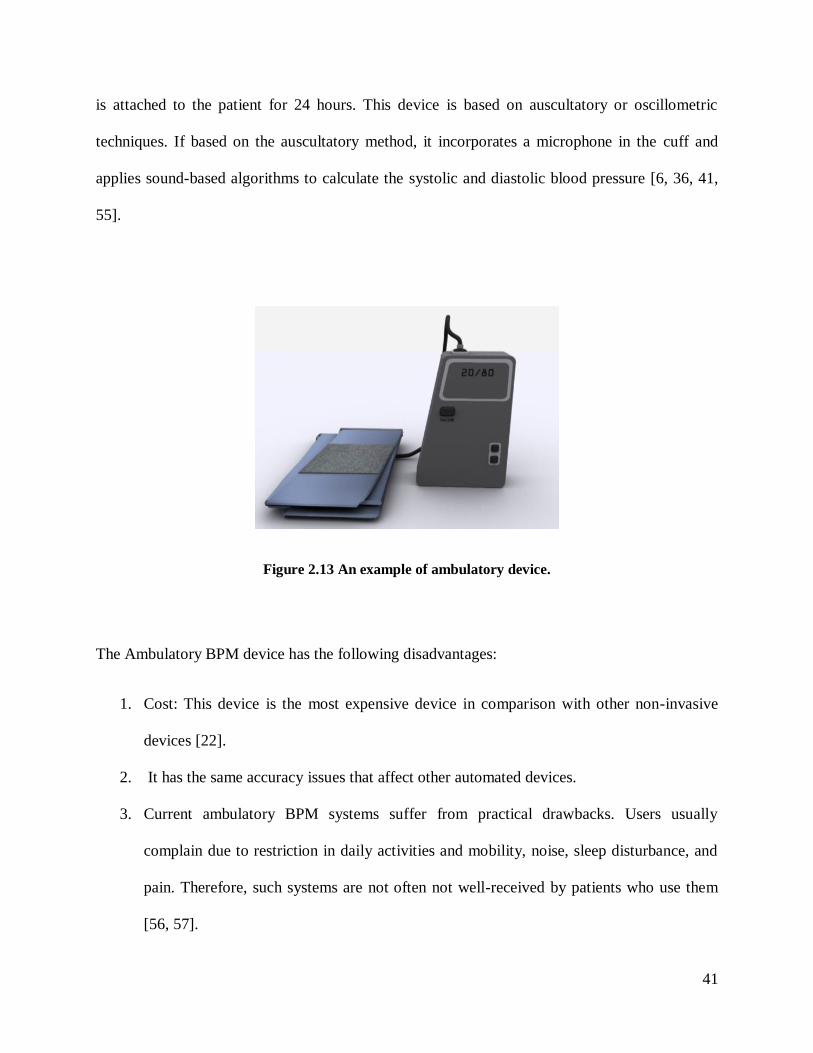
41
is attached to the patient for 24 hours. This device is based on auscultatory or oscillometric
techniques. If based on the auscultatory method, it incorporates a microphone in the cuff and
applies sound-based algorithms to calculate the systolic and diastolic blood pressure [6, 36, 41,
55].
Figure 2.13 An example of ambulatory device.
The Ambulatory BPM device has the following disadvantages:
1. Cost: This device is the most expensive device in comparison with other non-invasive
devices [22].
2. It has the same accuracy issues that affect other automated devices.
3. Current ambulatory BPM systems suffer from practical drawbacks. Users usually
complain due to restriction in daily activities and mobility, noise, sleep disturbance, and
pain. Therefore, such systems are not often not well-received by patients who use them
[56, 57].

42
The following table summarizes the main issues associated with current methods for blood
pressure monitoring.
43
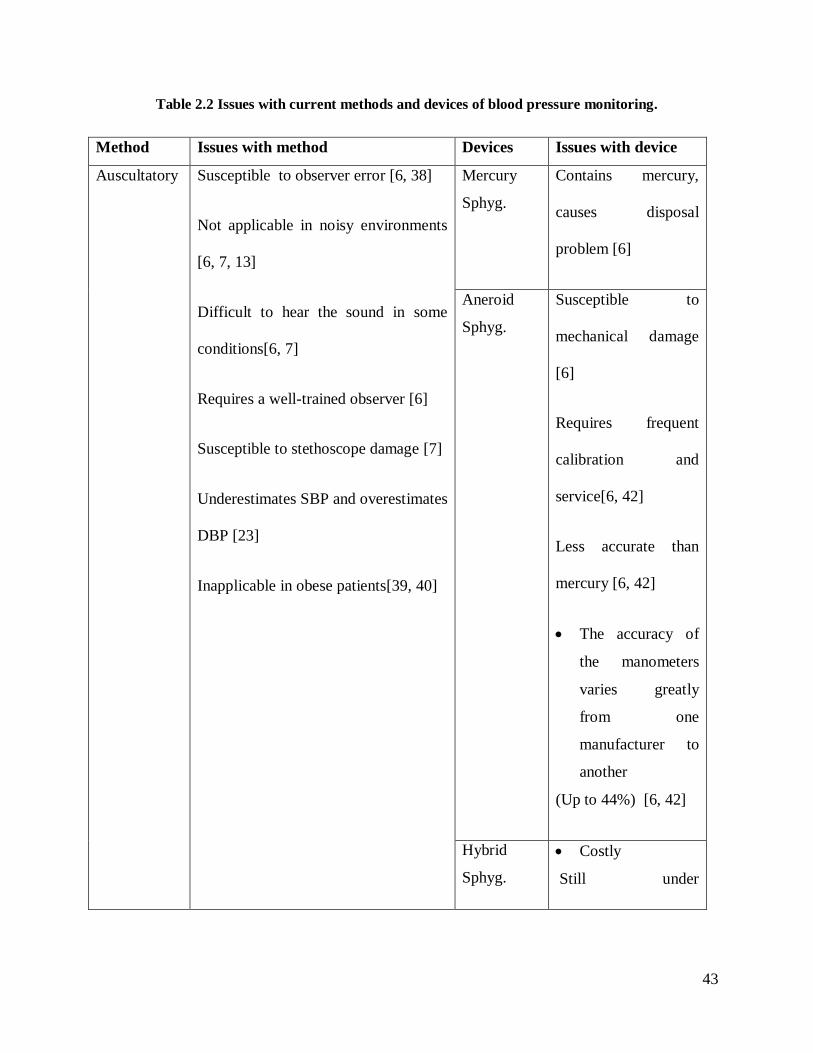
Table 2.2 Issues with current methods and devices of blood pressure monitoring.
Method Issues with method Devices Issues with device
Auscultatory
Susceptible to observer error [6, 38]
Not applicable in noisy environments
[6, 7, 13]
Difficult to hear the sound in some
conditions[6, 7]
Requires a well-trained observer [6]
Susceptible to stethoscope damage [7]
Underestimates SBP and overestimates
DBP [23]
Inapplicable in obese patients[39, 40]
Mercury
Sphyg.
Contains mercury,
causes disposal
problem [6]
Aneroid
Sphyg.
Susceptible to
mechanical damage
[6]
Requires frequent
calibration and
service[6, 42]
Less accurate than
mercury [6, 42]
The accuracy of
the manometers
varies greatly
from one
manufacturer to
another
(Up to 44%) [6, 42]
Hybrid
Sphyg.
Costly
Still under

44
Oscillometric Very sensitive to motion artifact
Not suitable for all patients (i.e
arrhythmias, pre-eclampsia, diabetes,
prepubertal children, and hypertensive
/hypotensive and for the elderly) [6]
Difficult to calibrate
Individual calibration is needed
Underestimates SBP and
Overestimates DBP [23]
Originally designed for home use
Because of variety of algorithms
for measurement, the accuracy of
the method varies greatly from one
manufacturer to another
Needs well trained observers
The bladders deflate at a
manufacturer-specific“bleedrate,”
which assumes a regular pulse
between bleed steps as part of the
algorithms used to determine
systolic and diastolic pressure
investigation[6]
Underestimates BP
[6]
wrist Less accurate than
arm device [6]
Should be at the heart
level, during
measurement [6]
Ambulatory Costly
Not convenient [36]
Restriction in
everyday activities
and mobility, noise,
sleep disturbance, and
pain [22, 56]

45
2.6 Cuffless blood pressure estimation methods
Two of the main disadvantages of conventional BPM devices are that they can be uncomfortable
to use and they do not continuously provide estimates of blood pressure. Therefore the goal of
developing cuffless devices is motivated by the fact that hypertension still remains poorly
managed globally [58, 59]. Cuffless devices are still in the development stage and there are
several research groups working since 2000 to design and implement a method/device to non-
invasively and continuously measure blood pressure without cuff [59-64].
The most common cuffless BPM methods are based on 3 main related parameters; the
measurement of pulse wave velocity (PWV), pulse transit time (PTT), and pulse arrival time
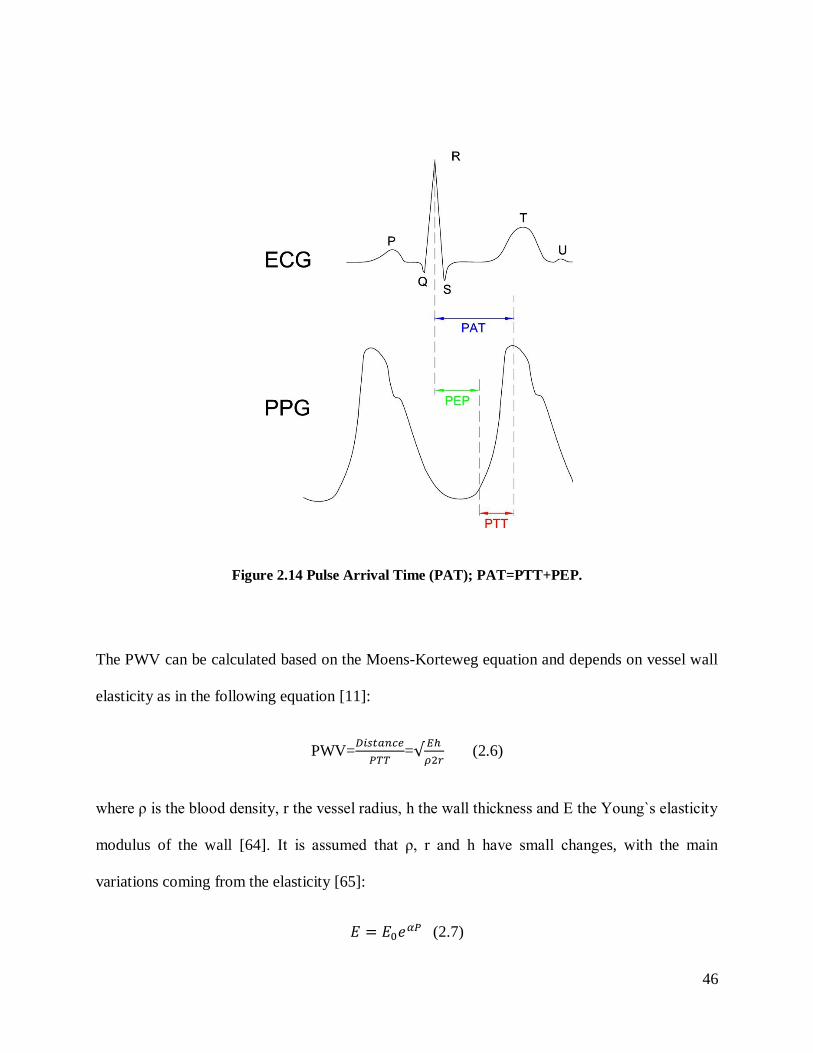
(PAT). The pulse arrival time (PAT) defins as the time-delay between the R-peak of the QRS
complex from the ECG and the arrival of the arterial pulse wave at a peripheral point in the
arterial system [59, 60, 62 and 63]. As shown in Figure 2.15, the PAT is the summation of the
pre-ejection period (PEP) with the pulse transit time (PTT).
PAT= PEP + PTT (2.5)
PAT and PTT are typically measured with the Electrocardiogram (ECG) and
photoplethysmography (PPG). The PEP is the duration of the iso-volumetric ventricle
contraction up to the aortic valve opening and is a non-constant additive delay, which changes
rapidly in response to stress, emotion and physical effort [60-63]. The PTT is measured as the
time interval from the R-peak to a characteristic point at a predetermined threshold on the
photoplethysmographic (PPG) pulse of the same cardiac cycle [60]. The PTT is the true transit
time of the pulse along the arterial wall over a long non-homogeneous vascular path.
46
Figure 2.14 Pulse Arrival Time (PAT); PAT=PTT+PEP.
The PWV can be calculated based on the Moens-Korteweg equation and depends on vessel wall
elasticity as in the following equation [11]:
PWV=𝐷𝑖𝑠𝑡𝑎𝑛𝑐𝑒
𝑃𝑇𝑇=√
𝐸ℎ
𝜌2𝑟 (2.6)
whereρistheblooddensity,rthevesselradius,hthewallthicknessandEtheYoung`selasticity
modulus of the wall [64]. It is assumed that ρ, r and h have small changes, with the main
variations coming from the elasticity [65]:
𝐸 = 𝐸0𝑒𝛼𝑃 (2.7)
47
where E is the elasticity,αisaconstantnumbertypicallytakenas0.017 mmHg, and P is blood
pressure. The combination of Young`s module and the Moens-Korteweg equation leads to the
following form [66]:
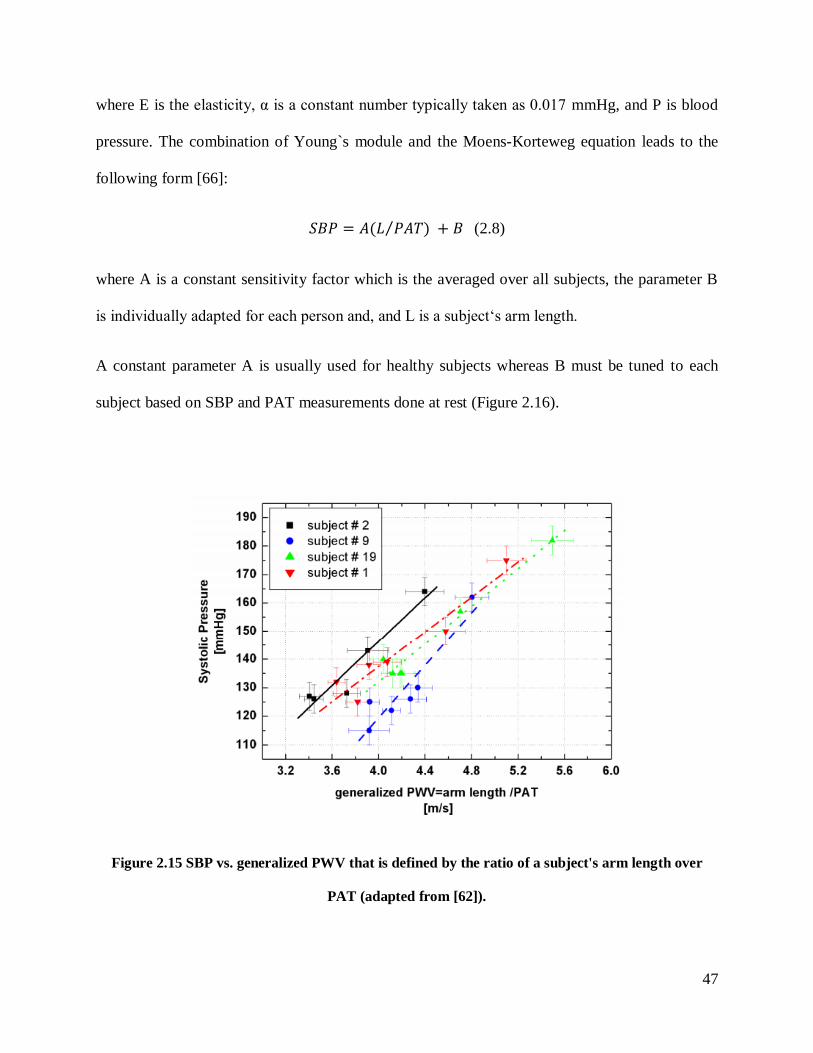
𝑆𝐵𝑃 = 𝐴(𝐿 𝑃𝐴𝑇)⁄ + 𝐵 (2.8)
where A is a constant sensitivity factor which is the averaged over all subjects, the parameter B
isindividuallyadaptedforeachpersonand,andLisasubject‘sarmlength.
A constant parameter A is usually used for healthy subjects whereas B must be tuned to each
subject based on SBP and PAT measurements done at rest (Figure 2.16).
Figure 2.15 SBP vs. generalized PWV that is defined by the ratio of a subject's arm length over
PAT (adapted from [62]).
48
2.6.1 Applications
These cuffless methods have been applied in different devices such as wireless and wearable
Body Sensor Networks (BSN), in personal digital assistants (PDA), or in a wristwatch and have
been used to transfer the data to health care centers for 24/7 continuous monitoring of blood
pressure [59-63, 67-69].
2.6.2 Limitations
A main problem with this technique is that it cannot measure or estimate diastolic BP. Therefore,
it is not realistic for clinical use especially for hypertension patients who have high diastolic
pressure [61-63, 69]. There are also accuracy problems with this method as it does not achieve
the requirements of standards protocols such as ANSI/AAMI for SBP [59, 60, 67].
Another limitation of this method is that it makes many assumptions that may not be correct and
so contribute to the inaccuracy. For example, the method assumes that the PEP is constant which
is not correct. Muehlsteff et al., 2006 shows that an accurate value of PEP is important especially
during physical activity and can substantially change the estimate of SBP [62]. Additionally the
parameters ρ, r and h are also different in different individuals. For this reason, individual
calibration is also needed, but this requires developing an appropriate method for calibration,
which is not available yet. Furthermore, this method is not always convenient because it requires
wearing ECG leads that are attached to the chest of the person, which can be uncomfortable for
long term monitoring. Therefore given all these difficulties, there is still the lack of a device

49
which is light, easy to use, comfortable, that is able to measure SBP and DBP continuously and
accurately without a cuff and that does not need of individual calibration.
2.6.3 Machine Learning Approach
Figure 2.4 shows some of the internal physiological factors that affect BP. However, there are
many other physical and non-physical factors (e.g., emotional state, posture) that affect the blood
pressure level over a very short duration (even within a few heartbeats). Therefore, it is very
difficult to develop a mathematical equation which includes all relevant factors to calculate
accurate BP values. As a result, a possible solution to overcome this limitation is artificial
intelligence and machine learning instead of using an algebraic formula. Some researchers are
trying to use different machine learning algorithms with the pulse wave signal of the PPG that
can be obtained easily and non-invasively to estimate blood pressure continuously.
Suzuki et al. in 2009 used PPG to get Pulse Wave (PW) signal to estimate SBP by Error-
Correcting Output Coding (ECOC) method as a multi-classifier machine based on an aggregation
of general binary classifiers. However, in the end, this method could not achieve a standard
deviation of error values less than 8 mmHg, as required by the ANSI/AAMI standard [70].
Aboui et al. in 2011 used an Artificial Neural Network (ANN) with two parameters of blood
concentration and heart rate to predict the MAP for hemodialysis patients [71]. They reported an
error of 9%, but their study was restricted to MAP and did not estimate SBP and DBP [61].
Monte-Moreno in 2011 used several machine learning algorithms such as linear regression,
neural networks, support vector machines, and random forest to estimate BP from PPG signals.

50
To select the best structure and parameters, they used 70% of the database as training and 10%
for validation and 20% for testing. This was done 10 times by rotating the databases. They
collected data from 213 male and 197 female volunteers (410 in total), aged from 9 to 80 years
(mean±SD=37.97±13.32).Eachsubject’sPPGwasmeasuredwith the fingertippulseoximeter
device iPod Digital Oximeter and BP measurements were made an aneroid sphygmomanometer.
The input of the signal was PPG signal and the outputs are SBP and DBP. [72], and the
following is a description of each of the methods used:
•Linear regression (LR). For the linear regression method, they trained a univariate model
where j= {SBP and DBP} using the ridge regression algorithm. The
quality criterion was the coefficient of determination R2 value on the test set.
•Neuralnetworks(NN).Fortheneuralnetworks method they used a multilayer perceptron
trained by means of a conjugate gradient algorithm (Fletcher Powell). They used 1 hidden
layer with 10 nodes, and three at the output, and a hyperbolic tangent algorithm. The quality
criterion was the coefficient of determination R2 value on the test set.
• Support vector machines (SVM). For SVM regression, they used the ε-insensitive loss
function and the kernels were the Gaussian and the polynomial and standardized the data.
The values of sigma were varied from 0.1 to 5, and for the polynomial kernel, orders from 1
to 5 were tested. The best kernel was a Gaussian kernel. The quality criterion was the
coefficient of determination R2 value on the test set.
• Random forest (RF). The performance of the RF was insensitive to variations of the
parameters in a certain margin, i.e., for a number of trees higher than 30 there was no
improvement, and the size of the set at each node could vary from 1 to 10 without worsening

51
the performance. The RF has a method for ranking the features based on how the
performance degrades when a given input feature is randomly permuted in the test.
In conclusion, their system complies with Grade B of the British Hypertension Society’s
protocol, which is considered the minimum to pass the accepted criteria of the International
Protocol or the AAMI Protocol.
Kurylyak et al. in 2013 also used an ANN method with the PPG signal to estimate BP. They
extracted features from the PPG signal and employed a Kalman filter for preprocessing their data
[73, 74] . Chapter 3 Section 3.7 describes in detail how they extracted their features from the
PPG signal. They took 5000 separate PPG signals in individual heartbeats for different persons
and different time instances from the same online source that we used (MIMIC II database at
physionet.org) and these were identified with corresponding BP values using the invasive arterial
BP (ABP) signal to obtain the reference values for comparison with their estimated values [77 ,
82]. Then 21 parameters were extracted from each of the separate pulses, and these parameters
defined the input vector for the ANN. A multilayer feed-forward back-propagation ANN
architecture with two hidden layers was used, with 35 neurons in the first hidden layer and 20 in
the second one and two output neurons to simultaneously estimate SBP and DBP. The
performance results of their experiments on the test database presented as mean and standard
deviation of absolute error (MAE±SDAE) obtained from reference SBP/DBP and estimated
values. In their tests, the error in for of MAE±SDAE is 3.80±3.46 mmHg for systolic and
2.21±2.09 mmHg for diastolic pressure which fulfil the requirement of common standards. They
used a Kalman filter to remove the low and high frequency noise (by eliminating artifacts from
the reference signals used to train the ANN) and as such obtained an increase in the accuracy of
estimated BP. The error for SBD and DBP with Kalman filtering became 3.24±3.47 and
52
1.79±2.02 respectively and the improvement with respect to unprocessed date was about 20%
[77, 82]. They, however, did not describe how many subjects were included in their 5000 pulse
dataset To train their network, they used 70% of collected heartbeats, and used 15% for
validation and 15% for testing. It is not clear, however, if they separated the subjects into each of
these subsets or if they allowed pulses from an individual subject to be represented in the
training, validation, and testing sets. Additionally, although they report meeting the requirements
of the ANSI/AAMI standard, they evaluate the performance of their method in the form of mean
absolute error (MAE) and standard deviation of absolute error (SDAE) and not mean error (ME)
and standard deviation of the error (SDE), as required by the standard. In our work, we also
consider the ANN as a solution to estimate BP from the arterial pulse waveform, as described in
the next chapter.
53
Materials and Methods 3
3.1 Introduction
The analysis approach used to estimate BP pressure from the arterial pulse waveform is based on
an Artificial Neural Network (ANN). An ANN consists of an input layer, one or more hidden
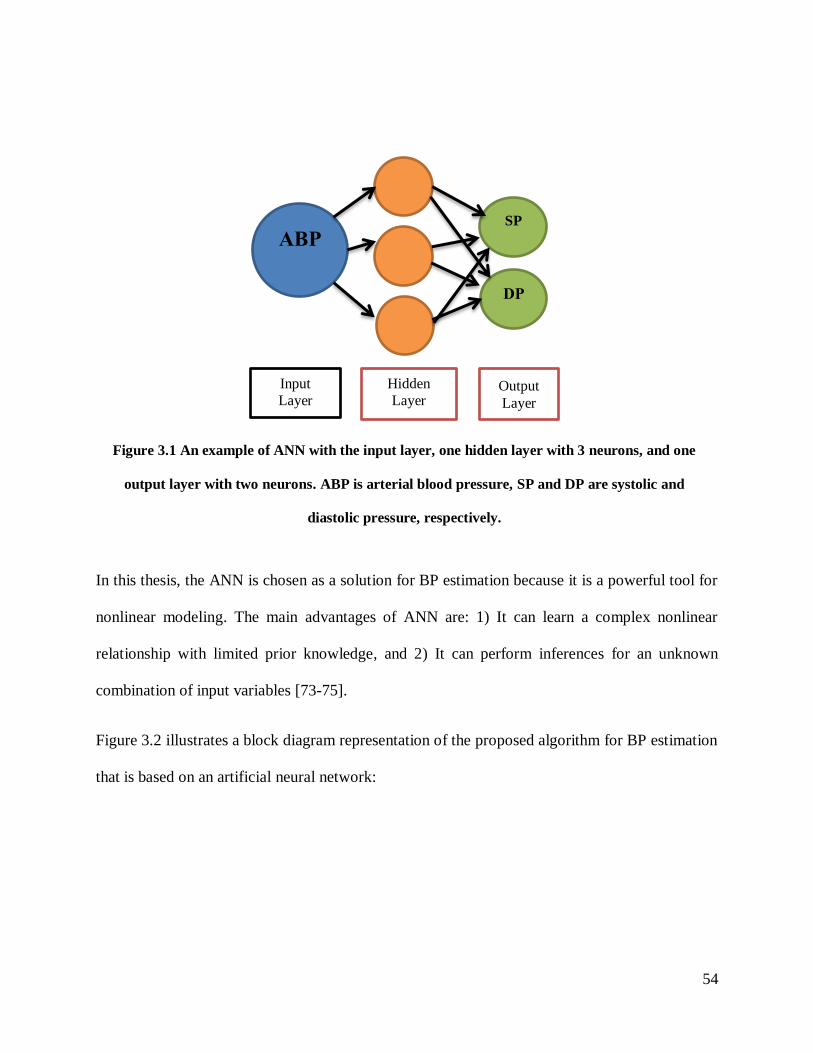
layers, and an output layer [73]. Figure 3.1 shows an example of an ANN with an input layer, one
hidden layer with 3 neurons and one output layer with two neurons. Each layer could consist of
one or several nodes which are called neurons. Similar to a typical natural neural network, the
ANN connections run forward from input to hidden nodes and from hidden nodes to output nodes,
which is why it is called Feed-forward. However, during the training phase, the system could have
a feedback loop that takes the errors from the output back to hidden nodes causing the weights on
connections to change. This is called backpropagation, and can increase the accuracy of the
system [73]. The process of implementing an ANN has 3 steps; training, validation, and testing.
In the training step, the program is presented with example inputs, desired outputs, and tries to
learn to map inputs to outputs. In the validation step, the system validates the results from training
and optimizes the network structure. In testing, the algorithm is given a new input and is asked for
an estimated output based on the network built in the previous steps. In the end, the performance
of the network is evaluated by calculating the error based on a comparison between reference and
estimated values. [73-75]
54
In this thesis, the ANN is chosen as a solution for BP estimation because it is a powerful tool for
nonlinear modeling. The main advantages of ANN are: 1) It can learn a complex nonlinear
relationship with limited prior knowledge, and 2) It can perform inferences for an unknown
combination of input variables [73-75].
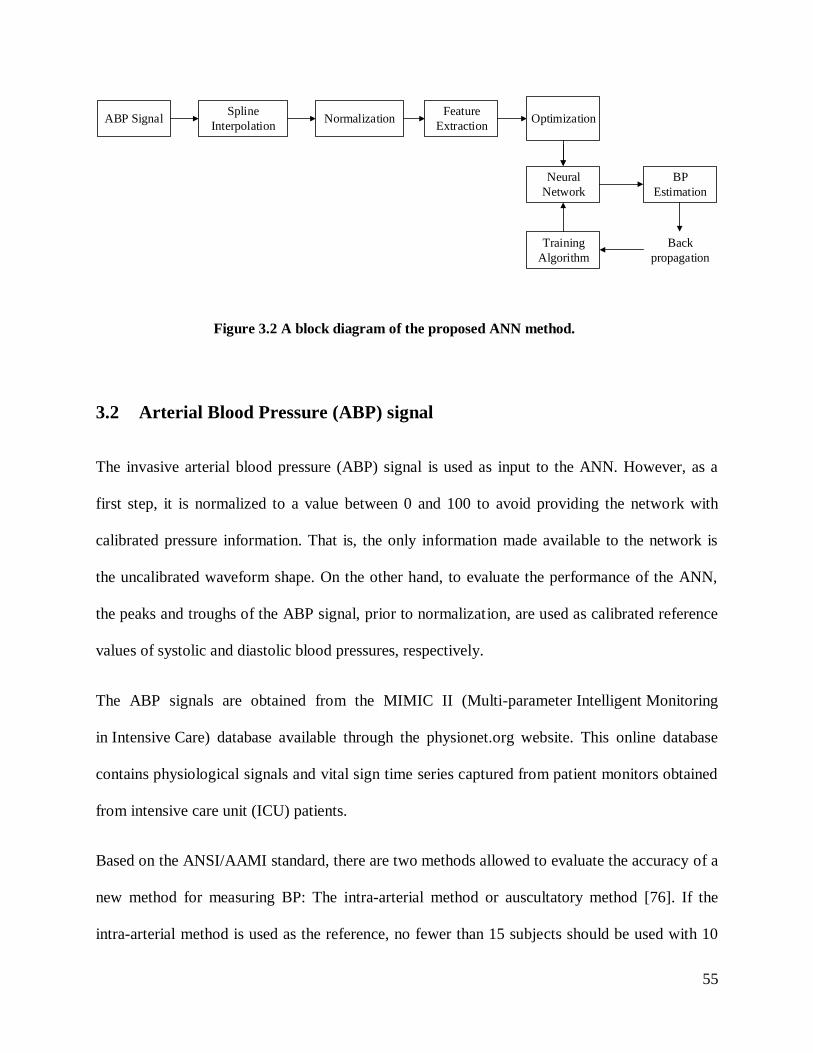
Figure 3.2 illustrates a block diagram representation of the proposed algorithm for BP estimation
that is based on an artificial neural network:
ABP
SP
DP
Input
Layer
Hidden
Layer Output
Layer
Figure 3.1 An example of ANN with the input layer, one hidden layer with 3 neurons, and one
output layer with two neurons. ABP is arterial blood pressure, SP and DP are systolic and
diastolic pressure, respectively.
55
ABP SignalSpline
InterpolationNormalization
Feature
Extraction
Neural
Network
BP
Estimation
Back
propagation
Training
Algorithm
Optimization
3.2 Arterial Blood Pressure (ABP) signal
The invasive arterial blood pressure (ABP) signal is used as input to the ANN. However, as a
first step, it is normalized to a value between 0 and 100 to avoid providing the network with
calibrated pressure information. That is, the only information made available to the network is
the uncalibrated waveform shape. On the other hand, to evaluate the performance of the ANN,
the peaks and troughs of the ABP signal, prior to normalization, are used as calibrated reference
values of systolic and diastolic blood pressures, respectively.
The ABP signals are obtained from the MIMIC II (Multi-parameter Intelligent Monitoring
in Intensive Care) database available through the physionet.org website. This online database
contains physiological signals and vital sign time series captured from patient monitors obtained
from intensive care unit (ICU) patients.
Based on the ANSI/AAMI standard, there are two methods allowed to evaluate the accuracy of a
new method for measuring BP: The intra-arterial method or auscultatory method [76]. If the
intra-arterial method is used as the reference, no fewer than 15 subjects should be used with 10
Figure 3.2 A block diagram of the proposed ANN method.

56
paired measurements per subject, for a total of 150 paired observations. If auscultatory method is
used as the reference, there should be no fewer than 85 subjects with 3 paired observations each,
for a total minimum of 255 (= 3*85) paired observations. For SBP and DBP separately, the mean
error (ME) of the 255 individual paired measurements of the test system should be ± 5 mmHg or
less, with a standard deviation of error (SDE) of 8 mmHg or less. In this research, the intra-
arterial method is used as the reference measurement because accurate calibrated values of SBP
and DBP are readily obtainable from the ABP signals. Therefore, from the MIMIC II database,
the ABP signal from 11 ICU patients with normal blood pressure and 11 ICU patients with
hypertension are used with 10 periods each, for a total of 220 paired ABP signals as inputs to
train and test the ANN. At the very end, to test the performance of the ANN with a completely
“fresh” set of data, a further 2 patients with normal blood pressure and 1 patient with
hypertension with 10 periods each are used. Figure 3.3 shows the distribution of systolic and
diastolic pressures of the aforementioned 22 patients. Note that a single cardiac pulse period of
the ABP signal is considered as one input waveform to the ANN.
57
Figure 3.3 The histogram of (a) systolic and (b) diastolic distribution for the 22 ICU patients used to
train and test the proposed ANN.
Nu
mber
of
per
iods
Nu
mber
of
per
iods
(a)
(b)

58
Figure 3.4 (a) shows an example of a one minute recording of the ABP signal for a patient with
normal blood pressure. The first 10 periods of this signal are selected as the input of the ANN
(Figure 3.4 (b)). Figure 3.4 (c) illustrates a complete period which could be from minimum to
minimum for estimation of the SBP and peak to peak for estimation of the DBP (the reason for
using these two different start and end points for the SBP and DBP is explained below). The
reference systolic and diastolic BP are calculated as the maximum and minimum of these signals
within the cardiac pulse.
59
Figure 3.4 An example of an ABP signal for one patient. (a) One minute recording. (b) The selected
10 periods. (c) One minimum to minimum selected period.
(a)
(c)
(b)
60
3.3 Spline Interpolation
In each person, the amplitude and duration of the pulse signal varies beat to beat which means
that each single period consists of a different number of samples. However, since the number of
input neurons in the ANN must be fixed when the raw signal is used as input to the network, all
pulse periods are interpolated to 100 samples (x-axis in Fig. 3.5), making the input matrix to the
network a 220 periods x 100 samples. Figure 3.5 shows an example of (a) the original ABP and
(b) the interpolated signal.
Figure 3.5 An example of ABP signal: the raw signal is in blue and the interpolated signal is in
green.
BP
valu
es (
mm
Hg)
Samples
61
3.4 Normalization
The ABP signal in each pulse period used as input to the ANN is normalized from 0 to 100 to
make sure that the network is not provided with calibrated information about the blood pressure,
and so it only uses the shape of the signal to estimate the SBP and DBP. Normalization also
helps the ANNs train faster and reduces the chances of getting stuck in local minima [121].
Figure 3.6 illustrates an example of (a) the original ABP after interpolation (Section 3.3) and (b)
the normalized signal.
Figure 3.6 An example of ABP signal. (a) The raw signal after interpolation. (b) The normalized
signal.
(a)
(b)
Samples
Samples
BP
valu
es (
mm
Hg)
BP
valu
es (
unit
less
)

62
3.5 Artificial Neural Network (ANN) architecture
Because the proposed method is intended in the future to be implemented in a stand-alone cuffless
BPM device, the required size of memory is one of the considerations of this research study.
Therefore, a multilayer feed-forward (FF) architecture that uses backpropagation for training is
proposed and not another ANN architecture based on the radial basis function, counter
propagation, or learning vector quantization, because this architecture requires a smaller number
of neurons in the case of large training set [77].
The Levenberg-Marquardt backpropagation algorithm (trainlm function in MATLAB) is a
network training function that updates weight and bias values. The reason that this training
function is chosen is because it is often found to be the fastest backpropagation supervised
algorithm. It has gradient descent and adaptive learning and back propagation all included it, and
therefore it is a good choice for optimization of the network [74].
Although the network uses a fixed training function (Levenberg-Marquardt) and, once
optimized, a fixed number of hidden layers and neurons, it has a random weight and bias each
time when the network is run. Therefore, based on the central limit theorem in statistics, to get a
good estimate, the program is run 30 times, with 30 times in training, validation and testing. At
the end, the average values of errors, in the testing phase, are calculated based on these runs in
the form of mean error (ME) and standard deviation of error (SDE) (as shown in Table 4.1).
The leave-one-out method is used for testing the ANN. In this method, one patient and all his/her
10 associated periods are removed from the 220 waveform dataset to avoid biasing the training
of the network and used for testing. Therefore, 210 waveforms remain for training and validation
of which 80% (168 waveforms) are used for training and 20% (42 waveforms) are used for the

63
validation. The ANN model is designed using MATLAB R2012a (The MathWorks, Natick,
Massachusetts).
3.6 Principal component analysis (PCA)
The input to the ANN has 100 samples per waveform and so has high dimensionality. Therefore,
a dimensional reduction process is applied on the signals based on linear time series analysis.
Principal Component Analysis (PCA) is a dimension-reduction approach that can be used to
reduce a large set of variables to a small set that still includes most of the information found in a
large set. A subset of variables from a larger set is selected, based on which original variables
have the highest correlations with the principal component [73]. PCA is commonly used for this
purpose and has been found to show satisfactory results in many applications where
dimensionality reduction is needed [73].
Based on our experimental design in this thesis, PCA is applied on the raw signal and also on the
21 features that are extracted from the pulse signal (Section 3.7 below). In the end, the results
with and without dimensionality reduction are compared to see whether or not using PCA
improves the results.
3.7 Feature Extraction
Our goal is to estimate the systolic and diastolic blood pressure from the pulse signal. This goal
could be approached by a non-invasive device that measures the pulse signal using an optical
sensor such as in a pulse oximeter or which could be embedded in a smartphone. The amplitude

64
of the obtained pulse signal may change due to several factors such as the gain of the device, the
amount of the pressure between the finger and the optical sensor etc. As a result, the amplitude
of the signal would not contain useful information for estimating the blood pressure. Therefore
one approach would be to characterize the pulses considering features that reflect the temporal
structure of the signals.
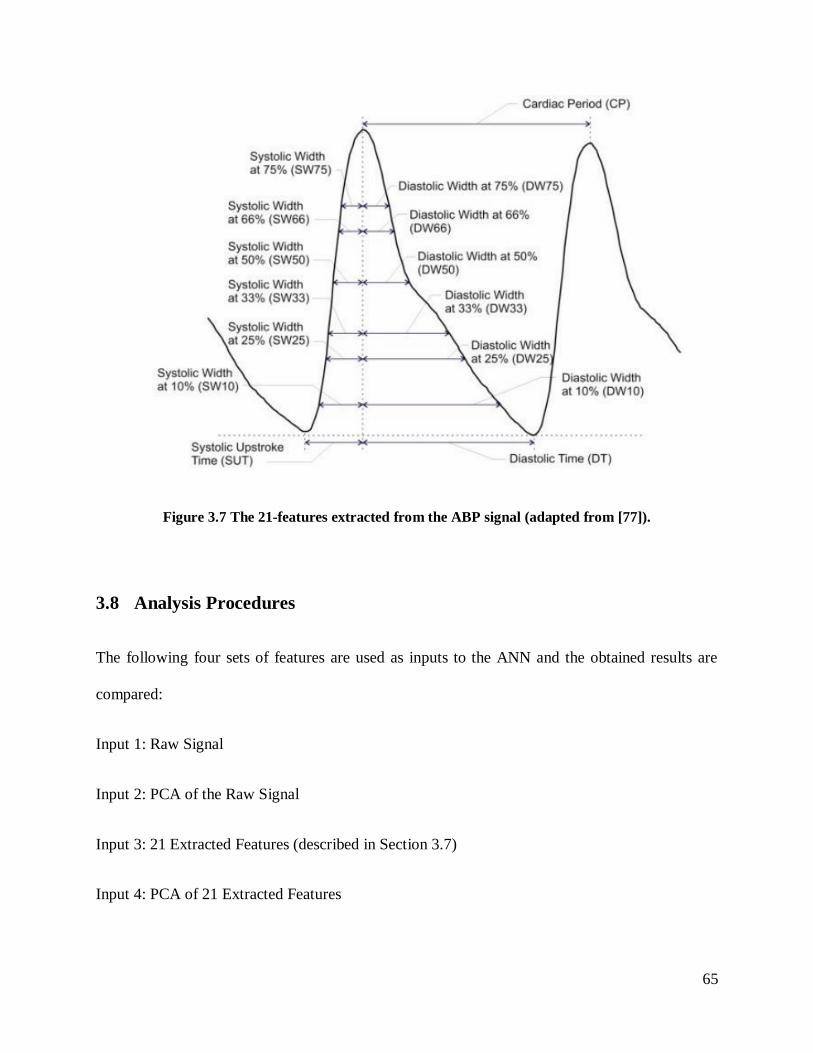
Several parameters could be used in order to characterize the ABP pulses. The following are the
parameters obtained based on a review of the literature: The Systolic Upstroke Time (SUT),
Diastolic Time (DT), time width of 2/3 and 1/2 pulse amplitude, are mentioned in [78], while the
cardiac period (CP) and peak width at 10% of the pulse height are used in [79]. Kurylyak et al.
(2013a) also proposed to calculate the width at 25%, 33% and 75% of the pulse height and to
extract separate features for the systolic and diastolic components which are the intervals from
minimal to the maximal point and from the maximal to the next minimal point, respectively [77].
These authors also proposed using the ratio between systolic and diastolic widths (DW/SW) as
well as their sum in order to extract as much information as possible (SW+DW), for each of the
10, 25, 33, 50, 66 and 75% time periods (x-axis). Thus, they extracted 21 parameters as a feature
set for the pulse signal as follows (Figure 3.7):
• Cardiac Period (CP), Systolic Upstroke Time (SUT), Diastolic Time (DT);
• At 10%: DW10, SW10+DW10, DW10/SW10;
• At 25%: DW25, SW25+DW25, DW25/SW25;
• At 33%: DW33, SW33+DW33, DW33/SW33;
• At 50%: DW50, SW50+DW50, DW50/SW50;
• At 66%: DW66, SW66+DW66, DW66/SW66;
• At 75%: DW75, SW75+DW75, DW75/SW75
65
Figure 3.7 The 21-features extracted from the ABP signal (adapted from [77]).
3.8 Analysis Procedures
The following four sets of features are used as inputs to the ANN and the obtained results are
compared:
Input 1: Raw Signal
Input 2: PCA of the Raw Signal
Input 3: 21 Extracted Features (described in Section 3.7)
Input 4: PCA of 21 Extracted Features
66
In all procedures, to increase the accuracy of the result, separate networks are used for systolic
and diastolic blood pressure estimation. With 220 input pulse periods in total, the ANN estimates
220 SBP and 220 DBP values.
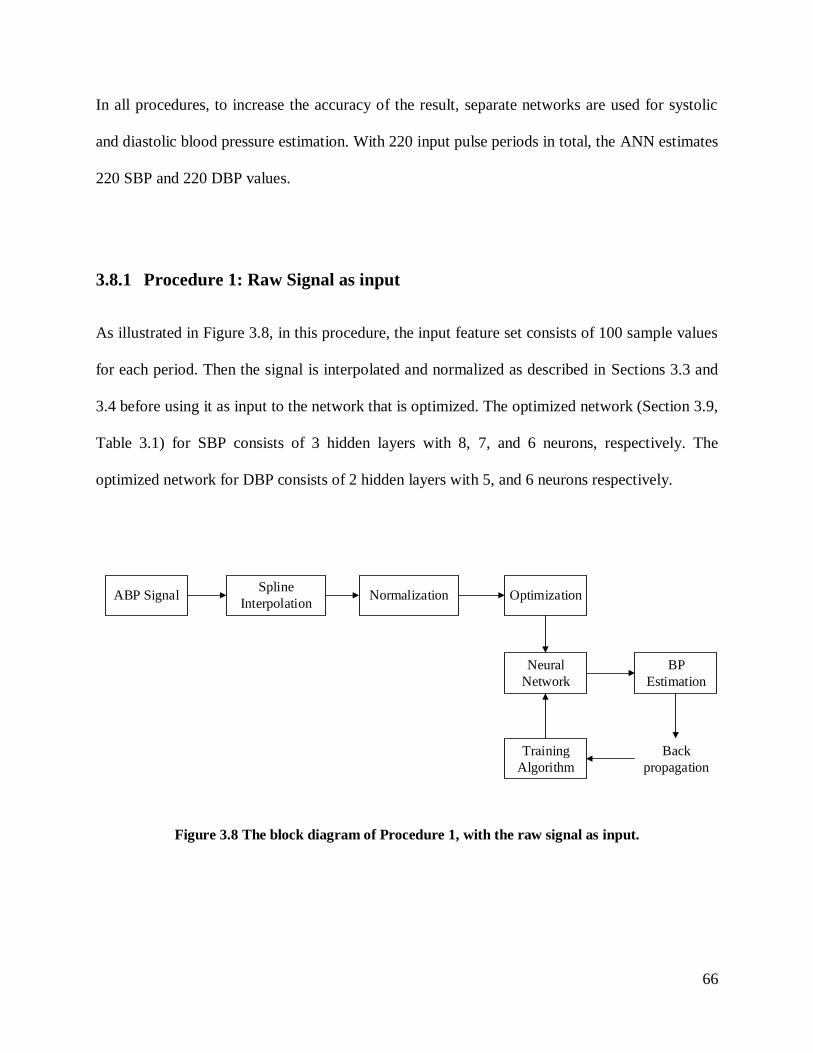
3.8.1 Procedure 1: Raw Signal as input
As illustrated in Figure 3.8, in this procedure, the input feature set consists of 100 sample values
for each period. Then the signal is interpolated and normalized as described in Sections 3.3 and
3.4 before using it as input to the network that is optimized. The optimized network (Section 3.9,
Table 3.1) for SBP consists of 3 hidden layers with 8, 7, and 6 neurons, respectively. The
optimized network for DBP consists of 2 hidden layers with 5, and 6 neurons respectively.
ABP SignalSpline
InterpolationNormalization Optimization
Neural
Network
BP
Estimation
Back
propagation
Training
Algorithm
Figure 3.8 The block diagram of Procedure 1, with the raw signal as input.

67
3.8.2 Procedure 2: PCA of the Raw Signal as input
In this procedure, after interpolation and normalization of the ABP signal, Principal Component
Analysis (PCA) is applied on the raw signal for each input pulse period (Figure 3.9). The output
of the PCA is used as input to the ANN, giving a feature set with 6 elements for SBP and a
feature set with 4 elements for DBP. These numbers of PCA elements for systolic and diastolic
pressure covered 99% of the information in the raw input signal.
As shown in Table 3.1, the optimized network for SBP consists of 1 hidden layer with 2 neurons.
The optimized network for DBP consists of 2 hidden layers with 8 and 7 neurons, respectively.
The PCA is applied only in training phase of the procedure, and the validation and testing phases
used the PCA which was determined in the training phase.
ABP SignalSpline
InterpolationNormalization PCA
Neural
Network
BP
Estimation
Back
propagation
Training
Algorithm
Optimization
Figure 3.9 The block diagram of Procedure 2 with the PCA of the raw signal as input.
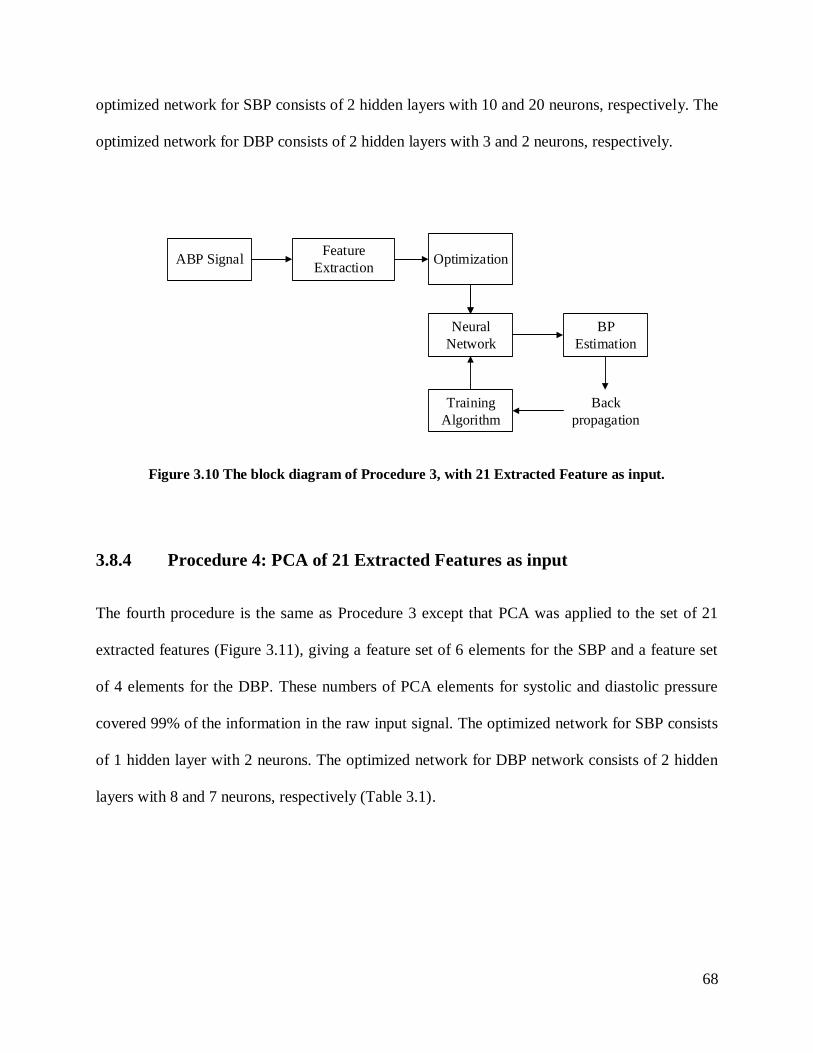
3.8.3 Procedure 3: 21 Extracted Features as input
In the third procedure, the 21 features extracted from each raw pulse signal, as described in
Section 3.7, were used as the input feature set (Figure 3.10). As indicated in Table 3.1, the
68
optimized network for SBP consists of 2 hidden layers with 10 and 20 neurons, respectively. The
optimized network for DBP consists of 2 hidden layers with 3 and 2 neurons, respectively.
ABP SignalFeature
Extraction
Neural
Network
BP
Estimation
Back
propagation
Training
Algorithm
Optimization
Figure 3.10 The block diagram of Procedure 3, with 21 Extracted Feature as input.
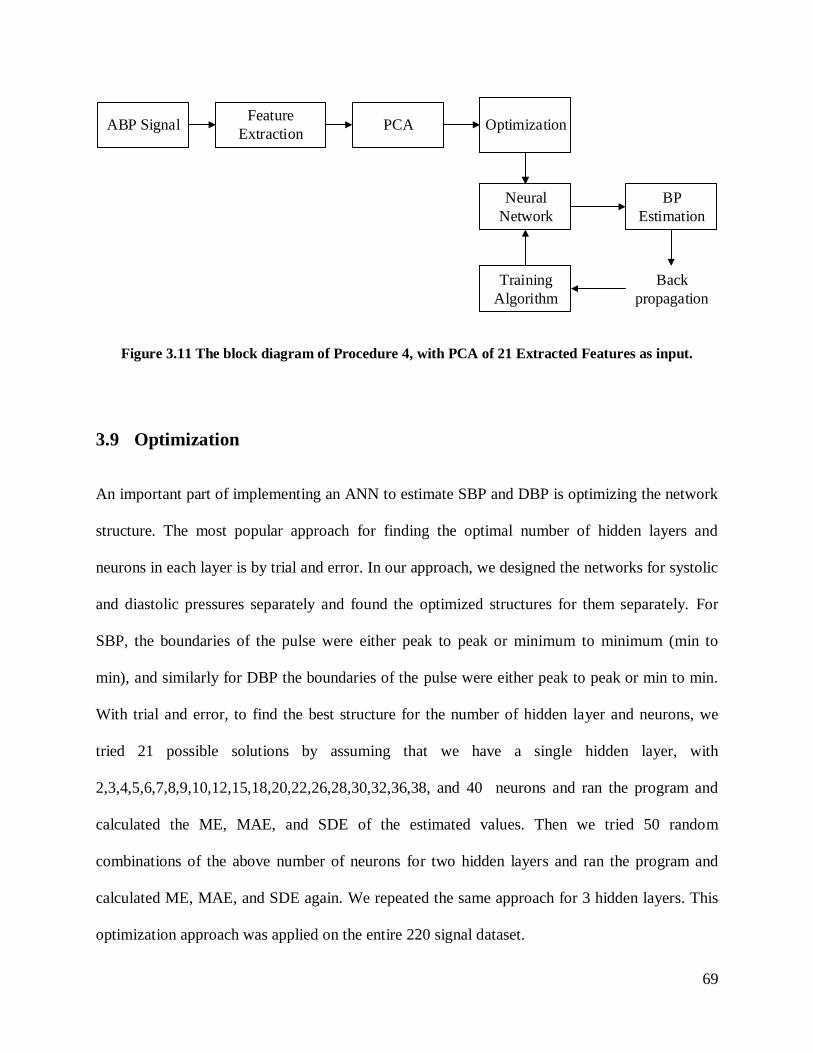
3.8.4 Procedure 4: PCA of 21 Extracted Features as input
The fourth procedure is the same as Procedure 3 except that PCA was applied to the set of 21
extracted features (Figure 3.11), giving a feature set of 6 elements for the SBP and a feature set
of 4 elements for the DBP. These numbers of PCA elements for systolic and diastolic pressure
covered 99% of the information in the raw input signal. The optimized network for SBP consists
of 1 hidden layer with 2 neurons. The optimized network for DBP network consists of 2 hidden
layers with 8 and 7 neurons, respectively (Table 3.1).
69
ABP SignalFeature
ExtractionPCA
Neural
Network
BP
Estimation
Back
propagation
Training
Algorithm
Optimization
Figure 3.11 The block diagram of Procedure 4, with PCA of 21 Extracted Features as input.
3.9 Optimization
An important part of implementing an ANN to estimate SBP and DBP is optimizing the network
structure. The most popular approach for finding the optimal number of hidden layers and
neurons in each layer is by trial and error. In our approach, we designed the networks for systolic
and diastolic pressures separately and found the optimized structures for them separately. For
SBP, the boundaries of the pulse were either peak to peak or minimum to minimum (min to
min), and similarly for DBP the boundaries of the pulse were either peak to peak or min to min.
With trial and error, to find the best structure for the number of hidden layer and neurons, we
tried 21 possible solutions by assuming that we have a single hidden layer, with
2,3,4,5,6,7,8,9,10,12,15,18,20,22,26,28,30,32,36,38, and 40 neurons and ran the program and
calculated the ME, MAE, and SDE of the estimated values. Then we tried 50 random
combinations of the above number of neurons for two hidden layers and ran the program and
calculated ME, MAE, and SDE again. We repeated the same approach for 3 hidden layers. This
optimization approach was applied on the entire 220 signal dataset.
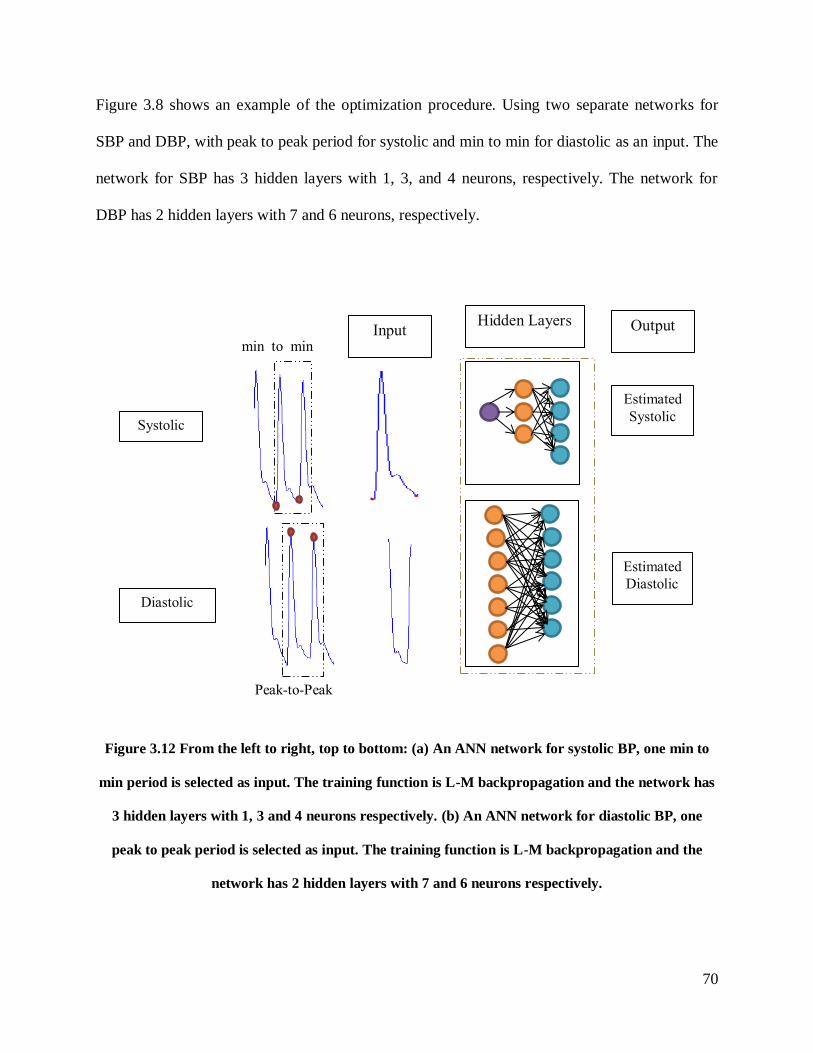
70
Figure 3.8 shows an example of the optimization procedure. Using two separate networks for
SBP and DBP, with peak to peak period for systolic and min to min for diastolic as an input. The
network for SBP has 3 hidden layers with 1, 3, and 4 neurons, respectively. The network for
DBP has 2 hidden layers with 7 and 6 neurons, respectively.
Figure 3.12 From the left to right, top to bottom: (a) An ANN network for systolic BP, one min to
min period is selected as input. The training function is L-M backpropagation and the network has
3 hidden layers with 1, 3 and 4 neurons respectively. (b) An ANN network for diastolic BP, one
peak to peak period is selected as input. The training function is L-M backpropagation and the
network has 2 hidden layers with 7 and 6 neurons respectively.
Peak-to-Peak
min_to_min
Systolic
Diastolic
Input
Hidden Layers
Estimated
Systolic
Estimated
Diastolic
Output
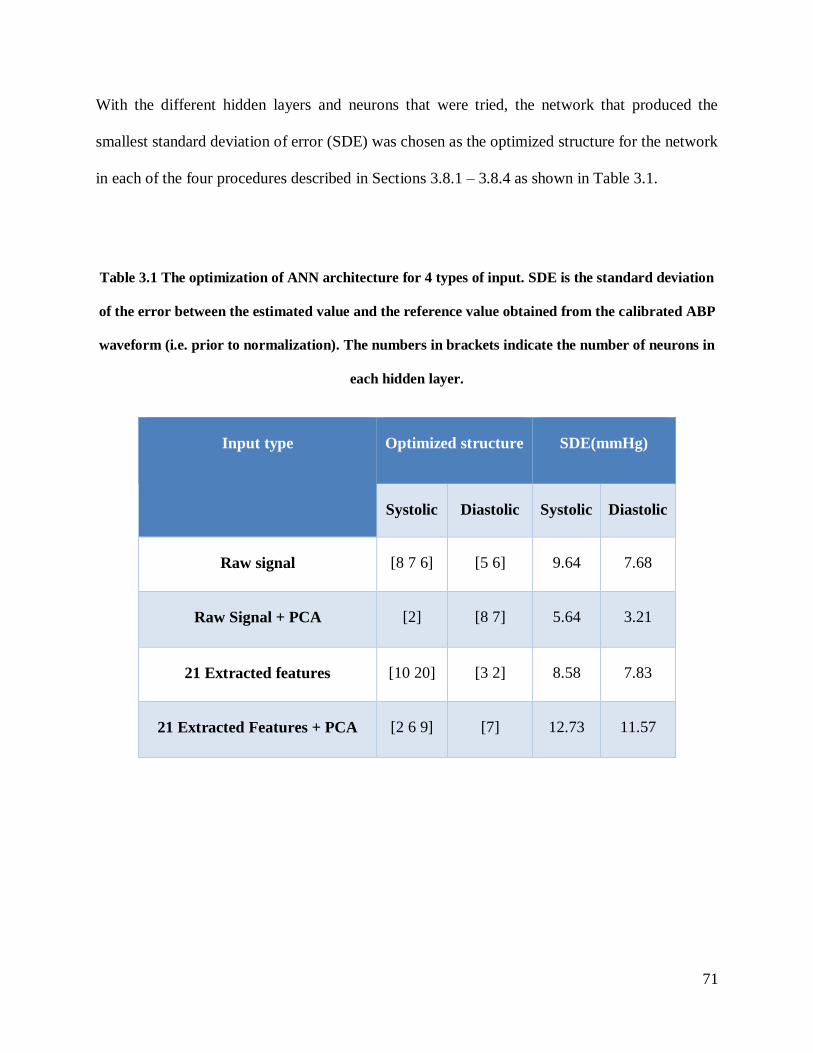
71
With the different hidden layers and neurons that were tried, the network that produced the
smallest standard deviation of error (SDE) was chosen as the optimized structure for the network
in each of the four procedures described in Sections 3.8.1 – 3.8.4 as shown in Table 3.1.
Table 3.1 The optimization of ANN architecture for 4 types of input. SDE is the standard deviation
of the error between the estimated value and the reference value obtained from the calibrated ABP
waveform (i.e. prior to normalization). The numbers in brackets indicate the number of neurons in
each hidden layer.
Input type Optimized structure SDE(mmHg)
Systolic Diastolic Systolic Diastolic
Raw signal [8 7 6] [5 6] 9.64 7.68
Raw Signal + PCA [2] [8 7] 5.64 3.21
21 Extracted features [10 20] [3 2] 8.58 7.83
21 Extracted Features + PCA [2 6 9] [7] 12.73 11.57

72
Results and Discussion 4
4.1 Results
The performance of our proposed ANN estimation method with different feature sets was
evaluated on the dataset of 220 pulses. The feature sets described in Chapter 3 consist of the 1)
Raw Signal, 2) PCA of the Raw Signal, 3) 21 Extracted Features and 4) PCA of the 21 Extracted
Features. The first feature set of Raw Signal has an input of 100 sample values. The second
feature set was obtained by applying principal component analysis (PCA) on the raw signal. For
the third features set, we used the 21 features extracted from the raw signal as described in the
literature. And for the final feature set, we applied PCA on the 21 Extracted Features. Table 4.1
shows the performance with all four feature sets with the database of 220 pulse periods from 22
patients (11 with normal blood pressure, 11 hypertensive), presented in terms of mean error
(ME) and standard deviation of the error (SDE) between estimated SBP and DBP and
corresponding reference values. As can be seen, all of the proposed feature sets give estimates
that are within the requirements of the ANSI/AAMI standard for non-invasive blood pressure
devices, which puts a limit of ±5 mmHg for ME and 8 mmHg for SDE.
Among the four feature sets, applying PCA on the raw signal achieved the best BP estimation
results with ME of 0.07 mmHg and SDE of 4.64 mmHg in the estimation of SBP and ME of -
0.07 mmHg and SDE of 3.21 mmHg in the estimation of DBP.
As a further test of the performance of the neural network estimation method, and as a check
that they have not been over-trained, the networks that were used in the analysis of the 22
patients used for training and testing were fixed (i.e. their architecture and internal weights were
fixed). Then 3 new patients with 10 periods each, who are not part of the 22 patient database,
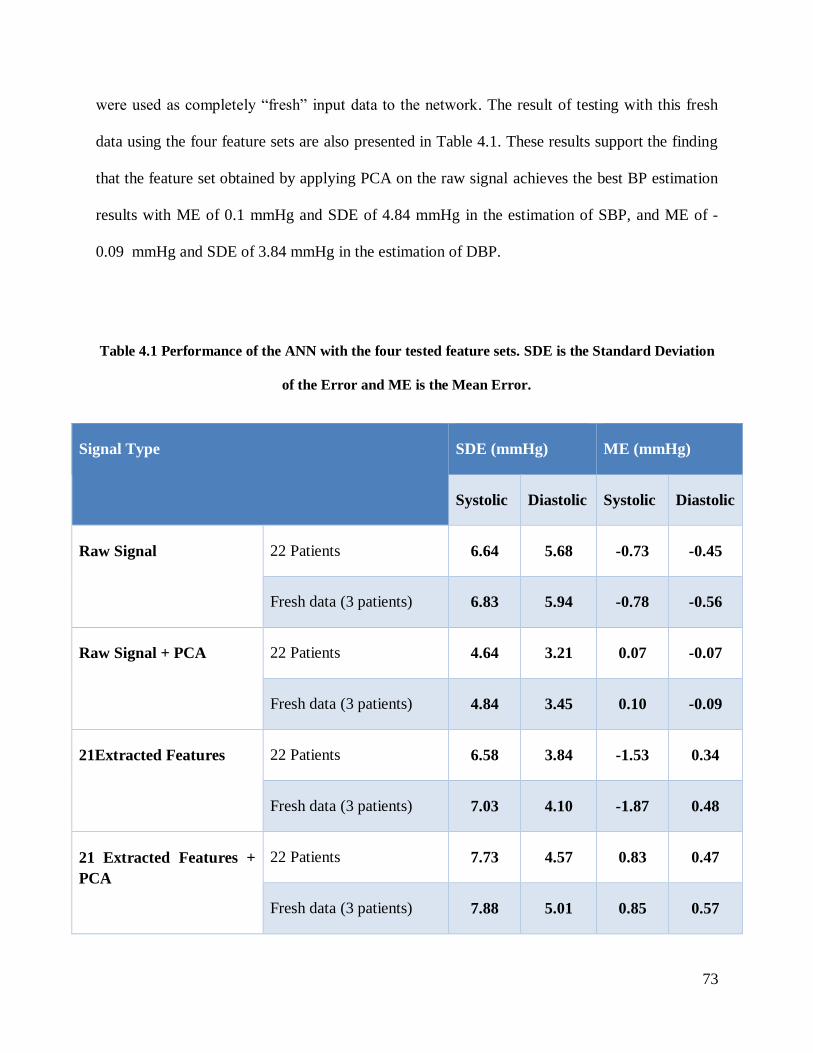
73
wereusedascompletely“fresh” inputdatatothenetwork. The result of testing with this fresh
data using the four feature sets are also presented in Table 4.1. These results support the finding
that the feature set obtained by applying PCA on the raw signal achieves the best BP estimation
results with ME of 0.1 mmHg and SDE of 4.84 mmHg in the estimation of SBP, and ME of -
0.09 mmHg and SDE of 3.84 mmHg in the estimation of DBP.
Table 4.1 Performance of the ANN with the four tested feature sets. SDE is the Standard Deviation
of the Error and ME is the Mean Error.
Signal Type SDE (mmHg) ME (mmHg)
Systolic Diastolic Systolic Diastolic
Raw Signal 22 Patients 6.64 5.68 -0.73 -0.45
Fresh data (3 patients) 6.83 5.94 -0.78 -0.56
Raw Signal + PCA
22 Patients 4.64 3.21 0.07 -0.07
Fresh data (3 patients) 4.84 3.45 0.10 -0.09
21Extracted Features 22 Patients 6.58 3.84 -1.53 0.34
Fresh data (3 patients) 7.03 4.10 -1.87 0.48
21 Extracted Features +
PCA
22 Patients 7.73 4.57 0.83 0.47
Fresh data (3 patients) 7.88 5.01 0.85 0.57

74
4.1.1 Bland-Altman Plots
In order to further analyze the performance of the neural networks with the proposed feature sets,
Bland-Altman analysis is performed. Bland and Altman developed a graphical statistical
approach to assessing the agreement between a newly developed measurement method and a
reference measurement method [80, 81]. Figures 4.1- 4.8 show the Bland–Altman plots that
compare the proposed method to the reference measurement with all the feature sets. The
reference SBP and DBP (from the invasive ABP signal) are used as targets, and the estimated
values of outputs of the neural networks are used as the results of the new measurement method.
Each point on the Bland-Altman plot represents the average of the two methods (x-axis) and
their difference (y-axis). The horizontal central dashed line shows the bias (ME), while the
horizontal dashed lines (above and below the central line) show the limits of agreement
(ME±1.96×SDE). Smaller bias and narrower limits of agreements show a better agreement
between the two techniques. All plots show two groupings of data, and these relate to the 11
patients with normal blood pressure (on the left), and the 11 patients with hypertension (on the
right). Comparing the four plots, it is apparent that the limits of agreement are narrowest in the
case of the features obtained by applying PCA on the raw signal for both SBP and DBP
estimation.
Compared to the reference values obtained from the invasive method, it is observed that for the
features obtained from the raw signal, there is an underestimation of SBP and DBP at pressures
in normal blood pressure group, while the results show an overestimation for hypertensive group
(Figures 4.1 and 4.2).
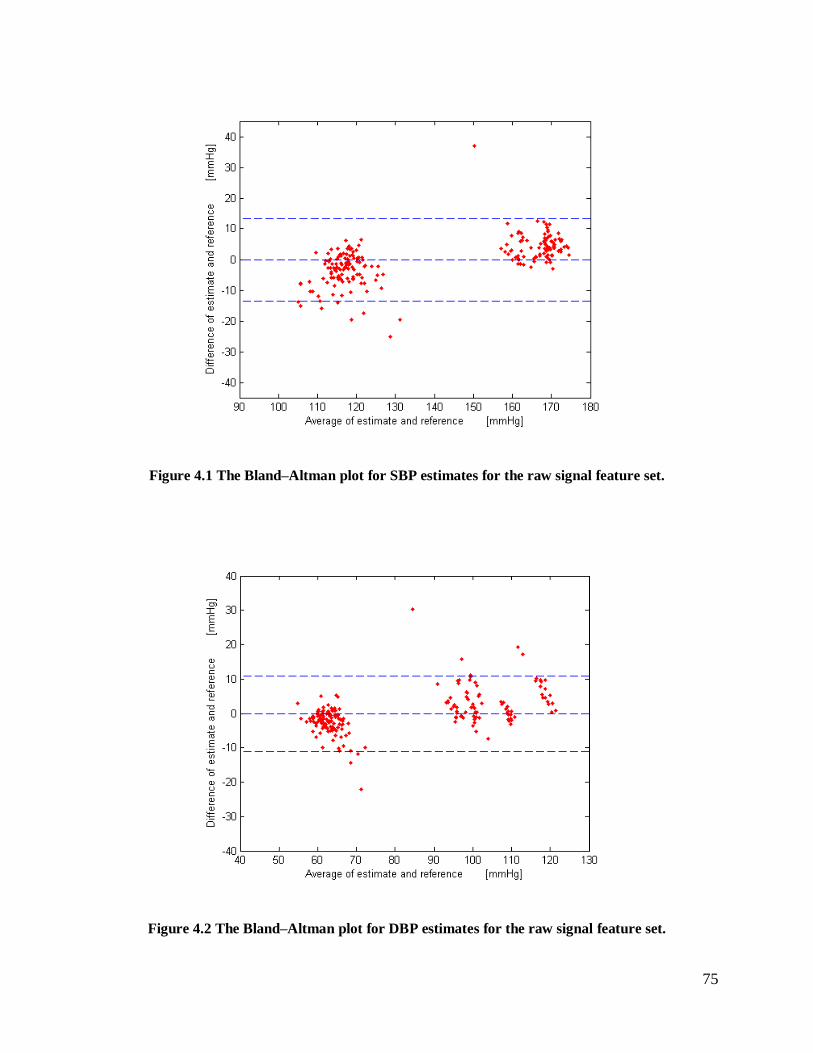
75
Figure 4.1 The Bland–Altman plot for SBP estimates for the raw signal feature set.
Figure 4.2 The Bland–Altman plot for DBP estimates for the raw signal feature set.
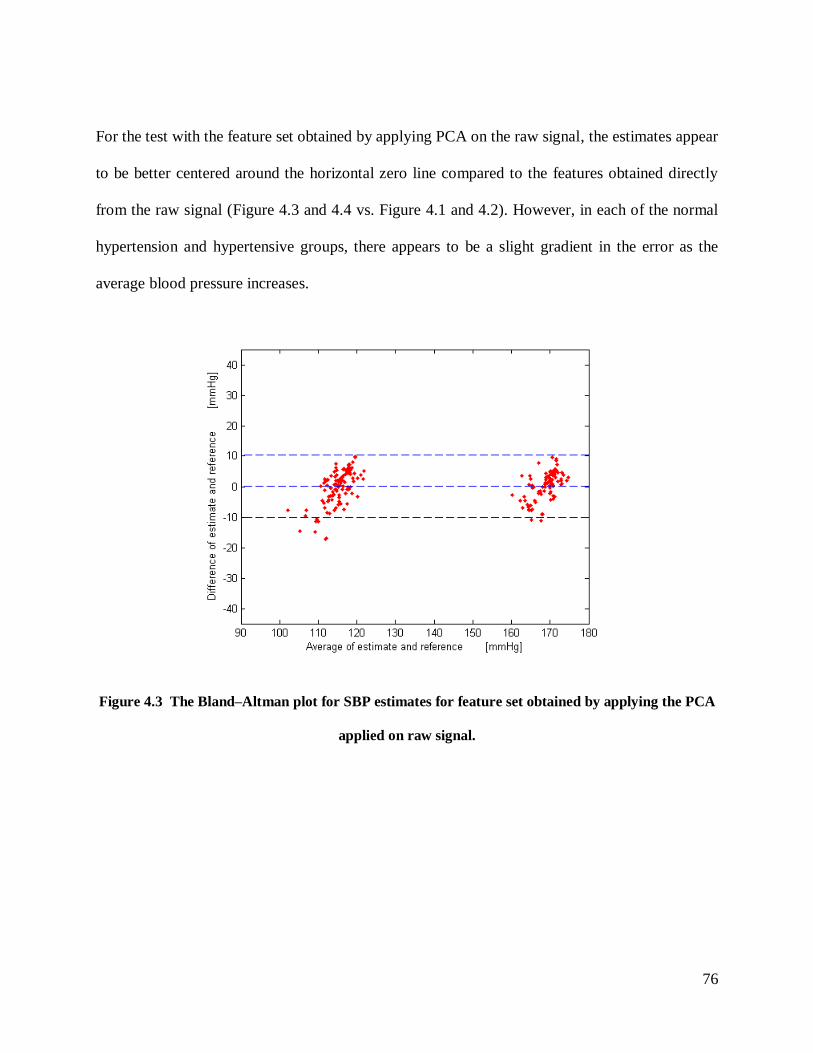
76
For the test with the feature set obtained by applying PCA on the raw signal, the estimates appear
to be better centered around the horizontal zero line compared to the features obtained directly
from the raw signal (Figure 4.3 and 4.4 vs. Figure 4.1 and 4.2). However, in each of the normal
hypertension and hypertensive groups, there appears to be a slight gradient in the error as the
average blood pressure increases.
Figure 4.3 The Bland–Altman plot for SBP estimates for feature set obtained by applying the PCA
applied on raw signal.
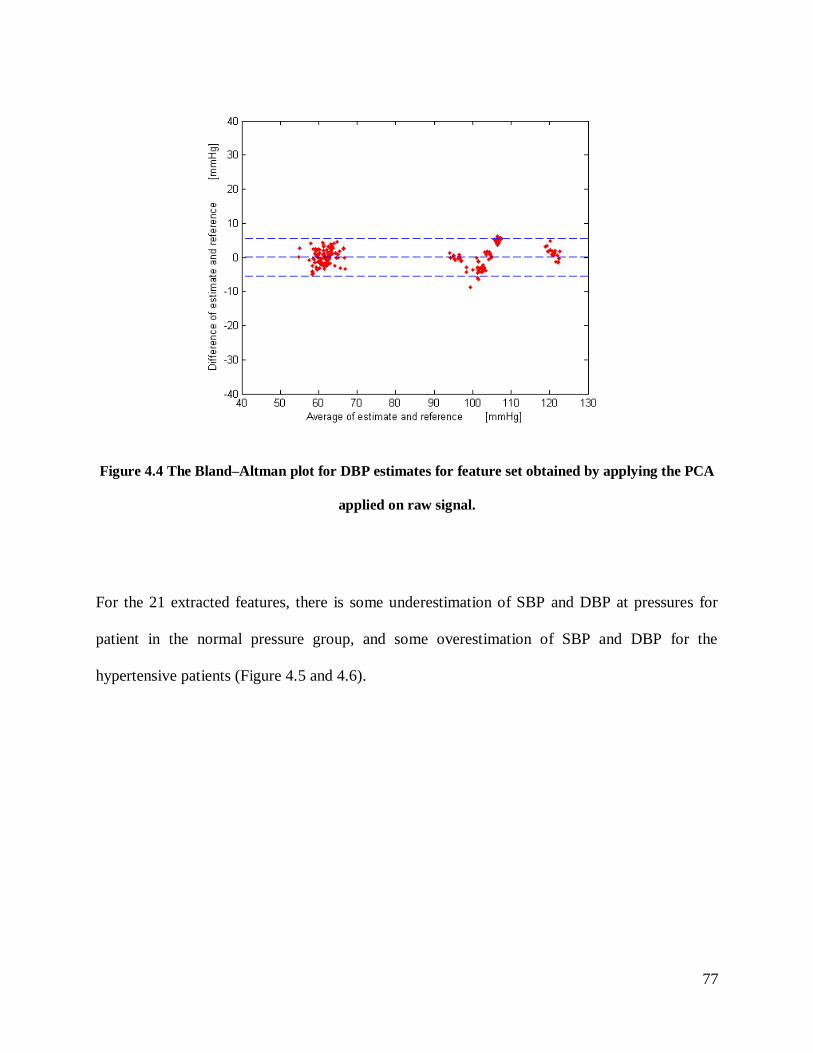
77
Figure 4.4 The Bland–Altman plot for DBP estimates for feature set obtained by applying the PCA
applied on raw signal.
For the 21 extracted features, there is some underestimation of SBP and DBP at pressures for
patient in the normal pressure group, and some overestimation of SBP and DBP for the
hypertensive patients (Figure 4.5 and 4.6).
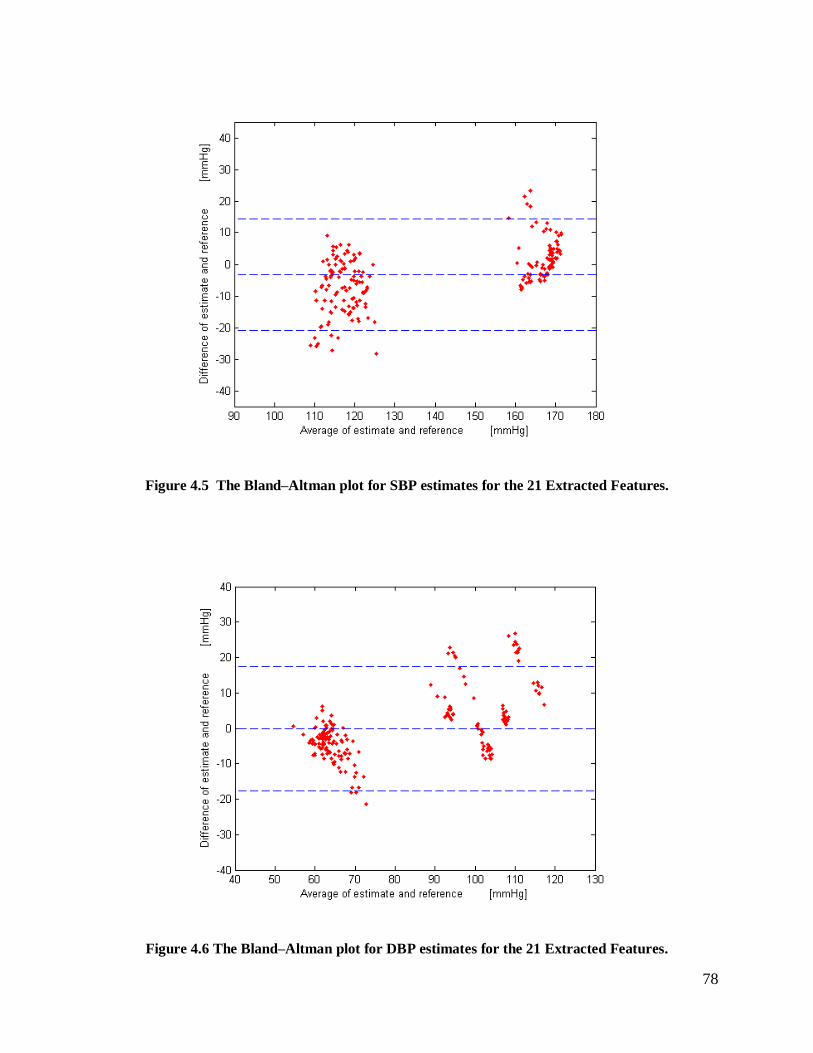
78
Figure 4.5 The Bland–Altman plot for SBP estimates for the 21 Extracted Features.
Figure 4.6 The Bland–Altman plot for DBP estimates for the 21 Extracted Features.
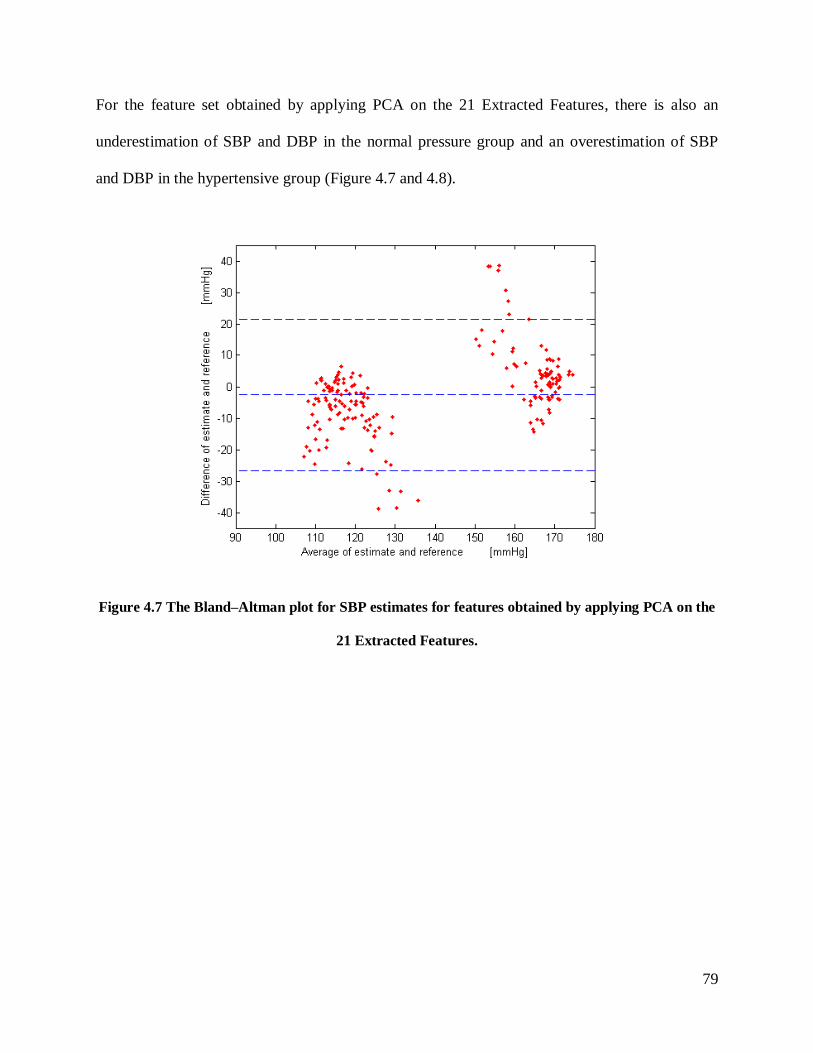
79
For the feature set obtained by applying PCA on the 21 Extracted Features, there is also an
underestimation of SBP and DBP in the normal pressure group and an overestimation of SBP
and DBP in the hypertensive group (Figure 4.7 and 4.8).
Figure 4.7 The Bland–Altman plot for SBP estimates for features obtained by applying PCA on the
21 Extracted Features.
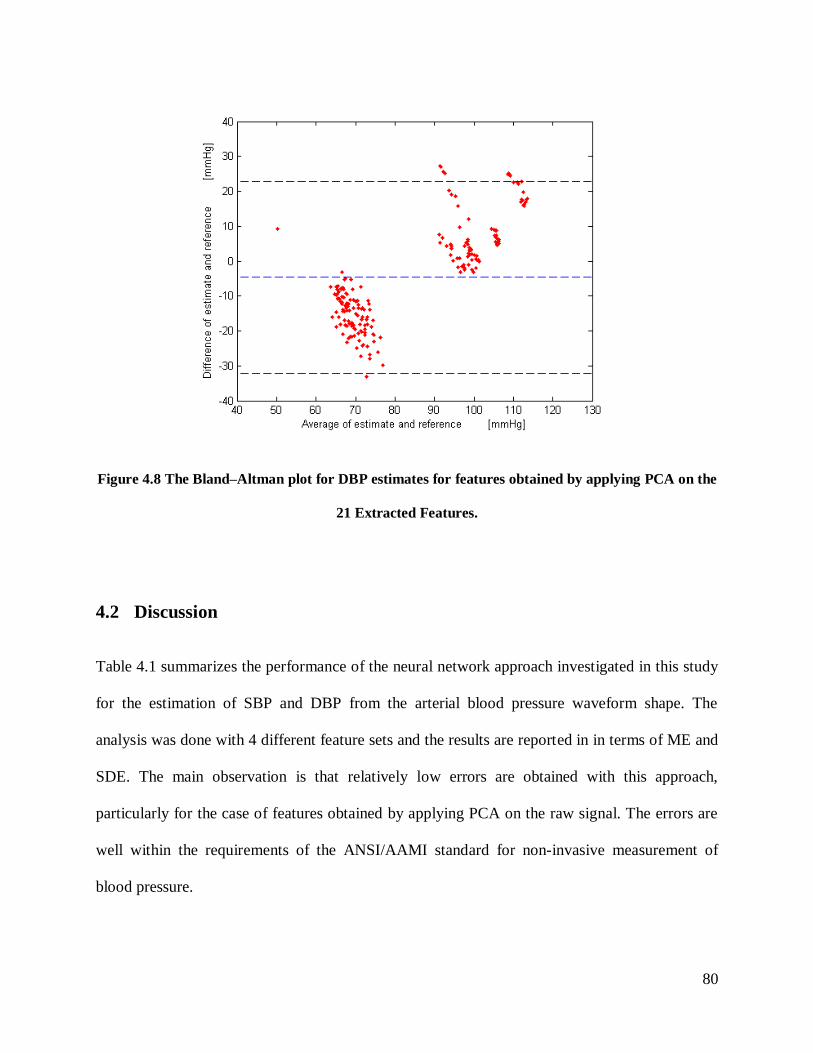
80
Figure 4.8 The Bland–Altman plot for DBP estimates for features obtained by applying PCA on the
21 Extracted Features.
4.2 Discussion
Table 4.1 summarizes the performance of the neural network approach investigated in this study
for the estimation of SBP and DBP from the arterial blood pressure waveform shape. The
analysis was done with 4 different feature sets and the results are reported in in terms of ME and
SDE. The main observation is that relatively low errors are obtained with this approach,
particularly for the case of features obtained by applying PCA on the raw signal. The errors are
well within the requirements of the ANSI/AAMI standard for non-invasive measurement of
blood pressure.
81
It can be concluded that in comparison to the raw signal, the dimension reduction method of
PCA achieves 0.66 and 0.38 mmHg improvement in terms of ME, and 2.00 and 2.47 mmHg
improvement in terms of SDE for SBP and DBP, respectively. The study also found that
extracting a set of features suggested in the literature gave poorer results in comparison with
using the raw signal, while applying PCA on the extracted features worsens the results further.
As mentioned in Chapter 2, Kurylyak et al. (2013a and 2013b) proposed a method to estimate BP
by ANN using the BP waveform, in their case the PPG signal [77, 82]. They used a feedforward
ANN with two hidden layers, with 35 and 20 neurons in the first and second hidden layers
respectively. More than 5000 pulses from the MIMIC II database were analyzed, and 21 features
were extracted from each of them. They obtained a Mean Absolute Error (MAE) of 3.8 mmHg
for SBP and 2.21 mmHg for DBP, respectively. The table 4.2 compares the estimation
performance for SBP and DBP that we obtained using the same 21 features as used by Kurylyak
et al. in terms of MAE. It should be noted that the difference in performance may be due to
several reasons. First, the patients and pulses included in the two studies would likely have been
different since we chose our patients randomly from a large database. Second, our training set is
considerably smaller than in their study, and so their network had a better opportunity to be
trained with a large variety of patients with different status (i.e. gender, age, and health status)
and pulse shapes. Third, when separating the pulses into the training, validation, and testing sets,
it is not clear if Kurylyak et al. separated patients as well, like we did in our study. That is, they
may have had pulses from the same patient in each of the three sets, which could augment
performance.
Additionally, although they report meeting the requirements of the ANSI/AAMI standard, they
evaluate the performance of their method in the form of mean absolute error (MAE) and standard
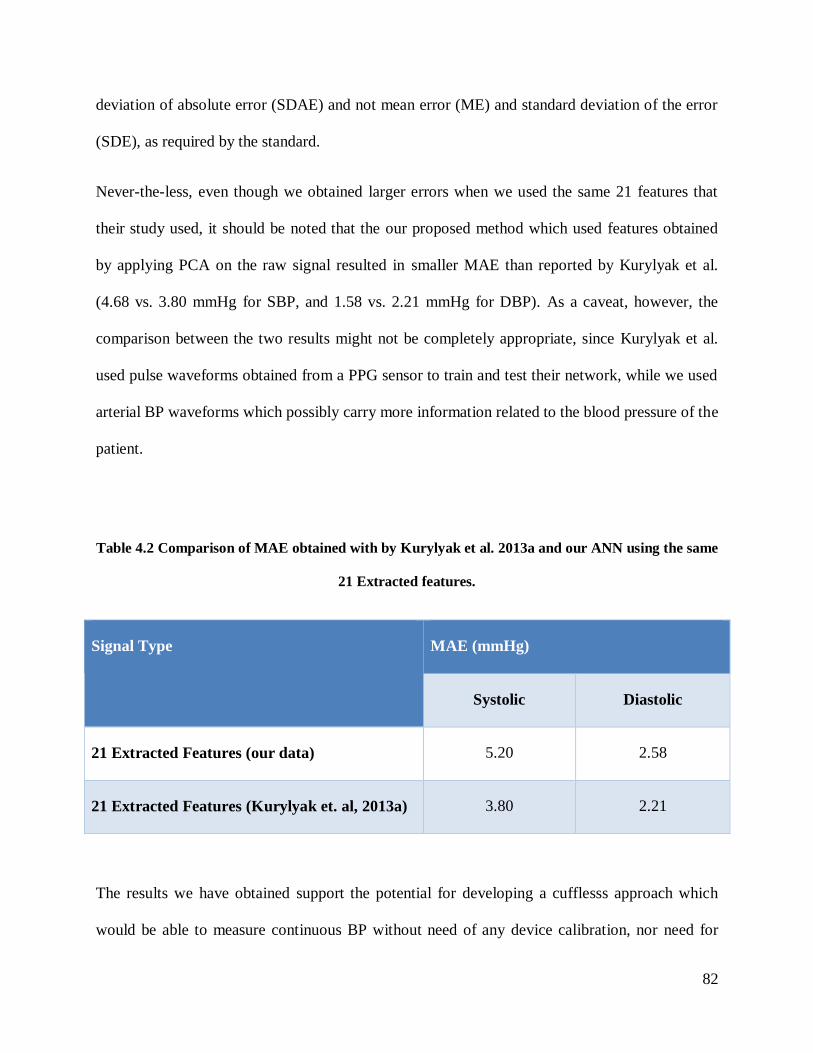
82
deviation of absolute error (SDAE) and not mean error (ME) and standard deviation of the error
(SDE), as required by the standard.
Never-the-less, even though we obtained larger errors when we used the same 21 features that
their study used, it should be noted that the our proposed method which used features obtained
by applying PCA on the raw signal resulted in smaller MAE than reported by Kurylyak et al.
(4.68 vs. 3.80 mmHg for SBP, and 1.58 vs. 2.21 mmHg for DBP). As a caveat, however, the
comparison between the two results might not be completely appropriate, since Kurylyak et al.
used pulse waveforms obtained from a PPG sensor to train and test their network, while we used
arterial BP waveforms which possibly carry more information related to the blood pressure of the
patient.
Table 4.2 Comparison of MAE obtained with by Kurylyak et al. 2013a and our ANN using the same
21 Extracted features.
Signal Type MAE (mmHg)
Systolic Diastolic
21 Extracted Features (our data) 5.20 2.58
21 Extracted Features (Kurylyak et. al, 2013a) 3.80 2.21
The results we have obtained support the potential for developing a cufflesss approach which
would be able to measure continuous BP without need of any device calibration, nor need for

83
recording ECG as is done in the Pulse Arrival Time (PAT) based methods. This approach could
potentially be implemented on a smart phone by taking advantage of the light sensor found in it
to record the pulse waveform from the finger. Thus there would not be a need to buy separate
hardware or/and wearable device. Currently, there is no such application or device available in
the market to continuously measure BP without cuff which meets the requirements of any
standard such as ANSI/AAMI, European, or British standards.
However an important limitation of the proposed method in terms of developing a cuffless
device is that this study relied on invasive waveforms whereas the non-invasive cuffless device
would get the waveforms through a surface sensor such as a pulse oximeter which may not
contain the same amount of information. On the other hand, using invasive waveforms ensured
that the reference values are exact and not obtained through another non-invasive method that
has its own errors and noise.

84
Conclusions and Future Work 5
5.1 Conclusions
The monitoring of vital signs is an important part of monitoring human health status. These days,
many major cellphone companies such as Apple, Microsoft, and Samsung are trying to monitor
human vital signs via their smartphones [83-85]. However, until now, they have only succeeded
in measuring the human pulse and heart rate (HR) throughthedevices’cameras.CurrentApps
such as the Samsung HR App or other “HearRate”Apps are able to measure the HR with a
touch of the index finger using the flash module, or with the camera. Their technology does this
by detecting pulsatile changes in finger colour as the result of the blood volume change. It takes
approximately 10-20 seconds to measure the HR value and the pulse signal. The principle of the
measurement process is the same as the one being used in the pulse oximeter, with the exception
that the pulse oximeter has two optical sensors (Red/IR), whereas the camera smartphone has
just one sensor, and it uses either yellow or red light [86-88].
The ultimate aim of our project is to develop algorithms to continuously measure BP possibly by
using a handheld device such as a smartphone, which could provide the pulse waveform through
an optical sensor or through the integrated camera. The algorithms developed and tested in this
thesis show that the pulse waveform (at least when measured intra-arterially), contains sufficient
information to allow the beat-by-beat estimation of systolic and diastolic pressure.
Unlike most of the cuffless approaches described in the literature, namely those based on
measuring PWV, PTT and PAT, the method described in this work uses a computational
intelligence approach on only one signal, the arterial pulse waveform, to estimate blood pressure.
With the limited set of test data and with the appropriate selection of input features, the Artificial

85
Neural Network was able to achieve excellent performance, with errors that are considerably
smaller than the limits required by the ANSI/AAMI standard for non-invasive measurement of
blood pressure. This performance was also consistent for individuals over a wide range of blood
pressure values. Another advantage of the method is that it is independent of the person whose
vital signs are being measured, and also does not need calibration over time or over subjects
since it does not rely on the amplitude of the waveform [72, 89]. If similar results can be
achieved with the pulse waveform measured non-invasively, then it can be readily incorporated
in smartphone, without the need for an extradevicetomeasureone’svitalsignsThis would be
an important contribution to blood pressure monitoring, particularly in the context of home
healthcare.
5.2 Contributions
In this thesis, we proposed a novel method based on Artificial Neural Networks to continuously
measure cuffless BP without the need of any device calibration, nor the need to record ECG as is
done in other published methods based on the PAT. There is no currently available cuffless
method or device which meets the requirements of any of the international standards, such as the
ANSI/AAMI, European, or British standards. The method was validated with a limited set of
patients having a wide range of blood pressures, and achieved very low errors when the input
features to the ANN were appropriately selected and processed. The work showed that a good set
of such features can be obtained by applying PCA on the samples of the raw signals to reduce the
dimensionality of the inputs to the network.
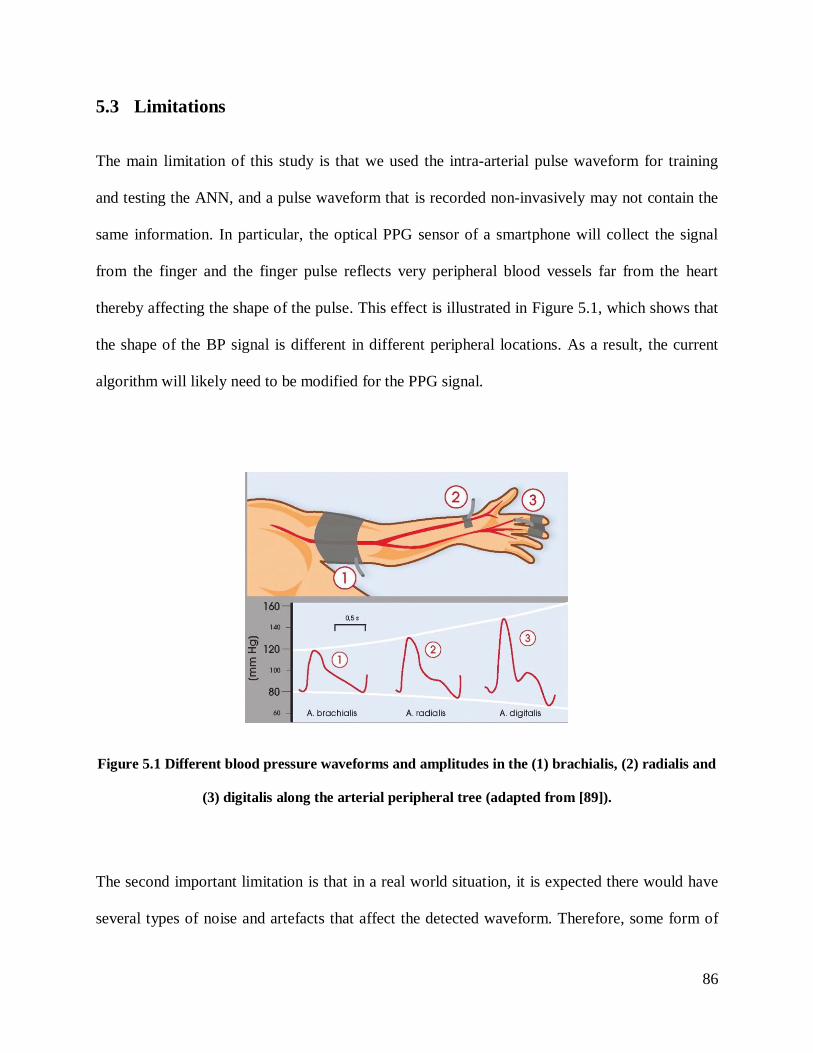
86
5.3 Limitations
The main limitation of this study is that we used the intra-arterial pulse waveform for training
and testing the ANN, and a pulse waveform that is recorded non-invasively may not contain the
same information. In particular, the optical PPG sensor of a smartphone will collect the signal
from the finger and the finger pulse reflects very peripheral blood vessels far from the heart
thereby affecting the shape of the pulse. This effect is illustrated in Figure 5.1, which shows that
the shape of the BP signal is different in different peripheral locations. As a result, the current
algorithm will likely need to be modified for the PPG signal.
Figure 5.1 Different blood pressure waveforms and amplitudes in the (1) brachialis, (2) radialis and
(3) digitalis along the arterial peripheral tree (adapted from [89]).
The second important limitation is that in a real world situation, it is expected there would have
several types of noise and artefacts that affect the detected waveform. Therefore, some form of
87
filtering will likely be required to suppress these artefacts in a preprocessing stage before
extracting the signal features. The third limitation of work is that the MIMC database that we
used does not have other information about the patients such as gender, age, height, weight,
health status and what kind of medications they were using during the measurement. These
factors can directly affect the characteristics of the signal and so affect the design and
performance of the neural network. A fourth limitation is the concern that the ANN is over-
learning because we used all the input signals to optimize the network and ultimately to train the
network. However, we mitigated this concern by testing the network with a completely fresh set
of data.
Although using the feature set obtained by applying PCA on the raw signal gave very promising
results, its usage is limited to particular applications. First, the ANN has a black box structure
that implicitly models the relationship between the BP and the pulse signal. For example, it is
very difficult to describe the weights at the nodes of the ANN. Therefore, in applications where
an explicit relationship between the pulse signal and the BP is required, the use of ANN is
limited. Never-the-less, it should be emphasized that in most applications that involve non-
invasive blood pressure estimation, characterizing an explicit relationship between the pulse
signal and BP is not required. Second, once the ANN has been trained, it is not possible to
incorporate additional knowledge such as new data or system settings into the network, without
repeating the whole training process. Third, to obtain good results, ANNs require a large training
dataset representative of all the target patient population.
88
5.4 Future work
The next phase of the project will be to use the photoplethysmogram signal (PPG) obtained from
the MIMIC II database (Physionet website) as input to the network, and an intra-arterial blood
pressure (ABP) signal recorded from the same subject would supply the reference values in the
same cardiac cycle. Then, the ANN will be used to train and test the data. However, there are
limitations to the MIMIC database such as the aforementioned lack of information regarding the
patients. Therefore, we plan to eventually build up our own database which includes the relevant
patient information as well as the PPG, ECG, and invasive or non-invasive BP values obtained
by trained observers, and covering a variety of patients with a wide range of blood pressures. An
ideal database would include 200 healthy subjects, 200 hypertension patients, and 200 patients
with other cardiovascular diseases such as peripheral vascular disease (PVD) and premature
ventricular contraction [90]. Theusageofeachindividual’sinformationsuchashealthstatus[70,
72, 75, 90], gender [70], height[70], age [70, 72], weight [70, 72], body mass index [72], heart
rate, and oxygen blood concentration [71] could help improve the performance of the algorithm.
The algorithm may encounter difficulties because of differences between the PPG shape and the
intra-arterial signal used in this study, and so may require more possessing stages for the input
signal before it can be utilized by the neural network. One approach may be to extract
appropriate features from PPG signal based on a transfer function between the intra-arterial
waveform and the PPG signal. For suppressing noise in the signal, based on the results of the
Kurylyak et al. (2013b), using Kalman filtering to remove the low and high-frequency noise may
improve the estimation values by up to 20% [82].

89
For future work, we could also try other machine learning techniques or a combination of them
such as ANN and fuzzy systems (or Neuro-Fuzzy systems) [75]. Based on the results shown in
[72], other machine learning approaches may be promising.

90
References
[1] World Health Organization, "A global brief on hypertension: silent killer, global public
health crisis: World Health Day 2013," 2013.
[2] World Health Organization, "Causes of death 2008: data sources and methods," 2011.
[3] Hypertension Canada, "Hypertension Canada," 2014.
[4] American standard for electronic and automated sphygmomanometers, ANSI/AAMI SP10
Standard, Arlington, TX, 1993. Bibliography 144.
[5] E. N. Marieb and K. Hoehn, Human Anatomy & Physiology. Pearson Education, 2009.
[6] T. G. Pickering, J. E. Hall, L. J. Appel, B. E. Falkner, J. Graves, M. N. Hill, D. W. Jones, T.
Kurtz, S. G. Sheps, E. J. Roccella and Subcommittee of Professional and Public Education of the
American Heart Association Council on High Blood Pressure Research, "Recommendations for
blood pressure measurement in humans and experimental animals: Part 1: blood pressure
measurement in humans: a statement for professionals from the Subcommittee of Professional
and Public Education of the American Heart Association Council on High Blood Pressure
Research," Hypertension, vol. 45, pp. 142, 2005.
[7] O. Alexis, "Providing best practice in manual blood pressure measurement," Br. J. Nurs.,
vol. 18, pp. 410, 2009.
[8] T. Valler-Jones and K. Wedgbury, "Measuring blood pressure using the mercury
sphygmomanometer," Br. J. Nurs., vol. 14, pp. 145, 2005.
[9] S. D. Bhatt, A. L. Hinderliter and G. A. Stouffer. Influence of sex on the accuracy of
Oscillometric‐Derived blood pressures. The Journal of Clinical Hypertension 13(2), pp. 112.
2011.
91
[10] R. A. Peura, "Blood pressure and sound," in Medical Instrumentation: Application and
Design, 4th ed., J. Webster, Ed. Wiley-India, pp. 297, 2010.
[11] W. Nichols, M. O'Rourke, & C. Vlachopoulos, McDonald's Blood Flow in Arteries:
Theoretical, Experimental and Clinical Principles. CRC Press, 2011.
[12] J. A. Potkay, "Long term, implantable blood pressure monitoring
systems," Biomed. Microdevices, vol. 10, pp. 379, 2008.
[13] A. Mosenkis and R. R. Townsend, "Automated Blood Pressure Measurement in Public
Places," The Journal of Clinical Hypertension, vol. 7, pp. 620, 2005.
[14] S. Buchanan, P. Orris and J. Karliner, "Alternatives to the mercury
sphygmomanometer," J. Public Health Policy, vol. 32, pp. 107, 2011.
[15] T. G. Papaioannou, A. D. Protogerou, K. S. Stamatelopoulos, M. Vavuranakis and C.
Stefanadis, "Non-invasive methods and techniques for central blood pressure estimation:
procedures, validation, reproducibility and limitations," Curr. Pharm. Des., vol. 15, pp. 245,
2009.
[16] J. Webster, Medical Instrumentation: Application and Design. Wiley-India, 2009.
[17] E. O’Brien, G. Beevers and G. Y. H. Lip, "ABC of hypertension: Blood pressure
measurement. Part IV-automated sphygmomanometry: self blood pressure measurement," BMJ:
British Medical Journal, vol. 322, pp. 1167, 2001.
[18] E. O'Brien, B. Waeber, G. Parati, J. Staessen and M. G. Myers, "Blood pressure measuring
devices: recommendations of the European Society of Hypertension," BMJ, vol. 322, pp. 531,
2001.
[19] G. C. Carroll, "Blood pressure monitoring," Crit. Care Clin., vol. 4, pp. 411-434, Jul,
1988.

92
[20] S. Norwood, A. Ruby, J. Civetta and V. Cortes, "Catheter-related infections and associated
septicemia." Chest, vol. 99, pp. 968, 1991.
[21] E. O'Brien, "Demise of the mercury sphygmomanometer and the dawning of a new era in
blood pressure measurement," Blood Press. Monit., vol. 8, pp. 19, 2003.
[22] T. G. Pickering, C. Pieper and C. B. Schechter, Ambulatory Monitoring and Blood Pressure
Variability. Science Press, 1991.
[23] A. Araghi, J. Bander and J. Guzman, "Arterial blood pressure monitoring in overweight
critically ill patients: invasive or noninvasive?" Critical Care, vol. 10, pp. R64, 2006.
[24] M. Semret, M. Zidehsarai and R. Agarwal, "Accuracy of oscillometric blood pressure
monitoring with concurrent auscultatory blood pressure in hemodialysis patients," Blood
Press. Monit., vol. 10, pp. 249, 2005.
[25] D. W. Jones, L. J. Appel, S. G. Sheps, E. J. Roccella and C. Lenfant, "Measuring blood
pressure accurately: new and persistent challenges," JAMA, vol. 289, pp. 1027, 2003.
[26] A. Bur, H. Herkner, M. Vlcek, C. Woisetschlager, U. Derhaschnig, G. Delle Karth, A. N.
Laggner and M. M. Hirschl, "Factors influencing the accuracy of oscillometric blood pressure
measurement in critically ill patients," Crit. Care Med., vol. 31, pp. 793, 2003.
[27] U. Tholl, K. Forstner and M. Anlauf, "Measuring blood pressure: pitfalls and
recommendations," Nephrology Dialysis Transplantation, vol. 19, pp. 766, 2004.
[28] D. W. McKay, N. R. Campbell, L. S. Parab, A. Chockalingam and J. G. Fodor, "Clinical
assessment of blood pressure." J. Hum. Hypertens., vol. 4, pp. 639, 1990.
[29] G. Van Montfrans, G. Van Der Hoeven, J. Karemaker, W. Wieling and A. Dunning,
"Accuracy of auscultatory blood pressure measurement with a long
cuff." Br. Med. J. (Clin. Res. Ed), vol. 295, pp. 354, 1987.

93
[30] T. G. Pickering, "Blood pressure measurement and detection of hypertension," The Lancet,
vol. 344, pp. 31, 1994.
[31] F. S. Cattivelli and H. Garudadri, "Noninvasive cuffless estimation of blood pressure from
pulse arrival time and heart rate with adaptive calibration," in Wearable and Implantable Body
Sensor Networks, 2009. BSN 2009. Sixth International Workshop On, pp. 114, 2009.
[32] G. Mancia, M. Bombelli, R. Facchetti, F. Madotto, G. Corrao, F. Q. Trevano, G. Grassi and
R. Sega, "Long-term prognostic value of blood pressure variability in the general population:
results of the Pressioni Arteriose Monitorate e Loro Associazioni Study," Hypertension, vol. 49,
pp. 1265, 2007.
[33] M. P. Devbhandari, Z. Shariff and A. J. Duncan, "Skin necrosis in a critically ill patient due
to a blood pressure cuff," J. Postgrad. Med., vol. 52, pp. 136, 2006.
[34] R. A. Reeves, "Does This Patient Have Hypertension?" JAMA: The Journal of the
American Medical Association, vol. 273, pp. 1211, 1995.
[35] T. G. Pickering, W. Gerin, J. E. Schwartz, T. M. Spruill and K. W. Davidson, "Franz
Volhard lecture: should doctors still measure blood pressure? The missing patients with masked
hypertension," J. Hypertens., vol. 26, pp. 2259, 2008.
[36] G. Parati, L. R. Krakoff and P. Verdecchia, "Methods of measurements: home and
ambulatory blood pressure monitoring," Blood Press. Monit., vol. 15, pp. 100, 2010.
[37] T. Akpolat, M. Dilek, T. Aydogdu, Z. Adibelli, D. G. Erdem and E. Erdem, "Home
sphygmomanometers: validation versus accuracy," Blood Press. Monit., vol. 14, pp. 26, 2009.
[38] M. G. Myers, M. Valdivieso, A. Kiss and S. W. Tobe, "Comparison of two automated
sphygmomanometers for use in the office setting," Blood Press. Monit., vol. 14, pp. 45, 2009.

94
[39] M. Stolt, G. Sjonell, H. Astrom, S. Rossner and L. Hansson, "Improved accuracy of indirect
blood pressure measurement in patients with obese arms," Am. J. Hypertens., vol. 6, pp. 66,
1993.
[40] P. E. Nielsen, B. Larsen, P. Holstein and H. L. Poulsen, "Accuracy of auscultatory blood
pressure measurements in hypertensive and obese subjects," Hypertension, vol. 5, pp. 122, 1983.
[41] G. Smith, "Device Bullentin- Blood Pressure Monitoring Devices," 2006.
[42] T. G. Pickering, "The case for a hybrid sphygmomanometer," Blood Press. Monit., vol. 6,
pp. 177, 2001.
[43] M. J. Burke, H. M. Towers, K. O'Malley, D. J. Fitzgerald and E. T. O'Brien,
"Sphygmomanometers in hospital and family practice: problems and
recommendations." Br. Med. J. (Clin. Res. Ed), vol. 285, pp. 469, 1982.
[44] R. H. Bailey, V. L. Knaus and J. H. Bauer, "Aneroid sphygmomanometers: an assessment of
accuracy at a university hospital and clinics," Arch. Intern. Med., vol. 151, pp. 1409, 1991.
[45] V. J. Canzanello, P. L. Jensen and G. L. Schwartz, "Are aneroid sphygmomanometers
accurate in hospital and clinic settings?" Arch. Intern. Med., vol. 161, pp. 729, 2001.
[46] D. Mion and A. M. Pierin, "How accurate are sphygmomanometers?" J. Hum. Hypertens.,
vol. 12, pp. 245, 1998.
[47] S. A. Yarows and K. Qian, "Accuracy of aneroid sphygmomanometers in clinical usage:
University of Michigan experience," Blood Press. Monit., vol. 6, pp. 101, 2001.
[48] F. Tasker, A. De Greeff and A. Shennan, "Development and validation of a blinded hybrid
device according to the European Hypertension Society protocol: Nissei DM-
3000," J. Hum. Hypertens., vol. 24, pp. 609, 2010.

95
[49] G. S. Stergiou, P. P. Giovas, C. P. Gkinos and D. G. Tzamouranis, "Validation of the A&D
UM-101 professional hybrid device for office blood pressure measurement according to the
International Protocol," Blood Press. Monit., vol. 13, pp. 37, 2008.
[50] T. G. Pickering, "What will replace the mercury sphygmomanometer?" Blood
Press. Monit., vol. 8, pp. 23, 2003.
[51] G. W. Mauck, C. R. Smith, L. A. Geddes and J. D. Bourland, "The meaning of the point of
maximum oscillations in cuff pressure in the indirect measurement of blood pressure—part
ii," J. Biomech. Eng., vol. 102, pp. 28, 1980.
[52] G. A. Van Montfrans, "Oscillometric blood pressure measurement: progress and
problems," Blood Press. Monit., vol. 6, pp. 287, 2001.
[53] J. M. Mallion, J. P. Baguet and G. Mancia, "European Society of Hypertension Scientific
Newsletter: Clinical value of ambulatory blood pressure monitoring," J. Hypertens., vol. 24, pp.
2327, 2006.
[54] A. Charmoy, G. Wurzner, C. Ruffieux, C. Hasler, F. Cachat, B. Waeber and M. Burnier,
"Reactive rise in blood pressure upon cuff inflation: cuff inflation at the arm causes a greater rise
in pressure than at the wrist in hypertensive patients," Blood Press. Monit., vol. 12, pp. 275,
2007.
[55] N. McGowan and P. L. Padfield, "Self blood pressure monitoring: a worthy substitute for
ambulatory blood pressure&quest," J. Hum. Hypertens., vol. 24, pp. 801, 2010.
[56] T. H. Westhoff, H. Straub-Hohenbleicher, S. Schmidt, M. Tölle, W. Zidek and M. Giet,
"Convenience of ambulatory blood pressure monitoring: comparison of different
devices," Blood Press. Monit, vol. 10, pp. 239, 2005.

96
[57] L. R. Krakoff, "Cost-Effectiveness of Ambulatory Blood Pressure," Hypertension, vol. 47,
pp. 29, 2006.
[58] World Health Organization, and International Society of Hypertension Writing Group,
"2003 World Health Organization (WHO)/International Society of Hypertension (ISH) statement
on management of hypertension," vol. 21, pp. 1983, 2003.
[59] C. C. Y. Poon, Y. M. Wong and Y. T. Zhang, "M-health: The development of cuff-less and
wearable blood pressure meters for use in body sensor networks," Life Science Systems and
Applications Workshop, 2006. IEEE/NLM, pp. 1, 2006.
[60] C. C. Y. Poon and Y. T. Zhang, "Cuff-less and noninvasive measurements of arterial blood
pressure by pulse transit time," Engineering in Medicine and Biology Society, 2005. IEEE-EMBS
2005. 27th Annual International Conference of The IEEE, pp. 5877, 2005
[61] J. Espina, T. Falck, J. Muehlsteff and X. Aubert, "Wireless body sensor network for
continuous cuff-less blood pressure monitoring," Medical Devices and Biosensors, 2006. 3rd
IEEE/EMBS International Summer School On, pp. 11, 2006.
[62] J. Muehlsteff, X. L. Aubert and M. Schuett, "Cuffless estimation of systolic blood pressure
for short effort bicycle tests: The prominent role of the pre-ejection period," Engineering in
Medicine and Biology Society, 2006. EMBS'06. 28th Annual International Conference of the
IEEE, pp. 5088, 2006.
[63] J. Muehlsteff, X. A. Aubert and G. Morren, "Continuous cuff-less blood pressure
monitoring based on the pulse arrival time approach: The impact of posture," Engineering in
Medicine and Biology Society, 2008. EMBS 2008. 30th Annual International Conference of the
IEEE, pp. 1691, 2008.

97
[64] J. C. Bramwell and A. V. Hill, "The Velocity of the Pulse Wave in Man," Proceedings of
the Royal Society of London. Series B, Containing Papers of a Biological Character, pp. 298,
1922.
[65] D. J. Hughes, C.F. Babbs, L. A. Geddes and J. D.Bourland, "Measurement ofYoung’s
modulus of elasticity of the canine aorta with ultrasound," Ultrasonic Imaging, vol. 1, pp. 356,
1979.
[66] W. Chen, T. Kobayashi, S. Ichikawa, Y. Takeuchi and T. Togawa, "Continuous estimation
of systolic blood pressure using the pulse transit time and intermittent calibration," Medical and
Biological Engineering and Computing, vol. 38, pp. 567, 2000.
[67] Y. T. Zhang , C. C.Y Poon, C. H. Chan, M. W. W. Tsang, and K. F. Wu, "A health-shirt
using e-textile materials for the continuous and cuffless monitoring of arterial blood
pressure," Medical Devices and Biosensors, 2006. 3rd IEEE/EMBS International Summer School
on, pp. 86, 2006.
[68] W. B. Gu, C. C. Y. Poon, M. Y. Sy, H. K. Leung, Y. P. Liang and Y. T. Zhang, "A h-Shirt-
Based Body Sensor Network for Cuffless Calibration and Estimation of Arterial Blood
Pressure," 2009 Body Sensor Networks, pp. 151, 2009.
[69] J. Espina, T. Falck, J. Muehlsteff, Y. Jin, M. A. Adan and X. Aubert, "Wearable body
sensor network towards continuous cuff-less blood pressure monitoring," Medical Devices and
Biosensors, 2008. ISSS-MDBS 2008. 5th International Summer School and Symposium On, pp.
28, 2008.
[70] S. Suzuki and K. Oguri, "Cuffless blood pressure estimation by error-correcting output
coding method based on an aggregation of AdaBoost with a photoplethysmograph sensor,"

98
Engineering in Medicine and Biology Society, 2009. EMBC 2009. Annual International
Conference of the IEEE, pp. 6765, 2009.
[71] V. Abouei, H. Sharifian, F. Towhidkhah, V. R. Nafisi, and H. Abouie, "Using neural
network in order to predict hypotension of hemodialysis patients," Electrical Engineering
(ICEE), 2011 19th Iranian Conference on, vol. 19, pp. 1, 2011.
[72] E. Monte-Moreno, "Non-invasive estimate of blood glucose and blood pressure from a
photoplethysmograph by means of machine learning techniques," Artif. Intell. Med., vol. 53,
pp. 127, Oct, 2011.
[73] K. L. Priddy and P. E. Keller, Artificial Neural Networks: An Introduction. SPIE Press,
2005.
[74] J. A. Reggia, "Neural computation in medicine," Artif. Intell. Med., vol. 5, pp. 143, 1993.
[75] M. Soltane, M. Ismail, and Z. A. Abdul Rashid., "Artificial Neural Networks (ANN)
Approach to PPG Signal Classification," International Journal of Computing & Information
Sciences 2, vol. 2, pp. 58, 2004.
[76] Association for the Advancement of Medical Instrumentation. American National Standard.
Manual, electronic or automated sphygmomanometers ANSI/AAMI SP10-2002/A1. 3330
Washington Boulevard, Suite 400, Arlington, VA 22201-4598, USA: AAMI; 2006.
[77] Y. Kurylyak, F. Lamonaca, and D. Grimaldi, "A neural network-based method for
continuous blood pressure estimation from a PPG signal," Instrumentation and Measurement
Technology Conference (I2MTC), 2013 IEEE International, vol. 12, pp. 280, 2013.
[78] X. F. Teng and Y. T. Zhang., "Continuous and noninvasive estimation of arterial blood
pressure using a photoplethysmographic approach," Engineering in Medicine and Biology

99
Society, 2003. Proceedings of the 25th Annual International Conference of the IEEE, vol. 4, pp.
3153, 2003.
[79] S. P. Linder, S. M. Wendelken, E. Wei, and S. P. McGrath., "Using the morphology of
photoplethysmogram peaks to detect changes in posture," posture.Journal of clinical monitoring
and computing, vol. 20, pp. 151, 2006.
[80] D. G. Altman and J. M. Bland., "Measurement in medicine: the analysis of method
comparison studies," The statistician, pp. 307, 1983.
[81] J. M. Bland and D. G. Altman., "Statistical methods for assessing agreement between two
methods of clinical measurement," The lancet, vol. 327, pp. 307, 1986.
[82] Y. Kurylyak, K. Barbe, F. Lamonaca, D. Grimaldi, and W. V. Moer, "Photoplethysmogram-
based Blood pressure evaluation using Kalman filtering and Neural Networks," Medical
Measurements and Applications Proceedings (MeMeA), 2013 IEEE International Symposium
on, pp. 170, 2013.
[83] M. Gurman, This is Healthbook, Apple’s major first step into health & fitness tracking.
Available: http://9to5mac.com/2014/03/17/this-is-healthbook-apples-first-major-step-into-health-
fitness-tracking/.
[84] P. Pachal, How the Samsung Galaxy S5 Measures Your Heart Rate. Available:
http://mashable.com/2014/02/25/samsung-gs5-heart-rate/.
[85] N. Tue. Manage your personal health records with lumia. Available:
http://conversations.nokia.com/2014/09/02/manage-personal-health-records-lumia/.
[86] K. Matsumura, P. Rolfe, J. Lee and T. Yamakoshi, "iPhone 4s Photoplethysmography:
Which Light Color Yields the Most Accurate Heart Rate and Normalized Pulse Volume Using
100
the iPhysioMeter Application in the Presence of Motion Artifact?" PloS One, vol. 9, pp. 91205,
2014.
[87] M. J. Gregoski, M. Mueller, A. Vertegel, A. Shaporev, B. B. Jackson, R. M. Frenzel, S. M.
Sprehn and F. A. Treiber, "Development and validation of a smartphone heart rate acquisition
application for health promotion and wellness telehealth applications," International Journal of
Telemedicine and Applications, vol. 2012, pp. 1, 2012.
[88] E. Jonathan and M. Leahy, "Investigating a smartphone imaging unit for
photoplethysmography," Physiol. Meas., vol. 31, pp. N79, 2010.
[89] E. Sackl-Pietsch, "Continuous non-invasive arterial pressure shows high accuracy in
comparison to invasive intra-arterial blood pressure measurement," Unpublished manuscript,
2010.
[90] M. A. Allen, "Development of a neural network screening aid for diagnosing lower limb
peripheral vascular disease from photoelectric plethysmography pulse
waveforms," Physiol. Meas. , vol. 14, pp. 13, 1993.

101
Appendix
Table A-1 – Blood Pressure Estimation Results in Individual Pulse Waveforms. Reference
values of SBP and DBP and estimates obtained using Artificial Neural Networks based on 4
feature sets for each individual pulse from 22 patients. See text for details on the feature sets.
Abbreviations: Est.: Estimated, PCA: Principal Component Analysis, EF: Extracted Features.
SBP
DBP
Ref. Est.
Raw
Est. Raw +
PCA
Est.
21EF
Est. 21EF+
PCA
Ref. Est.
Raw
Est. Raw +
PCA
Est.
21EF
Est.
21EF
+ PCA
1 121.72 131.10 115.57 121.73 131.90 60.86 59.76 59.61 77.61 85.21
2 121.72 121.01 114.61 125.65 136.66 61.45 63.92 60.70 73.74 81.64
3 119.57 119.30 113.52 113.25 113.24 61.45 66.07 59.19 65.55 71.62
4 122.90 125.03 120.47 117.19 122.85 62.23 67.21 60.17 70.90 82.60
5 122.90 118.38 114.96 119.67 123.26 60.27 64.08 61.92 71.50 77.99
6 122.90 127.94 119.12 121.14 123.87 61.25 75.57 58.83 79.28 81.31
7 124.46 126.59 114.67 119.42 119.46 63.99 67.05 60.82 76.61 77.47
8 124.46 129.33 114.81 124.56 134.01 60.27 70.49 60.55 72.61 81.04
9 121.33 140.89 114.26 126.95 121.10 60.08 82.19 55.91 78.21 79.32
10 124.46 117.97 119.22 118.38 124.82 63.21 63.21 59.47 67.50 80.02

102
11 114.68 120.84 120.41 124.03 122.96 58.12 61.07 59.71 65.49 76.53
12 116.44 119.36 116.39 131.73 147.87 59.69 63.55 59.82 69.84 87.64
13 116.44 122.00 115.18 128.91 141.36 59.69 62.12 59.62 69.41 83.98
14 115.85 118.30 115.53 129.43 128.79 60.27 59.61 60.62 69.64 78.59
15 113.89 118.77 114.75 124.78 134.36 59.88 62.36 61.27 68.47 83.87
16 118.40 124.37 121.81 125.22 145.02 60.27 62.03 59.53 67.13 86.95
17 119.77 118.24 115.55 124.11 128.66 59.69 63.59 57.32 64.30 78.31
18 119.77 118.68 114.14 123.55 129.35 60.08 60.55 58.25 64.00 77.89
19 117.81 117.60 114.69 123.32 122.49 58.51 59.63 59.01 64.22 77.05
20 115.46 116.54 115.06 122.40 122.04 59.69 59.91 59.04 65.55 76.84
21 111.55 115.68 114.62 122.97 139.21 57.93 59.14 60.78 61.34 79.52
22 110.18 118.61 114.99 124.97 123.38 55.77 58.24 60.88 63.40 74.60
23 108.02 122.19 116.62 121.47 130.48 56.16 62.99 60.51 63.83 79.55
24 111.15 115.73 118.10 115.15 111.95 57.73 61.41 61.14 60.81 73.74
25 111.15 112.50 114.45 139.56 149.61 57.93 59.52 60.79 66.39 82.89
26 110.57 116.61 114.82 115.23 114.24 57.73 60.28 61.34 62.33 72.46
27 108.61 116.23 114.12 115.19 113.18 56.16 61.53 61.06 57.92 72.23

103
28 108.41 114.63 117.21 121.82 145.24 57.73 63.43 61.36 62.09 84.91
29 112.13 118.55 118.15 121.89 134.70 59.49 63.34 61.00 64.03 82.30
30 112.13 118.09 115.06 129.26 122.49 59.49 60.40 61.77 66.70 73.91
31 115.07 114.84 114.13 115.28 125.01 60.08 60.69 60.84 62.80 79.69
32 117.03 113.44 114.53 116.17 126.22 59.49 61.18 58.51 61.83 77.35
33 117.03 118.73 117.92 121.05 134.03 58.32 59.12 58.71 63.53 79.93
34 114.09 117.40 115.00 118.05 120.38 57.14 58.64 58.05 60.65 79.34
35 114.09 115.55 116.73 111.62 110.15 57.14 59.26 59.68 61.45 75.26
36 116.05 141.21 112.65 117.48 129.98 54.99 56.43 54.78 54.29 45.65
37 116.05 118.59 114.12 134.17 139.60 56.36 53.32 53.61 60.56 89.38
38 115.85 115.02 116.67 115.12 123.04 56.36 66.23 60.34 63.56 77.30
39 115.85 122.34 118.16 115.99 120.31 59.10 63.52 60.38 64.48 80.46
40 113.11 114.44 113.53 117.43 117.64 58.71 61.17 61.79 63.10 75.63
41 119.37 115.79 113.60 126.74 124.42 64.19 63.36 61.56 64.19 75.81
42 117.61 118.29 114.63 126.37 153.75 63.99 64.99 62.27 64.69 84.87
43 116.63 118.32 114.28 121.62 121.12 61.84 65.67 61.48 58.87 82.95
44 117.61 122.55 117.70 125.03 124.52 65.17 63.71 62.47 64.14 79.15

104
45 120.94 123.12 115.16 126.60 129.92 64.97 65.42 61.09 64.13 78.44
46 120.94 120.40 115.49 123.34 129.66 64.77 66.22 62.22 62.74 78.43
47 118.98 117.72 114.96 124.73 125.25 64.38 62.86 61.64 64.45 76.91
48 117.22 116.95 114.89 122.31 122.96 64.38 63.47 62.27 59.25 81.03
49 119.96 120.56 118.12 123.51 128.21 65.95 67.47 61.83 62.24 82.97
50 119.96 116.73 114.71 122.12 119.42 64.97 64.20 61.91 58.89 78.50
51 118.40 123.20 110.94 127.07 115.83 61.84 65.97 62.56 64.38 73.83
52 114.48 121.76 113.87 126.48 116.15 60.08 62.75 62.83 65.51 74.53
53 111.35 114.12 115.64 126.57 114.91 60.67 61.03 62.31 62.52 74.79
54 112.92 116.14 113.39 126.39 112.66 61.45 61.24 62.59 63.28 73.85
55 114.09 117.21 115.50 126.75 111.97 61.45 64.18 62.91 62.61 75.49
56 117.61 120.07 119.83 127.07 114.39 62.82 64.05 62.67 65.06 76.30
57 117.61 115.69 111.44 126.74 113.76 62.23 62.43 62.67 64.93 74.40
58 115.46 117.16 113.59 126.95 114.11 61.06 61.89 62.78 64.26 73.89
59 112.72 118.19 115.21 126.55 114.19 59.69 62.57 63.16 62.51 73.70
60 112.92 119.26 117.71 126.34 116.54 60.86 66.00 63.30 63.14 74.39
61 117.61 118.95 116.26 113.00 113.97 62.43 64.69 62.83 63.61 70.17
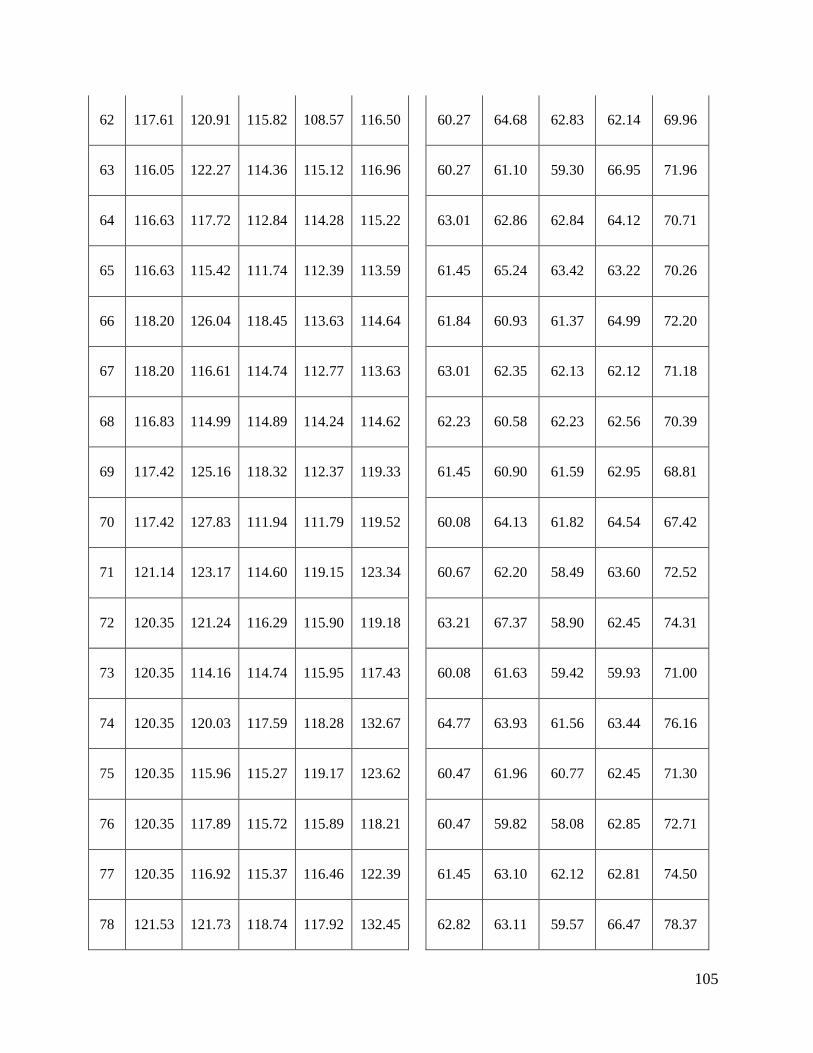
105
62 117.61 120.91 115.82 108.57 116.50 60.27 64.68 62.83 62.14 69.96
63 116.05 122.27 114.36 115.12 116.96 60.27 61.10 59.30 66.95 71.96
64 116.63 117.72 112.84 114.28 115.22 63.01 62.86 62.84 64.12 70.71
65 116.63 115.42 111.74 112.39 113.59 61.45 65.24 63.42 63.22 70.26
66 118.20 126.04 118.45 113.63 114.64 61.84 60.93 61.37 64.99 72.20
67 118.20 116.61 114.74 112.77 113.63 63.01 62.35 62.13 62.12 71.18
68 116.83 114.99 114.89 114.24 114.62 62.23 60.58 62.23 62.56 70.39
69 117.42 125.16 118.32 112.37 119.33 61.45 60.90 61.59 62.95 68.81
70 117.42 127.83 111.94 111.79 119.52 60.08 64.13 61.82 64.54 67.42
71 121.14 123.17 114.60 119.15 123.34 60.67 62.20 58.49 63.60 72.52
72 120.35 121.24 116.29 115.90 119.18 63.21 67.37 58.90 62.45 74.31
73 120.35 114.16 114.74 115.95 117.43 60.08 61.63 59.42 59.93 71.00
74 120.35 120.03 117.59 118.28 132.67 64.77 63.93 61.56 63.44 76.16
75 120.35 115.96 115.27 119.17 123.62 60.47 61.96 60.77 62.45 71.30
76 120.35 117.89 115.72 115.89 118.21 60.47 59.82 58.08 62.85 72.71
77 120.35 116.92 115.37 116.46 122.39 61.45 63.10 62.12 62.81 74.50
78 121.53 121.73 118.74 117.92 132.45 62.82 63.11 59.57 66.47 78.37

106
79 121.53 118.55 114.20 115.39 117.29 63.01 63.66 61.42 62.80 72.17
80 121.53 128.36 117.21 118.50 132.41 67.12 77.17 62.51 67.01 79.50
81 103.13 118.93 120.47 121.83 118.30 60.08 65.37 61.75 64.47 70.85
82 98.04 113.08 112.59 121.59 117.25 60.27 71.14 62.81 60.00 70.83
83 98.24 111.99 106.05 122.58 117.75 65.17 70.95 68.62 72.24 73.29
84 104.31 116.24 114.96 121.31 118.40 60.08 67.81 62.17 66.24 69.55
85 104.31 111.55 115.68 121.41 114.68 63.01 73.92 65.39 60.92 72.57
86 101.76 109.65 116.72 123.29 118.71 63.99 70.40 67.13 70.97 75.02
87 101.76 109.75 111.49 125.45 122.31 61.25 66.17 61.32 63.87 69.40
88 102.94 113.26 110.67 122.85 116.02 61.25 67.77 62.92 68.52 73.90
89 103.72 113.99 120.56 123.47 122.08 62.04 64.16 63.77 66.38 69.24
90 103.72 117.35 115.17 127.92 120.89 60.47 63.54 62.29 63.32 70.04
91 110.76 108.63 110.69 114.68 109.64 63.80 61.44 62.75 70.89 79.75
92 112.92 115.56 114.68 116.84 116.71 64.97 66.62 63.79 68.74 68.17
93 112.92 116.35 110.33 115.75 110.07 64.97 65.55 65.11 71.00 81.05
94 112.92 120.07 120.34 116.06 113.54 64.97 68.04 65.11 68.32 69.92
95 112.92 116.77 110.84 114.84 112.97 64.58 76.37 64.58 66.33 69.78

107
96 108.81 128.51 113.43 118.17 112.42 64.58 67.89 64.69 75.07 83.45
97 112.52 118.49 115.37 116.92 112.62 66.34 65.02 64.54 69.54 71.56
98 112.52 113.18 112.08 115.97 110.46 66.54 69.38 66.75 68.59 80.56
99 113.11 123.80 118.66 114.52 110.49 67.71 62.80 65.13 71.26 75.09
100 113.11 130.55 111.06 120.54 113.79 67.51 62.24 65.17 74.20 78.91
101 113.11 130.55 111.06 120.54 113.79 67.51 62.24 65.17 74.20 78.91
102 113.31 113.18 111.17 115.86 113.20 63.21 58.29 61.09 64.01 81.51
103 111.15 117.03 112.24 128.23 116.33 65.36 67.47 64.54 79.06 87.29
104 115.07 118.26 115.25 119.90 120.09 63.99 64.61 62.89 71.13 82.16
105 115.07 111.85 111.39 117.63 116.24 62.04 66.67 62.87 69.90 80.13
106 108.22 119.62 115.10 127.52 121.37 62.04 71.40 61.05 83.39 91.95
107 113.70 116.09 117.24 119.92 118.66 62.62 65.57 62.75 70.48 82.22
108 113.70 111.67 111.45 121.97 118.37 63.01 67.20 62.43 76.75 86.12
109 110.37 121.97 118.09 118.87 115.97 63.99 68.64 62.63 72.44 85.15
110 111.94 114.61 114.99 119.87 117.73 62.62 63.50 62.91 69.12 77.71
111 111.94 112.23 110.88 130.07 118.06 62.62 69.43 62.41 79.39 88.79
112 175.34 169.51 171.57 161.80 163.74 120.35 115.73 117.25 101.33 103.46

108
113 175.34 168.50 168.11 165.16 166.46 120.94 118.20 117.50 108.18 103.39
114 171.23 167.41 168.10 166.56 171.27 120.55 120.19 118.88 109.94 104.58
115 175.34 173.87 173.26 166.43 171.11 120.55 115.05 118.71 113.92 104.83
116 176.13 171.67 166.98 166.36 171.46 122.50 117.29 117.60 110.82 104.61
117 176.13 167.48 167.05 166.70 171.24 122.11 119.13 120.78 109.13 104.56
118 171.04 165.62 167.92 166.11 171.29 120.94 117.52 117.50 110.96 104.61
119 176.32 172.39 173.23 165.39 166.66 120.94 116.35 122.18 111.24 103.53
120 175.93 169.53 167.40 166.49 172.49 121.72 120.91 120.00 109.78 104.72
121 162.04 163.65 173.21 165.54 144.41 120.94 111.37 120.23 99.65 96.10
122 162.04 160.83 168.10 165.42 147.61 121.53 104.27 122.94 99.67 96.64
123 160.67 162.17 168.48 160.23 142.57 121.53 111.29 122.73 95.41 97.07
124 159.69 158.04 170.59 164.56 142.74 121.33 113.41 120.69 97.86 96.14
125 163.60 166.11 172.67 165.49 149.24 121.33 102.04 119.18 100.00 98.80
126 163.60 160.76 168.25 163.96 157.09 122.31 115.28 122.75 97.93 99.80
127 160.86 156.03 168.27 166.35 155.03 122.31 113.04 121.69 99.84 100.14
128 163.41 162.56 172.42 164.26 159.25 122.31 112.68 120.38 98.57 102.54
129 163.80 155.90 168.83 163.29 156.11 123.48 113.75 121.61 96.67 100.71

109
130 172.41 165.36 168.52 167.06 167.99 110.18 111.26 104.40 103.68 101.39
131 172.41 164.24 167.42 168.46 170.16 110.18 109.60 104.71 105.43 101.36
132 166.73 160.68 168.19 166.93 170.83 109.00 110.94 104.68 105.37 101.67
133 169.47 169.48 172.72 167.72 168.54 109.00 109.26 103.78 106.47 102.03
134 171.43 168.19 168.80 168.08 167.91 109.59 109.98 103.43 104.07 100.69
135 171.82 164.87 168.09 167.07 169.05 109.98 107.97 104.56 106.91 101.11
136 166.54 165.52 168.14 169.25 169.91 109.00 108.73 104.45 107.01 99.82
137 169.28 170.09 172.43 169.74 172.79 109.00 105.65 104.06 105.91 102.35
138 171.62 165.35 169.36 167.86 168.59 109.39 108.82 103.46 106.94 102.05
139 171.04 165.03 170.59 169.48 165.35 109.00 110.44 104.12 106.88 103.20
140 171.04 166.65 166.81 167.52 166.67 109.39 106.28 104.47 105.08 103.22
141 165.17 165.91 165.59 169.29 165.26 108.22 110.38 104.23 106.57 103.55
142 168.69 171.84 172.66 168.99 166.51 108.22 109.98 102.92 107.22 102.80
143 171.04 167.71 170.08 169.37 163.67 108.81 106.01 104.40 105.93 103.67
144 171.04 165.12 167.71 169.26 165.26 109.20 107.91 104.44 106.22 103.51
145 165.95 165.43 168.18 169.36 164.59 108.22 111.40 104.59 106.44 103.46
146 168.10 169.11 172.34 168.53 166.51 108.22 111.48 103.77 105.81 102.71

110
147 170.65 169.47 168.97 169.29 165.26 108.61 110.35 104.30 106.57 103.55
148 173.19 168.41 169.05 158.08 147.05 104.50 99.07 102.86 89.82 86.01
149 174.17 167.68 168.84 162.12 160.26 104.70 94.15 104.89 87.80 92.61
150 174.17 161.94 168.56 163.15 152.84 103.91 98.87 103.15 95.32 88.09
151 172.99 165.49 169.84 158.65 144.65 103.91 94.31 104.47 91.39 84.89
152 174.36 162.88 169.71 151.59 142.25 103.91 100.90 102.39 82.84 83.62
153 171.04 166.05 163.16 161.32 137.26 105.09 93.87 104.71 85.14 79.46
154 172.80 160.20 167.67 153.29 134.17 105.09 89.26 104.29 83.80 77.84
155 175.34 171.30 170.77 154.59 134.57 105.09 96.96 103.85 84.66 78.15
156 175.34 163.77 165.66 152.10 136.78 105.09 96.18 103.63 82.30 80.05
157 161.25 160.54 168.99 166.14 170.83 96.09 94.02 100.51 90.79 95.34
158 158.90 155.35 161.59 165.48 172.86 96.28 95.68 97.37 90.77 97.83
159 161.25 162.82 167.08 165.32 169.54 96.87 98.22 96.03 91.13 95.96
160 161.25 158.19 165.83 166.57 172.01 96.48 97.32 97.63 92.44 98.94
161 159.88 159.94 164.55 166.53 166.82 96.48 93.97 96.58 92.65 92.03
162 161.64 161.72 169.04 165.08 171.27 96.67 97.51 96.35 90.56 98.57
163 161.64 161.32 164.93 164.68 166.30 96.48 91.97 96.88 91.13 91.62

111
164 159.49 156.96 166.40 164.08 164.28 96.09 95.88 96.34 90.88 92.40
165 160.86 158.21 167.66 165.42 171.96 96.87 95.08 99.77 88.07 97.86
166 165.56 159.45 165.04 151.05 153.41 95.11 96.19 95.85 82.80 93.24
167 164.58 152.77 160.96 167.88 167.99 95.11 93.86 95.51 91.25 96.79
168 166.54 162.85 168.44 158.16 166.89 95.11 96.45 95.49 85.99 98.15
169 166.54 157.92 163.07 168.07 159.02 95.30 91.77 95.00 92.92 88.62
170 165.75 157.31 165.90 165.06 148.01 95.11 86.60 103.92 90.86 87.43
171 166.14 159.03 167.94 164.53 156.96 95.30 92.05 94.61 92.20 90.86
172 166.14 156.98 163.74 167.26 167.30 94.72 91.57 93.40 90.99 94.61
173 164.97 159.10 164.26 165.47 153.90 94.13 96.66 94.26 90.94 88.76
174 168.69 131.61 168.75 169.22 167.96 99.61 69.33 103.50 108.21 101.52
175 173.78 171.20 171.83 167.45 168.41 101.37 100.93 104.11 102.17 99.88
176 173.78 164.29 168.85 166.58 161.94 101.37 98.72 104.60 102.51 91.59
177 170.45 166.96 167.50 167.66 166.59 100.78 91.97 104.74 102.45 96.96
178 173.58 165.71 172.61 167.19 168.93 100.78 91.20 103.97 100.82 100.52
179 173.58 164.56 168.29 167.46 165.34 101.57 95.70 103.76 102.51 95.48
180 172.41 168.64 168.41 167.95 169.80 101.37 91.63 105.14 101.83 101.46

112
181 170.06 167.20 167.81 167.04 168.87 101.37 95.25 104.30 100.09 101.08
182 173.97 170.78 171.55 167.12 169.15 100.78 96.01 104.28 100.21 100.26
183 173.97 163.68 168.30 166.78 167.56 100.98 100.87 104.57 100.16 99.15
184 169.86 164.70 168.60 168.94 165.48 100.78 96.62 103.72 106.67 95.48
185 173.19 170.45 172.61 169.13 166.27 100.78 100.47 102.05 106.14 97.61
186 173.19 167.62 168.42 168.96 164.53 101.17 99.69 104.24 106.80 95.52
187 172.99 166.99 168.28 168.99 164.26 100.98 99.34 100.99 106.76 95.36
188 170.06 166.40 169.64 169.13 166.27 100.98 100.77 102.08 106.14 97.61
189 172.80 168.86 171.08 168.25 166.02 100.98 102.30 104.53 105.57 96.07
190 172.80 168.44 169.28 169.40 169.05 100.59 98.73 104.00 107.99 97.48
191 171.43 167.49 169.37 169.46 169.83 99.80 100.72 102.77 107.29 98.11
192 169.86 168.54 170.16 168.89 164.29 99.80 100.64 103.01 106.21 95.39
193 169.08 167.12 168.33 169.02 173.16 98.24 101.75 104.59 106.88 101.39
194 167.71 166.56 169.21 169.28 171.09 98.24 103.52 104.24 106.73 99.18
195 166.34 165.80 168.81 168.52 172.20 98.24 97.93 101.88 105.73 100.76
196 169.28 168.26 171.02 169.40 170.55 99.02 101.75 103.65 104.92 97.73
197 169.28 168.77 168.06 169.05 171.10 99.61 101.40 102.75 104.64 99.19

113
198 167.91 166.24 168.05 168.86 170.60 99.80 100.60 104.20 103.84 97.47
199 168.88 164.95 171.04 169.80 170.67 99.80 100.54 103.38 108.40 98.07
200 170.84 169.30 170.79 169.89 172.67 100.39 107.65 103.59 106.66 98.40
201 170.84 165.96 169.42 168.94 169.83 100.39 101.41 104.66 106.02 97.16
202 170.84 120.24 169.42 168.94 169.83 100.39 101.41 104.66 106.02 100.39
203 175.34 166.32 174.54 161.8 169.45 120.35 115.73 117.25 101.33 120.35
204 175.34 164.32 177.54 165.16 174.65 120.94 118.2 117.5 108.18 120.94
205 171.23 165.4 172.43 166.56 169.43 120.55 120.19 118.88 109.94 120.55
205 175.34 170.4 173.26 166.43 171.11 120.55 115.05 118.71 113.92 120.55
206 176.13 165.4 175.68 166.36 171.46 122.5 117.29 117.6 110.82 122.5
207 176.13 170.12 175.45 166.7 171.24 122.11 119.13 120.78 109.13 122.11
208 171.04 175.5 170.5 166.11 171.29 120.94 117.52 117.5 110.96 120.94
209 176.32 170.34 176.3 170.45 171.98 120.94 116.35 122.18 111.24 120.94
210 176.32 178.34 176.42 170.43 170.45 100.39 101.41 104.66 106.02 100.39
211 173.97 170.78 171.55 167.12 169.15 100.78 96.01 104.28 100.21 100.26
212 173.97 163.68 168.30 166.78 167.56 100.98 100.87 104.57 100.16 99.15
213 169.86 164.70 168.60 168.94 165.48 100.78 96.62 103.72 106.67 95.48

114
214 173.19 170.45 172.61 169.13 166.27 100.78 100.47 102.05 106.14 97.61
215 173.19 167.62 168.42 168.96 164.53 101.17 99.69 104.24 106.80 95.52
216 172.99 166.99 168.28 168.99 164.26 100.98 99.34 100.99 106.76 95.36
217 170.06 166.40 169.64 169.13 166.27 100.98 100.77 102.08 106.14 97.61
218 172.80 168.86 171.08 168.25 166.02 100.98 102.30 104.53 105.57 96.07
219 172.80 168.44 169.28 169.40 169.05 100.59 98.73 104.00 107.99 97.48
220 171.43 167.49 169.37 169.46 169.83 99.80 100.72 102.77 107.29 98.11
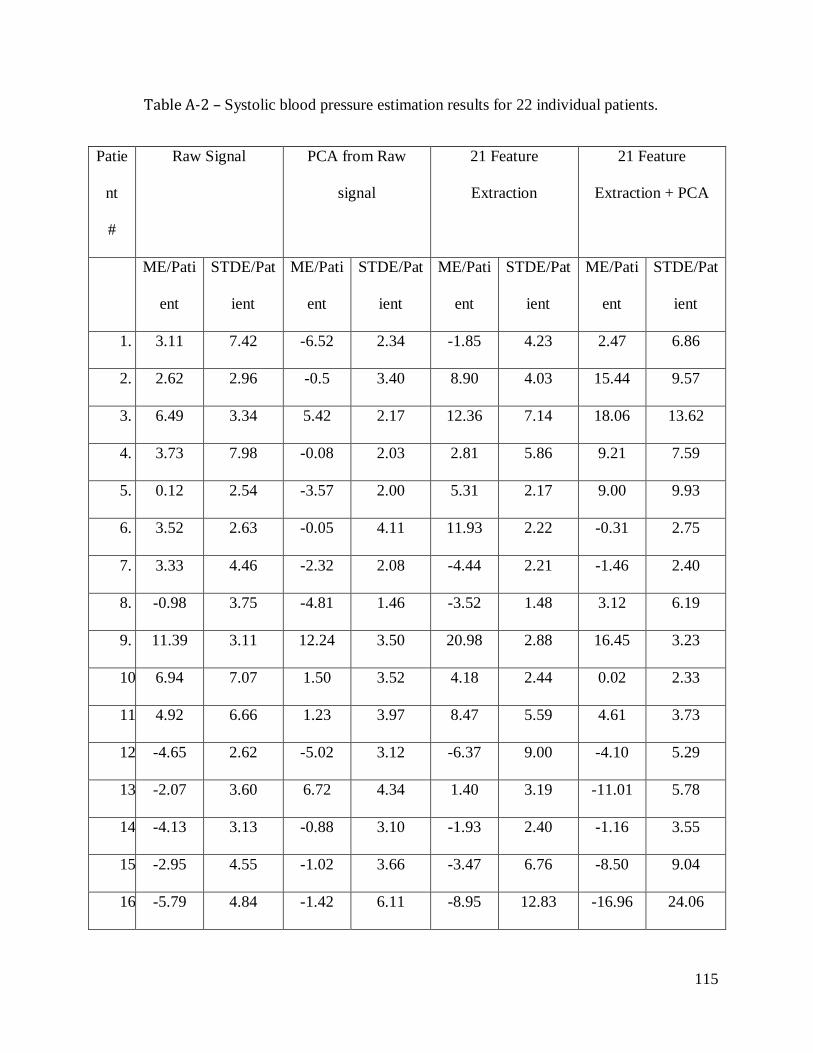
115
Table A-2 – Systolic blood pressure estimation results for 22 individual patients.
Patie
nt
#
Raw Signal PCA from Raw
signal
21 Feature
Extraction
21 Feature
Extraction + PCA
ME/Pati
ent
STDE/Pat
ient
ME/Pati
ent
STDE/Pat
ient
ME/Pati
ent
STDE/Pat
ient
ME/Pati
ent
STDE/Pat
ient
1. 3.11 7.42 -6.52 2.34 -1.85 4.23 2.47 6.86
2. 2.62 2.96 -0.5 3.40 8.90 4.03 15.44 9.57
3. 6.49 3.34 5.42 2.17 12.36 7.14 18.06 13.62
4. 3.73 7.98 -0.08 2.03 2.81 5.86 9.21 7.59
5. 0.12 2.54 -3.57 2.00 5.31 2.17 9.00 9.93
6. 3.52 2.63 -0.05 4.11 11.93 2.22 -0.31 2.75
7. 3.33 4.46 -2.32 2.08 -4.44 2.21 -1.46 2.40
8. -0.98 3.75 -4.81 1.46 -3.52 1.48 3.12 6.19
9. 11.39 3.11 12.24 3.50 20.98 2.88 16.45 3.23
10. 6.94 7.07 1.50 3.52 4.18 2.44 0.02 2.33
11. 4.92 6.66 1.23 3.97 8.47 5.59 4.61 3.73
12. -4.65 2.62 -5.02 3.12 -6.37 9.00 -4.10 5.29
13. -2.07 3.60 6.72 4.34 1.40 3.19 -11.01 5.78
14. -4.13 3.13 -0.88 3.10 -1.93 2.40 -1.16 3.55
15. -2.95 4.55 -1.02 3.66 -3.47 6.76 -8.50 9.04
16. -5.79 4.84 -1.42 6.11 -8.95 12.83 -16.96 24.06

116
17. -4.40 4.16 2.35 4.15 0.35 6.67 0.35 9.65
18. -9.54 10.00 -2.13 2.25 -3.27 3.25 -5.64 4.36
19. -4.78 2.24 -2.73 1.85 -3.91 2.08 -5.54 2.38
20. -1.76 1.23 0.42 1.52 0.16 1.27 1.55 3.17
21. -10.46 14.75 -0.40 1.27 -7.11 3.84 -2.83 2.19
22. -4.29 6.48 -2.50 2.06 -4.20 2.14 -6.01 1.83
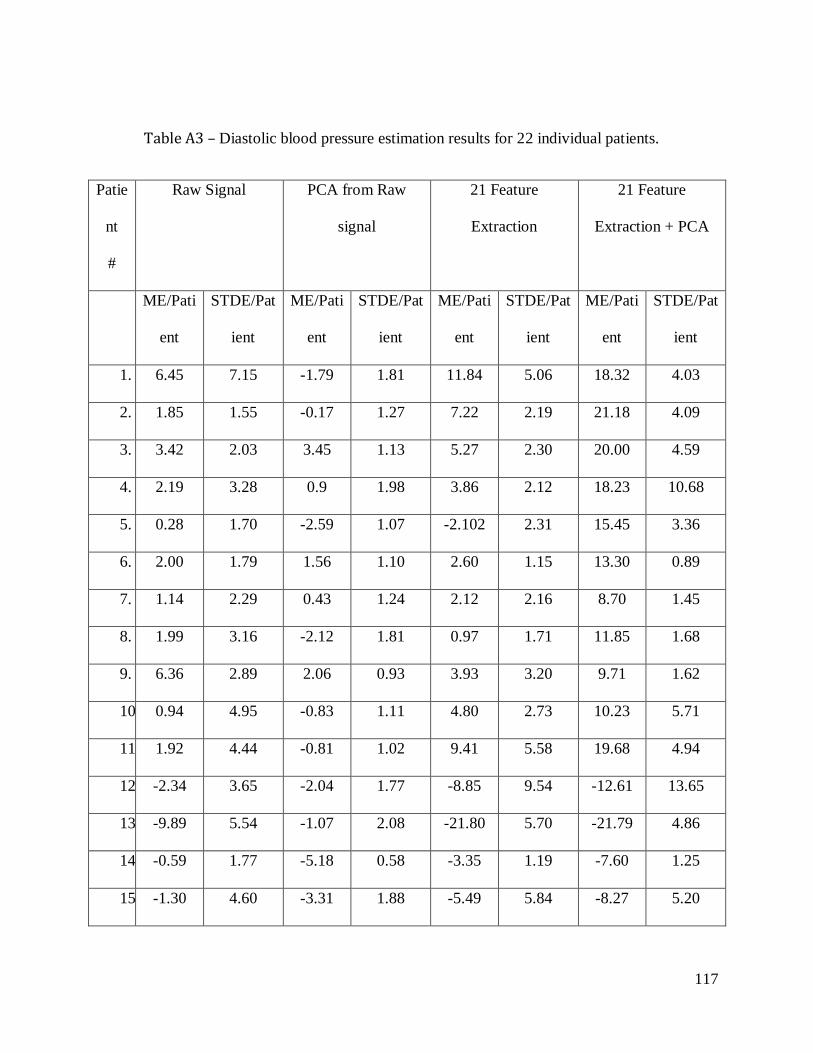
117
Table A3 – Diastolic blood pressure estimation results for 22 individual patients.
Patie
nt
#
Raw Signal PCA from Raw
signal
21 Feature
Extraction
21 Feature
Extraction + PCA
ME/Pati
ent
STDE/Pat
ient
ME/Pati
ent
STDE/Pat
ient
ME/Pati
ent
STDE/Pat
ient
ME/Pati
ent
STDE/Pat
ient
1. 6.45 7.15 -1.79 1.81 11.84 5.06 18.32 4.03
2. 1.85 1.55 -0.17 1.27 7.22 2.19 21.18 4.09
3. 3.42 2.03 3.45 1.13 5.27 2.30 20.00 4.59
4. 2.19 3.28 0.9 1.98 3.86 2.12 18.23 10.68
5. 0.28 1.70 -2.59 1.07 -2.102 2.31 15.45 3.36
6. 2.00 1.79 1.56 1.10 2.60 1.15 13.30 0.89
7. 1.14 2.29 0.43 1.24 2.12 2.16 8.70 1.45
8. 1.99 3.16 -2.12 1.81 0.97 1.71 11.85 1.68
9. 6.36 2.89 2.06 0.93 3.93 3.20 9.71 1.62
10. 0.94 4.95 -0.83 1.11 4.80 2.73 10.23 5.71
11. 1.92 4.44 -0.81 1.02 9.41 5.58 19.68 4.94
12. -2.34 3.65 -2.04 1.77 -8.85 9.54 -12.61 13.65
13. -9.89 5.54 -1.07 2.08 -21.80 5.70 -21.79 4.86
14. -0.59 1.77 -5.18 0.58 -3.35 1.19 -7.60 1.25
15. -1.30 4.60 -3.31 1.88 -5.49 5.84 -8.27 5.20

118
16. -5.72 5.81 0.10 1.82 -13.86 7.99 -14.18 13.01
17. -1.91 3.05 1.34 2.78 -6.12 3.05 -2.16 3.86
18. -7.12 9.08 2.11 1.99 0.36 3.53 -2.94 3.58
19. -1.93 2.37 2.54 1.27 3.71 3.26 -3.38 2.01
20. 2.36 2.38 4.11 1.22 6.84 1.58 -0.72 2.32
21. -2.74 2.48 -0.99 3.22 -8.21 7.95 -0.32 1.02
22. -1.22 5.32 2.67 1.38 4.45 2.78 -3.35 2.06