Embed Size (px)
Citation preview

BEAT PLASTICPOLLUTIONFrom Branded Litter

To identify types and quantity of Branded & Unbranded packaging with Manufacturers name in Plastic waste
Waste & Brand Audit

LOCATION TIME CONTACT PERSON
1. HSR DWCC : 2299, 16th Cross Road, 1st Sector, HSR Layout, Bengaluru, Karnataka - 560102
2. Koramangala DWCC inside High Tension Wire, Next to Empire Hotel, Jyothi Nivas College Road, Koramanagala
3. Lal Bagh, Meeting point Lalbagh café on MN Krishna Rao Road
4. Majestic Bus Stand, Main entrance.
5. Mantri Mall, Food Court, Malleswaram
6. Maramanapalya DWCC
7. Sarjapur ward 150 DWCC
8. Yelahanka ward 10 DWCC
8 AM - 10:30 AM
Sunday : 10 AM - 12 PMMonday & Tuesday : 9 AM - 11 AM
8:30 AM - 11 AM
8 AM - 10 AM
8 AM - 10 AM
8:15 AM - 12:15 AM
8 AM - 10 AM
8 AM - 10 AM
Shanthi : +91 9036057199
Neeraja : +91 9880668688
Renuka : +91 9740073635
Anirudh : +91 8095903171
Rabia : +91 8904198237
Archana : +91 90606889529
Amita : +91 9886749437
Allen : +91 9343777777
WASTE & BRAND AUDIT, BENGALURU ( 20TH-22ND MAY, 2018)

Volunteers

H S R L AY O U T B E L L A N D U R W A R D 1 5 0
Amita Pillai
Archana Prasad
Kashyap
K.P.Singh
Ravish Yavagal
Prabha Mohan
K O R A M A N G A L A
Sunil Achar
Archana Murthy
Maria Raj
Uma Ravindranath
Shalini Suren
Swetha
Pria Arvind
Roopa Rai
Jayashree
Neeraja Shetty
Smita Kulkarni
Chitra Praneeth
Rajani Boppaih
Nalini
Suma Reddy
Krupa Seetaram
Tirumal Boppana
Nandini Sriraaman
Aditi Sudarshan
Mohan Govindiah
Prabha
B.N.S.Ratnakar
Sriakshitha
Ishana Modi
Vijayalakshmi Ravi
Likhith Ravi
Jagdeesh Sheshadri
Roopa De
Shreya Praveen
Sanjana Reddy
Vaishnavi Reddy
Shahsidhar
Divya Venkatesh
Dr. Shanthi

L A L B A G H
Nylah Nalwad
Harsha Nalwad
Smitha Srinath
Shashi sastry
Geetha Narasimhan
Renuka Bhosle
Pooja
Kumuda M Saravor
Mekhala H M
Vani Bhaskar
Meghana Joshi
Raghu Verma
Roshita
Y E L A H A N K A
Allen Joseph
Sarada
Ram Prasad
Prabha
Sunil Kumar D R
Abdul Salimani
Sobitha Balaji
Padma Badami
Poornima M N
Mangala Gowri M
Vaishnavi
M A N T R I M A L L
Vani Murthy
Deepika Aujer
Rabiya
Nataraj S
Satish P
Prerna.Harish
Anupama.Harish
Raghuveer
Jayoti B
M A J E S T I C
Anirudh
Prajwal GV
Lohit BN
Rahul Anand
Niranjan M
Brunda M
Dhisha Mohan
Amar BP
Srinidhi Chandra
Nidhish
Bhuvan BN

M A R A P PA N A PA LYA
Nalini Shekar
Archana.V
Midhun
Nagarjun
Indha Mahoor
Sharath
Mohan
Shivarajamma
Geetha
Vasanthi
16 students and
2 Supervisors from
University of
Minnesota
S W M R T
Sandya Narayan
Ramakant
Pinky Chandran
J A I N U N I V E R S I T Y
Priyanka
Beula Anthony
Padma Priya
Usha
Manjula
Vijaya A

FINDINGS

Brand Audit
1.
Post consumer Plastic Waste

607 B R A N D S
479 128L O C A L ( L ) I N T E R N A T I O N A L ( I )

12,000600 Kgs
120 V O L U N T E E R S F O R T H R E E D AY S .
O F P L A S T I C
PA C K A G I N G
P I E C E S A U D I T E D
8 L O C AT I O N S
5C AT E G O R I E S

BRAND AUDIT - PRODUCT PACKAGING TYPES.
FP PC HP
F O O D PA C K A G I N G P E R S O N A L C A R E PA C K A G I N G H O U S E H O L D P R O D U C T S
PA C K A G I N G
10,300 1000 700L = 6 5 %
I = 3 5 %
L = 5 0 %
I = 5 0 %
L = 7 6 %
I = 2 4 %
L - L O C A L
I - I N T E R N A T I O N A L
U N I T = N U M B E R O F P I E C E S
P I E C E S P I E C E S P I E C E S
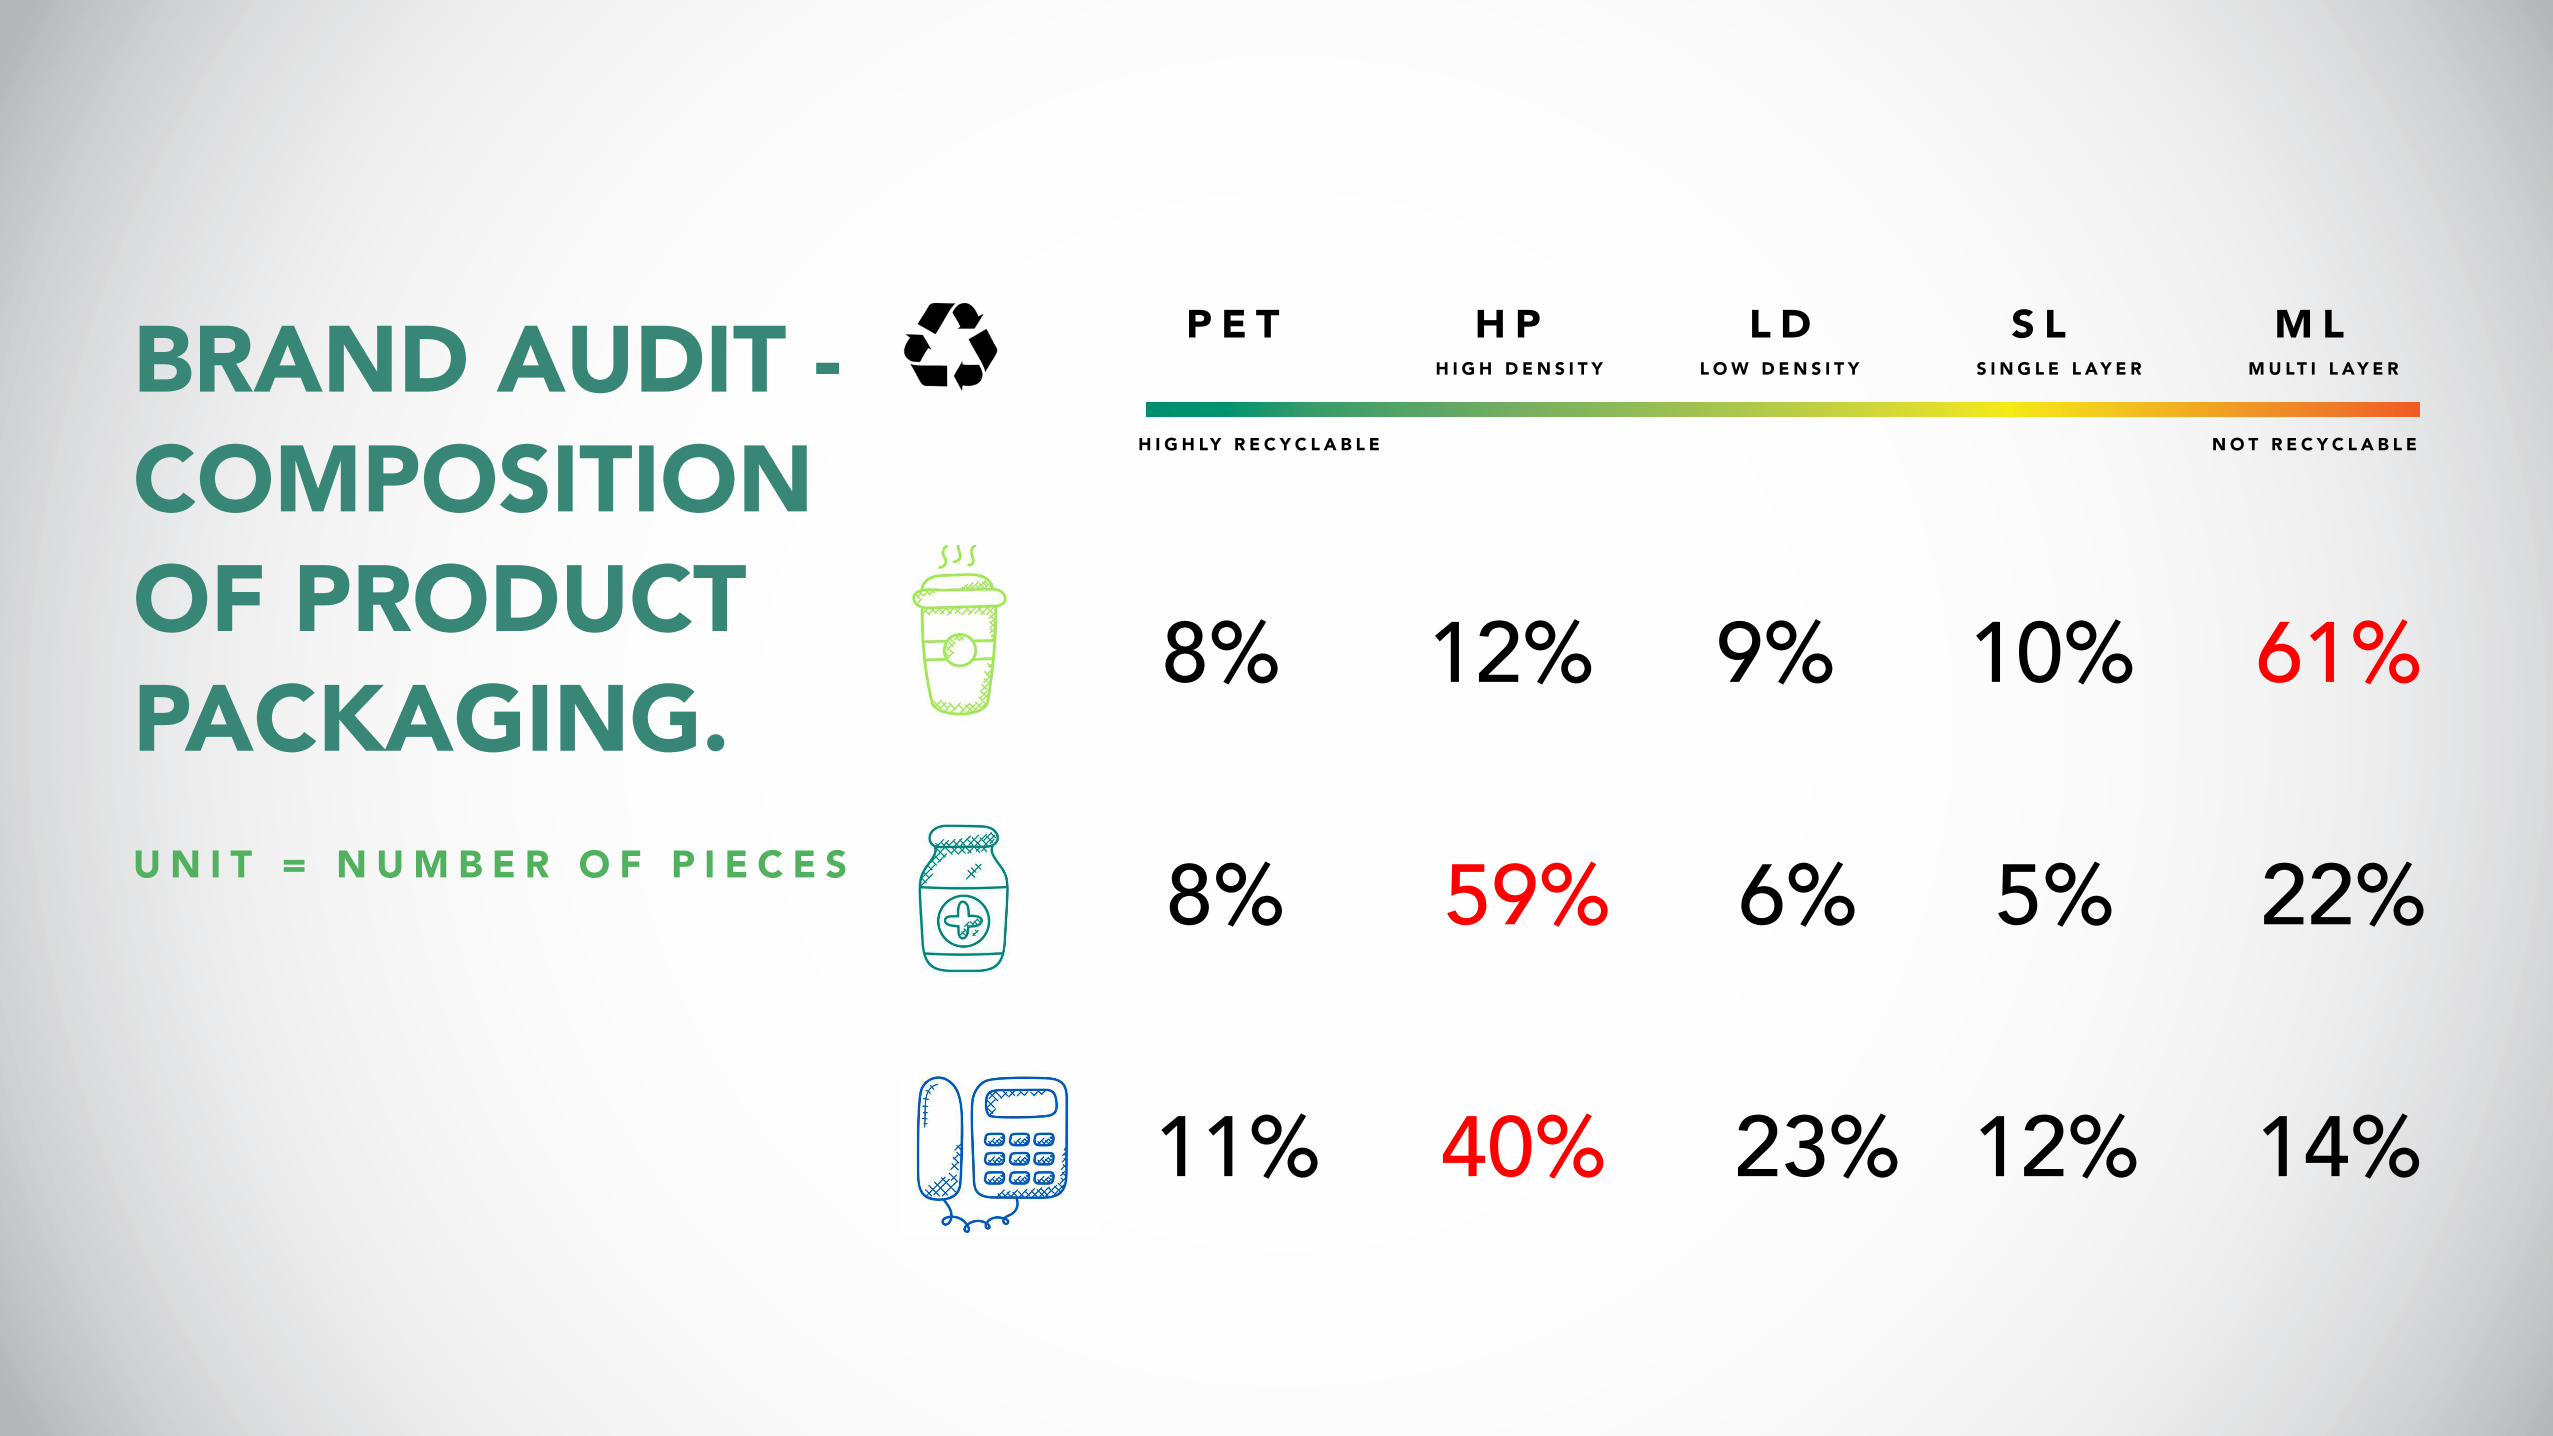
BRAND AUDIT -
COMPOSITION
OF PRODUCT
PACKAGING.
P E T H P L D S L M LH I G H D E N S I T Y L O W D E N S I T Y S I N G L E L AY E R M U LT I L AY E R
H I G H LY R E C Y C L A B L E N O T R E C Y C L A B L E
8% 12% 9% 10% 61%
8% 59% 6% 5% 22%
11% 40% 23% 12% 14%
U N I T = N U M B E R O F P I E C E S

OTHER OBSERVATIONS - INFERENCE
Composition of Product Packaging :
1. Multi Layer Packaging is higher in International Brands (75%) than in Local Brands (44%) . Because of its high cost Single Layer is preferred by Local Brands
2. No ‘Super’ in the Data Samples indicates No Plastic Carry bags. (Super is a colloquial term for plastic carry bags)
3. ‘Other – Polypropylene’ not found, implies that Non Woven Polypropylene ( NWPP) is not getting recovered in the DWCC and is going out as discards to the Landfill. Possibly it is not considered as Plastic and being mistaken for cloth.
4. No ‘Polystrene -Styrofoam’ was seen

COMPOSITION
OF FOOD
PACKAGING
P E T H P L D S L M LH I G H D E N S I T Y L O W D E N S I T Y S I N G L E L AY E R M U LT I L AY E R
H I G H LY R E C Y C L A B L E N O T R E C Y C L A B L E
2% 6% 3% 6% 83%
14% 75%7% 1% 2%
L
I
10% 57% 20% 13%
27% 28%28% 4% 13%
N
U
L = Local BrandsI = International BrandsN = NandiniU = Unbranded
(20 BRANDS)
(10 BRANDS)
FP
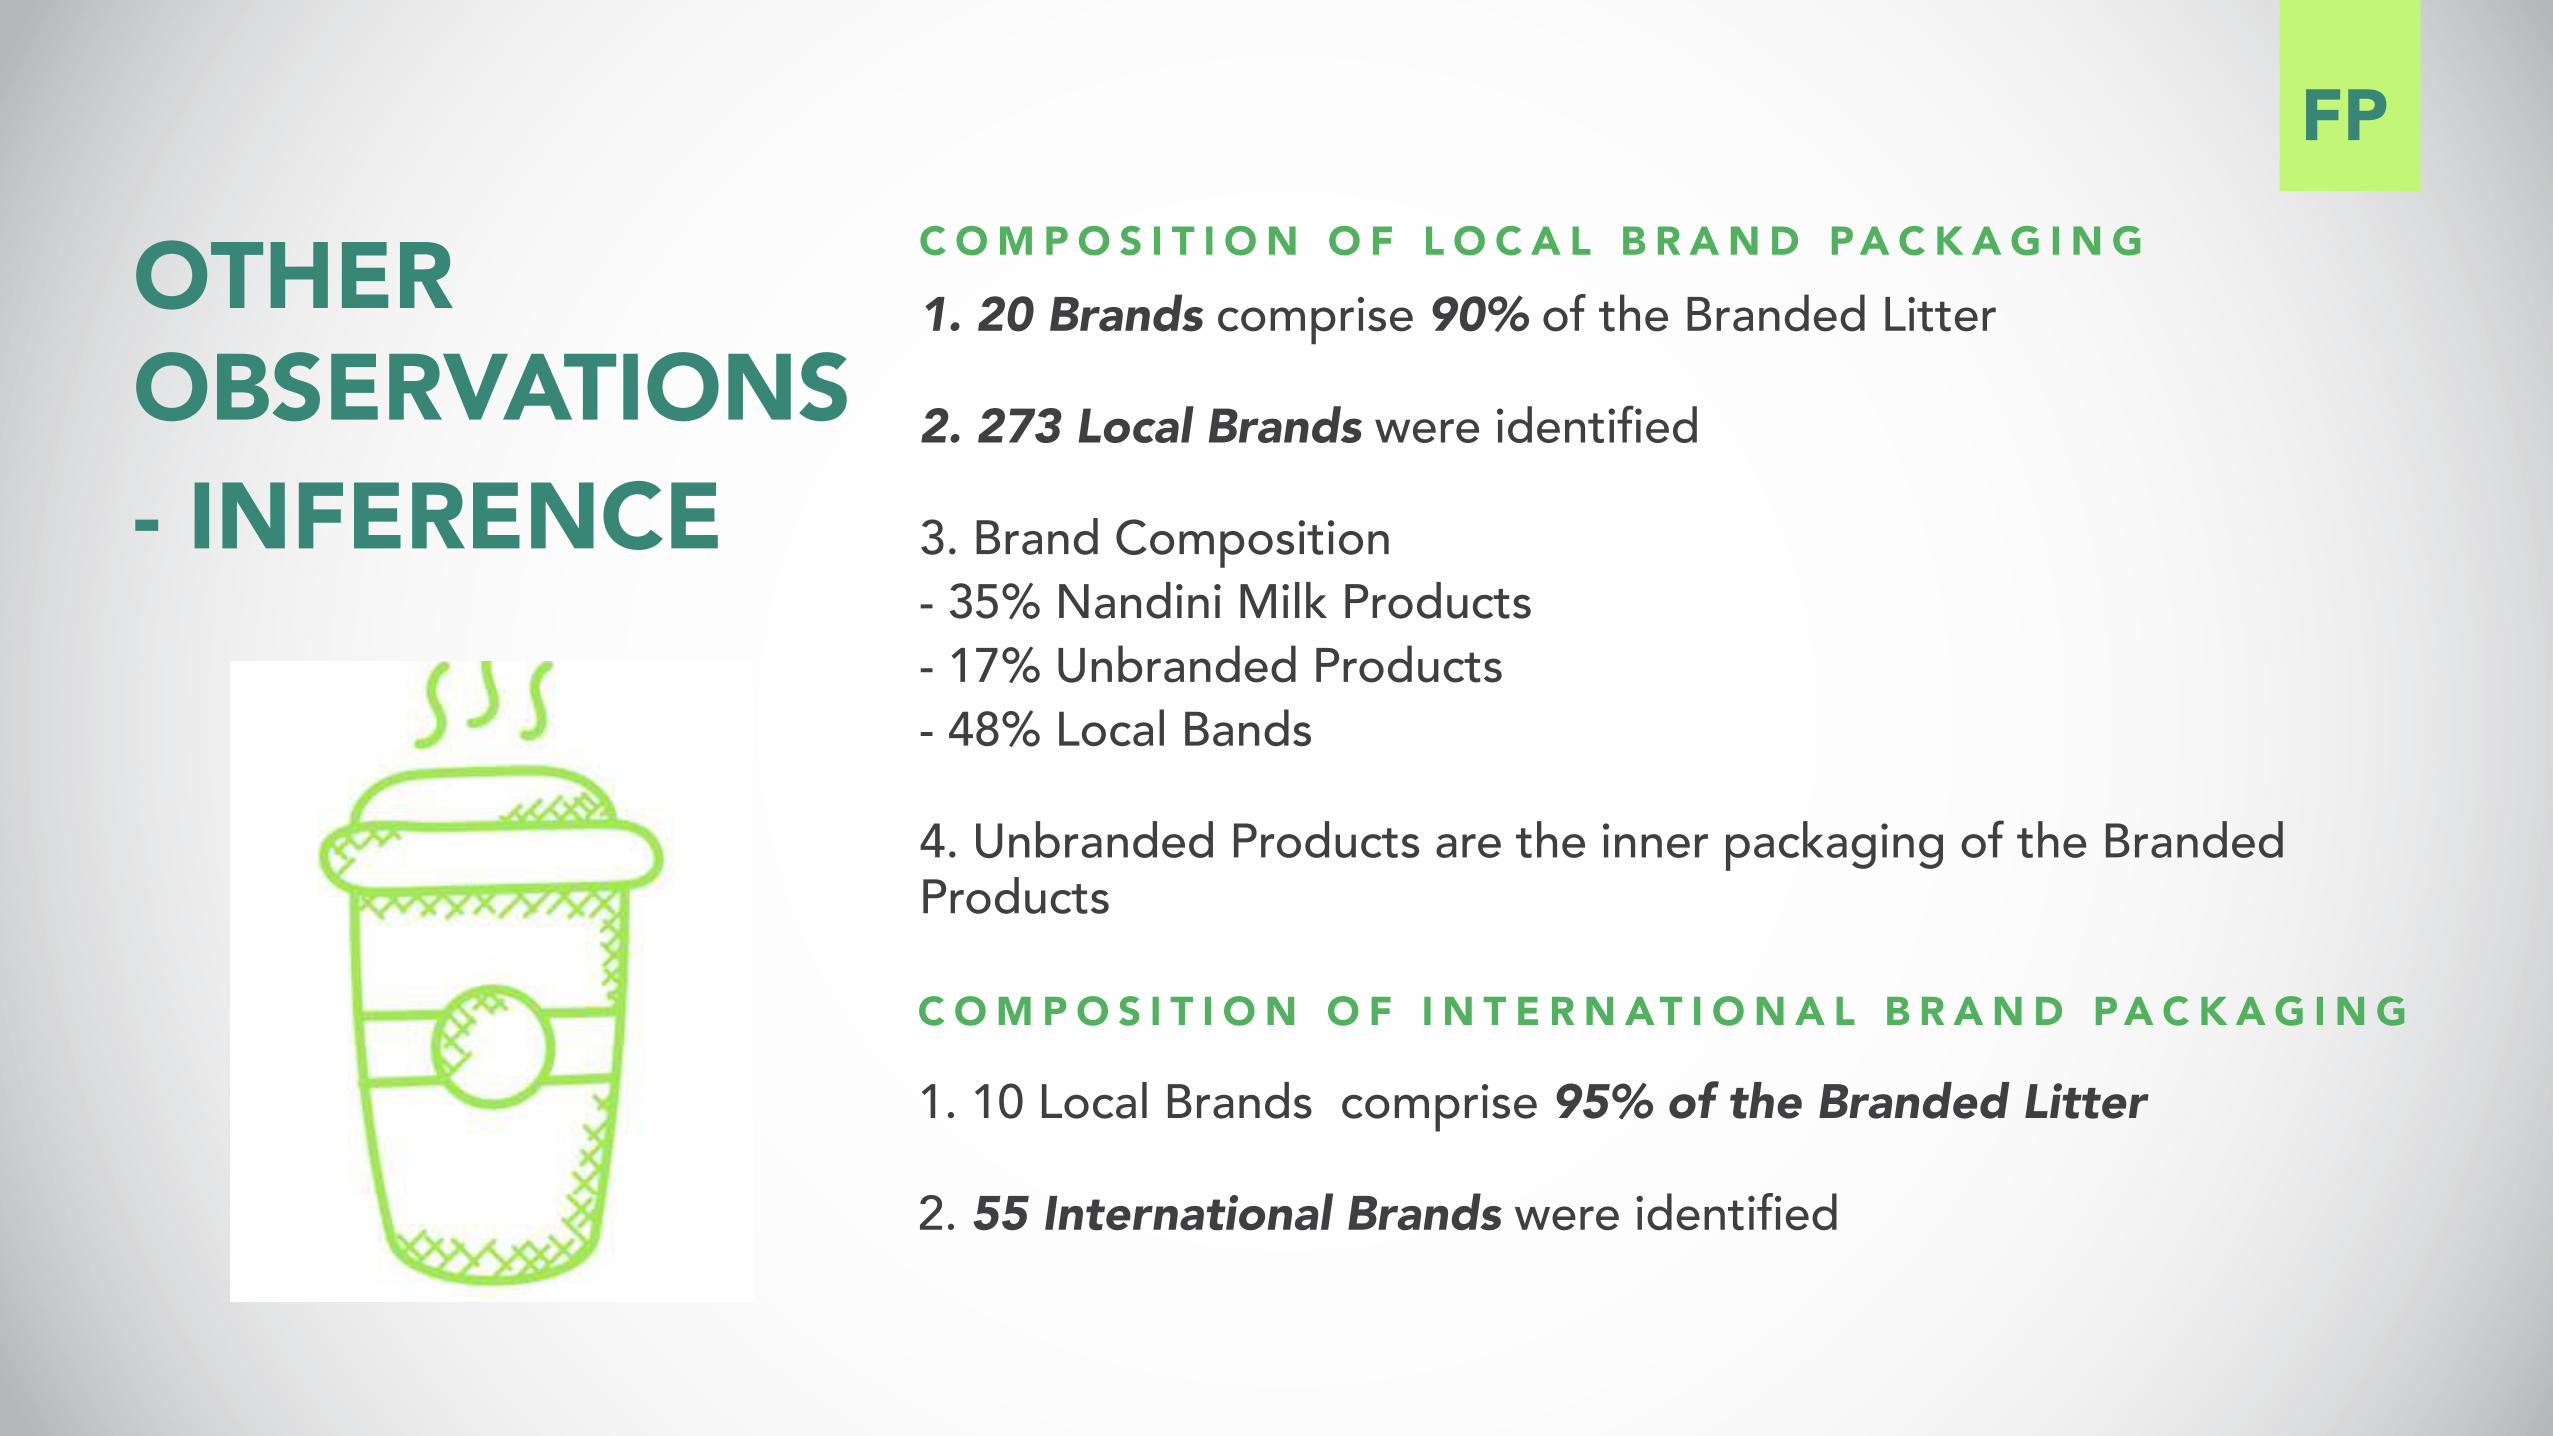
OTHER OBSERVATIONS
- INFERENCE
C O M P O S I T I O N O F L O C A L B R A N D PA C K A G I N G
C O M P O S I T I O N O F I N T E R N AT I O N A L B R A N D PA C K A G I N G
1. 20 Brands comprise 90% of the Branded Litter
2. 273 Local Brands were identified
3. Brand Composition
- 35% Nandini Milk Products
- 17% Unbranded Products
- 48% Local Bands
4. Unbranded Products are the inner packaging of the Branded Products
1. 10 Local Brands comprise 95% of the Branded Litter
2. 55 International Brands were identified
FP

INTERNATIONAL BRANDS COMPOSITION
28%
15%
11%
11%
9%
8%
7%
4%
2%
2%
FP

LOCAL BRANDS COMPOSITION
35%
9.29%
6.65%
5.21%
2.77%
1.90%
1.62%
1.26%
1.06%
0.82%
0.80%
0.64%
0.54%
0.49%
0.49%
0.48%
0.40%
0.37%
0.31%
0.31%
FP

OTHER OBSERVATIONS - INFERENCE Composition of All Brand Packaging ( Units = number of Pieces)
1. Multilayer is used by all Brands for Sweets snacks and Ready to eat foods and comprised 85% of their packaging. 2. PET by International Brands /HD by Local Brands is used for Soft Drinks-Oils and comprised of 15-35% of their packaging. Bisleri Brand had 100% PET for Water 3. LD is used by Milk and Milk product Brands and comprised 60- 80% of the packaging. This is exempt from Ban 4. SL upto 40% is used for Grocery –Provisions packaging by Local Brands 5. LD- SL upto 40% used by Food Takeaway Brands was found, which is banned in Karnataka
FP

P E T H P L D S L M L
H I G H D E N S I T Y L O W D E N S I T Y S I N G L E L AY E R M U LT I L AY E R
H I G H LY R E C Y C L A B L E N O T R E C Y C L A B L E
FP

COMPOSITION OF PERSONAL CAREPACKAGING
P E T H P L D S L M LH I G H D E N S I T Y L O W D E N S I T Y S I N G L E L AY E R M U LT I L AY E R
H I G H LY R E C Y C L A B L E N O T R E C Y C L A B L E
8% 12% 1% 20%59%
5% 65% 8% 6% 16%
L
I
---- 54%38% --- 8%U
L = Local BrandsI = International BrandsU = Unbranded
(13 BRANDS)
(4 BRANDS)
PC

OTHER OBSERVATIONS - INFERENCE
C O M P O S I T I O N O F L O C A L B R A N D PA C K A G I N G
C O M P O S I T I O N O F I N T E R N AT I O N A L B R A N D PA C K A G I N G
1. 13 Brands comprise 50% of the Branded Litter
2. 96 Local Brands were identified
3. 42% of the Brand Packaging is of low and non recyclable quality
1. 4 Brands comprise 51% of the Branded Litter
2. 48 International Brands were identified
3. 30% of the Brand Packaging is of low and non recyclable quality
Unbranded Products could possibly be the inner packaging of the Branded Products have almost 54% component of low,non recyclable quality
U N I T = N U M B E R O F P I E C E S
PC

23%
15%
8%
4%
INTERNATIONAL BRANDS COMPOSITION
PC

10%
6.9%
5.02%
2.82%
2.51%
2.19%
2.19%
1.88%
1.88%
1.88%
1.88%
LOCAL BRANDS COMPOSITION 6%
PC

COMPOSITION OF HOUSEHOLD PRODUCTSPACKAGING P E T H P L D S L M L
H I G H D E N S I T Y L O W D E N S I T Y S I N G L E L AY E R M U LT I L AY E R
H I G H LY R E C Y C L A B L E N O T R E C Y C L A B L E
4% 51% 1% 30% 13%I
I = International Brands
(5 BRANDS)
HP

OTHER OBSERVATIONS - INFERENCE
C O M P O S I T I O N O F L O C A L B R A N D PA C K A G I N G
C O M P O S I T I O N O F I N T E R N AT I O N A L B R A N D PA C K A G I N G
1. No one Brand was prominent
2. 110 Local Brands were identified
1. 5 Brands comprise 75% of the Branded Litter
2. 25 International Brands were identified
3. 44% of the Brand Packaging is of low and non recyclable quality
HP

35.8%
21.4%
8.64%
5.35%
4.94%
INTERNATIONAL BRANDS COMPOSITION
HP

Dry WasteCollection Centres
2.
Recovery of Post consumer Plastic Waste

12,325T O N N E S
D O O R T O D O O R C O L L E C T I O N 1 . 1 5 T P D - B U Y B A C K 0 . 5 T P D
( J U N E 2 0 1 7 - M A R 2 0 1 8 ) - F Y 2 0 1 7 - 2 0 1 8

3300
1
12 D W C C s
(DOOR TO DOOR COLLECTION)
T O N N E P E R D AY
T O N N E S
9025T O N N E S
50 D W C C s
BUY BACK
0.5T O N N E P E R D AY
J U N E 2 0 1 7 - M A R C H 2 0 1 8 F Y 2 0 1 7 - 2 0 1 8

82%
18%
50% 50%
COMPOSITION AFTER SORTING AND GRADING
LVP – MLPLow Value PackagingMulti Layer Packaging
LVP – MLPLow Value PackagingMulti Layer Packaging
Door to Door Collection
Buy Back

Recommendationsunder the scope of
3.Plastic Waste Management Rules 2016 - 2018 Solid Waste Management Rules 2016Policy Resolution for Petrochemicals 2007

A. RECOMMENDATION
IMPLEMENT :
Plastic Waste Management Rules 2016 - 2018
Solid Waste Management Rules 2016

Brand owners, MFg and Producers of plastic packaging to take up implementation of the Rule 9 of the PWM rules :
• Collection
• Take back
• Phase out
A. REQUIREMENTS• Collection Facilities and Process a) Door to Door, Institutional and Commercial b) Using Waste pickers and CSO,NGO
• Destination –Recycling, Energy recovery, Alternate use a) Set up by Local Body b) Brand Owners / Producer participation

B. RECOMMENDATION
IMPLEMENT :
The Petrochemical Policy Resolutions of 2007

Implement the Policy Resolutions for Petrochemicals 2007 :
• on Safe food packaging
• Plastic Parks for Recycling
• R&D Fund
• IEC and Community awareness programs to stop
littering
• Waste Collection programs
B. REQUIREMENTS

C. RECOMMENDATION
IMPLEMENT :
The Petrochemical Policy Resolutions of 2007

• Ministry of Urban Development should be the nodal agency for the implementation of the Rules by the MOEF and the Ministry of Chemicals and Fertilisers
C. REQUIREMENTS

For more Information, Contact :
Sandya [email protected] 9341927080
Nalini [email protected] 7829777737
Pinky [email protected] 9845888686
Icons by Creative Stall, for The Noun Project
Credits :


![Serial Peripheral Interface [SPI] Controller Area Network [CAN] By: Instructor: Praneeth Kumar Bajjuri Dr.James M. Conrad](https://img.pdfslide.us/doc/110x75/56649cb65503460f9497b9f4/serial-peripheral-interface-spi-controller-area-network-can-by-instructor.jpg)