Embed Size (px)
Citation preview
August 2012
The Beans Value Chain in KenyaThe Beans Value Chain in KenyaThe Beans Value Chain in KenyaThe Beans Value Chain in Kenya
i
EXECUTIVE SUMMARYEXECUTIVE SUMMARYEXECUTIVE SUMMARYEXECUTIVE SUMMARY
This assignment was commissioned by SNV, HIVOS and Solidaridad – Horticulture and Food Security Program and
implemented by SNV and Fineline Systems and Management between March and August 2012. The objective was
to develop an analysis of and the strategy for the bean sub-sector consistence with the M4P framework. The
analysis include: (i) the overall sub-sector performance and position of the poor within it; (ii) the structure,
players and relationship that describes how it operates; (iii) key systemic constraint impinging on the sub-sector;
(iv) the main elements of the sub-sector strategy; and (v) specific interventions consistent with the analysis and
strategy. The information used in the analysis was obtained through interviews with various participants in the
green bean value chain conducted between March and August. The interviewees included smallholder farmers,
farmer group leaders, horticultural industry association leaders, exporters, domestic green bean buyers, EU
importers and EU supermarkets and certification companies. The interviews were supplemented with secondary
information and data from reports on the sub-sector.
The Green beans are grown mainly by smallholder farmers under irrigation in Central, Rift Valley and Eastern
Provinces. The beans were initially grown exclusively for export market, but over the years they have gained
popularity in the domestic market, especially the premium supermarkets. In the year 2010, out of the 55841 MT
of French beans produced, only 18,725MT (34%) were exported1 for the value of Ksh. 4.4 billion (HCDA 2010). In
2011, French beans accounted for 29 per cent - Sh4 billion - of Kenya's total earnings from vegetable exports of
Sh13.7 billion. The huge disparity between the domestic (Kshs 1.6 billion) and export (Kshs. 4.4 billion) values are
due to the farm gate prices offered to farmers by exporters2. The main importing countries for Kenya’s green
beans are UK, France, Germany, Holland, Belgium and South Africa.
The fresh bean production is mainly dominated by smallholder farmers, estimated at 50,000 growers3, who are
mainly households with less than 2 acres of land. They cultivate the land, mainly using family labour. Households
also provide labour in the large farms and are compensated through wages. They gain from fresh bean cultivation
through the employment and income earned from the sale of the crop. This also contributes to food security of
these households. A typical farmer4 growing bean makes an average profit of US$750 (Ksh.60000) per year.
Majority of the farmers working with the green bean did not sell to the local market since there was no ready
demand for the vegetable. In addition, most of the farmers are organized in groups bound by regulations
forbidding sale to the local market. Others have contracts with companies that may not permit sale of their
produce outside the contract. Green beans are highly perishable and not convenient for sale to the local market.
For these reasons, the local value chain for green bean is under-developed and information is largely unavailable.
The sector is controlled by the private sector5, incorporating large and small-scale farmers and exporters scattered
across the nation. While largely controlled by private investors, who have continued to export top quality fresh
produce to the markets, the government has helped in policy and regulation of the sector.
1 The remaining 66% were marketed locally through premium supermarkets, hotels, schools, hospitals, children homes and other local institutions, used as animal feeds and other hawked/retailed. 2 The average farm gate prices in the year 2010 are Ksh.28.7, while the average export value per kilogram of French beans was Ksh. 235. 3 Small to medium growers are estimated to be 4000, while the large contract growers of beans are estimated to be less than 100 (DFID, 2010). 4 There is no universally agreed definition of small-scale farms in developing countries. In much of the development literature, farms of less than five hectares can be considered
“small”. In general these farms often have limited capital or other assets. For the purposes of this paper we adopt a broad definition of a small-scale farmer. A small-scale is one who derives their livelihood from a holding of < 2-5ha (usually < 2ha); and around 10 to 20 heads of livestock (although often there is < 2 or none at all). Small-scale farmers may practice a mix of commercial and subsistence production (in crops or livestock) or either, where family provides the majority of labor and the farm provides the principle source of income. In the paper we define a
small holder farmer as one who is (neither large scale or medium scale farmers – meaning 5-several thousand acres), often using small inputs such as pangas and hoes to cultivate, with open plots of < 2 acres and which are oft 5http://www.fpeak.org/industry.html (accessed on 13th March 2012)
ii
The fresh bean industry in general employs 45,000 to 60,000 people, of whom an estimated 60 per cent are
women, in commercial farms, processing, and logistics operations. It is estimated that nearly half or 44 percent
of Kenya’s smallholder households are managed by women. Women are active at every point in the food chain
and are often responsible for the household farming activities under which most of the green bean farms fall. At
the pack houses, gender roles become distinct again with women dominating handling sorting, grading and quality
control. Men will often do manually demanding tasks like land preparation, irrigation, spraying, loading and off-
loading trucks.
Youth‘s engagement in export horticulture is ranked more favorably compared to other farm-level enterprises due
to the high returns per unit area, short production period and regularity of income. However, these benefits are
more skewed to the resource endowed youths who can afford the heavy and lumpy investments required to meet
Global GAP standards. On the flip-side, the less resource-endowed youths either totally or temporarily exit export-
bound horticultural production for other enterprises, remain non-compliant or maneuver their way into accessing
the export market.
Kenya has been exporting vegetables to the Europe since the 1950s. Reasons for Kenyan success have varied
with the changing market forces of the highly competitive UK and European markets. Kenya’s original success in
exporting vegetables, especially beans was based on its climatic and geographic competitive advantage. Producing
temperate products year round and being well served by northbound airfreight (thanks to the Kenyan tourism
market) proved lucrative for Kenyan vegetable exporters. Kenyan success has been due to market segmentation,
investing in certification schemes, adding value to products through sophisticated packaging, servicing niche
markets, and investing in marketing. Over the years, due to effective public-private dialogue, the Kenyan
government has been receptive to implementing regulatory changes, investing in education, and improving
infrastructure, which have increased the competitiveness of the industry. Requirements in the international
markets for green beans and other fresh produce appear to be raising the bar for new entrants while at the same
time throwing new challenges in the path of existing growers. In recognition of the need to meet these standards
of environmental management, product food safety, quality, traceability and occupational health & safety of
workers, FPEAK launched the code of practice (that has so far changed its name into KENYA-GAP) in 1996 as a
certification measure for producers and exporters to achieve.
During the value chain analysis of the green beans for export and domestic market, a variety of constraints were
identified that were limiting the production and income. The main challenges and opportunities have been
identified, namely access to inputs and equipment; knowledge and information; pests and diseases; infrastructure
services; coordination and organisational skills; limited markets and market information; challenges with
innovation and product development; regulation, standards and laws; and finally access to suitable financing for
smallholder. Traditional markets for green beans are faced with both tariff and non-tariff barriers which are
increasingly exerting pressure and pose a threat to smallholders. Examples include sustained campaigns against
air freighted products due to carbon foot prints; food safety standards; eminent threats for payment of 16% duty
on Kenya and other 17 ACP countries following the expiry of Economic Partnership Agreements (EPA’s) next year.
Therefore, for the sub-sector to remain competitive, the following key changes are proposed:
• Market development and market information – There is need to scout for other possible markets for
the Kenyan green beans targeting both Domestic, regional and International markets. Consumption of
green beans is emerging in Kenya and the region and there is need to promote it. There is a need to look
for other alternative markets to EU, e.g. USA, Asia, etc. The development of the local and regional market
is subject to promotion and awareness creation (informing the local consumer about the nutritive value of
this vegetable). Otherwise, it is perceived to be a crop for foreign markets. There is need to improve the
iii
marketing information system: Farmers need proper advise on when to plant to avoid overproduction.
There is need to educate farmers on market driven production planning.
• Technology, innovation and product development- Pre-harvest crop management as well as
postharvest handling both contribute to the quality of green beans produced and products channelled to
the market (both local and internationally). Green bean postharvest losses account for a significant decline
in marketable yield at farm level and along the marketing chain. There is therefore need for training and
sensitizing farmers on farm level postharvest handling practices and adherence to set regulations to
maintain product quality. Agro processing, packaging, canned and frozen beans and quality standards in
the domestic, regional and international market are not fully developed. In particular, value addition,
investment in packaging technology is critical during sea freight, whose cost is significantly lower compared
to the air freight. Deliberate efforts should be made towards investing in this area to increase the produce
shelf life, reduce post-harvest losses, and improve consumer acceptance both in domestic and international
markets.
iv
LIST OF ACRONYMNSLIST OF ACRONYMNSLIST OF ACRONYMNSLIST OF ACRONYMNS
AAK Agrochemical Association of Kenya
ACP Africa Caribbean Pacific
AGRA Alliance for Green Revolution in Africa
DFID Department for International Development
EFSS European Food Safety Standards
EMCA Environmental Management and Coordination Act
EPC Export Promotion Council
EPA Economic Partnership Agreement
EU European Union
FAO Food and Agriculture Organisation of the United Nations
FPEAK Fresh Produce Association of Kenya
GAP Good Agricultural Practices
GDP Gross Domestic Product
GLOBALGAP Global Good Agricultural Practices
GMP Good Manufacturing Practices
HACCP Hazard analysis and critical control points
HCDA Horticultural Crops Development Authority
HIVOS Humanistisch Instituut voor Ontwikkelingssamenwerking (the Humanist Institute for
Development Cooperation)
HVC High Value Chain
IFAD International Fund for Agriculture Development
JICA Japan International Cooperation Agency
KARI Kenya Agriculture Research Institute
KEPHIS Kenya Plant Health Inspectorate Service
KEBS Kenya Bureau of Standards
KENFAP Kenya National Federation of Agricultural Producers
KES Kenya Shillings
KIRDI Kenya Industrial Research and Development Institute
MT Metric Tonnes
MoALD Ministry of Agriculture and Livestock Development
MENR Ministry of Environment and Natural Resources
MOH Ministry of Health
M4P Markets for the poor
MRL Maximum Residue Limits
NEMA National Environmental Management Authority
PCPB Pest Control Products Board
PPP Public-private partnerships
SHDP Small Scale Horticulture Development Program
SHoMAP Small Holder Horticulture Marketing Program
SNV Netherlands Development Organization
STAK Seed Traders Association
UK United Kingdom
USAID United States Agency for International Development
VC Value Chain
WB World Bank
v
TABLE OF CONTENTS
EXECUTIVE SUMMARY................................................................................................................................................... I
LIST OF ACRONYMNS .................................................................................................................................................. IV
ACKNOWLEDGEMENT ................................................................................................................................................. VI
1.0 INTRODUCTION ................................................................................................................................................ 1
2.0 SECTOR DESCRIPTION ....................................................................................................................................... 1
2.1 OVERVIEW OF THE HORTICULTURE SUB-SECTOR .................................................................................................................... 1 2.2 KEY TRENDS OVER THE PAST 5 YEARS .................................................................................................................................. 1 2.3 RELEVANCE TO THE POOR ................................................................................................................................................. 3 2.4 THE SECTOR MAP OF GREEN BEANS ................................................................................................................................... 4 2.5 MAJOR SUPPORTING INSTITUTIONS OR PRIVATE SERVICE PROVIDERS ....................................................................................... 14 2.6 CROSS CUTTING ISSUES .................................................................................................................................................. 16
3.0 SECTOR ANALYSIS .......................................................................................................................................... 18
3.1 VALUE CREATION IN BEAN SUB-SECTOR ............................................................................................................................. 18 3.2 THE FORMAL AND INFORMAL RULES ................................................................................................................................ 19 3.3 IMPLICATIONS FOR VALUE CREATION FOR THE MARKET ........................................................................................................ 19
4.0 THE COMPETITIVENESS POSITION OF THE SECTOR ........................................................................................... 21
4.1 GLOBAL AND LOCAL DEMAND ......................................................................................................................................... 21 4.2 COMPETITION .............................................................................................................................................................. 21 4.3 EMERGING TRENDS IN INNOVATION IN THE PAST 5 YEARS ...................................................................................................... 23 4.4 SYSTEMIC CONSTRAINTS TO COMPETITIVENESS.................................................................................................................... 23
5.0 SECTOR STRATEGY ......................................................................................................................................... 29
5.1 SECTOR VISIONS: ARTICULATION OF THE SECTOR VISIONS ..................................................................................................... 29 5.2 KEY ACTORS IN THE CHANGE PROCESS ............................................................................................................................... 29 5.3 PATHWAYS TO SYSTEMIC CHANGE .................................................................................................................................... 30
6.0 REFERENCES ................................................................................................................................................... 33
7.0 ANNEXES ....................................................................................................................................................... 34
ANNEX 1: AVERAGE COST OF PRODUCTION AND PROFITS FOR GREEN BEAN............................................................................................ 34 ANNEX 2: KENYA GREEN BEAN EXPORTERS ..................................................................................................................................... 35 ANNEX 3: INSTRUMENTS USED TO COLLECT DATA FROM FARMERS AND KEY INFORMANTS ...................................................................... 39 ANNEX 4.FOCUS GROUP DISCUSSION (FGD) GUIDE FOR AGRICULTURAL FINANCE ................................................................................. 46 ANNEX 5: QUESTIONNAIRE USED IN THE FIELD ................................................................................................................................. 49
List of tables
Table 1: Production of French/Green beans from 2006-2010 ............................................................................ 2
Table 2: Farm gate Value (Ksh) of French Beans/Green Beans production in 2006-2010 ....................................... 3
Table 3: Growers of green beans and their characteristics and role in the value chain .......................................... 5
Table 4: Intervention area ........................................................................................................................ 31
List of figures
Figure 1: Production of Green Beans by Province ............................................................................................ 2
Figure 2: Trend in Acreage under Green Bean by province ............................................................................... 2
Figure 3: Trend in Production of Green Bean by Province ................................................................................. 2
Figure 4: Farm gate Value of Green Beans Production in 2006-2010 .................................................................. 3
Figure 5: Green Bean Marketing channel for Export....................................................................................... 11
Figure 6: Local market Chain for the Green Bean .......................................................................................... 14
Figure 7: Bean sub-sector constraint fish bone diagram ................................................................................. 28
vi
ACKNOWLEDGEMENTACKNOWLEDGEMENTACKNOWLEDGEMENTACKNOWLEDGEMENT
There are a number of persons and institutions that contributed to the successful completion of Beans value chain
study in Kenya who we feel indebted to acknowledge in this report. First, we would like to thank Embassy of The
Kingdom of Netherlands, Nairobi through Solidaridad East and Central Africa Expertise Center (SECAEC) for
providing the finances to undertake the assignment. We are particularly thankful to Alphonce Muriu (Senior
Economic Development Advisor SNV – Horticulture Sector Leader), Thomas Were (Senior Economic Development
Advisor- SNV), and Benard Ndolo (Junior Consultant Horticulture - SNV) for their contribution towards the
facilitation, content development, quality control and overall success of the study. Our appreciations also go to
Fineline Systems and Management Consultants team for the field data collection and collation led by Mr. Alex
Mala.
We would also like to thank officials from the Ministry of Agriculture in all the beans growing areas visited
especially in Central, Rift Valley and Upper Eastern Provinces. In addition our appreciation to all the stakeholders
who participated in the study cutting across the producers, transporters, services providers, processers, traders,
exporters and development facilitators without whom the results of this studies would not have been successful.
We also give our sincere gratitude to all the stakeholders who were involved in report validation at the validation
workshop held in Fairview Hotel, Nairobi. Your contributions and positive critiques have shaped the outlook of this
final report.
To all those mentioned above and others who may in one way or the other have contributed to the success of this
project we are indeed very grateful and value your contribution.
Harm Duiker
Country Director SNV Kenya
1
1.01.01.01.0 INTRODUCTIONINTRODUCTIONINTRODUCTIONINTRODUCTION
Horticulture is an important subsector of Kenyan agriculture, the mainstay of the country’s economy, in achieving
food security, income and employment generation, foreign exchange earnings, raw material for agro-processing,
and poverty alleviation. Solidaridad/SNV/HIVOS has designed a programme to scale up the horticulture and food
security in Kenya by strengthening the smallholder to produce in a more sustainable manner and improve the
Kenyan food security.
This assignment was commissioned by SNV, HIVOS and Solidaridad – Horticulture and Food Security Program and
implemented by SNV and a team of private sector consultants, Fineline Systems and Management and August
2012. The objective of the assignment was to develop an analysis of and the strategy for the bean sub-sector
consistence with the M4P framework. The analysis included: (i) the overall sub-sector performance and position of
the poor within it; (ii) the structure, players and relationship that describes how it operates; (iii) key systemic
constraint impinging on the sub-sector; (iv) the main elements of the sub-sector strategy; and (v) specific
interventions consistent with the analysis and strategy. The information used in the analysis was obtained
through interviews with various participants in the green bean value chain conducted between March and August.
The interviewees included smallholder farmers, farmer group leaders, horticultural industry association leaders,
exporters, domestic green bean buyers, EU importers and EU supermarkets and certification companies. The
interviews were supplemented with secondary information and data from reports on the sub-sector.
2.02.02.02.0 SECTOR DESCRIPTIONSECTOR DESCRIPTIONSECTOR DESCRIPTIONSECTOR DESCRIPTION
2.1 Overview of the horticulture sub-sector
Agriculture is the mainstay of the Kenyan economy with an annual direct and indirect contribution to GDP of 24%
and 27% respectively. Horticulture is among the leading contributors to the Agricultural GDP at 33% and
continues to grow at between 15 and 20% per year. The horticulture sub sector has grown significantly to become
a major employer, with over six million Kenyans directly and indirectly employed. About 96% of the horticultural
production is consumed locally, while the remaining 4% is exported; yet in terms of incomes, the export segment
earns the country huge amounts of foreign exchange (National Horticultural Policy 2010). The Kenyan horticultural
industry has grown from its base of small businesses and small farmers, to being dominated by very sophisticated
businesses that are becoming increasingly vertically integrated. According to USAID Kenya Horticultural
Competitiveness Project, export of fresh produce earned Kenya about Ksh.91.4 billion in the year 2011. In the
year 2010 the value of Kenya’s horticultural exports was Kshs. 77.71 billion shillings ($ 971 million in foreign
exchange) up from 71.60 billion shillings in 2009 representing a 7.7% increase. The overall subsector is
comprised of a mix of products from the three main subgroups: primarily flowers, fresh fruits, and fresh
vegetables.
2.2 Key trends over the past 5 years
The subsector analysis will focus on green beans from among the range of horticultural export crops. The Green
beans are grown mainly by smallholder farmers under irrigation in Central, Rift Valley and Eastern Provinces.
French beans were initially grown exclusively for export market, mainly to the European Union but over the years
the vegetable has gained popularity in the domestic market, especially the premium supermarkets; as more than
66% of green been produced is consumed locally or wasted. The crop is grown mainly by smallholder farmers
under irrigation in Central (16,526 MT), Rift Valley (4,419 MT), Eastern (33,596 MT), Western (980 MT) and Coast
(320 MT) Provinces. There has been a 37% reduction in the area under green bean production from 7,733ha in
2007 to 4840ha in year 2010. Between 2008 and 2010, the production volume and value decreased by about
39% and 45% respectively. This was due to prolonged drought in 2008 – 2009. Table 1 shows the area (ha) and
production (MT) for green beans.
2
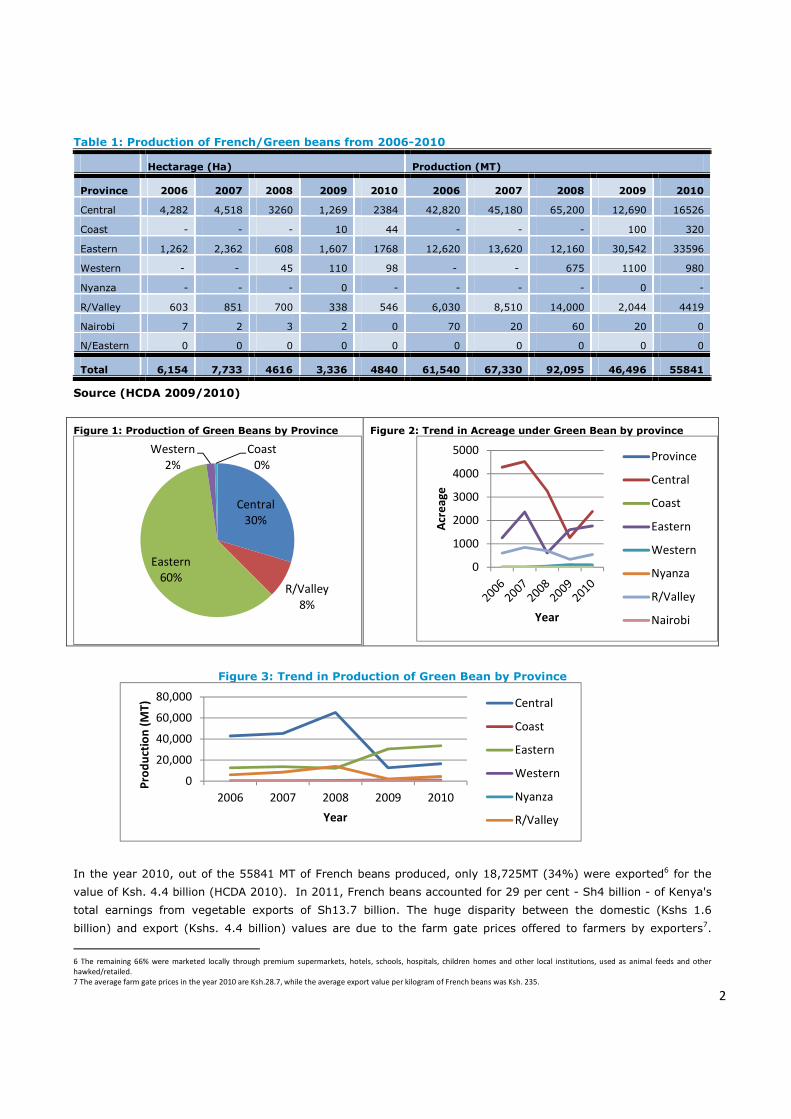
Table 1: Production of French/Green beans from 2006-2010
Hectarage (Ha) Production (MT)
Province 2006 2007 2008 2009 2010 2006 2007 2008 2009 2010
Central 4,282 4,518 3260 1,269 2384 42,820 45,180 65,200 12,690 16526
Coast - - - 10 44 - - - 100 320
Eastern 1,262 2,362 608 1,607 1768 12,620 13,620 12,160 30,542 33596
Western - - 45 110 98 - - 675 1100 980
Nyanza - - - 0 - - - - 0 -
R/Valley 603 851 700 338 546 6,030 8,510 14,000 2,044 4419
Nairobi 7 2 3 2 0 70 20 60 20 0
N/Eastern 0 0 0 0 0 0 0 0 0 0
Total 6,154 7,733 4616 3,336 4840 61,540 67,330 92,095 46,496 55841
Source (HCDA 2009/2010)
Figure 1: Production of Green Beans by Province
Figure 2: Trend in Acreage under Green Bean by province
Figure 3: Trend in Production of Green Bean by Province
In the year 2010, out of the 55841 MT of French beans produced, only 18,725MT (34%) were exported6 for the
value of Ksh. 4.4 billion (HCDA 2010). In 2011, French beans accounted for 29 per cent - Sh4 billion - of Kenya's
total earnings from vegetable exports of Sh13.7 billion. The huge disparity between the domestic (Kshs 1.6
billion) and export (Kshs. 4.4 billion) values are due to the farm gate prices offered to farmers by exporters7.
6 The remaining 66% were marketed locally through premium supermarkets, hotels, schools, hospitals, children homes and other local institutions, used as animal feeds and other
hawked/retailed. 7 The average farm gate prices in the year 2010 are Ksh.28.7, while the average export value per kilogram of French beans was Ksh. 235.
Central
30%
R/Valley
8%
Eastern
60%
Western
2%
Coast
0%
0
1000
2000
3000
4000
5000A
cre
ag
e
Year
Province
Central
Coast
Eastern
Western
Nyanza
R/Valley
Nairobi
0
20,000
40,000
60,000
80,000
2006 2007 2008 2009 2010
Pro
du
ctio
n (
MT
)
Year
Central
Coast
Eastern
Western
Nyanza
R/Valley
3
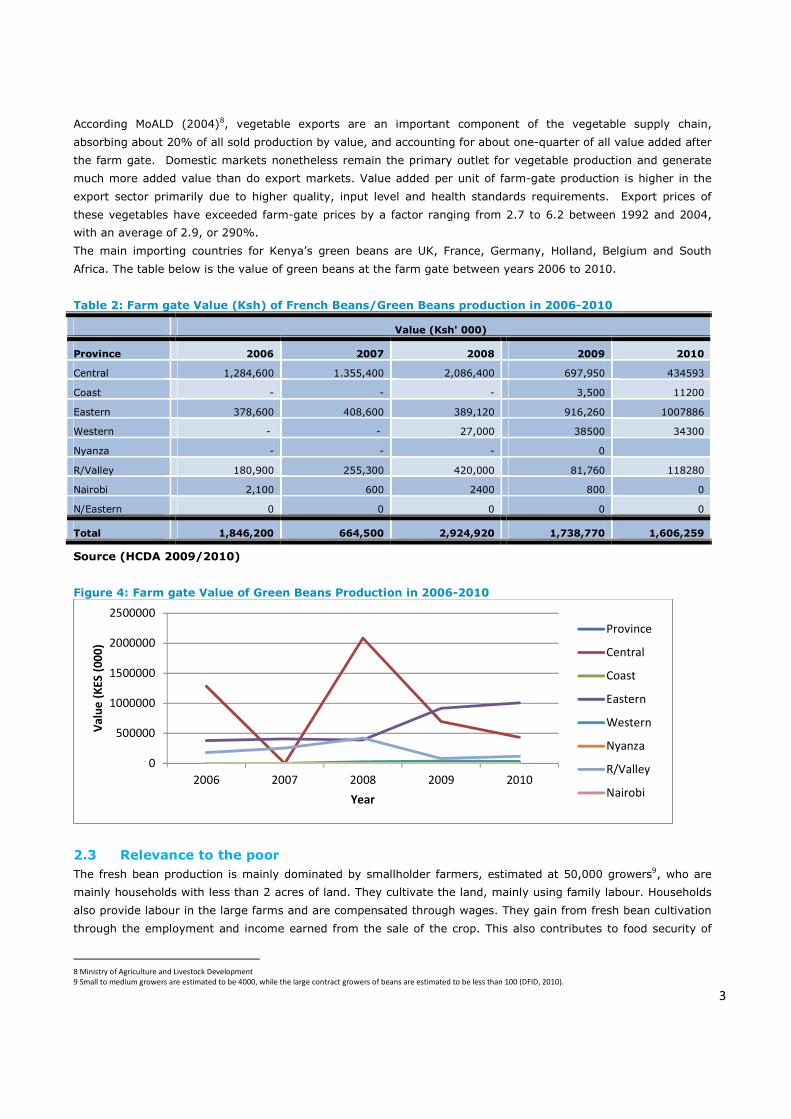
According MoALD (2004)8, vegetable exports are an important component of the vegetable supply chain,
absorbing about 20% of all sold production by value, and accounting for about one-quarter of all value added after
the farm gate. Domestic markets nonetheless remain the primary outlet for vegetable production and generate
much more added value than do export markets. Value added per unit of farm-gate production is higher in the
export sector primarily due to higher quality, input level and health standards requirements. Export prices of
these vegetables have exceeded farm-gate prices by a factor ranging from 2.7 to 6.2 between 1992 and 2004,
with an average of 2.9, or 290%.
The main importing countries for Kenya’s green beans are UK, France, Germany, Holland, Belgium and South
Africa. The table below is the value of green beans at the farm gate between years 2006 to 2010.
Table 2: Farm gate Value (Ksh) of French Beans/Green Beans production in 2006-2010
Value (Ksh' 000)
Province 2006 2007 2008 2009 2010
Central 1,284,600 1.355,400 2,086,400 697,950 434593
Coast - - - 3,500 11200
Eastern 378,600 408,600 389,120 916,260 1007886
Western - - 27,000 38500 34300
Nyanza - - - 0
R/Valley 180,900 255,300 420,000 81,760 118280
Nairobi 2,100 600 2400 800 0
N/Eastern 0 0 0 0 0
Total 1,846,200 664,500 2,924,920 1,738,770 1,606,259
Source (HCDA 2009/2010)
Figure 4: Farm gate Value of Green Beans Production in 2006-2010
2.3 Relevance to the poor
The fresh bean production is mainly dominated by smallholder farmers, estimated at 50,000 growers9, who are
mainly households with less than 2 acres of land. They cultivate the land, mainly using family labour. Households
also provide labour in the large farms and are compensated through wages. They gain from fresh bean cultivation
through the employment and income earned from the sale of the crop. This also contributes to food security of
8 Ministry of Agriculture and Livestock Development
9 Small to medium growers are estimated to be 4000, while the large contract growers of beans are estimated to be less than 100 (DFID, 2010).
0
500000
1000000
1500000
2000000
2500000
2006 2007 2008 2009 2010
Va
lue
(K
ES
(0
00
)
Year
Province
Central
Coast
Eastern
Western
Nyanza
R/Valley
Nairobi
4
these households. A typical farmer10 growing bean makes an average profit of US$750 (Ksh.60000) per year.
(DFID, 2010). Small holder farmers grow horticultural products because they are profitable, earning up to seven
times more income than maize. In addition, the small land size of these farmers makes maize farming
uneconomical.
2.4 The Sector Map of Green Beans
The subsector map is a visual presentation of the way the product flows through different channels from
production to the markets. The map is divided between the different functions that are carried out in getting the
product from farm to the end markets. The participants are divided into channels based on their forward and
backwards linkages and their use of technologies that differentiate them from one another. The main functions in
the subsector are production (or growing); harvesting, bulking, purchasing and collection of the product, packing
and export of the product, the shipping, import and distribution to the consumer markets. These are described
more fully below, along with the range of participants who fulfil the various functions. The domestic value chain,
though not different from the export, has also been presented.
2.4.1 Growing of green beans
There are three differentiated kinds of growers. These are the large farmers, very small traditional and emerging
bean growers. In the middle are small to medium farmers who grow beans primarily on contract.
10 There is no universally agreed definition of small-scale farms in developing countries. In much of the development literature, farms of less than five hectares can be considered “small”.
In general these farms often have limited capital or other assets. For the purposes of this paper we adopt a broad definition of a small-scale farmer. A small-scale is one who derives their
livelihood from
a holding of < 2-5ha (usually < 2ha); and around 10 to 20 heads of livestock (although often there is < 2 or none at all). Small-scale farmers may practice a mix of commercial and
subsistence production (in crops or livestock) or either, where family provides the majority of labor and the farm provides the principle source of income. In the paper we define a small
holder farmer as one who is (neither large scale or medium scale farmers – meaning 5-several thousand acres), often using small inputs such as pangas and hoes to cultivate, with open
plots of < 2 acres and which are oft
5
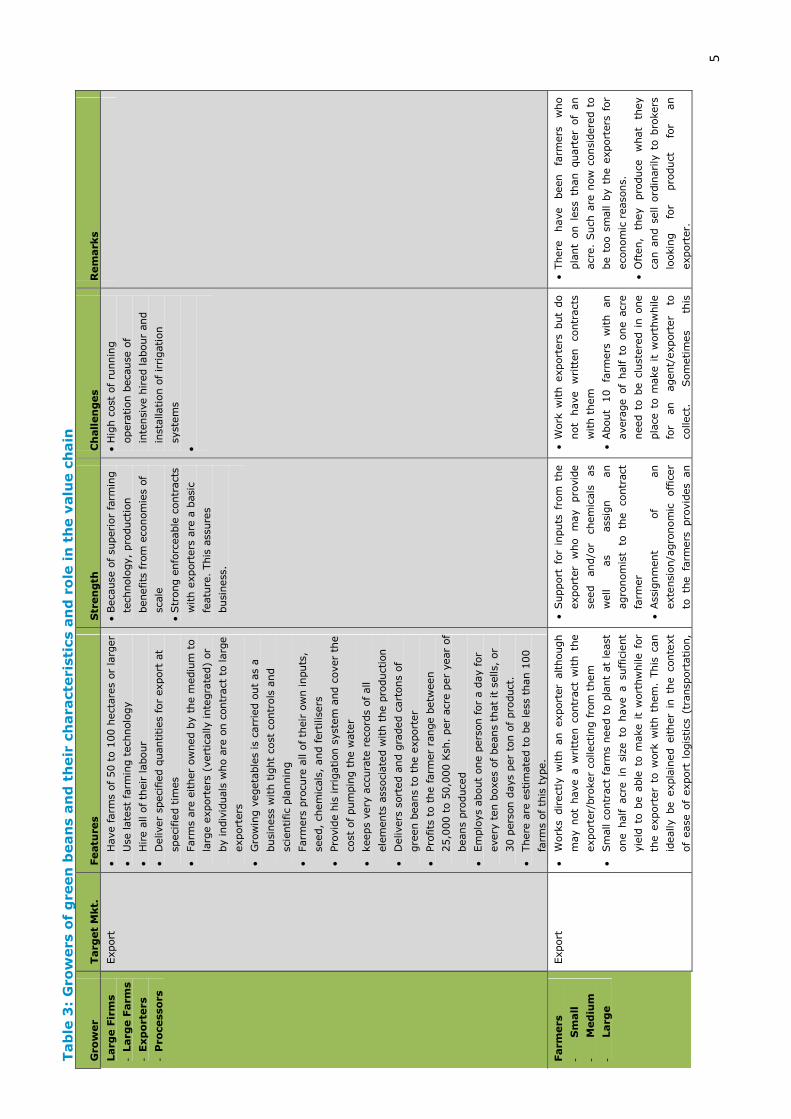
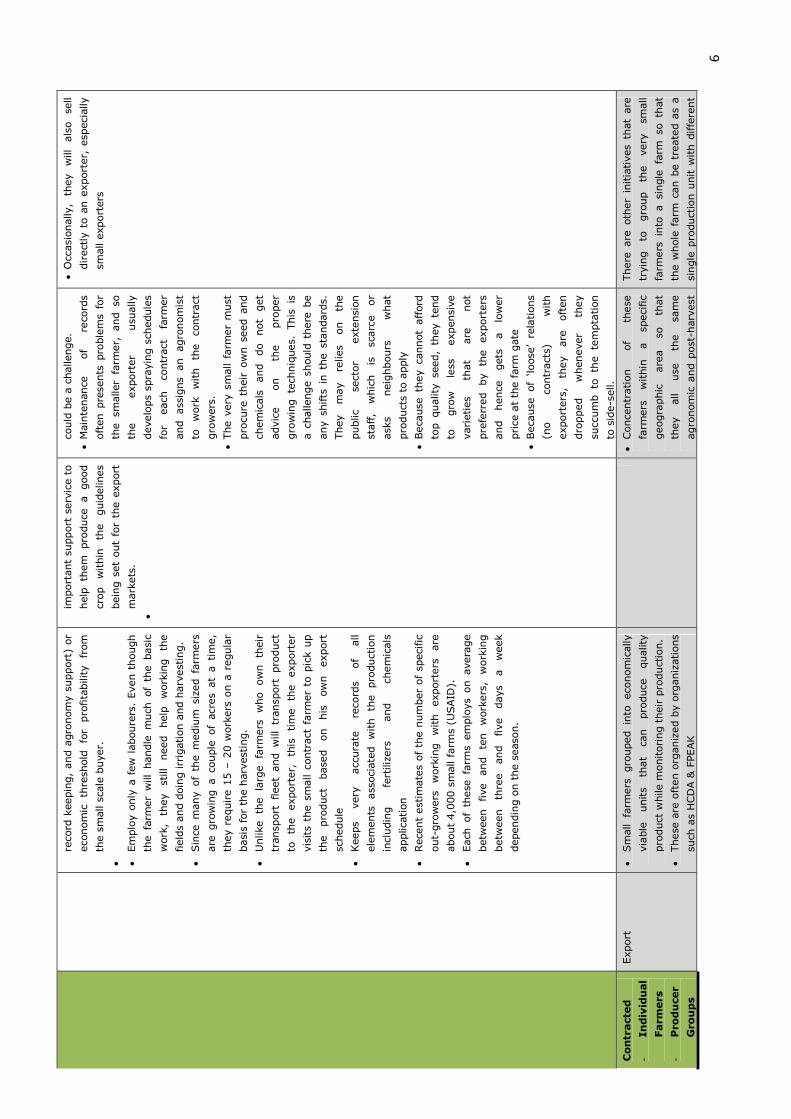
Table 3: Growers of green beans and their characteristics and role in the value chain
Grower
Target Mkt.
Features
Strength
Challenges
Remarks
Large Firms
- Large Farm
s
- Exporters
- Processors
Export
•
Have farm
s of 50 t
o 1
00 h
ect
are
s or
larg
er
•
Use
late
st farm
ing t
ech
nolo
gy
•
Hire a
ll o
f th
eir
labour
•
Deliver
speci
fied q
uantities
for
export
at
speci
fied t
imes
•
Farm
s are
either
ow
ned b
y t
he m
ediu
m t
o
larg
e e
xport
ers
(vert
ically inte
gra
ted)
or
by indiv
iduals
who a
re o
n c
ontr
act
to larg
e
export
ers
•
Gro
win
g v
egeta
ble
s is
carr
ied o
ut
as
a
busi
ness
with t
ight
cost
contr
ols
and
scie
ntific
pla
nnin
g
•
Farm
ers
pro
cure
all o
f th
eir
ow
n inputs
,
seed, ch
em
icals
, and fert
ilis
ers
•
Pro
vid
e h
is irr
igation s
yst
em
and c
over
the
cost
of pum
pin
g t
he w
ate
r
•
keeps
very
acc
ura
te r
eco
rds
of all
ele
ments
ass
oci
ate
d w
ith t
he p
roduct
ion
•
Delivers
sort
ed a
nd g
raded c
art
ons
of
gre
en b
eans
to t
he e
xport
er
•
Pro
fits
to t
he farm
er
range b
etw
een
25,0
00 t
o 5
0,0
00 K
sh.
per
acr
e p
er
year
of
beans
pro
duce
d
•
Em
plo
ys
about
one p
ers
on for
a d
ay for
every
ten b
oxes
of beans
that
it s
ells,
or
30 p
ers
on d
ays
per
ton o
f pro
duct
.
•
There
are
est
imate
d t
o b
e less
than 1
00
farm
s of th
is t
ype.
• B
eca
use
of su
perior
farm
ing
tech
nolo
gy,
pro
duct
ion
benefits
fro
m e
conom
ies
of
scale
• S
trong e
nfo
rceable
contr
act
s
with e
xport
ers
are
a b
asi
c
featu
re. This
ass
ure
s
busi
ness
.
• H
igh c
ost
of ru
nnin
g
opera
tion b
eca
use
of
inte
nsi
ve h
ired labour
and
inst
alla
tion o
f irrigation
syst
em
s
•
Farmers
- Small
- Medium
- Large
Export
•
Work
s direct
ly w
ith an export
er
although
may n
ot
have a
writt
en c
ontr
act
with t
he
export
er/
bro
ker
colle
ctin
g fro
m t
hem
•
Sm
all c
ontr
act
farm
s need t
o p
lant
at
least
one half acr
e in
si
ze to
have a su
ffic
ient
yie
ld t
o b
e a
ble
to m
ake i
t w
ort
hw
hile
for
the e
xport
er
to w
ork
with t
hem
. This
can
ideally be expla
ined either
in th
e co
nte
xt
of
ease
of
export
logis
tics
(tr
ansp
ort
ation,
• Support
for
inputs
fro
m t
he
export
er
who
may
pro
vid
e
seed
and/o
r ch
em
icals
as
well
as
ass
ign
an
agro
nom
ist
to th
e co
ntr
act
farm
er
• Ass
ignm
ent
of
an
exte
nsi
on/a
gro
nom
ic
offic
er
to th
e fa
rmers
pro
vid
es
an
• W
ork
with e
xport
ers
but
do
not
have
writt
en
contr
act
s
with t
hem
• About
10
farm
ers
w
ith
an
avera
ge o
f half t
o o
ne a
cre
need t
o b
e c
lust
ere
d i
n o
ne
pla
ce t
o m
ake i
t w
ort
hw
hile
for
an
agent/
export
er
to
colle
ct.
Som
etim
es
this
• There
have
been
farm
ers
w
ho
pla
nt
on le
ss th
an quart
er
of
an
acr
e.
Such
are
now
consi
dere
d t
o
be t
oo s
mall b
y t
he e
xport
ers
for
eco
nom
ic r
easo
ns.
• O
ften,
they
pro
duce
w
hat
they
can a
nd s
ell o
rdin
arily
to b
rokers
lookin
g
for
pro
duct
fo
r an
export
er.
6
reco
rd k
eepin
g,
and a
gro
nom
y s
upport
) or
eco
nom
ic th
resh
old
fo
r pro
fita
bili
ty
from
the s
mall s
cale
buyer.
•
•
Em
plo
y o
nly
a f
ew
laboure
rs.
Even t
hough
the fa
rmer
will
handle
m
uch
of
the basi
c
work
, th
ey
still
need
help
w
ork
ing
the
field
s and d
oin
g irr
igation a
nd h
arv
est
ing.
•
Sin
ce m
any o
f th
e m
ediu
m s
ized f
arm
ers
are
gro
win
g a co
uple
of
acr
es
at
a tim
e,
they r
equire 1
5 –
20 w
ork
ers
on a
regula
r
basi
s fo
r th
e h
arv
est
ing.
•
Unlike th
e la
rge fa
rmers
w
ho ow
n th
eir
transp
ort
fleet
and w
ill
transp
ort
pro
duct
to
the
export
er,
th
is
tim
e
the
export
er
vis
its
the s
mall c
ontr
act
farm
er
to p
ick u
p
the
pro
duct
base
d
on
his
ow
n
export
schedule
•
Keeps
very
acc
ura
te
reco
rds
of
all
ele
ments
ass
oci
ate
d w
ith th
e pro
duct
ion
incl
udin
g
fert
ilize
rs
and
chem
icals
applic
ation
•
Rece
nt
est
imate
s of
the n
um
ber
of
speci
fic
out-
gro
wers
w
ork
ing
with
export
ers
are
about
4,0
00 s
mall farm
s (U
SAID
).
•
Each
of
these
fa
rms
em
plo
ys
on avera
ge
betw
een
five
and
ten
work
ers
, w
ork
ing
betw
een
thre
e
and
five
days
a
week
dependin
g o
n t
he s
easo
n.
import
ant
support
serv
ice t
o
help
th
em
pro
duce
a good
crop
within
th
e
guid
elines
bein
g s
et
out
for
the e
xport
mark
ets
.
•
could
be a
challe
nge.
• M
ain
tenance
of
reco
rds
oft
en p
rese
nts
pro
ble
ms
for
the sm
aller
farm
er,
and so
the
export
er
usu
ally
develo
ps
spra
yin
g s
chedule
s
for
each
co
ntr
act
fa
rmer
and ass
igns
an agro
nom
ist
to
work
w
ith
the
contr
act
gro
wers
.
• The v
ery
sm
all f
arm
er
must
pro
cure
their o
wn s
eed a
nd
chem
icals
and
do
not
get
advic
e
on
the
pro
per
gro
win
g te
chniq
ues.
This
is
a c
hallenge s
hould
there
be
any s
hifts
in t
he s
tandard
s.
They
may
relies
on
the
public
se
ctor
exte
nsi
on
staff,
whic
h
is
scarc
e
or
ask
s neig
hbours
w
hat
pro
duct
s to
apply
• Beca
use
th
ey ca
nnot
afford
top quality
se
ed,
they te
nd
to
gro
w
less
expensi
ve
varieties
that
are
not
pre
ferr
ed
by
the
export
ers
and
hence
gets
a
low
er
price
at
the farm
gate
• Beca
use
of
‘loose
’ re
lations
(no
contr
act
s)
with
export
ers
, th
ey
are
oft
en
dro
pped
whenever
they
succ
um
b to
th
e te
mpta
tion
to s
ide-s
ell.
• O
ccasi
onally,
they
will
als
o
sell
direct
ly t
o a
n e
xport
er,
esp
eci
ally
small e
xport
ers
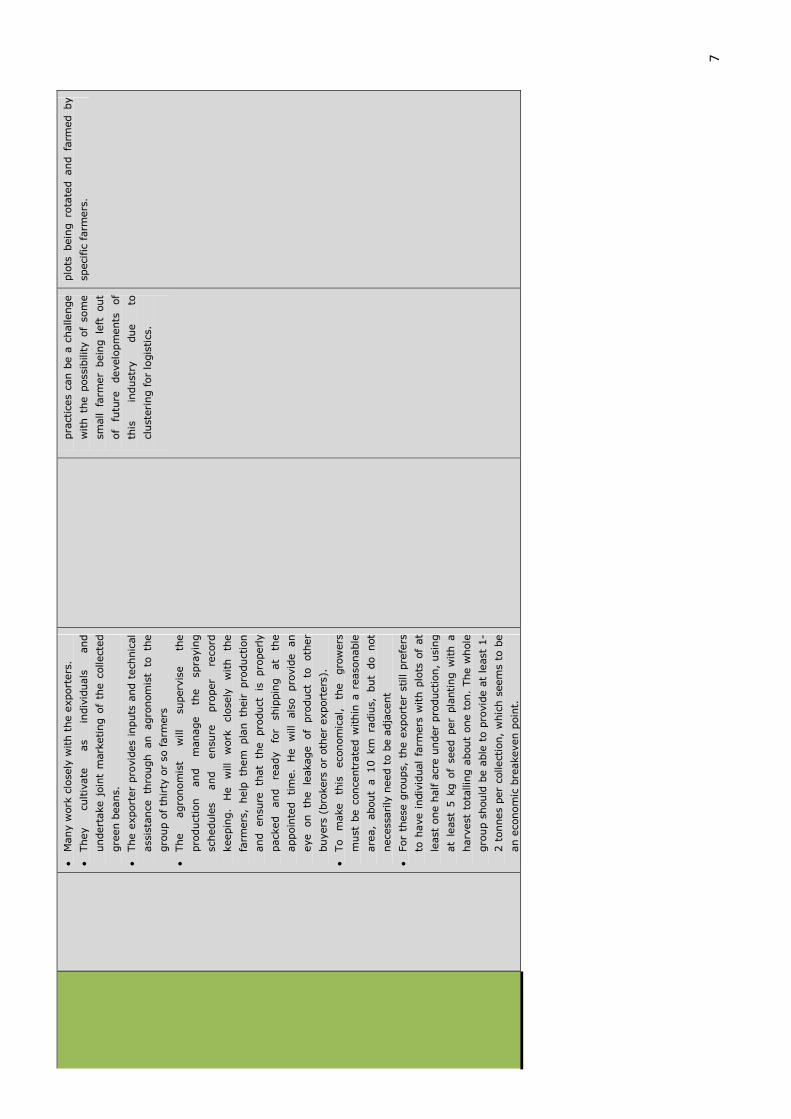
Contracted
- Individual
Farmers
- Producer
Groups
Export
•
Sm
all fa
rmers
gro
uped in
to eco
nom
ically
via
ble
units
that
can
pro
duce
quality
pro
duct
while
monitoring t
heir
pro
duct
ion.
•
These
are
oft
en o
rganiz
ed b
y o
rganiz
ations
such
as
HCD
A &
FPEAK
• Conce
ntr
ation
of
these
farm
ers
w
ithin
a
speci
fic
geogra
phic
are
a
so
that
they
all
use
th
e
sam
e
agro
nom
ic a
nd p
ost
-harv
est
There
are
oth
er
initia
tives
that
are
tryin
g
to
gro
up
the
very
sm
all
farm
ers
in
to a si
ngle
fa
rm so
th
at
the w
hole
farm
can b
e t
reate
d a
s a
single
pro
duct
ion u
nit w
ith d
iffe
rent
7
•
Many w
ork
clo
sely
with t
he e
xport
ers
.
•
They
cultiv
ate
as
indiv
iduals
and
undert
ake j
oin
t m
ark
eting o
f th
e c
olle
cted
gre
en b
eans.
•
The e
xport
er
pro
vid
es
inputs
and t
ech
nic
al
ass
ista
nce
th
rough an agro
nom
ist
to th
e
gro
up o
f th
irty
or
so farm
ers
•
The
agro
nom
ist
will
su
perv
ise
the
pro
duct
ion
and
manage
the
spra
yin
g
schedule
s and
ensu
re
pro
per
reco
rd
keepin
g.
He
will
w
ork
cl
ose
ly
with
the
farm
ers
, help
th
em
pla
n th
eir pro
duct
ion
and ensu
re th
at
the pro
duct
is
pro
perly
pack
ed
and
ready
for
ship
pin
g
at
the
appoin
ted tim
e.
He w
ill als
o pro
vid
e an
eye on th
e le
akage of
pro
duct
to
oth
er
buyers
(bro
kers
or
oth
er
export
ers
).
•
To
make
this
eco
nom
ical,
the
gro
wers
must
be c
once
ntr
ate
d w
ithin
a r
easo
nable
are
a,
about
a 10 km
ra
diu
s, but
do not
nece
ssarily
need t
o b
e a
dja
cent
•
For
these
gro
ups,
the e
xport
er
still pre
fers
to h
ave i
ndiv
idual
farm
ers
with p
lots
of
at
least
one h
alf a
cre u
nder
pro
duct
ion,
usi
ng
at
least
5 k
g o
f se
ed p
er
pla
nting w
ith a
harv
est
tota
lling a
bout
one t
on.
The w
hole
gro
up s
hould
be a
ble
to p
rovid
e a
t le
ast
1-
2 t
onnes
per
colle
ctio
n,
whic
h s
eem
s to
be
an e
conom
ic b
reakeven p
oin
t.
pra
ctic
es
can b
e a
challe
nge
with t
he p
oss
ibility o
f so
me
small fa
rmer
bein
g le
ft out
of
futu
re
develo
pm
ents
of
this
in
dust
ry
due
to
clust
ering for
logis
tics
.
plo
ts bein
g ro
tate
d and fa
rmed by
speci
fic
farm
ers
.
8
2.4.2 Collection and Brokering
When Kenya first entered the green bean market over 3 decades ago, brokers served the role of doing much of
the collection from the very small farmers, buying from them at cheaper prices and reselling to the exporters
(margin of about KES 10/ box of 3 kg., a cost that was often borne by the farmer. With the increasing
requirements for traceability of the product, exporters must now contract directly with the growers, which make
brokering an endangered profession. However the advantage of brokering is filling up inefficiency gaps in the
product chain because the small, medium and even large exporters still suffer some product movement
inefficiencies. They frequently use brokers to acquire additional product, thus cutting down on their own costs
and time loss. Many exporters buy from brokers on a regular basis to round out orders. In areas where exporters
do not reach the farmers, the brokers become the main outlet for farmer but pay relatively low prices, the
alternative being that the farmer loses out completely. One disadvantage is; because of not having up-front
costs, they tend to push their risk to the farmer and the exporter who may have supplied seed/input in advance.
This in turn leads to side-selling, which in turn destroys the otherwise cordial contractual relationships with the
exporters.Within the year (through several – 2 to 3 planting seasons, prices can vary from as low as KES 10 to
as high as KES 110/kg. The reasons for such huge fluctuations includes demand/supply forces, poor quality
beans and competition among buyers i.e. exporters, processors and to a small extent, brokers. Other causes of
fluctuations may be weather changes, social holidays or events in the export market
2.4.3 Exporting of beans
This involves the purchase of the beans from the grower, final grading into the appropriate categories, packing,
and shipping to a buyer in Europe. Even during the low season, there were about 37 firms exporting vegetable
products (beans, etc.). These represent large, medium, and small firms. These figures come close to double
during the peak season, as more part time exporters enter the market. Most of the exporters working with
contract growers have trained them in grading to ensure that they get quality product. There are three major
groups of exporters: the large vertically integrated, small to medium, and the briefcase exporters.
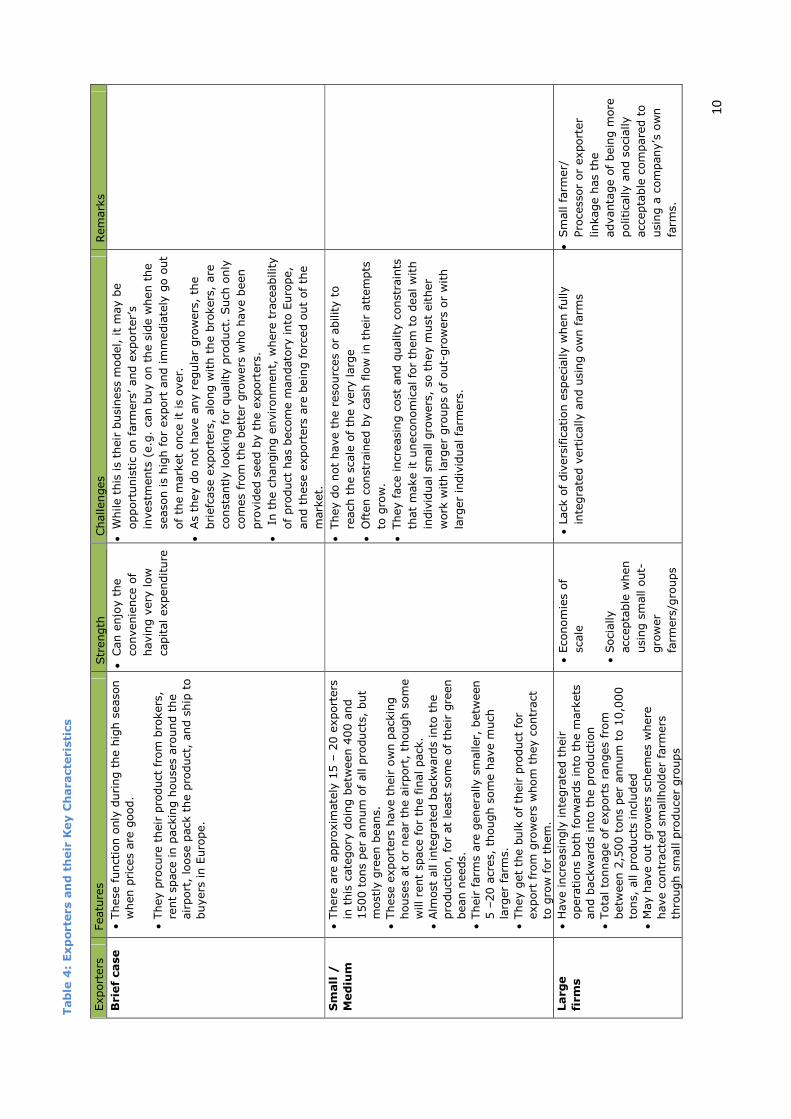
a) Briefcase exporters: These function only during the high season when prices are good. They procure their
product from brokers, rent space in packing houses around the airport, loose pack the product, and ship to
buyers in Europe. As they do not have any regular growers, the briefcase exporters, along with the brokers,
are constantly looking for quality product. This product comes most often from the better growers who have
been provided seed by other exporters. In the changing environment, where traceability11 of product has
become mandatory into Europe, and these exporters are being forced out of the market.
b) Small to medium exporters: These exporters are in the market all year long. They are serious about
exporting, but do not have the resources or ability to reach the scale of the very large. Issues that make
them unable to get to scale of large exporters are that most are start-ups that are growing, challenges in
securing guaranteed large markets. They are often constrained by cash flow in their attempts to grow.
There are approximately 15 – 20 exporters in this category doing between 400 and 1500 tons per annum of
all products, but mostly green beans. In most cases these exporters have their own packing houses at or
near the airport, though some will rent space for the final pack. These exporters are almost all integrated
backwards into the production, for at least some of their green bean needs. Their farms are generally
smaller, between 5 –20 acres, though some have much larger farms. They get the bulk of their product for
export from growers whom they contract to grow for them. But they are also facing increasing cost and
11
Such exporters are involved in produce poaching. They are also unable to trace the origin of their produce since they
have no contractual relationships with small holder growers.
9
quality constraints that make it uneconomical for them to deal with individual small growers, so they must
either work with larger groups of out-growers or with larger individual farmers.
c) Large integrated exporters. These exporters have increasingly integrated their operations both forwards
into the markets and backwards into the production. Their total tonnage of exports ranges from between
2,500 tons per annum to 10,000 tons, all products included. Finlays, Vegpro, Sunripe, Everest and Frigoken
have out growers schemes; they have contracted smallholder farmers through small producer groups. This
form of small farmer/processor or exporter linkage has the advantage of being more politically and socially
acceptable compared to using a company’s own farms, as it fosters inclusiveness than tightly vertically
integrated systems (such as those in the flower industry) where small farmers are completely locked out.
Some large exporters such as Everest have very strong market links and generally provide a fairly consistent
amount of product over the course of the year. Some of them, like Home-grown, Indu-farm and Everest, are
integrated into the markets, with shareholding in the distributors in Europe.
10
Table 4: Exporters and their Key Characteristics
Export
ers
Featu
res
Str
ength
Challenges
Rem
ark
s Brief case
• T
hese
funct
ion o
nly
during t
he h
igh s
easo
n
when p
rice
s are
good.
• T
hey p
rocu
re t
heir
pro
duct
fro
m b
rokers
, re
nt
space
in p
ack
ing h
ouse
s aro
und t
he
air
port
, lo
ose
pack
the p
roduct
, and s
hip
to
buyers
in E
uro
pe.
• Can e
njo
y t
he
convenie
nce
of
havin
g v
ery
low
capital expenditure
• W
hile t
his
is
their
busi
ness
model, it
may b
e
opport
unis
tic
on f
arm
ers
’ and e
xport
er’
s
invest
ments
(e.g
. ca
n b
uy o
n t
he s
ide w
hen t
he
seaso
n is
hig
h for
export
and im
media
tely
go o
ut
of
the m
ark
et
once
it
is o
ver.
• As
they d
o n
ot
have a
ny r
egula
r gro
wers
, th
e
bri
efc
ase
export
ers
, alo
ng w
ith t
he b
rokers
, are
const
antly lookin
g f
or
quality
pro
duct
. Such
only
com
es
from
the b
ett
er
gro
wers
who h
ave b
een
pro
vid
ed s
eed b
y t
he e
xport
ers
.
• I
n t
he c
hangin
g e
nvironm
ent,
where
tra
ceability
of
pro
duct
has
beco
me m
andato
ry into
Euro
pe,
and t
hese
export
ers
are
bein
g forc
ed o
ut
of th
e
mark
et.
Small /
Medium
• T
here
are
appro
xim
ate
ly 1
5 –
20 e
xport
ers
in
this
cate
gory
doin
g b
etw
een 4
00 a
nd
1500 t
ons
per
annum
of
all p
roduct
s, b
ut
most
ly g
reen b
eans.
• T
hese
export
ers
have t
heir
ow
n p
ack
ing
house
s at
or
near
the a
irport
, th
ough s
om
e
will re
nt
space
for
the fin
al pack
. • A
lmost
all inte
gra
ted b
ack
ward
s in
to t
he
pro
duct
ion,
for
at
least
som
e o
f th
eir g
reen
bean n
eeds.
• T
heir f
arm
s are
genera
lly s
maller,
betw
een
5 –
20 a
cres,
though s
om
e h
ave m
uch
la
rger
farm
s.
• T
hey g
et
the b
ulk
of th
eir
pro
duct
for
export
fro
m g
row
ers
whom
they c
ontr
act
to
gro
w f
or
them
.
• They d
o n
ot
have t
he r
eso
urc
es
or
ability t
o
reach
the s
cale
of
the v
ery
larg
e
• O
ften c
onst
rain
ed b
y c
ash
flo
w in t
heir
att
em
pts
to g
row
.
• They face
incr
easi
ng c
ost
and q
uality
const
rain
ts
that
make it
uneco
nom
ical fo
r th
em
to d
eal w
ith
indiv
idual sm
all g
row
ers
, so
they m
ust
either
work
with larg
er
gro
ups
of
out-
gro
wers
or
with
larg
er
indiv
idual fa
rmers
.
Large
firms
• H
ave incr
easi
ngly
inte
gra
ted t
heir
opera
tions
both
forw
ard
s in
to t
he m
ark
ets
and b
ack
ward
s in
to t
he p
roduct
ion
• T
ota
l to
nnage o
f export
s ra
nges
from
betw
een 2
,500 t
ons
per
annum
to 1
0,0
00
tons,
all p
roduct
s in
cluded
• M
ay h
ave o
ut
gro
wers
sch
em
es
where
have c
ontr
act
ed s
mallhold
er
farm
ers
th
rough s
mall p
roduce
r gro
ups
• E
conom
ies
of
scale
• S
oci
ally
acc
epta
ble
when
usi
ng s
mall o
ut-
gro
wer
farm
ers
/gro
ups
• L
ack
of
div
ers
ific
ation e
speci
ally w
hen f
ully
inte
gra
ted v
ert
ically a
nd u
sing o
wn f
arm
s
• Sm
all f
arm
er/
Pro
cess
or
or
export
er
linkage h
as
the
advanta
ge o
f bein
g m
ore
politica
lly a
nd s
oci
ally
acc
epta
ble
com
pare
d t
o
usi
ng a
com
pany’s
ow
n
farm
s.
11
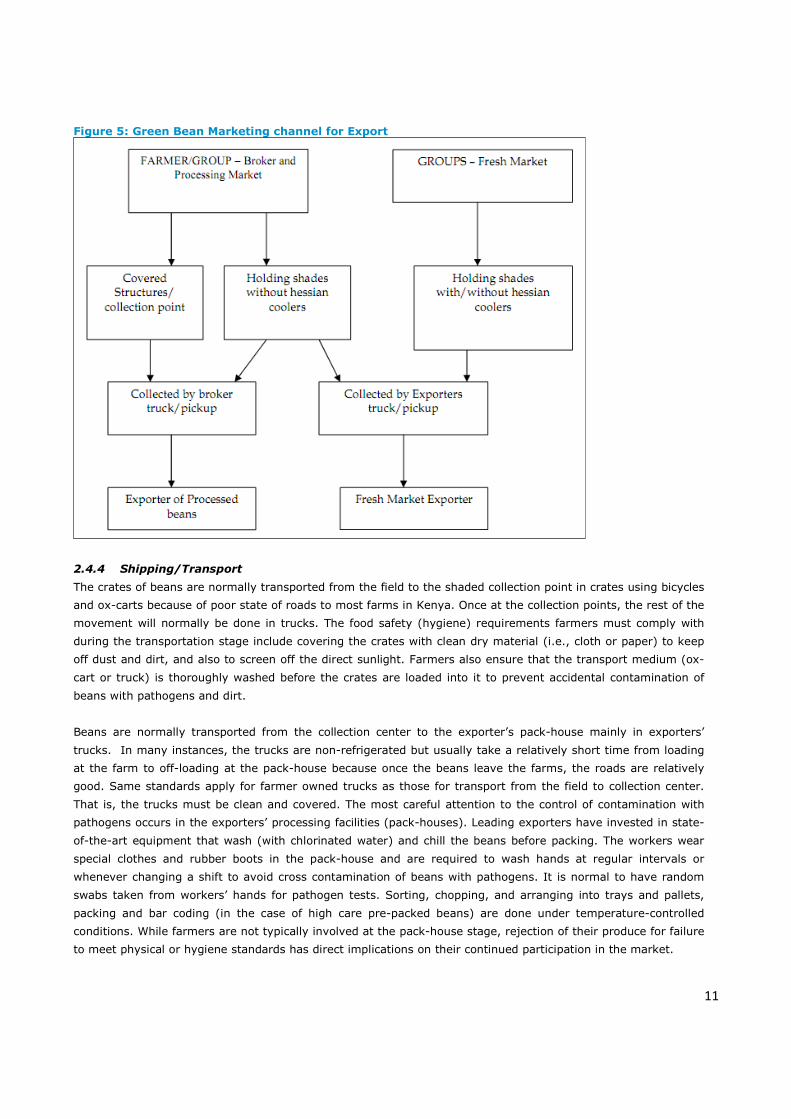
Figure 5: Green Bean Marketing channel for Export
2.4.4 Shipping/Transport
The crates of beans are normally transported from the field to the shaded collection point in crates using bicycles
and ox-carts because of poor state of roads to most farms in Kenya. Once at the collection points, the rest of the
movement will normally be done in trucks. The food safety (hygiene) requirements farmers must comply with
during the transportation stage include covering the crates with clean dry material (i.e., cloth or paper) to keep
off dust and dirt, and also to screen off the direct sunlight. Farmers also ensure that the transport medium (ox-
cart or truck) is thoroughly washed before the crates are loaded into it to prevent accidental contamination of
beans with pathogens and dirt.
Beans are normally transported from the collection center to the exporter’s pack-house mainly in exporters’
trucks. In many instances, the trucks are non-refrigerated but usually take a relatively short time from loading
at the farm to off-loading at the pack-house because once the beans leave the farms, the roads are relatively
good. Same standards apply for farmer owned trucks as those for transport from the field to collection center.
That is, the trucks must be clean and covered. The most careful attention to the control of contamination with
pathogens occurs in the exporters’ processing facilities (pack-houses). Leading exporters have invested in state-
of-the-art equipment that wash (with chlorinated water) and chill the beans before packing. The workers wear
special clothes and rubber boots in the pack-house and are required to wash hands at regular intervals or
whenever changing a shift to avoid cross contamination of beans with pathogens. It is normal to have random
swabs taken from workers’ hands for pathogen tests. Sorting, chopping, and arranging into trays and pallets,
packing and bar coding (in the case of high care pre-packed beans) are done under temperature-controlled
conditions. While farmers are not typically involved at the pack-house stage, rejection of their produce for failure
to meet physical or hygiene standards has direct implications on their continued participation in the market.
12
2.4.5 Bean Importers
These are the clients of the exporters. They are critical to the whole process. There are small independent
importers who operate during the peak season, as do the briefcase exporters, but the majority of the export
passes through the hands of regular, respected importers and distributors. The largest exporters have fixed
relations with strong distributors who have long term relations with the supermarkets. Some of the distributors
are actually co-owned by the exporters (Everest and Finlays).
2.4.6 Domestic Green Bean Consumption
In a study conducted by WB/EU/ACP (2010), a unanimous outcome of a series of studies indicated that a major
problem faced in development of a methodology to characterize the supply of fruits and vegetables to major
cities in East Africa was lack of data to characterize the domestic horticulture market. In Kenya, domestic fresh
vegetables supply is irregular and faces lots of imports including bananas, papayas, pears, and apples among
others. Although plenty of data exists to describe local production, little or no data is available on domestic
supply. In a study of snap bean production, post-harvest practices and constraints in Kirinyaga and Machakos
districts of Kenya, Ndegwa, A.M. Muthoka, C.W, Gathambiri, M.N,, Muchui, M.N., Kamau, M.W., and Waciuri,
S.M. (2009)12 found that local consumption of snap bean was minimal. They identified development of locally
adapted varieties for promotion of the bean utilization in the local market. Majority of the farmers working with
the green bean did not sell to the local market since there was no ready demand for the vegetable. In addition,
most of the farmers are organized in groups bound by regulations forbidding sale to the local market. Others
have contracts with companies that will not permit sale of their produce outside the contract. Lastly, green beans
are highly perishable and not convenient for sale to the local market. For these reasons, the local value chain for
green bean is under-developed and information is largely unavailable.
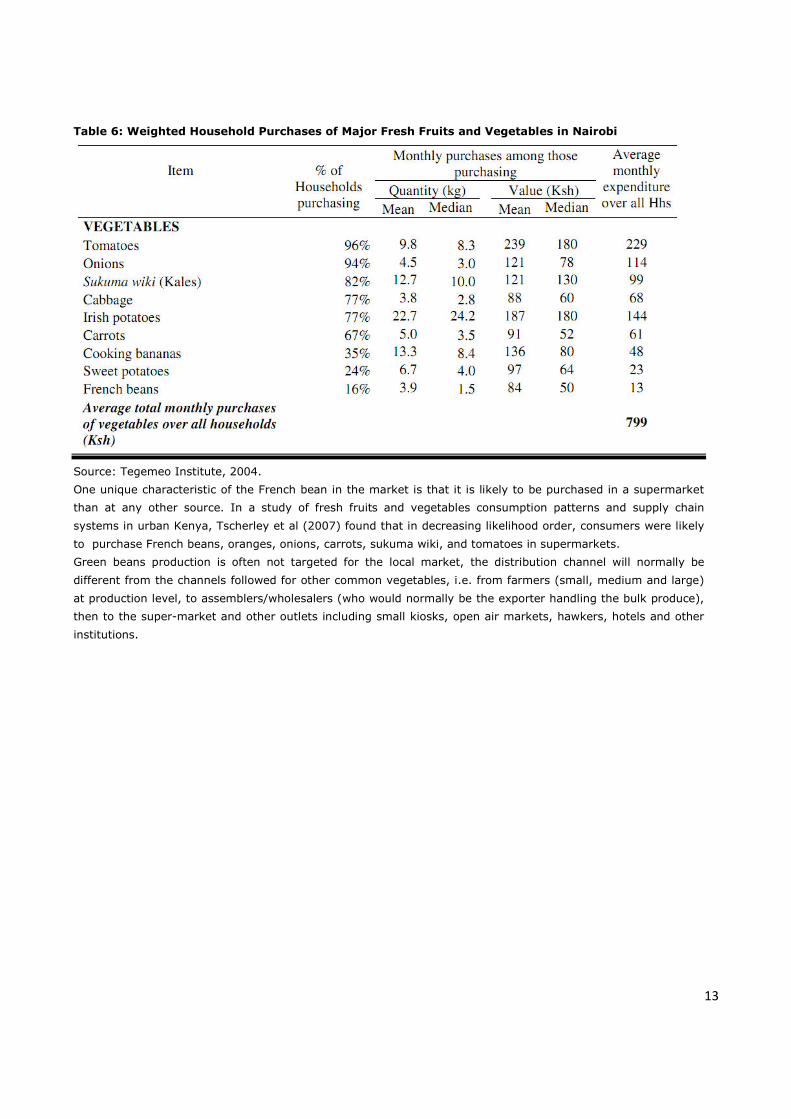
In a study of fresh fruit and vegetable consumption patterns and supply chain systems in urban Kenya,
Tschirley, Ayieko & Mathenge, (2007)13 found that French beans were least purchased by Nairobi population
(16%). The table below shows weighted households purchases of major fresh fruits and vegetables in Nairobi in
2004.
12
Ndegwa, A.M. et al (2009): Snap Bean Production, Post-harvest Practices and Constraints in Kirinyaga and Machakos
Districts of Kenya; KARI, Thika. 13
Tegemeo Institute of Agricultural Policy & Development, 2007
13
Table 6: Weighted Household Purchases of Major Fresh Fruits and Vegetables in Nairobi
Source: Tegemeo Institute, 2004.
One unique characteristic of the French bean in the market is that it is likely to be purchased in a supermarket
than at any other source. In a study of fresh fruits and vegetables consumption patterns and supply chain
systems in urban Kenya, Tscherley et al (2007) found that in decreasing likelihood order, consumers were likely
to purchase French beans, oranges, onions, carrots, sukuma wiki, and tomatoes in supermarkets.
Green beans production is often not targeted for the local market, the distribution channel will normally be
different from the channels followed for other common vegetables, i.e. from farmers (small, medium and large)
at production level, to assemblers/wholesalers (who would normally be the exporter handling the bulk produce),
then to the super-market and other outlets including small kiosks, open air markets, hawkers, hotels and other
institutions.
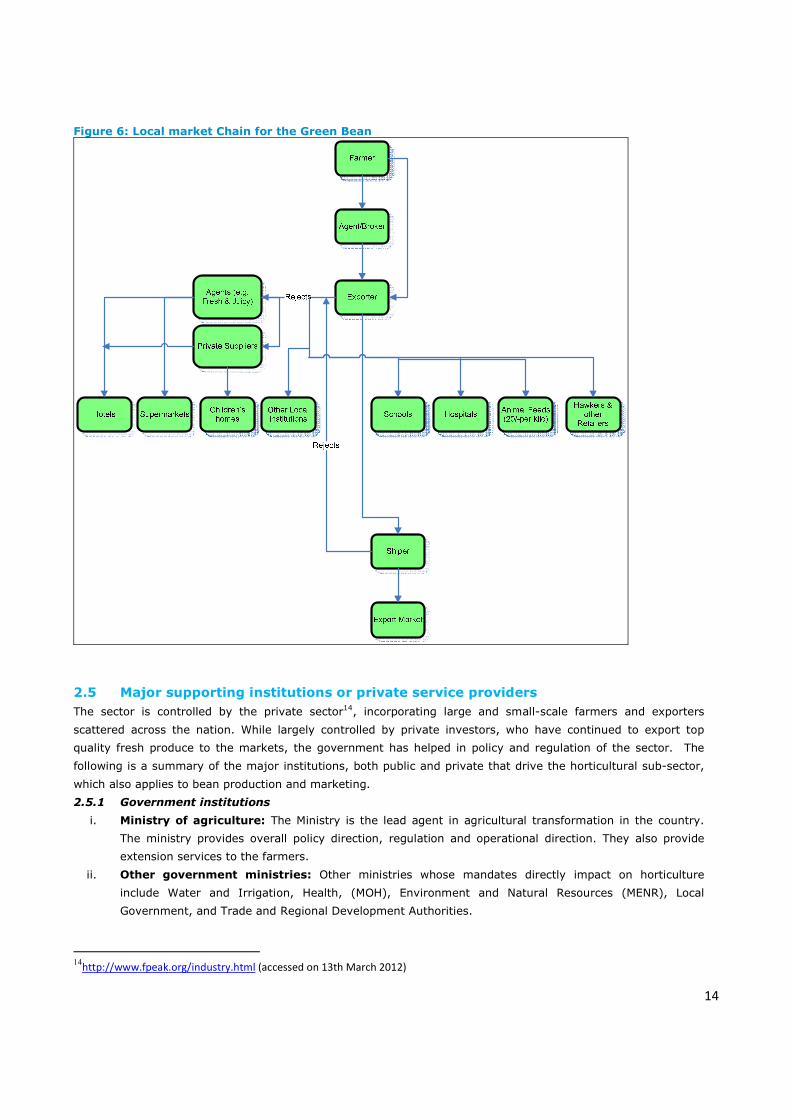
14
Figure 6: Local market Chain for the Green Bean
2.5 Major supporting institutions or private service providers
The sector is controlled by the private sector14, incorporating large and small-scale farmers and exporters
scattered across the nation. While largely controlled by private investors, who have continued to export top
quality fresh produce to the markets, the government has helped in policy and regulation of the sector. The
following is a summary of the major institutions, both public and private that drive the horticultural sub-sector,
which also applies to bean production and marketing.
2.5.1 Government institutions
i. Ministry of agriculture: The Ministry is the lead agent in agricultural transformation in the country.
The ministry provides overall policy direction, regulation and operational direction. They also provide
extension services to the farmers.
ii. Other government ministries: Other ministries whose mandates directly impact on horticulture
include Water and Irrigation, Health, (MOH), Environment and Natural Resources (MENR), Local
Government, and Trade and Regional Development Authorities.
14
http://www.fpeak.org/industry.html (accessed on 13th March 2012)
15
iii. Horticultural crops development authority: The Horticultural Crops Development Authority (HCDA)
is established under the Agriculture Act, (Cap. 318) through the Horticultural Crops Development
Authority Order, 1967 (Legal Notice No. 229/1967). HCDA has the mandate to facilitate the
development, promotion, coordination and regulation of the horticulture industry in Kenya.
iv. Kenya plant health inspectorate service: The Kenya Plant Health Inspectorate Services (KEPHIS)
was established by the Kenya Plant Health Inspectorate Service Order, 1996 under the State
Corporations Act (Cap 446). KEPHIS is the designated competent authority with the responsibility of
regulating plant health issues relating to phyto-sanitary and seed matters.
v. Kenya agricultural research institute: The Kenya Agriculture Research Institute (KARI) is established
under the Science and Technology Act (Cap 250) with the national mandate of carrying out research the
fields of agriculture.
vi. The pest control products board: The Pest Control Products Board (PCPB) is established under the
Pest Control Products Act (Cap 346). Its functions are to regulate the importation, exportation,
manufacturing, distribution and usage of pesticides.
vii. Kenya bureau of standards: The Kenya Bureau of Standards (KEBS) is established under the
Standards Act (Cap 496). Its primary function is to promote standardization in commerce and industry
viii. Kenya industrial research and development institute: The Kenya Industrial Research and
Development Institute (KIRDI) were established under the Science and Technology Act (Cap 250). It is
mandated to undertake research and development in industrial and allied technologies.
ix. Export promotion council: The Export Promotion Council (EPC) is established through Legal Notice No.
4342 with the mandate of developing and promoting Kenya’s exports. EPC’s primary duty is to identify
and address constraints facing exporters and producers of export goods and services.
x. National environmental management authority
xi. The National Environmental Management Authority (NEMA) is established under the Environmental
Management and Coordination Act (EMCA) No. 8 of 1999, as the principal instrument of government in
the implementation of all policies relating to the environment.
xii. Universities and colleges of agriculture: There are a number of public universities and colleges of
agriculture in Kenya; these institutions are established under Cap 210 of the laws of Kenya. The
institutions’ primary roles are research and development of human capacity.
2.5.2 Private sector Organisations
i. Fresh produce exporters association of Kenya: The Fresh Produce Exporters Association of Kenya
(FPEAK) was established in 1975. It is a members association dedicated to the welfare and enhancement
of members’ business activities through lobbying, information and marketing support, and promoting
members’ compliance with international standards. The FPEAK membership comprises large and small-
scale farmers and exporters (see annex for the list of registered members).
ii. Kenya national federation of agricultural producers: The Kenya National Federation of Agricultural
Producers (KENFAP) is the umbrella organization of agricultural producers. KENFAP lobbies for and
advocates through representation of producer groups and commodity associations at local, regional,
national and international levels.
iii. Agrochemical association of Kenya: The membership of Agrochemical Association of Kenya (AAK)
comprises manufacturers, formulators, re-packers, importers, distributors, farmers, and users of pest
control products (pesticides). The primary objective of AAK is to promote safe and effective use of
pesticide chemicals.
iv. Seed traders association: This Seed Traders Association (STAK) is an association for seed traders and
seed trading companies operating in the country.
16
2.6 Cross Cutting Issues
While growing of green beans is done under tight controls in terms of use of inputs (fertilisers and pesticides),
these pose occupational15 safety issues especially if the standards are not adhered to, especially to producers
targeting both export and local market. Adherence to the standards has been a challenge to small scale farmers
due to the increasing costs of compliance, limited skills and inadequate access to the right inputs. There have
been initiatives by leading European supermarkets to be carbon neutral following concerns of carbon emissions
from air freighted food. Green beans use airfreights due to their perishability. However, Kenyans growers are
perplexed with the pre-occupation, though they note that climate change will directly affect green bean
production. Kenyan horticulture is between 4 and 6 times less carbon intensive than the European equivalent,
which relies on temperature control and heavy machinery (Africa Research Institute, 2009).
The fresh bean industry in general employs 45,000 to 60,000 people, of whom an estimated 60 per cent are
women, in commercial farms, processing, and logistics operations. According to Feed the Future; Kenya 2011-
2015 Multi-year Strategy, It is estimated that nearly half or 44 percent of Kenya’s smallholder households are
managed by women. This is largely attributed to rapid rural to urban migration by men in search of employment.
Women are active at every point in the food chain and are often responsible for the household farming activities
under which most of the green bean farms fall. There are more precision activities that require numbers and are
best done by women especially at the farm level. These include; planting, picking pods, sorting, grading and
packaging. At the pack houses, gender roles become distinct again with women dominating handling sorting,
grading and quality control. Men will often do manually demanding tasks like land preparation, irrigation,
spraying, loading and off-loading trucks. More research is however required to better understand the socio-
economic implications of increased participation of women in the sector and intra-household labor (revenue
retention) impacts of a transfer from traditional commodities to high value green vegetable products.
Employees typically earn just under US$2 per day, while smallholders are reportedly able to earn the equivalent
of US$7 per day. There are concerns that proceeds are not shared equally among men and women farmers.
Some of the underlying reasons for this include failure to target/support activities in which women, youth and
children predominate, in effect serving to disempower them, failure to catalyse social innovations that reduce
gender inequality in agricultural production such as innovations in agricultural labour saving technologies and
practices that reduce women’s labour burden, failure to link women to extension and markets, inadequate pro-
women legislation enforcement efforts and lack of training on integration of gender in green bean value chains
business.
Employment and work conditions, especially amongst the large scale and commercial farms, discriminate gender,
against marginalised groups and persons with disability. Cases of sexual harassment, reluctance to accord
women maternity leaves, poor pay and work conditions have been reported, especially in large farms
(Government of Kenya, 2010). Youths are involved in gainful employment at various stages of the bean value
chains growing for export and local markets i.e. production, marketing, inputs suppliers, Business Development
Services, exports etc. For instance, youth farmers in Central and Eastern counties of Kenya have embraced the
opportunities that facilitate Global GAP compliance and the challenges encountered in the process of acquiring
GLOBALGAP certification. The main challenges encountered in pursuit of Global GAP compliance by the youth in
Kenya include; unfavorable land tenure systems and insecure lease agreements, limited access to funds, limited
15
The health and well-being of people employed in a work environment in terms of safety equipment, training and
procedures
17
awareness of potential effects/impact of Global GAP compliance, limited awareness of emerging export markets,
non-binding contracts and poor coordination of stakeholders making compliance costly and complicated.
Youth‘s engagement in export horticulture is ranked more favorably compared to other farm-level enterprises
due to the high returns per unit area, short production period and regularity of income. However, these benefits
are more skewed to the resource endowed youths who can afford the heavy and lumpy investments required to
meet Global GAP standards. On the flip-side, the less resource-endowed youths either totally or temporarily exit
export-bound horticultural production for other enterprises, remain non-compliant or maneuver their way into
accessing the export market.
There is need to provide incentive to the youth to innovatively involve them in different horticultural value
chains. The sub-sector is among the leading foreign exchange earner and contributes enormously to food
security and household income to majority of Kenyan producers. The industry also provides employment to
many Kenyans thus contributing to food security. Green bean production is dominated by rural small scale
farmers especially women and the youth and this make up a big part of their incomes. Women farmers working
with green beans own small plots of land have succeeded in exporting green beans to Europe and other regions.
The profit margin on green beans is relatively high. Most importantly, most of these women farmers grow them
on family or group farms, which provides them with the flexibility to care and provide for their families while
cultivating cash crops and earning an income. They participate in many activities ranging from planting,
weeding, picking, sorting, grading and packaging. They also take part in decision making on what to do with the
proceeds that directly benefits the families. According to USAID (2005); TRADE LIBERALIZATION, ECONOMIC
GROWTH, AND GENDER, giving women farmers the same level of agricultural inputs and education as men could
increase yields obtained by women more than 20 percent. This would translate into more income, and benefit to
their respective families.
18
3.03.03.03.0 SECTOR ANALYSISSECTOR ANALYSISSECTOR ANALYSISSECTOR ANALYSIS
3.1 Value Creation in bean sub-sector
Kenya has been exporting vegetables to the Europe since the 1950s. Reasons for Kenyan success have varied
with the changing market forces of the highly competitive UK and European markets. Kenya’s original success in
exporting vegetables, especially beans was based on its climatic and geographic competitive advantage.
Producing temperate products year round and being well served by northbound airfreight (thanks to the Kenyan
tourism market) proved lucrative for Kenyan vegetable exporters. Kenyan success has been due to market
segmentation, investing in certification schemes, adding value to products through sophisticated packaging,
servicing niche markets, and investing in marketing. Over the years, due to effective public-private dialogue, the
Kenyan government has been receptive to implementing regulatory changes, investing in education, and
improving infrastructure, which have increased the competitiveness of the industry. For example, the
Horticulture Crops Development Authority (HCDA) of Kenya was initially directly involved in the trading of
vegetables but eventually switched to a more facilitative function; it now focuses solely on certification schemes.
Throughout the 1970s and 1980s, the majority of Kenyan vegetables imported into the European Community
were handled by firms that serviced wholesale markets and small or medium retail outlets. In the 1980s, Kenyan
exports doubled in five years due to a differential foreign exchange rate for horticultural exports, which the
government set below average prices, providing further incentive for exporters to invest in the industry. By the
late 1990s, due to lobbying efforts of the Fresh Producer Exporters Association of Kenya (FPEAK), the Kenyan
government partnered with the private sector to expand the Fresh Produce Terminal at the Nairobi airport, thus
improving the competitiveness of fresh vegetable exports. Then, throughout the 1990s, large supermarkets
began to dominate the European grocery sector, in part, by featuring signature “fresh produce” sections. As they
did so, these firms increased the market demand for higher quality, more variety, and price-competitive fresh
produce. To meet demand, many firms decided to vertically integrate their retail and wholesale operations, thus
concentrating their power in the market and making price competition and product diversification major market
forces. In the 2000s, as the power of the supermarkets continued to drive the market, many supermarkets
began to pursue market segmentation and branding strategies, which increased the demand for higher quality
standards, different varieties, and organic or “safer” produce. A number of exporters have invested heavily in
growing their own high quality, certified vegetables to take advantage of the increased market opportunities for
high-quality produce. The effect of these trends has been a much shorter supply chain, a greater degree of
vertical integration, fewer active players, and production and exporting on a much grander scale.
The domestic market value chain for green beans though important, it has not been considered for development
by both government and private sector actors. This is partly because the production of green bean is often not
for the local market and given the structure of the value chain for the local market, little research has gone into
tracking the value of bean that ends up in the local market. Almost all of the green bean volumes that find their
way into the local market are actually rejects. They end up in supermarkets, where they are slashed and re-
packaged, schools, big hotels; out-door catering companies and other institutions such as children’s homes. The
Small Holder Horticulture Marketing Program (SHoMaP) and Small Scale Horticulture Development Program
(SHDP) are making efforts to develop the local value chains for an assortment of vegetables, including the green
bean. The procedures, controls and costs that go into producing the bean cannot be sustained by the local
market at the moment, and promoting this vegetable might entail use of less fastidious varieties, probably more
adaptable to the local weather conditions, that require less chemicals and controls or those that are justified by
the farmers’ cost profiles and intended for the local market. If the same vegetables produced for the export
market are the same to be marketed locally, then there would be implication on the contractual agreements and
restrictions for side selling. There has to be a parallel VC developed specifically to service the local market and
one that is economically justifiable by the market locally. The vegetables being sold now, are likely to be left
19
overs or those that to don’t meet physiological, chemical application and quality of freshness standards and
which must be sold off without destroying, or those that have not been picked from the farms by
exporters/brokers. The gap lies here and there is an opportunity to develop a completely new VC for the local
market, with its own variety of seeds and production procedures.
3.2 The Formal and Informal Rules
Despite its importance in the economy as a leading foreign exchange earner, the industry has not had a policy to
guide its growth and sustainability. However, in the year 2010, the National Horticultural policy was finalised
(GOK, 2010). The policy analyzes the various industry concerns and highlights the challenges they face. It offers
policy interventions for production, support services (financing the industry, research and extension), marketing
(local, regional and export markets), infrastructure as well as regulatory and institutional arrangements.
Requirements in the international markets for green beans and other fresh produce appear to be raising the bar
for new entrants while at the same time throwing new challenges in the path of existing growers. In recognition
of the need to meet these standards of environmental management, product food safety, quality, traceability
and occupational health & safety of workers, FPEAK launched the code of practice (that has so far changed its
name into KENYA-GAP) in 1996 as a certification measure for producers and exporters to achieve. The code of
practice covers the entire spectrum of production, food handling, transportation, packaging and waste
management. KENYA-GAP is intended to enhance the reputation of Kenya's exports by encouraging production
and marketing practices that are socially, environmentally and agronomically responsible. Certification against
KENYA-GAP acknowledges that qualifying exporters are meeting internationally &nationally recognized
production practices and standards for fresh produce and provides the market buyers with a 'guarantee of
confidence'. The introduction of international food safety standards (IFSS)16 has given rise to the need for
farmers to change their production and marketing practices. To be IFSS compliant, farmers find it necessary to:
i) adopt alternative ways of managing pests, ii) adopt safer ways of handling, storing and disposing pesticides,
iii) establish hygienic packing conditions, and iv) establish traceability system. The investments needed to make
these changes are, in most cases, lumpy in nature and require various forms of capital. Small and large farms
generally differ in their capital endowments and in the way they raise capital needed to finance new investments.
There are other players/institutions in the government and private sector mentioned in sections above who work
with the with input suppliers, growers and exporters of beans in mainly ensuring that the final products delivered
to the market is of acceptable quality. The players are generally strong in their area.
3.3 Implications for value creation for the Market
Most of the smallholder farmers are generally poor households whose main role in the value chain is in growing
beans. Therefore, interventions that help these farmers improve the quality and quantities of production vis a vis
finding the markets for the beans both locally and for export will surely improve incomes and directly and
indirectly meet household food situation. According to DFID 2010, Kenyan smallholder farmers earn between
$750 and $2,250 a year from green beans. And, the high standards of good agricultural practice required have
enhanced the farm management skills of 1000’s of small scale farmers. On the other hand, the costs of reaching
and maintaining these standards are high and it’s not clear whether small-scale farmers can continue to meet
them without sustained donor or other external support. Several studies have documented the difficulties
smallholder farmers encounter in complying with European standards (Okello& Swinton, 2007; Graffham,
Karehu& McGregor, 2009). Following the introduction of EFSS in Kenya, more than half of the smallholder
outgrowers were dropped by leading exporters soon after the European retailers they supplied started
20
demanding strict compliance with their private food safety protocols. Consequently, while smallholders in Kenya
produced over 60% of green beans in 1980s, their share had dropped to about 30% in 2003 (Kimenye, 1993;
Jaffee, 2003). However, interventions in helping farmers cope with these requirements have contributed to
increasing the numbers of smallholder players. The green bean export value chain the smallholder farmers are
most threatened by the European food safety standards, and have often been excluded from the high value
chains. The areas in the value chains where small holder farmers might be excluded that include:
i) Pre-harvest field level activities – At pre-harvest the field level critical control points (CCP),
individual smallholder farmers have found investment in facilities and skills needed to assure safety
(i.e. hygiene and pesticide residue limits) unaffordable.
ii) Harvesting field level activities- Handling and hygiene practices during the harvesting, grading and
packing of green beans sold through the supermarket chain are also closely coordinated. Exporters
have adopted the developed-country process standards such as the hazard analysis and critical
control points (HACCP), good manufacturing practices (GMP), and good agricultural practices (GAP).
For majority of smallholder farmers these requirements are too expensive owing to the large capital
outlays involved. For instance, A full cycle of training to attain certification for compliance to
EUROGAP can cost anything from KES 1 Million upwards. This is not easy for a local small farmer to
raise, yet is essential for them to participate in the export business effectively. The exporters also
require that farmers keep records of the type and quality of inputs used. Keeping majority of these
records requires special skills and functional literacy, and is therefore a significant hurdle the
illiterate and low-skilled farmers. The harvesting practices are also closely monitored by the exporter
mainly related to the hygiene and aesthetic qualities. This requires investment in proper gear and
equipment’s, which might be expensive to farmers. (iii) Post-harvest levels- These include meeting
postharvest handling practices such as storage, transport to the collection centre and pack-house.
These have also proven to be costly to smallholder farmers. It is revealed that the extent of the
threat of exclusion to smallholders at each of these points varies depend on the nature and cost of
investment required to meet the hygiene and pesticide residue standards.
21
4.04.04.04.0 THE COMPETITIVENESS POSITIONTHE COMPETITIVENESS POSITIONTHE COMPETITIVENESS POSITIONTHE COMPETITIVENESS POSITION OF THE SECTOROF THE SECTOROF THE SECTOROF THE SECTOR
4.1 Global and Local Demand
There is demand for green beans locally, though most efforts in data documentation have been on export. For
example, out of the 55841MT of green beans produced in Kenya in the year 2010, only 18,725 were exported. It
is not clear how the rest of the beans were utilised, but the volumes involved are quite high and can contribute
to local food situation. Interviews with the Solidaridad/HIVOs reveal that almost all of the green bean volumes
that find their way into the local market are actually rejects. They end up in supermarkets, where they are
slashed and re-packaged, schools, big hotels; out-door catering companies and other institutions such as
children’s homes.
Kenya has been exporting vegetables, especially green beans to the Europe since the 1950s, and there has been
a growing demand at the international level, especially the European markets. French beans were initially grown
exclusively for export market, mainly to the European Union but over the years the vegetable has gained
popularity in the domestic market. In the year 2010, about 18,725 tonnes of beans were exported whose value
was Ksh 4.4 billion. The European Union (EU) is the principal importer of Kenya fresh produce, with the French
beans the second largest vegetable exported from Kenya destined for United Kingdom (59%), France (20%),
Germany (7%), Netherlands (7%), Belgium (3%) and countries like Bahrain, Norway, Canada, China, Georgia,
and France among others (4%). (HCDA, 2010)
In December 2011, Kenya was cleared to start exporting French beans into United States market following five
years of intense lobbying by fresh produce growers, opening a new frontier outside Europe for farmers. The US
amended the fruits and vegetables regulation and was satisfied with Kenya's pre-export conditions following
improvements in washing, packaging and processing of beans17. The permission followed upgrading of standards
along the value chain. The US opening comes at a time when Kenya's exports are grappling with less demand in
Europe following the contagion from the Greek debt crisis brought about by the highly indebted countries such as
Greece and Spain. US will, however, limit its market scope to protect its small-scale farmers from price shocks.
There are campaigns in Europe to limit importation of airfreighted food stuff, and since most of the Kenyan
beans is airfreighted, this pose a new threat to this market. Kenya and other 17 ACP countries also is likely to
start paying duty of 16% to the produce exported to Europe after the expiry of the Economic Partnership
Agreement (EPA) next year. This will affect the competitiveness of Kenyan goods exported to Europe, losing to
its competitors like Zambia, Senegal etc who will still enjoy the duty free market access.
4.2 Competition
Among the factors that have supported Kenya's rise in the fresh produce exports is conductive Equatorial climate
which allows year-round production, a competitive labour force with good education and technical background.
As concerns the soil fertility, which is over time turning into less of a factor that guarantees competitive
advantage for the Kenyan market due to nutrient depletion, studies are on-going by some stakeholders to
ascertain the level of fertility and competitiveness of an area for growing selected crops in an effort to promote
local markets. For instance, HIVOS, a Dutch development organization that has much experience with small
holder initiatives and value chains on horticulture and food security projects, is working to support small scale
entrepreneurial farmers in horticulture with the aim of improving food security and sustaining incomes. In
October 2011, HIVOS piloted with 6 farmer groups in Kinangop, Naro Moru & Kirinyaga who grew green beans
17http://www.hortinews.co.ke/article.php?id=357
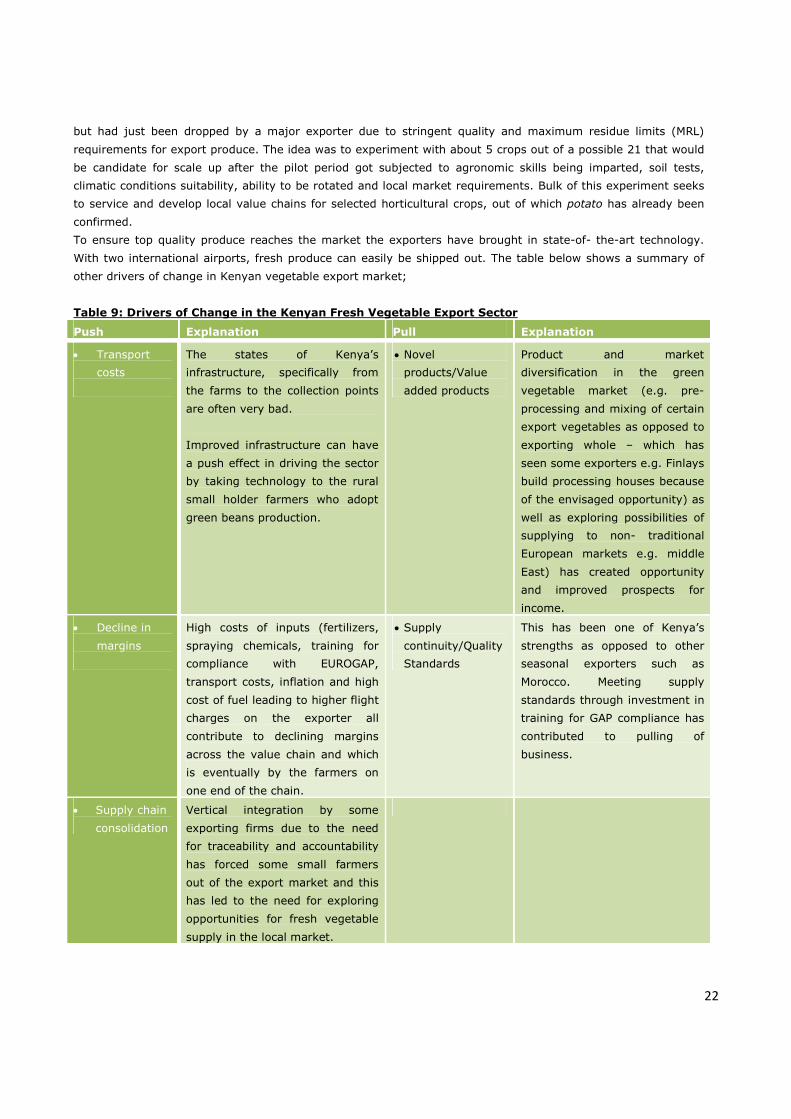
22
but had just been dropped by a major exporter due to stringent quality and maximum residue limits (MRL)
requirements for export produce. The idea was to experiment with about 5 crops out of a possible 21 that would
be candidate for scale up after the pilot period got subjected to agronomic skills being imparted, soil tests,
climatic conditions suitability, ability to be rotated and local market requirements. Bulk of this experiment seeks
to service and develop local value chains for selected horticultural crops, out of which potato has already been
confirmed.
To ensure top quality produce reaches the market the exporters have brought in state-of- the-art technology.
With two international airports, fresh produce can easily be shipped out. The table below shows a summary of
other drivers of change in Kenyan vegetable export market;
Table 9: Drivers of Change in the Kenyan Fresh Vegetable Export Sector
Push Explanation Pull Explanation
• Transport
costs
The states of Kenya’s
infrastructure, specifically from
the farms to the collection points
are often very bad.
Improved infrastructure can have
a push effect in driving the sector
by taking technology to the rural
small holder farmers who adopt
green beans production.
• Novel
products/Value
added products
Product and market
diversification in the green
vegetable market (e.g. pre-
processing and mixing of certain
export vegetables as opposed to
exporting whole – which has
seen some exporters e.g. Finlays
build processing houses because
of the envisaged opportunity) as
well as exploring possibilities of
supplying to non- traditional
European markets e.g. middle
East) has created opportunity
and improved prospects for
income.
• Decline in
margins
High costs of inputs (fertilizers,
spraying chemicals, training for
compliance with EUROGAP,
transport costs, inflation and high
cost of fuel leading to higher flight
charges on the exporter all
contribute to declining margins
across the value chain and which
is eventually by the farmers on
one end of the chain.
• Supply
continuity/Quality
Standards
This has been one of Kenya’s
strengths as opposed to other
seasonal exporters such as
Morocco. Meeting supply
standards through investment in
training for GAP compliance has
contributed to pulling of
business.
• Supply chain
consolidation
Vertical integration by some
exporting firms due to the need
for traceability and accountability
has forced some small farmers
out of the export market and this
has led to the need for exploring
opportunities for fresh vegetable
supply in the local market.
23
In the case of green beans, Kenya's main competitors are Morocco, Egypt, South Africa, Cote d’Ivoire, Senegal
and Zambia (Okello, J.J; Narrod A; and Roy D 2011). Freight costs are a strong determinant of a country's
export competitiveness. Kenya's exporters see little likelihood of their airfreight costs declining relative to those
of their competitors and believe that the only viable long term position is to specialize in supplying the
premium/high-care end of the market. Kenya's own (air) freight costs are estimated to be between US$1.50 and
US$1.60/kg. Only Zambia has similar freight costs to Kenya (Jaffee, 2003).. The other countries' costs are much
lower, ranging from US$0.75/kg to as low as US$0.20/kg for sea shipment ex-Egypt (FAO, 2004). For similar
distances, freight costs are likely to be lower among countries that already have well-developed and frequently-
used freight routes, whether these are for air (including passenger) freight or containerized sea freight. Thus, the
tourist economy in Kenya has had important spin-offs for the availability of freight for other sectors of the export
economy. In Zimbabwe, the recent downturn in the tourism industry, and the consequent reduction in foreign
passenger aircraft, has adversely affected the cost and availability of air freight for fresh produce exporters
(Heri, 2000).
4.3 Emerging trends in innovation in the past 5 years
In order to survive the effect of standards, some smallholder farmers and the governments have adopted two
non-market institutional arrangements for overcoming the screening effects of standards on smallholder farmers
namely, collective action and public-private partnerships. As a group, smallholders invested in facilities needed to
comply with European Food Safety Standards (EFSS) at the major CCPs thus reducing their per-person costs of
meeting EFSS. Similarly, smallholder farmers sought certification (especially for GlobalGAP) jointly in order to
demonstrate compliance with EFSS, though mostly with external support from governments, private sector or
partnership of the two (i.e., public-private partnerships).
Public-private partnerships (PPPs) for maintaining the participation of smallholder farmers in the green bean High
Value Chain (HVC) have mainly focused on provision of information, financial support (for investment in lumpy
assets), and capacity building (through financing audits and certification for GlobalGAP compliance and the
construction of grading facilities) to smallholders. Donors and NGO have jointly established Africa’s only
indigenous certification company (AfriCert) in order to make GlobalGAP certification cheaper and hence
affordable to smallholders. The investment by some of the European private agencies (private sector) especially
the Pesticide Initiative Project (PIP) helped in training farmers on pesticide use practices and pesticide residue
limits thus helping reduce the screening effect of EFSS at farm-level CCPs. PPPs have also been instrumental in
lobbying for the recognition of the ability of smallholders to meet GlobalGAP standards and the benchmarking of
GlobalGAP to Kenyan conditions through the formulation of KenyaGAP. Other innovations have been in the
organised logistics of bean marketing, pre-packaging of beans, branding and quality control measures.
4.4 Systemic constraints to competitiveness18
During the value chain analysis of the green beans for export and domestic market, a variety of constraints were
identified that were limiting the production and income. Eight (8) commercially viable solutions with the potential
to address those constraints, as well as existing providers of those solutions, were also identified: These
constraints might need to be addressed concurrently in order to have the desired impact on small-scale
producers. It is frequently difficult, therefore to evaluate the relative importance of one constraint over another.
18
Key benchmarks used for assessing competitiveness of the bean value chain is in the cost of production, value addition to the
products, transportation and logistics costs amongst others.
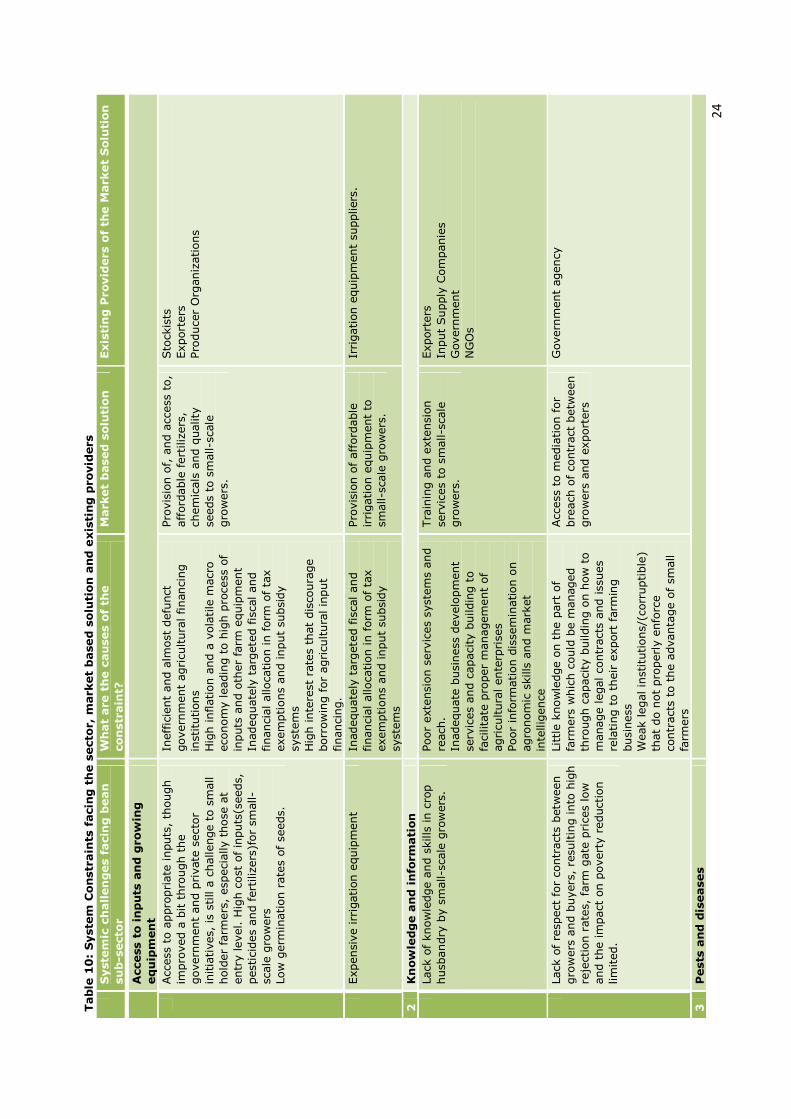
24
Table 10: System Constraints facing the sector, market based solution and existing providers
Systemic challenges facing bean
sub-sector
What are the causes of the
constraint?
Market based solution
Existing Providers of the Market Solution
Access to inputs and growing
equipment
Acc
ess
to a
ppro
pri
ate
inputs
, th
ough
impro
ved a
bit t
hro
ugh t
he
govern
ment
and p
rivate
sect
or
initia
tives,
is
still a c
hallenge t
o s
mall
hold
er
farm
ers
, esp
eci
ally t
hose
at
entr
y level. H
igh c
ost
of in
puts
(seeds,
pest
icid
es
and f
ert
iliz
ers
)for
small-
scale
gro
wers
Low
germ
ination r
ate
s of
seeds.
Ineff
icie
nt
and a
lmost
defu
nct
govern
ment
agri
cultura
l financi
ng
inst
itutions
Hig
h inflation a
nd a
vola
tile
macr
o
eco
nom
y leadin
g t
o h
igh p
roce
ss o
f in
puts
and o
ther
farm
equip
ment
Inadequate
ly t
arg
ete
d f
isca
l and
financi
al alloca
tion in form
of ta
x
exem
ptions
and input
subsi
dy
syst
em
s H
igh inte
rest
rate
s th
at
dis
coura
ge
borr
ow
ing f
or
agricu
ltura
l in
put
financi
ng.
Pro
vis
ion o
f, a
nd a
ccess
to,
aff
ord
able
fert
iliz
ers
, ch
em
icals
and q
uality
se
eds
to s
mall-s
cale
gro
wers
.
Sto
ckis
ts
Export
ers
Pro
duce
r O
rganiz
ations
Expensi
ve irr
igation e
quip
ment
Inadequate
ly t
arg
ete
d f
isca
l and
financi
al alloca
tion in form
of ta
x
exem
ptions
and input
subsi
dy
syst
em
s
Pro
vis
ion o
f aff
ord
able
ir
rigation e
quip
ment
to
small-s
cale
gro
wers
.
Irri
gation e
quip
ment
suppliers
.
2
Knowledge and information
Lack
of
know
ledge a
nd s
kills
in c
rop
husb
andry
by s
mall-s
cale
gro
wers
. Poor
exte
nsi
on s
erv
ices
syst
em
s and
reach
. In
adequate
busi
ness
develo
pm
ent
serv
ices
and c
apaci
ty b
uildin
g t
o
faci
lita
te p
roper
managem
ent
of
agri
cultura
l ente
rpri
ses
Poor
info
rmation d
isse
min
ation o
n
agro
nom
ic s
kills
and m
ark
et
inte
llig
ence
Tra
inin
g a
nd e
xte
nsi
on
serv
ices
to s
mall-s
cale
gro
wers
.
Export
ers
In
put
Supply
Com
panie
s G
overn
ment
NG
Os
Lack
of
resp
ect
for
contr
act
s betw
een
gro
wers
and b
uyers
, re
sultin
g into
hig
h
reje
ctio
n r
ate
s, f
arm
gate
pri
ces
low
and t
he im
pact
on p
overt
y r
educt
ion
lim
ited.
Litt
le k
now
ledge o
n t
he p
art
of
farm
ers
whic
h c
ould
be m
anaged
thro
ugh c
apaci
ty b
uildin
g o
n h
ow
to
manage legal co
ntr
act
s and iss
ues
rela
ting t
o t
heir
export
farm
ing
busi
ness
W
eak legal in
stitutions/
(corr
uptible
) th
at
do n
ot
pro
perl
y e
nfo
rce
contr
act
s to
the a
dvanta
ge o
f sm
all
farm
ers
Acc
ess
to m
edia
tion f
or
bre
ach
of co
ntr
act
betw
een
gro
wers
and e
xport
ers
Govern
ment
agency
3
Pests and diseases
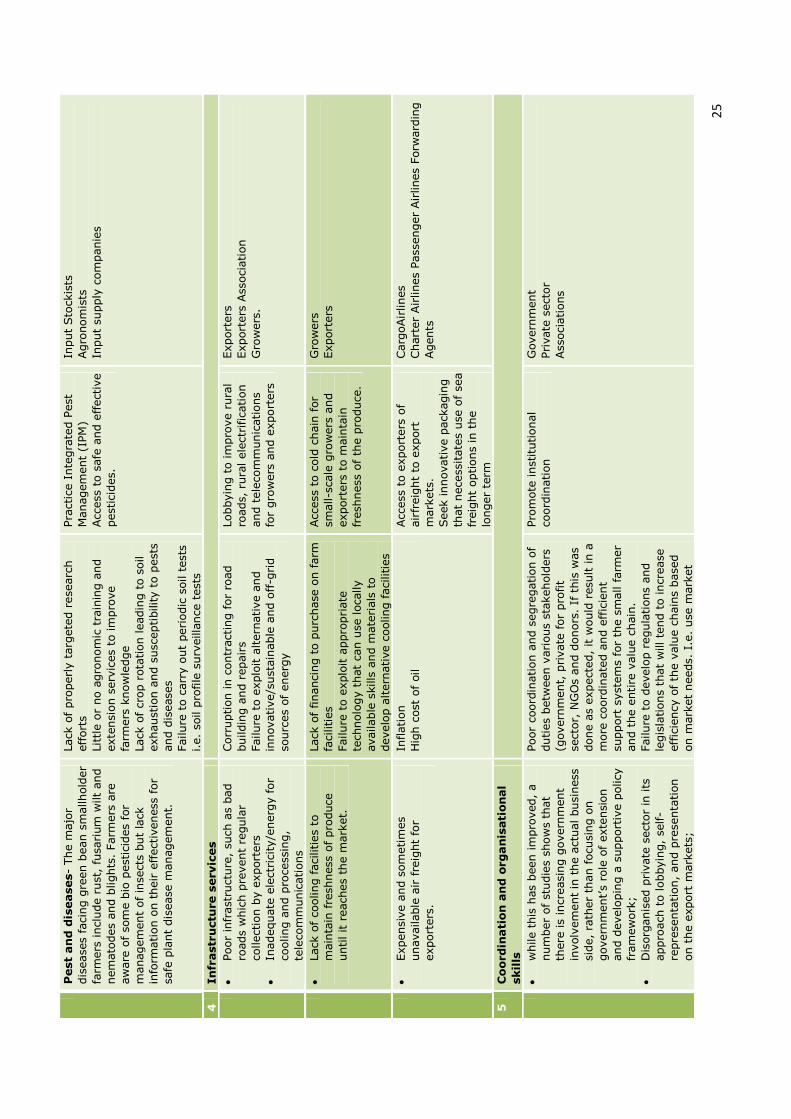
25
Pest and diseases-
The m
ajo
r dis
ease
s fa
cing g
reen b
ean s
mallhold
er
farm
ers
incl
ude r
ust
, fu
sari
um
wilt
and
nem
ato
des
and b
lights
. Farm
ers
are
aw
are
of
som
e b
io p
est
icid
es
for
managem
ent
of
inse
cts
but
lack
in
form
ation o
n t
heir e
ffect
iveness
for
safe
pla
nt
dis
ease
managem
ent.
Lack
of
pro
perly t
arg
ete
d r
ese
arc
h
eff
ort
s Li
ttle
or
no a
gro
nom
ic t
rain
ing a
nd
exte
nsi
on s
erv
ices
to im
pro
ve
farm
ers
know
ledge
Lack
of
crop r
ota
tion leadin
g t
o s
oil
exhaust
ion a
nd s
usc
eptibili
ty t
o p
est
s and d
isease
s Failure
to c
arr
y o
ut
peri
odic
soil t
est
s i.e.
soil p
rofile
surv
eill
ance
test
s
Pra
ctic
e I
nte
gra
ted P
est
M
anagem
ent
(IPM
) Acc
ess
to s
afe
and e
ffect
ive
pest
icid
es.
Input
Sto
ckis
ts
Agro
nom
ists
In
put
supply
com
panie
s
4
Infrastructure services
•
Poor
infr
ast
ruct
ure
, su
ch a
s bad
roads
whic
h p
revent
regula
r co
llect
ion b
y e
xport
ers
•
Inadequate
ele
ctrici
ty/e
nerg
y f
or
cooling a
nd p
roce
ssin
g,
tele
com
munic
ations
Corr
uption in c
ontr
act
ing for
road
buildin
g a
nd r
epair
s Failure
to e
xplo
it a
ltern
ative a
nd
innovative/s
ust
ain
able
and o
ff-g
rid
sourc
es
of
energ
y
Lobbyin
g t
o im
pro
ve r
ura
l ro
ads,
rura
l ele
ctrifica
tion
and t
ele
com
munic
ations
for
gro
wers
and e
xport
ers
Export
ers
Export
ers
Ass
oci
ation
Gro
wers
.
•
Lack
of
cooling f
aci
lities
to
main
tain
fre
shness
of pro
duce
until it r
each
es
the m
ark
et.
Lack
of
financi
ng t
o p
urc
hase
on farm
fa
cilities
Failure
to e
xplo
it a
ppro
pri
ate
te
chnolo
gy t
hat
can u
se loca
lly
available
skills
and m
ate
rials
to
develo
p a
ltern
ative c
ooling faci
lities
Acc
ess
to c
old
chain
for
small-s
cale
gro
wers
and
export
ers
to m
ain
tain
fr
esh
ness
of
the p
roduce
.
Gro
wers
Export
ers
•
Expensi
ve a
nd s
om
etim
es
unavailable
air
fre
ight
for
export
ers
.
Inflation
Hig
h c
ost
of
oil
Acc
ess
to e
xport
ers
of
air
freig
ht
to e
xport
m
ark
ets
. Seek innovative p
ack
agin
g
that
nece
ssitate
s use
of
sea
freig
ht
options
in t
he
longer
term
Carg
oAir
lines
Chart
er
Air
lines
Pass
enger
Air
lines
Forw
ard
ing
Agents
5
Coordination and organisational
skills
•
while t
his
has
been im
pro
ved,
a
num
ber
of
studie
s sh
ow
s th
at
there
is
incr
easi
ng g
overn
ment
involv
em
ent
in t
he a
ctual busi
ness
si
de,
rath
er
than focu
sing o
n
govern
ment’s
role
of
exte
nsi
on
and d
evelo
pin
g a
support
ive p
olicy
fr
am
ew
ork
; •
Dis
org
anis
ed p
rivate
sect
or
in its
appro
ach
to lobbyin
g,
self-
repre
senta
tion,
and p
rese
nta
tion
on t
he e
xport
mark
ets
;
Poor
coord
ination a
nd s
egre
gation o
f duties
betw
een v
ari
ous
stakehold
ers
(g
overn
ment,
private
for
pro
fit
sect
or,
NG
Os
and d
onors
. If
this
was
done a
s expect
ed,
it w
ould
resu
lt in a
m
ore
coord
inate
d a
nd e
ffic
ient
support
syst
em
s fo
r th
e s
mall f
arm
er
and t
he e
ntire
valu
e c
hain
.
Failure
to d
evelo
p r
egula
tions
and
legis
lations
that
will
tend t
o incr
ease
eff
icie
ncy
of th
e v
alu
e c
hain
s base
d
on m
ark
et
needs.
I.e
. use
mark
et
Pro
mote
inst
itutional
coord
ination
Govern
ment
Pri
vate
sect
or
Ass
oci
ations
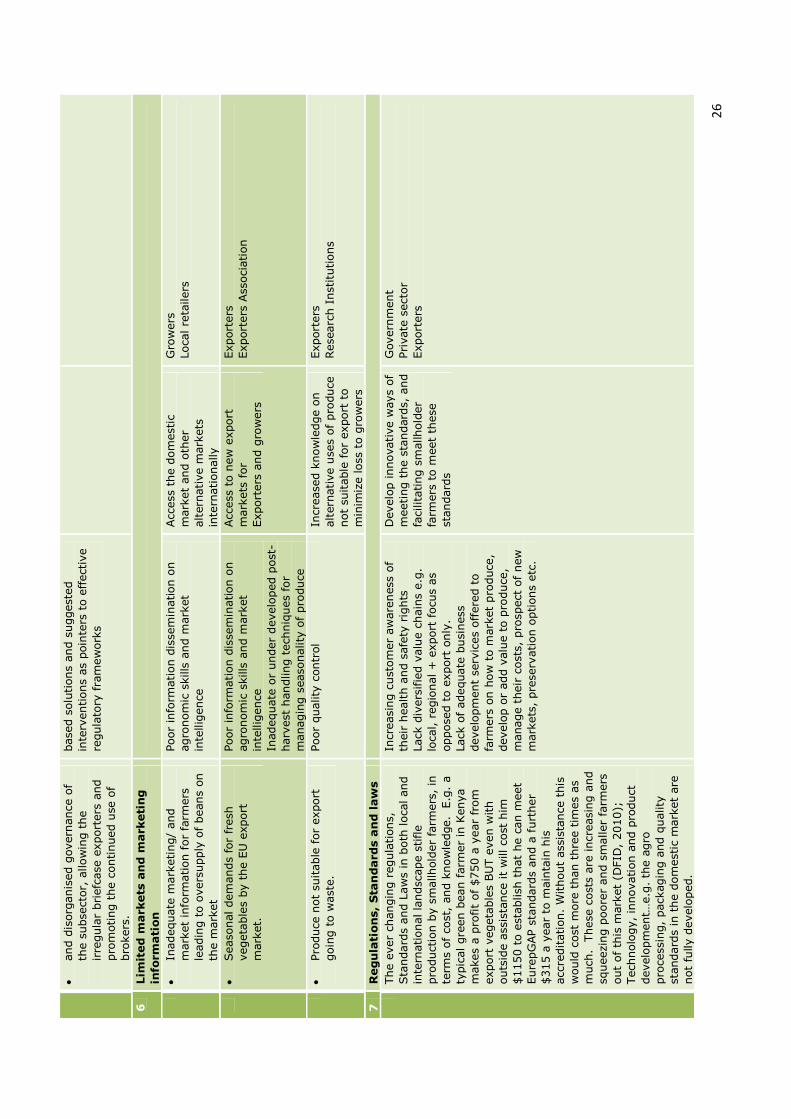
26
•
and d
isorg
anis
ed g
overn
ance
of
the s
ubse
ctor,
allow
ing t
he
irre
gula
r briefc
ase
export
ers
and
pro
moting t
he c
ontinued u
se o
f bro
kers
.
base
d s
olu
tions
and s
uggest
ed
inte
rventions
as
poin
ters
to e
ffect
ive
regula
tory
fra
mew
ork
s
6
Limited markets and marketing
information
•
Inadequate
mark
eting/
and
mark
et
info
rmation f
or
farm
ers
le
adin
g t
o o
vers
upply
of
beans
on
the m
ark
et
Poor
info
rmation d
isse
min
ation o
n
agro
nom
ic s
kills
and m
ark
et
inte
llig
ence
Acc
ess
the d
om
est
ic
mark
et
and o
ther
altern
ative m
ark
ets
in
tern
ationally
Gro
wers
Loca
l re
tailers
•
Seaso
nal dem
ands
for
fresh
vegeta
ble
s by t
he E
U e
xport
m
ark
et.
Poor
info
rmation d
isse
min
ation o
n
agro
nom
ic s
kills
and m
ark
et
inte
llig
ence
In
adequate
or
under
develo
ped p
ost
-harv
est
handling t
ech
niq
ues
for
managin
g s
easo
nality
of
pro
duce
Acc
ess
to n
ew
export
m
ark
ets
for
Export
ers
and g
row
ers
Export
ers
Export
ers
Ass
oci
ation
•
Pro
duce
not
suitable
for
export
goin
g t
o w
ast
e.
Poor
quality
contr
ol
Incr
ease
d k
now
ledge o
n
altern
ative u
ses
of
pro
duce
not
suitable
for
export
to
min
imiz
e loss
to g
row
ers
Export
ers
Rese
arc
h I
nst
itutions
7
Regulations, Standards and laws
The e
ver
changin
g r
egula
tions,
Sta
ndard
s and L
aw
s in
both
loca
l and
inte
rnational la
ndsc
ape s
tifle
pro
duct
ion b
y s
mallhold
er
farm
ers
, in
te
rms
of
cost
, and k
now
ledge.
E.g
. a
typic
al gre
en b
ean f
arm
er
in K
enya
makes
a p
rofit
of
$750 a
year
from
export
vegeta
ble
s BU
T e
ven w
ith
outs
ide a
ssis
tance
it
will co
st h
im
$1150 t
o e
stablish
that
he c
an m
eet
Eure
pG
AP s
tandard
s and a
furt
her
$315 a
year
to m
ain
tain
his
acc
reditation.
Without
ass
ista
nce
this
w
ould
cost
more
than t
hre
e t
imes
as
much
. T
hese
cost
s are
incr
easi
ng a
nd
squeezi
ng p
oore
r and s
maller
farm
ers
out
of th
is m
ark
et
(DFID
, 2010);
Tech
nolo
gy, in
novation a
nd p
roduct
develo
pm
ent…
e.g
. th
e a
gro
pro
cess
ing,
pack
agin
g a
nd q
uality
st
andard
s in
the d
om
est
ic m
ark
et
are
not
fully d
evelo
ped.
Incr
easi
ng c
ust
om
er
aw
are
ness
of
their
health a
nd s
afe
ty r
ights
La
ck d
ivers
ifie
d v
alu
e c
hain
s e.g
. lo
cal, r
egio
nal +
export
focu
s as
oppose
d t
o e
xport
only
. La
ck o
f adequate
busi
ness
develo
pm
ent
serv
ices
off
ere
d t
o
farm
ers
on h
ow
to m
ark
et
pro
duce
, develo
p o
r add v
alu
e t
o p
roduce
, m
anage t
heir
cost
s, p
rosp
ect
of
new
m
ark
ets
, pre
serv
ation o
ptions
etc
.
Develo
p innovative w
ays
of
meeting t
he s
tandard
s, a
nd
faci
lita
ting s
mallhold
er
farm
ers
to m
eet
these
st
andard
s
Govern
ment
Pri
vate
sect
or
Export
ers
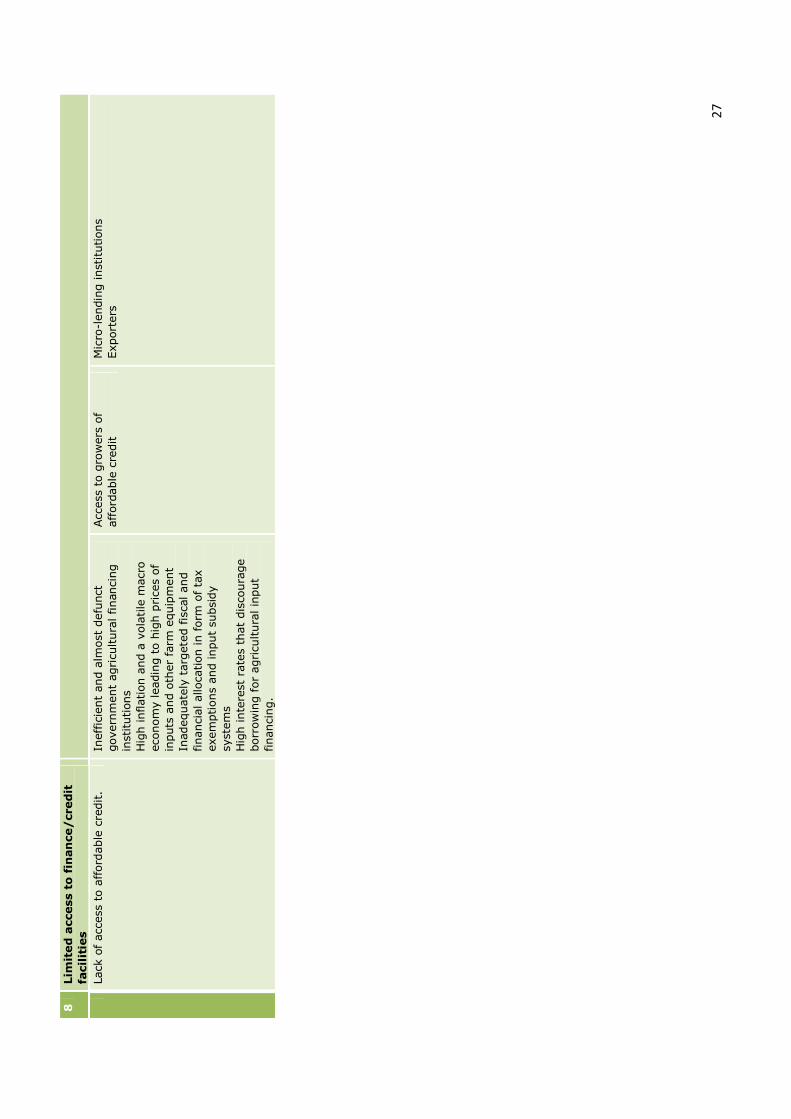
27
8
Limited access to finance/credit
facilities
Lack
of
acc
ess
to a
fford
able
cre
dit.
Ineff
icie
nt
and a
lmost
defu
nct
govern
ment
agri
cultura
l financi
ng
inst
itutions
Hig
h inflation a
nd a
vola
tile
macr
o
eco
nom
y leadin
g t
o h
igh p
rice
s of
inputs
and o
ther
farm
equip
ment
Inadequate
ly t
arg
ete
d f
isca
l and
financi
al alloca
tion in form
of ta
x
exem
ptions
and input
subsi
dy
syst
em
s H
igh inte
rest
rate
s th
at
dis
coura
ge
borr
ow
ing f
or
agricu
ltura
l in
put
financi
ng.
Acc
ess
to g
row
ers
of
aff
ord
able
cre
dit
Mic
ro-l
endin
g inst
itutions
Export
ers
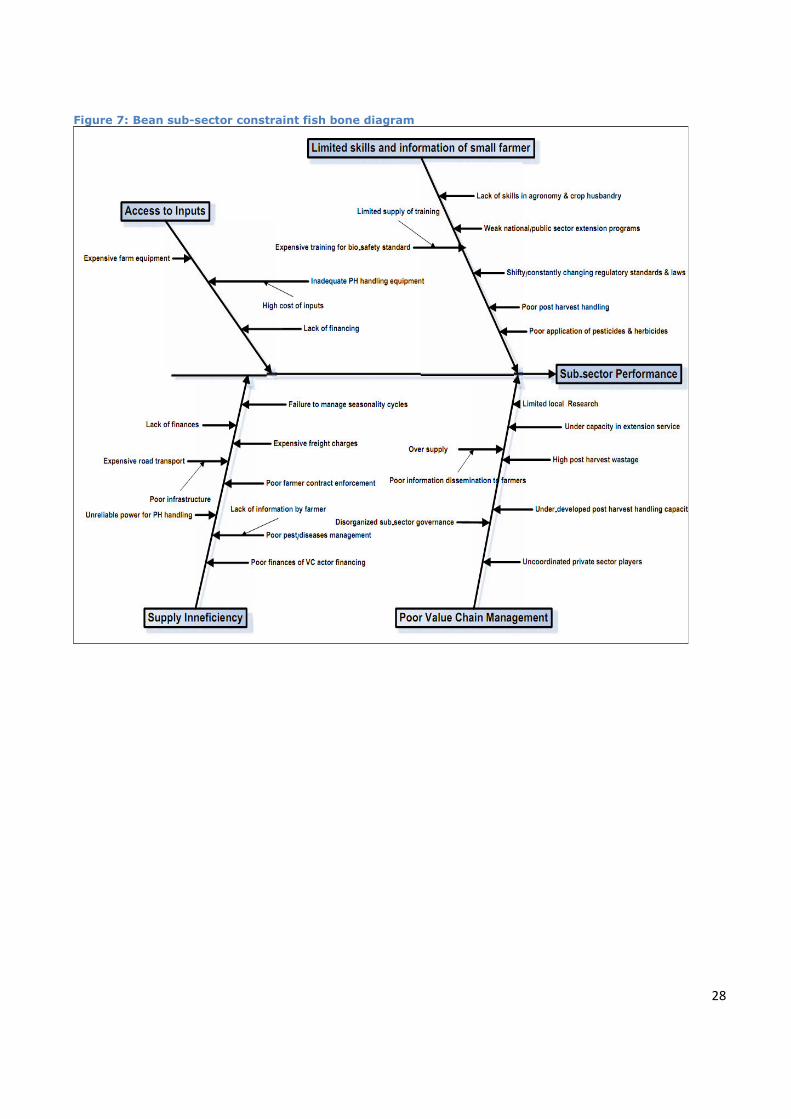
28
Figure 7: Bean sub-sector constraint fish bone diagram
29
5.05.05.05.0 SECTOR STRATEGYSECTOR STRATEGYSECTOR STRATEGYSECTOR STRATEGY
5.1 Sector Visions: Articulation of the sector visions
The sub-sector is governed by various public and private institutions with legal and institutional mandates, who
have articulated the sub-sector visions within these mandates. Public institutions established under various
statutes have a national mandate on various regulatory aspects with view of improving service delivery as well as
providing an enabling environment for the sector to remain competitive locally and internationally. Private
institutions are based on voluntary membership and focus on self-regulation and advocacy. There are also
commodity based associations. However, weak and ineffective linkages among public, private and other
regulatory, developmental and supportive institutions results in the inefficiencies in the industry.
The Government through the Ministry of Agriculture has developed a National Horticultural Policy to accelerate
and sustain growth in the sector. In order to resolve farming challenges that are multi-sector in nature, the
Ministry of Agriculture jointly with sector Ministries, relevant Government sub-sector regulating agencies, and the
industry have formed a National Horticulture Task Force (NHTF). This is an ad hoc forum that addresses all forms
of multi sectoral challenges affecting growth and sustainability of horticulture sub-sector in Kenya. In addition, the
Government has mandated the Horticultural Crops Development Authority (HCDA) with the responsibility of
developing, promoting, facilitating, and regulating the industry.
A number Non-Governmental Organizations and farmers associations are also involved in capacity building of
smallholder farmers, e.g. the Fresh Produce Exporters Association of Kenya (FPEAK), and the Kenya National
Federation of Agricultural Producers (KENFAP). The FPEAK is involved in building smallholder farmers capacity in
market requirements and linking them to markets. The FPEAK has facilitated 350 smallholder farmer groups
certification to KenyaGAP and linking of the groups to the premium supermarket chains namely Nakumatt and
Tuskys. KENFAP is an umbrella federation of farmers comprising of over 1.4 million farm families. The federation
empowers Kenyan farmers with a strong voice hence better bargaining power in business transactions.
The factors driving changes in the sector include the changing consumer demands, mostly internationally, which
have triggered changes in the technological process in the modes of production, pre-processing, packaging, and
transportation. The shift from tariff to non-tariff barriers in international horticulture trade has necessitated more
regulation of the industry to comply with the new market requirements. However, the activities of government
agencies involved in regulating the industry are not harmonised and lead to delays and increased cost of
complying with non-tariff barriers.
5.2 Key Actors in the change process
5.2.1 Public agencies
The Government continues formulating horticultural projects and programs with a view of addressing specific
objectives; four such projects are the National Accelerated Agriculture Input Program (NAAIP), NjaaMarufuku,
Smallholder Horticulture Marketing Project (SHoMAP), and the Smallholder Horticulture Development Project
(SHDP). The NAAIP is involved in capacity building and provision of seed and fertilizer grants for one hectare per
smallholder farmer. The target of this program is 2.5 million smallholder farmers. Unlike NAAIP, the focus of
NjaaMarufuku is smallholder farmer groups and not individual farmers. The program extends grants of up to $
6,250 per farmer group. SHoMAP is facilitating smallholders in addressing marketing and market infrastructure
challenges. This program is earmarked to benefit 12,000 smallholder farmers. The SHDP is focused on
establishing irrigation schemes for horticultural farming with a view of mitigating the negative effect of climate
change. The program has established 9 irrigation schemes with a total area of 2886 Ha; and is directly benefiting
5900 smallholder farmers. The Government in collaboration with the International Fund for Agriculture
30
Development (IFAD), Alliance for Green Revolution in Africa (AGRA), and the Equity Bank (K) set up a loan
scheme known as “Kilimo Biashara” to facilitate credit access to smallholder farmers. This initiative also involves a
cover known as the “weather Index Crop Insurance” that insures crops failure due to erratic weather. However,
the success of these programmes has not been evaluated on their impacts on bean farmers.
5.2.2 Donor agencies and NGOs
In addition to the Government funded projects, there is a large number of Non-Governmental Organizations with
different initiatives towards supporting horticulture in many parts of the country. Most of these projects are
funded through international cooperation agencies such as the USAID, JICA, GTZ, among others.
USAID, though the Kenya Horticultural Development Project (KHDP) and managed by FintracInc is providing
assistance to the fresh and processed food sector in Kenya. It provides marketing, postharvest handling,
processing and agronomic support for smallholders and allied agribusinesses. KHDP partners include grower
associations, input suppliers, processors, exporters, research institutions and trade associations.USAID, which is
currently preparing a follow-on programme to their Kenya Export Development Support (KEDS) programme which
assisted the horticultural sector for the past 9 years first through a technical assistance team and then through a
follow on programme to support the FPEAK..
The FAO is currently working with farmer field schools to improve production practices in various regions around
the country, including many green bean farmers in Central Province. They can be a good resource for identifying
promising regions and groups of farmers. The UK’s Department for International Development (DFID) set aside a
challenge fund, the Food Retail Industry Challenge Fund (FRICH), to reduce poverty in Africa by improving the
income of the rural poor. FRICH has awarded a £200,000 grant to British supermarket chain Waitrose to
encourage them to stock Kenyan beans, thus increasing the income potential of farmers.19
5.3 Pathways to systemic change
Under the competitive section above, 9 main challenges and opportunities have been identified, namely access to
inputs and equipment; knowledge and information; pests and diseases; infrastructure services; coordination and
organisational skills; limited markets and market information; challenges with innovation and product
development; regulation, standards and laws; and finally access to suitable financing for smallholder. However,
analysis shows that there are a number of initiatives/ interventions that are addressing these challenges though
there are weaknesses in reaching out to new markets as well as technological innovations and product
development. Traditional markets for green beans are faced with both tariff and non-tariff barriers which are
increasingly exerting pressure and pose a threat to smallholders. Examples include sustained campaigns against
air freighted products due to carbon foot prints; food safety standards; eminent threats for payment of 16% duty
on Kenya and other 17 ACP countries following the expiry of Economic Partnership Agreements (EPA’s) next year.
Therefore, for the sub-sector to remain competitive, we propose the following key changes:
i. Market development and market information – There is need to scout for other possible markets for the
Kenyan green beans targeting both Domestic, regional and International markets. Consumption of green
beans is emerging in Kenya and the region and there is need to promote it. There is a need to look for other
alternative markets to EU, e.g. USA, Asia, etc.
ii. Technology, innovation and product development- Agro processing, packaging, canned and frozen
beans and quality standards in the domestic, regional and international market are not fully developed. In
particular, value addition, investment in packaging technology is critical during sea freight, whose cost is
19
http://www.independent.co.uk/news/world/africa/kenyarsquos-green-beans-hit-uk-supermarket-shelves-2067630.html
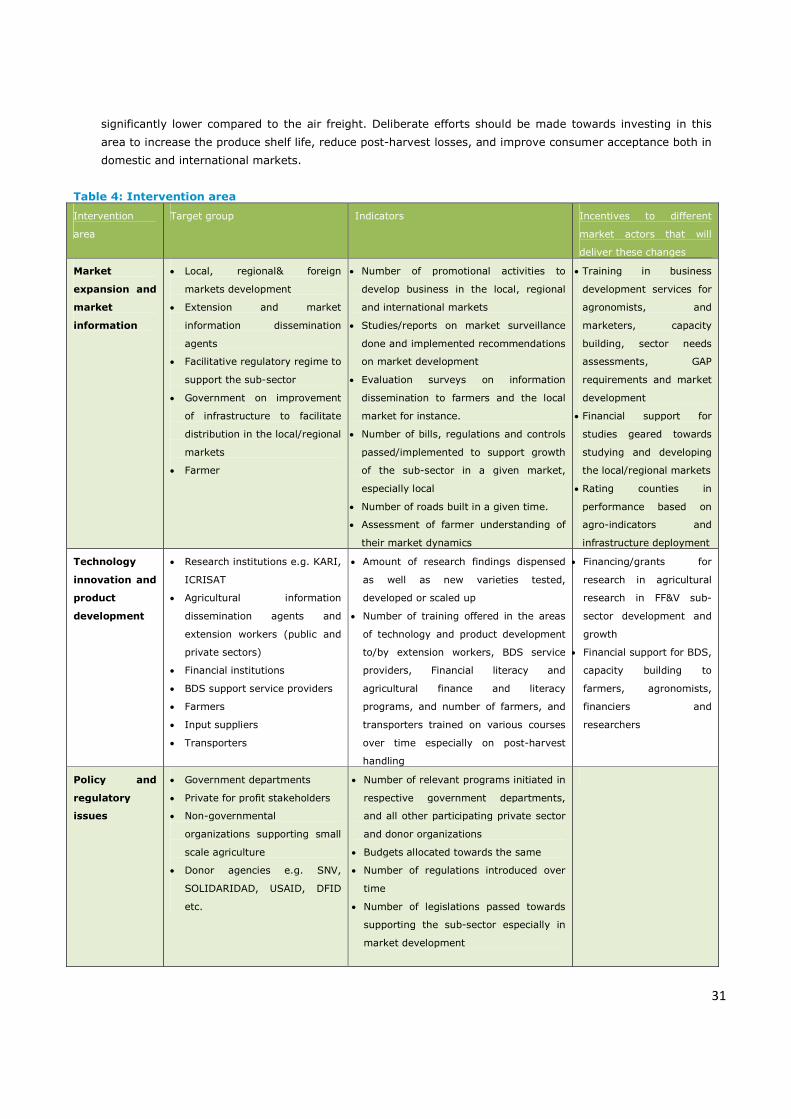
31
significantly lower compared to the air freight. Deliberate efforts should be made towards investing in this
area to increase the produce shelf life, reduce post-harvest losses, and improve consumer acceptance both in
domestic and international markets.
Table 4: Intervention area
Intervention
area
Target group Indicators Incentives to different
market actors that will
deliver these changes
Market
expansion and
market
information
• Local, regional& foreign
markets development
• Extension and market
information dissemination
agents
• Facilitative regulatory regime to
support the sub-sector
• Government on improvement
of infrastructure to facilitate
distribution in the local/regional
markets
• Farmer
• Number of promotional activities to
develop business in the local, regional
and international markets
• Studies/reports on market surveillance
done and implemented recommendations
on market development
• Evaluation surveys on information
dissemination to farmers and the local
market for instance.
• Number of bills, regulations and controls
passed/implemented to support growth
of the sub-sector in a given market,
especially local
• Number of roads built in a given time.
• Assessment of farmer understanding of
their market dynamics
• Training in business
development services for
agronomists, and
marketers, capacity
building, sector needs
assessments, GAP
requirements and market
development
• Financial support for
studies geared towards
studying and developing
the local/regional markets
• Rating counties in
performance based on
agro-indicators and
infrastructure deployment
Technology
innovation and
product
development
• Research institutions e.g. KARI,
ICRISAT
• Agricultural information
dissemination agents and
extension workers (public and
private sectors)
• Financial institutions
• BDS support service providers
• Farmers
• Input suppliers
• Transporters
• Amount of research findings dispensed
as well as new varieties tested,
developed or scaled up
• Number of training offered in the areas
of technology and product development
to/by extension workers, BDS service
providers, Financial literacy and
agricultural finance and literacy
programs, and number of farmers, and
transporters trained on various courses
over time especially on post-harvest
handling
• Financing/grants for
research in agricultural
research in FF&V sub-
sector development and
growth
• Financial support for BDS,
capacity building to
farmers, agronomists,
financiers and
researchers
Policy and
regulatory
issues
• Government departments
• Private for profit stakeholders
• Non-governmental
organizations supporting small
scale agriculture
• Donor agencies e.g. SNV,
SOLIDARIDAD, USAID, DFID
etc.
• Number of relevant programs initiated in
respective government departments,
and all other participating private sector
and donor organizations
• Budgets allocated towards the same
• Number of regulations introduced over
time
• Number of legislations passed towards
supporting the sub-sector especially in
market development
32
5.4 Potential Interventions
The Kenyan fresh vegetable export industry has grown enormously in size and value added, in large part by
implementing new processes and operations. These have been initiated by private business in response to evolving
market trends, recognized opportunities, and value chain pressures. The public sector has been an active partner in
this growth. Further opportunities exist to increase the competitiveness of the Kenyan fresh vegetable export
industry through value chain deepening, as well as through other approaches (for example, increasing the technical
capacities and market understanding of serving growing markets beyond Europe, extending the exporting season,
and reducing costs and losses through infrastructure). The realization of each enhanced process will, in turn,
provide opportunity for added services within the value chain. The following are the shortlisted interventions:
POTENTIAL INTERVENTIONS
Market expansion and market information
• Promote utilization of beans locally and regionally - According to research by Ndegwa et al 200620, carried out in
major green bean growing areas of Kirinyaga, Embu and Machakos districts, a notable proportion of the
respondents (up to 50%) consumed green beans at least once a week with the rest consuming occasionally.
However, it was not the preferred vegetable of choice for most (over 60%) of the respondents. Reasons given
for this were tedious preparation methods and need to add other expensive condiments to the snap beans to
formulate a tasty vegetable relish. Over 60% of the respondents did not know the nutritive value of these
beans. Close to 80% of the respondents reported that they would not purchase snap beans in the market for
home consumption since other vegetable options were available and more delicious. This finding reveals lack of
awareness for the beans. The development of the local and regional market is subject to promotion and
awareness creation (informing the local consumer about the nutritive value of this vegetable). Otherwise, it is
perceived to be a crop for foreign markets. According to HIVOS, they do not see any challenge with finding local
market. Organized production, reliability and consistency of servicing a market are the problems.
• Scout for other complimentary markets - The shift from tariff to non-tariff barriers in international horticulture
trade has necessitated more regulation of the industry to comply with the new market requirements, especially
in the EU and USA markets where consumers are concerned with the carbon footprints of imported food. There
is need to look for other markets for the green beans as well as explore reduction in carbon foot prints.
• Improve the marketing information system: Farmers need proper advise on when to plant to avoid
overproduction. There is need to educate farmers on market driven production planning.
Technology innovation and product development
• Pre-harvest crop management as well as postharvest handling both contribute to the quality of green beans
produced and products channelled to the market (both local and internationally). Green bean postharvest
losses account for a significant decline in marketable yield at farm level and along the marketing chain. There is
therefore need for training and sensitizing farmers on farm level postharvest handling practices and adherence
to set regulations to maintain product quality.
• Promote value addition interventions such as agro processing, packaging, canned and frozen beans and quality
standards in the domestic, regional and international market
• Alternative packaging in particular, investment in packaging technology is critical during sea freight, whose cost
is significantly lower compared to the air freight. Deliberate efforts should be made towards investing in this
area to increase the produce shelf life, reduce post-harvest losses, and improve consumer acceptance both in
domestic and international markets.
20 Ndegwa, A. M., N. M. Muthoka1, C. W. Gathambiri 1, M. N. Muchui, M. W. Kamau and S. M waciuri (2006). Snap bean production,
postharvest practices and constraints in Kirinyaga and Machakos districts of Kenya. Kenya Agricultural Research Institute, Thika.
33
6.06.06.06.0 REFERENCESREFERENCESREFERENCESREFERENCES
Africa Research Institute (2009). Kenya’s Flying Vegetables: Small farmers and the food miles debate. Policy Voices
series, featuring James Gikunju Muuru- A small holder farmer.
FAO (2004).The market for non-traditional agricultural exports FAO Commodities and Trade Technical Paper 3
Frank Lusby, Henry Panlibuton (2007). Value chain program design: promoting market-based solutions for msme
and industry competitiveness. Report submitted to Office of Microenterprise Development,
USAID/G/EGAD/MD,Washington, D.C. by Action for Enterprise (AFE)2009 N. 14th St, Suite 301
Graffham, A., Karehu, E., & McGregor, J. (2009).Impact of GLOBALGAP on small-scale vegetable growers in Kenya.
In Evaline B. de Battisti, James Mcgregor and Andrew Graffham (Eds) Standard Bearers: Horticultural Exports and
Private Standards in Africa. Natural Resources Institute. London, UK.
Jaffee, S.M. (2003). From Challenge to Opportunity: The transformation of the Kenyan fresh vegetable trade in the
context of emerging food safety and other standards. Agriculture and Rural Development Discussion Paper 1, World
Bank. Washington, DC.
Kenya Development Learning Centre (KDLC) 2010. Smallholder farmers’ involvement in commercial horticulture.
Kenya’s perspective Video conference on high value horticulture for Eastern & Southern Africa 02nd November
2010
Kimenye, L.N. (1993). Economics of Smallholder French Bean Production and Marketing in Kenya. PhD Dissertation,
Michigan State University, USA.
Government of Kenya (2010). National Horticulture Policy Ministry of Agriculture, Kilimo House, Nairobi.
Okello, J.J., & Swinton, S.M. (2007). Compliance with international food safety standards in Kenya's green bean
industry: Comparison of a small and a large scale family farm producing for export. Review of Agricultural
Economics, 29, 269-285.
Okello, JuliusJuma (2005) compliance with international food safety standards: the case of green bean production
in Kenyan family Farms. A phd dissertation submitted to Michigan state university in partial fulfilment of the
requirements for the degree of doctor of philosophy, department of agricultural economics 2005
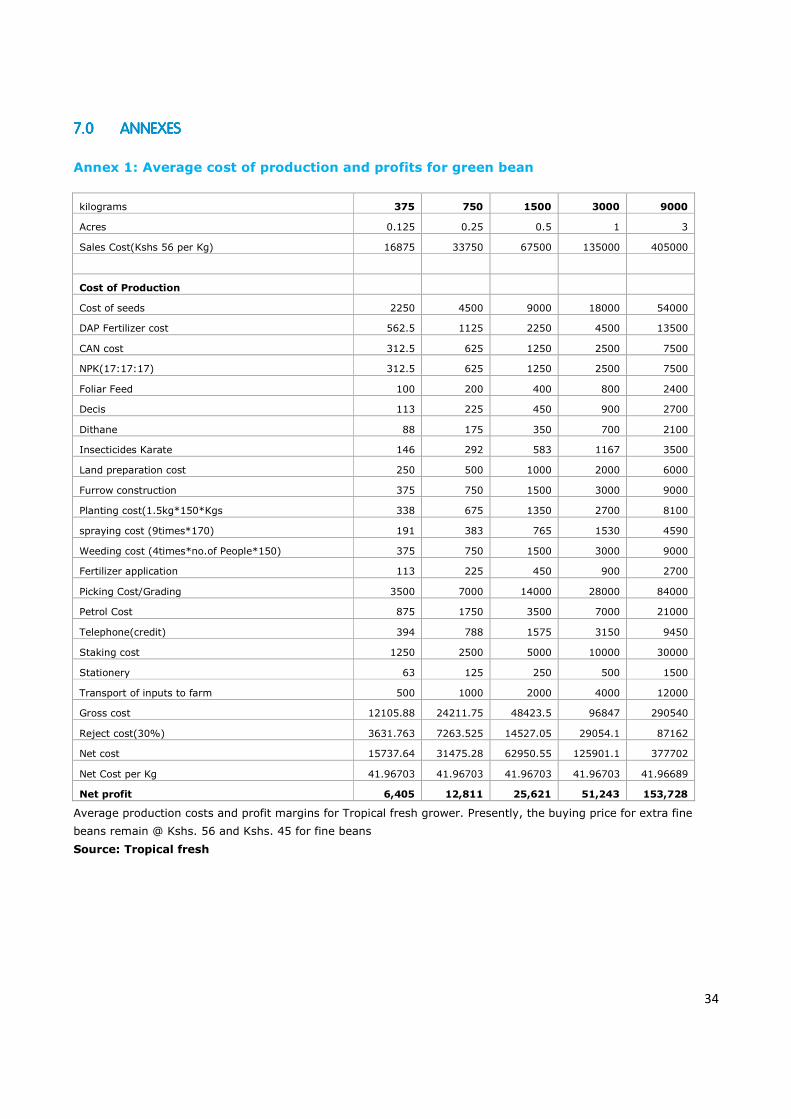
34
7.07.07.07.0 ANNEXESANNEXESANNEXESANNEXES
Annex 1: Average cost of production and profits for green bean
kilograms 375 750 1500 3000 9000
Acres 0.125 0.25 0.5 1 3
Sales Cost(Kshs 56 per Kg) 16875 33750 67500 135000 405000
Cost of Production
Cost of seeds 2250 4500 9000 18000 54000
DAP Fertilizer cost 562.5 1125 2250 4500 13500
CAN cost 312.5 625 1250 2500 7500
NPK(17:17:17) 312.5 625 1250 2500 7500
Foliar Feed 100 200 400 800 2400
Decis 113 225 450 900 2700
Dithane 88 175 350 700 2100
Insecticides Karate 146 292 583 1167 3500
Land preparation cost 250 500 1000 2000 6000
Furrow construction 375 750 1500 3000 9000
Planting cost(1.5kg*150*Kgs 338 675 1350 2700 8100
spraying cost (9times*170) 191 383 765 1530 4590
Weeding cost (4times*no.of People*150) 375 750 1500 3000 9000
Fertilizer application 113 225 450 900 2700
Picking Cost/Grading 3500 7000 14000 28000 84000
Petrol Cost 875 1750 3500 7000 21000
Telephone(credit) 394 788 1575 3150 9450
Staking cost 1250 2500 5000 10000 30000
Stationery 63 125 250 500 1500
Transport of inputs to farm 500 1000 2000 4000 12000
Gross cost 12105.88 24211.75 48423.5 96847 290540
Reject cost(30%) 3631.763 7263.525 14527.05 29054.1 87162
Net cost 15737.64 31475.28 62950.55 125901.1 377702
Net Cost per Kg 41.96703 41.96703 41.96703 41.96703 41.96689
Net profit 6,405 12,811 25,621 51,243 153,728
Average production costs and profit margins for Tropical fresh grower. Presently, the buying price for extra fine
beans remain @ Kshs. 56 and Kshs. 45 for fine beans
Source: Tropical fresh
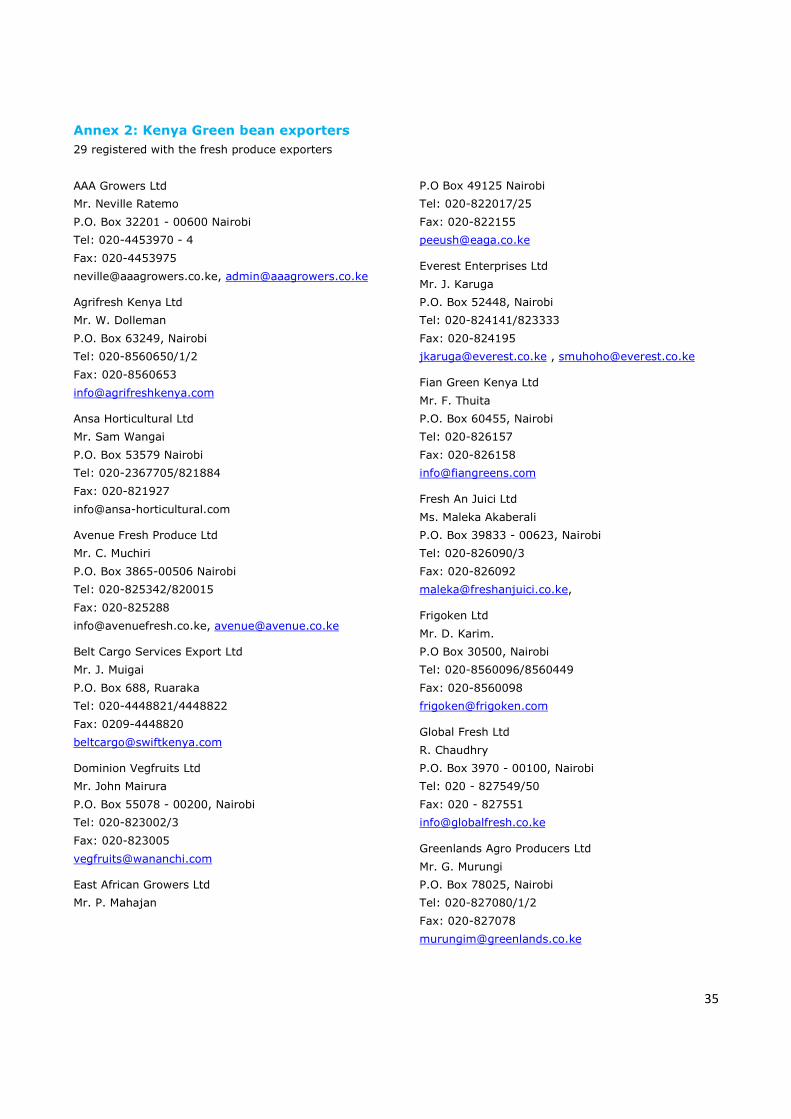
35
Annex 2: Kenya Green bean exporters
29 registered with the fresh produce exporters
AAA Growers Ltd
Mr. Neville Ratemo
P.O. Box 32201 - 00600 Nairobi
Tel: 020-4453970 - 4
Fax: 020-4453975
[email protected], [email protected]
Agrifresh Kenya Ltd
Mr. W. Dolleman
P.O. Box 63249, Nairobi
Tel: 020-8560650/1/2
Fax: 020-8560653
Ansa Horticultural Ltd
Mr. Sam Wangai
P.O. Box 53579 Nairobi
Tel: 020-2367705/821884
Fax: 020-821927
Avenue Fresh Produce Ltd
Mr. C. Muchiri
P.O. Box 3865-00506 Nairobi
Tel: 020-825342/820015
Fax: 020-825288
[email protected], [email protected]
Belt Cargo Services Export Ltd
Mr. J. Muigai
P.O. Box 688, Ruaraka
Tel: 020-4448821/4448822
Fax: 0209-4448820
Dominion Vegfruits Ltd
Mr. John Mairura
P.O. Box 55078 - 00200, Nairobi
Tel: 020-823002/3
Fax: 020-823005
East African Growers Ltd
Mr. P. Mahajan
P.O Box 49125 Nairobi
Tel: 020-822017/25
Fax: 020-822155
Everest Enterprises Ltd
Mr. J. Karuga
P.O. Box 52448, Nairobi
Tel: 020-824141/823333
Fax: 020-824195
[email protected] , [email protected]
Fian Green Kenya Ltd
Mr. F. Thuita
P.O. Box 60455, Nairobi
Tel: 020-826157
Fax: 020-826158
Fresh An Juici Ltd
Ms. Maleka Akaberali
P.O. Box 39833 - 00623, Nairobi
Tel: 020-826090/3
Fax: 020-826092
Frigoken Ltd
Mr. D. Karim.
P.O Box 30500, Nairobi
Tel: 020-8560096/8560449
Fax: 020-8560098
Global Fresh Ltd
R. Chaudhry
P.O. Box 3970 - 00100, Nairobi
Tel: 020 - 827549/50
Fax: 020 - 827551
Greenlands Agro Producers Ltd
Mr. G. Murungi
P.O. Box 78025, Nairobi
Tel: 020-827080/1/2
Fax: 020-827078
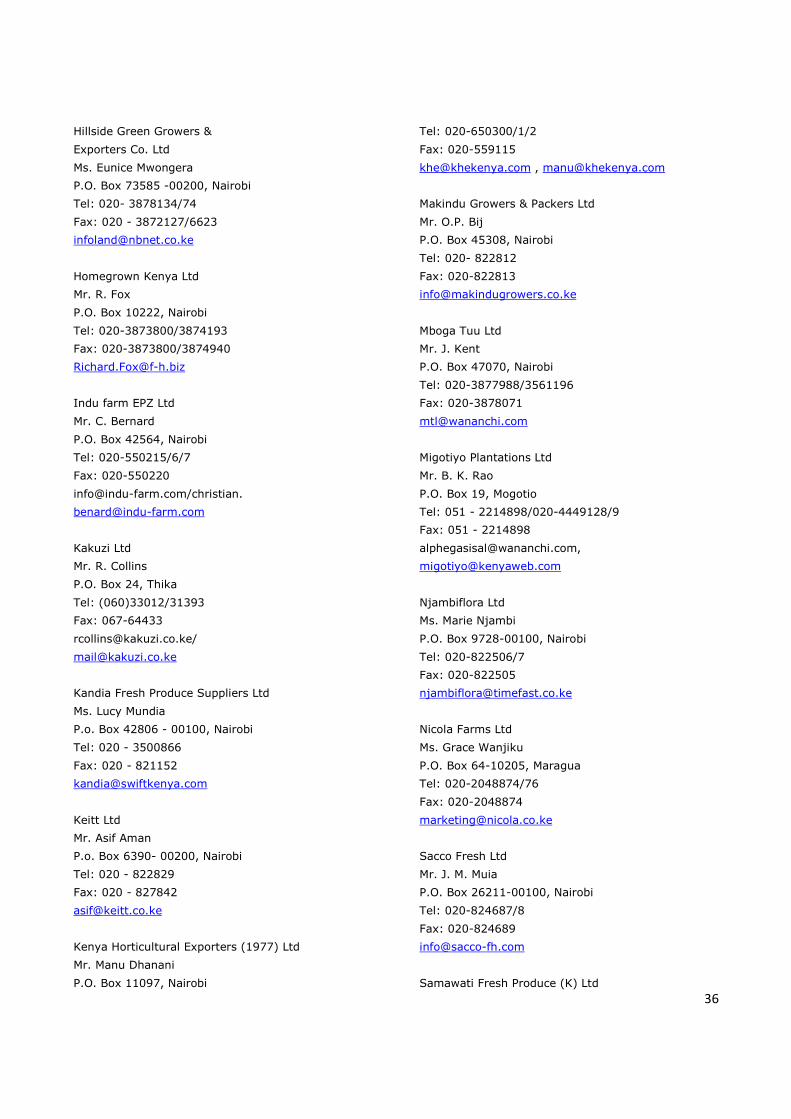
36
Hillside Green Growers &
Exporters Co. Ltd
Ms. Eunice Mwongera
P.O. Box 73585 -00200, Nairobi
Tel: 020- 3878134/74
Fax: 020 - 3872127/6623
Homegrown Kenya Ltd
Mr. R. Fox
P.O. Box 10222, Nairobi
Tel: 020-3873800/3874193
Fax: 020-3873800/3874940
Indu farm EPZ Ltd
Mr. C. Bernard
P.O. Box 42564, Nairobi
Tel: 020-550215/6/7
Fax: 020-550220
[email protected]/christian.
Kakuzi Ltd
Mr. R. Collins
P.O. Box 24, Thika
Tel: (060)33012/31393
Fax: 067-64433
Kandia Fresh Produce Suppliers Ltd
Ms. Lucy Mundia
P.o. Box 42806 - 00100, Nairobi
Tel: 020 - 3500866
Fax: 020 - 821152
Keitt Ltd
Mr. Asif Aman
P.o. Box 6390- 00200, Nairobi
Tel: 020 - 822829
Fax: 020 - 827842
Kenya Horticultural Exporters (1977) Ltd
Mr. Manu Dhanani
P.O. Box 11097, Nairobi
Tel: 020-650300/1/2
Fax: 020-559115
[email protected] , [email protected]
Makindu Growers & Packers Ltd
Mr. O.P. Bij
P.O. Box 45308, Nairobi
Tel: 020- 822812
Fax: 020-822813
Mboga Tuu Ltd
Mr. J. Kent
P.O. Box 47070, Nairobi
Tel: 020-3877988/3561196
Fax: 020-3878071
Migotiyo Plantations Ltd
Mr. B. K. Rao
P.O. Box 19, Mogotio
Tel: 051 - 2214898/020-4449128/9
Fax: 051 - 2214898
Njambiflora Ltd
Ms. Marie Njambi
P.O. Box 9728-00100, Nairobi
Tel: 020-822506/7
Fax: 020-822505
Nicola Farms Ltd
Ms. Grace Wanjiku
P.O. Box 64-10205, Maragua
Tel: 020-2048874/76
Fax: 020-2048874
Sacco Fresh Ltd
Mr. J. M. Muia
P.O. Box 26211-00100, Nairobi
Tel: 020-824687/8
Fax: 020-824689
Samawati Fresh Produce (K) Ltd
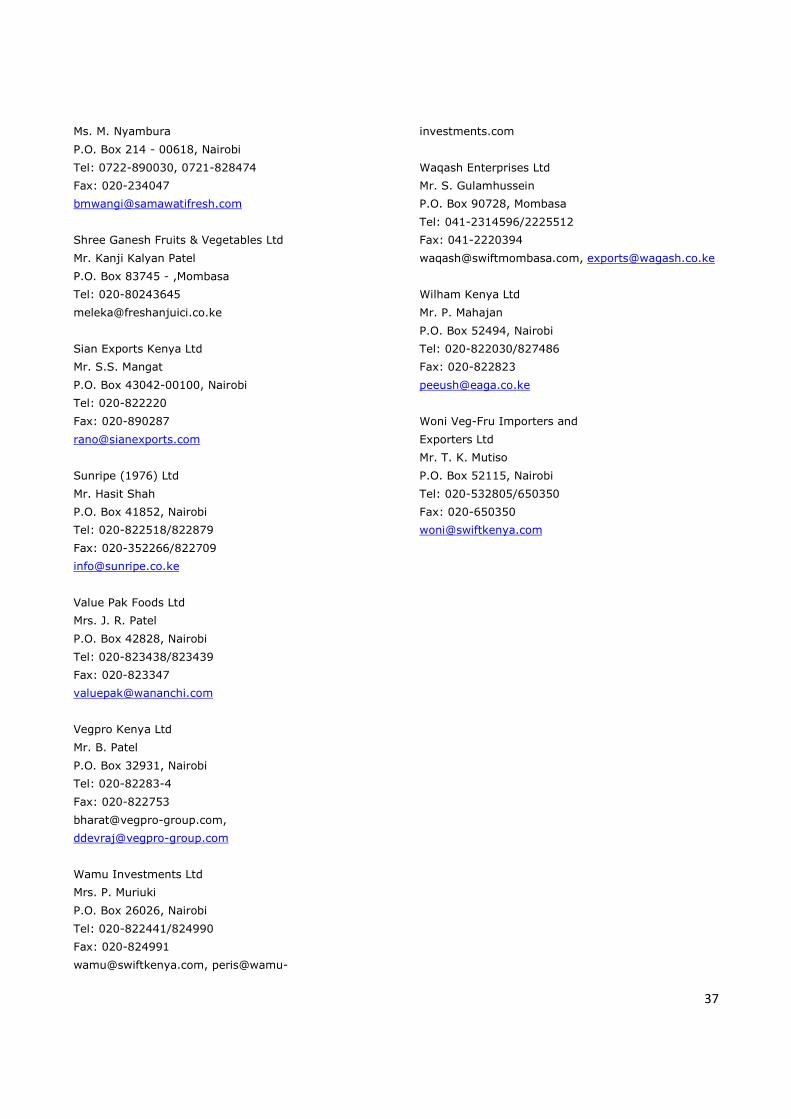
37
Ms. M. Nyambura
P.O. Box 214 - 00618, Nairobi
Tel: 0722-890030, 0721-828474
Fax: 020-234047
Shree Ganesh Fruits & Vegetables Ltd
Mr. Kanji Kalyan Patel
P.O. Box 83745 - ,Mombasa
Tel: 020-80243645
Sian Exports Kenya Ltd
Mr. S.S. Mangat
P.O. Box 43042-00100, Nairobi
Tel: 020-822220
Fax: 020-890287
Sunripe (1976) Ltd
Mr. Hasit Shah
P.O. Box 41852, Nairobi
Tel: 020-822518/822879
Fax: 020-352266/822709
Value Pak Foods Ltd
Mrs. J. R. Patel
P.O. Box 42828, Nairobi
Tel: 020-823438/823439
Fax: 020-823347
Vegpro Kenya Ltd
Mr. B. Patel
P.O. Box 32931, Nairobi
Tel: 020-82283-4
Fax: 020-822753
Wamu Investments Ltd
Mrs. P. Muriuki
P.O. Box 26026, Nairobi
Tel: 020-822441/824990
Fax: 020-824991
[email protected], peris@wamu-
investments.com
Waqash Enterprises Ltd
Mr. S. Gulamhussein
P.O. Box 90728, Mombasa
Tel: 041-2314596/2225512
Fax: 041-2220394
[email protected], [email protected]
Wilham Kenya Ltd
Mr. P. Mahajan
P.O. Box 52494, Nairobi
Tel: 020-822030/827486
Fax: 020-822823
Woni Veg-Fru Importers and
Exporters Ltd
Mr. T. K. Mutiso
P.O. Box 52115, Nairobi
Tel: 020-532805/650350
Fax: 020-650350
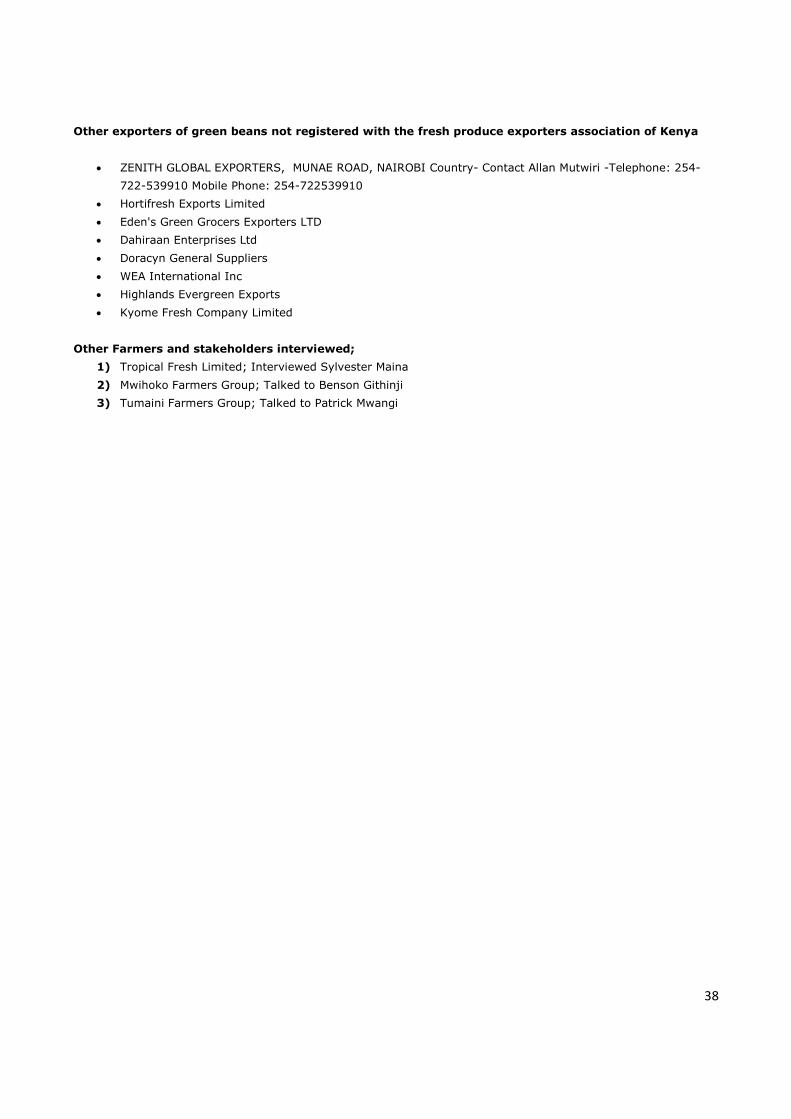
38
Other exporters of green beans not registered with the fresh produce exporters association of Kenya
• ZENITH GLOBAL EXPORTERS, MUNAE ROAD, NAIROBI Country- Contact Allan Mutwiri -Telephone: 254-
722-539910 Mobile Phone: 254-722539910
• Hortifresh Exports Limited
• Eden's Green Grocers Exporters LTD
• Dahiraan Enterprises Ltd
• Doracyn General Suppliers
• WEA International Inc
• Highlands Evergreen Exports
• Kyome Fresh Company Limited
Other Farmers and stakeholders interviewed;
1) Tropical Fresh Limited; Interviewed Sylvester Maina
2) Mwihoko Farmers Group; Talked to Benson Githinji
3) Tumaini Farmers Group; Talked to Patrick Mwangi
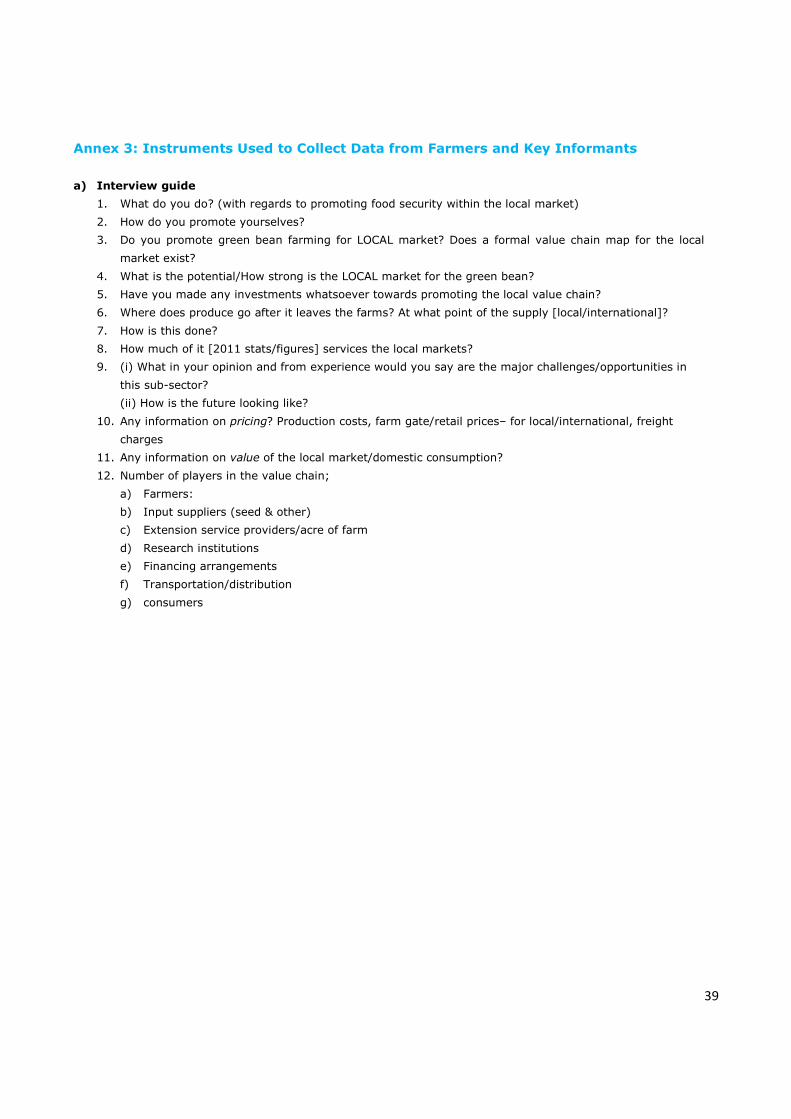
39
Annex 3: Instruments Used to Collect Data from Farmers and Key Informants
a) Interview guide
1. What do you do? (with regards to promoting food security within the local market)
2. How do you promote yourselves?
3. Do you promote green bean farming for LOCAL market? Does a formal value chain map for the local
market exist?
4. What is the potential/How strong is the LOCAL market for the green bean?
5. Have you made any investments whatsoever towards promoting the local value chain?
6. Where does produce go after it leaves the farms? At what point of the supply [local/international]?
7. How is this done?
8. How much of it [2011 stats/figures] services the local markets?
9. (i) What in your opinion and from experience would you say are the major challenges/opportunities in
this sub-sector?
(ii) How is the future looking like?
10. Any information on pricing? Production costs, farm gate/retail prices– for local/international, freight
charges
11. Any information on value of the local market/domestic consumption?
12. Number of players in the value chain;
a) Farmers:
b) Input suppliers (seed & other)
c) Extension service providers/acre of farm
d) Research institutions
e) Financing arrangements
f) Transportation/distribution
g) consumers
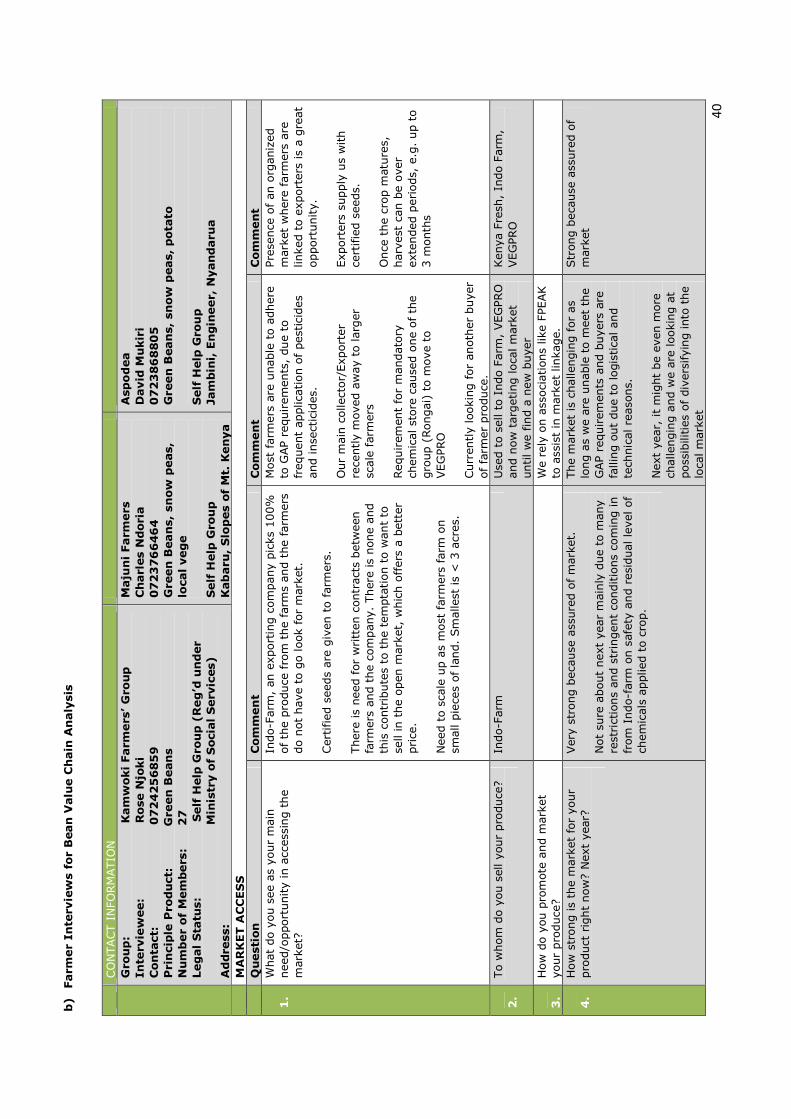
40
b) Farmer Interviews for Bean Value Chain Analysis
CO
NTACT I
NFO
RM
ATIO
N
Group: Kamwoki Farmers’ Group
Interviewee: Rose Njoki
Contact: 0724256859
Principle Product: Green Beans
Number of Members: 27
Legal Status: Self Help Group (Reg’d under
Ministry of Social Services)
Address:
Majuni Farmers
Charles Ndoria
0723766464
Green Beans, snow peas,
local vege
Self Help Group
Kabaru, Slopes of Mt. Kenya
Aspodea
David Mukiri
0723868805
Green Beans, snow peas, potato
Self Help Group
Jambini, Engineer, Nyandarua
MARKET ACCESS
Question
Comment
Comment
Comment
1.
What
do y
ou s
ee a
s your
main
need/o
pport
unity in a
ccess
ing t
he
mark
et?
Indo-F
arm
, an e
xport
ing c
om
pany p
icks
100%
of th
e p
roduce
fro
m t
he f
arm
s and t
he f
arm
ers
do n
ot
have t
o g
o look f
or
mark
et.
Cert
ifie
d s
eeds
are
giv
en t
o farm
ers
. There
is
need f
or
wri
tten c
ontr
act
s betw
een
farm
ers
and t
he c
om
pany.
There
is
none a
nd
this
contr
ibute
s to
the t
em
pta
tion t
o w
ant
to
sell in t
he o
pen m
ark
et,
whic
h o
ffers
a b
ett
er
price
. N
eed t
o s
cale
up a
s m
ost
farm
ers
farm
on
small p
iece
s of la
nd.
Sm
allest
is
< 3
acr
es.
Most
farm
ers
are
unable
to a
dhere
to
GAP r
equir
em
ents
, due t
o
frequent
applica
tion o
f pest
icid
es
and inse
ctic
ides.
O
ur
main
collect
or/
Export
er
rece
ntly m
oved a
way t
o larg
er
scale
farm
ers
Requir
em
ent
for
mandato
ry
chem
ical st
ore
cause
d o
ne o
f th
e
gro
up (
Rongai)
to m
ove t
o
VEG
PRO
Curr
ently lookin
g f
or
anoth
er
buyer
of fa
rmer
pro
duce
.
Pre
sence
of
an o
rganiz
ed
mark
et
where
farm
ers
are
linked t
o e
xport
ers
is
a g
reat
opport
unity.
Export
ers
supply
us
with
cert
ifie
d s
eeds.
O
nce
the c
rop m
atu
res,
harv
est
can b
e o
ver
exte
nded p
eriods,
e.g
. up t
o
3 m
onth
s
2.
To w
hom
do y
ou s
ell y
our
pro
duce
?
In
do-F
arm
U
sed t
o s
ell t
o I
ndo F
arm
, VEG
PRO
and n
ow
targ
eting loca
l m
ark
et
until w
e f
ind a
new
buyer
Kenya F
resh
, In
do F
arm
, VEG
PRO
3.
How
do y
ou p
rom
ote
and m
ark
et
your
pro
duce
?
W
e r
ely
on a
ssoci
ations
like F
PEAK
to a
ssis
t in
mark
et
linkage.
4.
How
str
ong is
the m
ark
et
for
your
pro
duct
rig
ht
now
? N
ext
year?
Very
str
ong b
eca
use
ass
ure
d o
f m
ark
et.
N
ot
sure
about
next
year
main
ly d
ue t
o m
any
rest
rict
ions
and s
trin
gent
conditio
ns
com
ing in
from
Indo-f
arm
on s
afe
ty a
nd r
esi
dual le
vel of
chem
icals
applied t
o c
rop.
The m
ark
et
is c
hallengin
g f
or
as
long a
s w
e a
re u
nable
to m
eet
the
GAP r
equirem
ents
and b
uyers
are
fa
llin
g o
ut
due t
o logis
tica
l and
tech
nic
al re
aso
ns.
N
ext
year,
it
mig
ht
be e
ven m
ore
ch
allengin
g a
nd w
e a
re lookin
g a
t poss
ibilitie
s of
div
ers
ifyin
g into
the
loca
l m
ark
et
Str
ong b
eca
use
ass
ure
d o
f m
ark
et
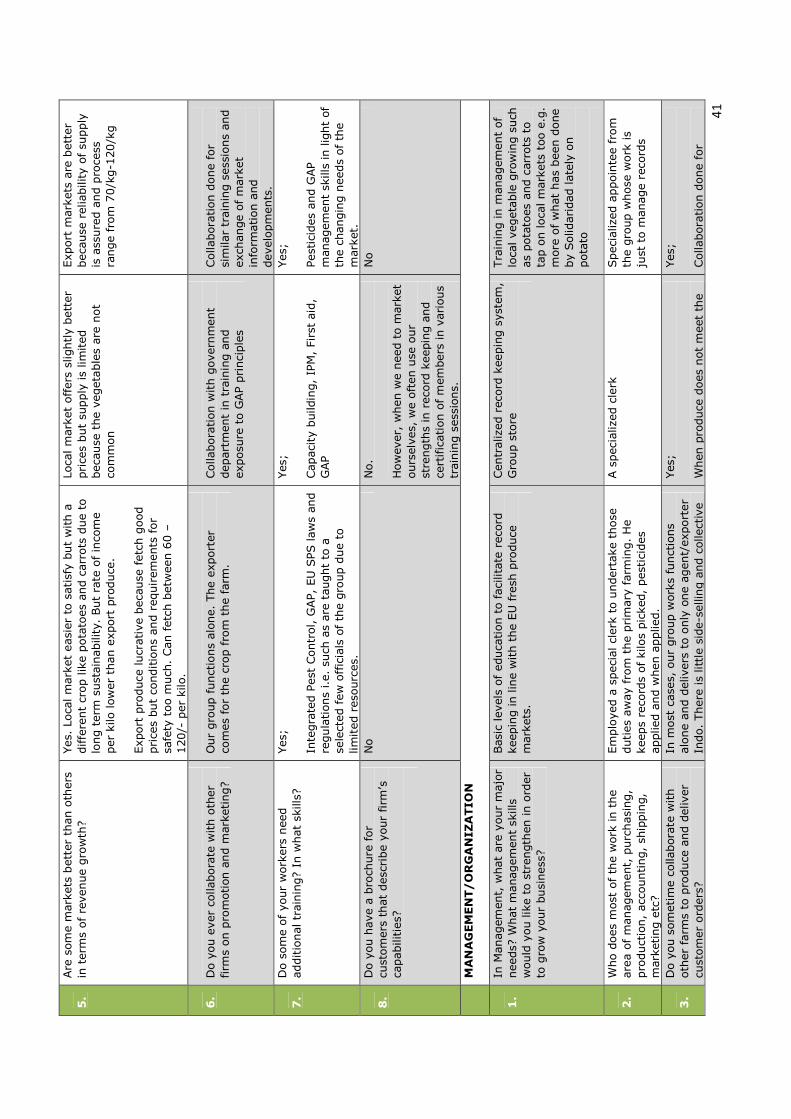
41
5.
Are
som
e m
ark
ets
bett
er
than o
thers
in
term
s of re
venue g
row
th?
Yes.
Loca
l m
ark
et
easi
er
to s
atisf
y b
ut
with a
diffe
rent
crop lik
e p
ota
toes
and c
arr
ots
due t
o
long t
erm
sust
ain
ability.
But
rate
of in
com
e
per
kilo low
er
than e
xport
pro
duce
. Export
pro
duce
lucr
ative b
eca
use
fetc
h g
ood
price
s but
conditio
ns
and r
equir
em
ents
for
safe
ty t
oo m
uch
. Can f
etc
h b
etw
een 6
0 –
120/-
per
kilo.
Loca
l m
ark
et
offers
slightly b
ett
er
pri
ces
but
supply
is
lim
ited
beca
use
the v
egeta
ble
s are
not
com
mon
Export
mark
ets
are
bett
er
beca
use
reliability o
f su
pply
is
ass
ure
d a
nd p
roce
ss
range f
rom
70/k
g-1
20/k
g
6.
Do y
ou e
ver
collabora
te w
ith o
ther
firm
s on p
rom
otion a
nd m
ark
eting?
Our
gro
up f
unct
ions
alo
ne.
The e
xport
er
com
es
for
the c
rop f
rom
the f
arm
.
Collabora
tion w
ith g
overn
ment
depart
ment
in t
rain
ing a
nd
exposu
re t
o G
AP p
rinci
ple
s
Collabora
tion d
one for
sim
ilar
train
ing s
ess
ions
and
exch
ange o
f m
ark
et
info
rmation a
nd
develo
pm
ents
. 7.
Do s
om
e o
f your
work
ers
need
additio
nal tr
ain
ing? I
n w
hat
skills
?
Yes;
In
tegra
ted P
est
Contr
ol, G
AP,
EU
SPS law
s and
regula
tions
i.e.
such
as
are
taught
to a
se
lect
ed f
ew
off
icia
ls o
f th
e g
roup d
ue t
o
lim
ited r
eso
urc
es.
Yes;
Capaci
ty b
uildin
g,
IPM
, Fir
st a
id,
GAP
Yes;
Pest
icid
es
and G
AP
managem
ent
skills
in lig
ht
of
the c
hangin
g n
eeds
of
the
mark
et.
8.
Do y
ou h
ave a
bro
chure
for
cust
om
ers
that
desc
ribe y
our
firm
’s
capabilitie
s?
No
No.
H
ow
ever,
when w
e n
eed t
o m
ark
et
ours
elv
es,
we o
ften u
se o
ur
stre
ngth
s in
reco
rd k
eepin
g a
nd
cert
ific
ation o
f m
em
bers
in v
ari
ous
train
ing s
ess
ions.
No
MANAGEMENT/ORGANIZATION
1.
In M
anagem
ent,
what
are
your
majo
r needs?
What
managem
ent
skills
w
ould
you lik
e t
o s
trength
en in o
rder
to g
row
your
busi
ness
?
Basi
c le
vels
of
educa
tion t
o faci
lita
te r
eco
rd
keepin
g in lin
e w
ith t
he E
U fre
sh p
roduce
m
ark
ets
.
Centr
alize
d r
eco
rd k
eepin
g s
yst
em
, G
roup s
tore
Tra
inin
g in m
anagem
ent
of
loca
l vegeta
ble
gro
win
g s
uch
as
pota
toes
and c
arr
ots
to
tap o
n loca
l m
ark
ets
too e
.g.
more
of w
hat
has
been d
one
by S
olidaridad late
ly o
n
pota
to
2.
Who d
oes
most
of
the w
ork
in t
he
are
a o
f m
anagem
ent,
purc
hasi
ng,
pro
duct
ion,
acc
ounting,
ship
pin
g,
mark
eting e
tc?
Em
plo
yed a
speci
al cl
erk
to u
ndert
ake t
hose
duties
aw
ay fro
m t
he p
rim
ary
farm
ing.
He
keeps
reco
rds
of kilos
pic
ked,
pest
icid
es
applied a
nd w
hen a
pplied.
A s
peci
alize
d c
lerk
Speci
alize
d a
ppoin
tee f
rom
th
e g
roup w
hose
work
is
just
to m
anage r
eco
rds
3.
Do y
ou s
om
etim
e c
ollabora
te w
ith
oth
er
farm
s to
pro
duce
and d
eliver
cust
om
er
ord
ers
?
In m
ost
case
s, o
ur
gro
up w
ork
s fu
nct
ions
alo
ne a
nd d
elivers
to o
nly
one a
gent/
export
er
Indo.
There
is
litt
le s
ide-s
ellin
g a
nd c
ollect
ive
Yes;
W
hen p
roduce
does
not
meet
the
Yes;
Collabora
tion d
one for
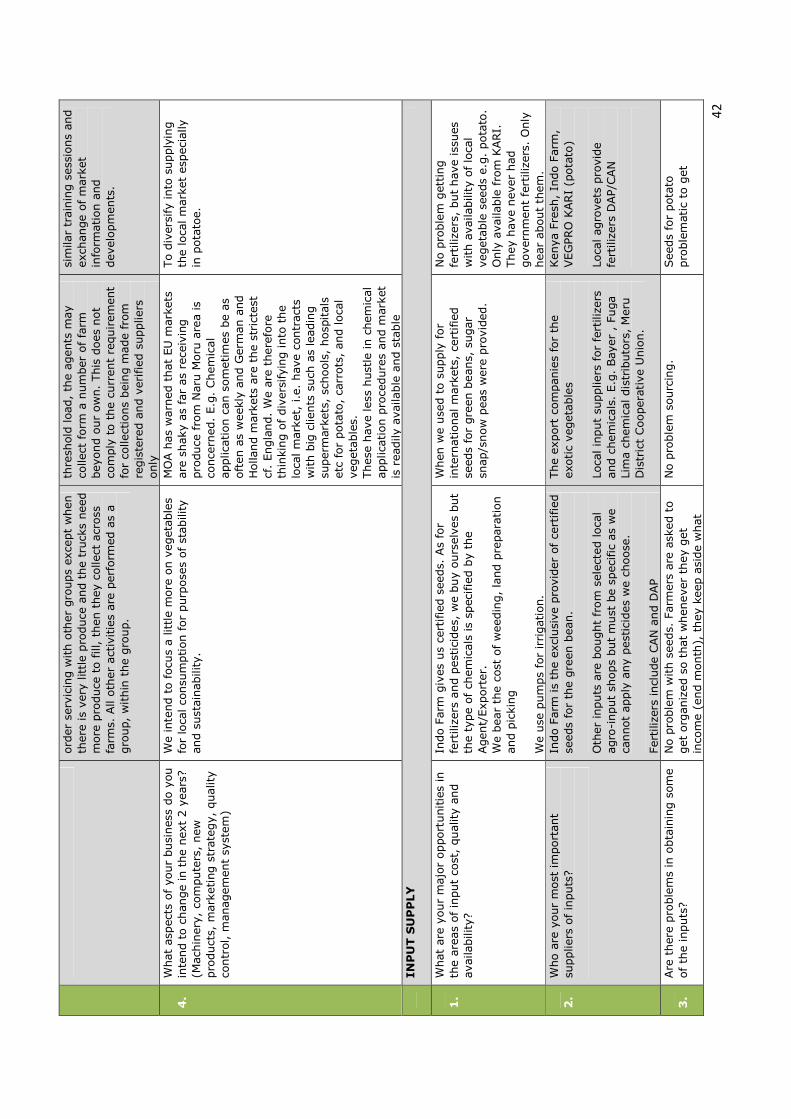
42
ord
er
serv
icin
g w
ith o
ther
gro
ups
exce
pt
when
there
is
very
little p
roduce
and t
he t
ruck
s need
more
pro
duce
to f
ill, t
hen t
hey c
ollect
acr
oss
fa
rms.
All o
ther
act
ivitie
s are
perf
orm
ed a
s a
gro
up,
within
the g
roup.
thre
shold
load,
the a
gents
may
collect
form
a n
um
ber
of
farm
beyond o
ur
ow
n.
This
does
not
com
ply
to t
he c
urr
ent
requirem
ent
for
collect
ions
bein
g m
ade fro
m
regis
tere
d a
nd v
eri
fied s
uppliers
only
sim
ilar
train
ing s
ess
ions
and
exch
ange o
f m
ark
et
info
rmation a
nd
develo
pm
ents
.
4.
What
asp
ect
s of
your
busi
ness
do y
ou
inte
nd t
o c
hange in t
he n
ext
2 y
ears
?
(Mach
inery
, co
mpute
rs,
new
pro
duct
s, m
ark
eting s
trate
gy,
quality
co
ntr
ol, m
anagem
ent
syst
em
)
We inte
nd t
o focu
s a little m
ore
on v
egeta
ble
s fo
r lo
cal co
nsu
mption f
or
purp
ose
s of
stability
and s
ust
ain
ability.
MO
A h
as
warn
ed t
hat
EU
mark
ets
are
shaky a
s fa
r as
rece
ivin
g
pro
duce
fro
m N
aru
Moru
are
a is
conce
rned.
E.g
. Chem
ical
applica
tion c
an s
om
etim
es
be a
s oft
en a
s w
eekly
and G
erm
an a
nd
Holland m
ark
ets
are
the s
tric
test
cf
. Engla
nd.
We a
re t
here
fore
th
inkin
g o
f div
ers
ifyin
g into
the
loca
l m
ark
et,
i.e
. have c
ontr
act
s w
ith b
ig c
lients
such
as
leadin
g
superm
ark
ets
, sc
hools
, hosp
itals
etc
for
pota
to,
carr
ots
, and loca
l vegeta
ble
s.
These
have less
hust
le in c
hem
ical
applica
tion p
roce
dure
s and m
ark
et
is r
eadily a
vailable
and s
table
To d
ivers
ify into
supply
ing
the loca
l m
ark
et
esp
eci
ally
in p
ota
toe.
INPUT SUPPLY
1.
What
are
your
majo
r opport
unitie
s in
th
e a
reas
of in
put
cost
, quality
and
availability?
Indo F
arm
giv
es
us
cert
ifie
d s
eeds.
As
for
fert
iliz
ers
and p
est
icid
es,
we b
uy o
urs
elv
es
but
the t
ype o
f ch
em
icals
is
speci
fied b
y t
he
Agent/
Export
er.
W
e b
ear
the c
ost
of
weedin
g,
land p
repara
tion
and p
ickin
g
We u
se p
um
ps
for
irrigation.
When w
e u
sed t
o s
upply
for
inte
rnational m
ark
ets
, ce
rtifie
d
seeds
for
gre
en b
eans,
sugar
snap/s
now
peas
were
pro
vid
ed.
No p
roble
m g
ett
ing
fert
iliz
ers
, but
have iss
ues
with a
vailability o
f lo
cal
vegeta
ble
seeds
e.g
. pota
to.
Only
available
fro
m K
ARI.
They h
ave n
ever
had
govern
ment
fert
iliz
ers
. O
nly
hear
about
them
. 2.
Who a
re y
our
most
im
port
ant
suppliers
of in
puts
?
Indo F
arm
is
the e
xcl
usi
ve p
rovid
er
of
cert
ifie
d
seeds
for
the g
reen b
ean.
Oth
er
inputs
are
bought
from
sele
cted loca
l agro
-input
shops
but
must
be s
peci
fic
as
we
cannot
apply
any p
est
icid
es
we c
hoose
. Fert
iliz
ers
incl
ude C
AN
and D
AP
The e
xport
com
panie
s fo
r th
e
exotic
vegeta
ble
s Loca
l in
put
suppliers
for
fert
iliz
ers
and c
hem
icals
. E.g
. Bayer
, Fuga
Lim
a c
hem
ical dis
trib
uto
rs, M
eru
D
istr
ict
Coopera
tive U
nio
n.
Kenya F
resh
, In
do F
arm
, VEG
PRO
KARI
(pota
to)
Loca
l agro
vets
pro
vid
e
fert
iliz
ers
DAP/C
AN
3.
Are
there
pro
ble
ms
in o
bta
inin
g s
om
e
of
the inputs
?
No p
roble
m w
ith s
eeds.
Farm
ers
are
ask
ed t
o
get
org
aniz
ed s
o t
hat
whenever
they g
et
inco
me (
end m
onth
), t
hey k
eep a
side w
hat
No p
roble
m s
ourc
ing.
Seeds
for
pota
to
pro
ble
matic
to g
et
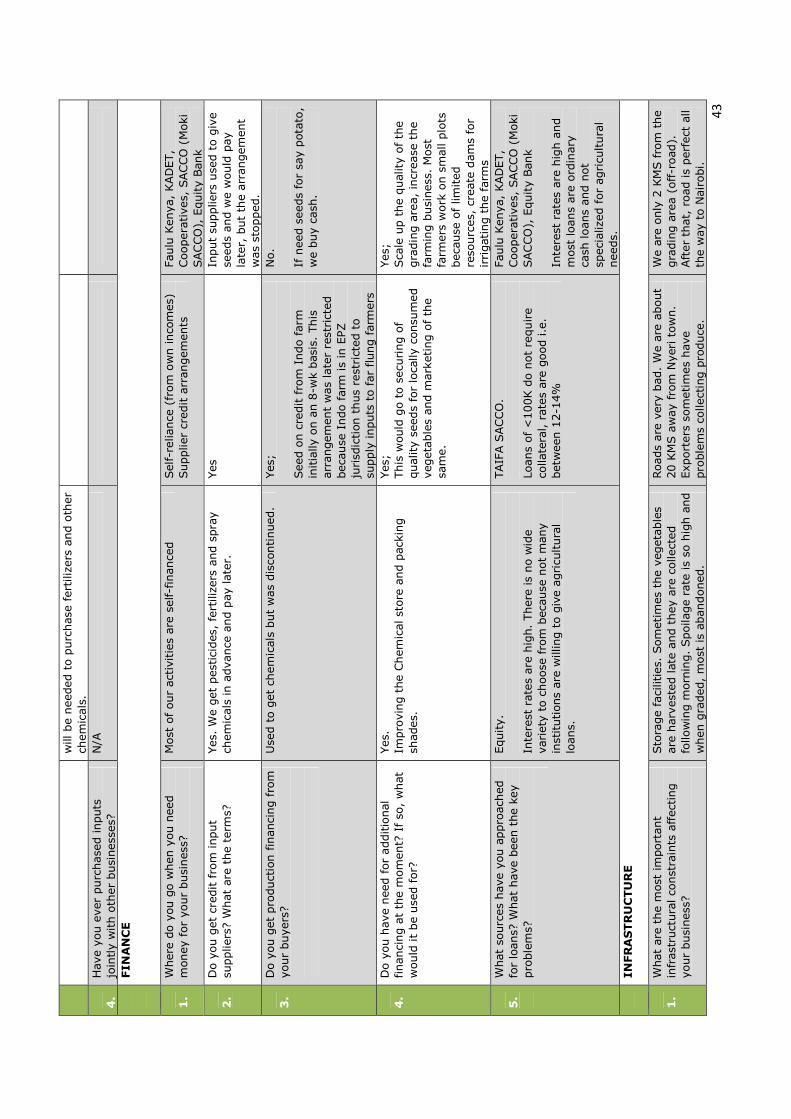
43
will be n
eeded t
o p
urc
hase
fert
iliz
ers
and o
ther
chem
icals
. 4.
Have y
ou e
ver
purc
hase
d inputs
jo
intly w
ith o
ther
busi
ness
es?
N
/A
FINANCE
1.
Where
do y
ou g
o w
hen y
ou n
eed
money f
or
your
busi
ness
?
Most
of our
act
ivitie
s are
self-f
inance
d
Self-r
eliance
(fr
om
ow
n inco
mes)
Supplier
credit a
rrangem
ents
Faulu
Kenya,
KAD
ET,
Coopera
tives,
SACCO
(M
oki
SAC
CO
), E
quity B
ank
2.
Do y
ou g
et
credit f
rom
input
suppliers
? W
hat
are
the t
erm
s?
Yes.
We g
et
pest
icid
es,
fert
iliz
ers
and s
pra
y
chem
icals
in a
dvance
and p
ay late
r.
Yes
Input
suppliers
use
d t
o g
ive
seeds
and w
e w
ould
pay
late
r, b
ut
the a
rrangem
ent
was
stopped.
3.
Do y
ou g
et
pro
duct
ion f
inanci
ng f
rom
your
buyers
?
Use
d t
o g
et
chem
icals
but
was
dis
continued.
Yes;
Seed o
n c
redit f
rom
Indo farm
in
itia
lly o
n a
n 8
-wk b
asi
s. T
his
arr
angem
ent
was
late
r re
strict
ed
beca
use
Indo f
arm
is
in E
PZ
jurisd
iction t
hus
rest
rict
ed t
o
supply
inputs
to f
ar
flung farm
ers
No.
If n
eed s
eeds
for
say p
ota
to,
we b
uy c
ash
.
4.
Do y
ou h
ave n
eed f
or
additio
nal
financi
ng a
t th
e m
om
ent?
If so
, w
hat
would
it
be u
sed for?
Yes.
Im
pro
vin
g t
he C
hem
ical st
ore
and p
ack
ing
shades.
Yes;
This
would
go t
o s
ecu
ring o
f quality
seeds
for
loca
lly c
onsu
med
vegeta
ble
s and m
ark
eting o
f th
e
sam
e.
Yes;
Sca
le u
p t
he q
uality
of th
e
gra
din
g a
rea,
incr
ease
the
farm
ing b
usi
ness
. M
ost
fa
rmers
work
on s
mall p
lots
beca
use
of
lim
ited
reso
urc
es,
cre
ate
dam
s fo
r ir
rigating t
he f
arm
s
5.
What
sourc
es
have y
ou a
ppro
ach
ed
for
loans?
What
have b
een t
he k
ey
pro
ble
ms?
Equity.
Inte
rest
rate
s are
hig
h.
There
is
no w
ide
variety
to c
hoose
fro
m b
eca
use
not
many
inst
itutions
are
willing t
o g
ive a
gri
cultura
l lo
ans.
TAIF
A S
ACCO
. Loans
of
<100K d
o n
ot
require
collate
ral, r
ate
s are
good i.e
. betw
een 1
2-1
4%
Faulu
Kenya,
KAD
ET,
Coopera
tives,
SACCO
(M
oki
SAC
CO
), E
quity B
ank
Inte
rest
rate
s are
hig
h a
nd
most
loans
are
ord
inary
ca
sh loans
and n
ot
speci
alize
d f
or
agri
cultura
l needs.
INFRASTRUCTURE
1.
What
are
the m
ost
im
port
ant
infr
ast
ruct
ura
l co
nst
rain
ts a
ffect
ing
your
busi
ness
?
Sto
rage f
aci
lities.
Som
etim
es
the v
egeta
ble
s are
harv
est
ed late
and t
hey a
re c
ollect
ed
follow
ing m
orn
ing.
Spoilage r
ate
is
so h
igh a
nd
when g
raded,
most
is
abandoned.
Roads
are
very
bad.
We a
re a
bout
20 K
MS a
way fro
m N
yeri
tow
n.
Export
ers
som
etim
es
have
pro
ble
ms
collect
ing p
roduce
.
We a
re o
nly
2 K
MS f
rom
the
gra
din
g a
rea (
off-r
oad).
Aft
er
that,
road is
perf
ect
all
the w
ay t
o N
air
obi.
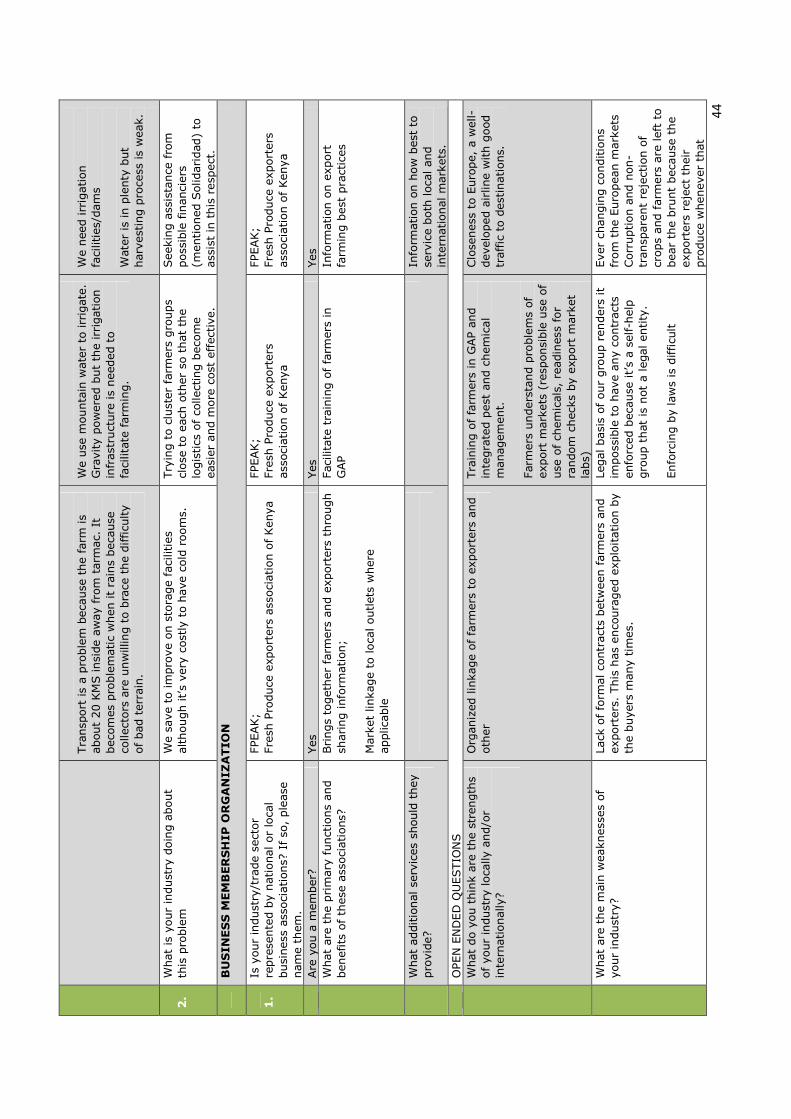
44
Tra
nsp
ort
is
a p
roble
m b
eca
use
the f
arm
is
about
20 K
MS insi
de a
way fro
m t
arm
ac.
It
beco
mes
pro
ble
matic
when it
rain
s beca
use
co
llect
ors
are
unw
illin
g t
o b
race
the d
ifficu
lty
of bad t
err
ain
.
We u
se m
ounta
in w
ate
r to
irr
igate
. G
ravity p
ow
ere
d b
ut
the irr
igation
infr
ast
ruct
ure
is
needed t
o
faci
lita
te farm
ing.
We n
eed irr
igation
faci
lities/
dam
s W
ate
r is
in p
lenty
but
harv
est
ing p
roce
ss is
weak.
2.
What
is y
our
indust
ry d
oin
g a
bout
this
pro
ble
m
We s
ave t
o im
pro
ve o
n s
tora
ge f
aci
lities
although it’s
very
cost
ly t
o h
ave c
old
room
s.
Try
ing t
o c
lust
er
farm
ers
gro
ups
close
to e
ach
oth
er
so t
hat
the
logis
tics
of
collect
ing b
eco
me
easi
er
and m
ore
cost
eff
ect
ive.
Seekin
g a
ssis
tance
fro
m
poss
ible
fin
anci
ers
(m
entioned S
olidari
dad)
to
ass
ist
in t
his
resp
ect
.
BUSINESS MEMBERSHIP ORGANIZATION
1.
Is y
our
indust
ry/t
rade s
ect
or
repre
sente
d b
y n
ational or
loca
l busi
ness
ass
oci
ations?
If so
, ple
ase
nam
e t
hem
.
FPEAK;
Fre
sh P
roduce
export
ers
ass
oci
ation o
f Kenya
FPEAK;
Fre
sh P
roduce
export
ers
ass
oci
ation o
f Kenya
FPEAK;
Fre
sh P
roduce
export
ers
ass
oci
ation o
f Kenya
Are
you a
mem
ber?
Yes
Yes
Yes
W
hat
are
the p
rim
ary
funct
ions
and
benefits
of
these
ass
oci
ations?
Brings
togeth
er
farm
ers
and e
xport
ers
thro
ugh
sharing info
rmation;
M
ark
et
linkage t
o loca
l outlets
where
applica
ble
Faci
lita
te t
rain
ing o
f fa
rmers
in
GAP
Info
rmation o
n e
xport
fa
rmin
g b
est
pra
ctic
es
W
hat
additio
nal se
rvic
es
should
they
pro
vid
e?
Info
rmation o
n h
ow
best
to
serv
ice b
oth
loca
l and
inte
rnational m
ark
ets
.
OPEN
EN
DED
QU
ESTIO
NS
W
hat
do y
ou t
hin
k a
re t
he s
trength
s of
your
indust
ry loca
lly a
nd/o
r in
tern
ationally?
Org
aniz
ed lin
kage o
f fa
rmers
to e
xport
ers
and
oth
er
Tra
inin
g o
f fa
rmers
in G
AP a
nd
inte
gra
ted p
est
and c
hem
ical
managem
ent.
Farm
ers
unders
tand p
roble
ms
of
export
mark
ets
(re
sponsi
ble
use
of
use
of ch
em
icals
, re
adin
ess
for
random
check
s by e
xport
mark
et
labs)
Clo
seness
to E
uro
pe,
a w
ell-
develo
ped a
irline w
ith g
ood
traffic
to d
est
inations.
W
hat
are
the m
ain
weakness
es
of
your
indust
ry?
Lack
of fo
rmal co
ntr
act
s betw
een f
arm
ers
and
export
ers
. This
has
enco
ura
ged e
xplo
itation b
y
the b
uyers
many t
imes.
Legal basi
s of
our
gro
up r
enders
it
imposs
ible
to h
ave a
ny c
ontr
act
s enfo
rced b
eca
use
it’s
a s
elf-h
elp
gro
up t
hat
is n
ot
a legal entity
. Enfo
rcin
g b
y law
s is
difficu
lt
Ever
changin
g c
onditio
ns
from
the E
uro
pean m
ark
ets
Corr
uption a
nd n
on-
transp
are
nt
reje
ctio
n o
f cr
ops
and f
arm
ers
are
left
to
bear
the b
runt
beca
use
the
export
ers
reje
ct t
heir
pro
duce
whenever
that
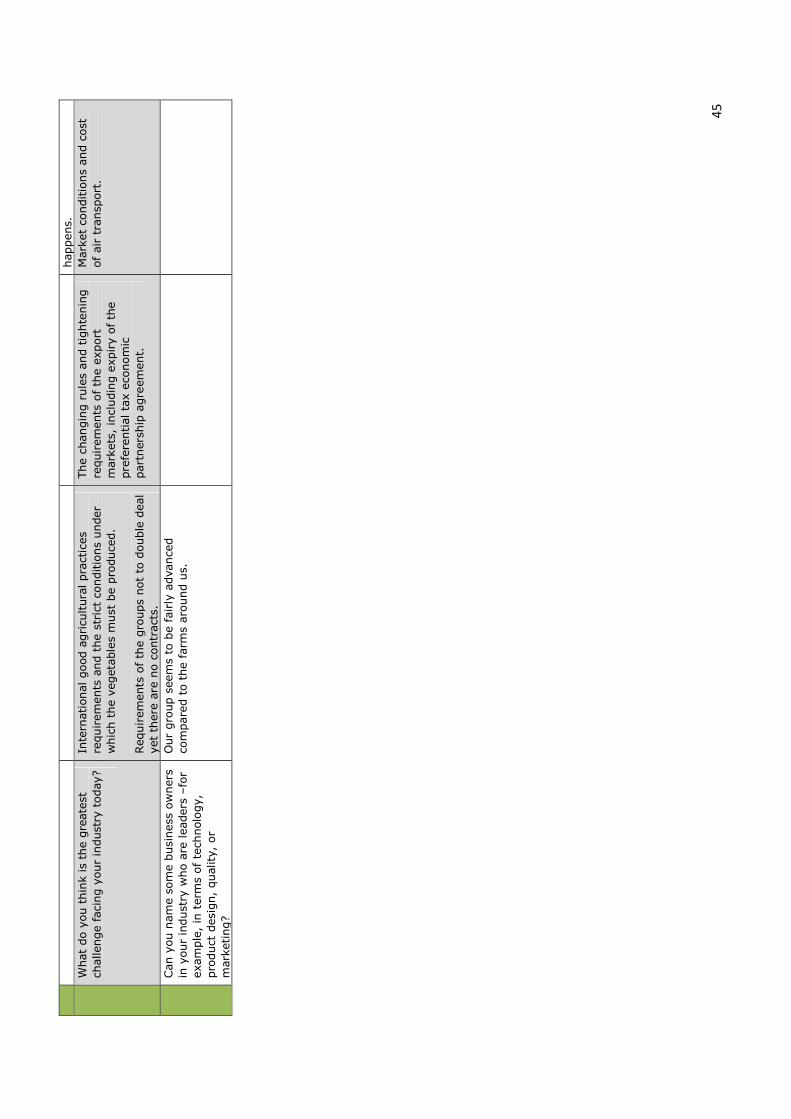
45
happens.
What
do y
ou t
hin
k is
the g
reate
st
challenge f
aci
ng y
our
indust
ry t
oday?
Inte
rnational good a
gri
cultura
l pra
ctic
es
requirem
ents
and t
he s
tric
t co
nditio
ns
under
whic
h t
he v
egeta
ble
s m
ust
be p
roduce
d.
Requir
em
ents
of
the g
roups
not
to d
ouble
deal
yet
there
are
no c
ontr
act
s.
The c
hangin
g r
ule
s and t
ighte
nin
g
requir
em
ents
of
the e
xport
m
ark
ets
, in
cludin
g e
xpir
y o
f th
e
pre
fere
ntial ta
x e
conom
ic
part
ners
hip
agre
em
ent.
Mark
et
conditio
ns
and c
ost
of
air t
ransp
ort
.
Can y
ou n
am
e s
om
e b
usi
ness
ow
ners
in
your
indust
ry w
ho a
re leaders
–fo
r exam
ple
, in
term
s of
tech
nolo
gy,
pro
duct
desi
gn,
quality
, or
mark
eting?
Our
gro
up s
eem
s to
be f
airly
advance
d
com
pare
d t
o t
he f
arm
s aro
und u
s.
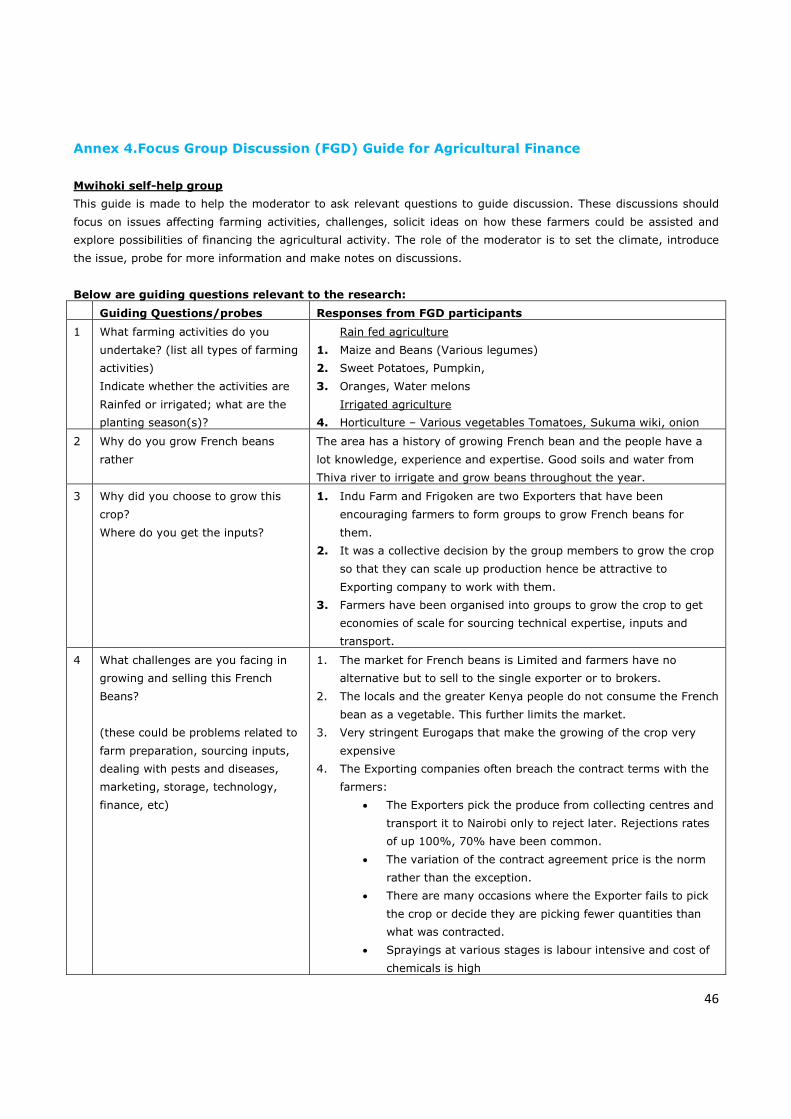
46
Annex 4.Focus Group Discussion (FGD) Guide for Agricultural Finance
Mwihoki self-help group
This guide is made to help the moderator to ask relevant questions to guide discussion. These discussions should
focus on issues affecting farming activities, challenges, solicit ideas on how these farmers could be assisted and
explore possibilities of financing the agricultural activity. The role of the moderator is to set the climate, introduce
the issue, probe for more information and make notes on discussions.
Below are guiding questions relevant to the research:
Guiding Questions/probes Responses from FGD participants
1 What farming activities do you
undertake? (list all types of farming
activities)
Indicate whether the activities are
Rainfed or irrigated; what are the
planting season(s)?
Rain fed agriculture
1. Maize and Beans (Various legumes)
2. Sweet Potatoes, Pumpkin,
3. Oranges, Water melons
Irrigated agriculture
4. Horticulture – Various vegetables Tomatoes, Sukuma wiki, onion
2 Why do you grow French beans
rather
The area has a history of growing French bean and the people have a
lot knowledge, experience and expertise. Good soils and water from
Thiva river to irrigate and grow beans throughout the year.
3 Why did you choose to grow this
crop?
Where do you get the inputs?
1. Indu Farm and Frigoken are two Exporters that have been
encouraging farmers to form groups to grow French beans for
them.
2. It was a collective decision by the group members to grow the crop
so that they can scale up production hence be attractive to
Exporting company to work with them.
3. Farmers have been organised into groups to grow the crop to get
economies of scale for sourcing technical expertise, inputs and
transport.
4 What challenges are you facing in
growing and selling this French
Beans?
(these could be problems related to
farm preparation, sourcing inputs,
dealing with pests and diseases,
marketing, storage, technology,
finance, etc)
1. The market for French beans is Limited and farmers have no
alternative but to sell to the single exporter or to brokers.
2. The locals and the greater Kenya people do not consume the French
bean as a vegetable. This further limits the market.
3. Very stringent Eurogaps that make the growing of the crop very
expensive
4. The Exporting companies often breach the contract terms with the
farmers:
• The Exporters pick the produce from collecting centres and
transport it to Nairobi only to reject later. Rejections rates
of up 100%, 70% have been common.
• The variation of the contract agreement price is the norm
rather than the exception.
• There are many occasions where the Exporter fails to pick
the crop or decide they are picking fewer quantities than
what was contracted.
• Sprayings at various stages is labour intensive and cost of
chemicals is high
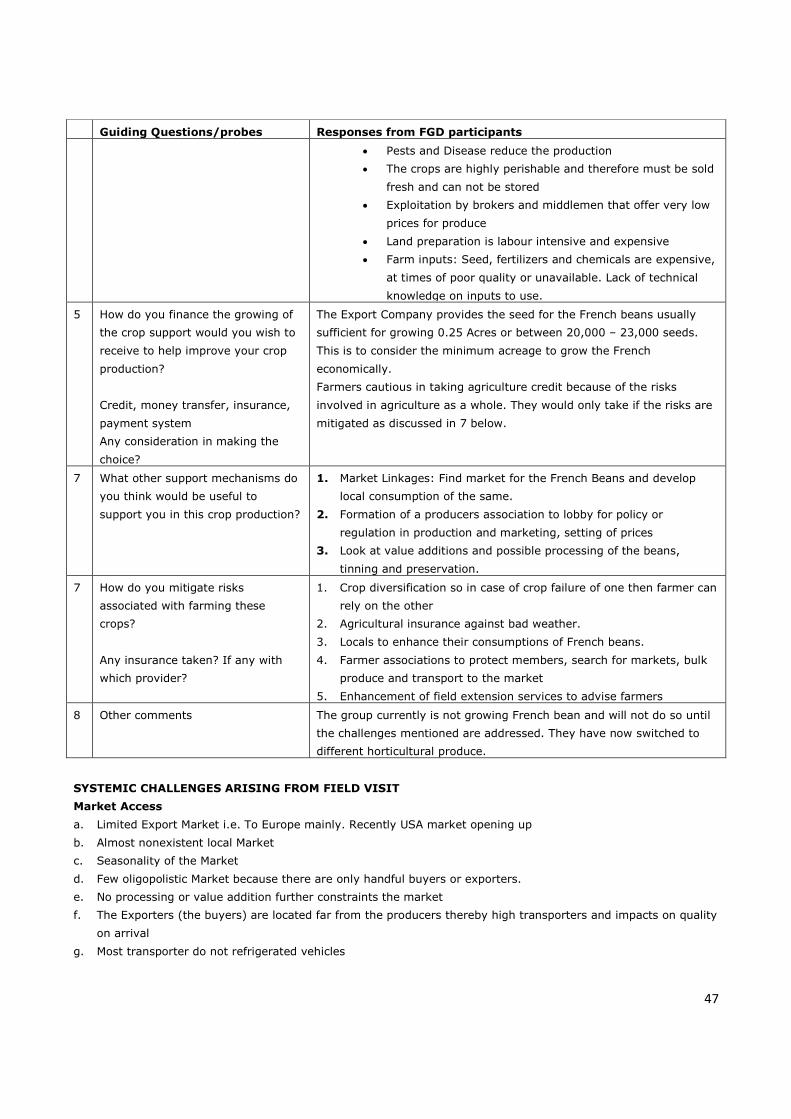
47
Guiding Questions/probes Responses from FGD participants
• Pests and Disease reduce the production
• The crops are highly perishable and therefore must be sold
fresh and can not be stored
• Exploitation by brokers and middlemen that offer very low
prices for produce
• Land preparation is labour intensive and expensive
• Farm inputs: Seed, fertilizers and chemicals are expensive,
at times of poor quality or unavailable. Lack of technical
knowledge on inputs to use.
5 How do you finance the growing of
the crop support would you wish to
receive to help improve your crop
production?
Credit, money transfer, insurance,
payment system
Any consideration in making the
choice?
The Export Company provides the seed for the French beans usually
sufficient for growing 0.25 Acres or between 20,000 – 23,000 seeds.
This is to consider the minimum acreage to grow the French
economically.
Farmers cautious in taking agriculture credit because of the risks
involved in agriculture as a whole. They would only take if the risks are
mitigated as discussed in 7 below.
7 What other support mechanisms do
you think would be useful to
support you in this crop production?
1. Market Linkages: Find market for the French Beans and develop
local consumption of the same.
2. Formation of a producers association to lobby for policy or
regulation in production and marketing, setting of prices
3. Look at value additions and possible processing of the beans,
tinning and preservation.
7 How do you mitigate risks
associated with farming these
crops?
Any insurance taken? If any with
which provider?
1. Crop diversification so in case of crop failure of one then farmer can
rely on the other
2. Agricultural insurance against bad weather.
3. Locals to enhance their consumptions of French beans.
4. Farmer associations to protect members, search for markets, bulk
produce and transport to the market
5. Enhancement of field extension services to advise farmers
8 Other comments The group currently is not growing French bean and will not do so until
the challenges mentioned are addressed. They have now switched to
different horticultural produce.
SYSTEMIC CHALLENGES ARISING FROM FIELD VISIT
Market Access
a. Limited Export Market i.e. To Europe mainly. Recently USA market opening up
b. Almost nonexistent local Market
c. Seasonality of the Market
d. Few oligopolistic Market because there are only handful buyers or exporters.
e. No processing or value addition further constraints the market
f. The Exporters (the buyers) are located far from the producers thereby high transporters and impacts on quality
on arrival
g. Most transporter do not refrigerated vehicles
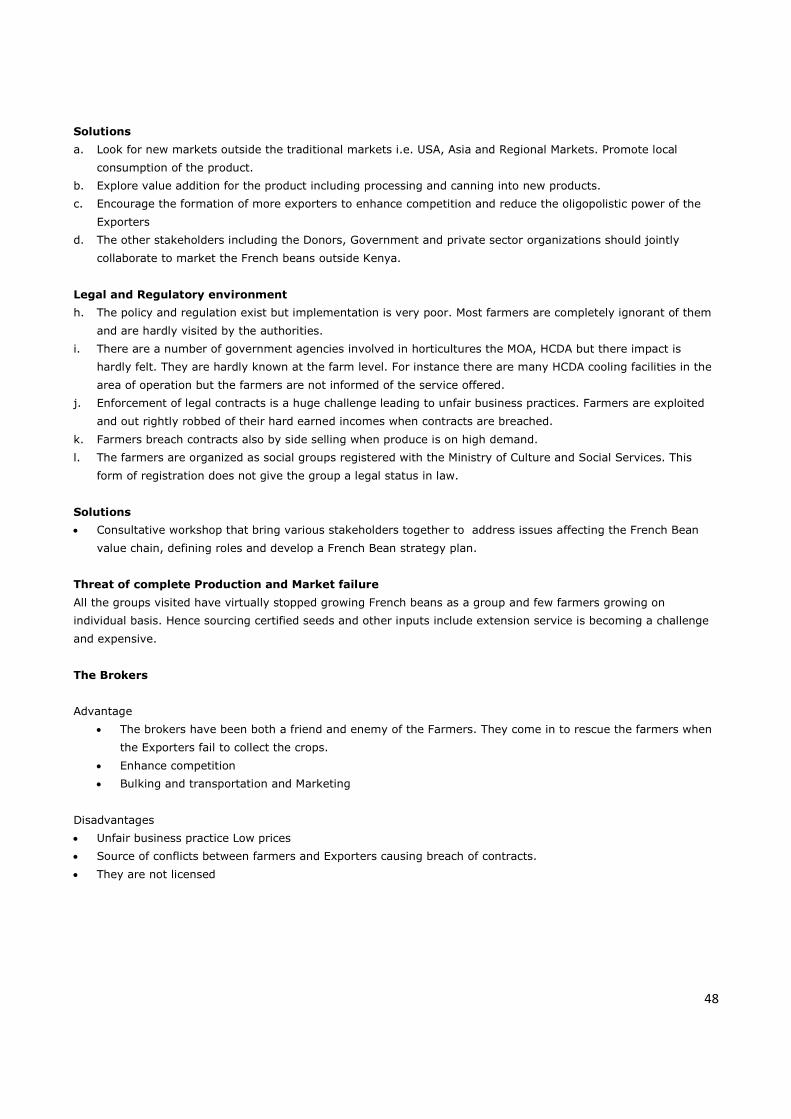
48
Solutions
a. Look for new markets outside the traditional markets i.e. USA, Asia and Regional Markets. Promote local
consumption of the product.
b. Explore value addition for the product including processing and canning into new products.
c. Encourage the formation of more exporters to enhance competition and reduce the oligopolistic power of the
Exporters
d. The other stakeholders including the Donors, Government and private sector organizations should jointly
collaborate to market the French beans outside Kenya.
Legal and Regulatory environment
h. The policy and regulation exist but implementation is very poor. Most farmers are completely ignorant of them
and are hardly visited by the authorities.
i. There are a number of government agencies involved in horticultures the MOA, HCDA but there impact is
hardly felt. They are hardly known at the farm level. For instance there are many HCDA cooling facilities in the
area of operation but the farmers are not informed of the service offered.
j. Enforcement of legal contracts is a huge challenge leading to unfair business practices. Farmers are exploited
and out rightly robbed of their hard earned incomes when contracts are breached.
k. Farmers breach contracts also by side selling when produce is on high demand.
l. The farmers are organized as social groups registered with the Ministry of Culture and Social Services. This
form of registration does not give the group a legal status in law.
Solutions
• Consultative workshop that bring various stakeholders together to address issues affecting the French Bean
value chain, defining roles and develop a French Bean strategy plan.
Threat of complete Production and Market failure
All the groups visited have virtually stopped growing French beans as a group and few farmers growing on
individual basis. Hence sourcing certified seeds and other inputs include extension service is becoming a challenge
and expensive.
The Brokers
Advantage
• The brokers have been both a friend and enemy of the Farmers. They come in to rescue the farmers when
the Exporters fail to collect the crops.
• Enhance competition
• Bulking and transportation and Marketing
Disadvantages
• Unfair business practice Low prices
• Source of conflicts between farmers and Exporters causing breach of contracts.
• They are not licensed
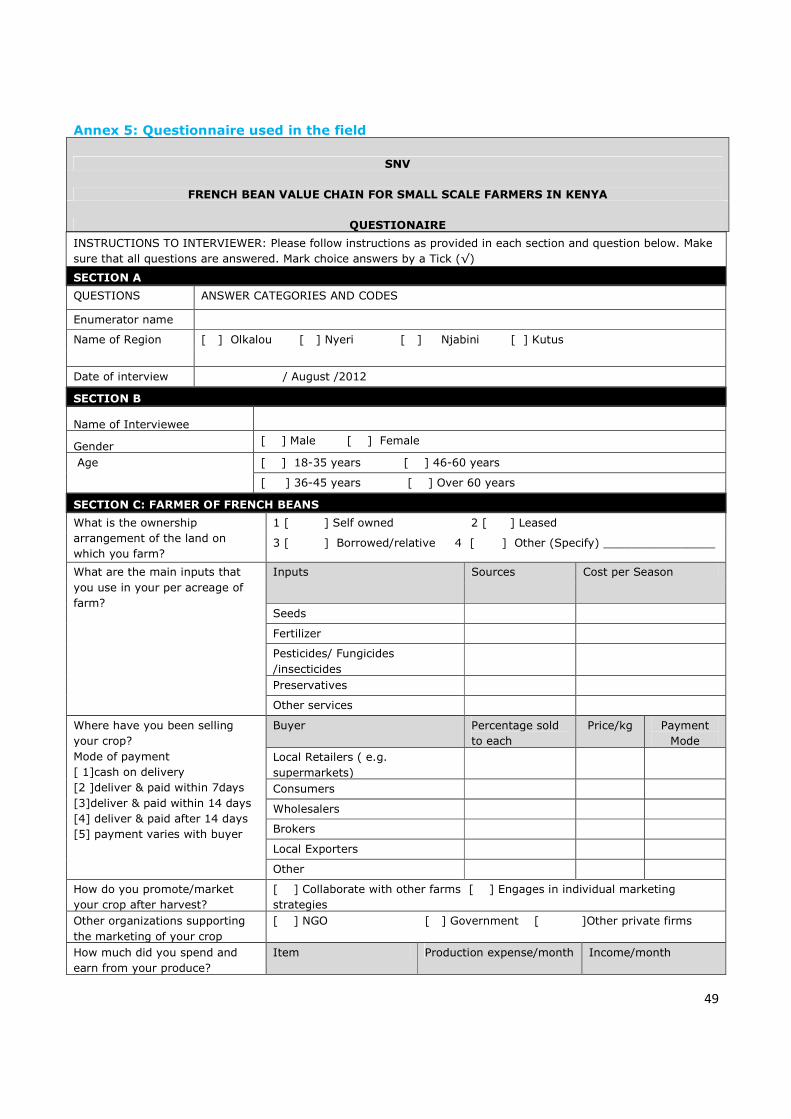
49
Annex 5: Questionnaire used in the field
SNV
FRENCH BEAN VALUE CHAIN FOR SMALL SCALE FARMERS IN KENYA
QUESTIONAIRE
INSTRUCTIONS TO INTERVIEWER: Please follow instructions as provided in each section and question below. Make
sure that all questions are answered. Mark choice answers by a Tick (√)
SECTION A
QUESTIONS ANSWER CATEGORIES AND CODES
Enumerator name
Name of Region [ ] Olkalou [ ] Nyeri [ ] Njabini [ ] Kutus
Date of interview / August /2012
SECTION B
Name of Interviewee
Gender [ ] Male [ ] Female
Age [ ] 18-35 years [ ] 46-60 years
[ ] 36-45 years [ ] Over 60 years
SECTION C: FARMER OF FRENCH BEANS
What is the ownership
arrangement of the land on
which you farm?
1 [ ] Self owned 2 [ ] Leased
3 [ ] Borrowed/relative 4 [ ] Other (Specify) ________________
What are the main inputs that
you use in your per acreage of
farm?
Inputs Sources Cost per Season
Seeds
Fertilizer
Pesticides/ Fungicides
/insecticides
Preservatives
Other services
Where have you been selling
your crop?
Mode of payment
[ 1]cash on delivery
[2 ]deliver & paid within 7days
[3]deliver & paid within 14 days
[4] deliver & paid after 14 days
[5] payment varies with buyer
Buyer Percentage sold
to each
Price/kg Payment
Mode
Local Retailers ( e.g.
supermarkets)
Consumers
Wholesalers
Brokers
Local Exporters
Other
How do you promote/market
your crop after harvest?
[ ] Collaborate with other farms [ ] Engages in individual marketing
strategies
Other organizations supporting
the marketing of your crop
[ ] NGO [ ] Government [ ]Other private firms
How much did you spend and
earn from your produce?
Item Production expense/month Income/month
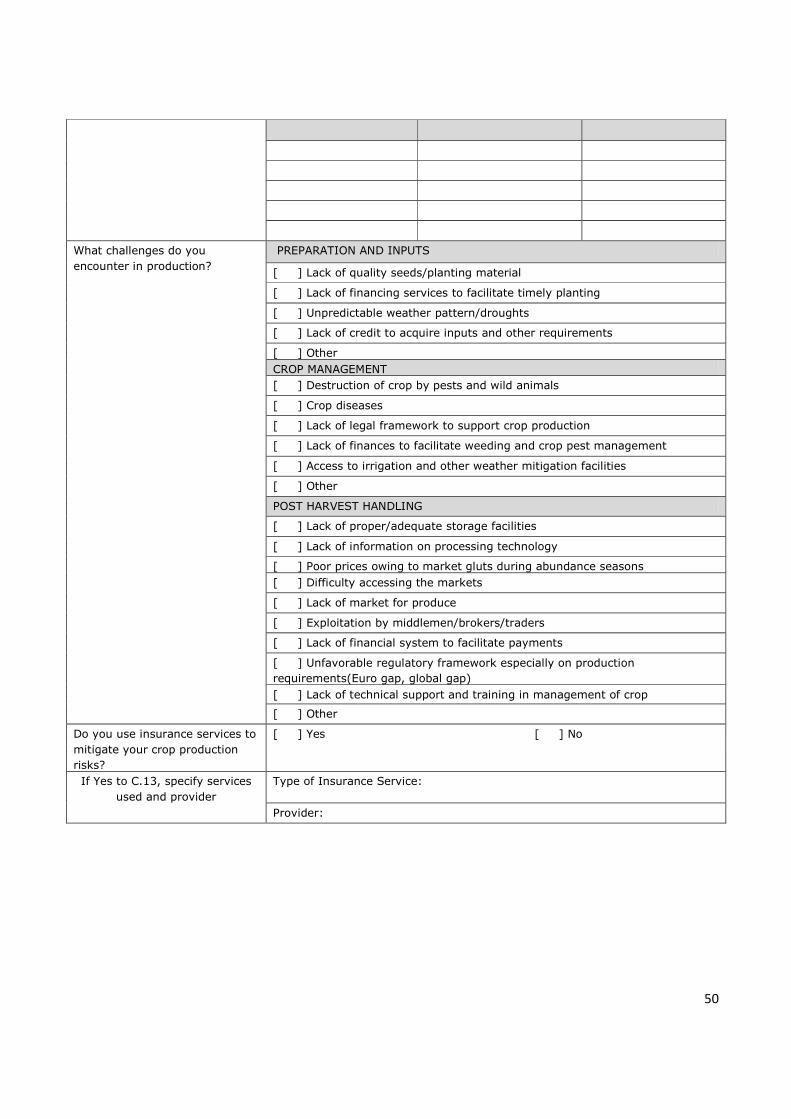
50
What challenges do you
encounter in production?
PREPARATION AND INPUTS
[ ] Lack of quality seeds/planting material
[ ] Lack of financing services to facilitate timely planting
[ ] Unpredictable weather pattern/droughts
[ ] Lack of credit to acquire inputs and other requirements
[ ] Other
CROP MANAGEMENT
[ ] Destruction of crop by pests and wild animals
[ ] Crop diseases
[ ] Lack of legal framework to support crop production
[ ] Lack of finances to facilitate weeding and crop pest management
[ ] Access to irrigation and other weather mitigation facilities
[ ] Other
POST HARVEST HANDLING
[ ] Lack of proper/adequate storage facilities
[ ] Lack of information on processing technology
[ ] Poor prices owing to market gluts during abundance seasons
[ ] Difficulty accessing the markets
[ ] Lack of market for produce
[ ] Exploitation by middlemen/brokers/traders
[ ] Lack of financial system to facilitate payments
[ ] Unfavorable regulatory framework especially on production
requirements(Euro gap, global gap)
[ ] Lack of technical support and training in management of crop
[ ] Other
Do you use insurance services to
mitigate your crop production
risks?
[ ] Yes [ ] No
If Yes to C.13, specify services
used and provider
Type of Insurance Service:
Provider:
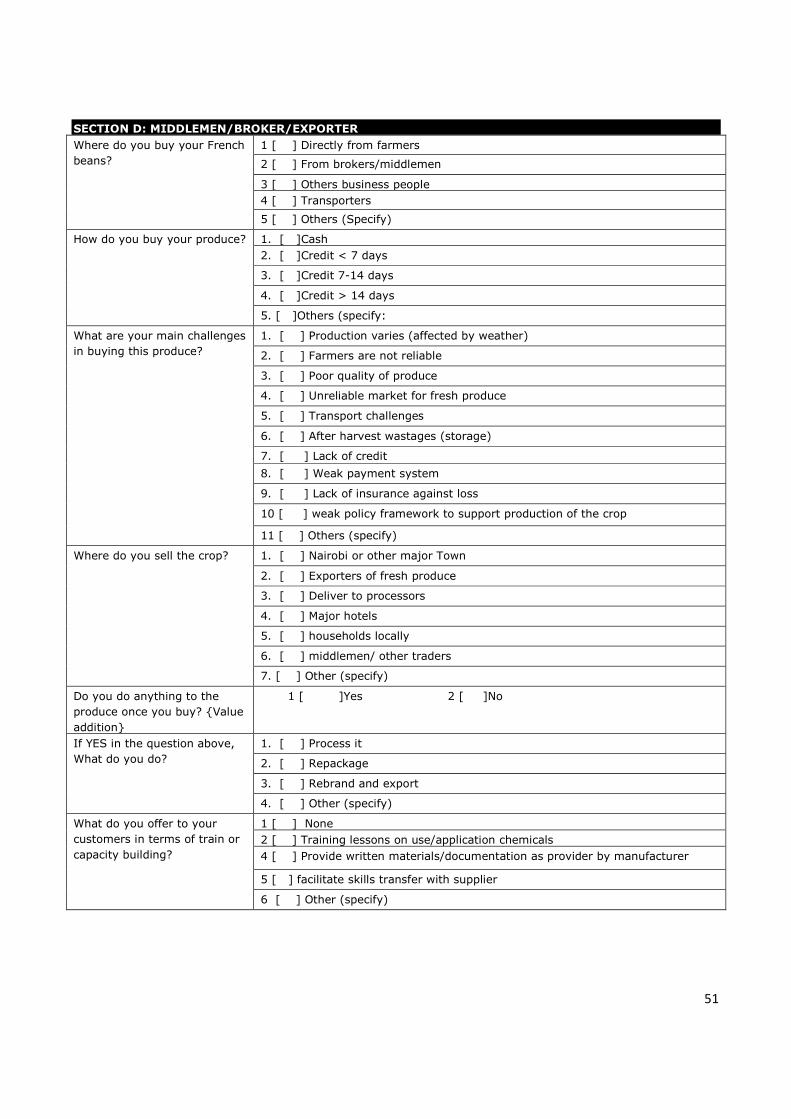
51
SECTION D: MIDDLEMEN/BROKER/EXPORTER
Where do you buy your French
beans?
1 [ ] Directly from farmers
2 [ ] From brokers/middlemen
3 [ ] Others business people
4 [ ] Transporters
5 [ ] Others (Specify)
How do you buy your produce? 1. [ ]Cash
2. [ ]Credit < 7 days
3. [ ]Credit 7-14 days
4. [ ]Credit > 14 days
5. [ ]Others (specify:
What are your main challenges
in buying this produce?
1. [ ] Production varies (affected by weather)
2. [ ] Farmers are not reliable
3. [ ] Poor quality of produce
4. [ ] Unreliable market for fresh produce
5. [ ] Transport challenges
6. [ ] After harvest wastages (storage)
7. [ ] Lack of credit
8. [ ] Weak payment system
9. [ ] Lack of insurance against loss
10 [ ] weak policy framework to support production of the crop
11 [ ] Others (specify)
Where do you sell the crop? 1. [ ] Nairobi or other major Town
2. [ ] Exporters of fresh produce
3. [ ] Deliver to processors
4. [ ] Major hotels
5. [ ] households locally
6. [ ] middlemen/ other traders
7. [ ] Other (specify)
Do you do anything to the
produce once you buy? {Value
addition}
1 [ ]Yes 2 [ ]No
If YES in the question above,
What do you do?
1. [ ] Process it
2. [ ] Repackage
3. [ ] Rebrand and export
4. [ ] Other (specify)
What do you offer to your
customers in terms of train or
capacity building?
1 [ ] None
2 [ ] Training lessons on use/application chemicals
4 [ ] Provide written materials/documentation as provider by manufacturer
5 [ ] facilitate skills transfer with supplier
6 [ ] Other (specify)
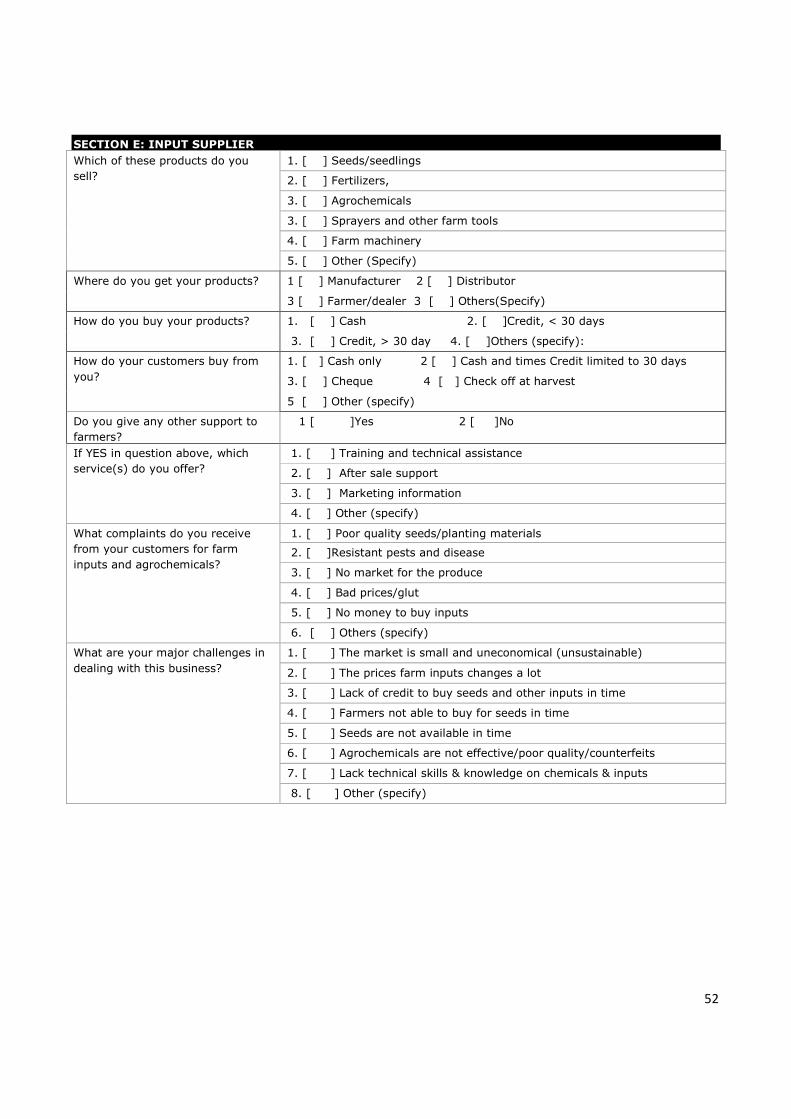
52
SECTION E: INPUT SUPPLIER
Which of these products do you
sell?
1. [ ] Seeds/seedlings
2. [ ] Fertilizers,
3. [ ] Agrochemicals
3. [ ] Sprayers and other farm tools
4. [ ] Farm machinery
5. [ ] Other (Specify)
Where do you get your products? 1 [ ] Manufacturer 2 [ ] Distributor
3 [ ] Farmer/dealer 3 [ ] Others(Specify)
How do you buy your products? 1. [ ] Cash 2. [ ]Credit, < 30 days
3. [ ] Credit, > 30 day 4. [ ]Others (specify):
How do your customers buy from
you?
1. [ ] Cash only 2 [ ] Cash and times Credit limited to 30 days
3. [ ] Cheque 4 [ ] Check off at harvest
5 [ ] Other (specify)
Do you give any other support to
farmers?
1 [ ]Yes 2 [ ]No
If YES in question above, which
service(s) do you offer?
1. [ ] Training and technical assistance
2. [ ] After sale support
3. [ ] Marketing information
4. [ ] Other (specify)
What complaints do you receive
from your customers for farm
inputs and agrochemicals?
1. [ ] Poor quality seeds/planting materials
2. [ ]Resistant pests and disease
3. [ ] No market for the produce
4. [ ] Bad prices/glut
5. [ ] No money to buy inputs
6. [ ] Others (specify)
What are your major challenges in
dealing with this business?
1. [ ] The market is small and uneconomical (unsustainable)
2. [ ] The prices farm inputs changes a lot
3. [ ] Lack of credit to buy seeds and other inputs in time
4. [ ] Farmers not able to buy for seeds in time
5. [ ] Seeds are not available in time
6. [ ] Agrochemicals are not effective/poor quality/counterfeits
7. [ ] Lack technical skills & knowledge on chemicals & inputs
8. [ ] Other (specify)


![Strategic Plan Revised Version Hcda[1]](https://img.pdfslide.us/doc/110x75/55cf96ac550346d0338d0d5e/strategic-plan-revised-version-hcda1.jpg)

