Embed Size (px)
Citation preview

Sains Malaysiana 41(12)(2012) 1621ndash1627
Beamforming Technique for Investigation of Lateral Variability at Geotechnical Sites
(Teknik Alur Bentuk untuk Mengkaji Kebolehubahan Sisi di Tapak Geoteknik)
NorfArAh NAdIA ISMAIL SuNG-ho Joh amp rAJA hASSANuL MuSA rAJA AhMAd
ABSTrAcT
A beamformer in seismology is a signal receptor with a series of geophones in which a beam of elastic waves is formed like a light beam by adjusting signal delays at individual geophones Recently beamforming has extended its applications to surface-wave measurement In surface-wave measurement beamforming provides unique advantages over other surface-wave methods such as full automation in data analysis as well as directional signal reception to minimize scattered noise and multiple reflections in signals However certain defects depreciate the value of beamforming in terms of its practicality and feasibility These include the requirement of having many receivers and the loss of small wavelength data due to spatial aliasing It leads to insensitivity in identification of lateral variability which creates the problem of having to smooth out geologic features and complexities like folding faults and fractures In this paper advances in the refinement of beamforming were described on two counts improvement of sensitivity in identification of lateral variability and recovery of aliased wave numbers which enables evaluation of shallow material On the passage to refinement synthetic waveforms for typical layering systems were generated to figure out characteristics of beamformer velocities in comparison with SASW velocities and theoretical normal-mode velocities
Keywords Beamforming theory phase velocities refined beamformer spatial aliasing
ABSTrAK
Alur bentuk dalam konteks seismologi ialah pengesan isyarat yang menggunakan sebilangan geofon dengan alur gelombang kenyal seperti alur cahaya dibentuk dengan mengubah lengah isyarat pada setiap geofon Kebelakangan ini aplikasi alur bentuk telah dikembangkan dalam kaedah pengukuran gelombang permukaan Dalam kaedah pengukuran gelombang permukaan alur bentuk mempunyai kelebihan yang unik berbanding kaedah gelombang permukaan yang lain seperti automasi penuh dalam menganalisis data serta penerimaan isyarat terarah untuk meminimumkan taburan hingar dan pantulan berganda dalam isyarat Walau bagaimanapun terdapat beberapa kekangan yang boleh menurunkan nilai alur bentuk daripada segi praktikal dan pelaksanaan Ia termasuklah keperluan untuk menggunakan banyak penerima dan kehilangan data pada panjang gelombang yang pendek akibat herotan ruang Ini membuatkan tahap pengenalpastian terhadap kebolehubahan sisi menjadi kurang sensitif dan boleh menimbulkan masalah kerana terpaksa melicinkan fitur geologi serta struktur rencamnya seperti lipatan sesaran dan retakan Dalam kertas ini kemajuan dalam tapisan alur bentuk diterangkan berdasarkan dua penekanan penambahbaikan kepekaan dalam pengenalpastian kebolehubahan sisi dan pemulihan nombor gelombang yang terherot bagi membolehkan penilaian dilakukan ke atas bahan cetek Dalam proses penapisan ini sejumlah gelombang sintetik untuk sistem berlapis yang tipikal telah dihasilkan bagi mencari dan menentukan ciri-ciri halaju alur bentuk berdasarkan perbandingan dengan halaju SASW dan halaju teori mod-normal
Kata kunci Alur bentuk tertapis halaju fasa herotan ruang teori beamforming
INTroducTIoN
Site investigation for layer stratification or stiffness profile is not the only use of surface-wave measurement Successful structural integrity assessment for both concrete and geotechnical structures are also attributed to the advancement of surface-wave technique With an increasing demand for surface-wave measurement its technology is also moving from 1-D profiling to 3-D representation from expertise-intensive analysis to fully automated analysis
Currently a variety of surface-wave assessment methods are available such as SASW MASW CSW reMi and frequency-wave number technique (Joh 1996 Stokoe et al 1994 2004) Each of these surface-wave methods has its own pros and cons In most cases the accuracy and reliability do not go along with practicality and feasibility in testing and analysis Recently a new method called beamforming technique which has been widely used for radar sonar and wireless transmission was also adopted for evaluating shear-wave velocity
1622
profiles at geotechnical sites Thanks to several advantages of beamforming technique such as full automation in data analysis and minimization of noises and multiple reflections beamforming could be a leading technology in surface-wave measurement However beamformer faces a couple of limitations in practice because a long measurement array smoothens out important geologic features locally distributed and also because large wave numbers are aliased which precludes the possibility of evaluating shallow material To refine the beamforming technique for improved performance two elementary techniques were proposed in this paper four-geophone based walk-away procedure and recovery scheme of aliased wave numbers To verify the validity of the refined beamformer synthetic waveforms for a typical layering system were incorporated
BEAMfoRMIng THEoRy
A beamforming technique was developed for transmitting and receiving signals in a specific direction Beamforming in signal reception implies that a beam of elastic waves is formed like a light beam by adjusting signal delays corresponding to individual receivers Delay-and-sum beamforming is the oldest and simplest beamforming algorithm In the delay-and-sum beamforming if a seismic wave is propagating towards a receiver array the receiver outputs delayed by appropriate amounts and added together reinforce the seismic signal with respect to noise or waves propagating in different directions (Johnson amp Dedgeon 1993) Let the waveform measured by the mth receiver hm(t) Delay-and-sum beamformer consists of applying a delay Δm and weighting factor wm to the amplitude of each receiver then summing the resulting signals The delays are chosen to maximize the arrayrsquos sensitivity to waves propagating from a particular location in space The output signal from the delay-and-sum beamformer is defined as
z(t) = (1)
The beamforming algorithm in the time domain can be also expressed in the frequency domain Phase theorem a property of fourier transform allows time delays to be rephrased in phase shift Therefore (1) can be redefined as (2) using Hm(ω) which denotes fourier transform of a waveform at the mth receiver
Z(ω) = (2)
Since phase delay ωΔm can be replaced with ndashkxm which is a product of local wavenumber k and the location of the mth receiver location (2) can be simplified as (3)
Zn = enHn (3)
where en is defined as (4) and called the steering vector for the nth frequency bin a sequence of phasors whose
exponents work to cancel phase shift corresponding to the waveform of the mth receiver
(4)
Hn is a column vector weighted by wm that contains the ffT coefficients for the waveform from each receiver finally the steered response power for the nth frequency bin which indicates the power in the beamformerrsquos output spectrum can be defined as (5)
Pn = enE[HnHn]en = enRnen (5)
where the matrix Rn is known as a cross-spectral matrix or a spatial correlation matrix Beamforming technique has been successfully employed for surface-wave measurements at geotechnical sites by researchers (Zywicki amp Malladi 2007 Zywicki amp Rix 2005) However to make beamforming more practical some improvements need to be made to deal with its limitations namely large number of receivers required to produce a good resolution and its lack of high-frequency information due to spatial aliasing At first the requirement of many receivers leads to a couple of problems including insensitivity in lateral variability due to long measurement array and high standard in hardware specification Secondly in the case of spatial aliasing wave numbers can be aliased if wave number goes over 2πd where d is inter-receiver spacing Therefore high frequencies to cause aliasing in wave numbers (spatial aliasing) cannot be included in surface-wave dispersion curves In turn the dispersion curve lacks the short wavelengths required to evaluate stiffness of shallow material In this research two elementary techniques for beamforming were proposed to enhance its performance in the area of surface-wave measurements
WALk-AWAy APPRoACH foR LIMITED nuMBER of RECEIVERS
In practicing beamforming technique using many receivers is preferable for reliable determination of phase velocities one example of the technique is to incorporate 15 geophones for characterizing geotechnical sites (Zywicki amp Rix 2005) Besides hardware requirements for having a number of receivers long measurement array also leads to the problem of smoothing out lateral variability in sedimentary strata such as geological folds and faults To solve these problems a testing scheme called the walk-away test is proposed and adopted The walk-away test makes repeated measurements with increasing source offsets using a limited number of receivers and then combines all the waveforms together Then the total length of the measurement array becomes equivalent to the combined length of the source offset and the actual length of receiver arrays Therefore the total number of waveforms increases to much more than the actual number of receivers We incorporated this idea to apply
1623
beamforming technique to the investigation of a limited section with only four receivers The details of walk-away beamforming measurements are illustrated in figure 1 In the figure four independent sources are applied consecutively to a layered system with four receivers deployed at the same spacing Each source produces four waveforms which are combined together to come up with 13 waveforms Analysis was done by incorporating the signal processing algorithm using MATLAB software (R2010a) The combination of waveforms induced by different sets of sources is based on impulse response which is defined as system response to an impulse source That is waveforms measured at all receivers are processed to determine impulse responses equivalent to the impulse source given at the location of source S1 The impulse responses are then multiplied by a typical source function ie half-sine wave and converted to waveforms The details of determining impulse responses are as follows first of all for each set of sources transfer functions are computed between receivers 2 to 4 and receiver 1 Receiver 1 is a local reference receiver for computation of transfer functions
Then transfer functions for the global reference Hp1 are recalculated using (6) where the global reference is the first receiver in a measurement array for example the transfer function for receiver no 5 and reference receiver no 1 can be determined as in (7)
Hp1 = = Hpr times Hr1 (6)
H51 = = H54 times H41 = H212 times H411 (7)
Then the linear spectrum of a typical source function S is multiplied to transfer function as in (8) which results in the transfer function between receiver p and a typical source finally waveforms corresponding to a typical source located at the first receiver are determined by (9)
Hp1S = Hp1 times S (8)
hpS = IffTh(Hp1S) (9)
fIguRE 1 Application of beamforming technique to synthetic waveforms determined at a shallow bedrock site (a) synthetic waveforms (b) frequency-wavenumber map and (c) phase velocity dispersion curve
Wave number radmTime sec
frequency hz
rec
eive
r Loc
atio
n m
freq
uenc
y h
z
Phas
e Ve
loci
ty m
sec
1624
RECoVERy of SPATIAL ALIASIng
Beamforming tests have a lower limit in measured wavelengths The lower limit of a wavelength that is minimum wavelength λmin is the reciprocal of maximum wave number kmax as shown in (10) Wave number can be expressed as the gradient of phase angle change Δφ with respect to distance of wave propagation r for two adjacent receivers the largest phase angle to be measured is 2π due to the features of trigonometric algebra receiver spacing is d so that maximum wave number is defined as (11) As a result minimum wavelength is defined to be the same as receiver spacing (12) Spatial aliasing is a phenomenon in which a wave number is decreased by 2πd when the wave number exceeds a maximum wave number kmax This aliasing phenomenon can be described in terms of phase-angle wrapping In trigonometric algebra when a phase angle exceeds 2π trigonometric functions give the same value for the angle subtracted by an angle of 2nπ where n could be 0 1 2 or any integer Therefore the wave number is limited to the upper limit of kmax which gives rise to the problem of aliasing An understanding of this problem leads to an idea of how to overcome aliasing and to recover aliased wave number By replacing Δφ with + 2nπ where is a wrapped phase angle smaller than 2π we proposed to recover the aliased wave number by (13)
λmin = (10)
k = ie kmax = (11)
λmin = d (12)
k =
(n = 012hellip)
(13)
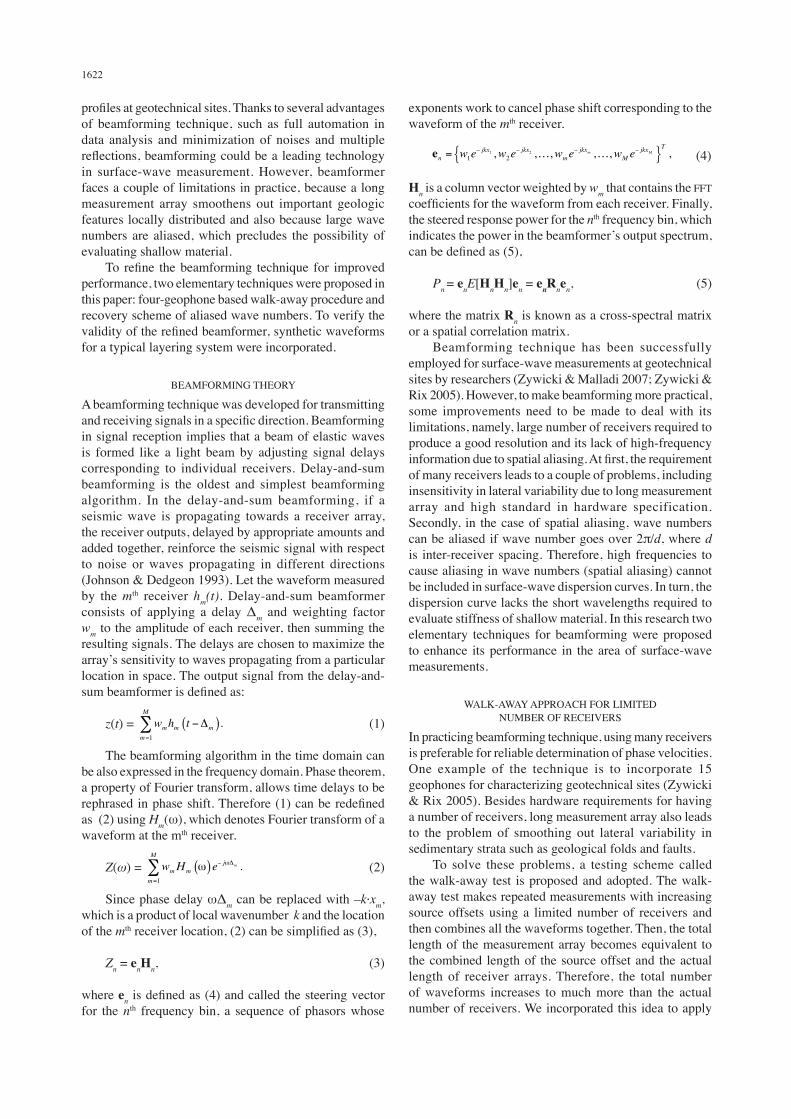
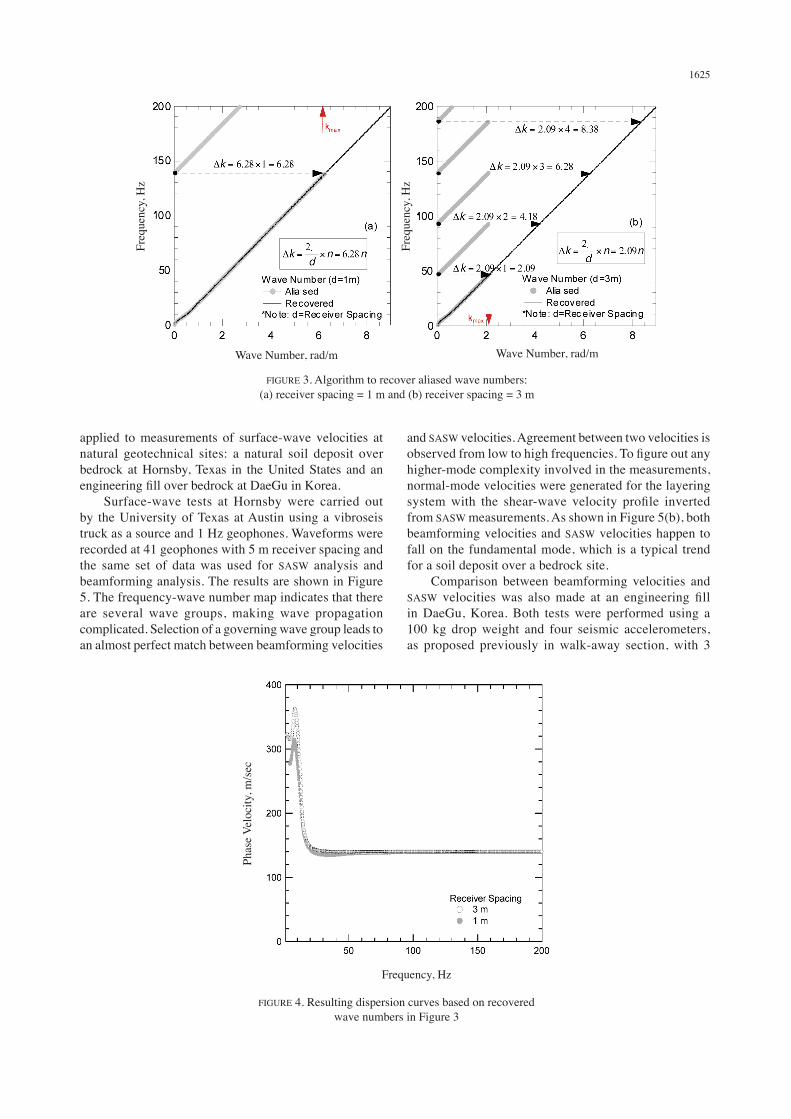
Illustrations on recovery of aliased wave number are given in figure 2 for a three-layer system two sets of 13 waveforms from receivers offset by 1 m and 3 m respectively were generated synthetically by dynamic stiffness modeling Those waveforms were processed by the proposed beamforming algorithm by using MATLAB software (R2010a) to give frequency-wave number maps as shown in figure 3 Discontinued parallel gray lines represent aliased wave numbers and dark solid lines stand for recovered wave numbers Then recovered wave numbers were used with corresponding frequencies to calculate phase velocities by (14) as shown in figure 4
vph = (14)
for verification the maximum wave numbers were retrieved from the unaliased part of the curve denoted as kmax in figure 3 which are 628 and 209 respectively for 1 m and 3 m receiver spacing from the maximum wave numbers minimum wavelengths are then determined by (10) The resulting minimum wavelengths for 1 m and 3 m receiver spacing are 100 m and 302 m respectively Therefore it can be seen clearly that the minimum wavelength in beamforming tests is equivalent to receiver spacing as shown in (12)
fIELD APPLICATIonS
Beamforming technique refined with the walk-away procedure and the spatial-aliasing recovery scheme was
fIguRE 2 Schematic diagram to combine waveforms from a different set of source functions by the proposed walk-away testing method
1625
applied to measurements of surface-wave velocities at natural geotechnical sites a natural soil deposit over bedrock at hornsby Texas in the united States and an engineering fill over bedrock at Daegu in korea Surface-wave tests at Hornsby were carried out by the university of Texas at Austin using a vibroseis truck as a source and 1 Hz geophones Waveforms were recorded at 41 geophones with 5 m receiver spacing and the same set of data was used for SASW analysis and beamforming analysis The results are shown in figure 5 The frequency-wave number map indicates that there are several wave groups making wave propagation complicated Selection of a governing wave group leads to an almost perfect match between beamforming velocities
and SASW velocities Agreement between two velocities is observed from low to high frequencies To figure out any higher-mode complexity involved in the measurements normal-mode velocities were generated for the layering system with the shear-wave velocity profile inverted from SASW measurements As shown in figure 5(b) both beamforming velocities and SASW velocities happen to fall on the fundamental mode which is a typical trend for a soil deposit over a bedrock site Comparison between beamforming velocities and SASW velocities was also made at an engineering fill in Daegu korea Both tests were performed using a 100 kg drop weight and four seismic accelerometers as proposed previously in walk-away section with 3
Wave number radm Wave number radm
freq
uenc
y h
z
freq
uenc
y h
z
fIguRE 3 Algorithm to recover aliased wave numbers (a) receiver spacing = 1 m and (b) receiver spacing = 3 m
frequency hz
Phas
e Ve
loci
ty m
sec
fIguRE 4 Resulting dispersion curves based on recovered wave numbers in figure 3
1626
m receiver spacing At high frequencies over 20 Hz both velocities are in a good agreement but at lower frequencies beamforming velocities are evaluated lower than SASW velocities Judging from the fact that no dominant wave groups are available at frequencies lower than 15 Hz in the f-k map shown in figure 6 the source employed for beamforming tests did not generate low-frequency energy sufficient for sampling deep material Therefore it is apparent that beamforming tests require more surface-wave energy than SASW tests to determine reliable phase velocities in a low frequency region
coNcLuSIoN
The beamforming technique developed for transmitting and receiving signals in a specific direction has been widely used for radar sonar and wireless communications In this paper beamforming technique was refined for surface-wave velocity measurements in order to overcome limitations such as insensitivity to lateral variability and spatial aliasing Additionally the inherent features of surface-wave velocities determined by beamforming technique were investigated using synthetic waveforms for typical layering systems The key findings of this
Wave number radm
freq
uenc
y h
z
frequency hz
Phas
e Ve
loci
ty m
sec
fIguRE 5 Results of beamforming tests at a natural geotechnical site near Hornsby Texas (a) f-k spectrum and (b) phase-velocity dispersion curve
Wave number radm
freq
uenc
y h
z
Wavelength m
Phas
e Ve
loci
ty m
sec
fIguRE 6 Results of beamforming tests a natural geotechnical site in Daegu korea (a) f-k spectrum and (b) phase-velocity dispersion curve
1627
research are as follows recovery of aliased wave numbers by the proposed algorithm was verified to be valid through numerical simulation of beamforming tests based on synthetic waveforms for typical layering systems and phase velocities determined by beamforming analysis proved to be apparent velocities which superpose all the normal modes of surface waves These surface-wave velocities are comparable with velocities determined by the SASW method
ACknoWLEDgEMEnT
This research is part of the project lsquodevelopment of Surface-Wave Technique for geotechnical Structures with Large Aggregate fillsrsquo supported by Korea MLTM and the 2010 chung-Ang university ASEAn young Scientist Scholarship (CAySs) Their financial support is gratefully acknowledged
REfEREnCES
Joh S-H 1996 Advances in interpretation and analysis techniques for Spectral-Analysis-of-Surface-Waves (SASW) method PhD dissertation The university of Texas Austin (unpublished)
Johnson DH amp Dedgeon DE 1993 Array Signal Processing Concepts and Techniques Indiana PTR Prentice-Hall
Stokoe kH Joh S-H amp Woods RD 2004 Some contributions of in situ geophysical measurements to solving geotechnical
engineering problems Proceedings ISC-2 on Geotechnical and Geophysical Site Characterization Viana da fonseca A amp Mayne P W (Eds) Millpress Rotterdam
Stokoe kH II Wright Sg Bay JA amp Roumlesset JM 1994 Characterization of geotechnical sites by SASW method Geophysical Characteristics of Sites Volume prepared by ISSMfE Technical Committee 10 XIII ICSMfE new Delhi India
Zywicki DJ amp Rix gJ 2005 Mitigation of near-field effects for seismic surface wave velocity estimation with cylindrical beamformers Journal of Geotechnical and Geoenvironmental Engineering 131(8) 970-977
Zywicki DJ amp Malladi S 2007 forward-backward cylindrical beamformer and geometric spreading weighting for seismic surface wave parameter estimation Proceedings of Geo-Denver 2007
Department of Civil and Environmental Engineeringchung-Ang university221 heulSeok-dongDongJak-gu Seoul 156-756 republic of Korea
corresponding author email norfarahnadiagmailcom
received 7 May 2012Accepted 6 August 2012
1622
profiles at geotechnical sites Thanks to several advantages of beamforming technique such as full automation in data analysis and minimization of noises and multiple reflections beamforming could be a leading technology in surface-wave measurement However beamformer faces a couple of limitations in practice because a long measurement array smoothens out important geologic features locally distributed and also because large wave numbers are aliased which precludes the possibility of evaluating shallow material To refine the beamforming technique for improved performance two elementary techniques were proposed in this paper four-geophone based walk-away procedure and recovery scheme of aliased wave numbers To verify the validity of the refined beamformer synthetic waveforms for a typical layering system were incorporated
BEAMfoRMIng THEoRy
A beamforming technique was developed for transmitting and receiving signals in a specific direction Beamforming in signal reception implies that a beam of elastic waves is formed like a light beam by adjusting signal delays corresponding to individual receivers Delay-and-sum beamforming is the oldest and simplest beamforming algorithm In the delay-and-sum beamforming if a seismic wave is propagating towards a receiver array the receiver outputs delayed by appropriate amounts and added together reinforce the seismic signal with respect to noise or waves propagating in different directions (Johnson amp Dedgeon 1993) Let the waveform measured by the mth receiver hm(t) Delay-and-sum beamformer consists of applying a delay Δm and weighting factor wm to the amplitude of each receiver then summing the resulting signals The delays are chosen to maximize the arrayrsquos sensitivity to waves propagating from a particular location in space The output signal from the delay-and-sum beamformer is defined as
z(t) = (1)
The beamforming algorithm in the time domain can be also expressed in the frequency domain Phase theorem a property of fourier transform allows time delays to be rephrased in phase shift Therefore (1) can be redefined as (2) using Hm(ω) which denotes fourier transform of a waveform at the mth receiver
Z(ω) = (2)
Since phase delay ωΔm can be replaced with ndashkxm which is a product of local wavenumber k and the location of the mth receiver location (2) can be simplified as (3)
Zn = enHn (3)
where en is defined as (4) and called the steering vector for the nth frequency bin a sequence of phasors whose
exponents work to cancel phase shift corresponding to the waveform of the mth receiver
(4)
Hn is a column vector weighted by wm that contains the ffT coefficients for the waveform from each receiver finally the steered response power for the nth frequency bin which indicates the power in the beamformerrsquos output spectrum can be defined as (5)
Pn = enE[HnHn]en = enRnen (5)
where the matrix Rn is known as a cross-spectral matrix or a spatial correlation matrix Beamforming technique has been successfully employed for surface-wave measurements at geotechnical sites by researchers (Zywicki amp Malladi 2007 Zywicki amp Rix 2005) However to make beamforming more practical some improvements need to be made to deal with its limitations namely large number of receivers required to produce a good resolution and its lack of high-frequency information due to spatial aliasing At first the requirement of many receivers leads to a couple of problems including insensitivity in lateral variability due to long measurement array and high standard in hardware specification Secondly in the case of spatial aliasing wave numbers can be aliased if wave number goes over 2πd where d is inter-receiver spacing Therefore high frequencies to cause aliasing in wave numbers (spatial aliasing) cannot be included in surface-wave dispersion curves In turn the dispersion curve lacks the short wavelengths required to evaluate stiffness of shallow material In this research two elementary techniques for beamforming were proposed to enhance its performance in the area of surface-wave measurements
WALk-AWAy APPRoACH foR LIMITED nuMBER of RECEIVERS
In practicing beamforming technique using many receivers is preferable for reliable determination of phase velocities one example of the technique is to incorporate 15 geophones for characterizing geotechnical sites (Zywicki amp Rix 2005) Besides hardware requirements for having a number of receivers long measurement array also leads to the problem of smoothing out lateral variability in sedimentary strata such as geological folds and faults To solve these problems a testing scheme called the walk-away test is proposed and adopted The walk-away test makes repeated measurements with increasing source offsets using a limited number of receivers and then combines all the waveforms together Then the total length of the measurement array becomes equivalent to the combined length of the source offset and the actual length of receiver arrays Therefore the total number of waveforms increases to much more than the actual number of receivers We incorporated this idea to apply
1623
beamforming technique to the investigation of a limited section with only four receivers The details of walk-away beamforming measurements are illustrated in figure 1 In the figure four independent sources are applied consecutively to a layered system with four receivers deployed at the same spacing Each source produces four waveforms which are combined together to come up with 13 waveforms Analysis was done by incorporating the signal processing algorithm using MATLAB software (R2010a) The combination of waveforms induced by different sets of sources is based on impulse response which is defined as system response to an impulse source That is waveforms measured at all receivers are processed to determine impulse responses equivalent to the impulse source given at the location of source S1 The impulse responses are then multiplied by a typical source function ie half-sine wave and converted to waveforms The details of determining impulse responses are as follows first of all for each set of sources transfer functions are computed between receivers 2 to 4 and receiver 1 Receiver 1 is a local reference receiver for computation of transfer functions
Then transfer functions for the global reference Hp1 are recalculated using (6) where the global reference is the first receiver in a measurement array for example the transfer function for receiver no 5 and reference receiver no 1 can be determined as in (7)
Hp1 = = Hpr times Hr1 (6)
H51 = = H54 times H41 = H212 times H411 (7)
Then the linear spectrum of a typical source function S is multiplied to transfer function as in (8) which results in the transfer function between receiver p and a typical source finally waveforms corresponding to a typical source located at the first receiver are determined by (9)
Hp1S = Hp1 times S (8)
hpS = IffTh(Hp1S) (9)
fIguRE 1 Application of beamforming technique to synthetic waveforms determined at a shallow bedrock site (a) synthetic waveforms (b) frequency-wavenumber map and (c) phase velocity dispersion curve
Wave number radmTime sec
frequency hz
rec
eive
r Loc
atio
n m
freq
uenc
y h
z
Phas
e Ve
loci
ty m
sec
1624
RECoVERy of SPATIAL ALIASIng
Beamforming tests have a lower limit in measured wavelengths The lower limit of a wavelength that is minimum wavelength λmin is the reciprocal of maximum wave number kmax as shown in (10) Wave number can be expressed as the gradient of phase angle change Δφ with respect to distance of wave propagation r for two adjacent receivers the largest phase angle to be measured is 2π due to the features of trigonometric algebra receiver spacing is d so that maximum wave number is defined as (11) As a result minimum wavelength is defined to be the same as receiver spacing (12) Spatial aliasing is a phenomenon in which a wave number is decreased by 2πd when the wave number exceeds a maximum wave number kmax This aliasing phenomenon can be described in terms of phase-angle wrapping In trigonometric algebra when a phase angle exceeds 2π trigonometric functions give the same value for the angle subtracted by an angle of 2nπ where n could be 0 1 2 or any integer Therefore the wave number is limited to the upper limit of kmax which gives rise to the problem of aliasing An understanding of this problem leads to an idea of how to overcome aliasing and to recover aliased wave number By replacing Δφ with + 2nπ where is a wrapped phase angle smaller than 2π we proposed to recover the aliased wave number by (13)
λmin = (10)
k = ie kmax = (11)
λmin = d (12)
k =
(n = 012hellip)
(13)
Illustrations on recovery of aliased wave number are given in figure 2 for a three-layer system two sets of 13 waveforms from receivers offset by 1 m and 3 m respectively were generated synthetically by dynamic stiffness modeling Those waveforms were processed by the proposed beamforming algorithm by using MATLAB software (R2010a) to give frequency-wave number maps as shown in figure 3 Discontinued parallel gray lines represent aliased wave numbers and dark solid lines stand for recovered wave numbers Then recovered wave numbers were used with corresponding frequencies to calculate phase velocities by (14) as shown in figure 4
vph = (14)
for verification the maximum wave numbers were retrieved from the unaliased part of the curve denoted as kmax in figure 3 which are 628 and 209 respectively for 1 m and 3 m receiver spacing from the maximum wave numbers minimum wavelengths are then determined by (10) The resulting minimum wavelengths for 1 m and 3 m receiver spacing are 100 m and 302 m respectively Therefore it can be seen clearly that the minimum wavelength in beamforming tests is equivalent to receiver spacing as shown in (12)
fIELD APPLICATIonS
Beamforming technique refined with the walk-away procedure and the spatial-aliasing recovery scheme was
fIguRE 2 Schematic diagram to combine waveforms from a different set of source functions by the proposed walk-away testing method
1625
applied to measurements of surface-wave velocities at natural geotechnical sites a natural soil deposit over bedrock at hornsby Texas in the united States and an engineering fill over bedrock at Daegu in korea Surface-wave tests at Hornsby were carried out by the university of Texas at Austin using a vibroseis truck as a source and 1 Hz geophones Waveforms were recorded at 41 geophones with 5 m receiver spacing and the same set of data was used for SASW analysis and beamforming analysis The results are shown in figure 5 The frequency-wave number map indicates that there are several wave groups making wave propagation complicated Selection of a governing wave group leads to an almost perfect match between beamforming velocities
and SASW velocities Agreement between two velocities is observed from low to high frequencies To figure out any higher-mode complexity involved in the measurements normal-mode velocities were generated for the layering system with the shear-wave velocity profile inverted from SASW measurements As shown in figure 5(b) both beamforming velocities and SASW velocities happen to fall on the fundamental mode which is a typical trend for a soil deposit over a bedrock site Comparison between beamforming velocities and SASW velocities was also made at an engineering fill in Daegu korea Both tests were performed using a 100 kg drop weight and four seismic accelerometers as proposed previously in walk-away section with 3
Wave number radm Wave number radm
freq
uenc
y h
z
freq
uenc
y h
z
fIguRE 3 Algorithm to recover aliased wave numbers (a) receiver spacing = 1 m and (b) receiver spacing = 3 m
frequency hz
Phas
e Ve
loci
ty m
sec
fIguRE 4 Resulting dispersion curves based on recovered wave numbers in figure 3
1626
m receiver spacing At high frequencies over 20 Hz both velocities are in a good agreement but at lower frequencies beamforming velocities are evaluated lower than SASW velocities Judging from the fact that no dominant wave groups are available at frequencies lower than 15 Hz in the f-k map shown in figure 6 the source employed for beamforming tests did not generate low-frequency energy sufficient for sampling deep material Therefore it is apparent that beamforming tests require more surface-wave energy than SASW tests to determine reliable phase velocities in a low frequency region
coNcLuSIoN
The beamforming technique developed for transmitting and receiving signals in a specific direction has been widely used for radar sonar and wireless communications In this paper beamforming technique was refined for surface-wave velocity measurements in order to overcome limitations such as insensitivity to lateral variability and spatial aliasing Additionally the inherent features of surface-wave velocities determined by beamforming technique were investigated using synthetic waveforms for typical layering systems The key findings of this
Wave number radm
freq
uenc
y h
z
frequency hz
Phas
e Ve
loci
ty m
sec
fIguRE 5 Results of beamforming tests at a natural geotechnical site near Hornsby Texas (a) f-k spectrum and (b) phase-velocity dispersion curve
Wave number radm
freq
uenc
y h
z
Wavelength m
Phas
e Ve
loci
ty m
sec
fIguRE 6 Results of beamforming tests a natural geotechnical site in Daegu korea (a) f-k spectrum and (b) phase-velocity dispersion curve
1627
research are as follows recovery of aliased wave numbers by the proposed algorithm was verified to be valid through numerical simulation of beamforming tests based on synthetic waveforms for typical layering systems and phase velocities determined by beamforming analysis proved to be apparent velocities which superpose all the normal modes of surface waves These surface-wave velocities are comparable with velocities determined by the SASW method
ACknoWLEDgEMEnT
This research is part of the project lsquodevelopment of Surface-Wave Technique for geotechnical Structures with Large Aggregate fillsrsquo supported by Korea MLTM and the 2010 chung-Ang university ASEAn young Scientist Scholarship (CAySs) Their financial support is gratefully acknowledged
REfEREnCES
Joh S-H 1996 Advances in interpretation and analysis techniques for Spectral-Analysis-of-Surface-Waves (SASW) method PhD dissertation The university of Texas Austin (unpublished)
Johnson DH amp Dedgeon DE 1993 Array Signal Processing Concepts and Techniques Indiana PTR Prentice-Hall
Stokoe kH Joh S-H amp Woods RD 2004 Some contributions of in situ geophysical measurements to solving geotechnical
engineering problems Proceedings ISC-2 on Geotechnical and Geophysical Site Characterization Viana da fonseca A amp Mayne P W (Eds) Millpress Rotterdam
Stokoe kH II Wright Sg Bay JA amp Roumlesset JM 1994 Characterization of geotechnical sites by SASW method Geophysical Characteristics of Sites Volume prepared by ISSMfE Technical Committee 10 XIII ICSMfE new Delhi India
Zywicki DJ amp Rix gJ 2005 Mitigation of near-field effects for seismic surface wave velocity estimation with cylindrical beamformers Journal of Geotechnical and Geoenvironmental Engineering 131(8) 970-977
Zywicki DJ amp Malladi S 2007 forward-backward cylindrical beamformer and geometric spreading weighting for seismic surface wave parameter estimation Proceedings of Geo-Denver 2007
Department of Civil and Environmental Engineeringchung-Ang university221 heulSeok-dongDongJak-gu Seoul 156-756 republic of Korea
corresponding author email norfarahnadiagmailcom
received 7 May 2012Accepted 6 August 2012