Embed Size (px)
Citation preview
Paul Feasey ACCT11059 06/06/19
ASS#2 Step 7 – Contribution Margin
Contribution Margin – the calculation process
Initially this step concerned me. Not the mechanics of it, as Contribution Margin is a simple calculation of Sale – Variable Costs. It represents how much a particular product or service contributes to the overall profit of the company. My concern was more about what information can be used to carry out this step in the assignment effectively. GallifordTry has three operating units, Lindon Homes, Partnerships & Regeneration and Construction. Lindon Homes build a range of Private Homes and Affordable Homes. Partnerships & Regeneration work with housing trusts and local councils to build and refit/repurpose a range of dwellings. The Construction group does large infrastructure projects. The question was how to pick a product/service from this mix that is relevant and would give a reasonable indication of contribution margin. More importantly I wanted to do this without guessing. There was information in the 2018 report that would surely point the way, but initially I could not see it. Inspiration came, as it generally does, when out running, and I could see a way forward.
The annual report details the performance of each business unit. This includes the average price of the land purchased for the company land bank, the total number of homes built by both Lindon Homes and Partnerships and Regeneration along with the average selling price of each unit The final piece of the puzzle was the gross contribution made to the group by these parts of the business. Ideally, I would have like to have found similar information for the Construction group. However, the report makes it clear that the contribution of construction is considerably less than the house building parts of the firm. To make it easier for me I have not considered the construction group in this exercise.
I’ve taken a relatively simple approach and added a few assumptions in my calculations. The calculations can be seen in the table at the end of this document. The number of units sold are categorised as affordable homes, private homes and sales from partnership and regeneration. These are three very different sectors of the UK housing industry. In every new development there is the expectation that the developer will build a mixture of “high end” and entry level housing. This is the difference between private and affordable. This difference is reflected in the size, fit out, location and selling price of these houses. The financial report detailed that the average selling price for a private house is almost three times that of an affordable home.
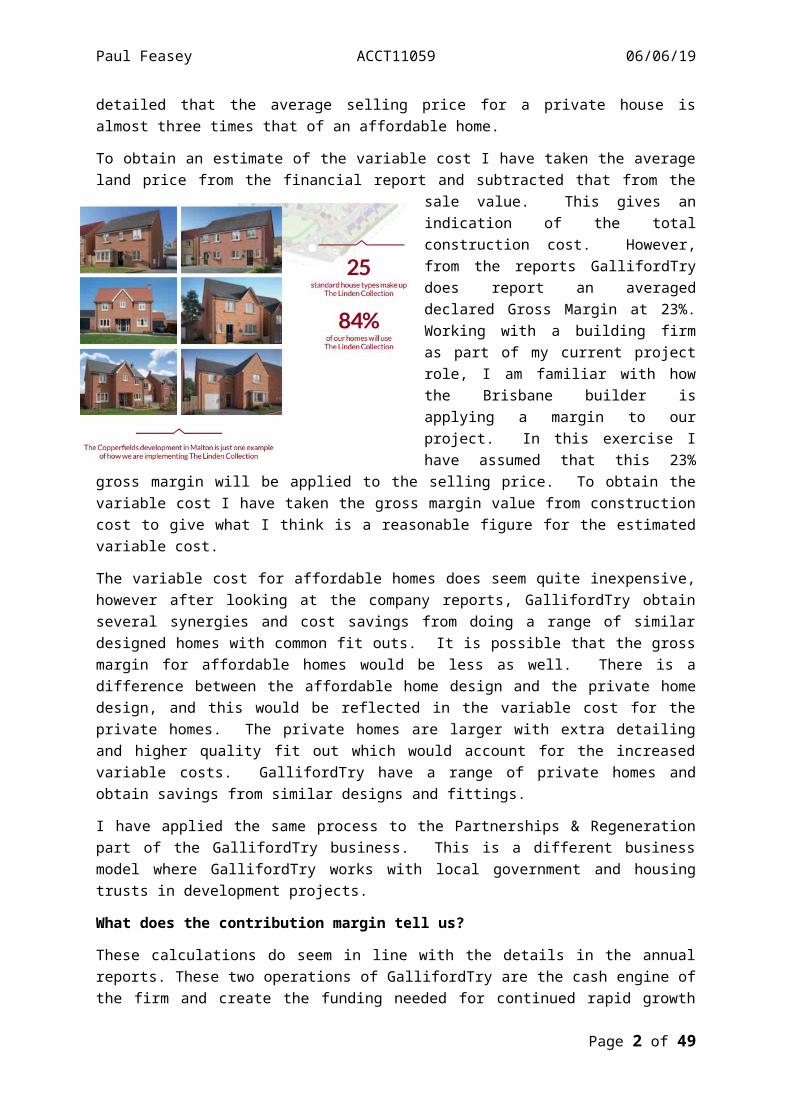
To obtain an estimate of the variable cost I have taken the average land price from the financial report and subtracted that from the sale value. This gives an indication of the total construction
cost. However, from the reports GallifordTry does report an averaged declared Gross Margin at 23%. Working with a building firm as part of my current project role, I am familiar with how the Brisbane builder is applying a margin to our project. In this exercise I have assumed that this 23% gross margin will be applied to the selling price. To obtain the variable cost I have taken the gross margin value from construction cost to give what I think is a reasonable figure for the estimated variable cost.
Page 1 of 34
Paul Feasey ACCT11059 06/06/19
The variable cost for affordable homes does seem quite inexpensive, however after looking at the company reports, GallifordTry obtain several synergies and cost savings from doing a range of similar designed homes with common fit outs. It is possible that the gross margin for affordable homes would be less as well. There is a difference between the affordable home design and the private home design, and this would be reflected in the variable cost for the private homes. The private homes are larger with extra detailing and higher quality fit out which would account for the increased variable costs. GallifordTry have a range of private homes and obtain savings from similar designs and fittings.
I have applied the same process to the Partnerships & Regeneration part of the GallifordTry business. This is a different business model where GallifordTry works with local government and housing trusts in development projects.
What does the contribution margin tell us?
These calculations do seem in line with the details in the annual reports. These two operations of GallifordTry are the cash engine of the firm and create the funding needed for continued rapid growth activities of house building. As would be expected private homes and partnerships & regeneration have the highest contribution margin. I would consider that the preferred approach of GallifordTry would be to reduce the number of affordable homes and increase the number of private homes and partnerships & regeneration sales as these do have the best contribution margin. In both operations there is either a direct sale to a new homeowner or a sale to a housing trust. In looking at the figures I suspect GallifordTry would be comfortable with the contribution that these operations are making to the firm. There is an acute shortage of housing the UK and indications from the annual reports that there are enough sites in the landbank and financial inducements for buyers to continue this type of operation comfortably for several years to come.
Possible constraints
GallifordTry are aware of potential constraints and detail these in the annual reports. Since the 2018 report was published Brexit continues to be unresolved and with it the future of skilled workers from the Euro Zone. Recently the firm has had a change of CEO that may have an impact, the new CEO is an internal appointment which may reduce the transition period. Recent press reports indicate that there are issues within the UK construction industry which are impacting the construction arm of the firm. On 19th April, following the announcement of more exceptional costs related to a project in Scotland, GallifordTry issued another profit warning. Another construction firm in the UK, the Kier Group, posted half-year losses of £35.5million per month, further indicating that the construction sector in the UK has significant challenges. With this uncertainty in the construction sector GallifordTry may hope to further rely on the home building and regeneration operations to remain profitable. GallifordTry are in a good position to increase their homebuilding operations and they have been increasing the output year on year. The planning and approvals process as dictated by central and local governments are a constraint in this growth pattern, this was also highlighted in the 2018 report.
While talking to my parents recently I was reminded of a development in their area of Buckinghamshire, a significantly wealthy county located west of London. A developer is building an estate on the former army base. Part of the planning approval process was a requirement for a certain number of private and affordable homes. It appears that the developer has built and sold the private homes and has now stopped work as the residents in the private homes and the developer no longer wish to have affordable homes in the area. This is resulting in litigation
Page 2 of 34

Paul Feasey ACCT11059 06/06/19
proceedings between the county council and the developer. To draw from this, a potential constraint for GallifordTry is being forced to build more affordable homes than private homes, thereby reducing the benefits obtained from the higher end housing.
Conclusion
Within its three operating units GallifordTry have two very profitable operations in Lindon Homes building private houses and dwellings developed by Partnerships & Regeneration. These businesses have increasing revenue year on year, very good contribution margins and operate in an area of need and growth within the UK economy. It will be interesting to see what the impact of the challenges in construction have on the firm’s performance and if the continual political instability within the UK is resolved satisfactorily to provide a benefit to the business performance.
Post Script – when I saw I had a UK construction company I was bit “meh”. As it happens, I think doing the unit with a UK firm this has come to be a real advantage. I’ve been able to draw from the experience and knowledge of the issues in the UK, my knowledge of owning homes in the UK and where to find supporting information to enhance my assignments. I suspect I would have done the same for any company, but having one closer to (my original) home has been a bonus.
Page 3 of 34

Paul Feasey ACCT11059 06/06/19
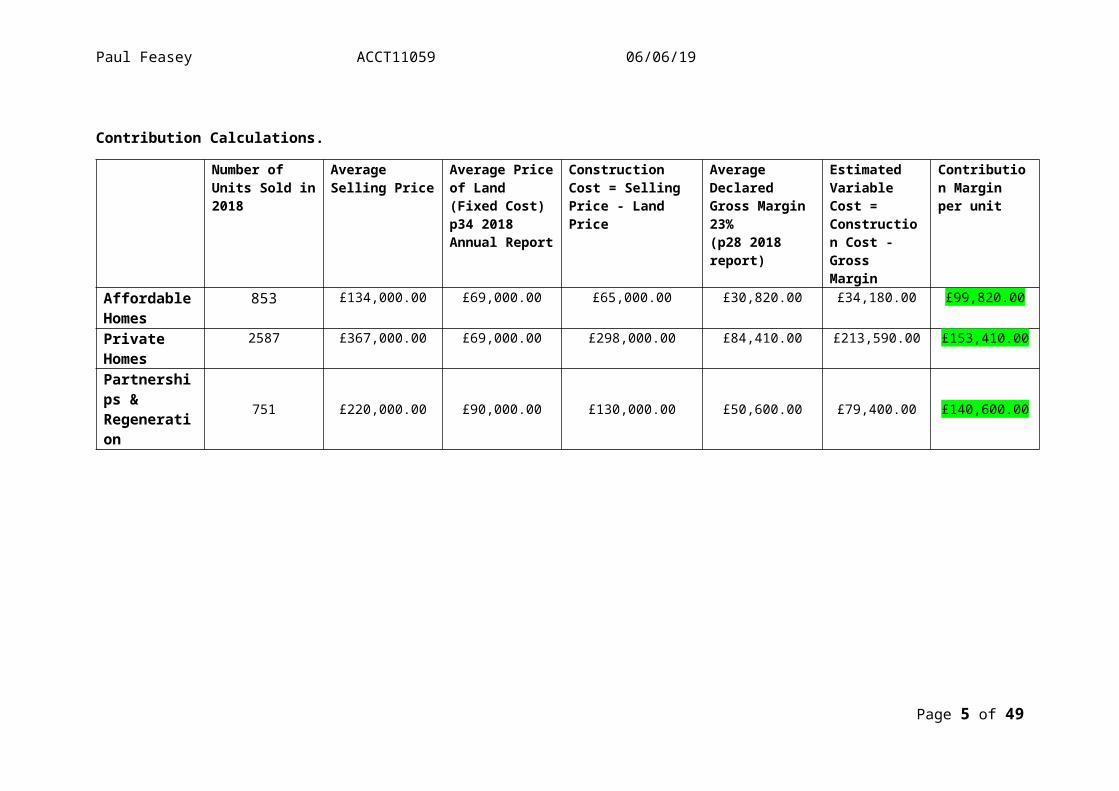
Contribution Calculations.
Number of Units Sold in 2018
Average Selling Price
Average Price of Land (Fixed Cost) p34 2018 Annual Report
Construction Cost = Selling Price - Land Price
Average Declared Gross Margin 23% (p28 2018 report)
Estimated Variable Cost = Construction Cost - Gross Margin
Contribution Margin per unit
Affordable Homes
853 £134,000.00 £69,000.00 £65,000.00 £30,820.00 £34,180.00 £99,820.00
Private Homes 2587 £367,000.00 £69,000.00 £298,000.00 £84,410.00 £213,590.00 £153,410.00
Partnerships & Regeneration 751 £220,000.00 £90,000.00 £130,000.00 £50,600.00 £79,400.00 £140,600.00
Page 4 of 34
Paul Feasey ACCT11059
ASS#2 Step 8 – Ratios GallifordTry
Step 8, the process of calculating ratios based on the details in the financial and restated financial statements. I consider myself reasonably proficient with spreadsheets, so I did not find the mechanics of following the video and calculating out the ratios particularly arduous. As I’d followed Maria’s previous instructions of labelling OI, NOA etc. it was all fairly straightforward. The challenge is interpreting the information and there were some odd numbers that required some deeper thought. You will note that 2017 was a particularly bad year in a number of the sections. I attribute this to some exceptional charges that resulted from project overruns. The company opted to pay these charges which had a negative effect on the profitability. In 2018 there were more exceptional charges, which were not paid through retained cash, but through sale of shares and borrowing. This had a positive effect on several of the ratios.
To start at the top:
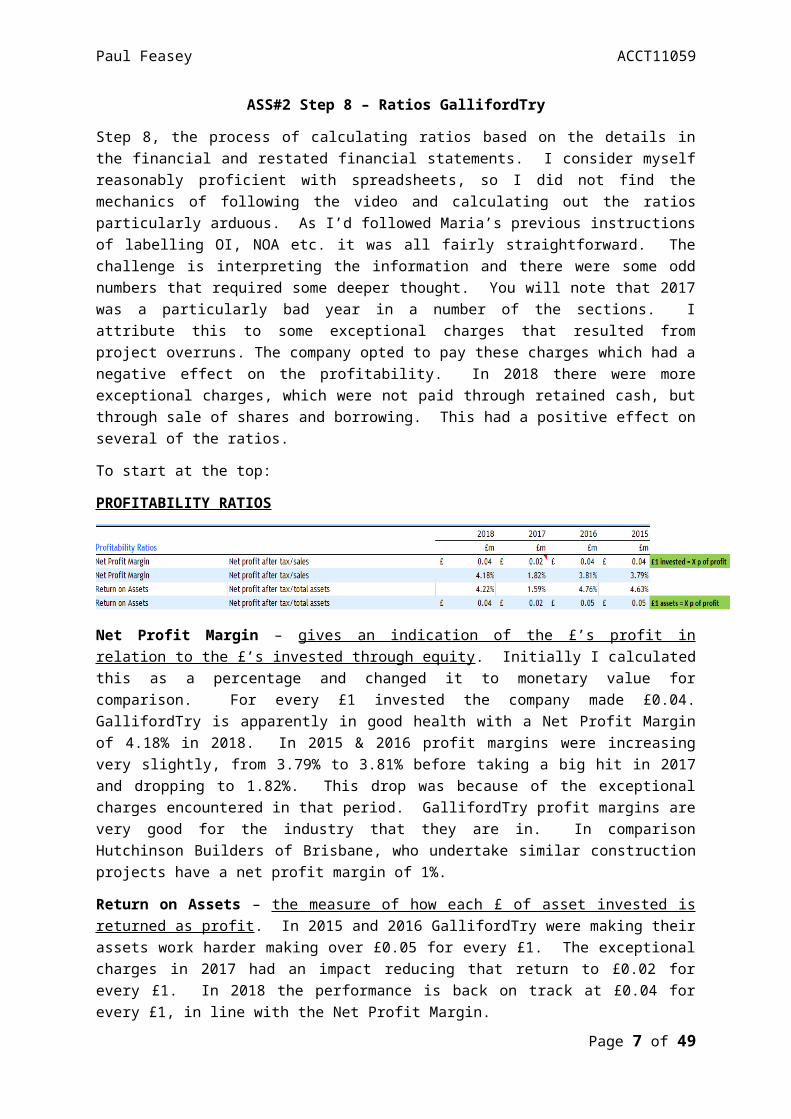
PROFITABILITY RATIOS
Net Profit Margin – gives an indication of the £’s profit in relation to the £’s invested through equity. Initially I calculated this as a percentage and changed it to monetary value for comparison. For every £1 invested the company made £0.04. GallifordTry is apparently in good health with a Net Profit Margin of 4.18% in 2018. In 2015 & 2016 profit margins were increasing very slightly, from 3.79% to 3.81% before taking a big hit in 2017 and dropping to 1.82%. This drop was because of the exceptional charges encountered in that period. GallifordTry profit margins are very good for the industry that they are in. In comparison Hutchinson Builders of Brisbane, who undertake similar construction projects have a net profit margin of 1%.
Return on Assets – the measure of how each £ of asset invested is returned as profit. In 2015 and 2016 GallifordTry were making their assets work harder making over £0.05 for every £1. The exceptional charges in 2017 had an impact reducing that return to £0.02 for every £1. In 2018 the performance is back on track at £0.04 for every £1, in line with the Net Profit Margin.
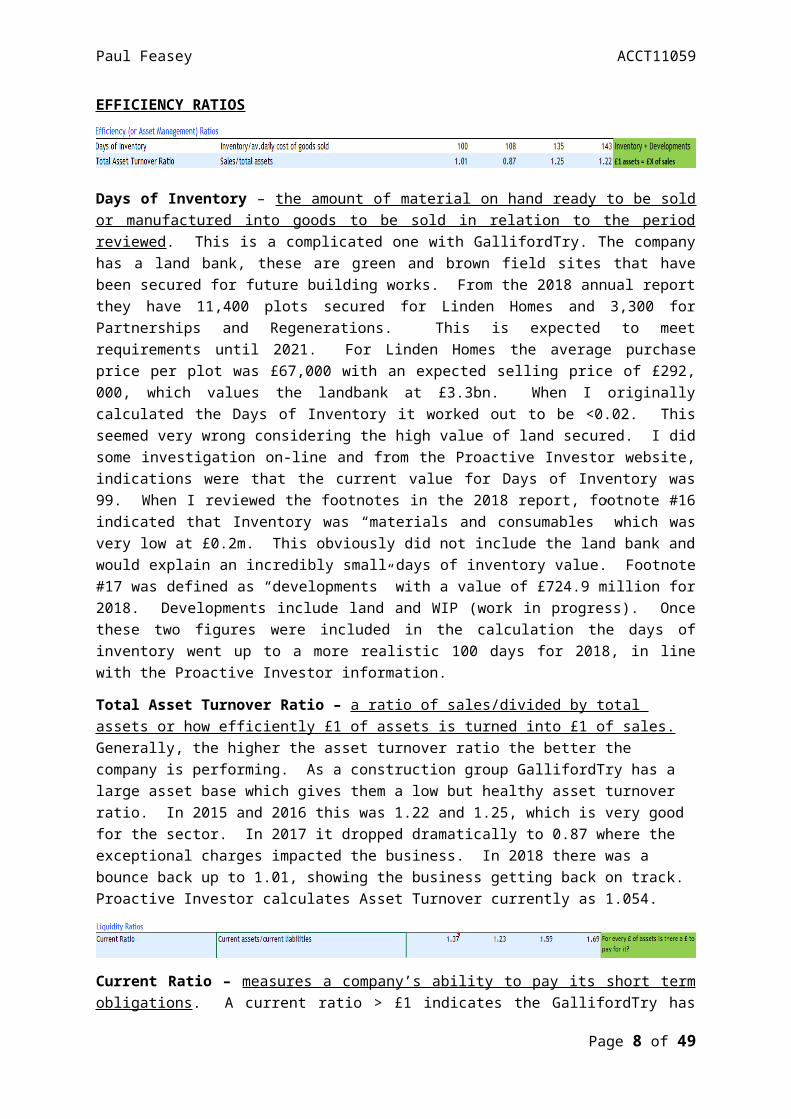
EFFICIENCY RATIOS
Days of Inventory – the amount of material on hand ready to be sold or manufactured into goods to be sold in relation to the period reviewed. This is a complicated one with GallifordTry. The company has a land bank, these are green and brown field sites that have been secured for future building works. From the 2018 annual report they have 11,400 plots secured for Linden Homes and 3,300 for Partnerships and Regenerations. This is expected to meet requirements until 2021. For Linden Homes the average purchase price per plot was £67,000 with an expected selling price of £292, 000, which values the landbank at £3.3bn. When I originally calculated the Days of Inventory it worked out to be <0.02. This seemed very wrong considering the high value of land secured. I did some investigation on-line and from the Proactive Investor website, indications were that the current
Page 5 of 34

Paul Feasey ACCT11059
value for Days of Inventory was 99. When I reviewed the footnotes in the 2018 report, footnote #16 indicated that Inventory was “materials and consumables” which was very low at £0.2m. This obviously did not include the land bank and would explain an incredibly small days of inventory value. Footnote #17 was defined as “developments” with a value of £724.9 million for 2018. Developments include land and WIP (work in progress). Once these two figures were included in the calculation the days of inventory went up to a more realistic 100 days for 2018, in line with the Proactive Investor information.
Total Asset Turnover Ratio – a ratio of sales/divided by total assets or how efficiently £1 of assets is turned into £1 of sales. Generally, the higher the asset turnover ratio the better the company is performing. As a construction group GallifordTry has a large asset base which gives them a low but healthy asset turnover ratio. In 2015 and 2016 this was 1.22 and 1.25, which is very good for the sector. In 2017 it dropped dramatically to 0.87 where the exceptional charges impacted the business. In 2018 there was a bounce back up to 1.01, showing the business getting back on track. Proactive Investor calculates Asset Turnover currently as 1.054.
Current Ratio – measures a company’s ability to pay its short term obligations. A current ratio > £1 indicates the GallifordTry has the capital on hand to remain solvent. This was made clear in the 2018 report where GallifordTry could have used its cash reserves to pay the exceptional charges but chose to raise equity through a share offering. Their current ratio remains healthy > £1 but has decreased since 2015. There have been a number of exceptional charges in recent years and from the BBC News reports in April, likely to be more this year as the firm announced another profit warning. The construction part of the firm is encountering more delays and costs associated with a delayed bridge project in Scotland.
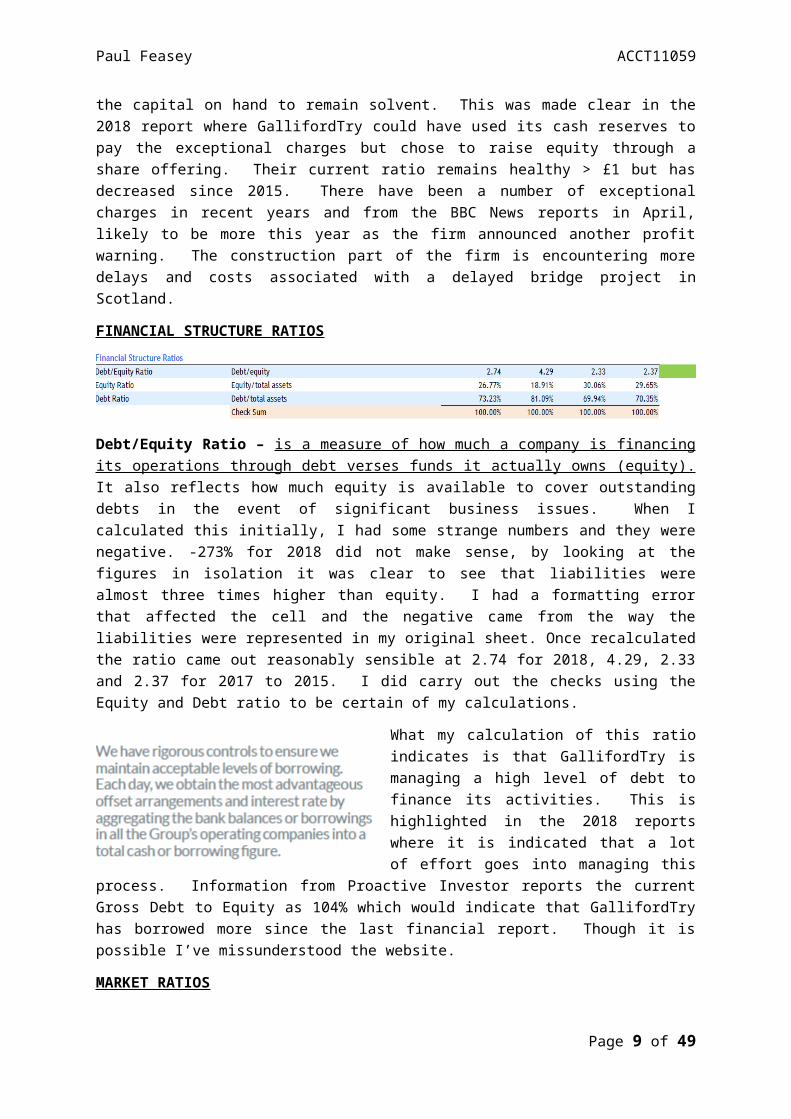
FINANCIAL STRUCTURE RATIOS
Debt/Equity Ratio – is a measure of how much a company is financing its operations through debt verses funds it actually owns (equity). It also reflects how much equity is available to cover outstanding debts in the event of significant business issues. When I calculated this initially, I had some strange numbers and they were negative. -273% for 2018 did not make sense, by looking at the figures in isolation it was clear to see that liabilities were almost three times higher than equity. I had a formatting error that affected the cell and the negative came from the way the liabilities were represented in my original sheet. Once recalculated the ratio came out reasonably sensible at 2.74 for 2018, 4.29, 2.33 and 2.37 for 2017 to 2015. I did carry out the checks using the Equity and Debt ratio to be certain of my calculations.
What my calculation of this ratio indicates is that GallifordTry is managing a high level of debt to finance its activities. This is highlighted in the 2018 reports where it is indicated that a lot of effort goes into managing this process. Information from Proactive Investor reports the current Gross Debt to Equity as 104% which would indicate that
Page 6 of 34
Paul Feasey ACCT11059
GallifordTry has borrowed more since the last financial report. Though it is possible I’ve missunderstood the website.
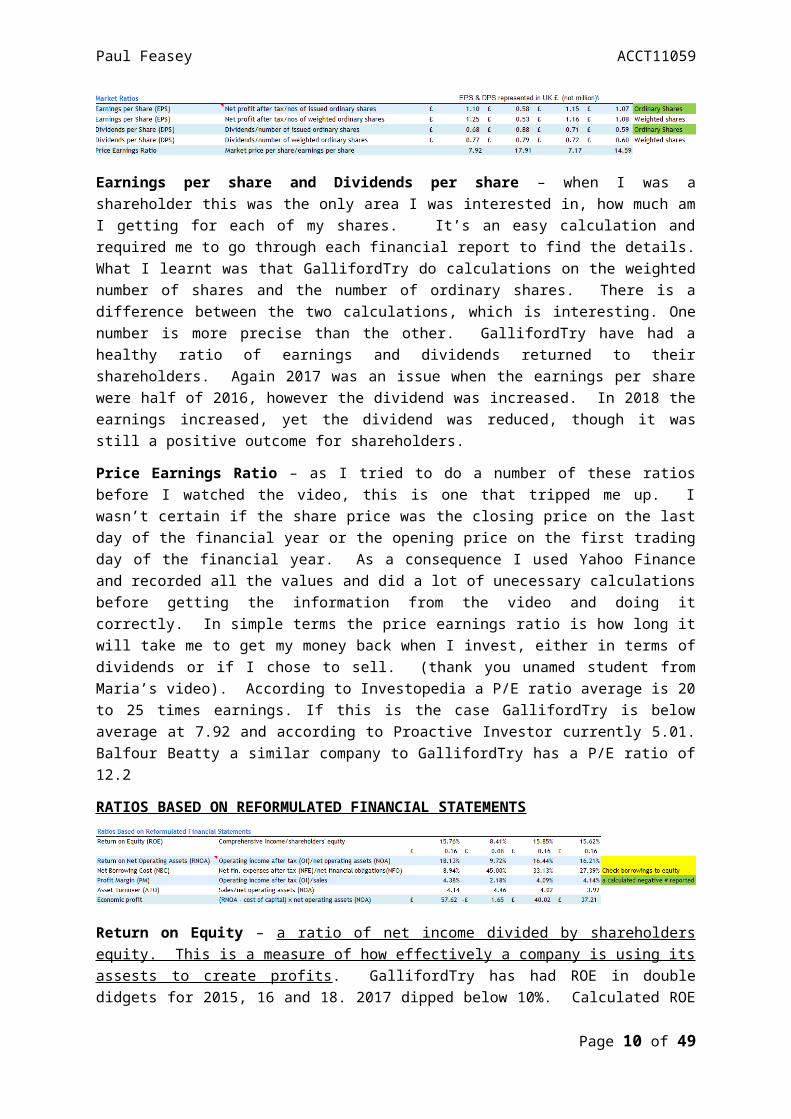
MARKET RATIOS
Earnings per share and Dividends per share – when I was a shareholder this was the only area I was interested in, how much am I getting for each of my shares. It’s an easy calculation and required me to go through each financial report to find the details. What I learnt was that GallifordTry do calculations on the weighted number of shares and the number of ordinary shares. There is a difference between the two calculations, which is interesting. One number is more precise than the other. GallifordTry have had a healthy ratio of earnings and dividends returned to their shareholders. Again 2017 was an issue when the earnings per share were half of 2016, however the dividend was increased. In 2018 the earnings increased, yet the dividend was reduced, though it was still a positive outcome for shareholders.
Price Earnings Ratio – as I tried to do a number of these ratios before I watched the video, this is one that tripped me up. I wasn’t certain if the share price was the closing price on the last day of the financial year or the opening price on the first trading day of the financial year. As a consequence I used Yahoo Finance and recorded all the values and did a lot of unecessary calculations before getting the information from the video and doing it correctly. In simple terms the price earnings ratio is how long it will take me to get my money back when I invest, either in terms of dividends or if I chose to sell. (thank you unamed student from Maria’s video). According to Investopedia a P/E ratio average is 20 to 25 times earnings. If this is the case GallifordTry is below average at 7.92 and according to Proactive Investor currently 5.01. Balfour Beatty a similar company to GallifordTry has a P/E ratio of 12.2
RATIOS BASED ON REFORMULATED FINANCIAL STATEMENTS
Return on Equity – a ratio of net income divided by shareholders equity. This is a measure of how effectively a company is using its assests to create profits. GallifordTry has had ROE in double didgets for 2015, 16 and 18. 2017 dipped below 10%. Calculated ROE is similar to the current ROE as indicated by Proactive Investor, which is positive. In comparison to a similar compant Balfour Beatty has a ROE of 11.8% indicated GallifordTry is doing a better job of using it’s assets.
Return on Net Operating Assets – return on net assets compares a firms net income with it’s assets as an enabler for investors to determine how well the company is generating profit from its assets. The RNOA, the return on net operating assets is determing how the assets allocated to operational activities are generating profit. In this ratio we have removed any benefit or liability that may be provided by financial assets. In much the same way as return on equity the higher the ratio the better the performance. The calculations here show a healthy RNOA with operational assets being effectively utilised. (A thank you is due here to Stephen Hentschke, who spotted this secton on RNOA missing from the draft)
Page 7 of 34
Paul Feasey ACCT11059
Net Borrowing Costs – is an indication of the costs arising from company borrowing. From what I can understand from my ratios GallifordTry increased borrowing in 2015, 16 and 17. In 2018 capital was raised through shares, indications are that this was done to reduce the need for borrowing. I have a note on my ratio sheet to check borrowings to equity. Unfortunately I have no idea what I was thinking at the time when I wrote this down. The firm does have extensive borrowings in respect to equity and do spend a lot of time managing interest rate swaps to get the best deal. The calculation is correct, not entirely sure what the impact is, apart from lower borrowing may be positive, alternatively more borrowing can reduce profit from paying interest payments and therefore reduce tax costs. Though as the tax cost seem quite similar across the reporting years I’m not confident that I actually know what I’m talking about at this point. This is the only ratio that has me truly perplexed, which is frankly rather annoying.
Profit Margin – in my original calculation I had a negative value in here, which didn’t make a lot of sense. I do recall Marie saying something about negative numbers and this must have been one of them. When I removed the negative, it made a lot more sense as a positive number. This restated value is in line with the original.
Asset Turnover – this is interesting as the value obtained from the restated sheets are four times higher than the original total asset turnover. This indicates to me that when only the operational assets remain on the balance sheet these operational assets are being used far more efficiently in creating value than the total assets.
Economic Profit – a measure of the profit or loss between the revenue received from the sale of an output and the cost of the inputs used. I scoured all of the financial reports looking for a WACC rate. While it was mentioned there was no figure asigned, so for the caclulation I used Maria’s 10% as recommended. Looking at this final ratio on the sheet it appears that GallifordTry returns double digit growth in EP, indicating a healthy company performance. GallifordTry is delivering consistent returns in EP which indicate that capital investment decisions are being managed well. As mentioned earlier in this comentary the firm appears to have low overall capital costs and high assets which would have a positive impact on the EP. If they were inesting heavily in new facilities there would be a reductionin EP in relation to the WACC rate and the RNOA. The RNOA is consistently in the mid to high teens indicating effective asset management and low wastage. There are several areas in the 2018 report where the importance of effective asset and capital investment are highlighted, indicating that GallifordTry keeps a close eye on the EP of the firm. The exception to this consistent performance would be 2017 where the exceptional items (project overruns, partnership failure with Carilion) resulted in significant cost pressure.
Conclusion
As I’d followed the instructions during the restating process linking the correct cells was straightforward and I didn’t encounter any difficulties with this process. The challenge came in confirming that the value shown did make sense and was relatable to comparitive busineses. I had a few cells with a monatary value or percentage value that didn’t make sense, once I’d reveiwed the cells and identfied the issues, it was all clear. Originally days of inventory was significantly out, as the inventory value was extermely low, however when combined with the landbank value, the days of inventory value became realistic. I have been fortunate to find the Proactive Investor website which was a great help in confirming that my calculations were in the right order of magnitude. I’m now confident that 99% of the cells are accurate and my explanations are sound. There is one area that I’m not entirely confident of is Net Borrowing Cost, it looks right, however I’m not sure what I’m comparing it against.
Page 8 of 34
Paul Feasey ACCT11059
ASS#2 Step 9 – Capital Investment Decisions
GallifordTry is a home building and construction company, this poses a challenge when considering investment decisions that the company may be required to make. With home building I assume that there will be a considerable amount of low-level investment, in site infrastructure, scaffold, ladders, cement mixers, site vehicles, etc. Some of these may even be hired from specialist firms. In relation to the overall company, these investment items would be insignificant in themselves, as they are likely purchased within the individual operating units. The complexity would probably increase if GallifordTry was to purchase, for example, a fleet of site vehicles for the entire group of companies. With regards to the construction arm of the company it was difficult to ascertain from the company reports if there were any significant investments in the heavy machinery required for road or bridge building. As I have no prior knowledge of the value of these items, I considered this an avenue appropriate to pursue.
What GallifordTry has done in the past is purchase additional companies. These purchases are indicated in the annual reports. For this exercise I decided to use these prior investments as the basis for the calculations. The two investments that I have considered are Drew Smith and Miller Construction. Similar businesses that fit within the GallifordTry portfolio, though Miller Construction has a revenue 10 times greater than Drew Smith. In 2017 Drew Smith, a home building operation in the South of England, was purchase for an undisclosed sum. By reviewing previous purchases and relating their revenue to profit and purchase price I estimated that Drew Smith may have been purchased for £10million. Miller Construction, an infrastructure construction company, was purchased in 2014 for £16.6million. These acquisitions would be seen as a long-term investment and within the GallifordTry group their useful life would be expected to be beyond 10 years. I am assuming the expectation would also be that their residual value to the group would decrease to a low amount over time. The residual value would only be recalculated based on their contribution to group performance should GallifordTry have a requirement to dispose of them in the future. For the calculation I have declared residual value to be half the original cost.
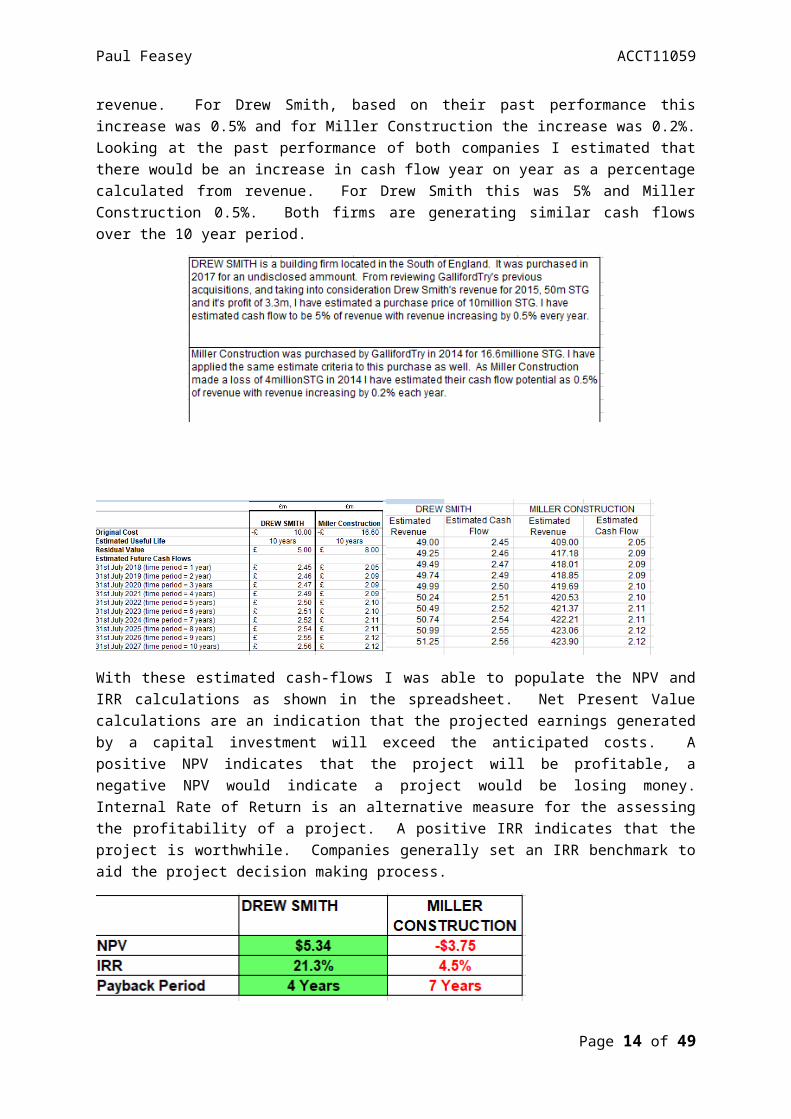
I have no idea what the potential cash flow of these business would be, and I did not want to guess. To give some structure to the process I estimated that each firm would have a yearly increase in revenue. For Drew Smith, based on their past performance this increase was 0.5% and for Miller Construction the increase was 0.2%. Looking at the past performance of both companies I estimated that there would be an increase in cash flow year on year as a percentage calculated from revenue. For Drew Smith this was 5% and Miller Construction 0.5%. Both firms are generating similar cash flows over the 10 year period.
Page 9 of 34
Paul Feasey ACCT11059
With these estimated cash-flows I was able to populate the NPV and IRR calculations as shown in the spreadsheet. Net Present Value calculations are an indication that the projected earnings generated by a capital investment will exceed the anticipated costs. A positive NPV indicates that the project will be profitable, a negative NPV would indicate a project would be losing money. Internal Rate of Return is an alternative measure for the assessing the profitability of a project. A positive IRR indicates that the project is worthwhile. Companies generally set an IRR benchmark to aid the project decision making process.
Conclusion
Miller Construction and Drew Smith deliver an increase in revenue year on year and a positive cash flow. The purchase of Drew Smith enabled GallifordTry to increase its homebuilding footprint in the Hampshire region of the UK. Homebuilding is a cash intensive industry with high margins. The cash flow generated is steady and in-line with what I would understand the expectations of the industry to be comfortable with. From the calculations the payback period of 4 years and internal rate of return of >20% Drew Smith would be considered an acceptable investment. The purchase of Miller Construction was a larger initial investment and had a much lower increase in revenue year on year. Cash flow was calculated to be consistent and delivered a payback period of 7 years. NPV remained negative after 10 years and the IRR was calculated to be low at 4.5%. Based on these calculations Miller Construction would be a less desirable investment than Drew Smith.
Business make investment decisions for various reasons. With the purchase of Drew Smith, GallifordTry increased its homebuilding footprint in the South of England. Considering the positive homebuilding environment in the UK I am assuming that GallifordTry will make a return on investment in line with my calculations. Miller Construction is a different proposition. The construction industry is a different model to homebuilding with longer term projects. Again, considering the challenges inherent in the construction industry it is likely that this purchase will have had an extended payback period and an NPV in line with my calculations.
Page 10 of 34
Paul Feasey ACCT11059
ASS# 2 Step 10 Feedback
Feedback for this final assignment has been interesting. I have been very active in providing support and advice on Facebook and through emails with various members of the unit. I’ve also kept my blog active and up to date inviting my peers to take a look and comment. Apparently, I have over 65 followers of my blog, yet surprisingly very few comments or acknowledgements. Though I have found bits of my spreadsheets embedded in the work of another student. While I don’t mind my work being used, a please and thank you would be nice. I do take some comfort in that my blog is being followed by people who are not in the unit and they appear to like what I write.
I have been part of the PASS sessions and have supported the little group of regular attendees and have also been part of two Facebook chats sharing comments and support. One of these chats has with Deb (Breeze) Taylor and Caitlin McCarthy has been really helpful. The added bonus is that I now have two friends and an expanding circle of studying support.
My support has been acknowledged in a number of peoples work and I appreciate that recognition and I’m glad I was able to help. I have also been in contact with Gayle Black, who having been without internet for a few weeks I’m happy to help get over the line.
My intent was to give and receive feedback to Deb (Breeze) Taylor and Caitlin McCarthy and one other. Sadly Deb, due to personal circumstance is unable to finish, which does not allow me to provide or receive feedback from her. This meant that I was at risk of not meeting the minimum requirements for feedback on this unit. To be sure, I did put a note out on Facebook to see who needed feedback and I received some responses. In addition to the feedback I had provided to Caitlin and to Holly Sheehan who contacted me by email. The end result was feedback being supplied to Stuart Hentschke, Lisa O’Neill, Jessie Smith and Loree Preston.
The feedback I have received has been most welcome and excellent. All of the reviews were done on my initial draft and each one highlighted an area where I had some improvements to make. The quality of feedback and people’s comfort with the process has definitely improved over the duration of the unit.
The following pages contain the feedback I have given and received.
Feedback Provided To Others.
Feedback From: Stuart Hentschke
Feedback To: Paul Feasey .
My Comments
Step 7
Identify three products or services of your firm
Estimate selling price, variable cost & CM
Commentary – contribution margins
Three products are clearly identified, and CM calculated correctly.
Page 11 of 34

Paul Feasey ACCT11059
Constraints – identify & commentary
It’s clear that you have spent time learning about your company and fully understand their operations. You have gone above and beyond to ensure that your estimates are as accurate as possible. You have discussed the reasons why there are differences in the variable costs between the affordable home and private home.
I would add a sentence to answer, “why not only produce a product with the highest contribution margin?”
You have correctly listed constraints such as the future of skilled workers, the change of the CEO, exceptional costs, significant challenges for the industry and the planning and approvals process determined by local government.
I would add a sentence here suggesting how these constraints might be relevant in deciding how much of your three products your company should produce and sell, to tie it all together.
Step 8 “Net Profit Margin – gives an indication of the £’s profit in relation to the £’s invested” – I would change this to how much income/profit is generated from revenue and describe as for every dollar of sales … made ….. profit.
Its great to see you calculate the net profit margin as a % and £ value and discuss the results, the reasons for the results and compare to other industries.
Return on Assets: “In 2015 and 2017 2016 GallifordTry were making their assets work harder making over £0.05 for every £1.”
Excellent commentary on days of inventory and your additional research on your company.
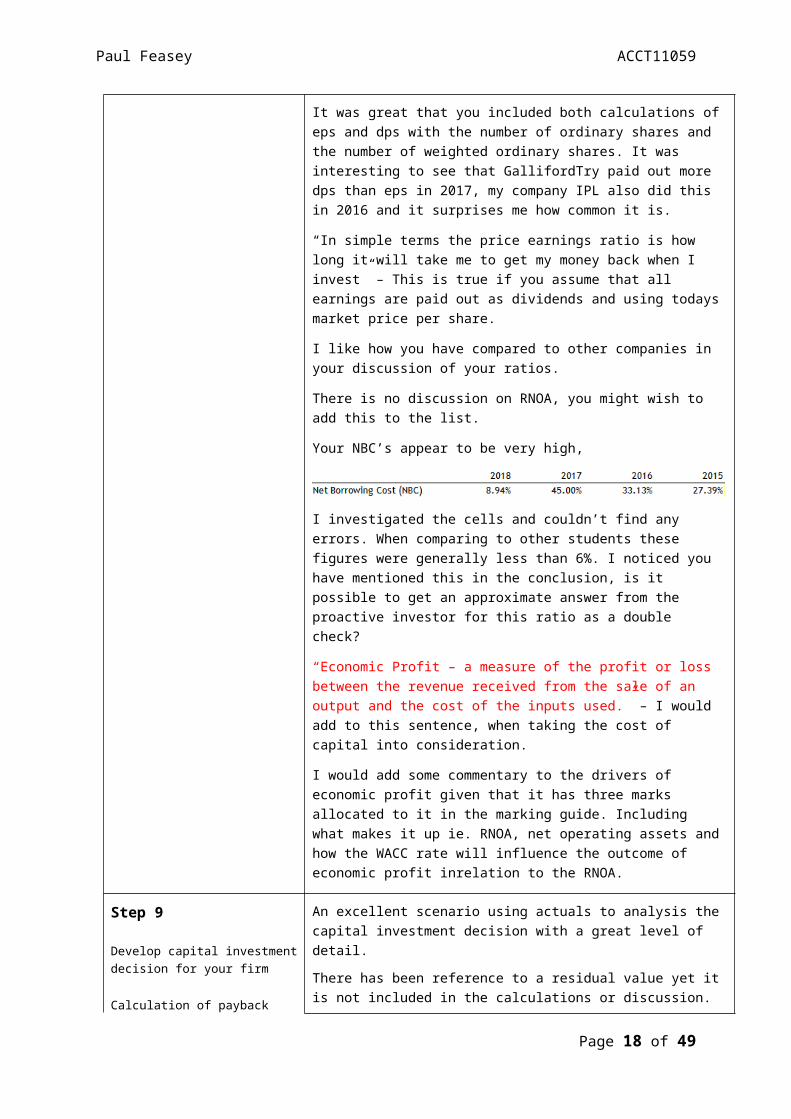
It was great that you included both calculations of eps and dps with the number of ordinary shares and the number of weighted ordinary shares. It was interesting to see that GallifordTry paid out more dps than eps in 2017, my company IPL also did this in 2016 and it surprises me how common it is.
“In simple terms the price earnings ratio is how long it will take me to get my money back when I invest” – This is true if you assume that all earnings are paid out as dividends and using todays market price per share.
I like how you have compared to other companies in your discussion of your ratios.
There is no discussion on RNOA, you might wish to add this to the list.
Your NBC’s appear to be very high,
Calculation of ratios
Ratios – commentary (blog)
Calculate economic profit
Commentary – drivers of economic profit (blog)
Page 12 of 34
Paul Feasey ACCT11059
I investigated the cells and couldn’t find any errors. When comparing to other students these figures were generally less than 6%. I noticed you have mentioned this in the conclusion, is it possible to get an approximate answer from the proactive investor for this ratio as a double check?
“Economic Profit – a measure of the profit or loss between the revenue received from the sale of an output and the cost of the inputs used.” – I would add to this sentence, when taking the cost of capital into consideration.
I would add some commentary to the drivers of economic profit given that it has three marks allocated to it in the marking guide. Including what makes it up ie. RNOA, net operating assets and how the WACC rate will influence the outcome of economic profit inrelation to the RNOA.
Step 9 An excellent scenario using actuals to analysis the capital investment decision with a great level of detail.
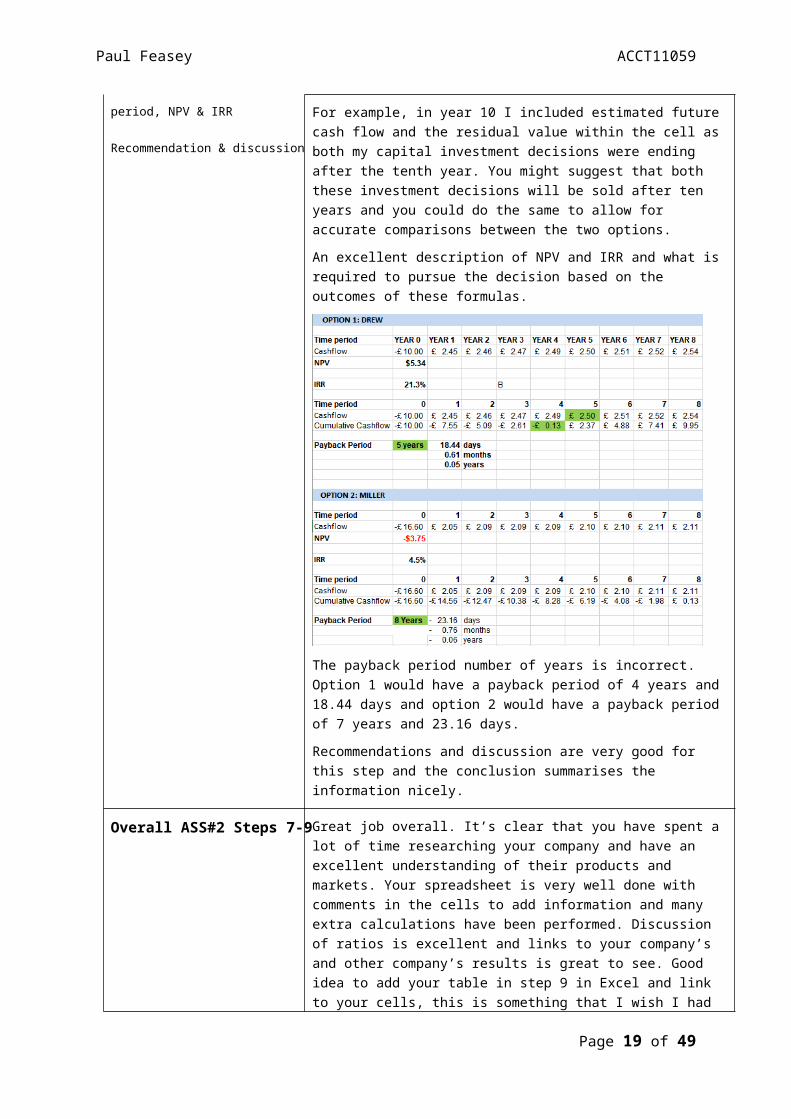
There has been reference to a residual value yet it is not included in the calculations or discussion. For example, in year 10 I included estimated future cash flow and the residual value within the cell as both my capital investment decisions were ending after the tenth year. You might suggest that both these investment decisions will be sold after ten years and you could do the same to allow for accurate comparisons between the two options.
An excellent description of NPV and IRR and what is required to pursue the decision based on the outcomes of these formulas.
The payback period number of years is incorrect. Option 1 would have a payback period of 4 years and 18.44 days and option 2 would have a payback period of 7 years and 23.16 days.
Develop capital investment decision for your firm
Calculation of payback period, NPV & IRR
Recommendation & discussion
Page 13 of 34
Paul Feasey ACCT11059
Recommendations and discussion are very good for this step and the conclusion summarises the information nicely.
Overall ASS#2 Steps 7-9 Great job overall. It’s clear that you have spent a lot of time researching your company and have an excellent understanding of their products and markets. Your spreadsheet is very well done with comments in the cells to add information and many extra calculations have been performed. Discussion of ratios is excellent and links to your company’s and other company’s results is great to see. Good idea to add your table in step 9 in Excel and link to your cells, this is something that I wish I had done rather than using Word and re typing the numbers. Thank you for the feedback you have given me, I appreciate your time and value having someone double check my results. Great job adding to the discussions on Facebook and helping me with previous queries I have had. I also look forward to interacting with you in the future!
Note: Please use this sheet as a guide. There is no need to provide feedback on each step of ASS#. For example, the person may have little or no draft work completed for one or more of the steps prior to asking for your feedback.
Feedback From: Caitlin McCarthy
Feedback To: Paul Feasey
My Comments
Step 7
Identify three products or services of your firm
Estimate selling price, variable cost & CM
Commentary – contribution margins
Constraints – identify & commentary
Products and Services of Your Firm
This step is well researched. You have provided apparent and concise information into why you have chosen these 3 products of your company. They are solid based services and are acquiring a significant contribution towards GallifordTry.
Estimated Selling Price, Variable Cost & CM
The separation of your land value from your selling price to find out construction costs are very clever.
Commentary – Contribution Margins
You have provided great insight and understanding of the contribution margin and have gone into great depth of this
meaning. You have even contributed to future suggestions and surrounding economic issues regarding the future of
GallifordTry.
Constraints – Identify & Commentary
It was great to see ACTUAL not POSSIBLE constraints that
Page 14 of 34
Paul Feasey ACCT11059
GallifordTry is going through at present. This information you have acquired by reading into great length of your financial reports and piecing the surroundings of your firm together.
Step 8 Calculation of Ratios
Expressing your Profitability ratios not only in percentages but also $ very smart to refer to! An excellent idea to portray these values.
Your ratios show very you have researched into they WHY extensively.
What happened in the year 2017? Just to think overworked assets would create so much of a downfall. GallifordTry seems to have taken out a massive loan difference in 2017, They also have higher net borrowing cost, and their asset turnover was at an all-time great for that year.
Ratios – commentary (blog)
You were one of the first people to complete and post your ratios to your blog, and your blog has over 65 followers! You have provided quality feedback to many people that are in
desperate need of your help. I will say you have taken on the role of feedback and questionnaire team leader. Love your
dedication to this unit.!
Calculate economic profit
Your economic profit ratio was formulated correctly. It was interesting to find 2017 provided to be an economic loss to GallifordTry, was there any more information to build on these exceptional items that impacted this year’s financial performance.
You are on par with economic loss that happened in 2017, throughout your discussions in your ratios. If you can extend on all these main drivers of economic profit and loss under your subheading economic profit to show the marker a conclusion (sum up), particularly since you have already commented on overworked assets and borrowings. Maybe an overall rundown that impacted your economic profit in 2017 since this will be an extra couple of marks. You have answered in ratios above where your net profit margin takes a hit and reduces by half in percentage due to charges encountered in that period and that
Calculation of ratios
Ratios – commentary (blog)
Calculate economic profit
Commentary – drivers of economic profit (blog)
Page 15 of 34
Paul Feasey ACCT11059
your return on assets is being overworked as this was an impact of these charges in this year. Earnings per share also were down by half of 2016, for the year 2017.
ASSESSMENT ECONOMIC STEP - Comment on what is driving or causing your firm’s economic profit over the past four years to be at the levels it is. If your firm’s economic profit is negative (or positive), what is causing it to be negative (or positive)? If it is a large number, what is causing it to be so large? If it is a small number, what is causing it to be so
Step 9 Develop Capital Investment decision for your Firm
Your Investment decisions were brilliant. So brilliant that I had you had given me a pathway for completing my capital investment decision. It was an excellent idea to compare two investments already operating within your company. Maybe this should be a new assignment criterion, to look at investments that are already occurring in our companies and to see if they are viable or not. It's a whole lot more relatable to our assessments than merely guessing. I have attached my feedback below regarding your fabulous investment plan.
Develop capital investment decision for your firm
Calculation of payback period, NPV & IRR
Recommendation & discussion
Page 16 of 34

Paul Feasey ACCT11059
Calculation of payback period, NVP & IRR
Your comparisons of these two investments are tops! Great explanation of potential cash flows. It was interesting to see Miller construction have a more extended payback period and net present value is negative. It is quite possible there is a higher opportunity cost of investing this money into Miller construction instead finding another investment, as 8 years is quite an extensive time period to payback and not knowing what is around the corner could be quite a risky decision for GallifordTry.
Recommendation & Discussion
The conclusion sums up your Investment decisions and provides much insight. Miller construction is quite a risky business. 8 years to payback is certainly a time constraint.
Once again, you have always been the first backing call for many people! Your extensive experience and being able to deeply understand many areas of this assessment has given many discussions and provided many answers! Quite an inspiration to where I would like to be after this degree! You're already on track!
Overall ASS#2 Steps 7-9 I cannot say much more than Great Job! Your assignment is realistic with your company! You have provided extensive research into your company reports, and it is shown the countless amount of times throughout your work! Your thought
Page 17 of 34
Paul Feasey ACCT11059
process is outstanding, and your background experience shines throughout this thought process! Visibly hard to fault in all areas! Hands up GREAT Job Paul!
Feedback From: Loree Preston
Feedback To: Paul Feasey .
My Comments
Step 7
Identify three products or services of your firm
Estimate selling price, variable cost & CM
Commentary – contribution margins
Constraints – identify & commentary
Your company seems a little complex to me with the different companies. I do not envy the paperwork you would have to peruse.
I was a little confused with Partnership & Regeneration. Is this a product in itself as well as a company? Perhaps a little further clarification on what the product actually is may be needed.
Martin has asked us to explain (if possible) why the actual contribution margins themselves may differ. You have made it clear the difference in the products, however I could not see this in particular with the CMs.
Well written. The only suggestion I would make would maybe put the complete total column after the CM. No reason other then showing the massive profit they make after selling 2587 Private homes, just a general interest thing. There is one very minor editing error in What does the contribution martin tell us?... There is an acute shortage of housing (in) the UK and indications……
Step 8 Your explanation are great for each of the ratios, apart from the net borrowing costs, which I didn’t completely get either.
Your formula for Return of Assets is out not consistent. The formula in the ratio for 2018 is
Calculation of ratios
Ratios – commentary (blog)
Page 18 of 34
Paul Feasey ACCT11059
different for the other years. Once this is correct you will need to also change the amounts in your commentary. All other ratios make sense and your explanation for them is well thought out.
I could not see that you have indicated what is driving your Economic Profit nor what is causing it to fluctuate or be stable, which is a marking requirement.
There were a few spelling mishaps, I have attached this separately and highlighted on your commentary.
I also noted in the spreadsheet that the Liquidity Ratios was hidden (this just might be my version of excel doing this)
Discussion with other peers is not included? Not sure if you are still working on this.
Calculate economic profit
Commentary – drivers of economic profit (blog)
Step 9 I had a hard time with this one myself due to my company structure and I didn’t totally understand it, so my feedback on this is limited (sorry). However, your detailed tables at the top of the spreadsheet are to be commended; the information you have provided on these and the explanation in your commentary are easily understood.
A few minor spelling errors, again I have attached and highlighted.
Develop capital investment decision for your firm
Calculation of payback period, NPV & IRR
Recommendation & discussion
Overall ASS#2 Steps 7-9 As always Paul, you are very thorough with your work and detailed with your assignments. You make them enjoyable and easy to understand. I imagine you will do exceptionally well. Good luck.
Feedback From: Holly Tucker
Feedback To: Paul Feasey
My Comments
Step 7
Identify three products or services of your firm
You have identified three product areas that are relevant to your firm, but I found I had to re-read a few times to wrap my head around the comparison between the two types of homes and the
Page 19 of 34
Paul Feasey ACCT11059
Estimate selling price, variable cost & CM
Commentary – contribution margins
Constraints – identify & commentary
regeneration. It is obvious in your discussion that you have focused on finding accurate selling prices and variable costs to calculate your contribution margins. I would suggest stating, more specifically, the exact products/service you have identified and what unit of measure you have used (I see you have done this in your table below).
You have identified very appropriate industry constraints and used your knowledge of Brexit to support this.
Step 8 You have successfully calculated your ratios by linking your cells back to your financial and restatement financial statements.
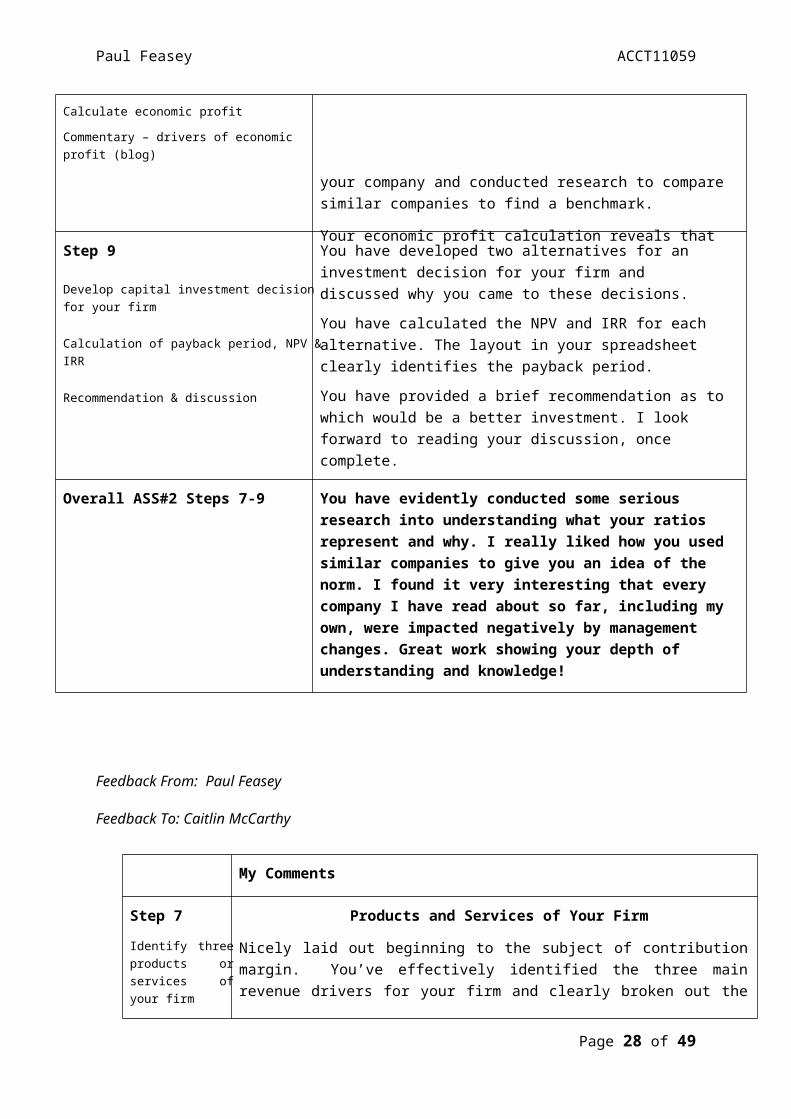
You have discussed what each ratio means for your company and conducted research to compare similar companies to find a benchmark.
Your economic profit calculation reveals that your firm is doing well and you comment on this throughout.
Calculation of ratios
Ratios – commentary (blog)
Calculate economic profit
Commentary – drivers of economic profit (blog)
Step 9 You have developed two alternatives for an investment decision for your firm and discussed why you came to these decisions.
You have calculated the NPV and IRR for each alternative. The layout in your spreadsheet clearly identifies the payback period.
You have provided a brief recommendation as to which would be a better investment. I look forward to reading your discussion, once complete.
Develop capital investment decision for your firm
Calculation of payback period, NPV & IRR
Recommendation & discussion
Overall ASS#2 Steps 7-9 You have evidently conducted some serious research into understanding what your ratios represent and why. I really liked how you used similar companies to give you an idea of the norm. I found it very interesting that every company I have read about so far, including my own, were impacted negatively by management changes. Great work showing your depth of understanding and knowledge!
Feedback From: Paul Feasey
Feedback To: Caitlin McCarthy
My Comments
Page 20 of 34

Paul Feasey ACCT11059
Step 7
Identify three products or services of your firm
Estimate selling price, variable cost & CM
Commentary – contribution margins
Constraints – identify & commentary
Products and Services of Your Firm
Nicely laid out beginning to the subject of contribution margin. You’ve effectively identified the three main revenue drivers for your firm and clearly broken out the products and services from them. I did have to read it a couple of times to be certain where your next step in this assignment would be referring to as it wasn’t immediately clear that you focus was on the Novatti Platform with Bill Payments through transaction and credit card and E-Voucher Loyalty product. I did work it out, but I needed to read further ahead. You did point it out on the graphic, unfortunately it didn’t link well to the text. What you’ve written in that second paragraph is great, and your rationale for doing so (57% of income) it’s a bit of a clunky paragraph that needs to be looked at carefully to fully get the gist.
Estimated Selling Price, Variable Cost & CM
Your explanation of selling price and variable cost is clear in this second paragraph, especially that the variable cost will vary with quantity. I liked your explanation of how you went about deriving the information, looking at the RBA to understand how banks make a profit, how earnings and overheads are derived. Areas that I had only vaguely thought about, so I learned something new.
I wasn’t sure initially where the Noavtti image with the highlights fitted in, until I realised what you’d highlighted was the areas of focus. It does provide an explanation about your product and services, for me it would need a bit more context about how it fits into you discussion piece, it is an important piece of information that will add value, at the moment it just sort of turns up and could be linked in smoother with some more information.
Clear explanation of how you have derived the sale revenue for transactions of bill payments in both forms. As you’ve explained in the previous commentary that credit cards are more expensive the difference between the revenue is quite clear and makes sense. Variable costs of 80% seem reasonable.
Flexipin is something I have no knowledge about. I like the way your curiosity has taken you down the path to investigate this in more detail. Just be careful when you reference a table or diagram in your paragraphs, in the Flexipin explanation you refer to adding the “cost of product fees on the right” However I’m not sure which right you are referring to. Throughout these explanations using the fixed amount of $1000 makes sense. I can see the value the shareholder insert will add to the commentary, it would have more impact when it’s linked into the piece as to why it there. I can see you’re highlighting that the revenue has increased in the transactional business, it you link it in with an explanation it will have great value.
I do like a good table and yours is no exception. Without looking too deeply I can quickly see the contribution margin per transaction.
Commentary – Contribution Margins
Love the way you emailed the RBA to get an indication of actual values. Something I would’ve done as well, the worst that can happen is they say no. Your explanation is clear and concise. Credit cards have been around for a long time, would their costs
Page 21 of 34
Paul Feasey ACCT11059
not be lower as they’ve been established longer? Or are their costs higher as the usage decreases in the wake of electronic transfers? Personally I don’t know the answer, it maybe something to consider?
Constraints – Identify & Commentary
Initial observation, might want to reword the second sentence “I am not going to pick a bank that will allow me to transfer money to clients” I see what you’re trying to say, might work better with a rewrite of the first couple of sentences. Good to see you’ve called out China, I recall seeing this in your work and financials a while back, it’s an important part of the business model.
Could you reword the second paragraph? Is a restricted licence a good or bad thing? I’m going to assume that an unrestricted licence is what they want/need it’s not clear in this paragraph if they have this.
Competition and incentives to work with Novetti are good constraints. Would you be able to indicate who the competition might be? You mention high end restrictions, could you expand on this? You do mention the need for flexibility and research, possibly more options than constraints unless there is no capability for either.
Overall, you have a challenging company which you have been able to identify three areas that contribute to Novatti performance. You’ve used company information to support your explanations and demonstrated creative thinking by contacting the RBA. I’ve highlighted a couple of areas where your information streams could be linked in a little tighter to make the commentary flow smoother for the reader. I’ve added one or two questions that could be put in to demonstrate your further understanding of your firm. I enjoyed reading and increased my knowledge from the process. With a couple of tweaks this will be spot on.
UPDATED – great to see the changes you made to the step 7 really highlighted the key areas and you put in the competition in constraints This made it so much clearer and easier to read. Great job.
Step 8 Calculation of Ratios
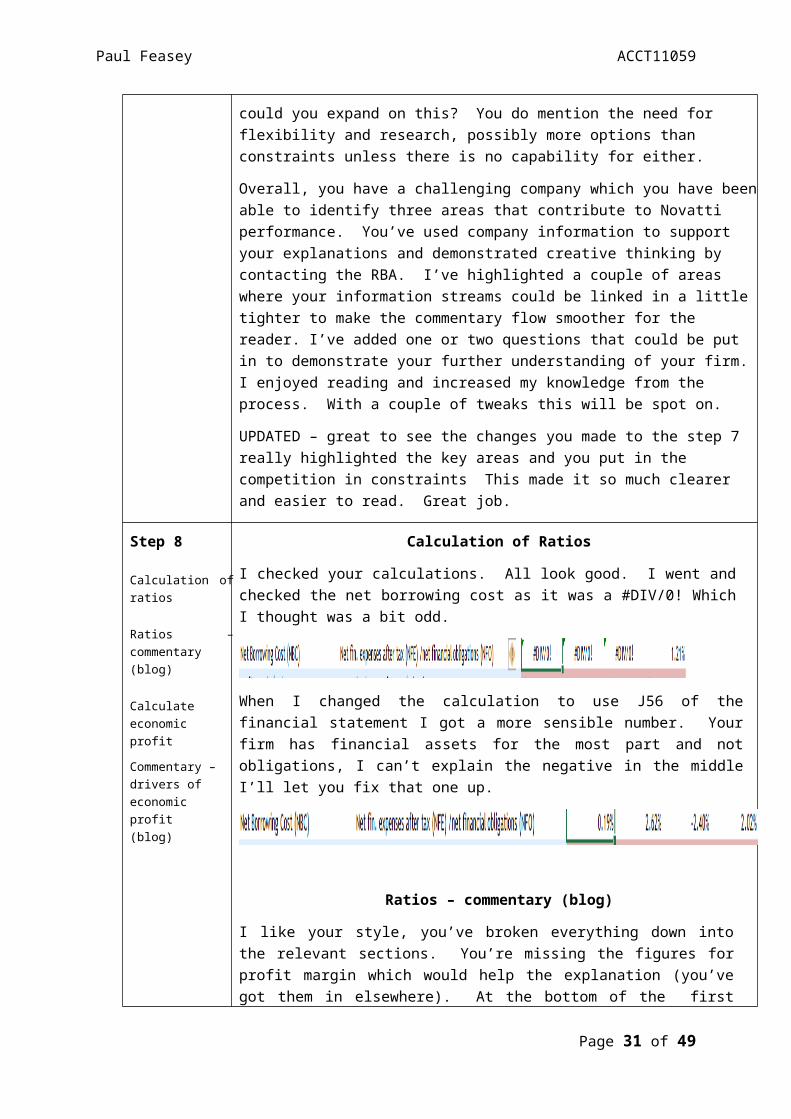
I checked your calculations. All look good. I went and checked the net borrowing cost as it was a #DIV/0! Which I thought was a bit odd.
When I changed the calculation to use J56 of the financial statement I got a more sensible number. Your firm has financial assets for the most part and not obligations, I can’t explain the negative in the middle I’ll let you fix that one up.
Ratios – commentary (blog)
Calculation of ratios
Ratios – commentary (blog)
Calculate economic profit
Commentary – drivers of economic profit (blog)
Page 22 of 34

Paul Feasey ACCT11059
I like your style, you’ve broken everything down into the relevant sections. You’re missing the figures for profit margin which would help the explanation (you’ve got them in elsewhere). At the bottom of the first paragraph, you’re leaving me hanging with “Further upon investigation” – might want to finish this sentence. Good questioning as to why comprehensive income is red. Good questions regarding the Return on Assets and identified that you’re using the recommended WACC rate.
Days of inventory- not sure if the note under the explanation is supposed to be there for you or the reader. It’s a good explanation, might want to link it into the piece. Not all companies have inventory, good to call it out and good to highlight what you’ve gained from Maria’s video
Total Asset Turnover – good explanation. Capitals in the first paragraph, again is this for you or the reader? Clear to see you understand what the ratio means in relation to the firm
Great explanation of Liquidity and current ratio, works well with the figures included.
Debt/equity ratios – another good explanation, were you able to determine what steps are being taken to drive the debt down? Have they sold shares or made profit?
EPS/DPS – your firms not looking too flash at the moment for shareholders, a good explanation as to what you think is happening here. I do like your price/earnings
Page 23 of 34

Paul Feasey ACCT11059
Step 9 Develop Capital Investment decision for your Firm
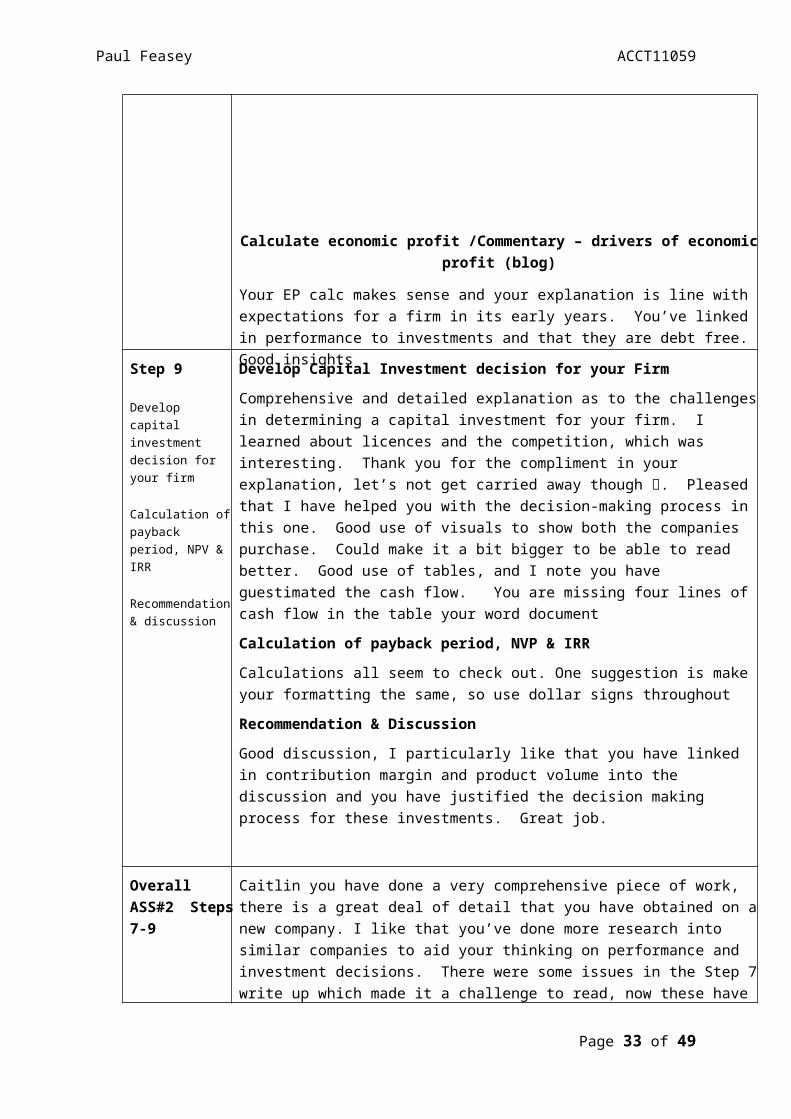
Comprehensive and detailed explanation as to the challenges in determining a capital investment for your firm. I learned about licences and the competition, which was interesting. Thank you for the compliment in your explanation, let’s not get carried away though 😊. Pleased that I have helped you with the decision-making process in this one. Good use of visuals to show both the companies purchase. Could make it a bit bigger to be able to read better. Good use of tables, and I note you have guestimated the cash flow. You are missing four lines of cash flow in the table your word document
Calculation of payback period, NVP & IRR
Calculations all seem to check out. One suggestion is make your formatting the same, so use dollar signs throughout
Recommendation & Discussion
Good discussion, I particularly like that you have linked in contribution margin and product volume into the discussion and you have justified the decision making process for these investments. Great job.
Develop capital investment decision for your firm
Calculation of payback period, NPV & IRR
Recommendation & discussion
Overall ASS#2 Steps 7-9
Caitlin you have done a very comprehensive piece of work, there is a great deal of detail that you have obtained on a new company. I like that you’ve done more research into similar companies to aid your thinking on performance and investment decisions. There were some issues in the Step 7 write up which made it a challenge to read, now these have been fixed up it flows so much better. Ratios were all good with only the NBC calculation that wasn’t quite right. The explanations were great and the layout was good, though I’m unsure about some of your comments whether they were aide memoirs for you or for the reader? With Step 9 I enjoyed the background to your decision making and I learned something of the banking industry so that was a bonus. Glad to have helped you in that area with the investment decisions, your process worked really well. Couple of areas to tidy up, otherwise it’s all good.
A great piece of work well done.
On a personal note, it’s been a pleasure to have been sharing knowledge and support with you and Deb over the period of this course. Out little study group has been excellent, and I hope we can continue to interact in future units. Thank you
Feedback From: Paul Feasey
Feedback To: Hayley Sheehan
My Comments
Page 24 of 34
Paul Feasey ACCT11059
Step 7
Identify three products or services of your firm
Estimate selling price, variable cost & CM
Commentary – contribution margins
Constraints – identify & commentary
I feel that I’ve spent a reasonable amount of time looking at your firm as well over the last 10 weeks so I was interested to see how you were going to go with this step. You’ve clearly identified the three products and allocated the variable cost at 90%. Good use of the information available to identify the selling prices. You’ve provided a good explanation of what contribution margin is and what it means to a business. You’ve also detailed the business model of Sliver Chef to highlight the rent or buying option.
You have allocated a 90% variable cost. Though I’m not convinced you have allocated it correctly.
Contribution margin = sale price – variable cost.
Product 1
Sale price = $6,531
Variable cost = $6531 * 90% = $5877.9
Contribution margin = $6531 – $5877.9 = $653.1
You have this the other way around with the variable cost of $653.1 and the CM of $5877.9
Product 2 and Product 3 – in this example you have indicated a variable cost of 10%
Sale price = $7393
Variable cost - $7393 * 10% = $739.3
CM = $7393 – $739.3 = $6653.7.
This step only allocates 4 marks so it is more about following the process and understanding what contribution margin means and providing an explanation for your product and calculations. To make sure you get those marks I would suggest going back and being consistent with your calculations in using 90% or 10% across all three. Personally I would use a table as it makes it clearer and easy to read for the marker. Always important to remember the audience you are writing for. The easier it is for them to understand the easier it is for you to get the marks. You have added a couple of constraints in the explanation. I appreciate it is only for a small number of marks, but I do think it’s possible to elaborate on the constraints a little bit more.
Overall a couple of little tweaks for consistency and elaboration in the explanation and it’s going to be sweet.
Step 8 I’ve looked through your ratios and the calculations appear to be sound.
Your explanation is covers the steps you took to help you understand the process and the issues you encountered in understanding the area of inventory. You have written a good overview of each of the ratio’s, I feel it would benefit if you broke it out into
Calculation of ratios
Ratios – commentary
Page 25 of 34
Paul Feasey ACCT11059
(blog)
some more detail with an explanation of each ratio, a cut from your spreadsheet and your interpretation of what the ratios may mean to the company performance. Danielle Bradleys exemplar is well worth a look at what good looks like.
For example I recall reading in the company report that the massive loss in the 2017/18 financial year was in part due to the exit of the GoGetta Business. This is quite significant and worth calling out in the commentary to demonstrate you really know your firm
Calculate economic profit
Commentary – drivers of economic profit (blog)
Step 9 Calculations – I checked your NPV calculation and the NPV calculation for Hiller had an error and was not referring to the WACC 10% and gave an incorrect NPV of $122, its actually $117. This did not affect the rest of the calculations but will affect your commentary. In using simple numbers for cash flow you have given yourself very rapid payback period. I wish all my projects I’ve worked on paid back that fast. Most capital investments I’ve worked on look for a payback of around 5 years, some major infrastructure ones can be longer, as I feel your examples probably would be. Simple numbers are ok as you’ve explained what you’ve done and why. For extra credit I would consider looking at the market place and seeing if there are some real world examples that can back up your work
Develop capital investment decision for your firm
Calculation of payback period, NPV & IRR
Recommendation &
Page 26 of 34
Paul Feasey ACCT11059
discussion
Overall ASS#2 Steps 7-9
Overall I think you’ve had some challenges with understanding your firm and getting some the spreadsheet work to make sense to you. You’ve reached out for help and used that to aid your understanding of the process and the firm. You have written up what you’ve learnt and your interpretation of the numbers involved. I think this will get you over the line for the unit. For future units I would suggest digging deeper into the firm (and I believe in the financial accounting unit we get to do this again, but in reverse) and demonstrating a more comprehensive knowledge of how your calculations relate to performance. I would also suggest using the examplers for inspiration, Investopedia and Studiosity to review your work, this will help with sentence structure and layout.
I hope you find this feedback helpful and look forward to seeing you on future units.
PEER FEEDBACK SHEET: ASS#2 Step 10
Feedback From: Paul Feasey
Feedback To: Jessica Smith .
My Comments
Step 7
Identify three products or services of your firm
Estimate selling price, variable cost & CM
Commentary – contribution margins
Constraints – identify & commentary
Really nicely laid out, clear and precise. Who doesn’t love a table, even better one with pictures? Somehow not surprised you picked golf clubs either. Your calculations make sense and the rationale behind the CM of each product is plausible. Being familiar with SportsDirect (and the crappy way they treat their staff) from my time in the UK I would agree their CM would be quite low. Sports Direct will often have an abundance of stock, which they mark down. You have made a good observation regarding the benefits in relation to consequential purchases.
Interesting discussion on constraints, Sports Direct is an interesting business and would be subject to a wide variety of issues, especially in the current UK Brexit uncertainty. There are a number of UK firms that have called out Brexit in their reports, I have one and Weatherspoons pubs which Ash Warbuton has is another. It would be interesting to see how this has affected your firm in a positive or negative way. Overall
Page 27 of 34
Paul Feasey ACCT11059
a good set of calculations and explanations
Step 8 I have checked the calculations of the ratios and they appear sound. It looks like you had no issues with them either. Graphs, nice touch, jealous that I didn’t think of that. This really makes the commentary clear. For each ratio you’ve clearly explained what the ratio means and what the impact has been on the financial performance. What I’m not quite getting is a sense that you’ve dug into those drivers of financial performance. Sports Direct do seem to be a consistent performer, there may not be too much to talk about. You mention that the 2018 financial year Sports Direct invested heavily which has impacted the results, is there more to it than that? You do call out the lack of dividends and return on equity being driven by a decline in CI, any reasons for this?
You write clearly about the mechanics of the EP calculation, what do you think is the driver behind the negative numbers? This section might benefit from being expanded to demonstrate your knowledge.
Overall clear and well laid out, graphs are a great addition. It could benefit from some additional explanation on the drivers that could be affecting the company performance.
Calculation of ratios
Ratios – commentary (blog)
Calculate economic profit
Commentary – drivers of economic profit (blog)
Step 9 More graphs, nice touch. The commentary would benefit from the inclusion of a table showing your cash flow. This is from mine as an example
I like the way you’ve used two plausible options for investment and the calculations all add up. I’d be interested to see how you wrap this all up.
Develop capital investment decision for your firm
Calculation of payback period, NPV & IRR
Recommendation & discussion
Overall ASS#2 Steps 7-9 An excellently laid out piece of work. Good use of pictures, tables and graphs to support the commentary. I would consider digging a little deeper
Page 28 of 34

Paul Feasey ACCT11059
into constraints, the UK is a mess at the moment and looking at some of the financial impacts in some more detail. A great piece of work, nice one
Note: Please use this sheet as a guide. There is no need to provide feedback on each step of ASS#. For example, the person may have little or no draft work completed for one or more of the steps prior to asking for your feedback.
Feedback From: Paul Feasey
Feedback To: Stuart Hentschke .
My Comments
Step 7
Identify three products or services of your firm
Estimate selling price, variable cost & CM
Commentary – contribution margins
Constraints – identify & commentary
Excellent presentation. Who doesn’t like a good table complete with pictures? Clear concise and easy to follow. With your background I can understand why you’ve chosen fertiliser. Good explanation of CM showing you clearly understand the exercise. Good explanation on the differences between the CM of product and the relationship with variable costs. Good insight into the software product, agree it should only need to be made once and have a high CM. Good insights into constraints taking into account location and other factors in relation to inventories and equipment. Good to see mention of the end of the mining boom and GFC, were you able to find any evidence in your company reports of that impact? I like that you’ve considered the weather as a constraint, again have you seen this in the company performance? A really good step 7, nice one.
Step 8 All your calculations are sound and great use of graphs. Might have to add some to mine now.
A very comprehensive commentary regarding your ratios, well laid out with lots of information regarding how you derived your share price and WACC rate. I like that you’re referring back to the annual reports to link back to the calculations, quite evident that you have spent the time understanding your firm (which answers some of my questions re your step 7). You’ve inserted the details from the ratio spreadsheet which makes the whole thing easy to read and understand. Really good commentary throughout and I liked that you’ve given an opinion from an investor point of view with regards to RNOA and EP. A solid conclusion to wrap up this section is
Calculation of ratios
Ratios – commentary (blog)
Calculate economic profit
Commentary – drivers of economic profit (blog)
Page 29 of 34

Paul Feasey ACCT11059
excellent. Great job on this one.
Step 9 Good choice of capital investments. Nice and detailed explanation of the scope and cost of each one and pictures, nice touch. I like the inclusion of the company conditions, this is something I use at work, but didn’t think to add it to my own assignment. I might change that in my own before submission. Cashflow and results clearly laid out with a really good explanation of the process and decisions taken. Excellent work
Develop capital investment decision for your firm
Calculation of payback period, NPV & IRR
Recommendation & discussion
Overall ASS#2 Steps 7-9 I am really pleased that I put it out there to do feedback and yours popped up. This is an excellent piece of work and a pleasure to review and I have gained insights for my own work. You have laid out this assignment extremely well. Your calculations are sound, your commentary is clear and well reasoned. You have demonstrated a great understanding of the process and how it relates to you firm. You clearly have spent a lot of time understanding your firm and it shows in the quality of this assignment. This is a great piece of work, I would anticipate a high mark. Well done, I expect you will do very well in this degree. Look forward to interacting with you in future units.
Note: Please use this sheet as a guide. There is no need to provide feedback on each step of ASS#. For example, the person may have little or no draft work completed for one or more of the steps prior to asking for your feedback.
Feedback From: Paul Feasey
Feedback To: Lisa O’Neil .
My Comments
Step 7
Identify three products or services of your firm
Estimate selling price, variable cost & CM
Commentary – contribution margins
Constraints – identify & commentary
Great opening into your CM work. How interesting is your firm? Good choice of the services and research to find the costs and what LOA means. I can understand taking a punt on determining a variable cost. Good discussion on the potential variables demonstrates your understanding of the concept and why you’ve gone with the chosen values.
Page 30 of 34
Paul Feasey ACCT11059
Calculations make sense and into a good explanation of variable costs. Interesting conclusions on the variation in variable costs within the services and I see you have considered a number of these in your constraints commentary. Constraints were very well written and thought out, good spot that it does depend on market conditions and how that would impact more than just revenue. You’ve given a lot of thought to this section and it rounds out this step very nicely. Well done.
Step 8 Ratio calculations all appear sound and show a company in good health. 2016 seemed to be a bit of a dip for the company and you’ve highlighted that fact. Did you check through the reports of that year for insights? I saw that you found days of inventory a challenge and I hope I recall correctly that we engaged on facebook about it. Good to see you persevered with the process and made the call to leave it, good explanation as to why. Interesting comments regarding the liquidity ratio, do you think this puts your company at risk?
Good work on EPS/DPS and use of the firms information to spot an error in calculation. I found that using the financial reports and external resources was the best way to understand the calculations and what the firm was experiencing, Would that capital restructure in 2016 have anything to do with the dip in profit at that stage?. Again good use of the firms report to back up your EP calculations for 2016. You do touch on that EP is driven by increase in operating income and asset re-evalaution, are there any other drivers of EP that are clear in the financial reports?
This was a very well written account of your ratios, nice one.
Calculation of ratios
Ratios – commentary (blog)
Calculate economic profit
Commentary – drivers of economic profit (blog)
Step 9 Good opener to capital investment. I like that you’ve put forward the idea of a council buyback. Much better than demolishing the joint with no other option. Good rationale for the refrigeration connection. The calculations all work out and your explanation and decision making is thorough. Well done
Develop capital investment decision for your firm
Calculation of payback period, NPV & IRR
Recommendation & discussion
Overall impression – this is a really good piece of work, well laid out and well written. You have done your research, each area and provided detailed,
Page 31 of 34
Paul Feasey ACCT11059
reasoned commentary throughout. Your calculations are correct and clearly laid out. There’s not much more I can add apart from the odd question that I have put in above. Really great job.
BTW I wish I did have a clone! Always happy to help and I have enjoyed our interactions via Facebook and Blog comments. I hope the other units go well and then it’s on to term 2.
Note: Please use this sheet as a guide. There is no need to provide feedback on each step of ASS#. For example, the person may have little or no draft work completed for one or more of the steps prior to asking for your feedback.
Feedback From: Paul Feasey
Feedback To: Loree Preston .
My Comments
Step 7
Identify three products or services of your firm
Estimate selling price, variable cost & CM
Commentary – contribution margins
Constraints – identify & commentary
Good opening into what your company does and products, I honestly couldn’t remember what firm you had, so this set the Step 7 up nicely. Given the challenges of finding out what is sold and pricing I think you’ve done a great job in determining the sales price and variable costs, and the justification are sound. Tabulating the results is always a good idea to make I clear for the reader and marker. Clearly you’ve done the research into the products and the reasons for the variation in CM, this demonstrates your understanding of your company, the products and the contribution. Given the information available determing constraints would be slightly more challenging. I agree with your conclusion that the demand would be based on statistics. This was a clear, well explained Step 7. Well done
Step 8 You have demonstrated to many on this unit that you know your way around a spreadsheet. It comes as no surprise to me that you found the mechanics of this task straightforward. I have reviewed the ratios and all calculations appear sound.
Calculation of ratios
Ratios – commentary (blog)
Page 32 of 34
Paul Feasey ACCT11059
Your commentary is clear and concise. You understand the ratios and are able to relate the numbers to the performance of your firm. Taking a lead from the examplers can I suggest that you cut from your spreadsheet the relevant section for each ratio? This means the marker has the information directly in front of them and do not need to switch between excel and word to confirm the numbers. Another potential tweak would be to expand in your own words an explanation of each ratio and what it means. This will add to the fact that you are confident in your understanding of the process. For example Net Borrowing Cost is an area that has stumped a lot of people (me included as my numbers seem a bit mad) as a ratio of borrowing, what exactly does it mean? With regards to EP, I’m going to give you back the feedback you gave me. What is driving EP for your firm? You mention it has fluctuated and there is a lawsuit, any other areas? Of all the feedback I’ve done this is an area of challenge for us all.
Calculate economic profit
Commentary – drivers of economic profit (blog)
Step 9 I can understand your confusion with the spreadsheet on this step, it took me a while as well. I like the rationale for the capital investment decision. Though if Redflex were going into a partnership with these people I would think the bulk of the revenue would go to NSW and a leasing/contract fee would go back to Redflex on a longer term basis. Based on your cash flow figures NSW would payback in one year and be rolling in money soon after. Pennsylvania would take about two years to do the same. Based on your calculations these investments are a licence to print money, which I’m sure would be desired by all involved. I would suggest going back to your spreadsheet and inserting the calculation that gets you months days etc. This will help you determine the payback period more effectively. In your NSW calculation you hadn’t started with a negative investment value as well. Doesn’t affect the outcome but is an important detail in the process. I would also put your cash flow table into the spreadsheet to help the marker
Develop capital investment decision for your firm
Calculation of payback period, NPV & IRR
Recommendation & discussion
Overall ASS#2 Steps 7-9 You have been a great support to many in the unit withyour mad spreadsheet skills. You clearly know your firm and understand the practicalities of the assignment tasks. These steps have been well written, clearly laid out and well researched. There
Page 33 of 34
Paul Feasey ACCT11059
are a couple of areas in Step 8 that I feel would further enhance your assignment and in Step 9 a tidy up of the NPV spreadsheet will help the commentary and marker. Overall this is a really good submission, a couple of tweaks and it’s totally spot on.
On an additional note I’ve enjoyed being with you on this unit, we’ve interacted well, worked together to solve problems and help others and you’ve provided me comprehensive feedback which is very much appreciated. I’ve enjoyed your virtual company as we’ve progressed through this unit and hope our paths cross again in the future. Good luck with the studies, from what I can see you’ll be absolutely fine.
Page 34 of 34
![[PPT]Slide 1 - Under Secretary of Defense for Acquisition ... · Web viewInternal Rate of Return (IRR) All companies evaluate cash flows based on these concepts Time Value of Money](https://img.pdfslide.us/doc/110x75/5aefd30e7f8b9a572b8ea79d/pptslide-1-under-secretary-of-defense-for-acquisition-viewinternal-rate.jpg)


![[PPT]Internal Rate of Return (IRR) and Net Present Value …leeds-faculty.colorado.edu/thibodea/REAL3000/files/2005... · Web viewInternal Rate of Return (IRR) and Net Present Value](https://img.pdfslide.us/doc/110x75/5aefd30e7f8b9a572b8ea779/pptinternal-rate-of-return-irr-and-net-present-value-leeds-viewinternal.jpg)