Embed Size (px)
Citation preview
ORI GIN AL PA PER
Be Careful Where You Smile: Culture Shapes Judgmentsof Intelligence and Honesty of Smiling Individuals
Kuba Krys1 • C. -Melanie Vauclair2 • Colin A. Capaldi3 •
Vivian Miu-Chi Lun4 • Michael Harris Bond5 •
Alejandra Domınguez-Espinosa6 • Claudio Torres7 •
Ottmar V. Lipp8 • L. Sam S. Manickam9• Cai Xing10 •
Radka Antalıkova11 • Vassilis Pavlopoulos12 • Julien Teyssier13 •
Taekyun Hur14 • Karolina Hansen15 • Piotr Szarota1 •
Ramadan A. Ahmed16 • Eleonora Burtceva17 •
Ana Chkhaidze18 • Enila Cenko19 • Patrick Denoux13 •
Marta Fulop20 • Arif Hassan21 • David O. Igbokwe22 •
Idil Isık23 • Gwatirera Javangwe24 • Marıa Malbran25 •
Fridanna Maricchiolo26 • Hera Mikarsa27 • Lynden K. Miles28 •
Martin Nader29 • Joonha Park30 • Muhammad Rizwan31 •
Radwa Salem32• Beate Schwarz33 • Irfana Shah34 •
Chien-Ru Sun35 • Wijnand van Tilburg36 • Wolfgang Wagner37 •
Ryan Wise23 • Angela Arriola Yu38
Published online: 30 December 2015� The Author(s) 2015. This article is published with open access at Springerlink.com
Abstract Smiling individuals are usually perceived more favorably than non-smiling
ones—they are judged as happier, more attractive, competent, and friendly. These seem-
ingly clear and obvious consequences of smiling are assumed to be culturally universal,
however most of the psychological research is carried out in WEIRD societies (Western,
Educated, Industrialized, Rich, and Democratic) and the influence of culture on social
perception of nonverbal behavior is still understudied. Here we show that a smiling
& Kuba [email protected]; [email protected]
1 Institute of Psychology, Polish Academy of Sciences, Jaracza 1, 00-378 Warsaw, Poland
2 Instituto Universitario de Lisboa (ISCTE-IUL), Cis-IUL, Lisbon, Portugal
3 Department of Psychology, Carleton University, Ottawa, Canada
4 Department of Applied Psychology, Lingnan University, Hong Kong, Hong Kong
5 Department of Management and Marketing, Faculty of Business, Hong Kong PolytechnicUniversity, Hong Kong, Hong Kong
6 Psychology Department, Iberoamerican University, Mexico City, Mexico
7 Institute of Psychology, University of Brasilia, Brasılia, Brazil
8 School of Psychology and Speech Pathology, Curtin University, Perth, Australia
9 Department of Psychiatry, JSS University, Karnataka, India
123
J Nonverbal Behav (2016) 40:101–116DOI 10.1007/s10919-015-0226-4
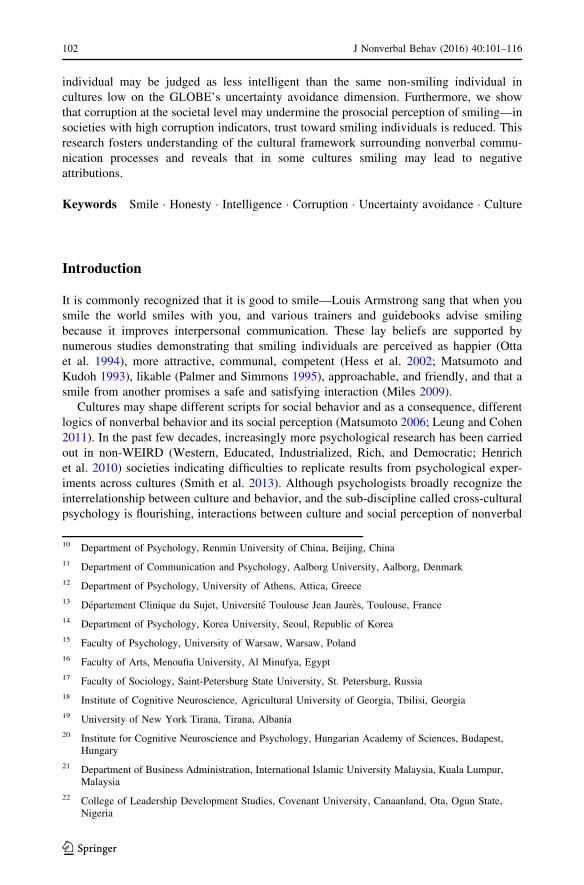
individual may be judged as less intelligent than the same non-smiling individual in
cultures low on the GLOBE’s uncertainty avoidance dimension. Furthermore, we show
that corruption at the societal level may undermine the prosocial perception of smiling—in
societies with high corruption indicators, trust toward smiling individuals is reduced. This
research fosters understanding of the cultural framework surrounding nonverbal commu-
nication processes and reveals that in some cultures smiling may lead to negative
attributions.
Keywords Smile � Honesty � Intelligence � Corruption � Uncertainty avoidance � Culture
Introduction
It is commonly recognized that it is good to smile—Louis Armstrong sang that when you
smile the world smiles with you, and various trainers and guidebooks advise smiling
because it improves interpersonal communication. These lay beliefs are supported by
numerous studies demonstrating that smiling individuals are perceived as happier (Otta
et al. 1994), more attractive, communal, competent (Hess et al. 2002; Matsumoto and
Kudoh 1993), likable (Palmer and Simmons 1995), approachable, and friendly, and that a
smile from another promises a safe and satisfying interaction (Miles 2009).
Cultures may shape different scripts for social behavior and as a consequence, different
logics of nonverbal behavior and its social perception (Matsumoto 2006; Leung and Cohen
2011). In the past few decades, increasingly more psychological research has been carried
out in non-WEIRD (Western, Educated, Industrialized, Rich, and Democratic; Henrich
et al. 2010) societies indicating difficulties to replicate results from psychological exper-
iments across cultures (Smith et al. 2013). Although psychologists broadly recognize the
interrelationship between culture and behavior, and the sub-discipline called cross-cultural
psychology is flourishing, interactions between culture and social perception of nonverbal
10 Department of Psychology, Renmin University of China, Beijing, China
11 Department of Communication and Psychology, Aalborg University, Aalborg, Denmark
12 Department of Psychology, University of Athens, Attica, Greece
13 Departement Clinique du Sujet, Universite Toulouse Jean Jaures, Toulouse, France
14 Department of Psychology, Korea University, Seoul, Republic of Korea
15 Faculty of Psychology, University of Warsaw, Warsaw, Poland
16 Faculty of Arts, Menoufia University, Al Minufya, Egypt
17 Faculty of Sociology, Saint-Petersburg State University, St. Petersburg, Russia
18 Institute of Cognitive Neuroscience, Agricultural University of Georgia, Tbilisi, Georgia
19 University of New York Tirana, Tirana, Albania
20 Institute for Cognitive Neuroscience and Psychology, Hungarian Academy of Sciences, Budapest,Hungary
21 Department of Business Administration, International Islamic University Malaysia, Kuala Lumpur,Malaysia
22 College of Leadership Development Studies, Covenant University, Canaanland, Ota, Ogun State,Nigeria
102 J Nonverbal Behav (2016) 40:101–116
123
behavior still remain understudied. One example of this lack of cross-cultural study is the
assessment of cultural variation of traits attributed to smiling individuals that goes beyond
East–West cultural comparisons (Hess et al. 2000). Rychlowska and collaborators (2015)
were among the first to address this pointing to the importance of heterogeneity versus
homogeneity of cultures in predicting the endorsement of smiling.
Although numerous studies confirm that positive perceptions of smiling individuals
seem to be universal, anecdotal evidence suggests that in some cultures the opposite may
be true. For example, a well-known Russian proverb says ‘Eks,ra, ,ep gpbxbys - gpbpyarlypaxbys’ (smiling with no reason is a sign of stupidity). The Norwegian government
humorously explains nuances of Norwegian culture by indicating that when a stranger on
the street smiles at Norwegians, they may assume that the stranger is insane (EURES
2010). British authors of a popular guidebook about Poland warn tourists that smiling at
strangers is perceived by Poles as a sign of stupidity (Bedford et al. 2008). Even Darwin
(1872/1998) wrote about ‘‘the large class of idiots who are … constantly smiling’’ (p. 199).
Previous studies have tested this counterintuitive phenomenon in different countries
(Krys et al. 2014, 2015). However, these studies included only a small number of cultures
(seven) compared to the much broader cross-cultural experiment reported here, which was
conducted in 44 cultures. Cross-cultural comparisons involving that many different cul-
tures allow for multilevel and country-level analyses, and are necessary to reliably identify
cultural factors that are related to the differential social perception of the most often
encountered facial expression, viz., the smile.
Meanings Attributed to Smiles
Smiles are highly diverse in their types and in their possible meanings. They are used to
communicate a range of different psychological signals, including positive emotions,
23 Istanbul Bilgi University, Istanbul, Turkey
24 Department of Psychology, University of Zimbabwe, Harare, Zimbabwe
25 Facultad de Humanidades y Ciencias de la Educacion, Universidad Nacional de La Plata, La Plata,Argentina
26 Department of Education, University of Roma Tre, Rome, Italy
27 Faculty of Psychology, University of Indonesia, Depok, Indonesia
28 School of Psychology, University of Aberdeen, Aberdeen, UK
29 Department of Psychological Studies, Universidad ICESI, Cali, Colombia
30 Nagoya University of Commerce and Business, Nagoya, Japan
31 Department of Health Sciences and Health Policy, University of Luzern, Lucerne, Switzerland
32 Silver School of Social Work, New York University, New York City, NY, USA
33 Department of Applied Psychology, Zurich University of Applied Sciences, Zurich, Switzerland
34 Department of Psychology, University of Sindh, Jamshoro, Pakistan
35 Department of Psychology, National Chengchi University, Taipei, Taiwan, Republic of China
36 Department of Psychology, King’s College London, London, United Kingdom
37 Department of Social and Economic Psychology, Johannes Kepler University, Linz, Austria
38 Department of Psychology, University of the Philippines-Diliman, Quezon City, Philippines
J Nonverbal Behav (2016) 40:101–116 103
123
social intentions, or a person’s social status (Matsumoto and Willingham 2009). Past
research has offered a number of distinctions among smiles. The utility of one of the most
popular distinctions, viz. Duchenne versus non-Duchenne smiles (Duchenne 1862), has
been recently questioned because there is evidence that the use of the Duchenne marker of
a ‘true’ smile is not universal, but rather limited to certain cultures (Abe et al. 2002;
Thibault et al. 2012). In their simulation of smiles model, Niedenthal et nl. (2010) focus on
the perception of smiles and suggest that the distinction between Duchenne and non-
Duchenne smiles may be largely superseded by a distinction based on the functions of
smiles, which may be derived from (and mapped onto) identifiable brain systems that
represent different meanings of smiling.
Niedenthal et al. (2010) describe three types of smiles that have important and discrete
functions, namely, enjoyment, affiliative, and dominance smiles. Humans (and some other
primates) smile spontaneously during experiences of pleasure or success (Ekman 2009)
and this expression is called the enjoyment smile. Affiliative smiles are those that signal
positive social intentions and are essential for the creation and maintenance of social
bonds; personal enjoyment does not have to accompany affiliative smiles. The third group
of smiles—dominance smiles—reflect social status or control, and may include scheming
smiles, critical smiles, and proud smiles which have different physical attributes than
affiliative and enjoyment smiles (Niedenthal et al. 2010). Chang and Vermeulen (2010)
claim that affiliative and enjoyment smiles cannot be discriminated from each other on the
basis of physical markers—their meaning may be derived only from contextual informa-
tion. Rychlowska and collaborators (2015) delivered evidence that the above distinctions
may be cross-culturally identified, and documented that heterogeneity and homogeneity of
cultures (i.e., the extent to which a country’s present-day population descended from
migration from numerous vs. few source countries over a long period of time) may predict
the endorsement of affiliative and dominance smiles, respectively.
The present research focuses on the attributions given to affiliative and enjoyment
smiles presented in still photographs in order to uncover the cultural variation of meanings
attributed to the most commonly expressed smiles. Limiting the scope of the current
research in this way avoids the problems related to differences in cultural scripts that may
influence the attributions to dominance smiles. We examined perceptions of honesty and
intelligence attributed to smiling individuals because these traits reflect the big two of
social perception (Abele and Wojciszke 2013; Bakan 1966). Among academic psycholo-
gists, there seems to be a consensus about two fundamental dimensions of social judg-
ments, though these basic dimensions are named differently and have slightly different
meanings. For example, Abele and Wojciszke (2014) call them agency and communion,
whereas Fiske et al. (2006) use the labels warmth and competence. These dimensions
reflect the logic of evolutionary pressure and help us determine whether ‘others’ are friend
or foe (communion/warmth/honesty) and whether ‘others’ have the ability to enact their
friendly or hostile intentions (agency/competence/intelligence).
Cultural Predictors of Smile Perception
Descriptive accounts of general cultural differences have been available for a long time,
but empirical assessments of cross-cultural variability have only emerged relatively
recently (Hofstede 2001; House et al. 2004; Leung and Bond 2004). In our research we
tested two predictions related to cultural variation. First, we tested the relation between
cultural uncertainty avoidance (UA; House et al. 2004) and the social perception of smiling
versus non-smiling individuals with regards to intelligence. Societies that rank high on UA
104 J Nonverbal Behav (2016) 40:101–116
123
socialize their members to alleviate the unpredictability of future events, whereas in
societies that rank low on UA, the future is judged to be relatively unpredictable and there
are fewer societal guidelines on how to behave (House et al. 2004). As argued elsewhere
(Krys et al. 2014), in cultures low on UA, social conditions are regarded as uncertain, so
expressing certainty through smiling (Hareli and Hess 2010) can be perceived as incon-
sistent behavior and people who exhibit inconsistency may be evaluated as unintelligent
(Weisbuch et al. 2010).
The second hypothesis tests whether ‘corruption corrupts smiling’. We predicted that
the more corrupt a society is, the less trust should be granted to a smile. On the one hand, a
smile is the most common signal of positive intentions. In fact, a smile conveys a message
that even a newborn baby understands and infants start smiling as early as 3 months old
(Wormann et al. 2014). The smile is perhaps the most commonly observed affiliative signal
(Mehu and Dunbar 2008). A smile facilitates the establishment and maintenance of social
bonds, and helps to coordinate social interactions (Fridlund 2002). All the above suggest
that smiling evolved as a universal signal of honesty and functions as a social glue
(Centorrino et al. 2015). On the other hand, this social glue may be counterfeited without
difficulty because smiling is a signal that can be easily produced (Mehu 2011). In particular
circumstances, some smiles may be expressed to benefit the signaller and may be deceptive
(Ekman and Friesen 1982).
Therefore, we predicted that the ease of producing a smile may in some conditions lead
to lower trust in this signal and one of the pre-conditions of scepticism about a smile’s
honesty is excessive corruption in society. In highly corrupt societies, individuals are
exposed to relatively frequent unfair or untruthful behaviors and, thus, scepticism about the
positive intentions underlying a smile may be well-grounded and justified. Hence, in our
second hypothesis we offer the novel prediction that the higher the corruption index of a
country, the more smiling individuals will be perceived as dishonest. In other words, we
empirically tested whether ‘corruption corrupts’ the evolutionary social glue of the smile.
Past research has shown that social judgements of smiling and non-smiling individuals
may also be affected by gender-related expectations (Hess et al. 2009). Gender stereotypes
and beliefs about emotional expressiveness can lead to different standards when men and
women evaluate the nonverbal behavior of other men and women (Krumhuber et al. 2007).
Women tend to smile more than men (LaFrance et al. 2003; Hall 1984) and there is a
greater expectation for them to do so (Brody and Hall 2008). Therefore, the gender of the
assessor and poser were included as control variables in all analyses. The contributions of
these control variables will be reported, though a detailed discussion of this contribution is
beyond the scope of the current paper.
Method
To provide a systematic analysis of the social perception of smiling individuals, we asked
participants in 44 cultures to rate photos of smiling and non-smiling individuals on traits
assessing honesty and intelligence.
Participants and Selection of Cultures
Data were gathered from a total of 5216 respondents in 44 cultures across six continents.
After removing individuals with at least one missing answer on the measures of
J Nonverbal Behav (2016) 40:101–116 105
123
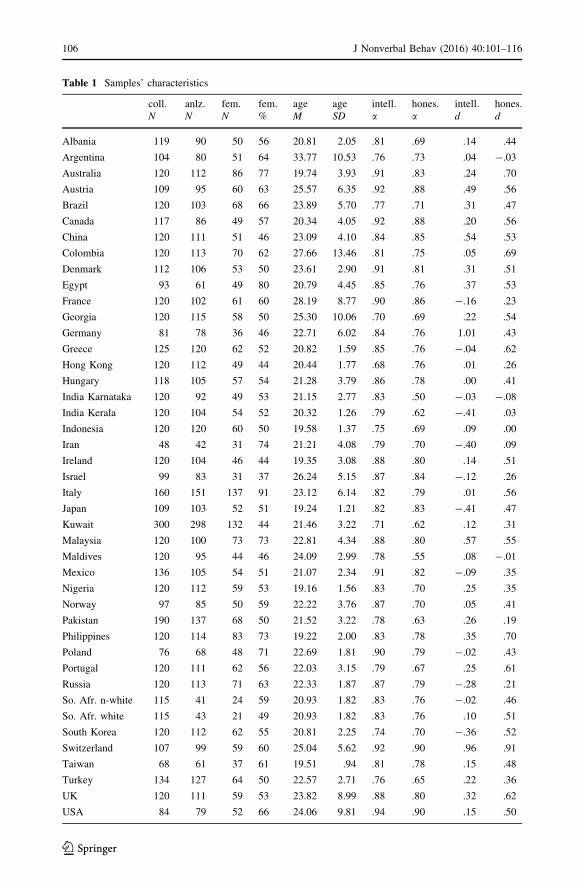
Table 1 Samples’ characteristics
coll. anlz. fem. fem. age age intell. hones. intell. hones.N N N % M SD a a d d
Albania 119 90 50 56 20.81 2.05 .81 .69 .14 .44
Argentina 104 80 51 64 33.77 10.53 .76 .73 .04 -.03
Australia 120 112 86 77 19.74 3.93 .91 .83 .24 .70
Austria 109 95 60 63 25.57 6.35 .92 .88 .49 .56
Brazil 120 103 68 66 23.89 5.70 .77 .71 .31 .47
Canada 117 86 49 57 20.34 4.05 .92 .88 .20 .56
China 120 111 51 46 23.09 4.10 .84 .85 .54 .53
Colombia 120 113 70 62 27.66 13.46 .81 .75 .05 .69
Denmark 112 106 53 50 23.61 2.90 .91 .81 .31 .51
Egypt 93 61 49 80 20.79 4.45 .85 .76 .37 .53
France 120 102 61 60 28.19 8.77 .90 .86 -.16 .23
Georgia 120 115 58 50 25.30 10.06 .70 .69 .22 .54
Germany 81 78 36 46 22.71 6.02 .84 .76 1.01 .43
Greece 125 120 62 52 20.82 1.59 .85 .76 -.04 .62
Hong Kong 120 112 49 44 20.44 1.77 .68 .76 .01 .26
Hungary 118 105 57 54 21.28 3.79 .86 .78 .00 .41
India Karnataka 120 92 49 53 21.15 2.77 .83 .50 -.03 -.08
India Kerala 120 104 54 52 20.32 1.26 .79 .62 -.41 .03
Indonesia 120 120 60 50 19.58 1.37 .75 .69 .09 .00
Iran 48 42 31 74 21.21 4.08 .79 .70 -.40 .09
Ireland 120 104 46 44 19.35 3.08 .88 .80 .14 .51
Israel 99 83 31 37 26.24 5.15 .87 .84 -.12 .26
Italy 160 151 137 91 23.12 6.14 .82 .79 .01 .56
Japan 109 103 52 51 19.24 1.21 .82 .83 -.41 .47
Kuwait 300 298 132 44 21.46 3.22 .71 .62 .12 .31
Malaysia 120 100 73 73 22.81 4.34 .88 .80 .57 .55
Maldives 120 95 44 46 24.09 2.99 .78 .55 .08 -.01
Mexico 136 105 54 51 21.07 2.34 .91 .82 -.09 .35
Nigeria 120 112 59 53 19.16 1.56 .83 .70 .25 .35
Norway 97 85 50 59 22.22 3.76 .87 .70 .05 .41
Pakistan 190 137 68 50 21.52 3.22 .78 .63 .26 .19
Philippines 120 114 83 73 19.22 2.00 .83 .78 .35 .70
Poland 76 68 48 71 22.69 1.81 .90 .79 -.02 .43
Portugal 120 111 62 56 22.03 3.15 .79 .67 .25 .61
Russia 120 113 71 63 22.33 1.87 .87 .79 -.28 .21
So. Afr. n-white 115 41 24 59 20.93 1.82 .83 .76 -.02 .46
So. Afr. white 115 43 21 49 20.93 1.82 .83 .76 .10 .51
South Korea 120 112 62 55 20.81 2.25 .74 .70 -.36 .52
Switzerland 107 99 59 60 25.04 5.62 .92 .90 .96 .91
Taiwan 68 61 37 61 19.51 .94 .81 .78 .15 .48
Turkey 134 127 64 50 22.57 2.71 .76 .65 .22 .36
UK 120 111 59 53 23.82 8.99 .88 .80 .32 .62
USA 84 79 52 66 24.06 9.81 .94 .90 .15 .50
106 J Nonverbal Behav (2016) 40:101–116
123
intelligence or honesty, the final sample that was analysed consisted of 4519 participants.
In Table 1, we present demographic characteristics for all national samples. The gender
distribution was 56.5 % female and 43.5 % male. The mean age of participants was
22.36 years (SD 5.50). Participants were students from a variety of different disciplines
who were recruited at each author’s university. All data were collected from 2011 to 2015.
We managed to collect data in forty-two out of the sixty-two cultures involved in the
GLOBE project (House et al. 2004). We also collected data in Norway (for which practices
on the GLOBE dimensions were calculated by Warner-Søderholm 2010) and in Pakistan
(ranked high on the corruption dimensions, which relates to our second hypothesis). We
aimed to collect data from at least 120 individuals in each analyzed culture (some authors,
however, collected more and other authors collected fewer).
Materials
All participants were asked to provide basic demographic information on their gender, age,
student status, religion, and father’s highest degree. Individuals were also asked about their
ethnicity and nationality in cultures where the team leaders decided that asking about this
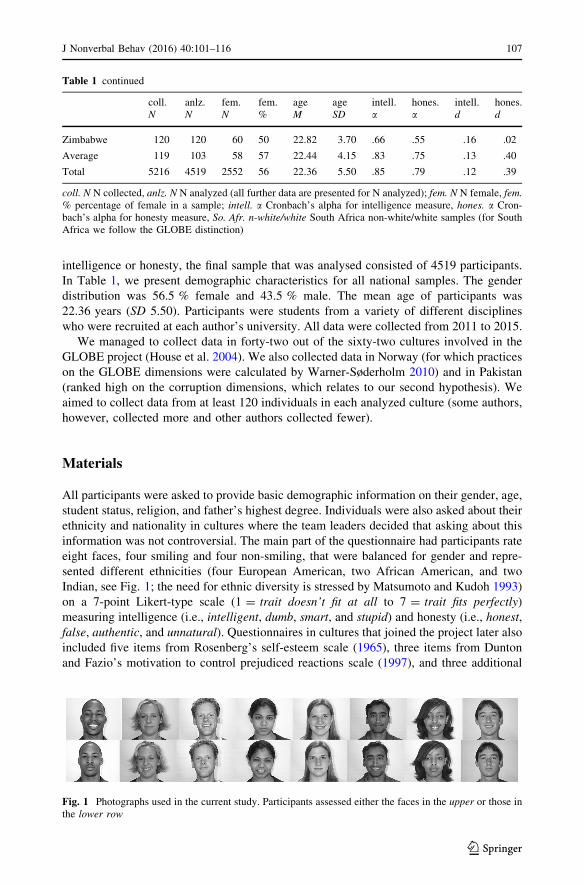
information was not controversial. The main part of the questionnaire had participants rate
eight faces, four smiling and four non-smiling, that were balanced for gender and repre-
sented different ethnicities (four European American, two African American, and two
Indian, see Fig. 1; the need for ethnic diversity is stressed by Matsumoto and Kudoh 1993)
on a 7-point Likert-type scale (1 = trait doesn’t fit at all to 7 = trait fits perfectly)
measuring intelligence (i.e., intelligent, dumb, smart, and stupid) and honesty (i.e., honest,
false, authentic, and unnatural). Questionnaires in cultures that joined the project later also
included five items from Rosenberg’s self-esteem scale (1965), three items from Dunton
and Fazio’s motivation to control prejudiced reactions scale (1997), and three additional
Table 1 continued
coll. anlz. fem. fem. age age intell. hones. intell. hones.N N N % M SD a a d d
Zimbabwe 120 120 60 50 22.82 3.70 .66 .55 .16 .02
Average 119 103 58 57 22.44 4.15 .83 .75 .13 .40
Total 5216 4519 2552 56 22.36 5.50 .85 .79 .12 .39
coll. N N collected, anlz. N N analyzed (all further data are presented for N analyzed); fem. N N female, fem.% percentage of female in a sample; intell. a Cronbach’s alpha for intelligence measure, hones. a Cron-bach’s alpha for honesty measure, So. Afr. n-white/white South Africa non-white/white samples (for SouthAfrica we follow the GLOBE distinction)
Fig. 1 Photographs used in the current study. Participants assessed either the faces in the upper or those inthe lower row
J Nonverbal Behav (2016) 40:101–116 107
123
attributes (i.e., attractiveness, friendliness, and familiarity) using the aforementioned
7-point scale. The current report is of the data provided by all participants. Photographs of
the same persons posing neutral and smiling expressions were taken from the Center for
Vital Longevity Face Database (Minear and Park 2004). The questionnaire, in the form of a
small booklet, started with the following instructions: ‘‘Research shows that people can
quite accurately evaluate others based on their looks. Can you help us and rate some
faces?’’. Photographs were organised into two sets, with targets who were smiling in one
set presented as non-smiling in the other (Fig. 1). Half of the participants received one set,
the other half received the other set. Photographs in each set were randomized. In a pre-test
carried out among 183 Polish students, smiling faces, were assessed as more joyful,
t(173) = 18.43, p\ .001, d = 1.40, and affiliative, t(182) = 9.22, p\ .001, d = .68, than
non-smiling faces, but did not differ in dominance, t(176) = .25, p = .80, d = .02.
Materials were originally written in Polish and English and were translated from English
into languages of each country where the study was carried out. Following best practices
(Brislin 1970), team leaders in each culture were asked to follow the back-translation
procedure to establish linguistic equivalence. The original material, including the manual
for collaborating researchers, is available from the first author in English.
For each participant, we calculated the average ratings given to smiling and non-smiling
target individuals across the traits associated with the intelligence and honesty dimensions.
Next, an effect size (i.e., Cohen’s d) for the differences between ratings for smiling and non-
smiling individuals was calculated for each dimension in each culture. Thus, we obtained two
measures for each culture: a Cohen’s d for intelligence and a Cohen’s d for honesty.
Results
To test our two predictions, we separately examined cross-cultural differences in ratings
given to smiling and non-smiling individuals on the intelligence and honesty dimensions.
The results are summarised in Figs. 2 and 3.
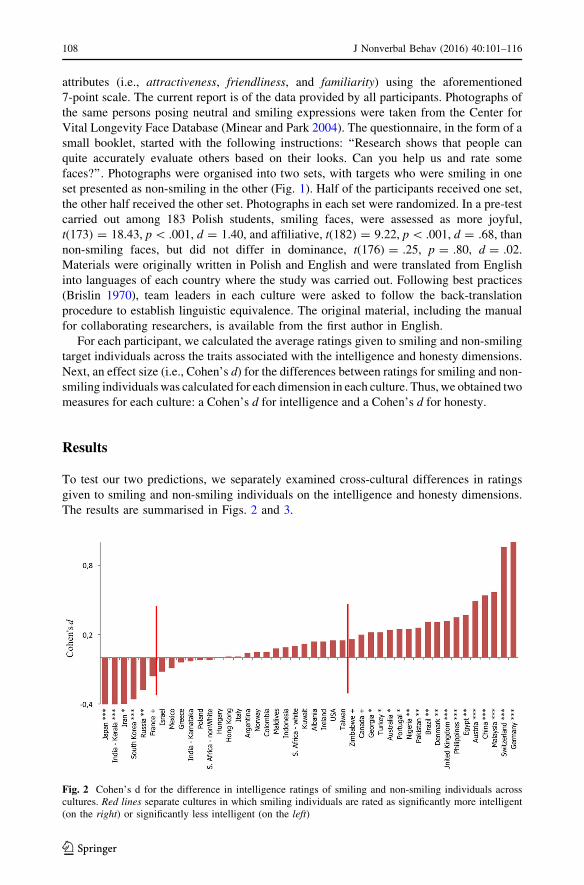
Fig. 2 Cohen’s d for the difference in intelligence ratings of smiling and non-smiling individuals acrosscultures. Red lines separate cultures in which smiling individuals are rated as significantly more intelligent(on the right) or significantly less intelligent (on the left)
108 J Nonverbal Behav (2016) 40:101–116
123
As predicted, smiling was not consistently perceived as a signal of intelligence across
all cultures. Although smiling did lead to attributions of higher intelligence in 18 out of the
44 cultures, we identified six cultures where individuals were perceived as significantly
less intelligent when smiling. Moreover, we found no significant difference in the intel-
ligence ratings of smiling versus non-smiling individuals in 20 cultures.
This result supports our prediction that social perception of the intelligence of smiling
individuals varies across cultures, and in some cultures, smiling may even lead to attri-
butions of lower levels of intelligence (we observed a significant two-way culture by smile
interaction, F(43, 4425) = 5.9, p\ .001, gp2 = .05; for detailed summary of results of
ANOVA analyses, including gender of participant and gender of target, see Table 2). As
predicted, the key to understanding this variability was not in geography (e.g., neighboring
countries like China and Japan or Germany and France are on different ends of the
distributions) nor in economic factors, but in cultural dimensions (for detailed correlation
and regression analyses, including economic factors, at the cultural level examine Table 3).
The predicted correlation between Cohen’s d (i.e., the difference in rated intelligence of
smiling and non-smiling individuals) and UA practices was high, r = .63, p\ .001, and
remained strong after controlling for economic factors (b = .65, p\ .001). UA practices
remained a significant predictor even when controlling for the heterogeneity-homogeneity
of 28 cultures in our study that had heterogeneity-homogeneity data available (Rychlowska
et al. 2015; b = .67, p\ .001). Consistent with predictions, multilevel analyses revealed a
significant cross-level interaction between facial expression and UA in the prediction of
intelligence attributions (for details of these analyses see Table 4).
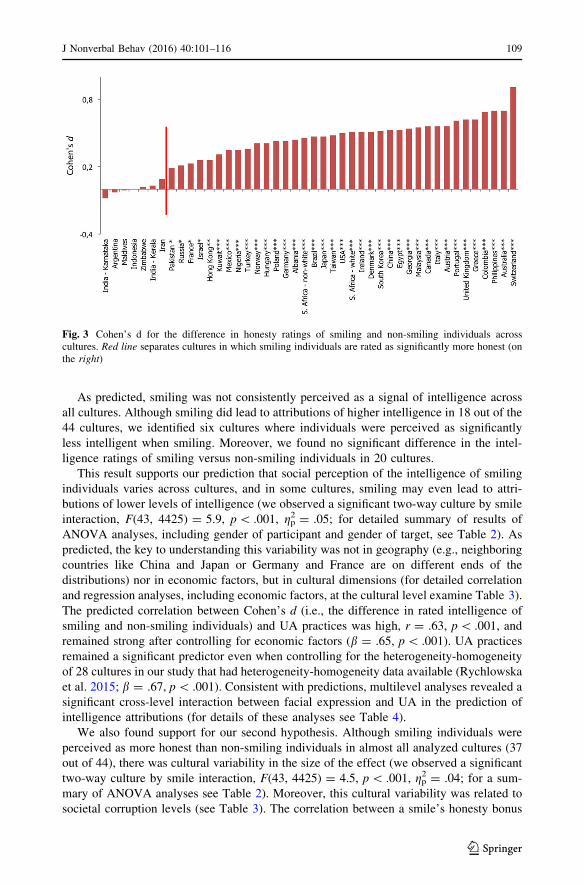
We also found support for our second hypothesis. Although smiling individuals were
perceived as more honest than non-smiling individuals in almost all analyzed cultures (37
out of 44), there was cultural variability in the size of the effect (we observed a significant
two-way culture by smile interaction, F(43, 4425) = 4.5, p\ .001, gp2 = .04; for a sum-
mary of ANOVA analyses see Table 2). Moreover, this cultural variability was related to
societal corruption levels (see Table 3). The correlation between a smile’s honesty bonus
Fig. 3 Cohen’s d for the difference in honesty ratings of smiling and non-smiling individuals acrosscultures. Red line separates cultures in which smiling individuals are rated as significantly more honest (onthe right)
J Nonverbal Behav (2016) 40:101–116 109
123
and three different corruption indices: Corruption Perceptions Index (Transparency
International 2010a), Global Corruption Barometer—Paying Bribe sub-dimension
(Transparency International 2010b), and Index of Economic Freedom – sub-index Freedom
from Corruption (The Heritage Foundation 2010), was significant and relatively high
(.59[ r[ .51, p\ .01) and remained significant after controlling for socio-economic
factors (b = -.48, p = .04). Corruption remained a significant predictor even when
controlling for the heterogeneity-homogeneity of 28 cultures in our study that had
heterogeneity-homogeneity data available (Rychlowska et al. 2015; b = -.64, p\ .001).
Multilevel analyses revealed an interaction between facial expression and corruption index
in the prediction of honesty judgments (see Table 4). As predicted, greater corruption
levels decreased trust granted toward smiling individuals.
Beyond cultural variability, we found that participant and target gender were important
factors that influenced the social perception of smiling versus non-smiling individuals
(see Table 2). For intelligence perception, we observed a significant two-way participant
gender by smile interaction, indicating that smiling increases ratings of intelligence more
among women (t[2551] = 7.80, p\ .001, d = .15, MNon-smileFemale = 4.71, SDNon-smileFemale =
.75, MSmileFemale = 4.83, SDSmileFemale = .77) than among men (t[1960] = 3.37, p =
.001, d = .08, MNon-smileMale = 4.54, SDNon-smileMale = .76, MSmile_Male = 4.61,
SDSmile_Male = .78). Two remaining two-way interactions regarded perceptions of honesty.
A significant participant gender by smile interaction indicated that smiling increases
ratings of honesty more for female assessors (t[2551] = 22.66, p\ .001, d = .45,
MNon-smileFemale = 4.48, SDNon-smileFemale = .71, MSmileFemale = 4.83, SDSmileFemale = .73)
than for male assessors (t[1960] = 13.73, p\ .001, d = .31, MNon-smileMale = 4.40,
SDNon-smileMale = .67, MSmileMale = 4.64, SDSmileMale = .72). Finally, a significant target
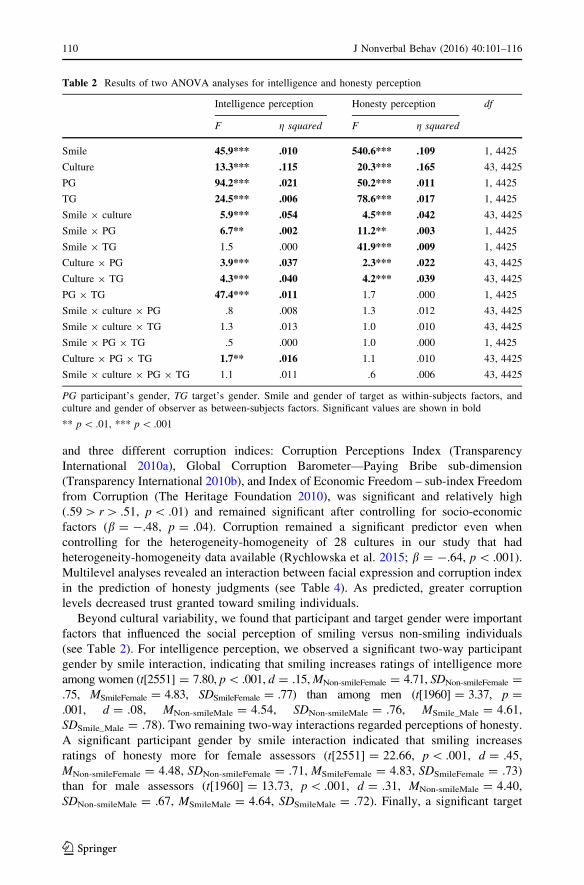
Table 2 Results of two ANOVA analyses for intelligence and honesty perception
Intelligence perception Honesty perception df
F g squared F g squared
Smile 45.9*** .010 540.6*** .109 1, 4425
Culture 13.3*** .115 20.3*** .165 43, 4425
PG 94.2*** .021 50.2*** .011 1, 4425
TG 24.5*** .006 78.6*** .017 1, 4425
Smile 9 culture 5.9*** .054 4.5*** .042 43, 4425
Smile 9 PG 6.7** .002 11.2** .003 1, 4425
Smile 9 TG 1.5 .000 41.9*** .009 1, 4425
Culture 9 PG 3.9*** .037 2.3*** .022 43, 4425
Culture 9 TG 4.3*** .040 4.2*** .039 43, 4425
PG 9 TG 47.4*** .011 1.7 .000 1, 4425
Smile 9 culture 9 PG .8 .008 1.3 .012 43, 4425
Smile 9 culture 9 TG 1.3 .013 1.0 .010 43, 4425
Smile 9 PG 9 TG .5 .000 1.0 .000 1, 4425
Culture 9 PG 9 TG 1.7** .016 1.1 .010 43, 4425
Smile 9 culture 9 PG 9 TG 1.1 .011 .6 .006 43, 4425
PG participant’s gender, TG target’s gender. Smile and gender of target as within-subjects factors, andculture and gender of observer as between-subjects factors. Significant values are shown in bold
** p\ .01, *** p\ .001
110 J Nonverbal Behav (2016) 40:101–116
123
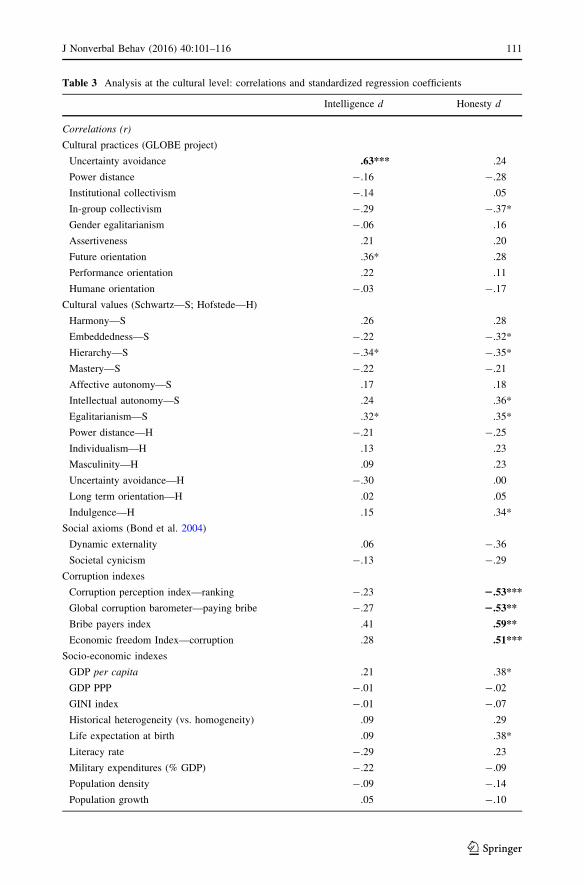
Table 3 Analysis at the cultural level: correlations and standardized regression coefficients
Intelligence d Honesty d
Correlations (r)
Cultural practices (GLOBE project)
Uncertainty avoidance .63*** .24
Power distance -.16 -.28
Institutional collectivism -.14 .05
In-group collectivism -.29 -.37*
Gender egalitarianism -.06 .16
Assertiveness .21 .20
Future orientation .36* .28
Performance orientation .22 .11
Humane orientation -.03 -.17
Cultural values (Schwartz—S; Hofstede—H)
Harmony—S .26 .28
Embeddedness—S -.22 -.32*
Hierarchy—S -.34* -.35*
Mastery—S -.22 -.21
Affective autonomy—S .17 .18
Intellectual autonomy—S .24 .36*
Egalitarianism—S .32* .35*
Power distance—H -.21 -.25
Individualism—H .13 .23
Masculinity—H .09 .23
Uncertainty avoidance—H -.30 .00
Long term orientation—H .02 .05
Indulgence—H .15 .34*
Social axioms (Bond et al. 2004)
Dynamic externality .06 -.36
Societal cynicism -.13 -.29
Corruption indexes
Corruption perception index—ranking -.23 2.53***
Global corruption barometer—paying bribe -.27 2.53**
Bribe payers index .41 .59**
Economic freedom Index—corruption .28 .51***
Socio-economic indexes
GDP per capita .21 .38*
GDP PPP -.01 -.02
GINI index -.01 -.07
Historical heterogeneity (vs. homogeneity) .09 .29
Life expectation at birth .09 .38*
Literacy rate -.29 .23
Military expenditures (% GDP) -.22 -.09
Population density -.09 -.14
Population growth .05 -.10
J Nonverbal Behav (2016) 40:101–116 111
123
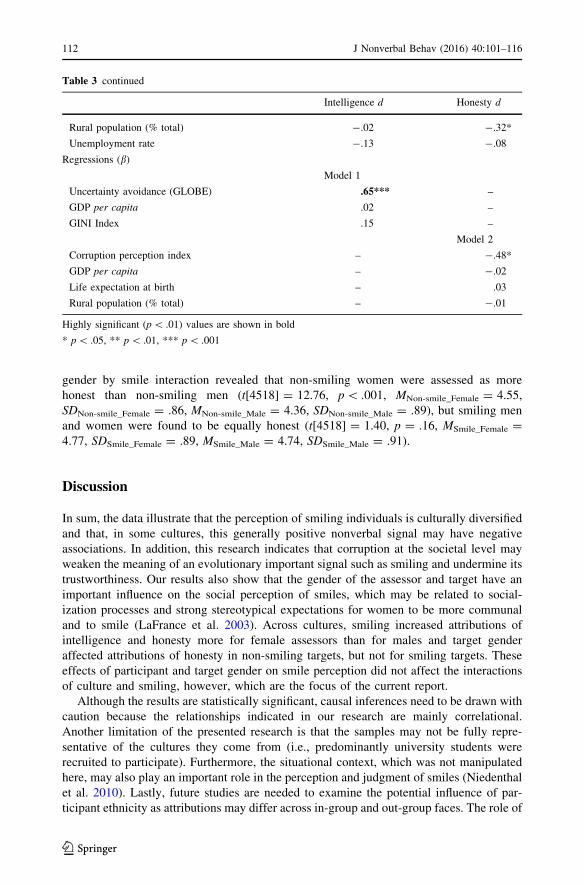
gender by smile interaction revealed that non-smiling women were assessed as more
honest than non-smiling men (t[4518] = 12.76, p\ .001, MNon-smile_Female = 4.55,
SDNon-smile_Female = .86, MNon-smile_Male = 4.36, SDNon-smile_Male = .89), but smiling men
and women were found to be equally honest (t[4518] = 1.40, p = .16, MSmile_Female =
4.77, SDSmile_Female = .89, MSmile_Male = 4.74, SDSmile_Male = .91).
Discussion
In sum, the data illustrate that the perception of smiling individuals is culturally diversified
and that, in some cultures, this generally positive nonverbal signal may have negative
associations. In addition, this research indicates that corruption at the societal level may
weaken the meaning of an evolutionary important signal such as smiling and undermine its
trustworthiness. Our results also show that the gender of the assessor and target have an
important influence on the social perception of smiles, which may be related to social-
ization processes and strong stereotypical expectations for women to be more communal
and to smile (LaFrance et al. 2003). Across cultures, smiling increased attributions of
intelligence and honesty more for female assessors than for males and target gender
affected attributions of honesty in non-smiling targets, but not for smiling targets. These
effects of participant and target gender on smile perception did not affect the interactions
of culture and smiling, however, which are the focus of the current report.
Although the results are statistically significant, causal inferences need to be drawn with
caution because the relationships indicated in our research are mainly correlational.
Another limitation of the presented research is that the samples may not be fully repre-
sentative of the cultures they come from (i.e., predominantly university students were
recruited to participate). Furthermore, the situational context, which was not manipulated
here, may also play an important role in the perception and judgment of smiles (Niedenthal
et al. 2010). Lastly, future studies are needed to examine the potential influence of par-
ticipant ethnicity as attributions may differ across in-group and out-group faces. The role of
Table 3 continued
Intelligence d Honesty d
Rural population (% total) -.02 -.32*
Unemployment rate -.13 -.08
Regressions (b)
Model 1
Uncertainty avoidance (GLOBE) .65*** –
GDP per capita .02 –
GINI Index .15 –
Model 2
Corruption perception index – -.48*
GDP per capita – -.02
Life expectation at birth – .03
Rural population (% total) – -.01
Highly significant (p\ .01) values are shown in bold
* p\ .05, ** p\ .01, *** p\ .001
112 J Nonverbal Behav (2016) 40:101–116
123
smile intensity is also another ripe area for future research (see Kraus and Chen 2013 for
instance).
Despite these limitations, this cross-cultural study illuminates surprising nuances of up-
to-now seemingly clear and obvious processes of smile perception. Although numerous
studies suggest that smiling individuals are perceived favorably, we document that the
same person may be judged as less intelligent when smiling than when posing a neutral
expression in some cultures. This has important practical implications, for example, in the
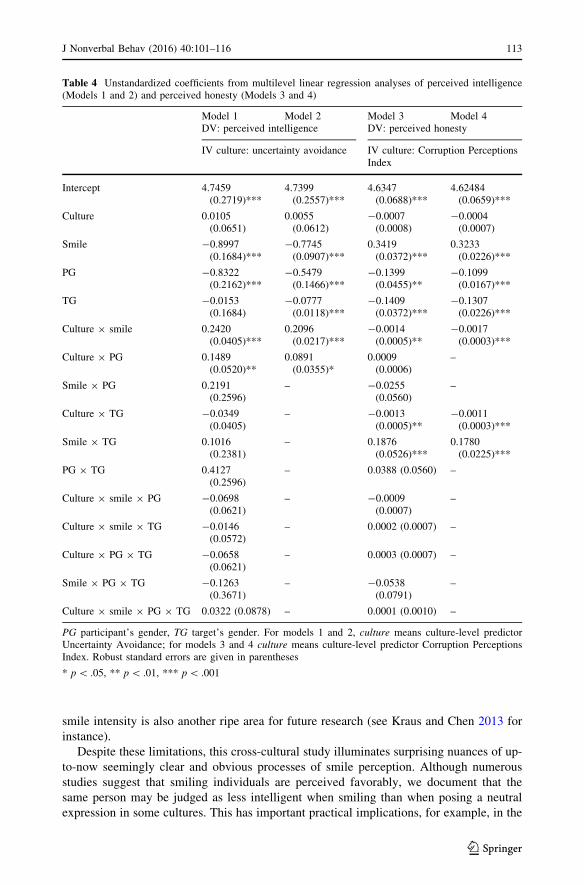
Table 4 Unstandardized coefficients from multilevel linear regression analyses of perceived intelligence(Models 1 and 2) and perceived honesty (Models 3 and 4)
Model 1 Model 2 Model 3 Model 4DV: perceived intelligence DV: perceived honesty
IV culture: uncertainty avoidance IV culture: Corruption PerceptionsIndex
Intercept 4.7459(0.2719)***
4.7399(0.2557)***
4.6347(0.0688)***
4.62484(0.0659)***
Culture 0.0105(0.0651)
0.0055(0.0612)
-0.0007(0.0008)
-0.0004(0.0007)
Smile -0.8997(0.1684)***
-0.7745(0.0907)***
0.3419(0.0372)***
0.3233(0.0226)***
PG -0.8322(0.2162)***
-0.5479(0.1466)***
-0.1399(0.0455)**
-0.1099(0.0167)***
TG -0.0153(0.1684)
-0.0777(0.0118)***
-0.1409(0.0372)***
-0.1307(0.0226)***
Culture 9 smile 0.2420(0.0405)***
0.2096(0.0217)***
-0.0014(0.0005)**
-0.0017(0.0003)***
Culture 9 PG 0.1489(0.0520)**
0.0891(0.0355)*
0.0009(0.0006)
–
Smile 9 PG 0.2191(0.2596)
– -0.0255(0.0560)
–
Culture 9 TG -0.0349(0.0405)
– -0.0013(0.0005)**
-0.0011(0.0003)***
Smile 9 TG 0.1016(0.2381)
– 0.1876(0.0526)***
0.1780(0.0225)***
PG 9 TG 0.4127(0.2596)
– 0.0388 (0.0560) –
Culture 9 smile 9 PG -0.0698(0.0621)
– -0.0009(0.0007)
–
Culture 9 smile 9 TG -0.0146(0.0572)
– 0.0002 (0.0007) –
Culture 9 PG 9 TG -0.0658(0.0621)
– 0.0003 (0.0007) –
Smile 9 PG 9 TG -0.1263(0.3671)
– -0.0538(0.0791)
–
Culture 9 smile 9 PG 9 TG 0.0322 (0.0878) – 0.0001 (0.0010) –
PG participant’s gender, TG target’s gender. For models 1 and 2, culture means culture-level predictorUncertainty Avoidance; for models 3 and 4 culture means culture-level predictor Corruption PerceptionsIndex. Robust standard errors are given in parentheses
* p\ .05, ** p\ .01, *** p\ .001
J Nonverbal Behav (2016) 40:101–116 113
123
context of globalization and job applications. In many countries it is still common to
submit photographs on one’s CV. Knowing whether a smile is interpreted positively (i.e.,
as a sign of competence and trustworthiness) or negatively may be crucial knowledge for
international applicants (also see Ruben et al. 2014).
Furthermore, this study advances theory about nonverbal behavior in important ways.
By recognizing processes underlying the two cultural dimensions used in perceiving
smiles, we indicate that those seemingly counter-intuitive findings reflect on highly
functional strategies in their own cultural context (also see Matsumoto 2006). Expressing
certainty in uncertain social conditions may not be the best way of signalling intelligence
(Hypothesis 1), and signalling unconditional trust in untrustworthy settings may be risky
(Hypothesis 2). Our research underscores the importance of the cultural framework in
understanding nonverbal communication processes and reveals that although positive traits
are usually attributed to smiling persons, perception of this common nonverbal signal may
have unexpected negative implications in some cultures.
Acknowledgments We thank all the supporting team-members involved in the translation procedures anddata collections. Research was supported by the Polish NCN Grant 2011/03/N/HS6/05112 (K.K.) andChinese NNSF Grant 31200788 (C.X).
Open Access This article is distributed under the terms of the Creative Commons Attribution 4.0 Inter-national License (http://creativecommons.org/licenses/by/4.0/), which permits unrestricted use, distribution,and reproduction in any medium, provided you give appropriate credit to the original author(s) and thesource, provide a link to the Creative Commons license, and indicate if changes were made.
References
Abe, J., Beetham, M., & Izard, C. (2002). What do smiles mean? An analysis in terms of differentialemotions theory. In A. Millicent (Ed.), The smile: Forms, functions, and consequences (pp. 83–110).New York: The Edwin Mellen Press.
Abele, A., & Wojciszke, B. (2013). The Big Two in social judgment and behavior. Social Psychology, 44,61–62.
Abele, A., & Wojciszke, B. (2014). Communal and agentic content in social cognition. A dual perspectivemodel. Advances in Experimental Social Psychology, 50, 195–255.
Bakan, D. (1966). The duality of human existence. Chicago: Rand McNally.Bedford, N., Fallon, S., & McAdam, M. (2008). Lonely planet—Destination Poland. Oakland, CA: LPP.Bond, M., Leung, K., Au, A., Tong, K.-K., De Carrasquel, S., Murakami, F., et al. (2004). Culture-level
dimensions of social axioms and their correlates across 41 cultures. Journal of Cross-Cultural Psy-chology, 35, 548–570.
Brislin, R. (1970). Back-translation for cross-cultural research. Journal of Cross-Cultural Psychology, 1,185–216.
Brody, L., & Hall, J. (2008). Gender and emotion in context. In M. Lewis, J. Haviland-Jones, & L. FeldmanBarrett (Eds.), Handbook of emotions (pp. 395–408). New York: Guilford Press.
Centorrino, S., Djemai, E., Hopfensitz, A., Milinski, M., & Seabright, P. (2015). Honest signalling in trustinteractions: Smiles rated as genuine induce trust and signal higher earnings opportunities. Evolutionand Human Behavior, 36, 8–16.
Chang, B., & Vermeulen, N. (2010). Re-thinking the causes, processes, and consequences of simulation.Behavioral and Brain Sciences, 33, 441–442.
Darwin, C. (1872/1998). The expression of the emotions in man and animals. Oxford: Oxford UniversityPress.
Duchenne, C. (1862). The mechanism of human facial expression. New York: Cambridge University Press.Dunton, B., & Fazio, R. (1997). An individual difference measure of motivation to control prejudiced
reactions. Personality and Social Psychology Bulletin, 23, 316–326.Ekman, P. (2009). Lie catching and microexpressions. In C. Martin (Ed.), The philosophy of deception (pp.
118–133). Oxford: Oxford University Press.
114 J Nonverbal Behav (2016) 40:101–116
123
Ekman, P., & Friesen, W. (1982). Felt, false, and miserable smiles. Journal of Nonverbal Behavior, 6,238–252.
EURES. (2010). Living and working in Norway. http://www.eures.dk/JobSeeker/Landeinfo-og-jobdatabaser/Norden/Living_and_working_in_Norway_%28engelsk%29.aspx.
Fiske, S., Cuddy, A., & Glick, P. (2006). Universal dimensions of social cognition: Warmth and compe-tence. Trends in Cognitive Science, 11, 77–83.
Fridlund, A. (2002). The behavioral ecology view of smiling and other facial expressions. In A. Millicent(Ed.), The smile: Forms, functions, and consequences (pp. 45–82). New York: The Edwin MellenPress.
Hall, J. (1984). Nonverbal sex differences: Communication accuracy and expressive style. Baltimore: JohnsHopkins University Press.
Hareli, S., & Hess, U. (2010). What emotional reactions can tell us about the nature of others: An appraisalperspective on person perception. Cognition and Emotion, 24, 128–140.
Henrich, J., Heine, S., & Norenzayan, A. (2010). The weirdest people in the world? Behavioral and BrainSciences, 33, 61–83.
Hess, U., Blairy, S., & Kleck, R. (2000). The influence of expression intensity, gender, and ethnicity onjudgments of dominance and affiliation. Journal of Nonverbal Behavior, 24, 265–283.
Hess, U., Beaupre, M., & Cheung, N. (2002). To whom and why—cultural differences and similarities in thefunction of smiles. In A. Millicent (Ed.), The smile: Forms, functions, and consequences (pp.187–216). New York: The Edwin Mellen Press.
Hess, U., Adams, R., & Kleck, R. (2009). The categorical perception of emotions and traits. Social Cog-nition, 27, 319–325.
Hofstede, G. (2001). Culture’s consequences: Comparing values, behaviors, institutions and organizationsacross nations. Thousand Oaks: Sage.
House, R., Hanges, P., Javidan, M., Dorfman, P., & Gupta, V. (2004). Culture, leadership, and organiza-tions. The GLOBE study of 62 societies. Thousand Oaks: Sage.
Kraus, M., & Chen, T. (2013). A winning smile? Smile intensity, physical dominance, and fighter perfor-mance, Emotion, 13, 270–279.
Krumhuber, E., Manstead, A., & Kappas, A. (2007). Temporal aspects of facial displays in person andexpression perception: The effects of smile dynamics, head-tilt, and gender. Journal of NonverbalBehaviour, 31, 39–56.
Krys, K., Hansen, K., Xing, C., Szarota, P., & Yang, M. (2014). Do only fools smile at strangers? Culturaldifferences in social perception of intelligence of smiling individuals. Journal of Cross-CulturalPsychology, 45, 314–321.
Krys, K., Hansen, K., Xing, C., Espinoza, A., Szarota, P., & Morales, M. (2015). It is better to smile towomen: Gender modifies perception of honesty of smiling individuals across cultures. InternationalJournal of Psychology, 50, 150–154.
LaFrance, M., Hecht, M., & Paluck, E. (2003). The contingent smile: A meta-analysis of sex differences insmiling. Psychological Bulletin, 129, 305–334.
Leung, K., & Bond, M. H. (2004). Social axioms: A model of social beliefs in multi-cultural perspective. InM. P. Zanna (Ed.), Advances in experimental social psychology. San Diego, CA: Academic Press.
Leung, A., & Cohen, D. (2011). Within- and between-culture variation: Individual differences and thecultural logics of honor, face, and dignity cultures. Journal of Personality and Social Psychology, 10,507–526.
Matsumoto, D. (2006). Culture and nonverbal behavior. In V. Manusov & M. Patterson (Eds.), The SAGEhandbook of nonverbal communication (pp. 219–235). Thousand Oaks: Sage.
Matsumoto, D., & Kudoh, T. (1993). American–Japanese cultural differences in attributions of personalitybased on smiles. Journal of Nonverbal Behavior, 17, 231–243.
Matsumoto, D., & Willingham, B. (2009). Spontaneous facial expressions of emotion of congenitally andnoncongenitally blind individuals. Journal of Personality and Social Psychology, 96, 1–10.
Mehu, M. (2011). Smiling and laughter in naturally occurring dyadic interactions: Relationship to con-versation, body contacts, and displacement activities. Human Ethology Bulletin, 26, 10–28.
Mehu, M., & Dunbar, R. (2008). Naturalistic observations of smiling and laughter in human group inter-actions. Behaviour, 145, 1747–1780.
Miles, L. (2009). Who is approachable? Journal of Experimental Social Psychology, 45, 262–266.Minear, M., & Park, D. (2004). A lifespan database of adult facial stimuli. Behavior Research Methods,
Instruments, & Computers, 36, 630–633.Niedenthal, P., Mermillod, M., Maringer, M., & Hess, U. (2010). The Simulation of Smiles (SIMS) Model:
Embodied simulation and the meaning of facial expression. Behavioral and Brain Sciences, 33,417–433.
J Nonverbal Behav (2016) 40:101–116 115
123
Otta, E., Lira, B., Delevati, N., Cesar, O., & Pires, C. (1994). The effect of smiling and of head tilting onperson perception. Journal of Psychology: Interdisciplinary and Applied, 128, 323–331.
Palmer, M., & Simmons, K. (1995). Communicating intentions through nonverbal behaviors. HumanCommunication Research, 22, 128–160.
Rosenberg, M. (1965). Society and the adolescent self-image. Princeton, NJ: Princeton University Press.Ruben, M., Hall, J., & Schmid Mast, M. (2014). Smiling in a job interview: When less is more. Journal of
Social Psychology, 155, 107–126.Rychlowska, M., Miyamoto, Y., Matsumoto, D., Hess, U., Gilboa-Schechtman, E., Kamble, S., et al. (2015).
Heterogeneity of long-history migration explains cultural differences in reports of emotional expres-sivity and the functions of smiles. PNAS, 112, E2429–E2436.
Smith, P., Fischer, R., Vignoles, V., & Bond, M. (2013). Understanding social psychology across cultures.Engaging with others in a changing world. London: Sage.
The Heritage Foundation. (2010). Index of economic freedom. http://www.heritage.org/index/download.Thibault, P., Levesque, M., Gosselin, P., & Hess, U. (2012). The Duchenne marker is NOT a universal
signal of smile authenticity: But it can be learned! Social Psychology, 43, 215–221.Transparency International. (2010a). Corruption Perceptions Index. http://www.transparency.org/cpi2010/
results.Transparency International. (2010b). Global corruption barometer. http://www.transparency.org/
gcb201011.Warner-Søderholm, G. (2010). Understanding perceptions of cultural and intracultural societal practices
and values of Norwegian managers (Doctoral dissertation). University of Reading: Reading.Weisbuch, M., Ambady, N., Clarke, A., Achor, S., & Weele, J. (2010). On being consistent: The role of
verbal–nonverbal consistency in first impressions. Basic and Applied Social Psychology, 32, 261–268.Wormann, V., Holodynski, M., Kartner, J., & Keller, H. (2014). The emergence of social smiling: The
interplay of maternal and infant imitation during the first three months in cross-cultural comparison.Journal of Cross-Cultural Psychology, 45, 339–361.
116 J Nonverbal Behav (2016) 40:101–116
123