Embed Size (px)
Citation preview
Natural ResourcesCanada
Ressources naturellesCanada
Canadian ForestService
Service canadiendes forêts
Canadian Forest ServiceEffects of Forestry Practices Network
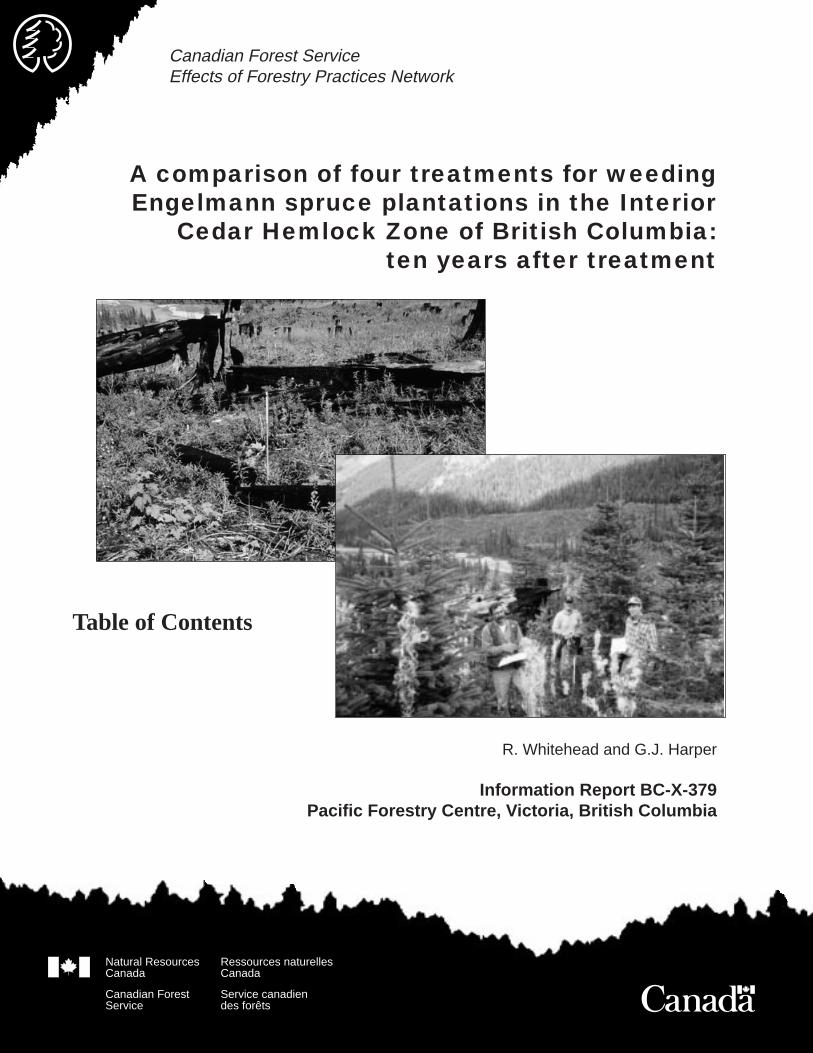
A comparison of four treatments for weedingEngelmann spruce plantations in the Interior
Cedar Hemlock Zone of British Columbia:ten years after treatment
R. Whitehead and G.J. Harper
Information Report BC-X-379Pacific Forestry Centre, Victoria, British Columbia
Table of Contents
The Pacific Forestry Centre, Victoria, British Columbia
The Pacific Forestry Centre of the Canadian Forest Service undertakes research as part of a national network systemresponding to the needs of various forest resource managers. The results of this research are distributed in the formof scientific and technical reports and other publications.
Additional information on Natural Resources Canada, the Canadian Forest Service, and Pacific Forestry Centreresearch and publications is also available on the World Wide Web at http://www.pfc.cfs.nrcan.gc.ca/.
The Effects of Forestry Practices Network
The responsible stewardship and management of Canada’s forest heritage, for present and future generations, is akey element in the future of our environment, our trade and our business relationships around the world. However,Canada’s forests do not adhere to the artificial boundaries between provinces and landowners. Therefore, co-operation between governments and other forest managers is imperative. As Canada’s major national forestresearch organization the Canadian Forest Service (CFS) has a major role to play. By developing scientificallysound forest management techniques and methods of sharing this information, Canada can assure its people and itscustomers that the best possible forest practices are being used. The Effects of Forestry Practices Network (EFPN)has been established to lead this effort.
A comparison of four treatments for weeding Engelmannspruce plantations in the Interior Cedar Hemlock Zone of
British Columbia: ten years after treatment
Roger J. WhiteheadCanadian Forest ServicePacific Forestry Centre
and
George J. HarperBritish Columbia Ministry of Forests
Research BranchVictoria
Pacific Forestry Centre
BC-X-379
1998
ii
Canadian Forest ServicePacific Forestry Centre506 West Burnside RoadVictoria, British ColumbiaV8Z 1M5Phone (250) 363-0600
© Her Majesty the Queen in Right of Canada, 1998
Printed in Canada
Canadian Cataloguing in Publication Data
Whitehead, Roger J.
A comparison of four treatments for weeding Engelmann spruce plantations in the interior cedar hemlock zone ofBritish Columbia: ten years after treatment
(Information report; ISSN 0830-0453; BC-X-379)Includes an abstract in French.Includes bibliographical references.ISBN 0-662-26608-0Cat. no. Fo46-17/379E
1. Engelmann spruce—British Columbia—Growth.2. Spruce—British Columbia—Growth.3. Vegetation management—British Columbia.4. Weeds—Control—British Columbia.I. Harper, George James, 1959-II Pacific Forestry Centre.III. Title.IV. Series: Information report (Pacific Forestry Centre); BC-X-379.
SD397.S77W44 1998 634.9’752’09711 C98-980068-7

iii
Contents
Abstract . . . . . . . . . . . . . . . . . . . . . . . . . . . . . . . . . . . . . . . . . . . . . . . . . . . . . . . . . . . . . . . . . . . . . . v
Resume . . . . . . . . . . . . . . . . . . . . . . . . . . . . . . . . . . . . . . . . . . . . . . . . . . . . . . . . . . . . . . . . . . . . . . vi
Acknowledgements. . . . . . . . . . . . . . . . . . . . . . . . . . . . . . . . . . . . . . . . . . . . . . . . . . . . . . . . . . . . . vi
Introduction . . . . . . . . . . . . . . . . . . . . . . . . . . . . . . . . . . . . . . . . . . . . . . . . . . . . . . . . . . . . . . . . . . . 1
Background . . . . . . . . . . . . . . . . . . . . . . . . . . . . . . . . . . . . . . . . . . . . . . . . . . . . . . . . . . . . . . . . 1
Objectives. . . . . . . . . . . . . . . . . . . . . . . . . . . . . . . . . . . . . . . . . . . . . . . . . . . . . . . . . . . . . . . . . . 1
Study area. . . . . . . . . . . . . . . . . . . . . . . . . . . . . . . . . . . . . . . . . . . . . . . . . . . . . . . . . . . . . . . . . . 1
Methods . . . . . . . . . . . . . . . . . . . . . . . . . . . . . . . . . . . . . . . . . . . . . . . . . . . . . . . . . . . . . . . . . . . 2
Treatments studied and experimental design . . . . . . . . . . . . . . . . . . . . . . . . . . . . . . . . . . . . . 2
Measures and records. . . . . . . . . . . . . . . . . . . . . . . . . . . . . . . . . . . . . . . . . . . . . . . . . . . . . . . 5
Data summary and statistical analyses. . . . . . . . . . . . . . . . . . . . . . . . . . . . . . . . . . . . . . . . . . 5
Results . . . . . . . . . . . . . . . . . . . . . . . . . . . . . . . . . . . . . . . . . . . . . . . . . . . . . . . . . . . . . . . . . . . . . . . 7
Target vegetation control . . . . . . . . . . . . . . . . . . . . . . . . . . . . . . . . . . . . . . . . . . . . . . . . . . . . . . 7
Conifer survival . . . . . . . . . . . . . . . . . . . . . . . . . . . . . . . . . . . . . . . . . . . . . . . . . . . . . . . . . . . . 11
Conifer height . . . . . . . . . . . . . . . . . . . . . . . . . . . . . . . . . . . . . . . . . . . . . . . . . . . . . . . . . . . . . 11
Conifer diameter . . . . . . . . . . . . . . . . . . . . . . . . . . . . . . . . . . . . . . . . . . . . . . . . . . . . . . . . . . . 14
Height:diameter ratio . . . . . . . . . . . . . . . . . . . . . . . . . . . . . . . . . . . . . . . . . . . . . . . . . . . . . . . . 15
Competition index . . . . . . . . . . . . . . . . . . . . . . . . . . . . . . . . . . . . . . . . . . . . . . . . . . . . . . . . . . 16
Discussion . . . . . . . . . . . . . . . . . . . . . . . . . . . . . . . . . . . . . . . . . . . . . . . . . . . . . . . . . . . . . . . . . . . 17
Summary and conclusions . . . . . . . . . . . . . . . . . . . . . . . . . . . . . . . . . . . . . . . . . . . . . . . . . . . . . . . 19
References . . . . . . . . . . . . . . . . . . . . . . . . . . . . . . . . . . . . . . . . . . . . . . . . . . . . . . . . . . . . . . . . . . . 20
iv
Tables
1. Treatment levels tested . . . . . . . . . . . . . . . . . . . . . . . . . . . . . . . . . . . . . . . . . . . . . . . . . . . . . . . . 4
2. Crop seedling and target vegetation assessment dates. . . . . . . . . . . . . . . . . . . . . . . . . . . . . . . . . 4
3. ANOVA model for individual year conifer and target vegetation data. . . . . . . . . . . . . . . . . . . . 4
4. Mean percent cover of target vegetation by species, treatment, and year . . . . . . . . . . . . . . . . . 10
5. Percent survival of conifer seedlings following treatment . . . . . . . . . . . . . . . . . . . . . . . . . . . . 11
6. Results of operational silviculture survey conducted in October 1993 . . . . . . . . . . . . . . . . . . . 11
7. p-values based on ANOVA of estimated growth parameters . . . . . . . . . . . . . . . . . . . . . . . . . . 13
8. p-values based on repeated-measures ANOVA of block means of crop response variables . . 13
Figures
1. Location of study site. . . . . . . . . . . . . . . . . . . . . . . . . . . . . . . . . . . . . . . . . . . . . . . . . . . . . . . . . . 2
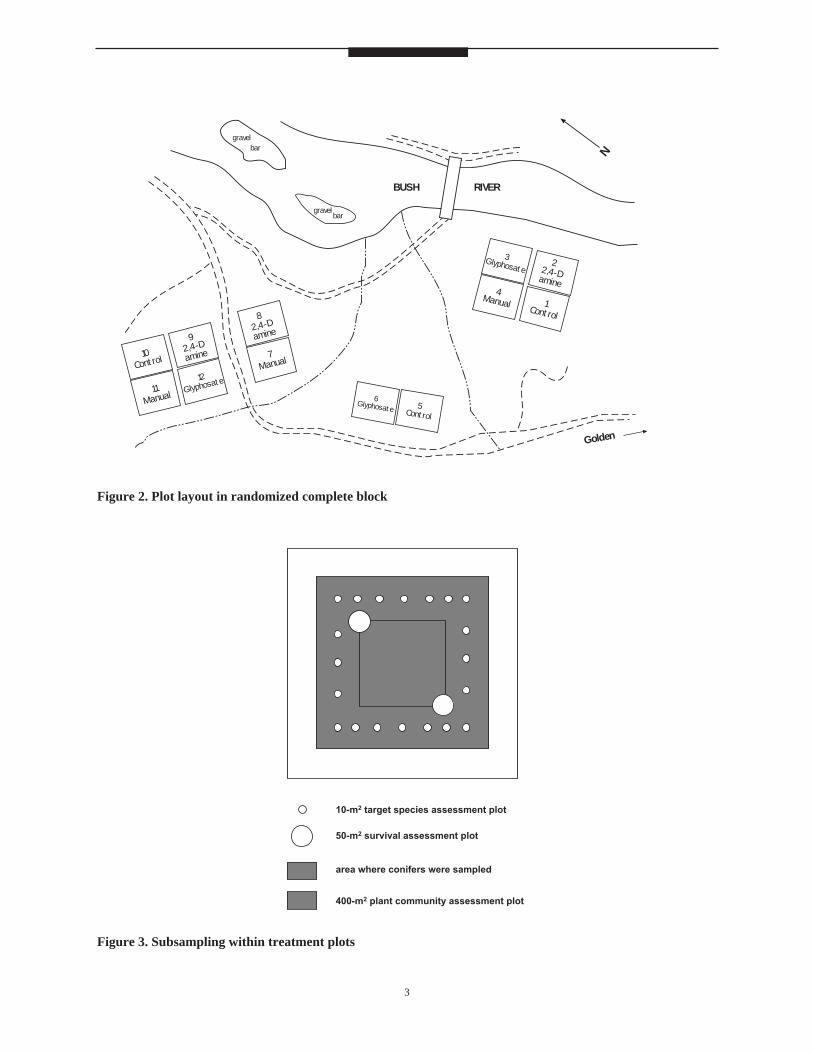
2. Plot layout in randomized complete block . . . . . . . . . . . . . . . . . . . . . . . . . . . . . . . . . . . . . . . . . 3
3. Subsampling within treatment plots . . . . . . . . . . . . . . . . . . . . . . . . . . . . . . . . . . . . . . . . . . . . . . 3
4. Percent cover of major target complex 1986-1991 . . . . . . . . . . . . . . . . . . . . . . . . . . . . . . . . . . . 8
5. Modal height of major target complex 1986-1991 . . . . . . . . . . . . . . . . . . . . . . . . . . . . . . . . . . . 8
6. Mean height of thimbleberry, by treatment, 1986-1991 . . . . . . . . . . . . . . . . . . . . . . . . . . . . . . . 8
7. Mean height of raspberry, by treatment, 1986-1991 . . . . . . . . . . . . . . . . . . . . . . . . . . . . . . . . . . 9
8. Mean height of fireweed, by treatment, 1986-1991. . . . . . . . . . . . . . . . . . . . . . . . . . . . . . . . . . . 9
9. Height of seedlings planted May 1984 . . . . . . . . . . . . . . . . . . . . . . . . . . . . . . . . . . . . . . . . . . . 12
10. Height of seedlings planted June 1986 . . . . . . . . . . . . . . . . . . . . . . . . . . . . . . . . . . . . . . . . . . 12
11. Diameter of seedlings planted May 1984 . . . . . . . . . . . . . . . . . . . . . . . . . . . . . . . . . . . . . . . . 14
12. Diameter of seedlings planted June 1986 . . . . . . . . . . . . . . . . . . . . . . . . . . . . . . . . . . . . . . . . 14
13. Height to diameter ratio of seedlings planted May 1984. . . . . . . . . . . . . . . . . . . . . . . . . . . . . 15
14. Height to diameter ratio of seedlings planted June 1986. . . . . . . . . . . . . . . . . . . . . . . . . . . . . 15
15. Competition index for five years post-treatment for 1986 planting . . . . . . . . . . . . . . . . . . . . 16
16. Competition index for five years post-treatment for 1984 planting . . . . . . . . . . . . . . . . . . . . 16
v
Abstract
In 1986, a field trial was established to test options for brushing young, shrub-dominated Engelmann spruceplantations in the moist warm Interior Cedar Hemlock biogeoclimatic subzone of British Columbia. Twelve 60 m ×60 m treatment plots were established in a randomized complete block design for three replicates of four treatments.Percent cover and height of thimbleberry, raspberry and fireweed was assessed before and up to five years aftertreatment. Conifer height, diameter and condition were measured before and up to ten years after treatment. Of thethree treatments compared to an untreated control, broadcast application of glyphosate in late August at 1.8 kga.i./ha was most effective in reducing cover and height of the major target complex. In comparison, manual cuttingand broadcast application of 2,4-D amine at 3.0 kg a.e./ha had minor and short-lived effects. Engelmann spruceseedlings responded positively to reduction of cover and height of the target vegetation complex. Indicators ofcompetitive stress, including seedling height:diameter ratio and competition index, were reduced followingglyphosate treatment and remained at lower levels relative to all other treatments tested throughout themeasurement period. Conifer height and diameter growth curves for the four treatments diverged over time, withseedlings in the glyphosate treatment growing at a faster rate than seedlings in all other treatments. Plots leftuntreated, manually cut, or treated with 2,4-D amine failed to meet minimum stocking standards in an operationalsilviculture survey conducted in 1993, eight years after treatment. By July of 1994, the plots treated with glyphosatesatisfied all criteria for stocking, freedom from competition and annual growth rate set as standards for successfulplantation performance in the ecosystem-specific guidelines of the Forest Practices Code of British Columbia.
Résumé
Un essai sur le terrain a été entrepris en 1986 pour vérifier diverses options de débroussaillement dans de jeunesplantations d’épinettes d’Engelmann dominées par des arbustes et situées dans la sous-zone biogéoclimatiquehumide et chaude à thuya et à pruche de l’intérieur de la Colombie-Britannique. Douze parcelles de 60 m2 ont étéimplantées suivant un plan expérimental en blocs aléatoires complets comportant trois répétitions pour chacun desquatre traitements. Le pourcentage de couverture et la hauteur de la ronce à petites fleurs, du framboisier et del’épilobe à feuilles étroites ont été évalués avant le traitement et jusqu’à cinq ans après. La hauteur, le diamètre etl’état des conifères ont été mesurés avant le traitement et jusqu’à dix ans après. Le traitement en plein au glyphosateeffectué à la fin d’août, à raison de 1,8 kg m.a./ha, était celui des trois traitements qui, comparés à une parcelletémoin, a été le plus efficace pour réduire la couverture et la hauteur du principal complexe de mauvaises herbesciblé. Par comparaison, le débroussaillement manuel et le traitement en plein au 2,4-D amine à une dose de 3,0 kgEA/ha ont eu des effets mineurs et éphémères. Les semis d’épinette d’Engelmann ont bien réagi à une diminutionde la couverture et de la hauteur du complexe de mauvaises herbes ciblé. Les indicateurs du stress causé par laconcurrence, y compris le rapport hauteur/diamètre des semis et l’indice de concurrence, ont diminué après letraitement au glyphosate et sont restés à des niveaux plus faibles que dans tous les autres traitements pendant lapériode de mesure. Les courbes d’accroissement en hauteur et en diamètre des conifères des quatre traitementsdivergeaient dans le temps, les semis traités au glyphosate présentant une croissance plus rapide que ceux de tousles autres traitements. Un relevé sylvicole opérationnel effectué en 1993, soit huit ans après les traitements, a permisde constater que les parcelles non traitées, débroussaillées à la main et traitées au 2,4-D amine ne satisfaisaient pasaux normes de densité relative minimale. Dès juillet 1994, les parcelles traitées au glyphosate étaient conformes auxcritères de densité relative, d’autonomie de croissance et de taux annuel de croissance. Ces critères constituent lesnormes fixées dans les lignes directrices propres aux écosystèmes du Code de pratiques forestières de la Colombie-Britannique pour évaluer la performance d’une plantation.

vi
Acknowledgements
The authors gratefully acknowledge the contributions of Brett Salmon, Laird Pittman (Evans Forest Products Ltd.)and Chris Thompson (B.C. Ministry of Forests, Nelson Region) for assistance in trial establishment, R. Keith King(Canadian Forest Service) for coordinating field work throughout the conduct of the study, Barry N. Brown(Canadian Forest Service) for assistance with data processing and analyses, Dr. Amanda F. Linnel Nemec(International Statistics and Research Corp.) for assistance with statistical design and analysis of conifer growthpatterns; Dr. Phil Comeau (B.C. Ministry of Forests), Jim Wood, Dr. Brian Titus and Dr. John Manville (CanadianForest Service) for their helpful reviews of this manuscript; Steve Glover for editorial assistance; and JenniferAdsett for graphics and production.
This research was funded in part by the Canada-British Columbia Forest Resource Development Agreement (1985-1990), the Canada-British Columbia Partnership Agreement on Forest Resource Development (FRDA II) and byForest Renewal British Columbia.
Introduction
Background
Importance of vegetation management during forest crop establishment in the more productive ecosystems ofBritish Columbia was broadly recognized by the mid nineteen eighties. The area of crown forest land treated forvegetation management increased from only 3000 ha in 1980 to 77 000 ha by 1990 (Hart and Comeau 1992). Aneed for ecosystem-specific information on the effectiveness of vegetation control treatments in specific brushcomplexes, and the longer-term response of conifer seedlings and plantations, was soon identified (Conard 1984;Sutton 1985a). A major research effort, funded primarily by the Canada-British Columbia Forest ResourceDevelopment Agreements, was initiated to address this need in British Columbia.
The most productive biogeoclimatic zone for timber growth in the interior of British Columbia is the Interior CedarHemlock (ICH) zone (Ketcheson et al. 1991). Mixed shrub and herb complexes often occupy moist and rich sitesvery soon after harvest and site preparation in this zone, and early survival and growth of conifer plantations can beseverely reduced by physical damage or by competition for light and limited growing space (Coates et al. 1994).Species of major concern in the ICH include those which rapidly exploit openings through vegetative means afterdisturbance, such as thimbleberry (Rubus parviflorus Nutt.), red raspberry (Rubus idaeus L.) and fireweed(Epilobium angustifolium L.) (Haeussler and Coates 1986).
After extensive consultation with forest managers in the Nelson Forest Region during the winter of 1985, theCanadian Forest Service established a research trial in the Golden Forest District near Bush River to examineefficacy of four brushing options in a young Engelmann spruce (Picea Engelmannii Parry) plantation overtopped bya Rubus-Epilobium brush complex.
Objectives
The Bush River study had three main objectives:
• to compare the effect of four vegetation control treatments on percent cover and height of a Rubus-Epilobiumbrush complex;
• to compare the effect of four vegetation control treatments on survival and growth performance of plantedEngelmann spruce seedlings; and,
• to describe the effects of four vegetation control treatments on vegetation community dynamics and on wildlifeforage values.
This report addresses the first two objectives, discussing vegetation control efficacy over a five-year period andconifer growth responses for a ten-year period following application of four treatment options. The third objectivewas addressed by Clement and Keeping (1996).
Study area
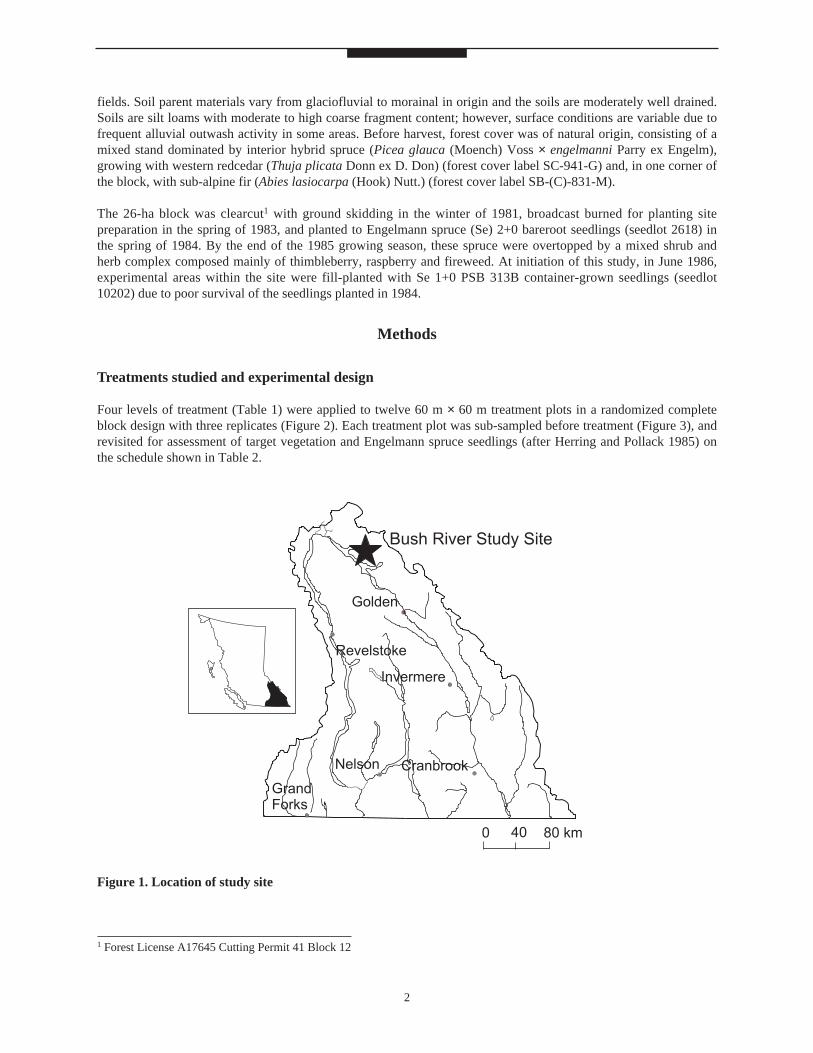
The study area is located on a site with mesic to subhygric hygrotope and meso to permosotropic trophotope at Lat.51˚55′N; Long. 117˚21′W, in the ICHmw1 (Golden Moist Warm Interior Cedar Hemlock biogeoclimatic variant)(Braumandl and Curran 1992). The site is located on the lower mesoslope position above the Bush River at anelevation of approximately 900 m (Figure 1). The aspect is south-easterly (145˚) on a slope of between 5% and20%. Above the block, the valley rises steeply to the spectacular backdrop of the Rocky Mountains.
The climate is typical for the ICHmw1 but influenced by cold air drainage from the surrounding mountains and ice
1
fields. Soil parent materials vary from glaciofluvial to morainal in origin and the soils are moderately well drained.Soils are silt loams with moderate to high coarse fragment content; however, surface conditions are variable due tofrequent alluvial outwash activity in some areas. Before harvest, forest cover was of natural origin, consisting of amixed stand dominated by interior hybrid spruce (Picea glauca (Moench) Voss × engelmanni Parry ex Engelm),growing with western redcedar (Thuja plicata Donn ex D. Don) (forest cover label SC-941-G) and, in one corner ofthe block, with sub-alpine fir (Abies lasiocarpa (Hook) Nutt.) (forest cover label SB-(C)-831-M).
The 26-ha block was clearcut1 with ground skidding in the winter of 1981, broadcast burned for planting sitepreparation in the spring of 1983, and planted to Engelmann spruce (Se) 2+0 bareroot seedlings (seedlot 2618) inthe spring of 1984. By the end of the 1985 growing season, these spruce were overtopped by a mixed shrub andherb complex composed mainly of thimbleberry, raspberry and fireweed. At initiation of this study, in June 1986,experimental areas within the site were fill-planted with Se 1+0 PSB 313B container-grown seedlings (seedlot10202) due to poor survival of the seedlings planted in 1984.
Methods
Treatments studied and experimental design
Four levels of treatment (Table 1) were applied to twelve 60 m × 60 m treatment plots in a randomized completeblock design with three replicates (Figure 2). Each treatment plot was sub-sampled before treatment (Figure 3), andrevisited for assessment of target vegetation and Engelmann spruce seedlings (after Herring and Pollack 1985) onthe schedule shown in Table 2.
2
Figure 1. Location of study site
1 Forest License A17645 Cutting Permit 41 Block 12
3
Figure 2. Plot layout in randomized complete block
BUSH RIVER
gravel
Golden
10Control
11Manual
92,4-Damine
12Glyphosate
82,4-Damine
7Manual
5Control
6Glyphosate
1Control
4Manual
22,4-Damine
3Glyphosate
gravel
bar
bar
N
Figure 3. Subsampling within treatment plots
10-m2 target species assessment plot
50-m2 survival assessment plot
area where conifers were sampled
400-m2 plant community assessment plot
4
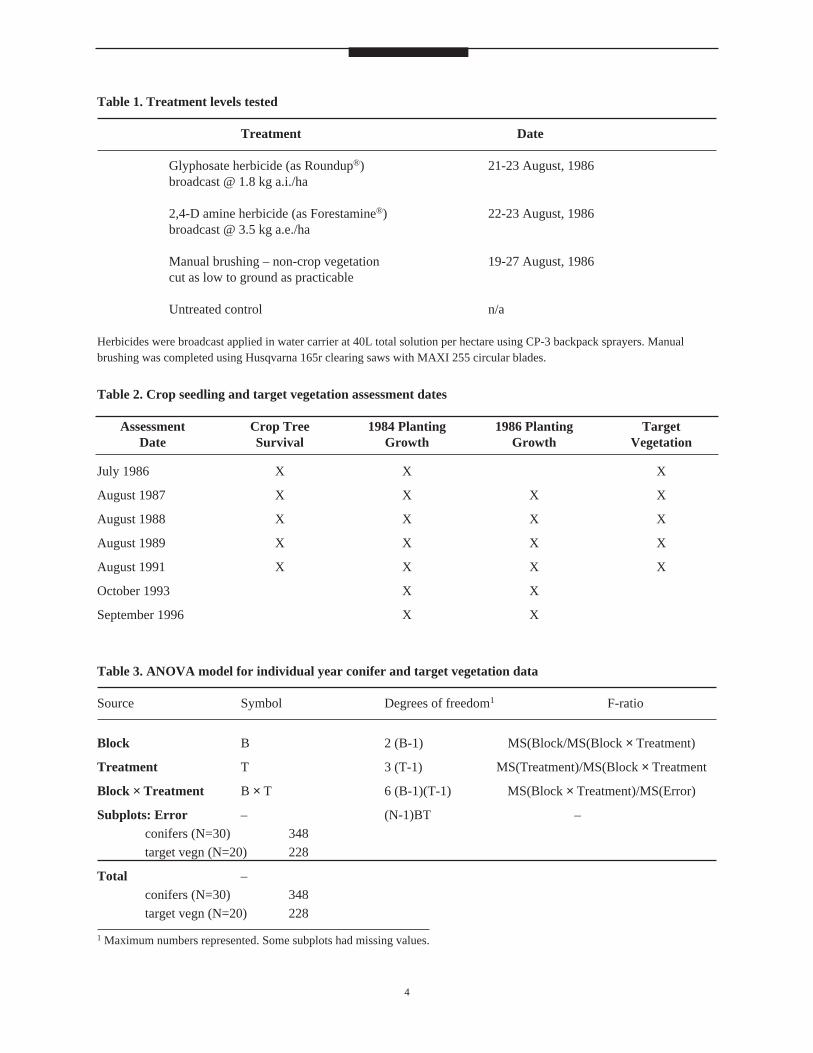
Table 1. Treatment levels tested
Treatment Date
Glyphosate herbicide (as Roundup®) 21-23 August, 1986broadcast @ 1.8 kg a.i./ha
2,4-D amine herbicide (as Forestamine®) 22-23 August, 1986broadcast @ 3.5 kg a.e./ha
Manual brushing – non-crop vegetation 19-27 August, 1986cut as low to ground as practicable
Untreated control n/a
Herbicides were broadcast applied in water carrier at 40L total solution per hectare using CP-3 backpack sprayers. Manualbrushing was completed using Husqvarna 165r clearing saws with MAXI 255 circular blades.
Table 3. ANOVA model for individual year conifer and target vegetation data
Source Symbol Degrees of freedom1 F-ratio
Block B 2 (B-1) MS(Block/MS(Block × Treatment)
Treatment T 3 (T-1) MS(Treatment)/MS(Block × Treatment
Block × Treatment B × T 6 (B-1)(T-1) MS(Block × Treatment)/MS(Error)
Subplots: Error – (N-1)BT –
conifers (N=30) 348
target vegn (N=20) 228
Total –
conifers (N=30) 348
target vegn (N=20) 228
1 Maximum numbers represented. Some subplots had missing values.
AssessmentDate
July 1986
August 1987
August 1988
August 1989
August 1991
October 1993
September 1996
Crop TreeSurvival
X
X
X
X
X
1984 PlantingGrowth
X
X
X
X
X
X
X
1986 PlantingGrowth
X
X
X
X
X
X
TargetVegetation
X
X
X
X
X
Table 2. Crop seedling and target vegetation assessment dates
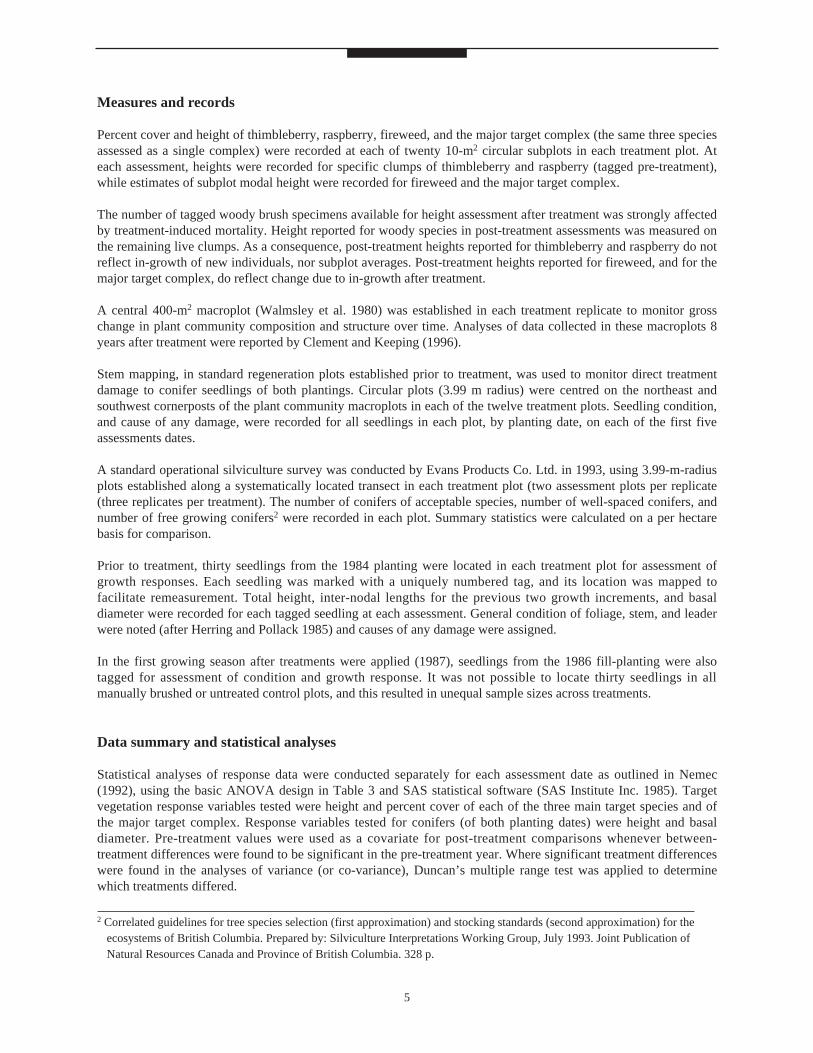
Measures and records
Percent cover and height of thimbleberry, raspberry, fireweed, and the major target complex (the same three speciesassessed as a single complex) were recorded at each of twenty 10-m2 circular subplots in each treatment plot. Ateach assessment, heights were recorded for specific clumps of thimbleberry and raspberry (tagged pre-treatment),while estimates of subplot modal height were recorded for fireweed and the major target complex.
The number of tagged woody brush specimens available for height assessment after treatment was strongly affectedby treatment-induced mortality. Height reported for woody species in post-treatment assessments was measured onthe remaining live clumps. As a consequence, post-treatment heights reported for thimbleberry and raspberry do notreflect in-growth of new individuals, nor subplot averages. Post-treatment heights reported for fireweed, and for themajor target complex, do reflect change due to in-growth after treatment.
A central 400-m2 macroplot (Walmsley et al. 1980) was established in each treatment replicate to monitor grosschange in plant community composition and structure over time. Analyses of data collected in these macroplots 8years after treatment were reported by Clement and Keeping (1996).
Stem mapping, in standard regeneration plots established prior to treatment, was used to monitor direct treatmentdamage to conifer seedlings of both plantings. Circular plots (3.99 m radius) were centred on the northeast andsouthwest cornerposts of the plant community macroplots in each of the twelve treatment plots. Seedling condition,and cause of any damage, were recorded for all seedlings in each plot, by planting date, on each of the first fiveassessments dates.
A standard operational silviculture survey was conducted by Evans Products Co. Ltd. in 1993, using 3.99-m-radiusplots established along a systematically located transect in each treatment plot (two assessment plots per replicate(three replicates per treatment). The number of conifers of acceptable species, number of well-spaced conifers, andnumber of free growing conifers2 were recorded in each plot. Summary statistics were calculated on a per hectarebasis for comparison.
Prior to treatment, thirty seedlings from the 1984 planting were located in each treatment plot for assessment ofgrowth responses. Each seedling was marked with a uniquely numbered tag, and its location was mapped tofacilitate remeasurement. Total height, inter-nodal lengths for the previous two growth increments, and basaldiameter were recorded for each tagged seedling at each assessment. General condition of foliage, stem, and leaderwere noted (after Herring and Pollack 1985) and causes of any damage were assigned.
In the first growing season after treatments were applied (1987), seedlings from the 1986 fill-planting were alsotagged for assessment of condition and growth response. It was not possible to locate thirty seedlings in allmanually brushed or untreated control plots, and this resulted in unequal sample sizes across treatments.
Data summary and statistical analyses
Statistical analyses of response data were conducted separately for each assessment date as outlined in Nemec(1992), using the basic ANOVA design in Table 3 and SAS statistical software (SAS Institute Inc. 1985). Targetvegetation response variables tested were height and percent cover of each of the three main target species and ofthe major target complex. Response variables tested for conifers (of both planting dates) were height and basaldiameter. Pre-treatment values were used as a covariate for post-treatment comparisons whenever between-treatment differences were found to be significant in the pre-treatment year. Where significant treatment differenceswere found in the analyses of variance (or co-variance), Duncan’s multiple range test was applied to determinewhich treatments differed.
5
2 Correlated guidelines for tree species selection (first approximation) and stocking standards (second approximation) for theecosystems of British Columbia. Prepared by: Silviculture Interpretations Working Group, July 1993. Joint Publication ofNatural Resources Canada and Province of British Columbia. 328 p.
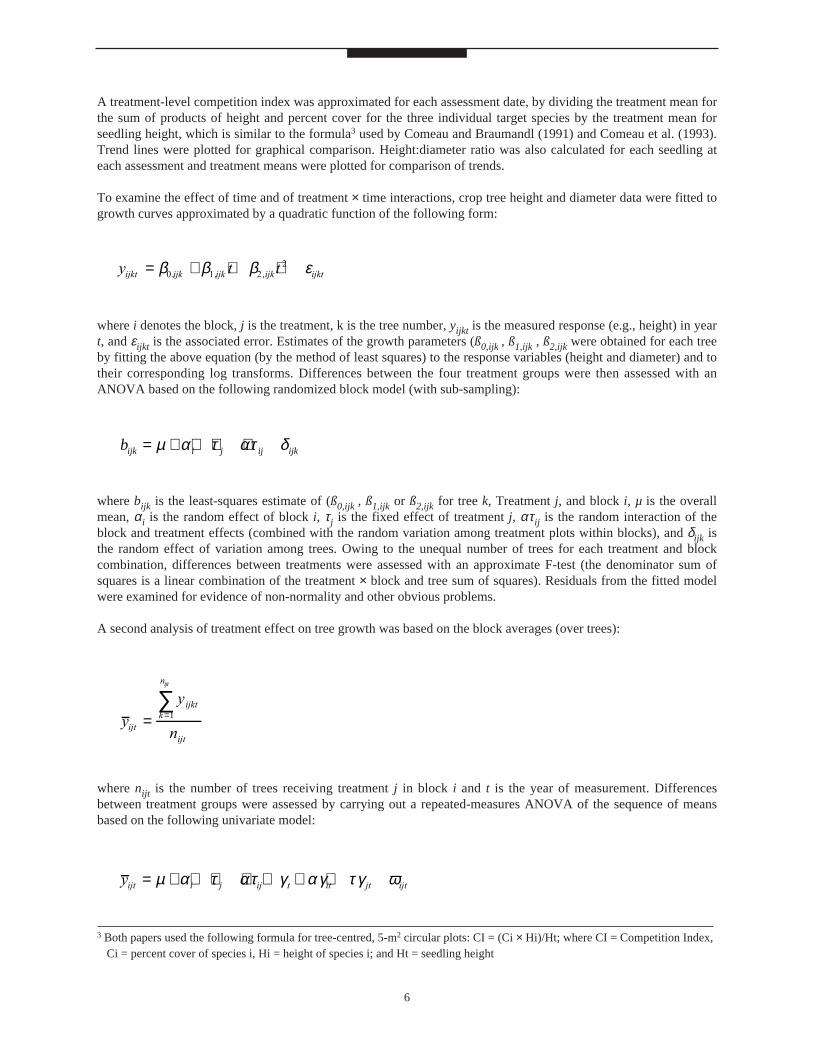
A treatment-level competition index was approximated for each assessment date, by dividing the treatment mean forthe sum of products of height and percent cover for the three individual target species by the treatment mean forseedling height, which is similar to the formula3 used by Comeau and Braumandl (1991) and Comeau et al. (1993).Trend lines were plotted for graphical comparison. Height:diameter ratio was also calculated for each seedling ateach assessment and treatment means were plotted for comparison of trends.
To examine the effect of time and of treatment × time interactions, crop tree height and diameter data were fitted togrowth curves approximated by a quadratic function of the following form:
where i denotes the block, j is the treatment, k is the tree number, yijkt is the measured response (e.g., height) in yeart, and εijkt is the associated error. Estimates of the growth parameters (ß0,ijk , ß1,ijk , ß2,ijk were obtained for each treeby fitting the above equation (by the method of least squares) to the response variables (height and diameter) and totheir corresponding log transforms. Differences between the four treatment groups were then assessed with anANOVA based on the following randomized block model (with sub-sampling):
where bijk is the least-squares estimate of (ß0,ijk , ß1,ijk or ß2,ijk for tree k, Treatment j, and block i, µ is the overallmean, αi is the random effect of block i, τj is the fixed effect of treatment j, ατ ij is the random interaction of theblock and treatment effects (combined with the random variation among treatment plots within blocks), and δijk isthe random effect of variation among trees. Owing to the unequal number of trees for each treatment and blockcombination, differences between treatments were assessed with an approximate F-test (the denominator sum ofsquares is a linear combination of the treatment × block and tree sum of squares). Residuals from the fitted modelwere examined for evidence of non-normality and other obvious problems.
A second analysis of treatment effect on tree growth was based on the block averages (over trees):
where nijt is the number of trees receiving treatment j in block i and t is the year of measurement. Differencesbetween treatment groups were assessed by carrying out a repeated-measures ANOVA of the sequence of meansbased on the following univariate model:
6
y
y
nijt
ijktk
n
ijt
ijt
= =∑
1
yijt i j ij t it jt ijt= + + + + + + +µ α τ ατ γ αγ τγ ω
y t tijkt ijk ijk ijk ijkt= + + +β β β ε0 1 22
, , ,
bijk i j ij ijk= + + + +µ α τ ατ δ
3 Both papers used the following formula for tree-centred, 5-m2 circular plots: CI = (Ci × Hi)/Ht; where CI = Competition Index,Ci = percent cover of species i, Hi = height of species i; and Ht = seedling height

where µ is the overall mean, αi is the random effect of block i, τj is the fixed effect of treatment j, ατ ij is the randominteraction of block and treatment, γt is the fixed effect of time, αγij is the random interaction of block and year, τγjtis the fixed interaction between the effects of treatment and year, and ωijt is the effect of all other sources of randomvariation. Differences in the sample sizes nijt were ignored. Although the test for parallelism (i.e., no treatment ×year interaction) makes no specific assumptions about the functional form of the time trends, it does require aparticular type of correlation structure. To relax the stringent assumption of “sphericity” (i.e., constant variancesand constant correlation between all pairs of repeated measures), the p-values for treatment × year were adjustedusing the Huynh-Feldt method available in PROC GLM of SAS. Polynomial contrasts of the repeated measureswere used to assess whether divergence of the growth curves could be attributed to different linear or quadratic(cubic, etc.) trends.
Results
Target vegetation control
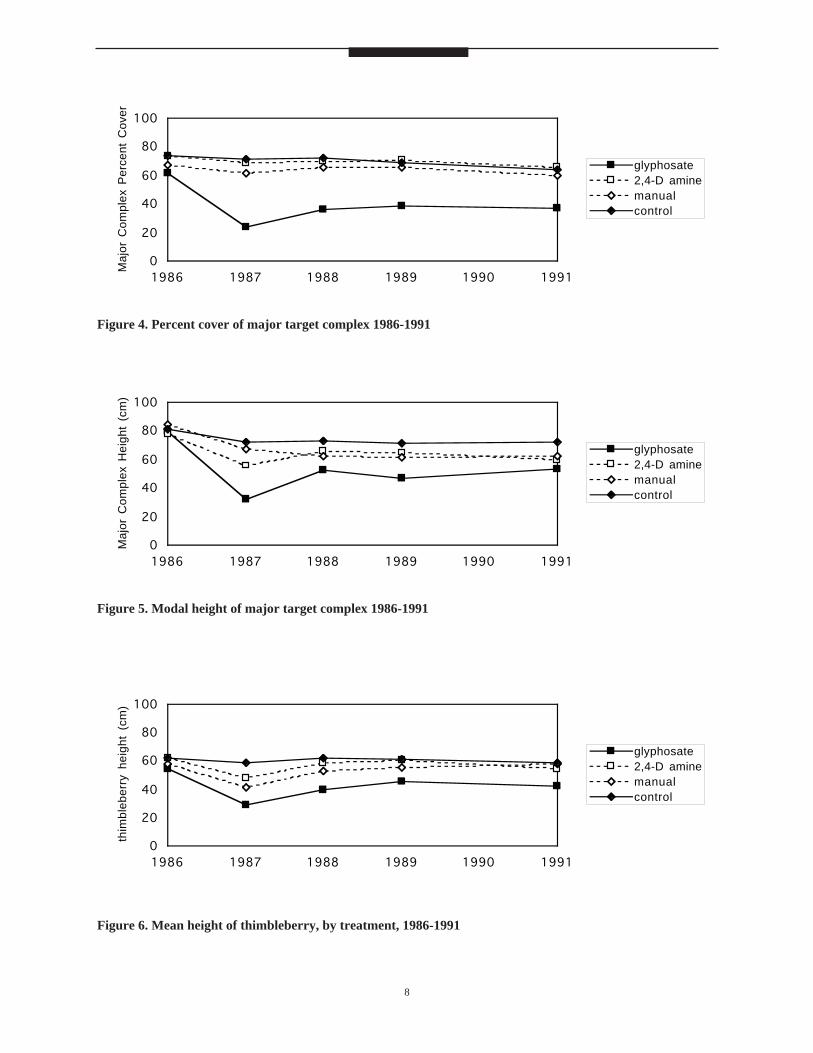
Trends in percent cover of the major target complex (thimbleberry, raspberry and fireweed) from 1986 to 1991 areshown in Figure 4. Only the glyphosate application reduced percent cover significantly (p<0.05). This effect lastedthroughout the five-year post-treatment assessment period. Modal height of the major complex was alsosignificantly lower in the glyphosate treatment in comparison to the untreated control throughout the duration of theexperiment and significantly lower than in all other treatments in the first and third post-treatment years (Figure 5).Effects of manual brushing and 2,4-D application on modal height are less definite, although there appears to be ageneral decline in modal height in both treatments.
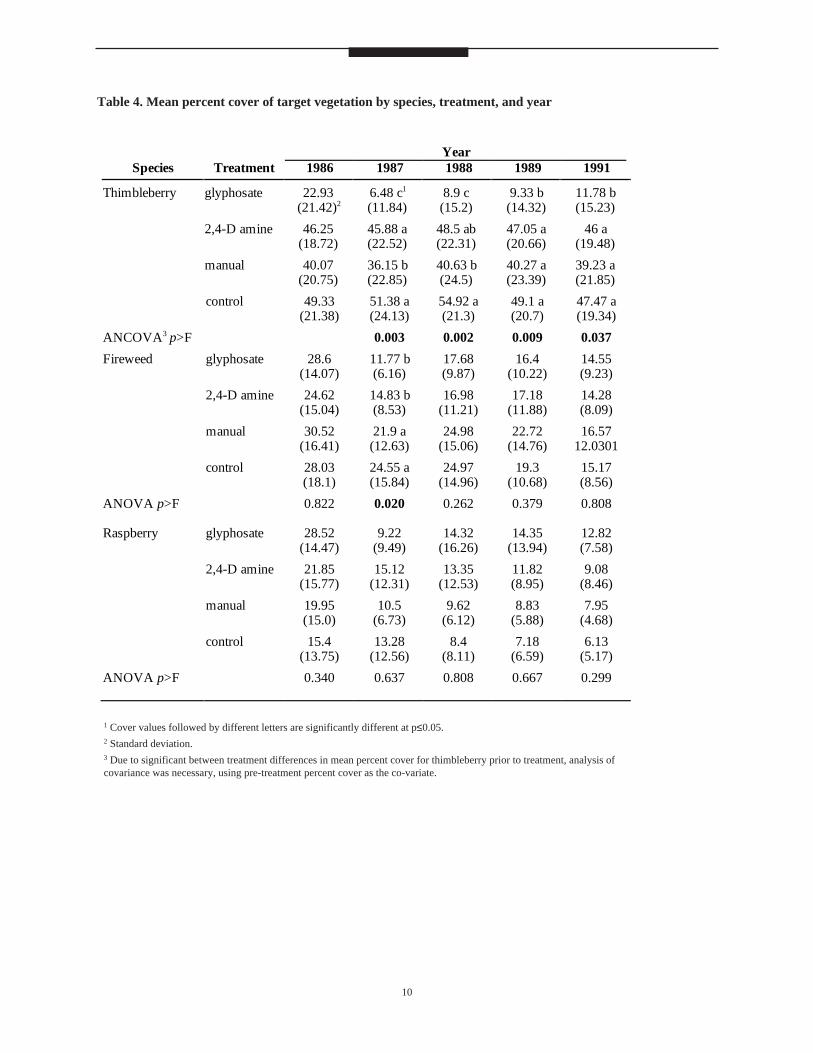
Trends in percent cover of the three individual target species are presented in Table 4. Thimbleberry cover in theuntreated control, manual brushing and 2,4-D plots varied only slightly throughout the five assessments (1986 to1991), although levels in manually brushed plots were significantly lower than levels in untreated plots for the firsttwo years after treatment was applied in 1986. In contrast, thimbleberry cover was sharply reduced in the plotstreated with glyphosate to levels significantly lower than in all other treatments at all assessment dates, and it onlyrecovered to 50% of the pre-treatment level after five years.
Glyphosate application also resulted in the largest reduction in thimbleberry height (Figure 6) which remainedsignificantly lower than in any other treatment for the full five-year post-treatment assessment period. Manualbrushing reduced thimbleberry height to levels significantly below the untreated control for one year only andapplication of the 2,4-D amine had no significant effect.
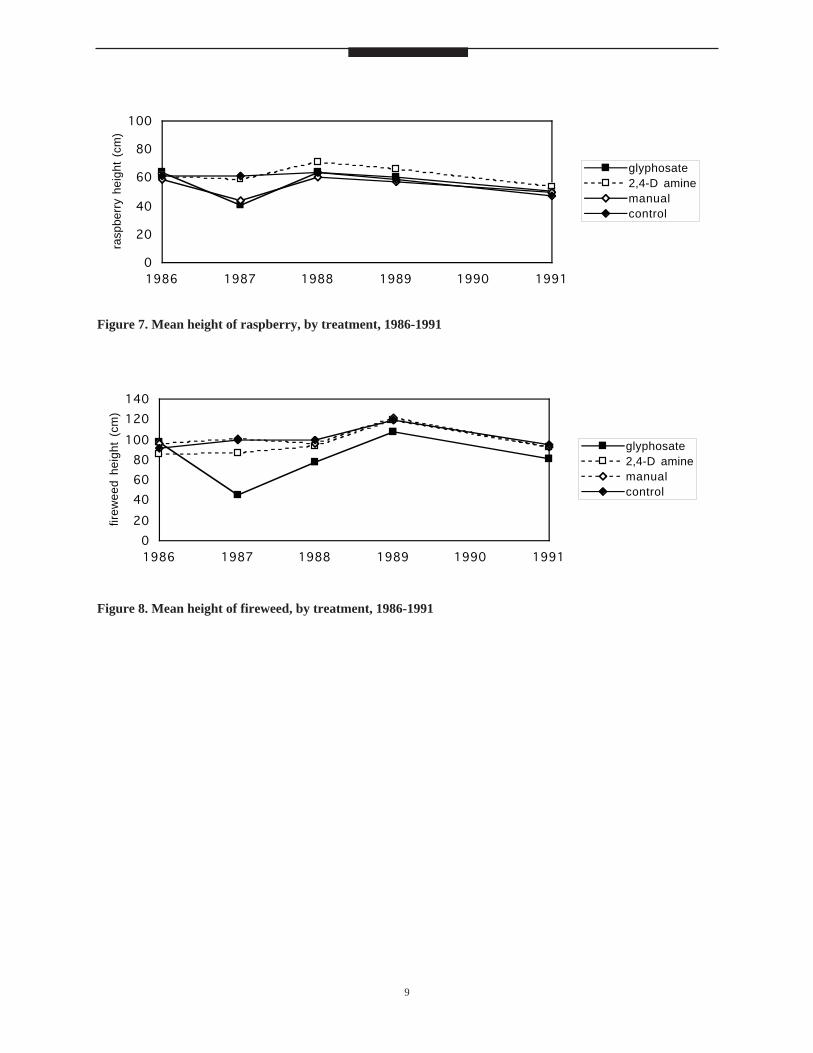
Both fireweed and raspberry cover declined in all treatments over the five-year duration of the experiment to about50% of pre-treatment values. There was no significant treatment effect evident on raspberry cover or height (Figure7). Both glyphosate and 2,4-D applications reduced cover of fireweed to levels significantly below those inmanually brushed or untreated plots one year following treatment. Fireweed height was reduced by the glyphosateapplication, to levels significantly lower than in all other treatments, for one year only (Figure 8).
7
8
0
20
40
60
80
100
1986 1987 1988 1989 1990 1991
Maj
or C
ompl
ex P
erce
nt C
over
glyphosate2,4-D aminemanualcontrol
0
20
40
60
80
100
1986 1987 1988 1989 1990 1991
Maj
or C
ompl
ex H
eigh
t (c
m)
glyphosate2,4-D aminemanualcontrol
0
20
40
60
80
100
1986 1987 1988 1989 1990 1991
thim
bleb
erry
hei
ght
(cm
)
glyphosate2,4-D aminemanualcontrol
Figure 4. Percent cover of major target complex 1986-1991
Figure 5. Modal height of major target complex 1986-1991
Figure 6. Mean height of thimbleberry, by treatment, 1986-1991
9
0
20
40
60
80
100
1986 1987 1988 1989 1990 1991
rasp
berr
y he
ight
(cm
)
glyphosate2,4-D aminemanualcontrol
0
20
40
60
80
100
120
140
1986 1987 1988 1989 1990 1991
firew
eed
heig
ht (
cm)
glyphosate2,4-D aminemanualcontrol
Figure 7. Mean height of raspberry, by treatment, 1986-1991
Figure 8. Mean height of fireweed, by treatment, 1986-1991
10
Table 4. Mean percent cover of target vegetation by species, treatment, and year
YearSpecies Treatment 1986 1987 1988 1989 1991
Thimbleberry glyphosate 22.93 6.48 c1 8.9 c 9.33 b 11.78 b(21.42)2 (11.84) (15.2) (14.32) (15.23)
2,4-D amine 46.25 45.88 a 48.5 ab 47.05 a 46 a(18.72) (22.52) (22.31) (20.66) (19.48)
manual 40.07 36.15 b 40.63 b 40.27 a 39.23 a(20.75) (22.85) (24.5) (23.39) (21.85)
control 49.33 51.38 a 54.92 a 49.1 a 47.47 a(21.38) (24.13) (21.3) (20.7) (19.34)
ANCOVA3 p>F 0.003 0.002 0.009 0.037
Fireweed glyphosate 28.6 11.77 b 17.68 16.4 14.55(14.07) (6.16) (9.87) (10.22) (9.23)
2,4-D amine 24.62 14.83 b 16.98 17.18 14.28(15.04) (8.53) (11.21) (11.88) (8.09)
manual 30.52 21.9 a 24.98 22.72 16.57(16.41) (12.63) (15.06) (14.76) 12.0301
control 28.03 24.55 a 24.97 19.3 15.17(18.1) (15.84) (14.96) (10.68) (8.56)
ANOVA p>F 0.822 0.020 0.262 0.379 0.808
Raspberry glyphosate 28.52 9.22 14.32 14.35 12.82(14.47) (9.49) (16.26) (13.94) (7.58)
2,4-D amine 21.85 15.12 13.35 11.82 9.08(15.77) (12.31) (12.53) (8.95) (8.46)
manual 19.95 10.5 9.62 8.83 7.95(15.0) (6.73) (6.12) (5.88) (4.68)
control 15.4 13.28 8.4 7.18 6.13(13.75) (12.56) (8.11) (6.59) (5.17)
ANOVA p>F 0.340 0.637 0.808 0.667 0.299
1 Cover values followed by different letters are significantly different at p≤0.05.2 Standard deviation.3 Due to significant between treatment differences in mean percent cover for thimbleberry prior to treatment, analysis ofcovariance was necessary, using pre-treatment percent cover as the co-variate.
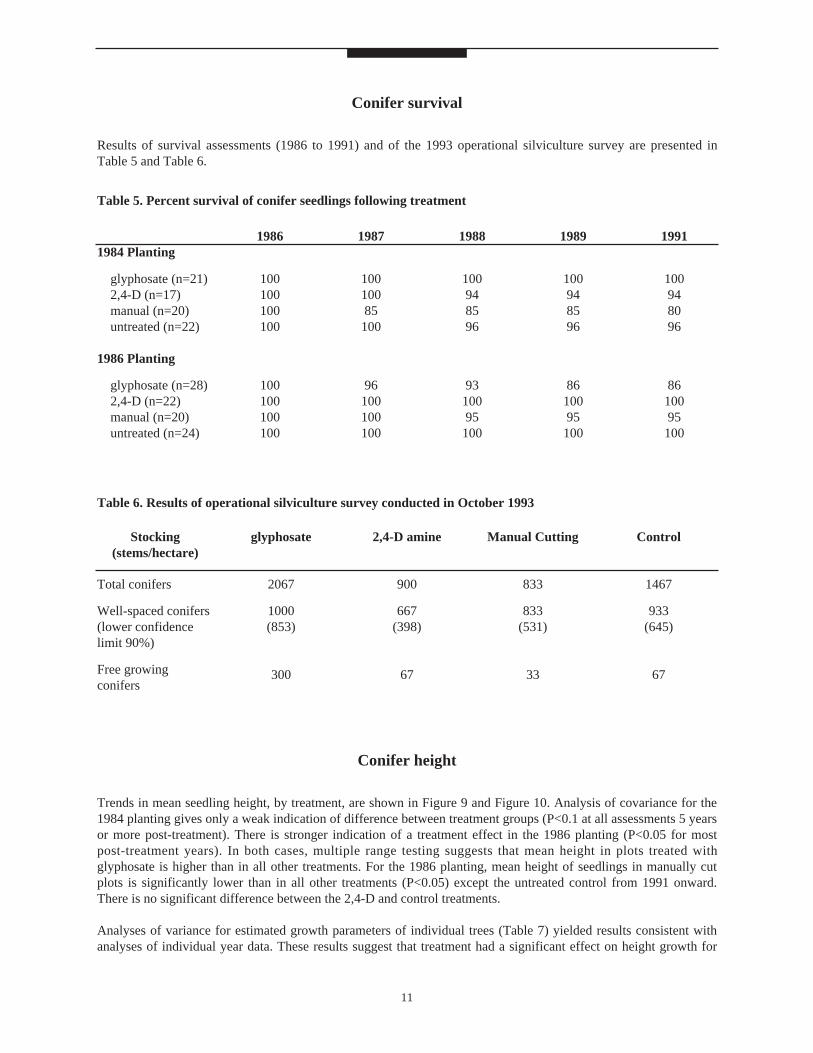
Conifer survival
Results of survival assessments (1986 to 1991) and of the 1993 operational silviculture survey are presented inTable 5 and Table 6.
Conifer height
Trends in mean seedling height, by treatment, are shown in Figure 9 and Figure 10. Analysis of covariance for the1984 planting gives only a weak indication of difference between treatment groups (P<0.1 at all assessments 5 yearsor more post-treatment). There is stronger indication of a treatment effect in the 1986 planting (P<0.05 for mostpost-treatment years). In both cases, multiple range testing suggests that mean height in plots treated withglyphosate is higher than in all other treatments. For the 1986 planting, mean height of seedlings in manually cutplots is significantly lower than in all other treatments (P<0.05) except the untreated control from 1991 onward.There is no significant difference between the 2,4-D and control treatments.
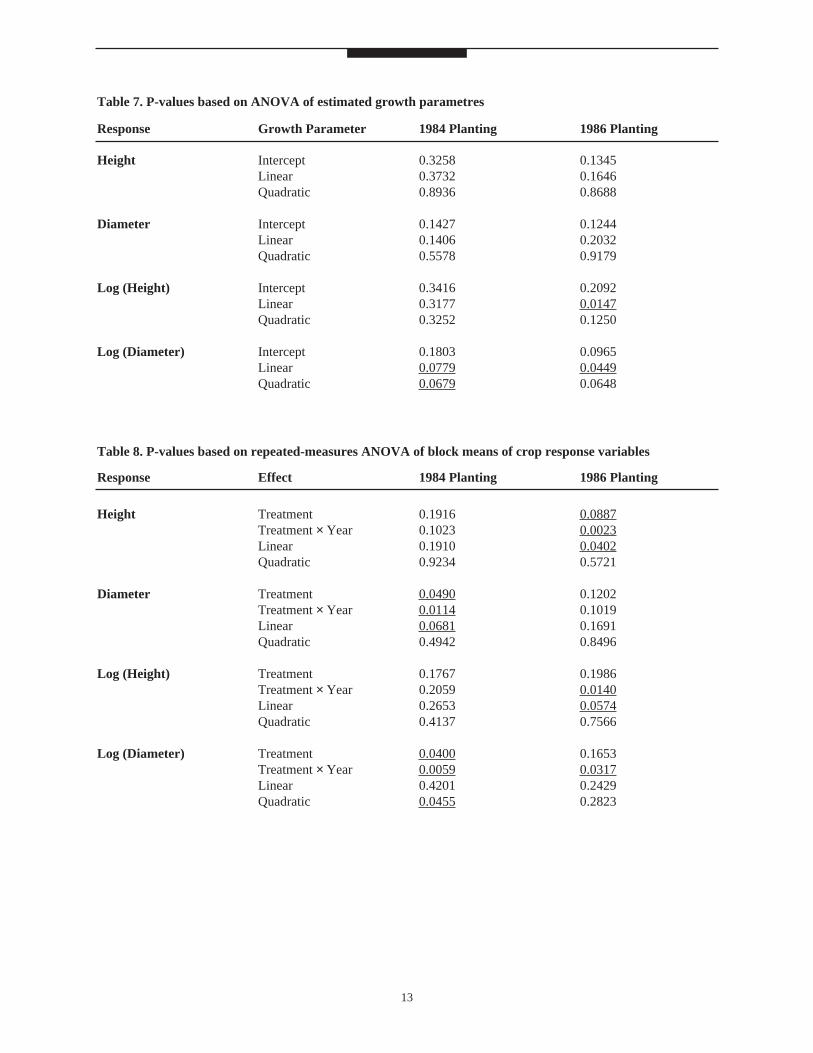
Analyses of variance for estimated growth parameters of individual trees (Table 7) yielded results consistent withanalyses of individual year data. These results suggest that treatment had a significant effect on height growth for
11
Stocking(stems/hectare)
Total conifers
Well-spaced conifers(lower confidencelimit 90%)
Free growingconifers
glyphosate
2067
1000(853)
300
2,4-D amine
900
667(398)
67
Manual Cutting
833
833(531)
33
Control
1467
933(645)
67
Table 6. Results of operational silviculture survey conducted in October 1993
Table 5. Percent survival of conifer seedlings following treatment
1986
100100100100
100100100100
1987
10010085100
96100100100
1988
100948596
9310095100
1989
100948596
8610095100
1991
100948096
8610095100
1984 Planting
glyphosate (n=21)2,4-D (n=17)manual (n=20)untreated (n=22)
1986 Planting
glyphosate (n=28)2,4-D (n=22)manual (n=20)untreated (n=24)
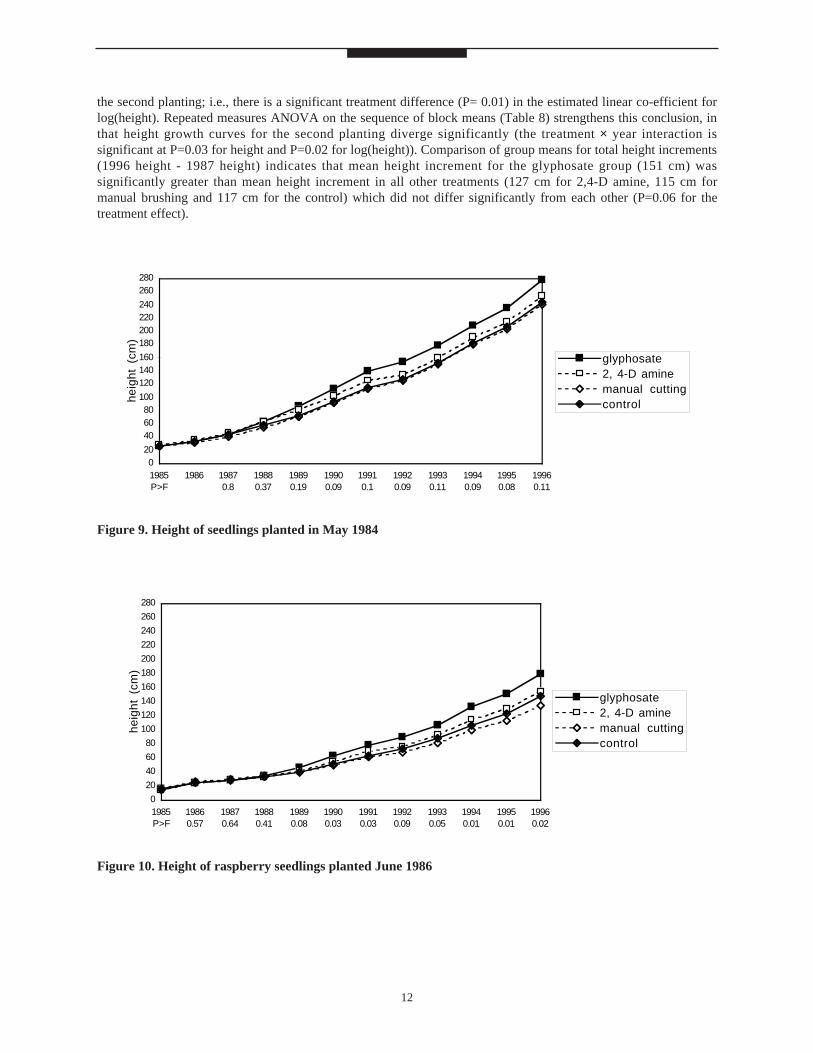
the second planting; i.e., there is a significant treatment difference (P= 0.01) in the estimated linear co-efficient forlog(height). Repeated measures ANOVA on the sequence of block means (Table 8) strengthens this conclusion, inthat height growth curves for the second planting diverge significantly (the treatment × year interaction issignificant at P=0.03 for height and P=0.02 for log(height)). Comparison of group means for total height increments(1996 height - 1987 height) indicates that mean height increment for the glyphosate group (151 cm) wassignificantly greater than mean height increment in all other treatments (127 cm for 2,4-D amine, 115 cm formanual brushing and 117 cm for the control) which did not differ significantly from each other (P=0.06 for thetreatment effect).
12
020
406080
100
120140160
180200220240
260280
1985P>F
1986 19870.8
19880.37
19890.19
19900.09
19910.1
19920.09
19930.11
19940.09
19950.08
19960.11
heig
ht (
cm)
glyphosate2, 4-D aminemanual cuttingcontrol
Figure 9. Height of seedlings planted in May 1984
0
20
40
60
80
100
120
140
160
180
200
220
240
260
280
1985P>F
19860.57
19870.64
19880.41
19890.08
19900.03
19910.03
19920.09
19930.05
19940.01
19950.01
19960.02
heig
ht (
cm)
glyphosate2, 4-D aminemanual cuttingcontrol
Figure 10. Height of raspberry seedlings planted June 1986
13
Response
Height
Diameter
Log (Height)
Log (Diameter)
Growth Parameter
InterceptLinearQuadratic
InterceptLinearQuadratic
InterceptLinearQuadratic
InterceptLinearQuadratic
1984 Planting
0.32580.37320.8936
0.14270.14060.5578
0.34160.31770.3252
0.18030.07790.0679
1986 Planting
0.13450.16460.8688
0.12440.20320.9179
0.20920.01470.1250
0.09650.04490.0648
Table 7. P-values based on ANOVA of estimated growth parametres
Response
Height
Diameter
Log (Height)
Log (Diameter)
Effect
TreatmentTreatment × YearLinearQuadratic
TreatmentTreatment × YearLinearQuadratic
TreatmentTreatment × YearLinearQuadratic
TreatmentTreatment × YearLinearQuadratic
1984 Planting
0.19160.10230.19100.9234
0.04900.01140.06810.4942
0.17670.20590.26530.4137
0.04000.00590.42010.0455
1986 Planting
0.08870.00230.04020.5721
0.12020.10190.16910.8496
0.19860.01400.05740.7566
0.16530.03170.24290.2823
Table 8. P-values based on repeated-measures ANOVA of block means of crop response variables
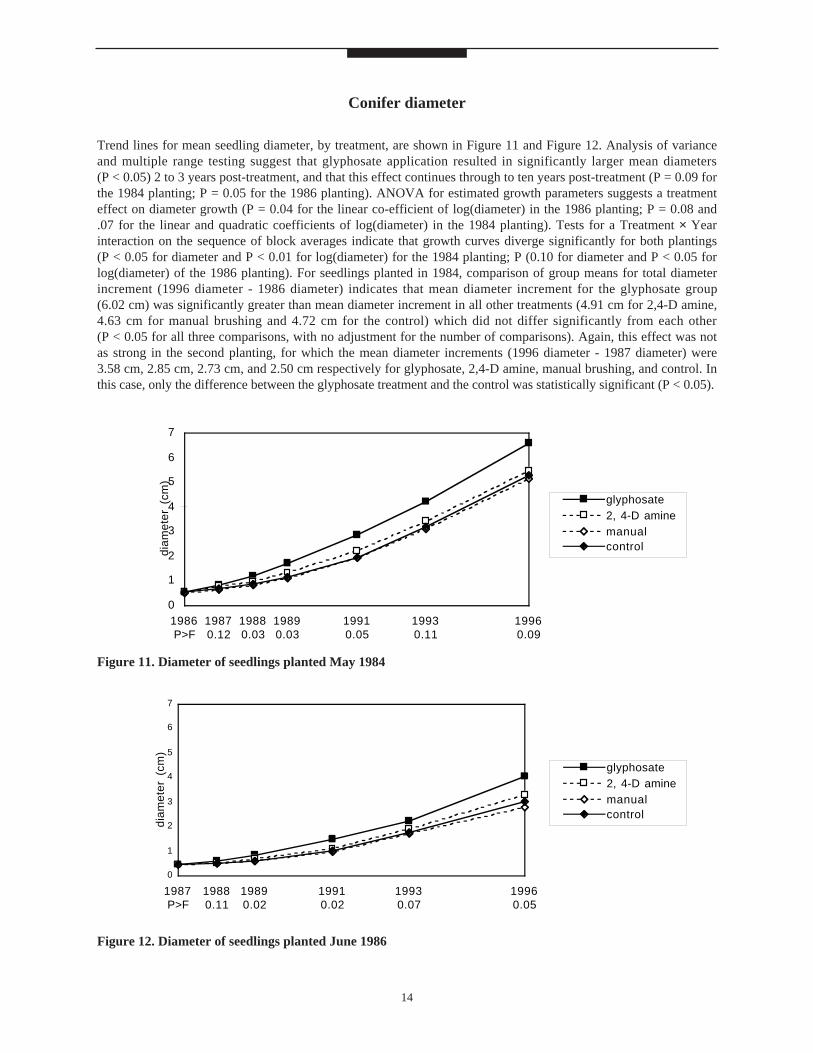
Conifer diameter
Trend lines for mean seedling diameter, by treatment, are shown in Figure 11 and Figure 12. Analysis of varianceand multiple range testing suggest that glyphosate application resulted in significantly larger mean diameters (P < 0.05) 2 to 3 years post-treatment, and that this effect continues through to ten years post-treatment (P = 0.09 forthe 1984 planting; P = 0.05 for the 1986 planting). ANOVA for estimated growth parameters suggests a treatmenteffect on diameter growth (P = 0.04 for the linear co-efficient of log(diameter) in the 1986 planting; P = 0.08 and.07 for the linear and quadratic coefficients of log(diameter) in the 1984 planting). Tests for a Treatment × Yearinteraction on the sequence of block averages indicate that growth curves diverge significantly for both plantings (P < 0.05 for diameter and P < 0.01 for log(diameter) for the 1984 planting; P (0.10 for diameter and P < 0.05 forlog(diameter) of the 1986 planting). For seedlings planted in 1984, comparison of group means for total diameterincrement (1996 diameter - 1986 diameter) indicates that mean diameter increment for the glyphosate group (6.02 cm) was significantly greater than mean diameter increment in all other treatments (4.91 cm for 2,4-D amine,4.63 cm for manual brushing and 4.72 cm for the control) which did not differ significantly from each other (P < 0.05 for all three comparisons, with no adjustment for the number of comparisons). Again, this effect was notas strong in the second planting, for which the mean diameter increments (1996 diameter - 1987 diameter) were3.58 cm, 2.85 cm, 2.73 cm, and 2.50 cm respectively for glyphosate, 2,4-D amine, manual brushing, and control. Inthis case, only the difference between the glyphosate treatment and the control was statistically significant (P < 0.05).
14
0
1
2
3
4
5
6
7
1987P>F
19880.11
19890.02
19910.02
19930.07
19960.05
diam
eter
(cm
)
glyphosate2, 4-D aminemanualcontrol
Figure 12. Diameter of seedlings planted June 1986
0
1
2
3
4
5
6
7
1986P>F
19870.12
19880.03
19890.03
19910.05
19930.11
19960.09
diam
eter
(cm
)
glyphosate2, 4-D aminemanualcontrol
Figure 11. Diameter of seedlings planted May 1984
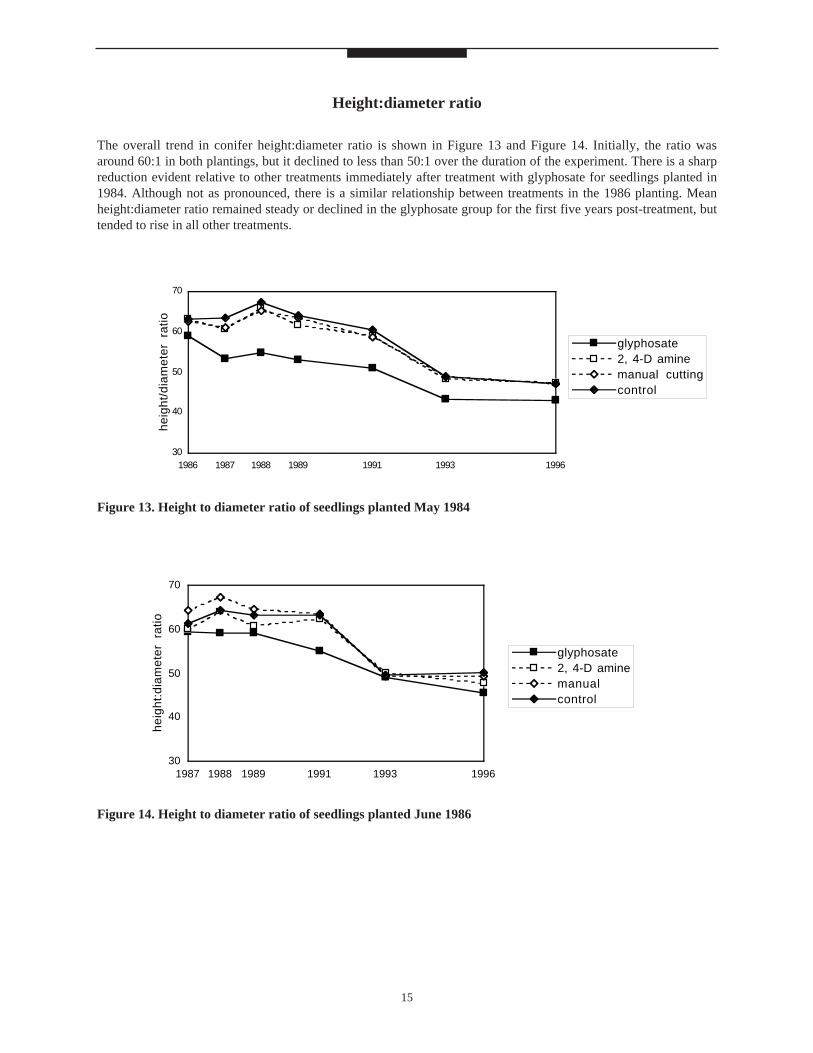
Height:diameter ratio
The overall trend in conifer height:diameter ratio is shown in Figure 13 and Figure 14. Initially, the ratio wasaround 60:1 in both plantings, but it declined to less than 50:1 over the duration of the experiment. There is a sharpreduction evident relative to other treatments immediately after treatment with glyphosate for seedlings planted in1984. Although not as pronounced, there is a similar relationship between treatments in the 1986 planting. Meanheight:diameter ratio remained steady or declined in the glyphosate group for the first five years post-treatment, buttended to rise in all other treatments.
15
30
40
50
60
70
1986 1987 1988 1989 1991 1993 1996
heig
ht/d
iam
eter
rat
io
glyphosate2, 4-D aminemanual cuttingcontrol
Figure 13. Height to diameter ratio of seedlings planted May 1984
30
40
50
60
70
1987 1988 1989 1991 1993 1996
heig
ht:d
iam
eter
rat
io
glyphosate2, 4-D aminemanualcontrol
Figure 14. Height to diameter ratio of seedlings planted June 1986
Competition index
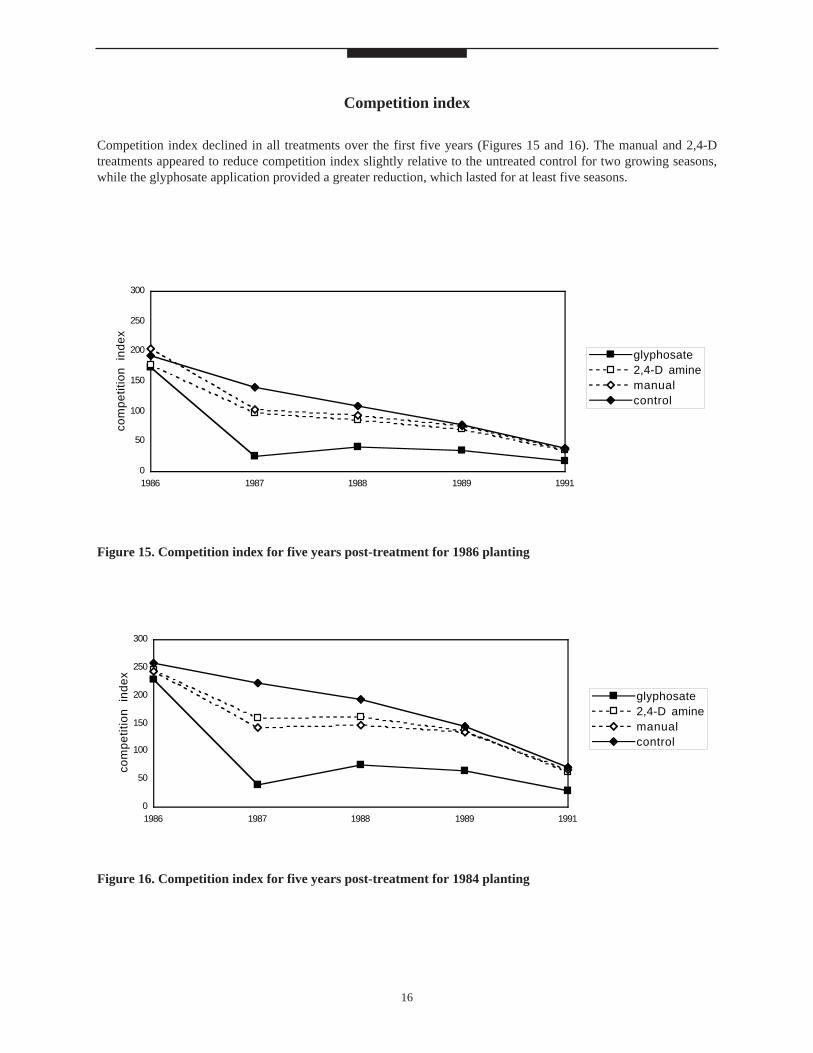
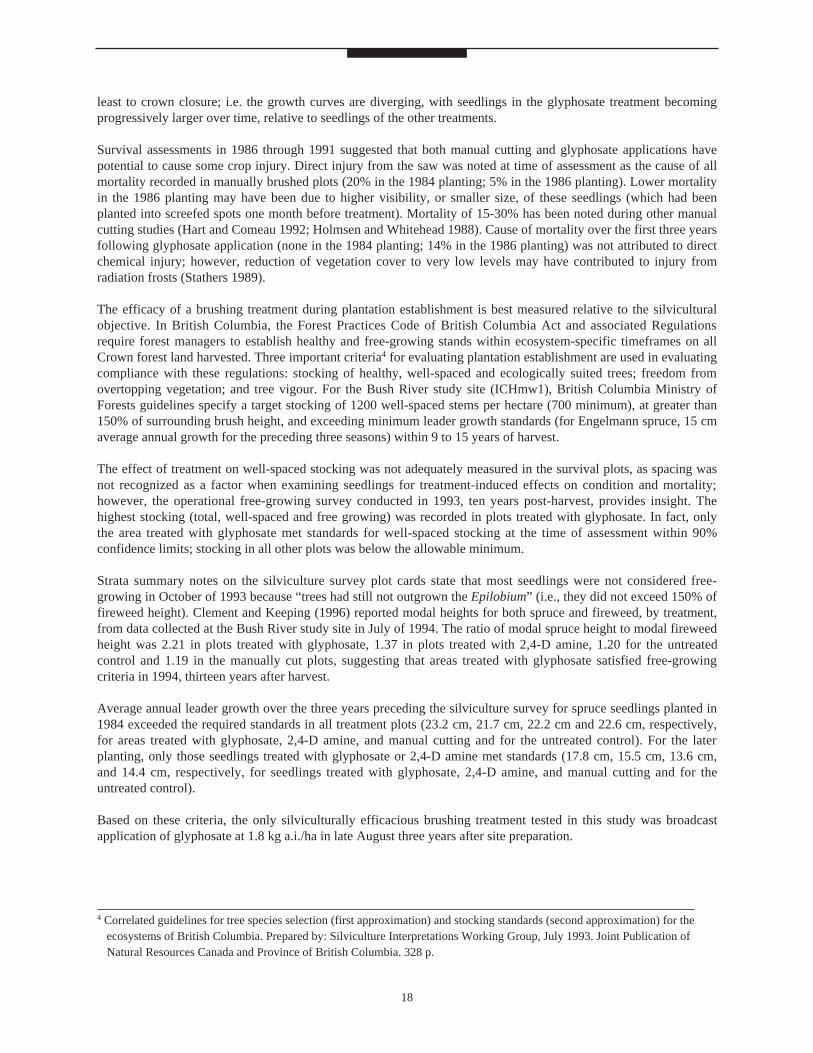
Competition index declined in all treatments over the first five years (Figures 15 and 16). The manual and 2,4-Dtreatments appeared to reduce competition index slightly relative to the untreated control for two growing seasons,while the glyphosate application provided a greater reduction, which lasted for at least five seasons.
16
0
50
100
150
200
250
300
1986 1987 1988 1989 1991
com
petit
ion
in
dex
glyphosate2,4-D aminemanualcontrol
0
50
100
150
200
250
300
1986 1987 1988 1989 1991
com
petit
ion
ind
ex
glyphosate2,4-D aminemanualcontrol
Figure 15. Competition index for five years post-treatment for 1986 planting
Figure 16. Competition index for five years post-treatment for 1984 planting

Discussion
Broadcast application of glyphosate had the most effect on the main competing species measured, reducing bothheight and percent cover to relatively low levels for at least five years after treatment. In comparison, broadcastapplication of 2,4-D amine and manual cutting treatments both had relatively short-term and minor effects on themain competing species. These observations are generally consistent with other studies comparing broadcastapplications of glyphosate, manual cutting and untreated controls in this vegetation type over the short term(LePage and Pollack 1988; Haeussler and Coates 1986).
In their assessment of plant community composition and structure in the Bush River study plots, Clement andKeeping (1996) also reported that total vegetation cover, and percent cover and modal height of the shrubcomponent were significantly lower than in any other treatment eight years after glyphosate treatment, suggestingthat the treatment effects we observed lasted well beyond the period of our assessments.
While Hart and Comeau (1992) suggest that manual cutting of thimbleberry in mid-July may result in a slightreduction of re-sprouting, they also caution that a single cutting of thimbleberry and fireweed will only providecontrol until the following spring. The most efficacious period for foliar application of 2,4-D is also early in thegrowing season, soon after full leaf out (Newton and Knight 1981), and the low level of vegetation control observedin this study may have been due to the late season of application. Phenological development of the vegetation at theBush River site was quite advanced by late August 1986 when treatments were applied. Colour change hadcommenced in foliage of both Rubus species prior to the herbicide treatments, and seed dispersal had begun in thefireweed. Glyphosate application is very effective during this late summer and early fall period (LePage and Pollack1988; Biring et al. 1996).
In this experiment, conifer growth responses were strongly related to the degree of vegetation control observed,implying that competition with the target species was limiting seedling growth. Trends observed in a calculatedcompetition index (CI) and in seedling height:diameter ratio support this hypothesis. Competition index was above200 in all treatments in the pre-treatment year, but declined in the years following treatment as trees gained inheight relative to the competing brush. Manual cutting and 2,4-D amine treatments reduced the competition indexslightly for two growing seasons following treatment, while application of glyphosate provided a much greaterreduction lasting for at least five seasons. The glyphosate application reduced CI to well below 100 in the first year,three to four years in advance of all other options tested. When calculated using a similar basis, competition indexesabove 100 have been considered limiting to conifer growth, because of reduction in amount of sunlight reachingseedling height (Comeau 1993; Comeau et al. 1993).
One of the first visual signs of seedling stress due to competition is an increase in height:diameter ratio (Newtonand Comeau 1990). Simard (1990) discusses this change in morphology in terms of preferential allocation of carbonto various carbohydrate sinks, arguing that height:diameter ratios increase when seedlings are competing withneighbouring vegetation because elongating shoots take priority over cambial tissue. For Douglas-fir (Pseudotsugamenziesii var menziesii (Mirbel) Franco), height:diameter ratios of 45:1 to 55:1 are normal in open grownplantations (Cole and Newton 1987), and long-term height diameter and volume increment in response to releasemay be jeopardized when height diameter ratio exceeds 60:1 (Newton and Comeau 1990). In this study, the ratiowas 60:1 or higher in both plantings at time of treatment, and tended to rise or remain steady in all but theglyphosate treatment for at least five years post-treatment. In contrast, mean height:diameter ratio of seedlings in theglyphosate treatment was reduced shortly after treatment, and remained at lower levels throughout the ten yearmeasurement period.
Only the glyphosate treatment resulted in longer-term significant effects on tree diameter, tree height and growthpattern. In all cases, seedlings treated with glyphosate were outperforming seedlings in all other treatments ten yearsafter treatment. Sutton (1985b) reported that early weed control was still exerting highly significant effects onperformance of white spruce (Picea glauca [Moench] Voss) three decades after treatment. Analyses of growthcurves provides some assurance that differences in the size and growth of trees observed in our study will persist, at
17
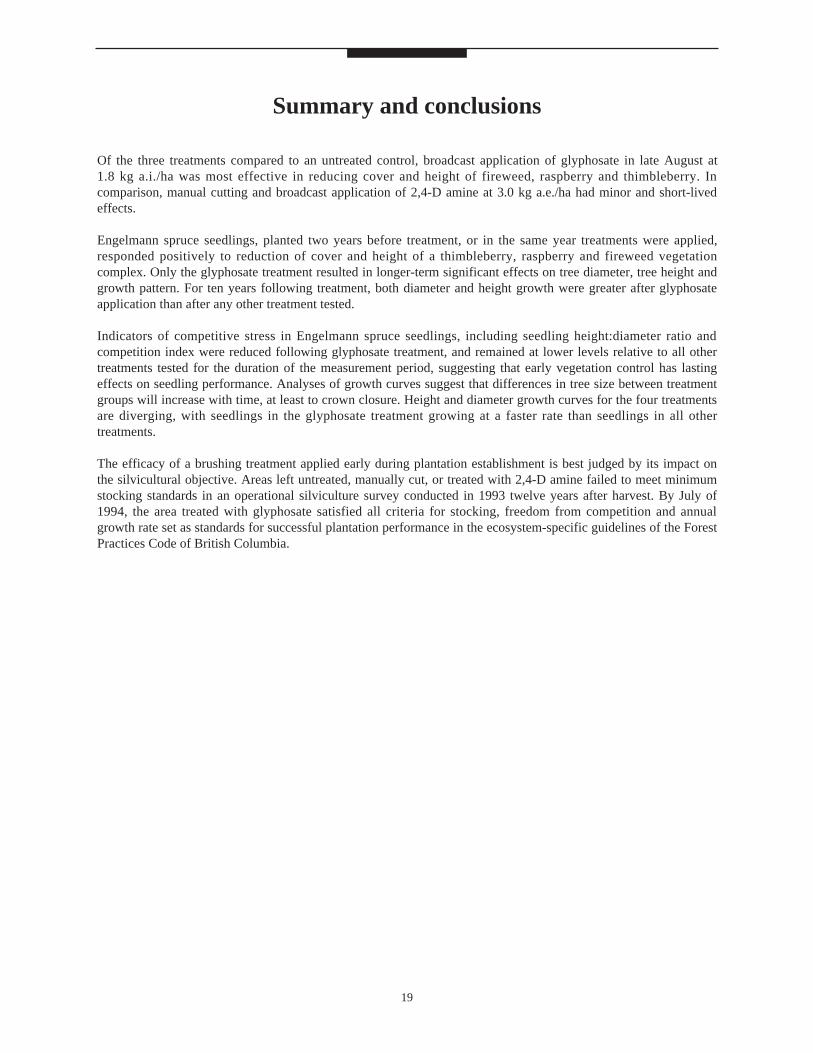
least to crown closure; i.e. the growth curves are diverging, with seedlings in the glyphosate treatment becomingprogressively larger over time, relative to seedlings of the other treatments.
Survival assessments in 1986 through 1991 suggested that both manual cutting and glyphosate applications havepotential to cause some crop injury. Direct injury from the saw was noted at time of assessment as the cause of allmortality recorded in manually brushed plots (20% in the 1984 planting; 5% in the 1986 planting). Lower mortalityin the 1986 planting may have been due to higher visibility, or smaller size, of these seedlings (which had beenplanted into screefed spots one month before treatment). Mortality of 15-30% has been noted during other manualcutting studies (Hart and Comeau 1992; Holmsen and Whitehead 1988). Cause of mortality over the first three yearsfollowing glyphosate application (none in the 1984 planting; 14% in the 1986 planting) was not attributed to directchemical injury; however, reduction of vegetation cover to very low levels may have contributed to injury fromradiation frosts (Stathers 1989).
The efficacy of a brushing treatment during plantation establishment is best measured relative to the silviculturalobjective. In British Columbia, the Forest Practices Code of British Columbia Act and associated Regulationsrequire forest managers to establish healthy and free-growing stands within ecosystem-specific timeframes on allCrown forest land harvested. Three important criteria4 for evaluating plantation establishment are used in evaluatingcompliance with these regulations: stocking of healthy, well-spaced and ecologically suited trees; freedom fromovertopping vegetation; and tree vigour. For the Bush River study site (ICHmw1), British Columbia Ministry ofForests guidelines specify a target stocking of 1200 well-spaced stems per hectare (700 minimum), at greater than150% of surrounding brush height, and exceeding minimum leader growth standards (for Engelmann spruce, 15 cmaverage annual growth for the preceding three seasons) within 9 to 15 years of harvest.
The effect of treatment on well-spaced stocking was not adequately measured in the survival plots, as spacing wasnot recognized as a factor when examining seedlings for treatment-induced effects on condition and mortality;however, the operational free-growing survey conducted in 1993, ten years post-harvest, provides insight. Thehighest stocking (total, well-spaced and free growing) was recorded in plots treated with glyphosate. In fact, onlythe area treated with glyphosate met standards for well-spaced stocking at the time of assessment within 90%confidence limits; stocking in all other plots was below the allowable minimum.
Strata summary notes on the silviculture survey plot cards state that most seedlings were not considered free-growing in October of 1993 because “trees had still not outgrown the Epilobium” (i.e., they did not exceed 150% offireweed height). Clement and Keeping (1996) reported modal heights for both spruce and fireweed, by treatment,from data collected at the Bush River study site in July of 1994. The ratio of modal spruce height to modal fireweedheight was 2.21 in plots treated with glyphosate, 1.37 in plots treated with 2,4-D amine, 1.20 for the untreatedcontrol and 1.19 in the manually cut plots, suggesting that areas treated with glyphosate satisfied free-growingcriteria in 1994, thirteen years after harvest.
Average annual leader growth over the three years preceding the silviculture survey for spruce seedlings planted in1984 exceeded the required standards in all treatment plots (23.2 cm, 21.7 cm, 22.2 cm and 22.6 cm, respectively,for areas treated with glyphosate, 2,4-D amine, and manual cutting and for the untreated control). For the laterplanting, only those seedlings treated with glyphosate or 2,4-D amine met standards (17.8 cm, 15.5 cm, 13.6 cm,and 14.4 cm, respectively, for seedlings treated with glyphosate, 2,4-D amine, and manual cutting and for theuntreated control).
Based on these criteria, the only silviculturally efficacious brushing treatment tested in this study was broadcastapplication of glyphosate at 1.8 kg a.i./ha in late August three years after site preparation.
18
4 Correlated guidelines for tree species selection (first approximation) and stocking standards (second approximation) for theecosystems of British Columbia. Prepared by: Silviculture Interpretations Working Group, July 1993. Joint Publication ofNatural Resources Canada and Province of British Columbia. 328 p.
Summary and conclusions
Of the three treatments compared to an untreated control, broadcast application of glyphosate in late August at 1.8 kg a.i./ha was most effective in reducing cover and height of fireweed, raspberry and thimbleberry. Incomparison, manual cutting and broadcast application of 2,4-D amine at 3.0 kg a.e./ha had minor and short-livedeffects.
Engelmann spruce seedlings, planted two years before treatment, or in the same year treatments were applied,responded positively to reduction of cover and height of a thimbleberry, raspberry and fireweed vegetationcomplex. Only the glyphosate treatment resulted in longer-term significant effects on tree diameter, tree height andgrowth pattern. For ten years following treatment, both diameter and height growth were greater after glyphosateapplication than after any other treatment tested.
Indicators of competitive stress in Engelmann spruce seedlings, including seedling height:diameter ratio andcompetition index were reduced following glyphosate treatment, and remained at lower levels relative to all othertreatments tested for the duration of the measurement period, suggesting that early vegetation control has lastingeffects on seedling performance. Analyses of growth curves suggest that differences in tree size between treatmentgroups will increase with time, at least to crown closure. Height and diameter growth curves for the four treatmentsare diverging, with seedlings in the glyphosate treatment growing at a faster rate than seedlings in all othertreatments.
The efficacy of a brushing treatment applied early during plantation establishment is best judged by its impact onthe silvicultural objective. Areas left untreated, manually cut, or treated with 2,4-D amine failed to meet minimumstocking standards in an operational silviculture survey conducted in 1993 twelve years after harvest. By July of1994, the area treated with glyphosate satisfied all criteria for stocking, freedom from competition and annualgrowth rate set as standards for successful plantation performance in the ecosystem-specific guidelines of the ForestPractices Code of British Columbia.
19
References
Biring, B.S.; Comeau; P.G.; Boateng, J.O. 1996. Effectiveness of forest vegetation control methods in BritishColumbia. For. Can. and B.C. Min. For., Victoria. FRDA Handbook 011.
Braumandl, T.F.; Curran, M.P. 1992. A field guide for site identification and interpretation for the Nelson ForestRegion. B.C. Min. For., Victoria, B.C.
Coates, K.D.; Haeussler, S.; Lindeburgh, S.; Pojar, R.; Stock, A.J. 1994. Ecology and silviculture of interior sprucein British Columbia. For. Can. and B.C. Min. For., Victoria. FRDA Rep. 220.
Clement, C.; Keeping, B. 1996. Evaluation of forest vegetation community dynamics on the Bush River brushingtrial site. Can. For. Serv. and B.C. Min. For., Victoria. FRDA Rep. 241.
Cole, E.C.; Newton, M. 1987. Fifth-year responses of Douglas-fir to crowding and non-coniferous competition.Can. J. For. Res. 17:181-186.
Comeau, P.G.; Braumandl, T.F. 1991. Light attenuation and competition by overtopping vegetation in the InteriorCedar Hemlock Zone - Project No. 3.48. For. Can. and B.C. Min. For., Victoria. FRDA Research Memo No.159.
Comeau, P.G. 1993. Competition indices and decision making. Pages 5-10 in C. Farnden, editor. Thesocioeconomic realities of brushing and weeding. Proceedings of the Northern Interior Vegetation ManagementAssociation Annual General Meeting, January 20-21, 1993, Smithers, B.C.
Comeau, P.G.; Braumandl, T.F.; Xie, C.-Y. 1993. Effects of overtopping vegetation on light availability and growthof Engelmann spruce (Picea engelmannii) seedlings. Can. J. For. Res. 23:2044-2048.
Conard, S. 1984. Forest vegetation management in British Columbia: problem analysis. B.C. Min. For. Res. Pap.RR84001-HQ.
Haeussler, S.; Coates, D. 1986. Autecological characteristics of selected species that compete with conifers inBritish Columbia: A literature review. For. Can. and B.C. Min. For., Victoria. FRDA Rep. 001.
Hart, D.; Comeau, P.G. 1992. Manual brushing for forest vegetation management in British Columbia: A review ofcurrent knowledge and information needs. B.C. Min. For., Research Branch, Victoria. Land ManagementReport 77.
Herring, L.J.; Pollack, J.C. 1985. Experimental design protocol for forest vegetation management research: Level Btrials - First Approximation. Research Report RR84013-HQ. Internal Report of the Ministry of ForestsResearch Program. B.C. Ministry of Forests, Victoria, B.C.
Holmsen, S.D.; Whitehead, R.J. 1988. Comparison of clearing-saw cutting attachments for weeding young coniferplantations. For. Can. and B.C. Min. For., Victoria. FRDA Rep. 028.
Ketcheson, M.V.; Braumandl, T.F.; Meidinger; D.; Utzig, G.F.; Demarchi, D.A. ; Wikeem, B.M. 1991. Interior
20
Cedar-Hemlock Zone. Chapter 11 in D. Meidinger and J. Pojar. Ecosystems of British Columbia. B.C. Min.For. Special Report Series 6. Victoria.
Lepage, P.; Pollack, J.C. 1988. Chemical and manual control of thimbleberry (Rubus parviflorus): a rate and timingtrial. Pages 17-18 in E. Hamilton and S. Watts, eds. Vegetation Competition and Responses: Proceedings of theThird Annual Vegetation Management Workshop, Feb. 15-17, 1988 Vancouver, B.C. For. Can. and B.C. Min.For., Victoria. FRDA Rep. 026.
Nemec, A.F.L. 1992. Guidelines for the statistical analysis of forest vegetation management data. BiometricsInformation Series Handbook No. 3. B.C. Min. For., Victoria, B.C.
Newton, M.; Comeau, P.G. 1990. Control of competing vegetation. Ch. 19 in D.P. Lavender, R. Parish, C.M.Johnson. G. Montgomery, A. Vyse, R.A. Willis, and D. Winston, eds. Regenerating British Columbia’sForests. University of British Columbia Press, Vancouver.
Newton, M.; Knight, F.B. 1981. Handbook of weed and insect control chemicals for forest resource managers.Timber Press. Beaverton, OR. 215 p.
SAS Institute Inc. 1985. SAS user’s guide: statistics. Version 5 ed. SAS Institute Inc., Cary, N.C.
Simard, S. 1990. Competition between sitka alder and lodgepole pine in the Montane Spruce zone in the southerninterior of British Columbia. For. Can. and B.C. Min. For., Victoria. FRDA Rep. 150.
Sutton, R.F. 1985a. Vegetation management in Canadian forestry. For. Can. Inf. Rep. O-X-369. Ottawa.
Sutton, R.F. 1985b. White spruce establishment: initial fertilization, weed control, and irrigation evaluated afterthree decades. New Forests 9: 123-133.
Stathers, R.J. 1989. Summer frost in young forest plantations. For. Can. and B.C. Min. For., Victoria. FRDA Rep. 073.
Walmsley, M.; Utzig, G.; Vold, T.; Moon, D.; van Barneveld, J. 1980. Describing ecosystems in the field. B.C Min.Env. and B.C. Min. For. Victoria. Land Management Report 7.
21