Embed Size (px)
Citation preview
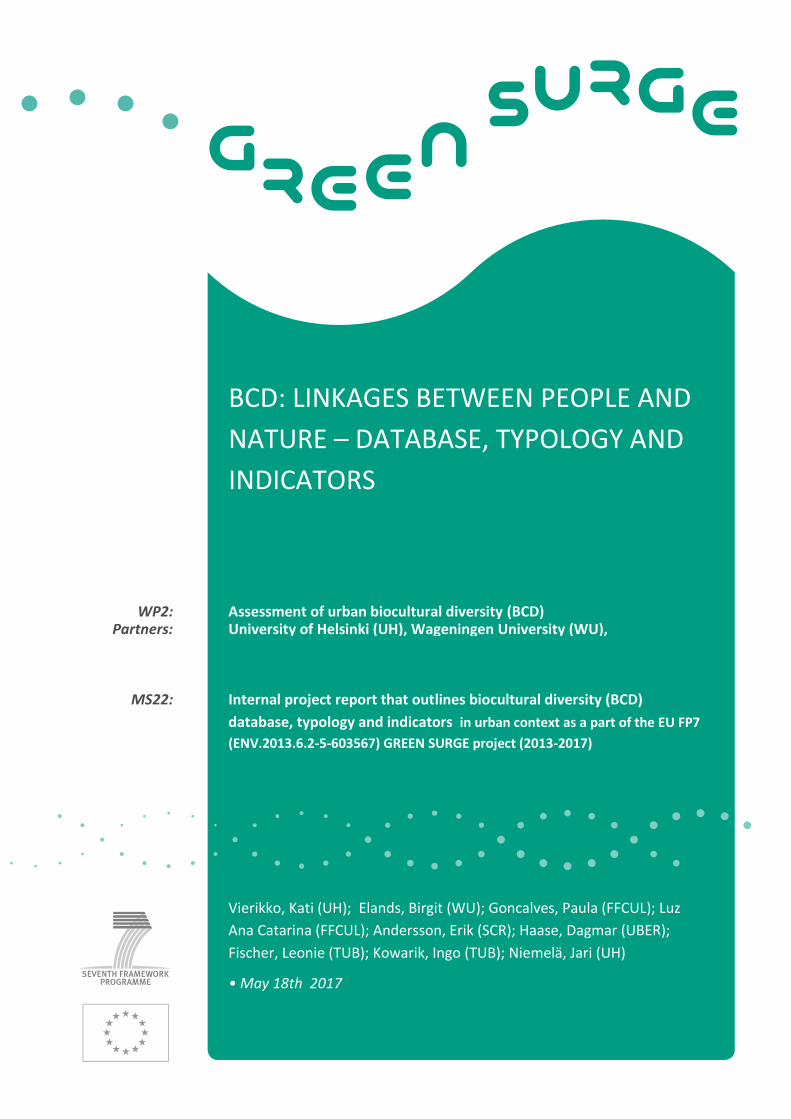
BCD: LINKAGES BETWEEN PEOPLE AND
NATURE – DATABASE, TYPOLOGY AND
INDICATORS
WP2: Assessment of urban biocultural diversity (BCD) Partners: University of Helsinki (UH), Wageningen University (WU),
MS22: Internal project report that outlines biocultural diversity (BCD)
database, typology and indicators in urban context as a part of the EU FP7
(ENV.2013.6.2-5-603567) GREEN SURGE project (2013-2017)
Vierikko, Kati (UH); Elands, Birgit (WU); Goncalves, Paula (FFCUL); Luz
Ana Catarina (FFCUL); Andersson, Erik (SCR); Haase, Dagmar (UBER);
Fischer, Leonie (TUB); Kowarik, Ingo (TUB); Niemelä, Jari (UH)
• May 18th 2017
BCD: LINKAGES BETWEEN PEOPLE AND NATURE – DATABASE, TYPOLOGY AND INDICATORS • WPX • Page 2
TABLE OF CONTENTS
1 Introduction 4
1.1 Objectives and outline of the report MS22 4
1.2 BCD research in the Green Surge 5
1.3 BCD database developed in the Green Surge 6
1.4 Ongoing WP2 research activities and publications 8
2 Towards a BCD typology 10
2.1 Relationships between culture(s) and nature is a key essence in BCD 12
3 BCD typology as a sensitizing concept 15
3.1 Tangible and materialised BCD 17
3.2 Lived BCD 20
3.3 Stewardship BCD 22
4 Development of BCD indicators 25
4.1 Tangible BCD manifestations 27
4.2 Lived biocultural diversity 28
4.3 Governance and stewardship 29
5 Towards the final report of WP2 (D2.3.) 31
5.1 Some points why BCD approach is needed in the urban context 31
5.2 Case narrative on materialized BCD 31
5.3 Case narrative on lived BCD in European cities 31
5.4 Case narrative on lived BCD in Helsinki and Lisbon 32
5.5 Case narrative on stewardship BCD 32
5.6 Conclusions: suggestions to assess BCD study in different situation 32
BCD: LINKAGES BETWEEN PEOPLE AND NATURE – DATABASE, TYPOLOGY AND INDICATORS • WPX • Page 3
6 References 33
BCD: LINKAGES BETWEEN PEOPLE AND NATURE – DATABASE, TYPOLOGY AND INDICATORS • WPX • Page 4
1 INTRODUCTION
1.1 Objectives and outline of the report MS22
According to the Project Annex I “Description of Work” (DoW, p. 3) the objectives of Green Surge are
to identify, develop and test ways of connecting green spaces, biodiversity, people and the green
economy, in order to meet the major urban challenges related to land use conflicts, climate change
adaptation, demographic changes, and human health and wellbeing. The Green Surge programme
has identified biocultural diversity (BCD) as a key concept for (1) understanding the integration be-
tween biological variety in the urban green infrastructure (UGI) and the cultural specificities of the
UGI’s users and (2) developing innovative approaches to planning and governance of UGI. The con-
cept was introduced for denoting the ‘inextricable link’ between biodiversity and cultural diversity
(Posey 1999). Work Package 2 (WP2) aims to apply the BCD in the context of Western urban socie-
ties, which is an innovative and novel approach to the use of the concept requiring further operation-
alisation in respect of its relevance for Urban Green Infrastructure (UGI) planning and governance. To
realise these aims, WP2 is divided into three different tasks:
2.1. Development of a conceptual framework for addressing how residents value and interact with
biodiversity (BD) and each other in urban regions
2.2. Use the conceptual framework to assess components of UGI and how residents with different
cultural backgrounds and socio-economic situations value and use UGI across European cities
2.3. Development of a database and typology of BCD of UGI components as grounding knowledge
for other parts of the project (WP4-7).
This milestone is result of Task 2.3, which is led by UH. FFCUL, UBER, WU, TUB and SRC have contrib-
uted to MS22. In addition, ULOD reviewed and commented the outcome during the writing process
(Table 1). MS22 is an analytical step for Green Surge researchers in producing final analyses for Deliv-
erable 2.3. This report will work as basis for D2.3 and present a BCD database, typology, indicators
and next steps for finishing Task 2.3.
BCD: LINKAGES BETWEEN PEOPLE AND NATURE – DATABASE, TYPOLOGY AND INDICATORS • WPX • Page 5
Table 1. List of partners and their contribution to the task 2.3.
No. Contributing partner Role Task/ contribution
2 University of Helsinki (UH) Lead Writing MS22 and D2.3. Case
analyses in Helsinki. Organizing
meetings and workshops
3 Humboldt Universität zu Berlin (UBER) Core team Testing BCD indicators, writing
short parts to the MS22/ D2.3
5 Wageningen University (WU) Core team Developing typology and content
of MS22 and D2.3, commenting
and reviewing
6 Stockholms Universitet (SRC) Core team Writing short parts of MS22 and
D2.3
12 Uniwersytet Łódzki (ULOD) Reviewer Reviewing and commenting
14 Fundação da Faculdade de Ciências
Da Universidade de Lisboa (FFCUL) Core team Writing MS22 and D2.3.
Development of BCD indicators;
cases analyses in Lisbon
16 Techniche Universität Berlin (TUB) Contributor Analysing BCD in ULL cities;
commenting and short
contributions to MS22 and
contribute analyses to D2.3
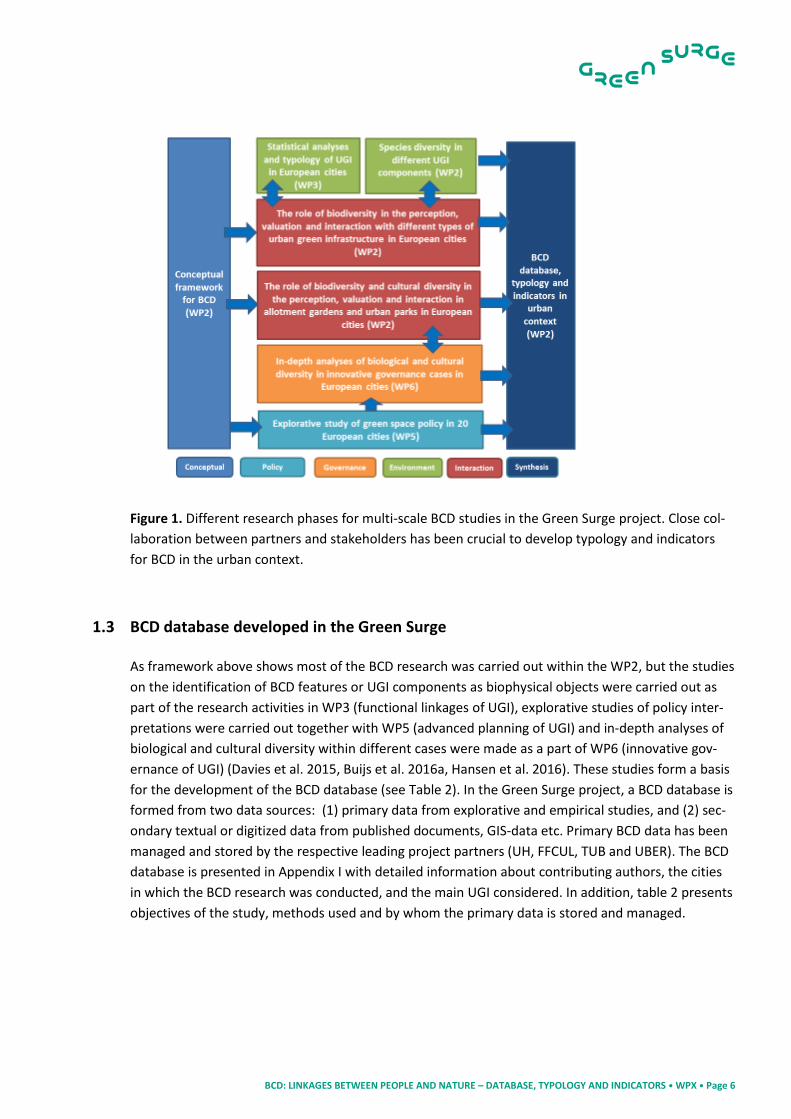
1.2 BCD research in the Green Surge
In the D2.1 a research framework for BCD were introduced (Vierikko et al. 2015, p. 21-23). The con-
cept of BCD was divided into three different research pillars: manifestations, maintenance and crea-
tions of BCD. Three pillars drew attention to the multiple relationships between culture(s) and nature
by studying how i) physical manifestations in urban settings, ii) different policy goals and manage-
ment practices, iii) people interact with biodiversity and with each other in different green spaces and
place-making situation.
BCD research in the Green Surge project was simultaneously carried out in five different phases at
multiple scales from the local and context-dependent scale (ULL cities) to European level analyses of
interlinkages between biodiversity and cultural diversity in European cities. Main research phases
were 1) conceptual, 2) policy, 3) governance, 4) people-biodiversity interactions, 5) biophysical envi-
ronment, and finally 6) synthesis of all research (Fig. 1). Methodological approaches of different re-
search phases are introduced in the D2.1, and the MS22 gives an overview of BCD studies conducted
in the WP2 and other WPs. There are some clarifications of methodological approaches and develop-
ment of the BCD research framework made after D2.1. The conceptual framework introduced in the
D2.1 was a starting point for BCD research in urban context and the aim was to develop the BCD con-
cept further. The MS22 will present the final research phase: synthesis with BCD database, typology
and indicators.
BCD: LINKAGES BETWEEN PEOPLE AND NATURE – DATABASE, TYPOLOGY AND INDICATORS • WPX • Page 6
Figure 1. Different research phases for multi-scale BCD studies in the Green Surge project. Close col-
laboration between partners and stakeholders has been crucial to develop typology and indicators
for BCD in the urban context.
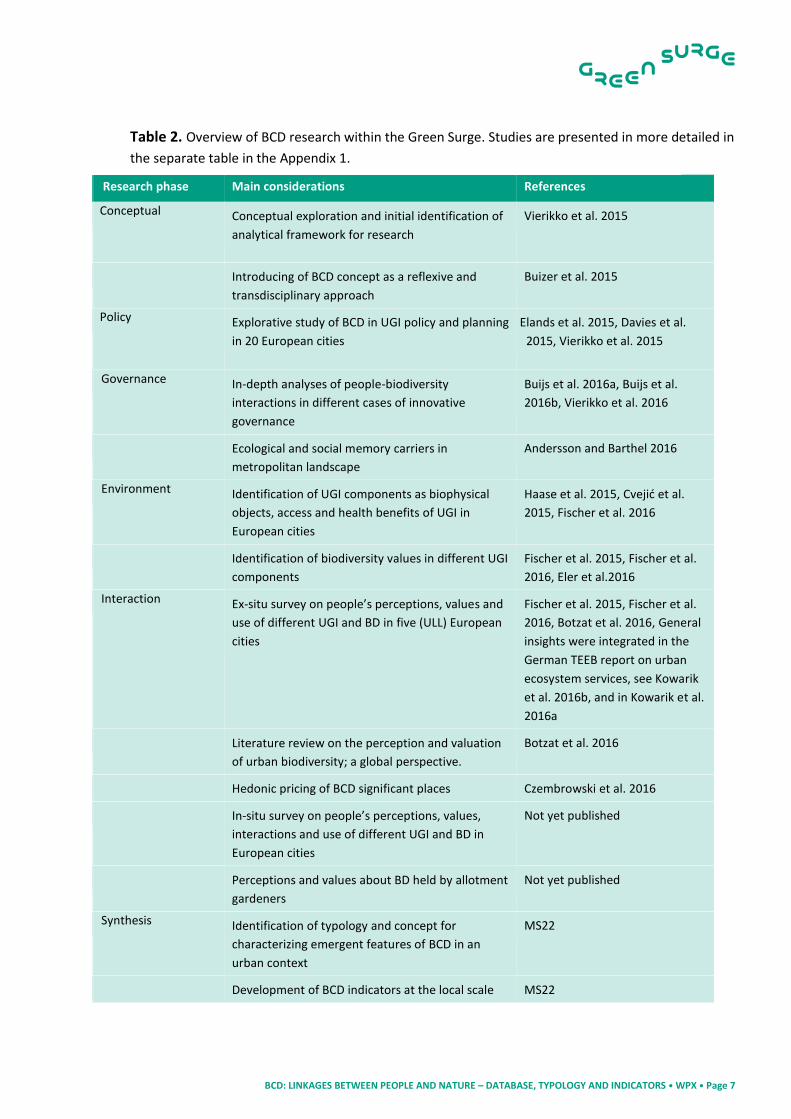
1.3 BCD database developed in the Green Surge
As framework above shows most of the BCD research was carried out within the WP2, but the studies
on the identification of BCD features or UGI components as biophysical objects were carried out as
part of the research activities in WP3 (functional linkages of UGI), explorative studies of policy inter-
pretations were carried out together with WP5 (advanced planning of UGI) and in-depth analyses of
biological and cultural diversity within different cases were made as a part of WP6 (innovative gov-
ernance of UGI) (Davies et al. 2015, Buijs et al. 2016a, Hansen et al. 2016). These studies form a basis
for the development of the BCD database (see Table 2). In the Green Surge project, a BCD database is
formed from two data sources: (1) primary data from explorative and empirical studies, and (2) sec-
ondary textual or digitized data from published documents, GIS-data etc. Primary BCD data has been
managed and stored by the respective leading project partners (UH, FFCUL, TUB and UBER). The BCD
database is presented in Appendix I with detailed information about contributing authors, the cities
in which the BCD research was conducted, and the main UGI considered. In addition, table 2 presents
objectives of the study, methods used and by whom the primary data is stored and managed.
BCD: LINKAGES BETWEEN PEOPLE AND NATURE – DATABASE, TYPOLOGY AND INDICATORS • WPX • Page 7
Table 2. Overview of BCD research within the Green Surge. Studies are presented in more detailed in
the separate table in the Appendix 1.
Research phase Main considerations References
Conceptual Conceptual exploration and initial identification of
analytical framework for research
Vierikko et al. 2015
Introducing of BCD concept as a reflexive and
transdisciplinary approach
Buizer et al. 2015
Policy Explorative study of BCD in UGI policy and planning
in 20 European cities
Elands et al. 2015, Davies et al.
2015, Vierikko et al. 2015
Governance In-depth analyses of people-biodiversity
interactions in different cases of innovative
governance
Buijs et al. 2016a, Buijs et al.
2016b, Vierikko et al. 2016
Ecological and social memory carriers in
metropolitan landscape
Andersson and Barthel 2016
Environment Identification of UGI components as biophysical
objects, access and health benefits of UGI in
European cities
Haase et al. 2015, Cvejić et al.
2015, Fischer et al. 2016
Identification of biodiversity values in different UGI
components
Fischer et al. 2015, Fischer et al.
2016, Eler et al.2016
Interaction Ex-situ survey on people’s perceptions, values and
use of different UGI and BD in five (ULL) European
cities
Fischer et al. 2015, Fischer et al.
2016, Botzat et al. 2016, General
insights were integrated in the
German TEEB report on urban
ecosystem services, see Kowarik
et al. 2016b, and in Kowarik et al.
2016a
Literature review on the perception and valuation
of urban biodiversity; a global perspective.
Botzat et al. 2016
Hedonic pricing of BCD significant places Czembrowski et al. 2016
In-situ survey on people’s perceptions, values,
interactions and use of different UGI and BD in
European cities
Not yet published
Perceptions and values about BD held by allotment
gardeners
Not yet published
Synthesis Identification of typology and concept for
characterizing emergent features of BCD in an
urban context
MS22
Development of BCD indicators at the local scale MS22
BCD: LINKAGES BETWEEN PEOPLE AND NATURE – DATABASE, TYPOLOGY AND INDICATORS • WPX • Page 8
1.4 Ongoing WP2 research activities and publications This section describes ongoing research activities as well as outputs of these activities until February
2017. Between November 2013 and December 2016, Green Surge project’s WP2 has been successful
in collecting a primary data through field observations, multi-taxa inventories, face-to-face inter-
views, internet surveys — much more than was anticipated in the research plan and in the DoW. Two
WP2 meetings were organized during the annual PGA meeting in Ljubljana and Wageningen during
2016. The core team has regularly organized Skype meetings (2016: February 6th, March 3rd, April
29th, November 11th, November 24th). WP2 has been very active in conceptual framing and the devel-
opment of analytical tools and approaches. Many of these BCD related studies were finished in 2016:
A study on urban dwellers’ perceptions and values towards urban parks, and associated cul-
tural and biological diversity was finished in Helsinki in summer 2016. The study in Helsinki
consisted of a multi-taxa assessment of biological diversity: vegetation, epiphytic lichens and
birds in 12 urban parks, and face-to-face interviews of park users (600 in total), based on the
questionnaire developed for the field survey that was conducted in task 2.2 in the five ULL
cities (see Fischer et al. 2015 and D2.2, Fischer et al. 2016).
In Lisbon, a study of urban dwellers’ perceptions and values towards green spaces, associated
biodiversity and ESS was finished in summer 2016. The study included four typologies of UGI:
parks older than 50 years in three urban matrix types (urban fabric, close to other UGI, green
embedded), allotment gardens, forests and derelict lands. Multi-taxa assessment of biological
and functional diversity: soil invertebrates, lichens, vascular plants, bees and butterflies,
birds, and face-to-face interviews of park users (611 total) and gardeners (60 total) were con-
ducted.
The BCD research of urban parks developed by UH and FFCUL, was adopted in two other cit-
ies: Berlin (160 interviews) and Leipzig by the UBER. In addition, researchers at the University
of Bucharest used the same approach in their park studies. We have not yet performed any
analyses, but based on data we presume that the research brings new information about why
and how different cultural groups uses parks, what they consider about place specific biodi-
versity and cultural diversity.
Exchange between university students: Master student Joana Viera visited the University of
Helsinki. Associated with the study presented above, she studied epiphytic lichen diversity in
18 urban parks of Helsinki in August 2016. The aim was to test air quality modelling devel-
oped in Lisbon in different geographical and urban context in Helsinki (Cristina: could you
check this one?). The contributing partner is FFCUL. Researcher Kati Vierikko visited Lisbon
with two master students in May 2016.
At TUB, analyses of the database on valuation, perception and use of urban green spaces
(task 2.2, see MS22, Fischer et al. 2015 and D2.2, Fischer et al. 2016) progressed well. General
outcomes of the field survey in task 2.2 were integrated in the German TEEB report on urban
ecosystem services (Kowarik et al. 2016) and presented at various international workshops
and conferences. A comprehensive manuscript was finalized for submission to a scientific
journal with the ULL partners in this task. Results of task 2.2 were integrated in the work
BCD: LINKAGES BETWEEN PEOPLE AND NATURE – DATABASE, TYPOLOGY AND INDICATORS • WPX • Page 9
within the Berlin ULL (WP7) at a very practical level: Hereby, TUB cooperated with a second-
ary school to create a biodiversity-friendly school garden and undertook environmental edu-
cation about edible wild plants in the school’s surrounding. During summer 2016 the TUB un-
dertook extensive vegetation and bird surveys on a wasteland site next to the school garden
and conducted a survey on urban foraging. The results will be integrated into a management
concept for the area that is momentarily developed by TUB students and the Berlin Focal LA.
This work is primarily listed as an activity within WP7 but the working group used the
knowledge gathered by the WP2, task 2.2 field survey in the previous year.
The ULOD team used hedonic pricing to check if green spaces characterized by high biocul-
tural diversity increase prices of nearby apartments more than other green spaces (Czem-
browski et al. 2016). The study was carried out in Łódź, Poland. This study indicated that
while there is a general desire to live close to the green space, biocultural diversity does not
translate into any positive impact on property prices.
Published and submitted papers in 2016:
Andersson, E. and Barthel, S. 2016. Memory carriers and stewardship of metropolitan landscapes.
Ecological Indicators 70, 606-614.
Buizer, M., Elands, B. and Vierikko, K. 2016. Governing cities reflexively – The biocultural diversity
concept as an alternative for ecosystem services. Environmental Science & Policy 62, 7-13.
Botzat, A., Fischer, L.K. and Kowarik, I. 2016. Unexploited opportunities in understanding liveable and
biodiverse cities. A review on urban biodiversity perception and valuation. Global Environmental
Change 39, 220–233.
Czembrowski, P., Laszkiewicz, E. and Kronenberg, J. 2016. Bioculturally valuable but not necessary
worth the price: integrating different dimensions of value of urban green spaces. Urban Forestry &
Urban Greening 20, 89–96
Kowarik, I., Fischer, L.K. and Honold, J. 2016. Beeinflusst Artenvielfalt die Wertschätzung der Stadtna-
tur? In: Kowarik, I., Bartz, R. and Brenck, M. (Eds. ) Naturkapital Deutschland – TEEB DE (2016): Öko-
systemleistungen in der Stadt – Gesundheit schützen und Lebensqualität erhöhen. Technische Uni-
versität Berlin, Helmholtz-Zentrum für Umweltforschung – UFZ. Berlin, Leipzig.
Kowarik, I., Bartz, R. and Fischer, L.K. 2016. Stadtgrün pflegen, Ökosystemleistungen stärken, Wildnis
wagen! Informationen zur Raumentwicklung 6, 731-738.
Vierikko, K., Elands, B., Niemelä, J., Andersson, E., Buijs, A., Fischer, L.K., Haase, D., Kabisch, N., Kowa-
rik, I., Luz, A. C., Olafsson Stahl, A., Száraz, L., Van der Jagt, A. and Konijnendijk van den Bosch, C.
2016: Considering the ways biocultural diversity helps enforce the urban green infrastructure in times
of urban transformation. Current Opinion in Environmental Sustainability 22, 7-12.
Vierikko, K. and Niemelä, J. 2016. Bottom-up thinking— Identifying socio-cultural values of ecosystem
services in local blue–green infrastructure planning in Helsinki, Finland. Land Use Policy 50, 537-547.
BCD: LINKAGES BETWEEN PEOPLE AND NATURE – DATABASE, TYPOLOGY AND INDICATORS • WPX • Page 10
2 TOWARDS A BCD TYPOLOGY
The second main goal of the Task 2.3, based on DoW (p. 9), was to develop a typology BCD of UGI. In
Green Surge the UGI is defined, in line with Benedict and McMahon (2006), as an interconnected net-
work of green space embodying the principles of multifunctionality and connectivity, which conserve
natural ecosystem values and functions, and provides associated benefits to human populations. Very
often in the literature, authors use the term urban green space (UGS). In the Green Surge, UGS is un-
derstood as any vegetation found in the urban environment including different UGS elements (also
called here as UGI components) such as parks, community or allotments gardens, residential gar-
dens, urban forests or street trees, lawns or cemeteries, water bodies and coastal areas (Breuste et
al. 2013, Kabisch and Haase 2014). It is worth mentioning that some biotopes such as forests, agricul-
tural land or sand dunes are usually not considered urban. Furthermore UGS have a different mean-
ing as a land cover type in Urban Atlas dataset including only certain types of green spaces such as
constructed parks and leaving original ecosystems such as forests or wetlands out from the category.
However, as these landscapes have historically sometimes been incorporated in expanding cities,
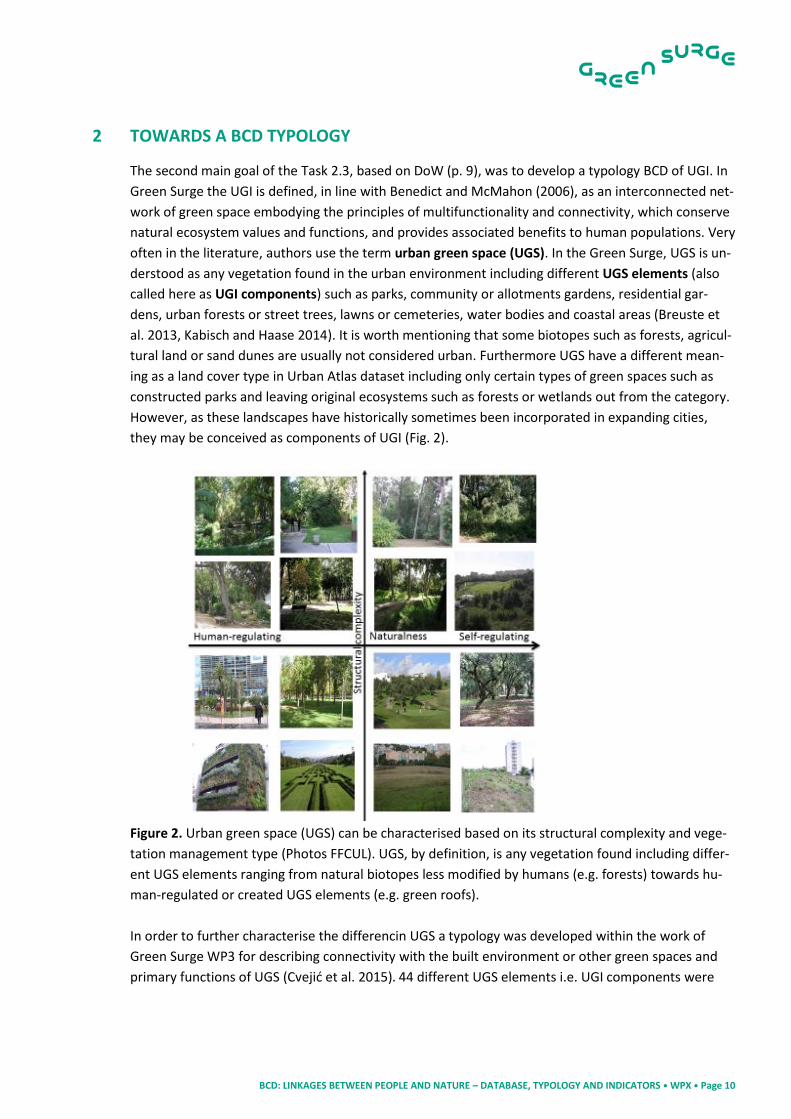
they may be conceived as components of UGI (Fig. 2).
Figure 2. Urban green space (UGS) can be characterised based on its structural complexity and vege-
tation management type (Photos FFCUL). UGS, by definition, is any vegetation found including differ-
ent UGS elements ranging from natural biotopes less modified by humans (e.g. forests) towards hu-
man-regulated or created UGS elements (e.g. green roofs).
In order to further characterise the differencin UGS a typology was developed within the work of
Green Surge WP3 for describing connectivity with the built environment or other green spaces and
primary functions of UGS (Cvejić et al. 2015). 44 different UGS elements i.e. UGI components were
BCD: LINKAGES BETWEEN PEOPLE AND NATURE – DATABASE, TYPOLOGY AND INDICATORS • WPX • Page 11
identified in the D3.2 (Table 3). They were classified under eight categories based on a) their integra-
tion with buildings/grey infrastructure; b) ownership, and c) primary function and use. The categories
are: 1) building greens, 2) private, commercial, industrial, institutional UGS and UGS connected to
grey infrastructure; 3) riverbank green; 4) parks and recreation; 5) allotments and community gar-
dens, 6) agricultural land; 7) natural, semi-natural and feral areas and 8) blue spaces.
Table 3. Eight UGS categories and 44 elements (UGI components) identified by the authors in WP3
(Cvejić et al. 2015).
UGS category UGS elements
1. Building greens Balcony green, ground based green wall, façade based
green wall, extensive green roof, intensive green roof,
atrium
2. Private, commercial, indus-
trial, institutional UGS and UGS
connected to grey infrastructure
Bioswale, tree alley and street tree, hedge, street
green, green verge, house garden, railroad bank, green
playground, school ground
3. Riverbank green Riverbank green
4. Parks and recreation Large urban park, historical park/garden, pocket park,
botanical garden/arboreta, zoological garden, neigh-
bourhood green space, institutional green space, ceme-
tery, churchyard, green sport facility, camping area
5. Allotments and community
gardens
Allotment garden, community garden
6. Agricultural land Arable land, grassland, tree meadow, orchard, biofuel
production, agroforestry, horticulture
7. Natural, semi-natural and fe-
ral areas
Forest (remnant woodland, managed forests, mixed
forms), shrubland, abandoned, ruderal, derelict land,
rocks, sand dunes, sand pit, quarry, open cast mine,
wetland, bog, fen, marsh
8. Blue spaces Lake, pond, river stream, dry riverbed, rambla, canal,
estuary, delta, sea coast
Another way of typifying UGS is to look at relationships between culture(s) and nature. For example,
Botzat et al. (2016) distinguished studies of human-nature interactions according to how biodiversity
were identified. Many studies assessed “biodiversity” primarily focused on either structural complex-
ity of vegetation or “green vs. gray” level when analysing perceptions, valuation or human-nature in-
teractions (Botzat et al. 2016). The explorative study on BCD manifestation as a part of UGI planning
in WP2 aimed to identify how biological and cultural diversity was interpreted and assessed by city
managers, and what kinds of BCD manifestations could be identified in 20 European cities (Elands et
al. 2015, Vierikko et al. 2015). Two spatial scales for BCD manifestations (e.g. human-nature interac-
tion) were identified: at the level of the city or at the local level of UGS element. At the city level, the
human-nature interactions in UGI were more either focused on natural or cultural capital and trans-
ferred between recreation and conservation (Fig. 3). At the local level, UGS element was character-
ised by either incorporation of biodiversity in the human domain or the incorporation of culture in
the ecological domain, and transferred between people using/ consuming area without engagement
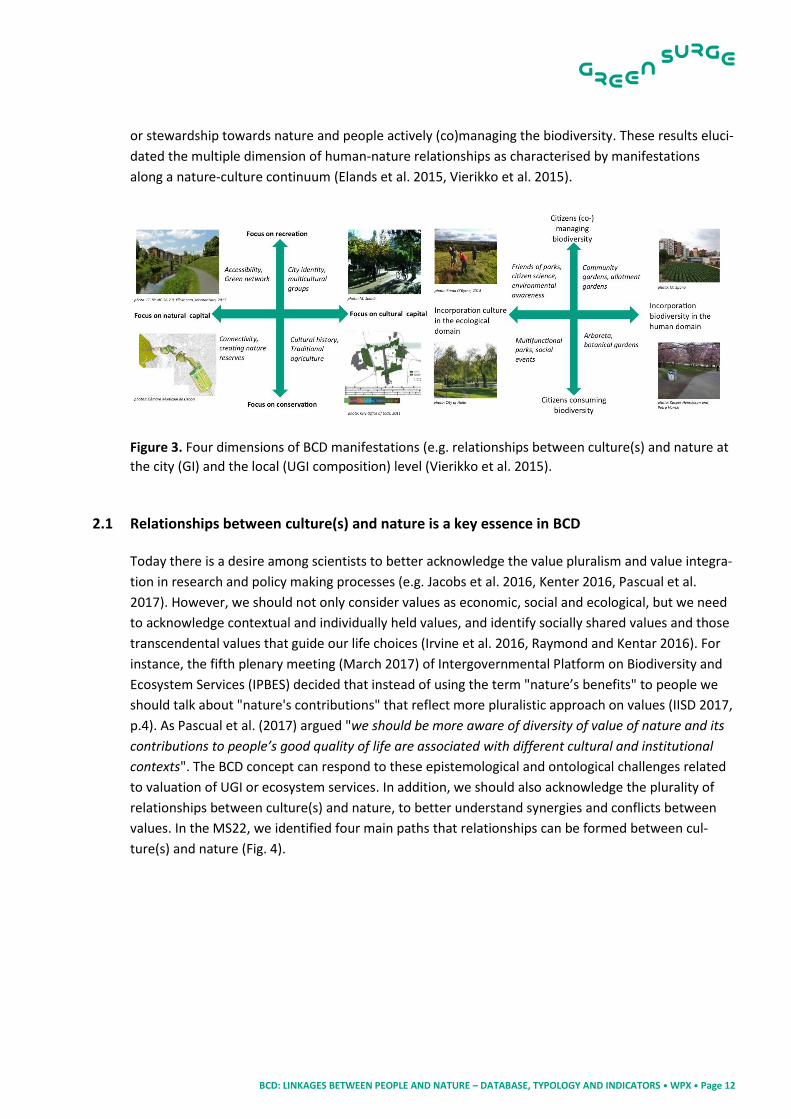
BCD: LINKAGES BETWEEN PEOPLE AND NATURE – DATABASE, TYPOLOGY AND INDICATORS • WPX • Page 12
or stewardship towards nature and people actively (co)managing the biodiversity. These results eluci-
dated the multiple dimension of human-nature relationships as characterised by manifestations
along a nature-culture continuum (Elands et al. 2015, Vierikko et al. 2015).
Figure 3. Four dimensions of BCD manifestations (e.g. relationships between culture(s) and nature at
the city (GI) and the local (UGI composition) level (Vierikko et al. 2015).
2.1 Relationships between culture(s) and nature is a key essence in BCD Today there is a desire among scientists to better acknowledge the value pluralism and value integra-
tion in research and policy making processes (e.g. Jacobs et al. 2016, Kenter 2016, Pascual et al.
2017). However, we should not only consider values as economic, social and ecological, but we need
to acknowledge contextual and individually held values, and identify socially shared values and those
transcendental values that guide our life choices (Irvine et al. 2016, Raymond and Kentar 2016). For
instance, the fifth plenary meeting (March 2017) of Intergovernmental Platform on Biodiversity and
Ecosystem Services (IPBES) decided that instead of using the term "nature’s benefits" to people we
should talk about "nature's contributions" that reflect more pluralistic approach on values (IISD 2017,
p.4). As Pascual et al. (2017) argued "we should be more aware of diversity of value of nature and its
contributions to people’s good quality of life are associated with different cultural and institutional
contexts". The BCD concept can respond to these epistemological and ontological challenges related
to valuation of UGI or ecosystem services. In addition, we should also acknowledge the plurality of
relationships between culture(s) and nature, to better understand synergies and conflicts between
values. In the MS22, we identified four main paths that relationships can be formed between cul-
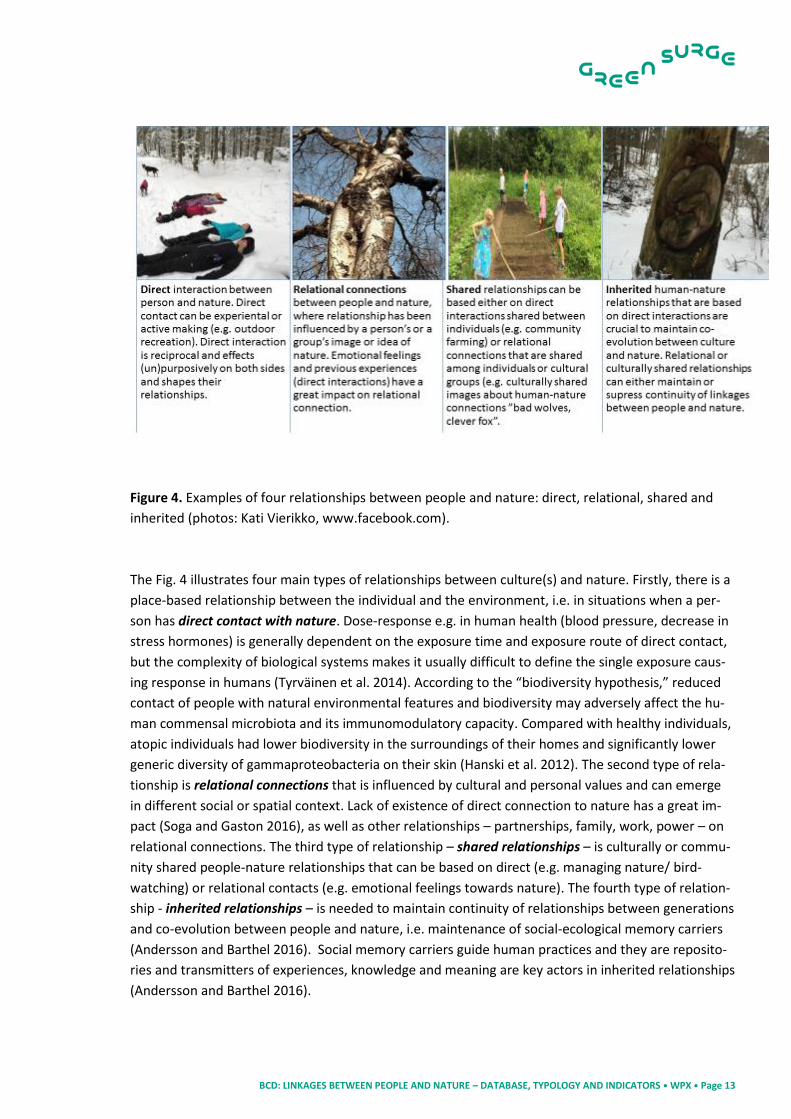
ture(s) and nature (Fig. 4).
BCD: LINKAGES BETWEEN PEOPLE AND NATURE – DATABASE, TYPOLOGY AND INDICATORS • WPX • Page 13
Figure 4. Examples of four relationships between people and nature: direct, relational, shared and
inherited (photos: Kati Vierikko, www.facebook.com).
The Fig. 4 illustrates four main types of relationships between culture(s) and nature. Firstly, there is a
place-based relationship between the individual and the environment, i.e. in situations when a per-
son has direct contact with nature. Dose-response e.g. in human health (blood pressure, decrease in
stress hormones) is generally dependent on the exposure time and exposure route of direct contact,
but the complexity of biological systems makes it usually difficult to define the single exposure caus-
ing response in humans (Tyrväinen et al. 2014). According to the “biodiversity hypothesis,” reduced
contact of people with natural environmental features and biodiversity may adversely affect the hu-
man commensal microbiota and its immunomodulatory capacity. Compared with healthy individuals,
atopic individuals had lower biodiversity in the surroundings of their homes and significantly lower
generic diversity of gammaproteobacteria on their skin (Hanski et al. 2012). The second type of rela-
tionship is relational connections that is influenced by cultural and personal values and can emerge
in different social or spatial context. Lack of existence of direct connection to nature has a great im-
pact (Soga and Gaston 2016), as well as other relationships – partnerships, family, work, power – on
relational connections. The third type of relationship – shared relationships – is culturally or commu-
nity shared people-nature relationships that can be based on direct (e.g. managing nature/ bird-
watching) or relational contacts (e.g. emotional feelings towards nature). The fourth type of relation-
ship - inherited relationships – is needed to maintain continuity of relationships between generations
and co-evolution between people and nature, i.e. maintenance of social-ecological memory carriers
(Andersson and Barthel 2016). Social memory carriers guide human practices and they are reposito-
ries and transmitters of experiences, knowledge and meaning are key actors in inherited relationships
(Andersson and Barthel 2016).
BCD: LINKAGES BETWEEN PEOPLE AND NATURE – DATABASE, TYPOLOGY AND INDICATORS • WPX • Page 14
The initial efforts to develop a typology in D3.2 (Cvejić et al. 2015) is based on the conceptualization
of UGS as a definite concept. UGS is characterized based on connections to gray infrastructure, own-
ership or primary function and use. However, little attention has been given dynamic human-nature
relationships and issues of equal access or opportunities to use UGS, social cohesion of places or eco-
logical sustainability. The BCD typology as a sensitizing concept could support UGI planning and gov-
ernance to become ecologically and socially more inclusive, as well as to elucidate the various types
of interaction between the biological variety in UGI and the cultural orientations of the users. Instead
of giving “a final type” for UGS could we typify UGS based on its dynamic and constantly evolving re-
lationships between people and nature?
BCD: LINKAGES BETWEEN PEOPLE AND NATURE – DATABASE, TYPOLOGY AND INDICATORS • WPX • Page 15
3 BCD TYPOLOGY AS A SENSITIZING CONCEPT
As discussed in the 2nd chapter, a further conceptualisation of BCD typology is needed, and BCD con-
cept should be sensitive and reflexive rather than definitive when analysing relationships between
culture and biodiversity. Buizer et al. (2016) argued that BCD concept can account for the many ways
in which modern people live with green areas in urbanized landscapes and acknowledge the different
kinds of cultural orientations this involves. The BCD concept should acknowledge the dynamics in bio-
logical and cultural diversity, and their relationships, in response to the ongoing processes of urban
transformation. We identified four challenges related to urban transformations in the sense of a co-
evolution between biodiversity and cultural diversity:
Past dynamics between human-nature relationships that have resulted in specific human-
nature interactions and that can be found in a landscape or in components in UGI. During the
past decade, much attention has been given to identifying how the historic processes of co-
evolution between biodiversity and cultural diversity have resulted in specific constellations of
UGI. An example of such dynamism might be the Green Circle of Tradition and Culture (GCTC),
which was designated in Łódź to underline the special biological and cultural value of certain
areas in the city. The GCTC is an irregular ring around the city center and consists of green
spaces as well as post-industrial areas and other historically important locations. The GCTC is
also the effect of the cultural diversity which was a trademark of Łódź in the 19th century and
which shaped the character of the city (Elands et al. 2015, Czembrowski et al. 2016).
Present dynamics between human-nature relationships. Changes in urban lifestyles or trends
can reconnect people with nature or deepen the loss of biodiversity experiences (Andersson et
al. 2014, Pett et al. 2016, Soga et al. 2016). Kowarik found (2015) that the acceptance of novel
wild nature at urban wastelands conspicuously increased during the last decades and facili-
tated the integration of such novel wilderness areas into the urban green infrastructure. Today,
an important part of urban residents assign environmental values also to wild growing plants
(”weeds”) in streetscapes (Weber et al. 2014). Increased interest of urban people on rewilding
the urban green space gives more space for autonomous ecological processes (Diemer et al.
2003) as well as conservation of threatened natural biodiversity (Goddard et al. 2010, Puppim
de Oliveira et al. 2011). However, what is at present novel, might be a heritage for a next gen-
eration, if the relationships or values are inherited.
Present dynamics in urban biodiversity. Loss of local green spaces and associated biodiversity
due to densification; homogenisation of UGI and species pools (green spaces and species sets
are becoming more similar everywhere) in cities restricts people’s daily interaction with a spe-
cific local, diverse nature. Limited ability of individuals to perceive biodiversity will influence a
person’s experiences, emotions and understanding about local biodiversity i.e. increase of peo-
ple-biodiversity paradox (Pett et al. 2016, Soga et al. 2016).
Present dynamics in cultural diversification. Cultural diversification can happen through the
influx of migrants with different cultural orientations on the use of UGS (Jay et al. 2012, Kloek
et al. 2013, Leikkilä et al. 2013), or among different socio-demographic groups or through dif-
ferentiation in urban lifestyles (trends). Increasing cultural diversity will have effect on mean-
ings, values or perceptions assigned to UGI, which can cause conflicts, inequity of use/ac-
cess/values related to UGI. Some groups can be stronger or more empowered than others and
BCD: LINKAGES BETWEEN PEOPLE AND NATURE – DATABASE, TYPOLOGY AND INDICATORS • WPX • Page 16
notions of equal access, environmental justice and power issues become important (Paloniemi
et al. submitted).
Diversity is a focal concept of the BCD concept. By its emphasis on diversity, the BCD concept
acknowledges the different knowledges (e.g. expert, tacit, traditional), meanings and values this in-
volves, and can reveal conflicts and ambivalence that may be at stake. Therefore, the BCD approach
calls for a genuine transdisciplinary thinking in research to cross borders between disciplines or schol-
ars, and to give way to new, “intermediate” research. Research itself should also maintain methodo-
logical and epistemological diversity. However, diversity (e.g., in values, interests, uses) can also
cause problems and conflicts, and therefore the BCD approach is critical on how far research should
go towards supporting specific values (Lang et al. 2012). During the Green Surge project, researchers
within WP2 agreed on some general requirement and objectives for the BCD concept:
1. The BCD typology should not be considered a static system to classify UGI. BCD typology is more
about identifying dimensions and parameters than classes.
2. The BCD typology need to consider cultural values, meanings, perceptions, actions and ongoing
relations as well as understanding of the biophysical reality and ecosystem services (ESS).
3. BCD allows us to illustrate how cultural understanding about UGI is created, and how different
UGI types have been transmitted and captured into cultural realities. Cultural reality includes ex-
pressions, stories, narratives, historical archives, cultural artefacts and also the values that are
held or certain meanings that an individual or a group conveys about biodiversity.
4. In addition to biophysical and cultural reality, the BCD typology should also consider intangible as-
pects and values, such as interactions between culture(s) and nature or power relations and eq-
uity/justice.
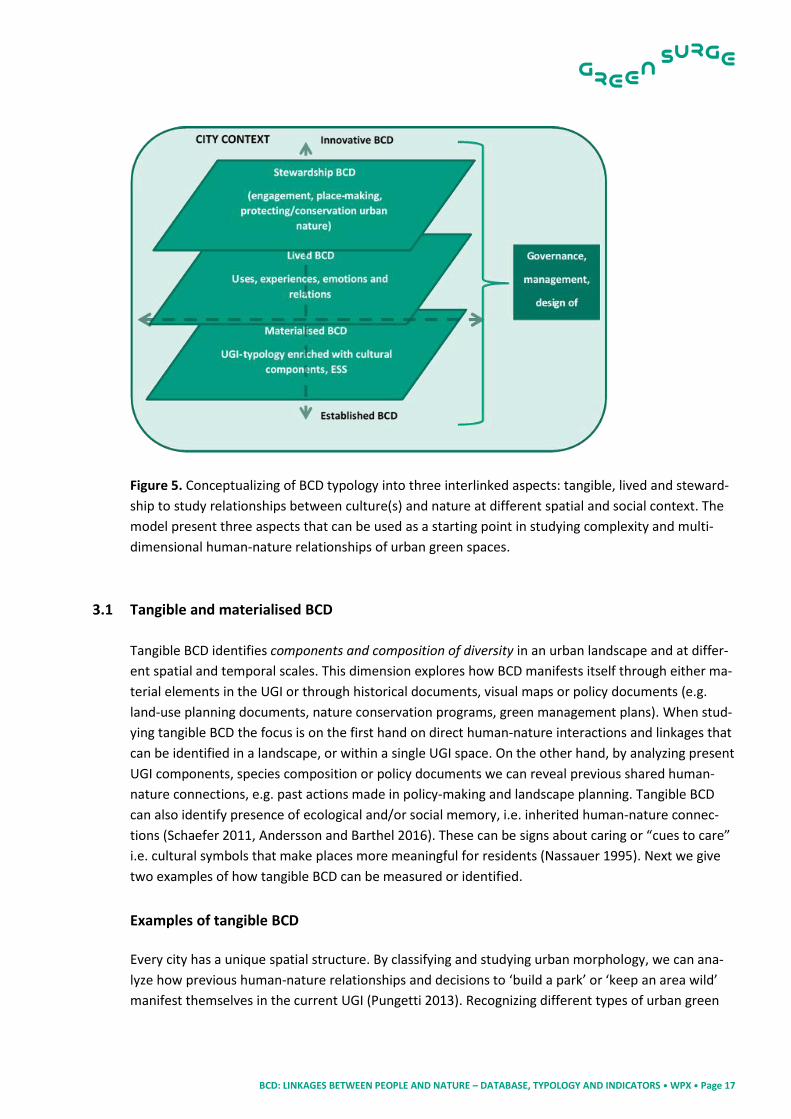
Based on previous discussions and main findings presented above we developed a conceptual model
for BCD typology. Figure 5 depicts three different aspects: tangible, lived and stewardship, being de-
parture points from which BCD can be studied. A focus on one aspect does not exclude the existence
of the other two, rather, they should be considered as interdependent. The concept of BCD typology
does not separate humans and nature as a counterbalance system as the ESS approach does (Buizer
et al. 2016). The core idea of the BCD concept is that there is an innate connection between biological
and cultural diversity. (Fig. 5). Changes in lived BCD (e.g. use of a UGI) will have an impact on tangi-
ble/materialised BCD (e.g. facilities, trails, species composition).
BCD: LINKAGES BETWEEN PEOPLE AND NATURE – DATABASE, TYPOLOGY AND INDICATORS • WPX • Page 17
Figure 5. Conceptualizing of BCD typology into three interlinked aspects: tangible, lived and steward-
ship to study relationships between culture(s) and nature at different spatial and social context. The
model present three aspects that can be used as a starting point in studying complexity and multi-
dimensional human-nature relationships of urban green spaces.
3.1 Tangible and materialised BCD
Tangible BCD identifies components and composition of diversity in an urban landscape and at differ-
ent spatial and temporal scales. This dimension explores how BCD manifests itself through either ma-
terial elements in the UGI or through historical documents, visual maps or policy documents (e.g.
land-use planning documents, nature conservation programs, green management plans). When stud-
ying tangible BCD the focus is on the first hand on direct human-nature interactions and linkages that
can be identified in a landscape, or within a single UGI space. On the other hand, by analyzing present
UGI components, species composition or policy documents we can reveal previous shared human-
nature connections, e.g. past actions made in policy-making and landscape planning. Tangible BCD
can also identify presence of ecological and/or social memory, i.e. inherited human-nature connec-
tions (Schaefer 2011, Andersson and Barthel 2016). These can be signs about caring or “cues to care”
i.e. cultural symbols that make places more meaningful for residents (Nassauer 1995). Next we give
two examples of how tangible BCD can be measured or identified.
Examples of tangible BCD
Every city has a unique spatial structure. By classifying and studying urban morphology, we can ana-
lyze how previous human-nature relationships and decisions to ‘build a park’ or ‘keep an area wild’
manifest themselves in the current UGI (Pungetti 2013). Recognizing different types of urban green
BCD: LINKAGES BETWEEN PEOPLE AND NATURE – DATABASE, TYPOLOGY AND INDICATORS • WPX • Page 18
spaces or present-day vegetation structure in urban landscape reflects not only materialised ele-
ments of BCD, but also legacies of past human-nature relationship (Boone et al. 2010, Pungetti 2013,
Agnoletti and Emanueli 2016, Andersson and Barthel 2016). There are plenty of classification systems
and typologies developed for UGS. These systems are on the one hand examples of how we construct
a material dimension of UGI and on the other hand examples of how we interpret urban landscapes
by using the developed UGI typology. Unique combinations of UGI types and neighbor associations
with other land uses are never complete, and manifestations of tangible BCD changes constantly in
different spatial or compositional scales – from local (species composition/ facilities of a park) to city
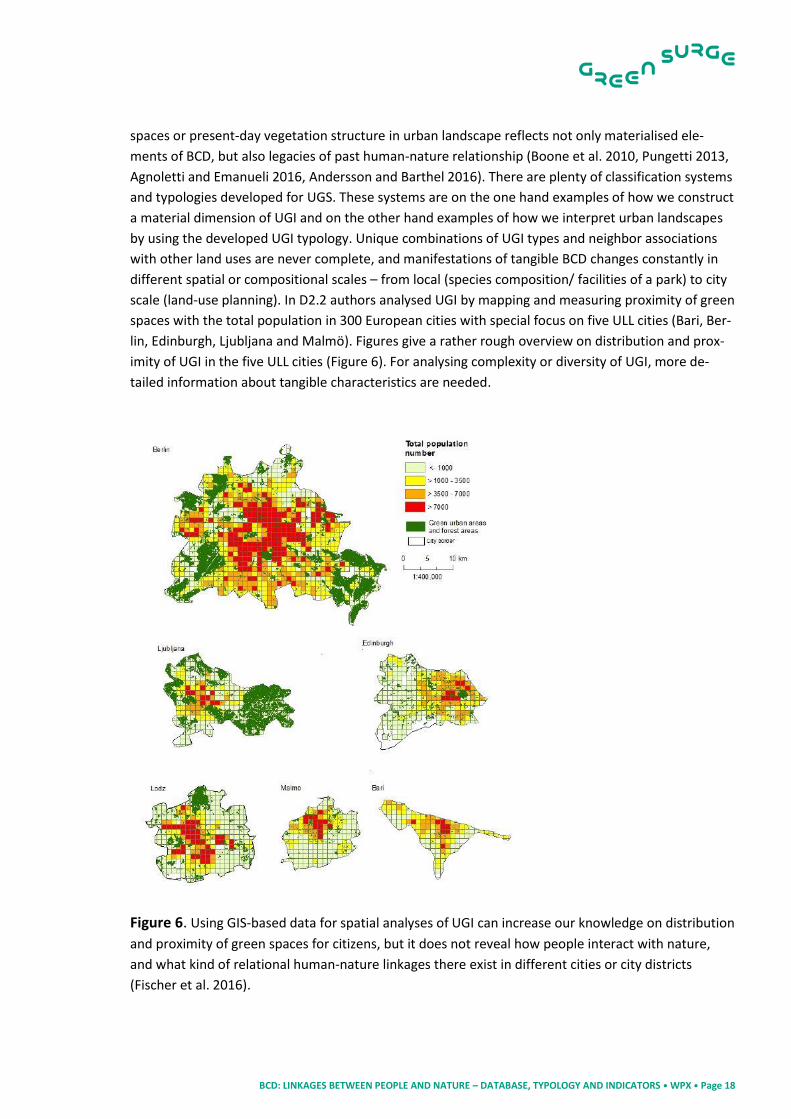
scale (land-use planning). In D2.2 authors analysed UGI by mapping and measuring proximity of green
spaces with the total population in 300 European cities with special focus on five ULL cities (Bari, Ber-
lin, Edinburgh, Ljubljana and Malmö). Figures give a rather rough overview on distribution and prox-
imity of UGI in the five ULL cities (Figure 6). For analysing complexity or diversity of UGI, more de-
tailed information about tangible characteristics are needed.
Figure 6. Using GIS-based data for spatial analyses of UGI can increase our knowledge on distribution
and proximity of green spaces for citizens, but it does not reveal how people interact with nature,
and what kind of relational human-nature linkages there exist in different cities or city districts
(Fischer et al. 2016).
BCD: LINKAGES BETWEEN PEOPLE AND NATURE – DATABASE, TYPOLOGY AND INDICATORS • WPX • Page 19
The above presented example of studying tangible BCD by identifying, mapping and analysing existing
urban landscape is made by experts. Pretty (2013) speaks about analytical landscape aspects as part
of a holistic landscape approach. Expert-oriented measures and ex-situ analyses of distribution or
proximity of green spaces needs another aspect to study BCD manifestations to deepen our
knowledge on how people interact with biodiversity in cities. For example, who has the opportunity
or access for daily interactions with nature-associated biodiversity? Tangible BCD dimension can help
us to find indications of different human-nature relationships e.g. by observing signs of cultural en-
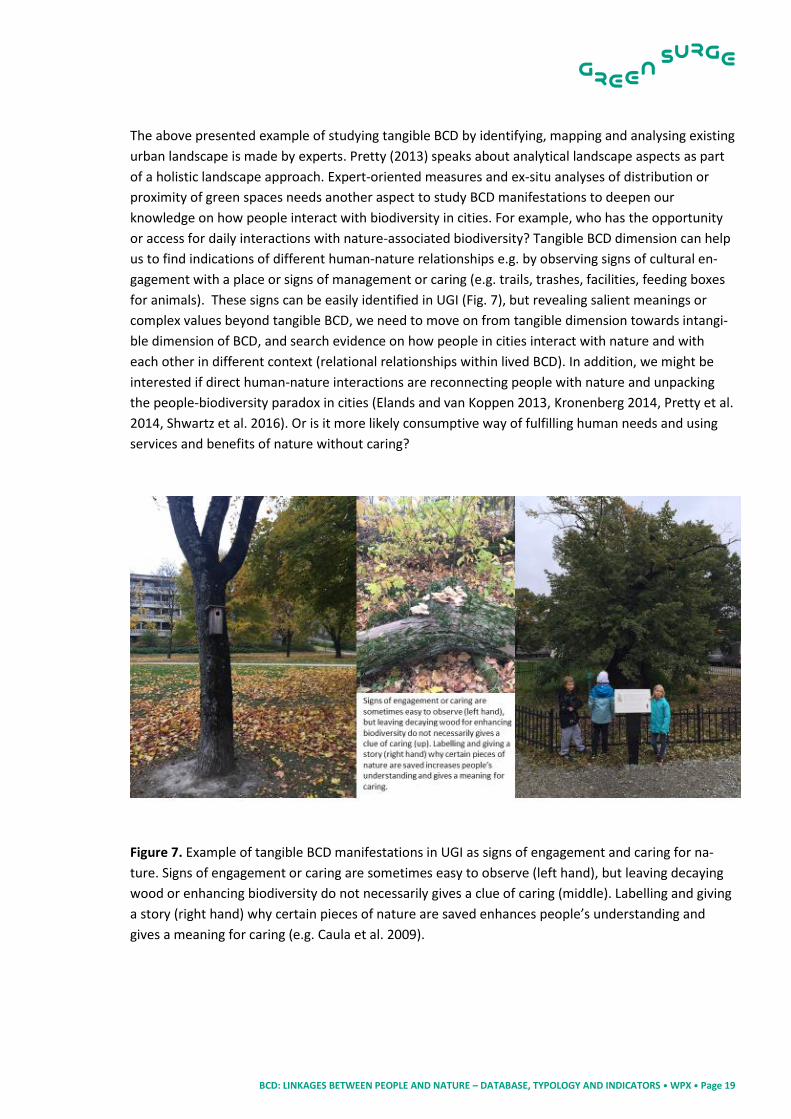
gagement with a place or signs of management or caring (e.g. trails, trashes, facilities, feeding boxes
for animals). These signs can be easily identified in UGI (Fig. 7), but revealing salient meanings or
complex values beyond tangible BCD, we need to move on from tangible dimension towards intangi-
ble dimension of BCD, and search evidence on how people in cities interact with nature and with
each other in different context (relational relationships within lived BCD). In addition, we might be
interested if direct human-nature interactions are reconnecting people with nature and unpacking
the people-biodiversity paradox in cities (Elands and van Koppen 2013, Kronenberg 2014, Pretty et al.
2014, Shwartz et al. 2016). Or is it more likely consumptive way of fulfilling human needs and using
services and benefits of nature without caring?
Figure 7. Example of tangible BCD manifestations in UGI as signs of engagement and caring for na-
ture. Signs of engagement or caring are sometimes easy to observe (left hand), but leaving decaying
wood or enhancing biodiversity do not necessarily gives a clue of caring (middle). Labelling and giving
a story (right hand) why certain pieces of nature are saved enhances people’s understanding and
gives a meaning for caring (e.g. Caula et al. 2009).
BCD: LINKAGES BETWEEN PEOPLE AND NATURE – DATABASE, TYPOLOGY AND INDICATORS • WPX • Page 20
3.2 Lived BCD
The second aspect of BCD concept identifies diversity in use of UGI and users, people’s meanings,
perceptions and values towards nature and associated biodiversity. Opposite to the ontological para-
digm in ES approach the concept of BCD inherently presumes that nature is not a separate biophysi-
cal system from social system providing different services for people or society. Rather, the BCD con-
cept underlines that social-ecological system include interactions between people and their
worldviews, value systems, understandings, preferences, management and ecological preconditions
and human mediated novelty. UGI per se does not have independent features that are unrelated to
how people interact with it. By analysing lived BCD in different spatial or social contexts helps us
identify current direct, relational and shared relationships between culture(s) and nature, and place-
based values that different groups and individuals assign for UGI and associated biodiversity
(Horlings 2014, Martín-López and Mortes 2014, Chan et al. 2016). Here we give two examples how
we can study lived BCD by analysing personal and culturally shared values.
Examples of lived BCD
Lived BCD refers to personal perceptions, interactions and values, e.g. direct and relational relation-
ships (Fig. 4). Emotional involvement with nature will influence an individual’s relationship to the nat-
ural world (Kollmus and Agyeman 2002). Direct connections are an important factor shaping beliefs,
values and attitudes towards the environment, as well as to participate or promote planning, man-
agement and care for the place. People directly interact with different biodiversity (BD) components
in a variety ways. Sometimes interaction between a person and nature is direct and easy to observe
(e.g. bird-watching, picking edible fruits or berries), but there are also other kinds of direct interac-
tions (e.g. enjoying bird signing) that are more difficult to observe by researchers or practitioners
(Pallidowa et al. 2017). People can use and value BD through different elements: landscape charac-
teristics, genetic variation (colour of flowers) in addition to a species point of view (Muratet et al.
2015, Voigt and Wurster 2015). Some elements of biodiversity are more recognised and appreciated
by people than others, and these elements tend to be the more actively promoted. For example, di-
rect ecosystem goods like edible plants play a central role in place making and cultural identity and
spending time in certain landscape types can provide directly experienced increases in well-being.
BCD: LINKAGES BETWEEN PEOPLE AND NATURE – DATABASE, TYPOLOGY AND INDICATORS • WPX • Page 21
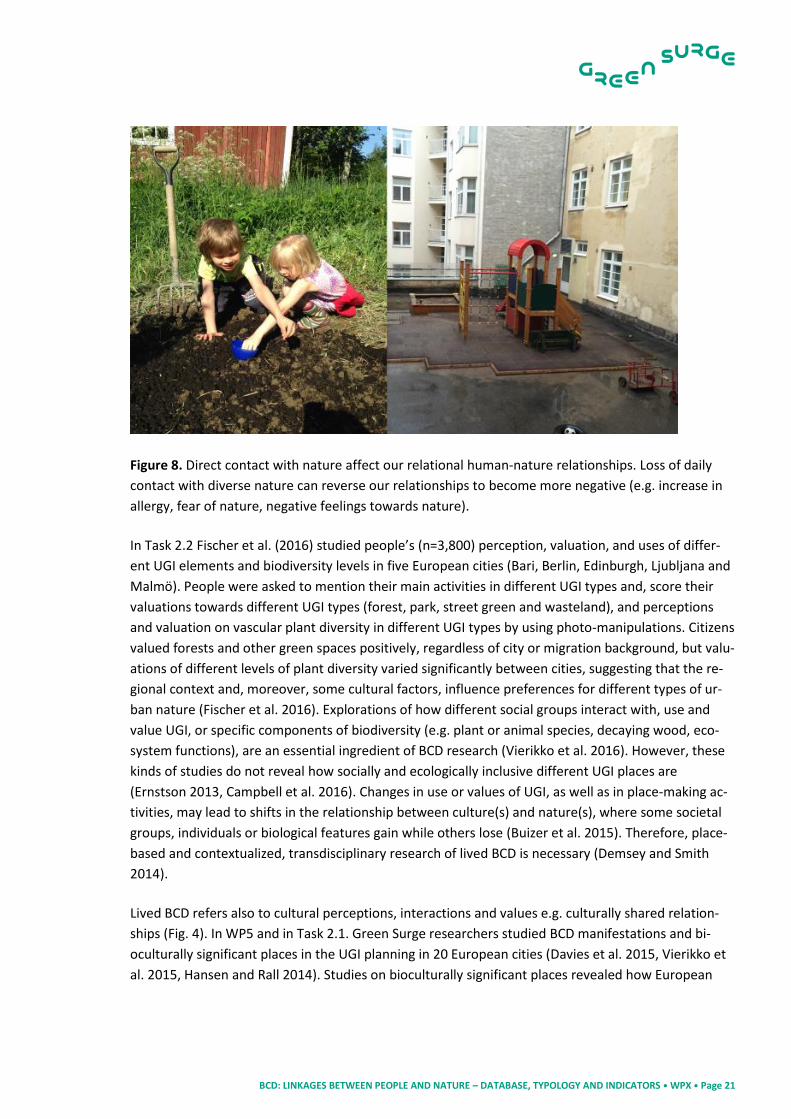
Figure 8. Direct contact with nature affect our relational human-nature relationships. Loss of daily
contact with diverse nature can reverse our relationships to become more negative (e.g. increase in
allergy, fear of nature, negative feelings towards nature).
In Task 2.2 Fischer et al. (2016) studied people’s (n=3,800) perception, valuation, and uses of differ-
ent UGI elements and biodiversity levels in five European cities (Bari, Berlin, Edinburgh, Ljubljana and
Malmö). People were asked to mention their main activities in different UGI types and, score their
valuations towards different UGI types (forest, park, street green and wasteland), and perceptions
and valuation on vascular plant diversity in different UGI types by using photo-manipulations. Citizens
valued forests and other green spaces positively, regardless of city or migration background, but valu-
ations of different levels of plant diversity varied significantly between cities, suggesting that the re-
gional context and, moreover, some cultural factors, influence preferences for different types of ur-
ban nature (Fischer et al. 2016). Explorations of how different social groups interact with, use and
value UGI, or specific components of biodiversity (e.g. plant or animal species, decaying wood, eco-
system functions), are an essential ingredient of BCD research (Vierikko et al. 2016). However, these
kinds of studies do not reveal how socially and ecologically inclusive different UGI places are
(Ernstson 2013, Campbell et al. 2016). Changes in use or values of UGI, as well as in place-making ac-
tivities, may lead to shifts in the relationship between culture(s) and nature(s), where some societal
groups, individuals or biological features gain while others lose (Buizer et al. 2015). Therefore, place-
based and contextualized, transdisciplinary research of lived BCD is necessary (Demsey and Smith
2014).
Lived BCD refers also to cultural perceptions, interactions and values e.g. culturally shared relation-
ships (Fig. 4). In WP5 and in Task 2.1. Green Surge researchers studied BCD manifestations and bi-
oculturally significant places in the UGI planning in 20 European cities (Davies et al. 2015, Vierikko et
al. 2015, Hansen and Rall 2014). Studies on bioculturally significant places revealed how European
BCD: LINKAGES BETWEEN PEOPLE AND NATURE – DATABASE, TYPOLOGY AND INDICATORS • WPX • Page 22
citizens live with urban biodiversity. Those culturally shared biodiversity components, that are mean-
ingful for the different cultural groups, can be called as “cultural keystone biodiversity”. Original defi-
nition referred to a cultural keystone species emerged from studies of indigenous people, and identi-
fying species that have a key role in defining cultural identity (Garibaldy and Turner 2004). Cultural
keystone species can vary over temporal, geographic, and social scales. They are dependent on con-
text and what is a keystone species to one group may not be keystone to another. For example, in
Romania, every year, when the new generation of mayflies (Palingenia longicauda) swim on the sur-
face of the river for a short period of time, many people come to Szeged to watch and experience this
“blooming of Tisza” (Davies et al. 2015). Analysing keystone BD elements as a part of lived BCD di-
mension can help us reveal shifts in relational relationships between culture(s) and nature in cities.
3.3 Stewardship BCD Stewardship is the third aspect of the BCD concept. A growing body of literature on different forms of
stewardship and engagement in nature or sustainability issues clearly show how people engage ac-
tively in shaping biodiversity to align with ideas about what is ‘desirable’ or ‘valuable’. This desire to
manage, improve or promote certain aspects of the natural world we live in is constantly changing
both nature and biodiversity itself and how we understand and make meaning of it. Novelty, the
break from business as usual, either through the arrival of new perspectives or new ecological fea-
tures may provide windows for re-evaluation and opening up new fields of meaningful biocultural di-
versity. However, BCD is not only created by the intentional interaction between engaged stewards
and a local ecology. Various human interests and pursuits come with indirect, if often profound, con-
sequences. Land transformations or sheer human presence influence ecological processes and dy-
namics, as well as species communities. Thus, actively or passively, directly or indirectly, we co-pro-
duce and are influenced by the nature we are embedded in. The third dimension of the BCD concept
tries to capture this inherent agency and some of the complex factors that shape human-nature rela-
tionships over time. This includes the various activities aimed at maintaining or promoting biodiver-
sity as well as those altering biophysical conditions for other reasons. Stewardship can emerge from
three social context: institutional/public (municipality, government, research institution taking care
of nature), communal (group of people, NGOs, organizations taking care of nature) and private (indi-
viduals or entrepreneur taking care of nature). We give an example how communal stewardship of
BCD can be analysed.
Example of stewardship BCD
Communal stewardship of private people towards environment is example when citizens or private
actors are taking responsibility for the maintenance or creation of UGI. These can be individual peo-
ple, local NGOs, community groups, private companies. People might be engaged with the environ-
ment through volunteering in management activities, on an ad hoc base or in a more structural form
through participation in e.g. a “Friends of” group, self-governance of urban green spaces, citizens sci-
ence activities (Buijs et al. 2016a). They can contribute to more established forms of BCD or contrib-
ute to new, innovative forms. The activities of these ‘biocultural creatives’ (Elands and Van Koppen,
2013) are a learning-lab to identify novel approaches to both conserving and developing BCD in urban
BCD: LINKAGES BETWEEN PEOPLE AND NATURE – DATABASE, TYPOLOGY AND INDICATORS • WPX • Page 23
areas. They can also act as memory carriers and to carry out that relationships between culture(s)
and people are inherited to next generations or other groups.
Innovative UGI governance practices were studied in-depth via 18 cases in European cities as part of
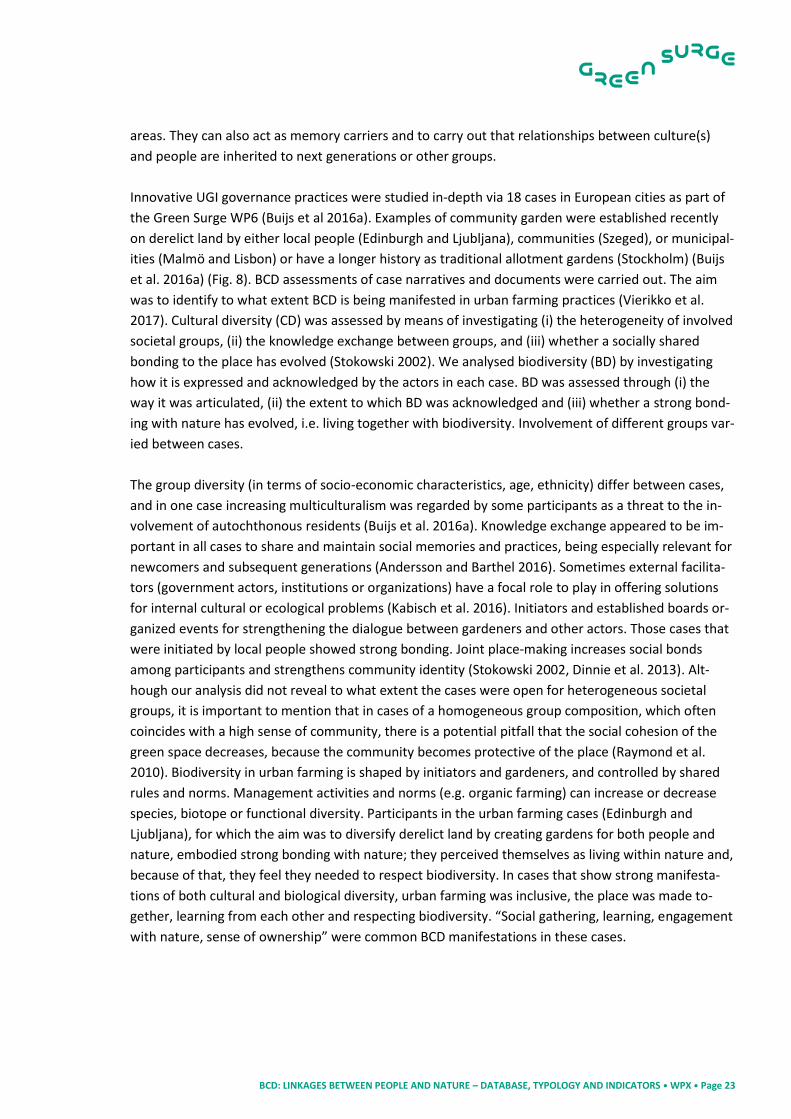
the Green Surge WP6 (Buijs et al 2016a). Examples of community garden were established recently
on derelict land by either local people (Edinburgh and Ljubljana), communities (Szeged), or municipal-
ities (Malmö and Lisbon) or have a longer history as traditional allotment gardens (Stockholm) (Buijs
et al. 2016a) (Fig. 8). BCD assessments of case narratives and documents were carried out. The aim
was to identify to what extent BCD is being manifested in urban farming practices (Vierikko et al.
2017). Cultural diversity (CD) was assessed by means of investigating (i) the heterogeneity of involved
societal groups, (ii) the knowledge exchange between groups, and (iii) whether a socially shared
bonding to the place has evolved (Stokowski 2002). We analysed biodiversity (BD) by investigating
how it is expressed and acknowledged by the actors in each case. BD was assessed through (i) the
way it was articulated, (ii) the extent to which BD was acknowledged and (iii) whether a strong bond-
ing with nature has evolved, i.e. living together with biodiversity. Involvement of different groups var-
ied between cases.
The group diversity (in terms of socio-economic characteristics, age, ethnicity) differ between cases,
and in one case increasing multiculturalism was regarded by some participants as a threat to the in-
volvement of autochthonous residents (Buijs et al. 2016a). Knowledge exchange appeared to be im-
portant in all cases to share and maintain social memories and practices, being especially relevant for
newcomers and subsequent generations (Andersson and Barthel 2016). Sometimes external facilita-
tors (government actors, institutions or organizations) have a focal role to play in offering solutions
for internal cultural or ecological problems (Kabisch et al. 2016). Initiators and established boards or-
ganized events for strengthening the dialogue between gardeners and other actors. Those cases that
were initiated by local people showed strong bonding. Joint place-making increases social bonds
among participants and strengthens community identity (Stokowski 2002, Dinnie et al. 2013). Alt-
hough our analysis did not reveal to what extent the cases were open for heterogeneous societal
groups, it is important to mention that in cases of a homogeneous group composition, which often
coincides with a high sense of community, there is a potential pitfall that the social cohesion of the
green space decreases, because the community becomes protective of the place (Raymond et al.
2010). Biodiversity in urban farming is shaped by initiators and gardeners, and controlled by shared
rules and norms. Management activities and norms (e.g. organic farming) can increase or decrease
species, biotope or functional diversity. Participants in the urban farming cases (Edinburgh and
Ljubljana), for which the aim was to diversify derelict land by creating gardens for both people and
nature, embodied strong bonding with nature; they perceived themselves as living within nature and,
because of that, they feel they needed to respect biodiversity. In cases that show strong manifesta-
tions of both cultural and biological diversity, urban farming was inclusive, the place was made to-
gether, learning from each other and respecting biodiversity. “Social gathering, learning, engagement
with nature, sense of ownership” were common BCD manifestations in these cases.
BCD: LINKAGES BETWEEN PEOPLE AND NATURE – DATABASE, TYPOLOGY AND INDICATORS • WPX • Page 24
Figure 9. Six urban farming cases analysed as a part of WP2.
BCD: LINKAGES BETWEEN PEOPLE AND NATURE – DATABASE, TYPOLOGY AND INDICATORS • WPX • Page 25
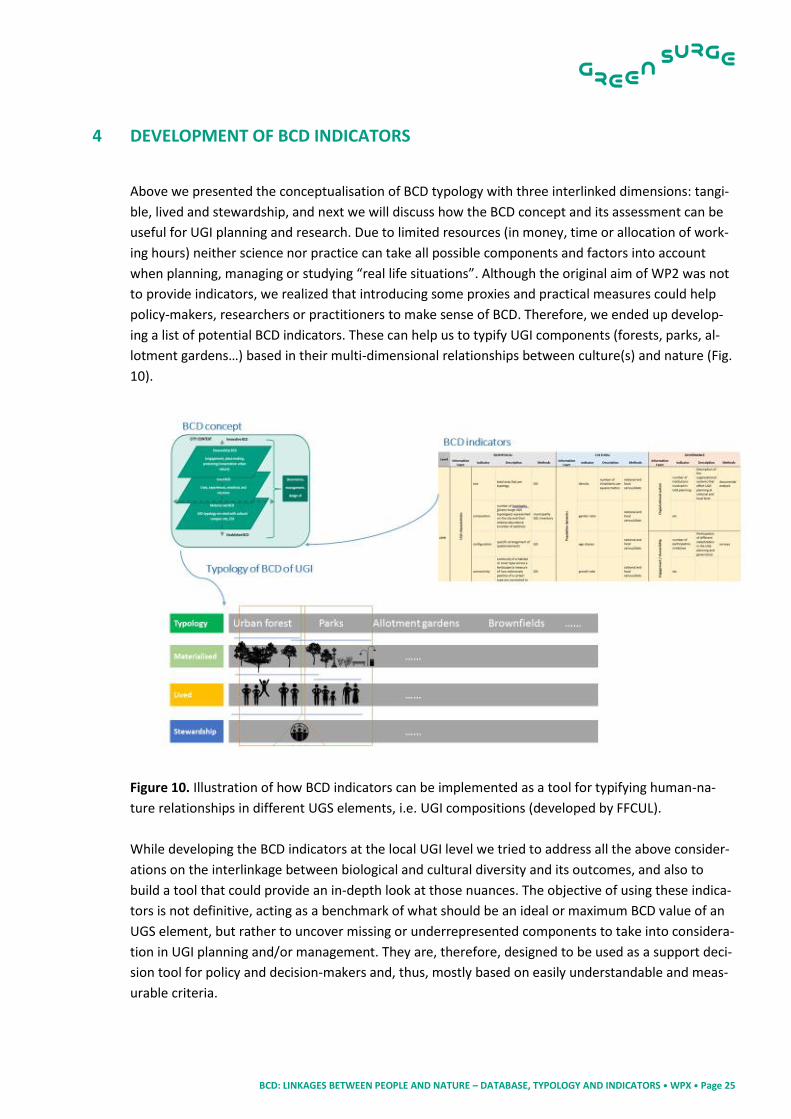
4 DEVELOPMENT OF BCD INDICATORS
Above we presented the conceptualisation of BCD typology with three interlinked dimensions: tangi-
ble, lived and stewardship, and next we will discuss how the BCD concept and its assessment can be
useful for UGI planning and research. Due to limited resources (in money, time or allocation of work-
ing hours) neither science nor practice can take all possible components and factors into account
when planning, managing or studying “real life situations”. Although the original aim of WP2 was not
to provide indicators, we realized that introducing some proxies and practical measures could help
policy-makers, researchers or practitioners to make sense of BCD. Therefore, we ended up develop-
ing a list of potential BCD indicators. These can help us to typify UGI components (forests, parks, al-
lotment gardens…) based in their multi-dimensional relationships between culture(s) and nature (Fig.
10).
Figure 10. Illustration of how BCD indicators can be implemented as a tool for typifying human-na-
ture relationships in different UGS elements, i.e. UGI compositions (developed by FFCUL).
While developing the BCD indicators at the local UGI level we tried to address all the above consider-
ations on the interlinkage between biological and cultural diversity and its outcomes, and also to
build a tool that could provide an in-depth look at those nuances. The objective of using these indica-
tors is not definitive, acting as a benchmark of what should be an ideal or maximum BCD value of an
UGS element, but rather to uncover missing or underrepresented components to take into considera-
tion in UGI planning and/or management. They are, therefore, designed to be used as a support deci-
sion tool for policy and decision-makers and, thus, mostly based on easily understandable and meas-
urable criteria.
BCD: LINKAGES BETWEEN PEOPLE AND NATURE – DATABASE, TYPOLOGY AND INDICATORS • WPX • Page 26
Dealing with such a complex and multidimensional indicandum, the number of indicators comes to be
quite extensive (n=61) and grouping them in information layers, draws attention to the main ques-
tions to be addressed when dealing with the three dimensions of BCD: i) materialized manifestations,
ii) lived, and iii) governance and stewardship. The BCD indicators are presented in separate Tables,
with (1) description and rationale to the real world situations, (2) what the indicator is measuring/im-
plying; (3) suggested methods and potential data sources; linkages with (4) BCD concept, (5) ES as-
sessment (CICES 4.3) and (6) UGI planning principles and challenges, (7) special need for qualitative
analyses and finally (8) key references related to each indicator. As such indicators are not static and
impervious, but rather dynamic and pervasive, data gathered can sometimes inform layers (or dimen-
sions) other than the ones to which they were allocated for practical reasons.
Below we provide a short description of each information layer. As many authors have argued (e.g.
Chan et al. 2012, Turnhout et al. 2013, Lele et al. 2014, Buizer et al. 2016), ES assessment fails to
identify engagement of social and cultural beyond ecosystem services. Therefore, we highlight if BCD
indicators are sensitive for human-nature relationships and cultural engagement (in the table we use
not applicable N.A. if there are no links with ES assessment). In addition, we want to emphasise how
BCD indicators could help to support innovative UGI planning (Hansen et al. 2016), and provide infor-
mation about success of planning in terms of principles and challenges.
URBAN GREEN INFRASTRUCTURE (UGI) PLANNING – Definition and Principles
UGI planning is understood as a strategic planning approach that aims at developing networks of green and blue spaces in urban areas designed and managed to deliver a wide range of ecosystem services (Hansen et al. 2016). UGI planning aims at creating multifunctional networks on different spatial levels, from urban regional to city and neighbourhood planning. In the WP5 four UGI planning principles were identified. They are integration of green and grey infrastructures, connectivity, multifunctionality and social inclusion. In the D5.2 authors present several targets related to principles. For example, grey-green integration targets not only primary infrastructural needs but also seeks to provide wider environmental, social and economic benefits. Green space network can support ecological and social connectivity, with benefits for wildlife and humans, and includes physical and functional connections. Multifunctionality aims at securing and increasing the multiple ecological, socio-cultural, and economic benefits of UGI – or in other words the provision of ecosystem services, while avoiding conflicts and trade-offs. Social inclu-sion aims at enabling all social groups to participate in the process of UGI planning, while putting a special emphasis on the most vulnerable ones. According to Hansen et al. (2016) four main challenges related to UGI planning were identified: Social cohesion – lncreasing social cohesion has many advantages. It can ease tensions between different ethnic groups and people of different classes and religions, reduce crime, vandalism and associated costs, im-prove the image of neighbourhoods, improve social relations and social capital, and increase place at-tachment. UGI planning can improve green economy: competitiveness with other cities by increasing the attractiveness and quality of life via investment in UGI, provide business opportunities and increase eco-nomic benefits. In addition, UGI planning can promote biodiversity protection and climate change adap-tation in cities. BCD indicators have many links with UGI planning principles and challenges, and there-fore we wanted to point out how BCD assessment in UGI places, can also support socially inclusive and ecologically sound UGI planning that takes diverse local, contextual and surrounding (f)actors into ac-count.
BCD: LINKAGES BETWEEN PEOPLE AND NATURE – DATABASE, TYPOLOGY AND INDICATORS • WPX • Page 27
4.1 Tangible BCD manifestations
Biodiversity and biophysical structure of UGS
Welcomeness of the UGS
Signs of memory carriers and cultural symbols
Neighbourhood characteristics
Biodiversity and biophysical characteristics of the UGS refer to the physical components or functions
of biodiversity, ecosystems and UGS assessed by standard measurements of biological, functional and
landscape diversity. These are not only the foundations for ecological quality, adaptation capacity
and ecological resilience but also the base for interactions between people and nature. Data for
measuring biodiversity are mainly provided by experts (researchers, managers, planners), but also
active citizens can have a central role in collecting information about e.g. distribution of species. This
information layer linked strongly with all sections of ecosystem services: provision, regulation and
cultural (CICES 4.3). These BCD indicators compromise especially with multifunctionality, biodiversity
protection and climate change adaptation.
To have an opportunity to visit a green space, people must have a feel of welcome and not feeling
excluded, which is translated as Welcomeness of the UGS. An inclusive green space welcomes people
of all ages, socio-economic condition or persuasion, without any kind of barriers: physical, cultural or
emotional. Welcomeness as an indicator of materialized BCD focus on tangible and visible character-
istics for accessible, inclusive and comfortable environment with an adequate layout for whatever
people pursue when visiting the space. Welcomeness is not consistent with cultural ecosystem ser-
vices (CES), because it also focuses on human constructions (traffic, roads, fees, facilities, signs of cul-
tural actions) and not for immaterial services provided by green space. Indicators for welcomeness
measure, at certain extent, multifunctionality and especially social cohesion of the place – if it’s ac-
cessible to all and provide space for social interactions (Hansen et al. 2016). It also shows if integra-
tion of green and grey infrastructure do not cause limitations to access (e.g. green roofs are not nec-
essarily open and they do not invite all equally). In addition, green space that is welcoming can also
attract green economy and vice versa.
The signs of previous use or human-nature interactions, inherently influenced by the cultural context,
are embodied in the environment and carry memories from the past that influence the way people
construct their identity towards the environment. In urban green spaces the signs of cultural use can
range from the complex architecture and design of a park, or the composition of ornamental species,
to a simple desire path or a carved tree, all of them representing a close and consistent interaction
with nature which is drawn in Signs of social memory carriers and cultural symbols. Indicators in this
layer link with CES: physical and intellectual interactions with ecosystems (CICES 4.3). They can help
reveal if a green space has been and still is multifunctional and socially cohesive. Some signs (biologi-
cal, cultural or biocultural) or symbols can tell us if biodiversity has been protected – and what kind of
biodiversity has been culturally meaningful. They also give indication of engagement and stewardship
towards nature (e.g. nest boxes or labels for culturally valued biotopes/species/elements), which will
BCD: LINKAGES BETWEEN PEOPLE AND NATURE – DATABASE, TYPOLOGY AND INDICATORS • WPX • Page 28
be further discussed in lived and governance & stewardship. Spaces that have many signs of memory
carriers or cultural symbols, will be most likely be also welcoming and supporting green economy.
But neither biological nor cultural diversity in a green space can be dissociated from its surrounding
matrix and an information layer of Neighbourhood characterization is crucial. The type and propor-
tion of green in the matrix, which refers to two UGI planning principles: connectivity and integration
of green and grey infrastructure, influences the movements and dispersion of people and species be-
tween green spaces, with higher levels of greenery in matrix promoting ecological connectivity and
walkability. The built matrix, grey infrastructure, play an important role with the level of urbanization
being sometimes more influential for species compositions than the size of green space or vegetation
structure (Ref.). For residents, the physical characteristics of the built environment strongly influence
the perception of safety, willingness to walk or bike, which can promote or hinder the opportunity to
visit a green space. The existence of other green spaces in the neighbourhood with other distinct fa-
cilities or layouts, may offer alternative and/or more interesting attractions for some users and di-
verge them by providing complementary uses. It also decreases use pressure towards a green space.
Neighbourhood characterisation, as long as the focus is on the green components, can be linked with
regulation and cultural ecosystem services. Indicators of this layer provides valuable information for
UGI planning related to connectivity, multifunctionality, integration of green and grey infrastructure,
and how neighbourhoods influence UGI planning challenges of social cohesion, climate change adap-
tation and biodiversity protection.
4.2 Lived biocultural diversity
User group diversity
Neighbourhood cultural and economic characteristics
Space usage
Interactions
Meanings, perceptions and values
User group diversity and Neighbourhood cultural characteristics directly assess the cultural diversity
of users in terms of their origin, the socio-demographic and economic status, and visible patterns of
allegiance to any kind of subculture or urban tribe, and evaluate how they use the greenspace, and if
this diversity is a reflection of the neighbourhood. ES assessment do not aim identify if (im)material
benefits of UGS are equally distributed to residents living nearby the UGS. Actual access and use of a
UGS is determined more by experiential barriers associated with the level of perceived integration
than by the UGS resources or physical qualities. One way of trying to capture the existence of such
barriers is to determine if the cultural diversity of the neighbourhood is fully represented in the
greenspace users and in the diversity of uses. These information layers provides information if plan-
ning is working and supporting social cohesions and multifunctionality of UGI, and indications for eco-
gentrifications in the neighbourhoods. Usage diversity of UGS indicates if UGS is supporting different
recreational uses, and points out potential conflicts with increasing use diversity (Raymond et al.
2016). Observing and analysing usage diversity of UGS links with CES: physical interactions with UGS
and it also shows if the place is multifunctional or not. Analysing user diversity implies that the UGS is
BCD: LINKAGES BETWEEN PEOPLE AND NATURE – DATABASE, TYPOLOGY AND INDICATORS • WPX • Page 29
providing CES. Social activities, events are also supporting green economy and therefore proxies
measuring potential economic benefits of UGS.
Interaction, interacting with someone or something, is the foundation to develop an emotional con-
nection, positive or negative, towards the object of interaction. Casual interaction with other people,
even if coincidental, affords opportunities to face and acknowledge distinct realities, ways of living
and attitudes, fostering tolerance and integration. In a regular basis, social interactions are the base
for social cohesiveness by creating bonds and promoting the sense of community. The same is valid
for interactions with nature, with emotional experiences with the natural world inducing empathy for
the environment and the desire to protect and conserve nature. Yet, people perceive and enjoy na-
ture in many different ways, conditioned by the meaning and value they attribute to a greenspace
and what it has to offer. Some may appreciate the space solely for its aesthetic properties or the use-
ful amenities and infrastructures it provides, while others can develop a more emotional or affective
relationship building a sense of belonging and attachment to place. Perceptions of safety, inclusive-
ness and integration are some of the most important factors for people to feel welcome and comfort-
able in the space and, when different meanings, values and perceptions are at stake, conflict can
arise and lead to self-exclusion or to space-time segregation. Self-exclusion may also be potentiated
by the perceived reputation of the place, either true, built upon real facts as crime rate of the neigh-
bourhood, or false, based in rumours or legends. Each place has its own and unique history that
shaped not only the biophysical characteristics of the space itself, but also the way people relate with
it and construct their meanings and perceptions about it. Interactions with nature links it with CES,
but BCD indicators provides much deeper information about interactions among people – conflicts –
which ES assessment often fails to identify. These two information layers are important for analysing
social cohesion, social inclusion and multifunctionality of UGS.
Places’ history is engraved in people’s memories, and represent an informal repository of infor-
mation, here designated by Memory carriers of place, which perpetuate in time through knowledge
transfer. Local ecological knowledge can represent a very useful tool for planners and managers but
only if opportunity is granted to users to fully participate in decision processes. Memory carriers have
a central role to support biodiversity protection, social cohesion, social inclusion and multifunctional-
ity of UGS.
4.3 Governance and stewardship
Governance system and
Stewardship
The Governance system, which includes property-right regime, actors and roles, network structure,
opportunities and barriers, governance shifts, management and specific norms and rules, determines
which and how actors can take part in decision processes and if they really have an active voice and
power to influence decisions. To fully participate in decision processes concerning a greenspace is
one of the many ways of engaging with the space. The other is environmental stewardship. Environ-
BCD: LINKAGES BETWEEN PEOPLE AND NATURE – DATABASE, TYPOLOGY AND INDICATORS • WPX • Page 30
mental stewards take care of the environment by protecting, conserving, managing, monitoring, ad-
vocating and educating about environmental issues. Such stewardship practices contribute directly
for ecological knowledge but also for social resilience by enhancing the emotional bonds towards na-
ture and the place itself. These information layers have no link with ES assessment, but it offers im-
portant information if UGI planning have met one of its main challenges: social inclusion.
BCD: LINKAGES BETWEEN PEOPLE AND NATURE – DATABASE, TYPOLOGY AND INDICATORS • WPX • Page 31
5 TOWARDS THE FINAL REPORT OF WP2 (D2.3.)
The MS22 has introduced the BCD database, conceptualisation of BCD typology and BCD indicators.
This report will be a practical tool for WP2 researchers to conduct final analyses and prepare D2.3
that will be a handbook for planners, designers, managers, place-makers and -keepers to understand
different biocultural dimensions of UGSs and why we need a BCD approach in governing or managing
UGSs or greening cities. In the following we will present shortly the content of D2.3 and list the re-
sponsible contributors. The D2.3 will include:
Discussion about why the BCD approach is needed in the urban context
Case narratives on materialised, lived and stewardship BCD
Methodological suggestions to assess BCD studies in different context/situations
5.1 Some points why BCD approach is needed in the urban context
Within this chapter of D2.3 we will highlight some important issues and challenges that need to be
discussed when assessing BCD approach and making BCD studies in cities. The aim is to stimulate
readers to consider context-dependence and relationality of any kind of approaches (UGI, ESS,
BCD…).
Database: all
Responsible partners: UH
Supporting partners: FFCUL, SRC, TUB, UBER, WU
Deadline: June 2017
5.2 Case narrative on materialized BCD
The chapter will present how multi-taxa assessment and lichen inventories can contribute for study-
ing human-nature interactions in cities.
Database: Multi-taxa assessment in Helsinki and Lisbon, lichen inventories in Lisbon
Responsible partners: FFCUL
Supporting partners: UH
Deadline: July 2017
5.3 Case narrative on lived BCD in European cities
The chapter will introduce how we can analyse diversity of UGI uses and users, and how these kinds
of analyses can support socially sustainable (cohesion, diversity, intergration) planning and manage-
ment of UGI. TUB will provide descriptive analyses on use diversity in different UGI types (forests,
parks, wasteland) in five ULL cities. FFCUL, UBER and UH will analyse use, user and value diversity in
parks in Berlin, Bucharest, Helsinki and Lisbon.
Database: D2.2, onsite interviews in parks in Berlin, Bucharest, Helsinki, Lisbon
Responsible partners: TUB and UH
BCD: LINKAGES BETWEEN PEOPLE AND NATURE – DATABASE, TYPOLOGY AND INDICATORS • WPX • Page 32
Supporting partners: UBER, SRC, WU
Deadline: June 2017
5.4 Case narrative on lived BCD in Helsinki and Lisbon
The chapter will give some in-depth examples on how people the city of Helsinki and Lisbon interact
with the biodiversity and with each other, and what is their relationship to the park. Two master stu-
dents (Mari and Jasmina) will write a shortly about their main findings on biodiversity perceptions
and park relationships of visitors.
Database: Interviews of park visitors in Helsinki and Lisbon
Responsible partners: UH
Supporting partners: FFCUL
Deadline: June 2017
5.5 Case narrative on stewardship BCD
Based on allotment gardeners’ interviews in Berlin, Lodz and Lisbon the chapter discuss how engage-
ment and stewardship of gardeners will differ in three cities. Within some specific examples the aim
is to give example how BCD approach can help identify local and culturally embedded different in val-
ues and management practises.
Database: Allotment garden studies in Berlin, Lodz, Lisbon
Responsible partners: FFCUL and UBER
Supporting partners: FFCUL, SCR, UBER, WU, UH
5.6 Conclusions: suggestions to assess BCD study in different situation In this chapter, summary of methods used in the Green Surge will be presented with some methodo-
logical suggestions how to study and analyse BCD in different context (establishing new green
greening projects, maintenance of current UGI, redesigning UGI, developing BD programmes, etch).
The chapter will highlight “tested” methods, but also identify “gaps” in knowledge production. Database: all
Responsible partners: SCR
Supporting partners: FFCUL, SRC, TUB, UBER, WU
Deadline: June 2017
BCD: LINKAGES BETWEEN PEOPLE AND NATURE – DATABASE, TYPOLOGY AND INDICATORS • WPX • Page 33
6 REFERENCES
Ackoff, R. L. 1989. From Data to Wisdom. Journal of Applies Systems Analysis 16, p 3-9.
Agnoletti and Emanueli 2016
Andersson, E. and Barthel, S. 2016. Memory carriers and stewardship of metropolitan land-scapes. Ecological
Indicators 70, 606-614.
Bac, M. 1998. Property rights regimes and the management of resources. Natural Resources Forum, pp. 263–
269.
Benedict, M.A., McMahon, E.T., 2001. Green Infrastructure: Smart Conservation for the 21st Century. Sprawl
Watch Clearinghouse Monograph Series. Washington, DC. Available from:
http://www.sprawlwatch.org/greeninfrastructure.pdf. Last accessed February 2016.
Beninde, J., Veith, M. and Hochkirch, A. 2015. Biodiversity in cities needs space: a meta-analysis of factors de-
termining intra-urban biodiversity variation. Ecological Letters 18, 581–92. doi:10.1111/ele.12427.
Biggs, R., Schlüter, M., Biggs, D., Bohensky, E.L., BurnSilver, S., Cundill, G., et al. 2012. Toward Principles for En-
hancing the Resilience of Ecosystem Services. Annual Review of Environment and Resources 37, 421-448.
Bodin, O. and Crona, B.I. 2009. The role of social networks in natural resource governance: What relational pat-
terns make a difference? Global Environmental 19, 366–374.
Boone, C., Cadenasso, M., Grove, M., Schwarz, K. and Buckley, G. 2010. Landscape, vegetation characteristics,
and group identity in a urban and suburban watershed: why the 60s matter. Urban Ecosystems 13, 255-271.
Botzat, A., Fischer, L.K., Kowarik, I. 2016. Unexploited opportunities in understanding liveable and biodiverse
cities. A review on urban biodiversity perception and valuation. Global Environmental Change 39, 220-233.
Bramston, P., Pretty, G., and Zammit, C. 2011. Assessing environmental stewardship motivation. Environment
and Behavior 43, 776–788.
Breukers, S., R. Mourik, L. van Summeren and Verbong, G. 2016. Institutional “lock-out”towards local self-gov-
ernance? Environmental justice and sustainable transformations in Dutch social housing neighbourhoods. En-
ergy Research & Social Science, 148-158.
Breuste et al 2013
Brown, G. and Raymond, C. 2007. The relationship between place attachment and landscape values: Toward
mapping place attachment. Applied Geography 27/2), 89-111.
Buijs, A., Elands, B., Havik, G., Ambrose-Oji, B., Gerohazi, E., van der Jagt, A., Mattijssen, T., Steen Moller, M.
and Vierikko, K. 2016a. Innovative governance of urban green spaces. Published project report GREEN SURGE
Deliverable 6.2. 177 pp.
Buijs, A., Mattijssen, T., Vander Jagt, B., Ambrose-Oji, A., Andersson, E., Elands, B. and Steen Møller, M. 2016b.
Active citizenship for urban green infrastructure: fostering the diversity and dynamics of citizen contributions
through mosaic governance. Current Opinion in Environmental Sustainability 22, 1-6.
Buizer, M., Elands, B. and Vierikko, K. 2016. Governing cities reflexively – The biocultural diversity concept as
an alternative for ecosystem services. Environmental Science & Policy 62, 7-13.
Byrne, J. and Wolch, J. 2009. Nature, race, and parks: past research and future directions for geographic re-
search, Progress in Human Geography, pp. 1-23.
Calvet-Mir, L., and Salpeteur, M. 2016. Humans, Plants, and Networks: A Critical Review, Environment and Soci-
ety 7(1), 107-128.
BCD: LINKAGES BETWEEN PEOPLE AND NATURE – DATABASE, TYPOLOGY AND INDICATORS • WPX • Page 34
Campbell, L., Svendsen, E., Sonti, N. and Johnson, M. 2016. A social assessment of urban parkland: Analyzing
park use and meaning to inform management and resilience planning. Environmental Science & Policy 62, 34-
44.
Cassidy, A., and McGrath, B. 2015. Farm, place and identity construction among Irish farm youth who migrate,
Journal of Rural Studies. 37, 20-28.
Cattell, V., N. Dines, W. Gesler, and Curtis, S. 2008. Mingling, observing, and lingering: Everyday public spaces
and their implications for well-being and social relations, Health & Place 14, 544–561.
Caula, S., Hvenegaard, G.T., Marty, P., 2009. The influence of bird information, attitudes, and demographics on
public preferences toward urban green spaces: the case of Montpellier, France. Urban Forestry & Urban
Greening 8, 117–128.
Chan, K. M. A., Guerry, A. D., Balvanera, P., Klain, S., Satterfield, T., Basurto, X., Bostrom, A., Chuenpagdee, R.,
Gould, R., Halpern, B. S., Hannahs, N., Levine, J., Norton, B., Ruckelshaus, M., Russell, R., Tam, J. and Wood-
side, U. 2012. Where are Cultural and Social in Ecosystem Services? A Framework for Constructive Engage-
ment. BioScience 62(8), 744-756.
Chan, K., Balvanera, P., Benessaiah, K., Chapman, M., Diaz, S. et al. 2016. Why protect nature ? Rethinking va-
lues and the environment. PNAS 113(6), 1462-1465.
Chapin, F., Carpenter, S., Kofinas, G., Folke, C. et al. 2010. Ecosystem stewardship: sustainability strategies for
a rapidly changing planet. Trends in Ecology & Evolution 25(4), 241-249.
Cilliers, E., Timmermans, W., Van den Goorbergh, F. and Slijkhuis, J. 2015. The Story Behind the Place: Creating
Urban Spaces That Enhance Quality of Life. Applied Research in Quality of Life 4, 589–598.
Cocks, M. and Wiersum, F. 2014. Reappraising the Concept of Biocultural Diversity: a Perspective from South
Africa. Human Ecology 42, 727–737.
Commission for Architecture and the Built Environment (CABE) 2005. What are we scared of? The value of risk
in designing public space. London.
Cooper, C.B., Dickinson, J., Phillips, T. and Bonney, R. 2007. Citizen science as a tool for conservation in residen-
tial ecosystems, Ecology and Society 12(2), 11.
Cornelissen, J., Lavorel, S., Garnier, E., Diaz, S., Buchmann, N., Gurvich, D. et al. 2003. A handbook of protocols
for standardised and easy measurement of plant functional traits worldwide. Australian Journal of Botany 51,
335–380.
Cosquer, A., Raymond, R., Prevot-Julliard A-C. 2012. Observations of everyday biodiversity: a new perspective
for conservation? Ecology and Society 17, 2.
Cumbo, B.J., Paay, J., Kjeldskov, J. and Jacobs, B.C. 2014. Connecting children to nature with technology: sowing
the seeds for proenvironmental behaviour. Proceedings of the Conference on Interaction Design and Children
2014, 189–192.
Cutts, B.B., Darby, K.J., Boone, C.G. and Brewis, A. 2009. City structure, obesity, and environmental justice: an
integrated analysos of physical and social barriers to walkable streets and park access. Social Science &
Medicine 69(9), 1314-1322.
Cvejić, R., Eler, K., Pintar, M., Železnikar, S., Haase, D., Kabisch, N. and Strohbach, M. 2015. A typology for ur-
ban green spaces, ecosystem services provisioning services and demands. Published project report GREEN
SURGE Deliverable 3.4. 68 pp.
Czembrowski, P., Laszkiewicz, E. and Kronenberg, J. 2016. Bioculturally valuable but not necessary worth the
price: Integrating different dimensions of value of urban green spaces. Urban Forestry & Urban Greening 20,
89–96.
BCD: LINKAGES BETWEEN PEOPLE AND NATURE – DATABASE, TYPOLOGY AND INDICATORS • WPX • Page 35
Davies, C., Hansen, R., Rall, E., Pauleit, S., Lafortezza, R., De Bellis, Y., Santos, A. and Tosics, I. 2015: Green
Infrastructure planning and implementation. GREEN SURGE Deliverable 5.1. Research report.
de Bello, F., Lavorel, S. Diaz, S., Harrington, R., Cornelissen, J.H., Bardgett, R.D. et al. 2010. Towards an assess-
ment of multiple ecosystem processes and services via functional traits, Biodiversity and Conservation 19,
2873–2893.
Dempsey, N. and Smith, H. 2014: Understanding place-keeping of open space. In Demsey, N., Smith, H. and
Burton, M. (Eds.): Place-Keeping: Open Space Management in Practice. pp. 13-29.
Diaz, S. and Cabido, M. 2001. Vive la différence: Plant functional diversity matters to ecosystem processes.
Trends in Ecology and Evolution 16, 646-655.
Diemer, M., Held, M. and Hofmaeister, S. 2003. Urban Wilderness in Central Europe Rewilding at the Urban
Fringe. International Journal of Wilderness 9(3), 7-11.
Dinnie, E., Brown, K.M. and Morris, S. 2013. Community, cooperation and conflict: Negotiating the social well-
being benefits of urban greenspace experiences. Landscape and Urban Planning 112, 1-9.
Dobbs, C., Kendal, D. and Nitschke, C.R. 2014. Multiple ecosystem services and disservices of the urban forest
establishing their connections with landscape structure and sociodemographics. Ecological Indicators 43, 44–
55.
Dobson, J. 2012. Grey places need green spaces: the case for investing in our nation’s natural assets’, Ground-
work UK, Birmingham.
Dunnett, N., Swanwick, C. and Woolley, H. 2002. Improving Urban Parks, Play Areas and Open Spaces, Depart-
ment of Landscape, University of Sheffield Department for Transport, Local Government and the Regions, Lon-
don.
Döhren, P. and Haase, D. 2015. Ecosystem disservices research: a review of the state of the art with a focus on
cities. Ecological Indicators 2015, 490–497.
Eizaguirre, S., Pradel, M., Terrones, A., Martinez-Celorrio, X. and García, M. 2012. Multilevel Governance and
Social Cohesion: Bringing Back Conflict in Citizenship Practices. Urban Studies 49, 1999–2016.
Elands, B. and van Koppen, C.S.A. 2013. Biocultural diversity in the Netherlands: from ecologically noble sav-
ages towards biocultural creatives. Chapter 11. In: Arts, B., van Bommel, S., Ros-Tonen, M., Verschoor, G.
(Eds.) Forest People Interfaces. Wageningen Academic Publishers, Wageningen, pp. 181-193.
Elands, B., Wiersum, K., Buijs, A. and Vierikko, K. 2015: Policy interpretations and manifestations of biocultural
diversity in urbanized Europe: Conservation of lived biodiversity. Biodiversity and Conservation 24, 3347-3366.
Eler, K., Železnikar, Š., Cvejić, R., Pintar, M., Haase, D., Kabisch, N., Strohbach, M., Annerstedt van den Bosch,
M., Kowarik, I., Fischer, L. 2016. Functional linkages between urban green infrastructure, biodiversity and
human well-being. Published project report GREEN SURGE Deliverable 3.2. 58p.
Ellaway, A. 2014. The Impact of the Local Social and Physical Local Environment on Wellbeing. In Cooper, R.,
Burton, E., Cooper, C. L. (Eds.), Wellbeing: A Complete Reference Guide, Volume II, Wellbeing and the Environ-
ment, 736, Wiley-Blackwell.
Ernstson, H. 2013: The social production of ecosystem services: A framework for studying environmental
justice and ecological complexity in urbanized landscapes. Landscape and Urban Planning 109,7-17.
Fischer, L.K., Kowarik, I., Botzat, A., Honold, J., Haase, D. and Kabisch, N. 2015. Biocultural diversity of urban
green spaces in European cities. Internal project report on the assessment of BCD in European city regions.
Published project report GREEN SURGE Milestone 21. 43p.
Fischer, L.K., Kowarik, I., Botzat, A., Honold, J., Haase, D. and Kabisch, N. 2016. Interaction of biological and cul-
tural diversity of urban green spaces. Internal project report on the assessment of BCD in European city regions.
Published project report GREEN SURGE Deliverable 2.2. 120p.
BCD: LINKAGES BETWEEN PEOPLE AND NATURE – DATABASE, TYPOLOGY AND INDICATORS • WPX • Page 36
Francis, J., Giles-Corti, B., Wood, L. and Knuiman, M. 2012a. Creating sense of community: The role of public
space. Journal of Environmental Psychology 32(4), 401-409.
Francis, J., Wood, L.J., Knuiman, M. and Giles-Corti, B. 2012b. Quality or quantity? Exploring the relationship
between Public Open Space attributes and mental health in Perth, Western Australia, Social Science & Medicine
74, 1570–1577.
Garibaldy, A. and Turner, N. 2004. Cultural keystone species: Implications for ecological conservation and
restoration. Ecology and Society 9(3), 1.
Giles-Corti, B., Broomhall, M.H., Knuiman, M., Collins, C., Douglas, K. and Ng, K. et al. 2005. Increasing walking:
how important is distance to, attractiveness, and size of public open space? American Journal of Preventive
Medicine 28, 169–176.
Goddard, M.A., Dougill, A.J. and Benton, T.G. 2010. Scaling up from gardens: biodiversity conservation in urban
environments. Trends in Ecology & Evolution 25(2), 90-98.
Goodness, J., Andersson, E., Anderson, P.M. and Elmqvist, T. 2016. Exploring the links between functional traits
and cultural ecosystem services to enhance urban ecosystem management. Ecological Indicators 70, 597–605.
Gould, W. 2000. Remote sensing of vegetation, plant species richness, and regional biodiversity hotspots. Eco-
logical Applications 10, 1861–1870.
Greenhalgh, L. and Parsons, A. 2006. Raising the standard: The Green Flag Award guidance manual, London:
CABE.
Hadavi, S., Kaplan, R. and Hunter, M.C.R. 2015. Environmental affordances: A practical approach for design of
nearby outdoor settings in urban residential areas, Landscape and Urban Planning 134, 19–32.
Hansen, R., and Rall, E. 2014. Analytical Framework. Milestone 34. GREEN SURGE report.
Hansen, R., Werner, R., Santos, A., Luz, A.C., Száraz, L., Tosics, I., Vierikko, K., Rall, E., Davies, C. and Pauleit, S.
2016. Advanced urban green infrastructure planning and implementation – Innovative Approaches and Strate-
gies from European Cities. Deliverable 5.2. Published GREEN SURGE report.
Hanski, I., Hertzen, L., Fyhrquist, N., Koskinen, K., Torppa, K., Laatikainen, T., Karisola, P., Auvinen, P., Paulin, L.,
Mäkelä, M.J. et al 2012: Environmental biodiversity, human microbiota, and allergy are interrelated. PNAS
2012, 109(21), 8334-8339.
Holland, C., Clark, A., Katz, J. and Peace, S. 2007. Social interactions in urban public places. Policy Press, Univer-
sity of Bristol, 88 pp.
Hooper, D., Solan, M., Symstad, A., Diaz, S. Gessner,M., Buchmann, N. et al. 2002. Species diversity, functional
diversity and ecosystem functioning. Biodiversity and Ecosystem Functioning: Synthesis and Perspectives. p.
195–208.
Horlings, L.G. 2015: Values in place; A value-oriented approach toward sustainable place-shaping. Regional
Studies & Regional Sciences 2(1), 256-273.
Hostetler, M., Allen, W. and Meurk, C. 2011. Conserving urban biodiversity? Creating green infrastructure is
only the first step. Landscape and Urban Planning 100, 369–371.
Hunter, M.R. and Askarinejad, A. 2015. Designer’s approach for scene selection in tests of preference and resto-
ration along a continuum of natural to manmade environments. Frontiers in Psychology 6, 1228.
IISD, Reporting Services 2017: Summary of stakeholder day and the fifth session of the plenary of the
Intergovernmental Science-policy Platform on Biodiversity and Ecosystem Services: 6-10 March 2017. Earth
Negotiations Bulletin, A Reportin Service for Environment and Development Negotiations 31(34).
http://enb.iisd.org/download/pdf/enb3134e.pdf.
Irvine, K., O’Brien, L., Ravenscroft, N., Cooper, N., Everard, M., Fazey, I., Reed, M.S. and Kenter, J.O. 2016.
Ecosystem services and the idea of shared values. Ecosystem Services 21, part B, 184-193.
BCD: LINKAGES BETWEEN PEOPLE AND NATURE – DATABASE, TYPOLOGY AND INDICATORS • WPX • Page 37
Jacobs, S., Dendonckerb, N., Martín-Lópezc, B., Bartone, D.N. et al. 2016. A new valuation school: Integrating
diverse values of nature in resource and land use decisions. Ecosystem Services 21 Part B, 213-220.
Jay, K., Peters, K., Buijs, A.E., Gentin, S., Kloek, M.E., and O’Brien, O. 2012. Towards access for all? Policy and
research on access of ethnic minority groups to natural areas in four European countries. Forest Policy
Economics 19, 4-11.
Kabisch, N., Frantzeskaki, N., Pauleit, S. and Bonn, A: 2016. Nature-based solutions to climate change
mitigation and adaptation in urban areas: Perspectives on indicators, knowledge gaps, barriers, and
opportunities for action. Ecology and Soceity 21(2), 39.
Kabisch, N. and Haase, D. 2014. Green justice or just green? Provision of urban green spaces in Berlin,
Germany. Landscape and Urban Planning 122, 129-139.
Kazmierczak, A. 2013. The contribution of local parks to neighbourhood social ties. Landscape and Urban Plan-
ning 109, 31–44.
Kenter, J.O. 2016. Editorial: Shared, plural and cultural values. Ecosystem Services 21 Part B, 175-183.
Kloek, M.E., Buijs, A.E., Boersema, J.J. and Schouten, M.G.C. 2013. Crossing borders: review of concepts and
approaches in research on green space, immigration and society in Northwest European countries. Landscape
research 38(1), 117-140.
Kollmuss, A. and Agyeman, J. 2002. Mind the gap: why do people act environmentally and what are the
barriers to pro-environmental behavior? Environmental Education Research 8(3), 239-260.
Kowarik, I. 2015. Gleisdreieck. How urban wilderness became possible in the new park. In: Lichtenstein, A., &
Mameli, F.A. (Eds.) Gleisdreieck / Park Life Berlin, p. 216-221,Transcript Verlag.
Kowarik, I., Fischer, L.K., Honold, J. 2016. Beeinflusst Artenvielfalt die Wertschätzung der Stadtnatur? In:
Kowarik, I., Bartz, R., Brenck, M. (Eds. ) Naturkapital Deutschland – TEEB DE (2016): Ökosystemleistungen in
der Stadt – Gesundheit schützen und Lebensqualität erhöhen. Technische Universität Berlin, Helmholtz-
Zentrum für Umweltforschung – UFZ. Berlin, Leipzig.
Kronenberg, J., 2014. Environmental impacts of the use of ecosystem services: case study of birdwatching.
Environmental Management 54, 617–630. doi:10.1007/s00267-014-0317-8.
Kyle, G., Graefe, A., Manning, R. and Bacon, J. 2004. Effects of place attachment on users’ perceptions of social
and environmental conditions in a natural setting. Journal of Environmental Psychology 24, 213-225.
Lang, D.L., Wiek, A., Bergmann, M., Stauffacher, M., Martens, P., Moll, P., Swilling, M. and Thomas, C.J. 2012.
Transdiscplinary research in sustainability science: practise, principles, and challenges. Sustainability Science 7
(suppl. 1), 25-43.
Leikkilä, J., Faehnle, M. and Galanakis, M. 2013. Promoting interculturalism by planning of urban nature.
Urban Forestry and Urban Green 12, 183-190.
Lele, S., Springate-Baginski, O., Lakerveld, R., Deb, D. and Dash, P., 2014. Ecosystem services: Origin, contribu-
tions, pitfalls and alternatives. Conservation and Society 11(4), 343-358.
Loukaitou-Sideris, A. 1995. Urban form and social context: cultural differentiation in the uses of urban parks.
Journal of Planning Education and Research 14, 89–102.
Lovell, S.T. and Johnston, D.M. 2009. Designing landscapes for performance based on emerging principles in
landscape ecology. Ecology and Society 14(1), 44.
Lyytimäki, J. and Sipilä, M. 2009. Hopping on one leg-The challenge of ecosystem disservices for urban green
management, Urban Forestry & Urban Greening 8, 309–315.
Maffesoli, M. 1988. Le temps des tribu : le déclin de l’individualisme dans les sociétés, Méridien Klinsieck, Paris.
BCD: LINKAGES BETWEEN PEOPLE AND NATURE – DATABASE, TYPOLOGY AND INDICATORS • WPX • Page 38
Manzo, L.C. and Perkins, D.D. 2006. Finding common ground: The importance of place attachment to commu-
nity participation and planning. Journal of Planning Literature 20, 335.
Marcus, L., Giusti, M. and Barthel, S. 2016. Cognitive affordances in sustainable urbanism: contributions of
space syntax and spatial cognition. Journal of Urban Design, 1–14.
Martín-López, B., Iniesta-Arandia, I., García-Llorente, M., Palomo, I., Casado-Arzuaga, I., Amo, D.G.D., et al.
2012. Uncovering ecosystem service bundles through social preferences. PLoS ONE 7, e38970.
doi:10.1371/journal.pone.0038970.
Maxwell, J.A. 2013. Qualitative Research Design: An Interactive Approach. Applied Social Research Method
Series 41, George Mason University.
McCann, E.J. 2002. The cultural politics of local economic development: meaning-making, place-making, and
the urban policy process. Geoforum 33, 385–398.
McMillen, H., Campbell, L.K., Svendsen, E.S. and Reynolds, R. 2016. Recognizing Stewardship Practices as Indica-
tors of Social Resilience: In Living Memorials and in a Community Garden. Sustainability 8, 775.
Mehta, V. 2014. Evaluating Public Space. Journal of Urban Design 19, 53–88.
Muñoz-Erickson, T.A., Campbell, L.K., Childers, D.L., Grove, J.M., Iwaniec, D.M., Pickett, S.T. et al. 2016. Demysti-
fying governance and its role for transitions in urban social-ecological systems. Ecosphere 7(11), e01564.
Muratet, A., Pellegrini, P., Dufour, A., Arrif, T. and Chiron, F. 2015: Perception and knowledge of plant diversity
among urban park users. Landscape and Urban Planning 137, 95-106.
Nassauer, J. 1995. Culture and changing landscape structure. Landscape Ecology 10(4), 229-237.
Ngom, R., Gosselin, P. and Blais, C. 2016. Reduction of disparities in access to green spaces: their geographic
insertion and recreational functions matter. Applied Geography 66, 35-51.
Ostrom, E. 2007. A diagnostic approach for going beyond panaceas. Proceedings of the National Academy of
Sciences 104, 15181–15187.
Ostrom, E. 2011. Background on the institutional analysis and development framework. Policy Studies Journal
39, 7–27.
Palliwoda, J., Kowarik, I. and von der Lippe, M. 2017: Human-biodiversity interactions in urban parks: The
species level matters. Landscape and Urban Planning 157, 397-406.
Paloniemi, R., Niemelä, J., Soininen, N., Laatikainen, T., Vierikko, K. et al. 2017. Environmental justice for the
governance of aquatic environments. Local Environment (submitted)
Pascual, U., Balvanera, P., Diaz, S., Pataki, G., Roth, E. et al. 2017. Valuing nature's contributions to people: the
IPBES approach. Current Opinion in Environmental Sustainability 26, 7-16.
Persic, A. and Martin, G. 2008. Links between biological and cultural diversity-concepts, methods and experi-
ences, Report of the 2007 International Workshop, United Nations Educational Scientific and Cultural Organisa-
tion, Paris.
Peters, K. 2010. Being together in urban parks: Connecting public space, leisure, and diversity. Leisure Sciences
32, 418–433.
Peters, K., Stodolska, M. and Horolets, A. 2016. The role of natural environments in developing a sense of be-
longing: A comparative study of immigrants in the US, Poland, the Netherlands and Germany. Urban Forestry &
Urban Greening 17, 63–70.
Peterson, G., Allen, C.R. and Holling, C.S. 1998. Ecological resilience, biodiversity, and scale. Ecosystems 1, 6–18.
Pett, T., Shwartz, A., Irvine, K., Dallimer, M. and Davies, Z. 2016. Unpacking the people-biodiversity paradox: A
conceptual framework. Biosicence 66(7), 576-583.
Pinkster, F.M. 2016. Narratives of neighbourhood change and loss of belonging in an urban garden village. So-
cial & Cultural Geography 17, 871-891.
BCD: LINKAGES BETWEEN PEOPLE AND NATURE – DATABASE, TYPOLOGY AND INDICATORS • WPX • Page 39
Pretty, J., Adams, B., Berkes, F., Ferreira de Athayde, S., Dudley, N., Hunn, E., Maffi, L., Milton, K., Rapport, D.,
Robbins, P., Sterling, E., Stolton, S., Tsing, A., Vintinner, E., Pilgrim, S., 2009. The intersections of biological
diversity and cultural diversity: Towards integration. Conservation and Society 7(2), 100–112.
Pungetti, G. 2013. Biocultural Diversity for Sustainable Ecological, Cultural and Sacred Landscapes: The Biocul-
tural Landscape Approach. In: Fu, B. and Jones, K. B. (Eds.), Landscape Ecology for Sustainable Environment and
Culture. Springer Science+Business Media, pp. 55-76.
Puppim de Oliveira, J.A., Balaban, O., Doll, C.N.H. and Suwa, A. 2011. Cities and biodiversity: Perspectives and
governance challenges for implementing the convention on biological diversity (CBD) at the city level. Biological
Conservation 144(5), 1302-1313.
Qiu, L., Lindberg, S., Nielsen, A.B. 2013. Is biodiversity attractive?—On-site perception of recreational and biodi-
versity values in urban green space. Landscape and Urban Planning 119, 136–146.
Raymond, C. and Kenter, J. 2016. Transcendental values and the valuation and management of ecosystem
services. Ecosystem Services 21 Part B, 241-257.
Raymond, C., Brown, G. and Weber, D. 2010. The measurement of place attachment: Personal, community,
and environmental connections. Journal of Environmental Psychology 30, 422-434.
Raymond, C. and Kenter, J.O. 2016. Transcendental values and the valuation and management of ecosystem
services. Ecosystem Services 21, Part B, 241-257.
Raymond, C.M., Gottwald, S., Kuoppa, J., Kyttä, M., 2016. Integrating multiple elements of environmental
justice into urban blue space planning using public participation geographic information systems. Landscape
and Urban Planning 153, 198–208. doi:10.1016/j.landurbplan.2016.05.005.
Romolini, M., Brinkley, W. and Wolf, K.L. 2012. What is urban environmental stewardship? Constructing a
practitioner-derived framework. Research Note, Department of Agriculture, Forest Service, USDA, 44 pp.
Salick, J., K. Konchar, K. and Nesbitt, M. 2014. Biocultural collections: needs, ethics and goals, in Curating biocul-
tural collections: a handbook. Kew Publishing.
Sampson, R.J., Raudenbush, S.W. and Earls, F. 1997. Neighborhoods and violent crime: A multilevel study of col-
lective efficacy Science 277, 918-924.
Schaefer, V. H. 2011. Remembering our roots: A possible connections between loss of ecological memory,
alien invasions and ecological restoration. Urban Ecosystems 14, 35-44.
Shwartz, A., Turbé, A., Simon, L. and Julliard, R. 2016. Enhancing urban biodiversity and its influence on city-
dwellers: An experiment. Biological Conservation 171, 82-90.
Sister C., Wilson, J. and Wolch, J. 2007. The Green Visions Plan for 21st Century Southern California. 15. Park
Congestion and Strategies to Increase Park Equity, University of Southern California GIS Research Laboratory
and Center for Sustainable Cities, Los Angeles, California.
Smaldone, D. 2007. The role of time in place attachment, in Burns, R. and Robinson, K. (Eds.), Proceedings of
the 2006 Northeastern Recreation Research Symposium. Gen. Tech. Rep. NRS-P-14. Newtown Square, PA: U.S.
Department of Agriculture, Forest Service, Northern Research Station. 613 pp.
Smale, B. and Hilbrecht, M. 2017. From National to Local: Measuring Well-Being at the Community Level, in:
Handbook of Community Well-Being Research, Springer, p. 293-312.
Soga, M. and Gaston, K.J. 2016. Extinction of experience: the loss of human-nature interactions. Frontiers in
Ecology and the Environment 14, 94-101.
Soga, M., and K. J. Gaston. 2016. Extinction of experience: the loss of human–nature interactions. Frontiers in
Ecology and the Environment 14, 94-101
Soga, M., Yamaura, Y., Aikoh, T., Shoji, Y., Kubo, T. and Gaston, K.J. 2015. Reducing the extinction of experience:
Association between urban form and recreational use of public greenspace. Landscape and Urban Planning 143,
69-75.
BCD: LINKAGES BETWEEN PEOPLE AND NATURE – DATABASE, TYPOLOGY AND INDICATORS • WPX • Page 40
Soulsbury, C.D. and White, P.C. 2016. Human-wildlife interactions in urban areas: a review of conflicts, benefits
and opportunities. Wildlife Research 42, 541–553.
Stephenson, J. 2008. The Cultural Values Models: An integrated approach to values in landscapes. Landscape
and Urban Planning 84(2), 127-139.
Stokowski, P. 2002: Languages of place and discourses of power: Constructing new senses of place. Journal of
Leisure Research 34, 368-382.
Svendsen, E.S., Campbell, L.K., Fisher, D.R., Connolly, J.J., Johnson, M.L., Sonti, N.F. et al. 2016. Stewardship
mapping and assessment project: a framework for understanding community-based environmental steward-
ship. Gen. Tech. Rep. 156. Newtown Square, PA: U.S. Department of Agriculture, Forest Service, Northern Re-
search Station. 134 p.
Tan, P.Y. and Samsudin, R. 2017. Effects of spatial scale on assessment of spatial equity of urban park provision.
Landscape and Urban Planning 158, 139–154.
Tews, J., Brose, U., Grimm, V., Tielbӧrger, K., Wichmann, M.C., Schwager, M. et al. 2004. Animal species diver-
sity driven by habitat heterogeneity/diversity: the importance of keystone structures. Journal of Biogeography
31, 79–92. doi:10.1046/j.0305-0270.2003.00994.x.
Tilman, D. 2001. Functional diversity. Encyclopedia of Biodiversity 3, 109–120.
Turnhout, E., Waterton, C., Neves, K. and Buizer, M. 2013. Rethinking biodiversity; From goods and services to
living with. Conservation Letters 6 (3), 154–161.
Tyrväinen, L., Ojala, A., Korpela, K., Lanki, T., Tsunetsugu, Y.,and Kagawa, T. 2014. The influence of urban green
environments on stress relief measures: A field experiment. Journal of Environmental Psychology 38: 1-9.
Van Herzele, A. and Wiedemann, T. 2003. A monitoring tool for the provision of accessible and attractive urban
green spaces. Landscape and Urban Planning 63, 109–126.
Vierikko, K., Elands, B., Niemelä, J., Andersson, E., Buijs, A., Fischer, L.K., Haase, D., Kabisch, N., Kowarik, I., Luz,
A. C., Olafsson Stahl, A., Száraz, L., Van der Jagt, A. and Konijnendijk van den Bosch, C. 2017: Considering the
ways biocultural diversity helps enforce the urban green infrastructure in times of urban transformation. Cur-
rent Opinion in Environmental Sustainability 22, 7-12.
Vierikko, K., Elands, B., Száraz, L. and J. Niemelä, 2015. Biocultural diversity – concept and assessment. Pub-
lished project report on BCD concept and explorative survey of BCD in 20 European cities. Published project re-
port GREEN SURGE Deliverable 2.1. 57 pp.
Voigt, A and Wurster, D. 2015. Does diversity matter? The experience of urban nature’s diversity: Case study
and cultural concept. Ecosystem Services 12, 200-208.
von Dӧhren, P. and Haase, D. 2015. Ecosystem disservices research: a review of the state of the art with a focus
on cities. Ecological Indicators 52, 490–497.
Ward Thompson, C., Aspinall, P., Roe, J., Robertson, L. and Miller, D. 2016. Mitigating Stress and Supporting
Health in Deprived Urban Communities: The Importance of Green Space and the Social Environment. Interna-
tional Journal of Environmental Research and Public Health 13, 440.
Weber, F., Kowarik, I., Säumel, I. (2014). A walk on the wild side: perceptions of roadside vegetation beyond
trees. Urban Forestry and Urban Greening 13, 205-212.
Wolch, J.R., Byrne, J. and Newell, J.P. 2014. Urban green space, public health, and environmental justice: The
challenge of making cities “just green enough”. Landscape and Urban Planning 125, 234–244.
Young, R.F. 2010. Managing municipal green space for ecosystem services. Urban Forestry & Urban Greening 9,
313–321.
Zuniga-Teran, A.A., Orr, B.J., Gimblett, R.H., Chalfoun, N.V., Going, S.B., Guertin, D.P. et al. 2016. Designing
healthy communities: A walkability analysis of LEED-ND. Frontiers of Architectural Research 5(4), 433-452.
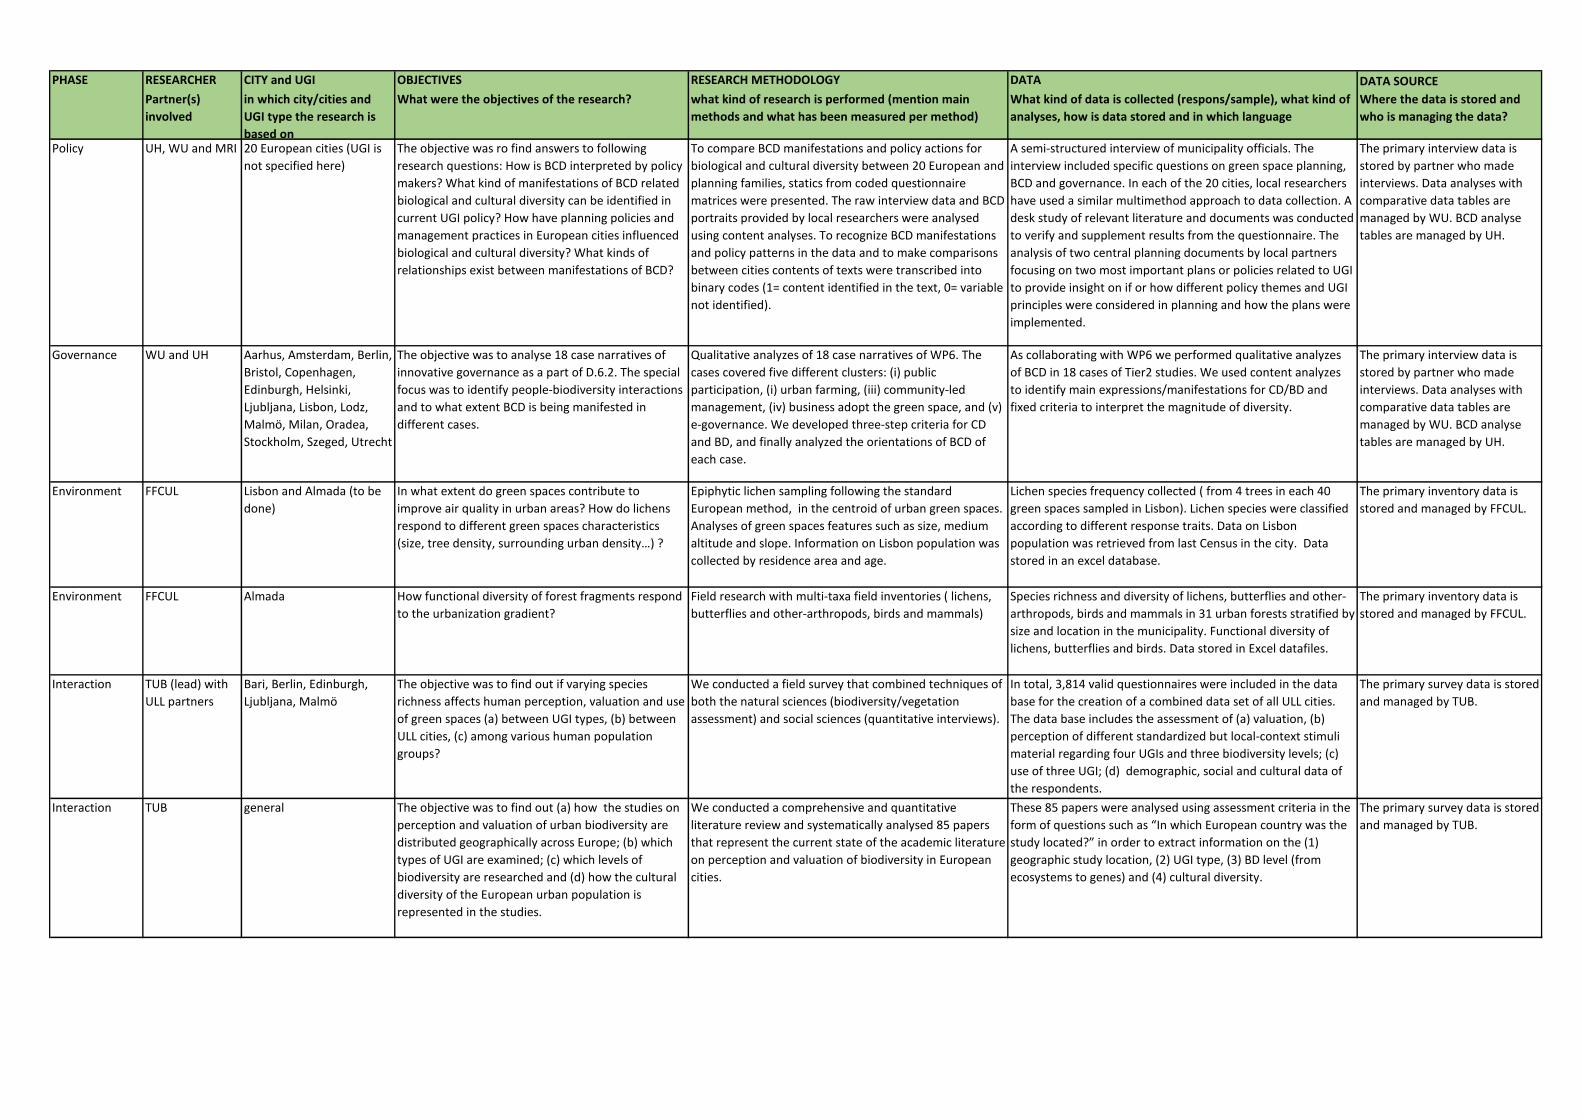
PHASE RESEARCHER CITY and UGI OBJECTIVES RESEARCH METHODOLOGY DATA DATA SOURCE
Partner(s)
involved
in which city/cities and
UGI type the research is
based on
What were the objectives of the research? what kind of research is performed (mention main
methods and what has been measured per method)
What kind of data is collected (respons/sample), what kind of
analyses, how is data stored and in which language
Where the data is stored and
who is managing the data?
Policy UH, WU and MRI 20 European cities (UGI is
not specified here)
The objective was ro find answers to following
research questions: How is BCD interpreted by policy
makers? What kind of manifestations of BCD related
biological and cultural diversity can be identified in
current UGI policy? How have planning policies and
management practices in European cities influenced
biological and cultural diversity? What kinds of
relationships exist between manifestations of BCD?
To compare BCD manifestations and policy actions for
biological and cultural diversity between 20 European and
planning families, statics from coded questionnaire
matrices were presented. The raw interview data and BCD
portraits provided by local researchers were analysed
using content analyses. To recognize BCD manifestations
and policy patterns in the data and to make comparisons
between cities contents of texts were transcribed into
binary codes (1= content identified in the text, 0= variable
not identified).
A semi-structured interview of municipality officials. The
interview included specific questions on green space planning,
BCD and governance. In each of the 20 cities, local researchers
have used a similar multimethod approach to data collection. A
desk study of relevant literature and documents was conducted
to verify and supplement results from the questionnaire. The
analysis of two central planning documents by local partners
focusing on two most important plans or policies related to UGI
to provide insight on if or how different policy themes and UGI
principles were considered in planning and how the plans were
implemented.
The primary interview data is
stored by partner who made
interviews. Data analyses with
comparative data tables are
managed by WU. BCD analyse
tables are managed by UH.
Governance WU and UH Aarhus, Amsterdam, Berlin,
Bristol, Copenhagen,
Edinburgh, Helsinki,
Ljubljana, Lisbon, Lodz,
Malmö, Milan, Oradea,
Stockholm, Szeged, Utrecht
The objective was to analyse 18 case narratives of
innovative governance as a part of D.6.2. The special
focus was to identify people-biodiversity interactions
and to what extent BCD is being manifested in
different cases.
Qualitative analyzes of 18 case narratives of WP6. The
cases covered five different clusters: (i) public
participation, (i) urban farming, (iii) community-led
management, (iv) business adopt the green space, and (v)
e-governance. We developed three-step criteria for CD
and BD, and finally analyzed the orientations of BCD of
each case.
As collaborating with WP6 we performed qualitative analyzes
of BCD in 18 cases of Tier2 studies. We used content analyzes
to identify main expressions/manifestations for CD/BD and
fixed criteria to interpret the magnitude of diversity.
The primary interview data is
stored by partner who made
interviews. Data analyses with
comparative data tables are
managed by WU. BCD analyse
tables are managed by UH.
Environment FFCUL Lisbon and Almada (to be
done)
In what extent do green spaces contribute to
improve air quality in urban areas? How do lichens
respond to different green spaces characteristics
(size, tree density, surrounding urban density…) ?
Epiphytic lichen sampling following the standard
European method, in the centroid of urban green spaces.
Analyses of green spaces features such as size, medium
altitude and slope. Information on Lisbon population was
collected by residence area and age.
Lichen species frequency collected ( from 4 trees in each 40
green spaces sampled in Lisbon). Lichen species were classified
according to different response traits. Data on Lisbon
population was retrieved from last Census in the city. Data
stored in an excel database.
The primary inventory data is
stored and managed by FFCUL.
Environment FFCUL Almada How functional diversity of forest fragments respond
to the urbanization gradient?
Field research with multi-taxa field inventories ( lichens,
butterflies and other-arthropods, birds and mammals)
Species richness and diversity of lichens, butterflies and other-
arthropods, birds and mammals in 31 urban forests stratified by
size and location in the municipality. Functional diversity of
lichens, butterflies and birds. Data stored in Excel datafiles.
The primary inventory data is
stored and managed by FFCUL.
Interaction TUB (lead) with
ULL partners
Bari, Berlin, Edinburgh,
Ljubljana, Malmö
The objective was to find out if varying species
richness affects human perception, valuation and use
of green spaces (a) between UGI types, (b) between
ULL cities, (c) among various human population
groups?
We conducted a field survey that combined techniques of
both the natural sciences (biodiversity/vegetation
assessment) and social sciences (quantitative interviews).
In total, 3,814 valid questionnaires were included in the data
base for the creation of a combined data set of all ULL cities.
The data base includes the assessment of (a) valuation, (b)
perception of different standardized but local-context stimuli
material regarding four UGIs and three biodiversity levels; (c)
use of three UGI; (d) demographic, social and cultural data of
the respondents.
The primary survey data is stored
and managed by TUB.
Interaction TUB general The objective was to find out (a) how the studies on
perception and valuation of urban biodiversity are
distributed geographically across Europe; (b) which
types of UGI are examined; (c) which levels of
biodiversity are researched and (d) how the cultural
diversity of the European urban population is
represented in the studies.
We conducted a comprehensive and quantitative
literature review and systematically analysed 85 papers
that represent the current state of the academic literature
on perception and valuation of biodiversity in European
cities.
These 85 papers were analysed using assessment criteria in the
form of questions such as “In which European country was the
study located?” in order to extract information on the (1)
geographic study location, (2) UGI type, (3) BD level (from
ecosystems to genes) and (4) cultural diversity.
The primary survey data is stored
and managed by TUB.
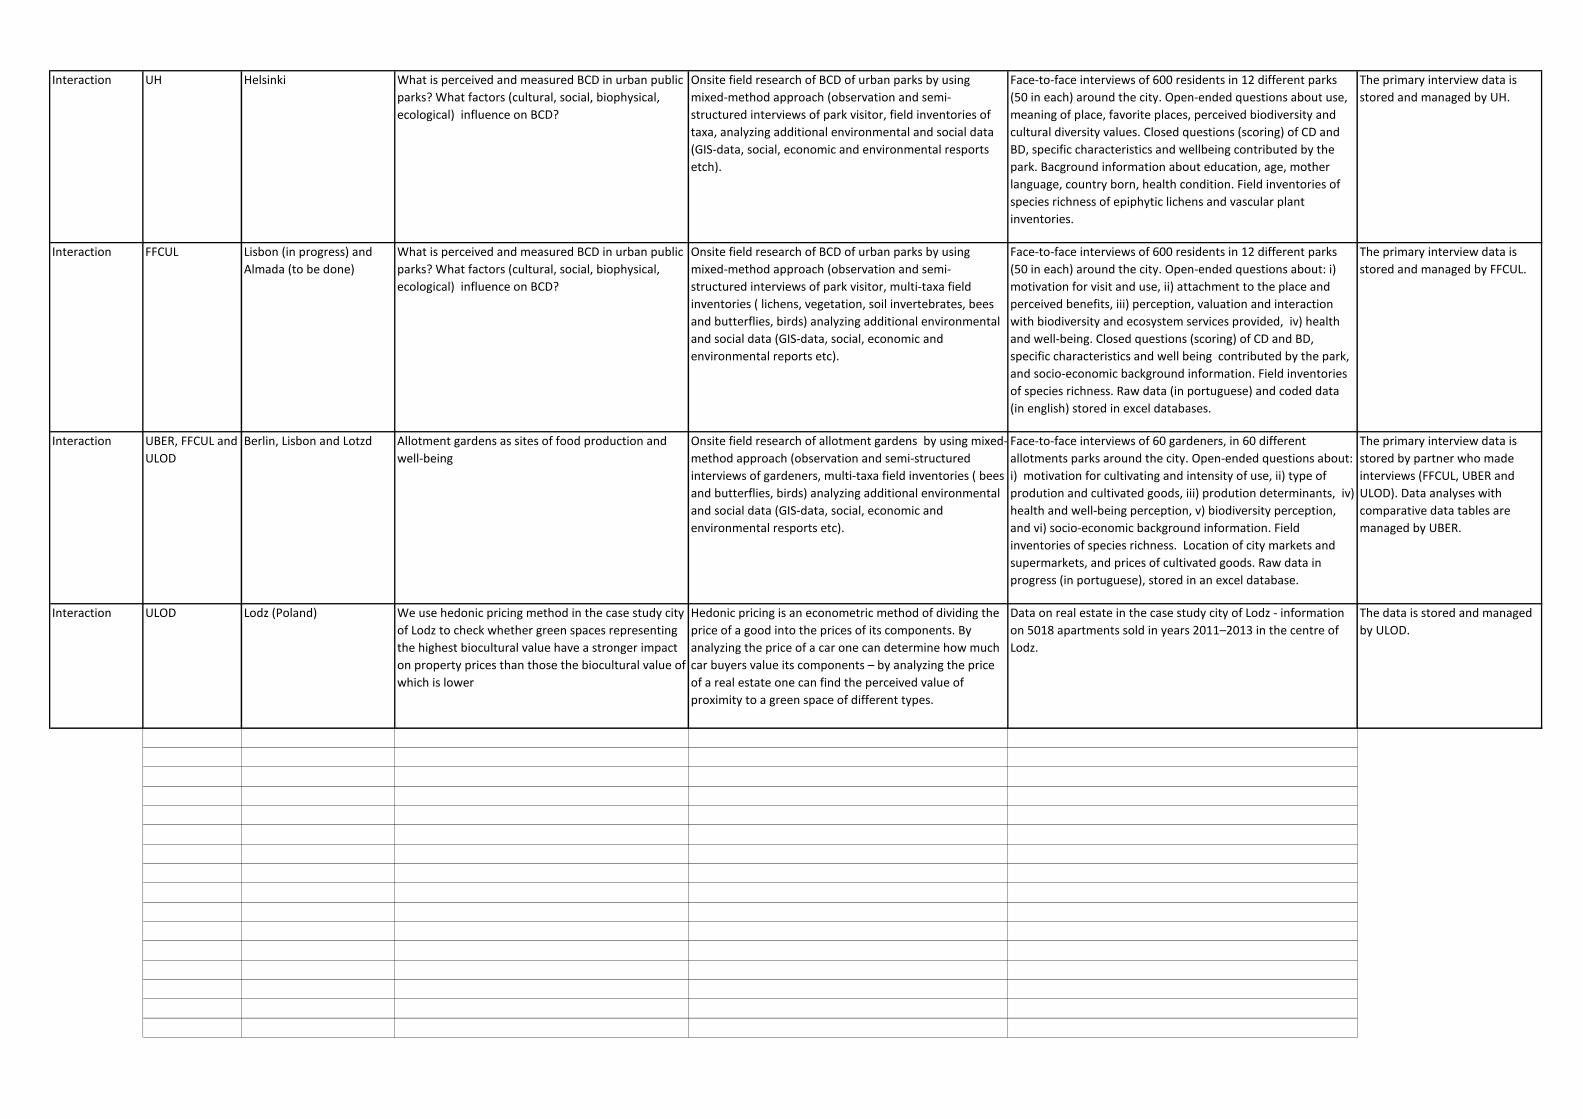
Interaction UH Helsinki What is perceived and measured BCD in urban public
parks? What factors (cultural, social, biophysical,
ecological) influence on BCD?
Onsite field research of BCD of urban parks by using
mixed-method approach (observation and semi-
structured interviews of park visitor, field inventories of
taxa, analyzing additional environmental and social data
(GIS-data, social, economic and environmental resports
etch).
Face-to-face interviews of 600 residents in 12 different parks
(50 in each) around the city. Open-ended questions about use,
meaning of place, favorite places, perceived biodiversity and
cultural diversity values. Closed questions (scoring) of CD and
BD, specific characteristics and wellbeing contributed by the
park. Bacground information about education, age, mother
language, country born, health condition. Field inventories of
species richness of epiphytic lichens and vascular plant
inventories.
The primary interview data is
stored and managed by UH.
Interaction FFCUL Lisbon (in progress) and
Almada (to be done)
What is perceived and measured BCD in urban public
parks? What factors (cultural, social, biophysical,
ecological) influence on BCD?
Onsite field research of BCD of urban parks by using
mixed-method approach (observation and semi-
structured interviews of park visitor, multi-taxa field
inventories ( lichens, vegetation, soil invertebrates, bees
and butterflies, birds) analyzing additional environmental
and social data (GIS-data, social, economic and
environmental reports etc).
Face-to-face interviews of 600 residents in 12 different parks
(50 in each) around the city. Open-ended questions about: i)
motivation for visit and use, ii) attachment to the place and
perceived benefits, iii) perception, valuation and interaction
with biodiversity and ecosystem services provided, iv) health
and well-being. Closed questions (scoring) of CD and BD,
specific characteristics and well being contributed by the park,
and socio-economic background information. Field inventories
of species richness. Raw data (in portuguese) and coded data
(in english) stored in excel databases.
The primary interview data is
stored and managed by FFCUL.
Interaction UBER, FFCUL and
ULOD
Berlin, Lisbon and Lotzd Allotment gardens as sites of food production and
well-being
Onsite field research of allotment gardens by using mixed-
method approach (observation and semi-structured
interviews of gardeners, multi-taxa field inventories ( bees
and butterflies, birds) analyzing additional environmental
and social data (GIS-data, social, economic and
environmental resports etc).
Face-to-face interviews of 60 gardeners, in 60 different
allotments parks around the city. Open-ended questions about:
i) motivation for cultivating and intensity of use, ii) type of
prodution and cultivated goods, iii) prodution determinants, iv)
health and well-being perception, v) biodiversity perception,
and vi) socio-economic background information. Field
inventories of species richness. Location of city markets and
supermarkets, and prices of cultivated goods. Raw data in
progress (in portuguese), stored in an excel database.
The primary interview data is
stored by partner who made
interviews (FFCUL, UBER and
ULOD). Data analyses with
comparative data tables are
managed by UBER.
Interaction ULOD Lodz (Poland) We use hedonic pricing method in the case study city
of Lodz to check whether green spaces representing
the highest biocultural value have a stronger impact
on property prices than those the biocultural value of
which is lower
Hedonic pricing is an econometric method of dividing the
price of a good into the prices of its components. By
analyzing the price of a car one can determine how much
car buyers value its components – by analyzing the price
of a real estate one can find the perceived value of
proximity to a green space of different types.
Data on real estate in the case study city of Lodz - information
on 5018 apartments sold in years 2011–2013 in the centre of
Lodz.
The data is stored and managed
by ULOD.

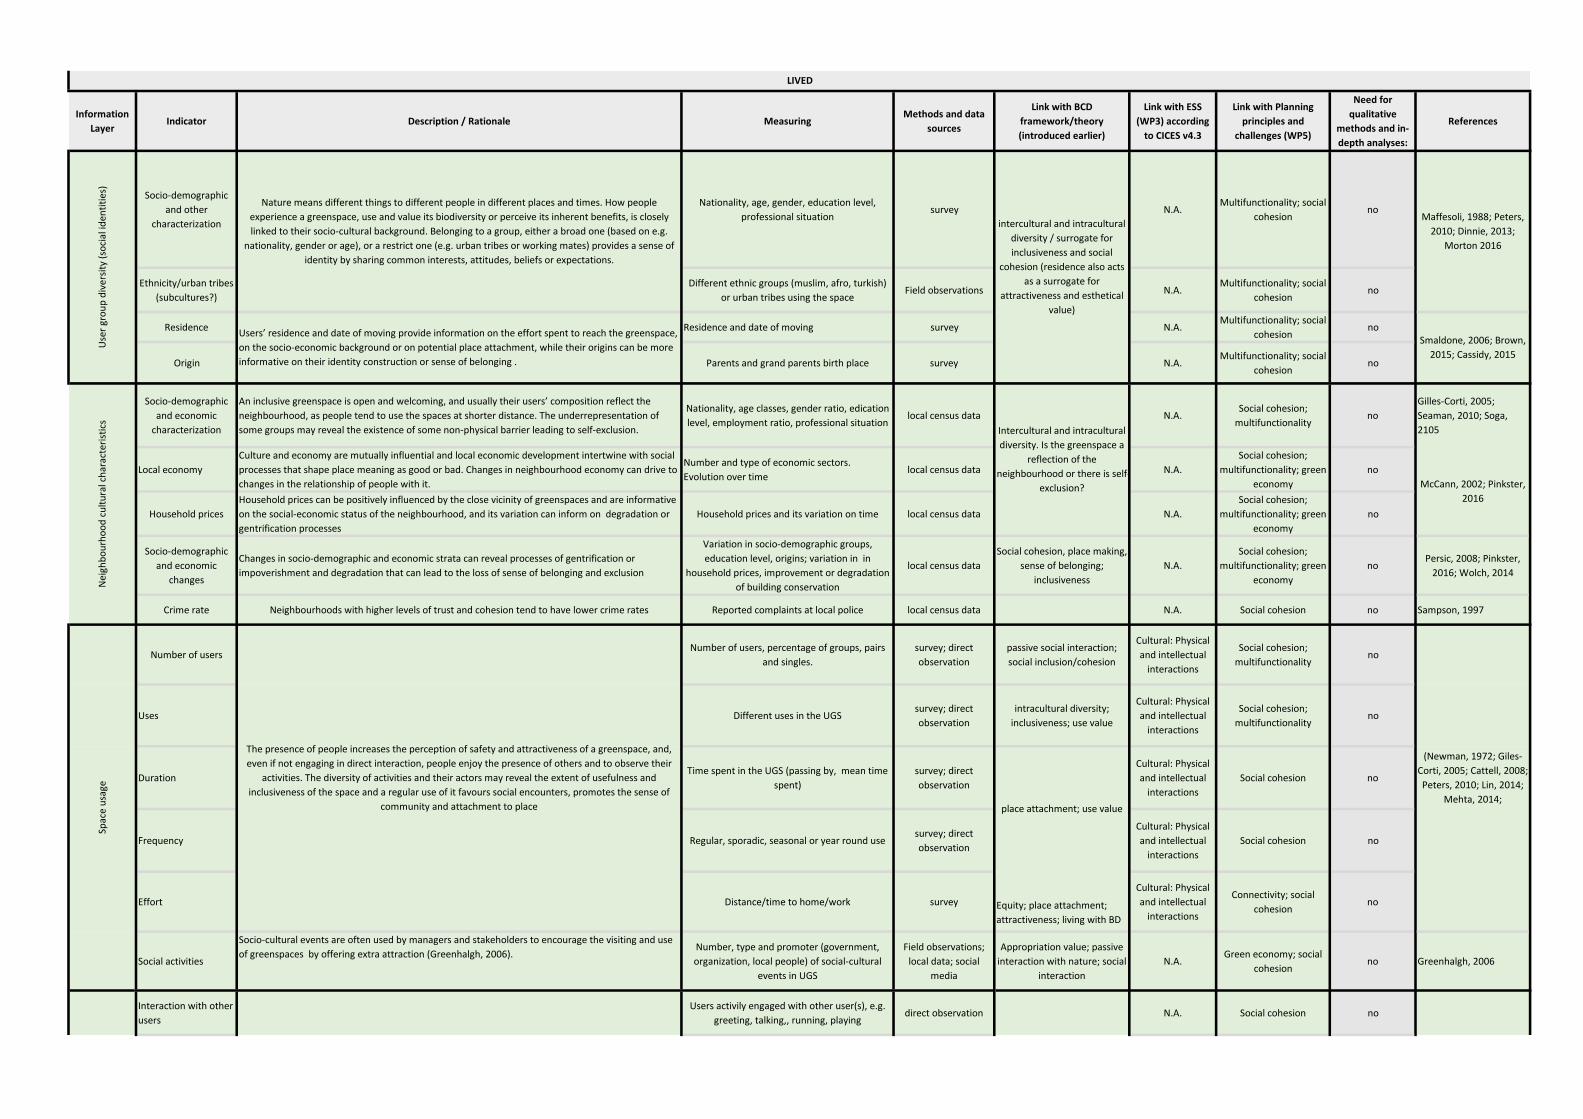
Information
LayerIndicator Description / Rationale Measuring
Methods and data
sources
Link with BCD
framework/theory
(introduced earlier)
Link with ESS
(WP3) according
to CICES v4.3
Link with Planning
principles and
challenges (WP5)
Need for
qualitative
methods and in-
depth analyses:
References
Socio-demographic
and other
characterization
Nationality, age, gender, education level,
professional situationsurvey N.A.
Multifunctionality; social
cohesionno
Ethnicity/urban tribes
(subcultures?)
Different ethnic groups (muslim, afro, turkish)
or urban tribes using the spaceField observations N.A.
Multifunctionality; social
cohesionno
Residence Residence and date of moving survey N.A.Multifunctionality; social
cohesionno
Origin Parents and grand parents birth place survey N.A.Multifunctionality; social
cohesionno
Socio-demographic
and economic
characterization
An inclusive greenspace is open and welcoming, and usually their users’ composition reflect the
neighbourhood, as people tend to use the spaces at shorter distance. The underrepresentation of
some groups may reveal the existence of some non-physical barrier leading to self-exclusion.
Nationality, age classes, gender ratio, edication
level, employment ratio, professional situationlocal census data N.A.
Social cohesion;
multifunctionalityno
Gilles-Corti, 2005;
Seaman, 2010; Soga,
2105
Local economy
Culture and economy are mutually influential and local economic development intertwine with social
processes that shape place meaning as good or bad. Changes in neighbourhood economy can drive to
changes in the relationship of people with it.
Number and type of economic sectors.
Evolution over timelocal census data N.A.
Social cohesion;
multifunctionality; green
economy
no
Household prices
Household prices can be positively influenced by the close vicinity of greenspaces and are informative
on the social-economic status of the neighbourhood, and its variation can inform on degradation or
gentrification processes
Household prices and its variation on time local census data N.A.
Social cohesion;
multifunctionality; green
economy
no
Socio-demographic
and economic
changes
Changes in socio-demographic and economic strata can reveal processes of gentrification or
impoverishment and degradation that can lead to the loss of sense of belonging and exclusion
Variation in socio-demographic groups,
education level, origins; variation in in
household prices, improvement or degradation
of building conservation
local census data
Social cohesion, place making,
sense of belonging;
inclusiveness
N.A.
Social cohesion;
multifunctionality; green
economy
noPersic, 2008; Pinkster,
2016; Wolch, 2014
Crime rate Neighbourhoods with higher levels of trust and cohesion tend to have lower crime rates Reported complaints at local police local census data N.A. Social cohesion no Sampson, 1997
Number of usersNumber of users, percentage of groups, pairs
and singles.
survey; direct
observation
passive social interaction;
social inclusion/cohesion
Cultural: Physical
and intellectual
interactions
Social cohesion;
multifunctionalityno
Uses Different uses in the UGSsurvey; direct
observation
intracultural diversity;
inclusiveness; use value
Cultural: Physical
and intellectual
interactions
Social cohesion;
multifunctionality no
DurationTime spent in the UGS (passing by, mean time
spent)
survey; direct
observation
Cultural: Physical
and intellectual
interactions
Social cohesion no
Frequency Regular, sporadic, seasonal or year round usesurvey; direct
observation
Cultural: Physical
and intellectual
interactions
Social cohesion no
Effort Distance/time to home/work survey Equity; place attachment;
attractiveness; living with BD
Cultural: Physical
and intellectual
interactions
Connectivity; social
cohesionno
Social activities
Socio-cultural events are often used by managers and stakeholders to encourage the visiting and use
of greenspaces by offering extra attraction (Greenhalgh, 2006).Number, type and promoter (government,
organization, local people) of social-cultural
events in UGS
Field observations;
local data; social
media
Appropriation value; passive
interaction with nature; social
interaction
N.A.Green economy; social
cohesionno Greenhalgh, 2006
Interaction with other
users
Users activily engaged with other user(s), e.g.
greeting, talking,, running, playingdirect observation N.A. Social cohesion no
Maffesoli, 1988; Peters,
2010; Dinnie, 2013;
Morton 2016
Nature means different things to different people in different places and times. How people
experience a greenspace, use and value its biodiversity or perceive its inherent benefits, is closely
linked to their socio-cultural background. Belonging to a group, either a broad one (based on e.g.
nationality, gender or age), or a restrict one (e.g. urban tribes or working mates) provides a sense of
identity by sharing common interests, attitudes, beliefs or expectations.
Nei
ghb
ou
rho
od
cu
ltu
ral c
har
acte
rist
ics
LIVED
place attachment; use value
Spac
e u
sage
Users’ residence and date of moving provide information on the effort spent to reach the greenspace,
on the socio-economic background or on potential place attachment, while their origins can be more
informative on their identity construction or sense of belonging .
Intercultural and intracultural
diversity. Is the greenspace a
reflection of the
neighbourhood or there is self-
exclusion?
Use
r gr
ou
p d
iver
sity
(so
cial
iden
titi
es)
intercultural and intracultural
diversity / surrogate for
inclusiveness and social
cohesion (residence also acts
as a surrogate for
attractiveness and esthetical
value)
The presence of people increases the perception of safety and attractiveness of a greenspace, and,
even if not engaging in direct interaction, people enjoy the presence of others and to observe their
activities. The diversity of activities and their actors may reveal the extent of usefulness and
inclusiveness of the space and a regular use of it favours social encounters, promotes the sense of
community and attachment to place
McCann, 2002; Pinkster,
2016
Smaldone, 2006; Brown,
2015; Cassidy, 2015
Inte
ract
ion
s
Social interactions, even if incidental, foster tolerance, build bonds and promote the sense of
community and social cohesion.
Active social interaction;
social cohesion; living
together
Cattel, 2008; Peters,
2010
(Newman, 1972; Giles-
Corti, 2005; Cattell, 2008;
Peters, 2010; Lin, 2014;
Mehta, 2014;
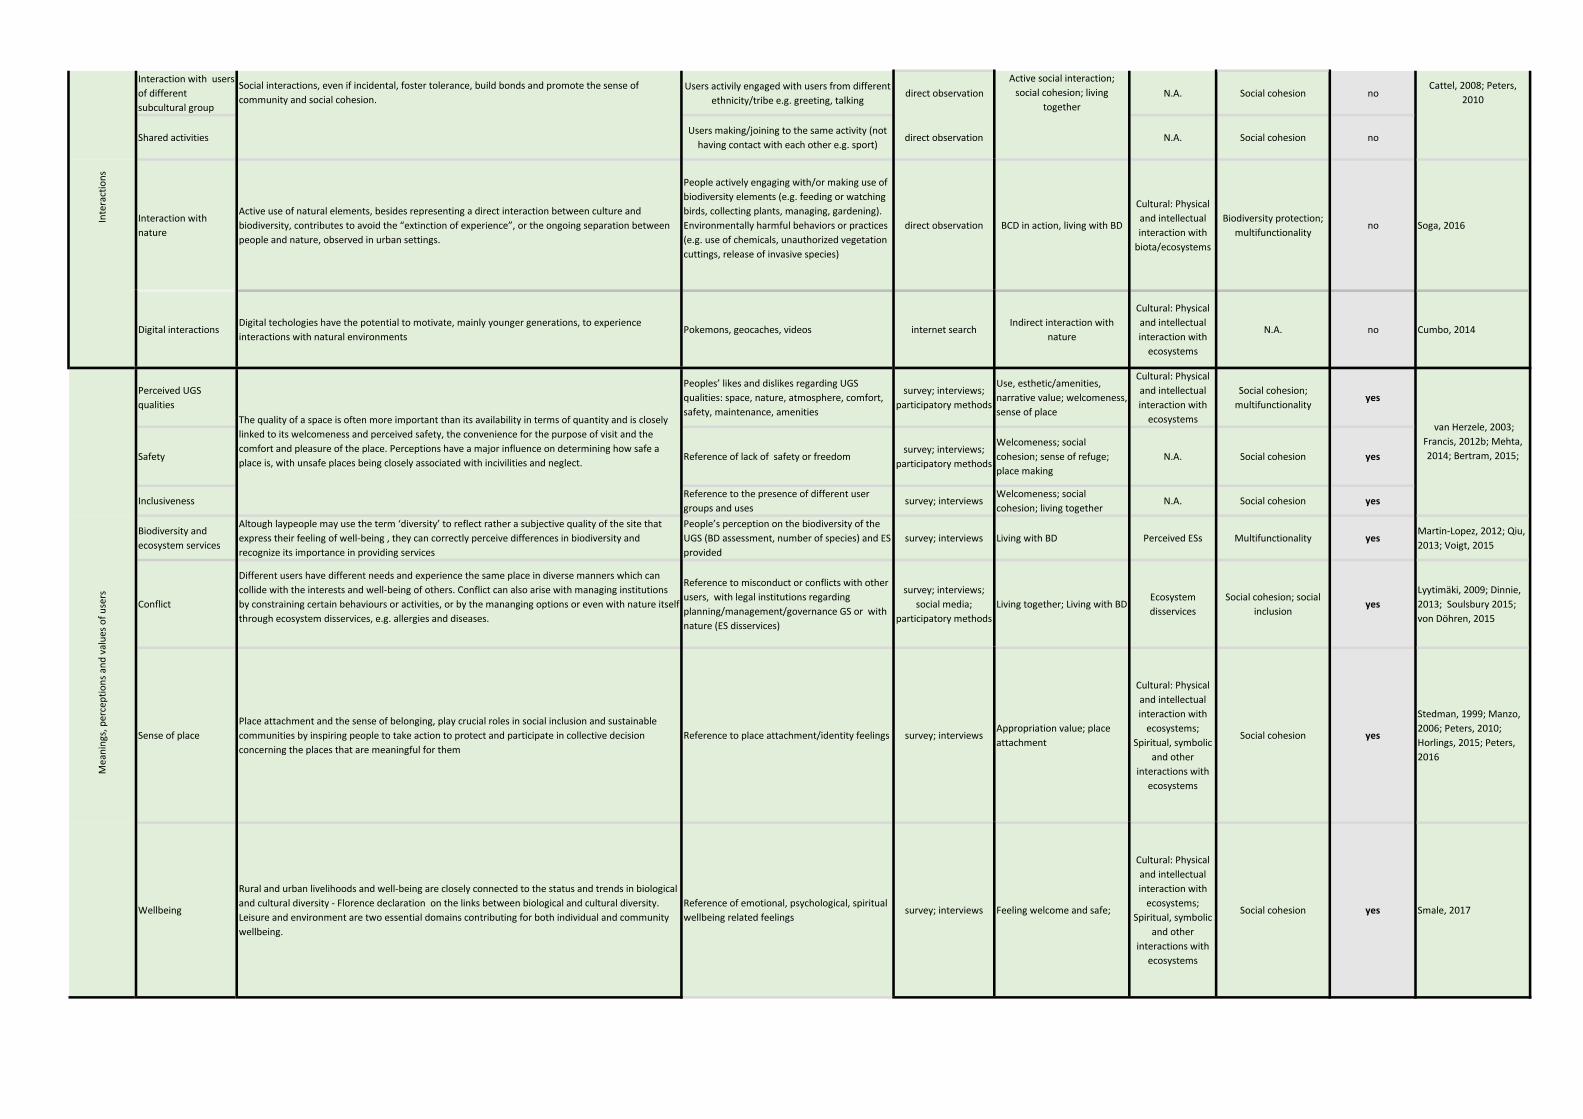
Interaction with users
of different
subcultural group
Users activily engaged with users from different
ethnicity/tribe e.g. greeting, talkingdirect observation N.A. Social cohesion no
Shared activitiesUsers making/joining to the same activity (not
having contact with each other e.g. sport)direct observation N.A. Social cohesion no
Interaction with
nature
Active use of natural elements, besides representing a direct interaction between culture and
biodiversity, contributes to avoid the “extinction of experience”, or the ongoing separation between
people and nature, observed in urban settings.
People actively engaging with/or making use of
biodiversity elements (e.g. feeding or watching
birds, collecting plants, managing, gardening).
Environmentally harmful behaviors or practices
(e.g. use of chemicals, unauthorized vegetation
cuttings, release of invasive species)
direct observation BCD in action, living with BD
Cultural: Physical
and intellectual
interaction with
biota/ecosystems
Biodiversity protection;
multifunctionalityno Soga, 2016
Digital interactions Digital techologies have the potential to motivate, mainly younger generations, to experience
interactions with natural environmentsPokemons, geocaches, videos internet search
Indirect interaction with
nature
Cultural: Physical
and intellectual
interaction with
ecosystems
N.A. no Cumbo, 2014
Perceived UGS
qualities
Peoples’ likes and dislikes regarding UGS
qualities: space, nature, atmosphere, comfort,
safety, maintenance, amenities
survey; interviews;
participatory methods
Use, esthetic/amenities,
narrative value; welcomeness,
sense of place
Cultural: Physical
and intellectual
interaction with
ecosystems
Social cohesion;
multifunctionalityyes
Safety Reference of lack of safety or freedomsurvey; interviews;
participatory methods
Welcomeness; social
cohesion; sense of refuge;
place making
N.A. Social cohesion yes
InclusivenessReference to the presence of different user
groups and usessurvey; interviews
Welcomeness; social
cohesion; living togetherN.A. Social cohesion yes
Biodiversity and
ecosystem services
Altough laypeople may use the term ‘diversity’ to reflect rather a subjective quality of the site that
express their feeling of well-being , they can correctly perceive differences in biodiversity and
recognize its importance in providing services
People’s perception on the biodiversity of the
UGS (BD assessment, number of species) and ES
provided
survey; interviews Living with BD Perceived ESs Multifunctionality yesMartin-Lopez, 2012; Qiu,
2013; Voigt, 2015
Conflict
Different users have different needs and experience the same place in diverse manners which can
collide with the interests and well-being of others. Conflict can also arise with managing institutions
by constraining certain behaviours or activities, or by the mananging options or even with nature itself
through ecosystem disservices, e.g. allergies and diseases.
Reference to misconduct or conflicts with other
users, with legal institutions regarding
planning/management/governance GS or with
nature (ES disservices)
survey; interviews;
social media;
participatory methods
Living together; Living with BDEcosystem
disservices
Social cohesion; social
inclusionyes
Lyytimäki, 2009; Dinnie,
2013; Soulsbury 2015;
von Döhren, 2015
Sense of place
Place attachment and the sense of belonging, play crucial roles in social inclusion and sustainable
communities by inspiring people to take action to protect and participate in collective decision
concerning the places that are meaningful for them
Reference to place attachment/identity feelings survey; interviewsAppropriation value; place
attachment
Cultural: Physical
and intellectual
interaction with
ecosystems;
Spiritual, symbolic
and other
interactions with
ecosystems
Social cohesion yes
Stedman, 1999; Manzo,
2006; Peters, 2010;
Horlings, 2015; Peters,
2016
Wellbeing
Rural and urban livelihoods and well-being are closely connected to the status and trends in biological
and cultural diversity - Florence declaration on the links between biological and cultural diversity.
Leisure and environment are two essential domains contributing for both individual and community
wellbeing.
Reference of emotional, psychological, spiritual
wellbeing related feelingssurvey; interviews Feeling welcome and safe;
Cultural: Physical
and intellectual
interaction with
ecosystems;
Spiritual, symbolic
and other
interactions with
ecosystems
Social cohesion yes Smale, 2017
Inte
ract
ion
s
Social interactions, even if incidental, foster tolerance, build bonds and promote the sense of
community and social cohesion.
The quality of a space is often more important than its availability in terms of quantity and is closely
linked to its welcomeness and perceived safety, the convenience for the purpose of visit and the
comfort and pleasure of the place. Perceptions have a major influence on determining how safe a
place is, with unsafe places being closely associated with incivilities and neglect.
Mea
nin
gs, p
erce
pti
on
s an
d v
alu
es o
f u
sers
Active social interaction;
social cohesion; living
together
Cattel, 2008; Peters,
2010
van Herzele, 2003;
Francis, 2012b; Mehta,
2014; Bertram, 2015;
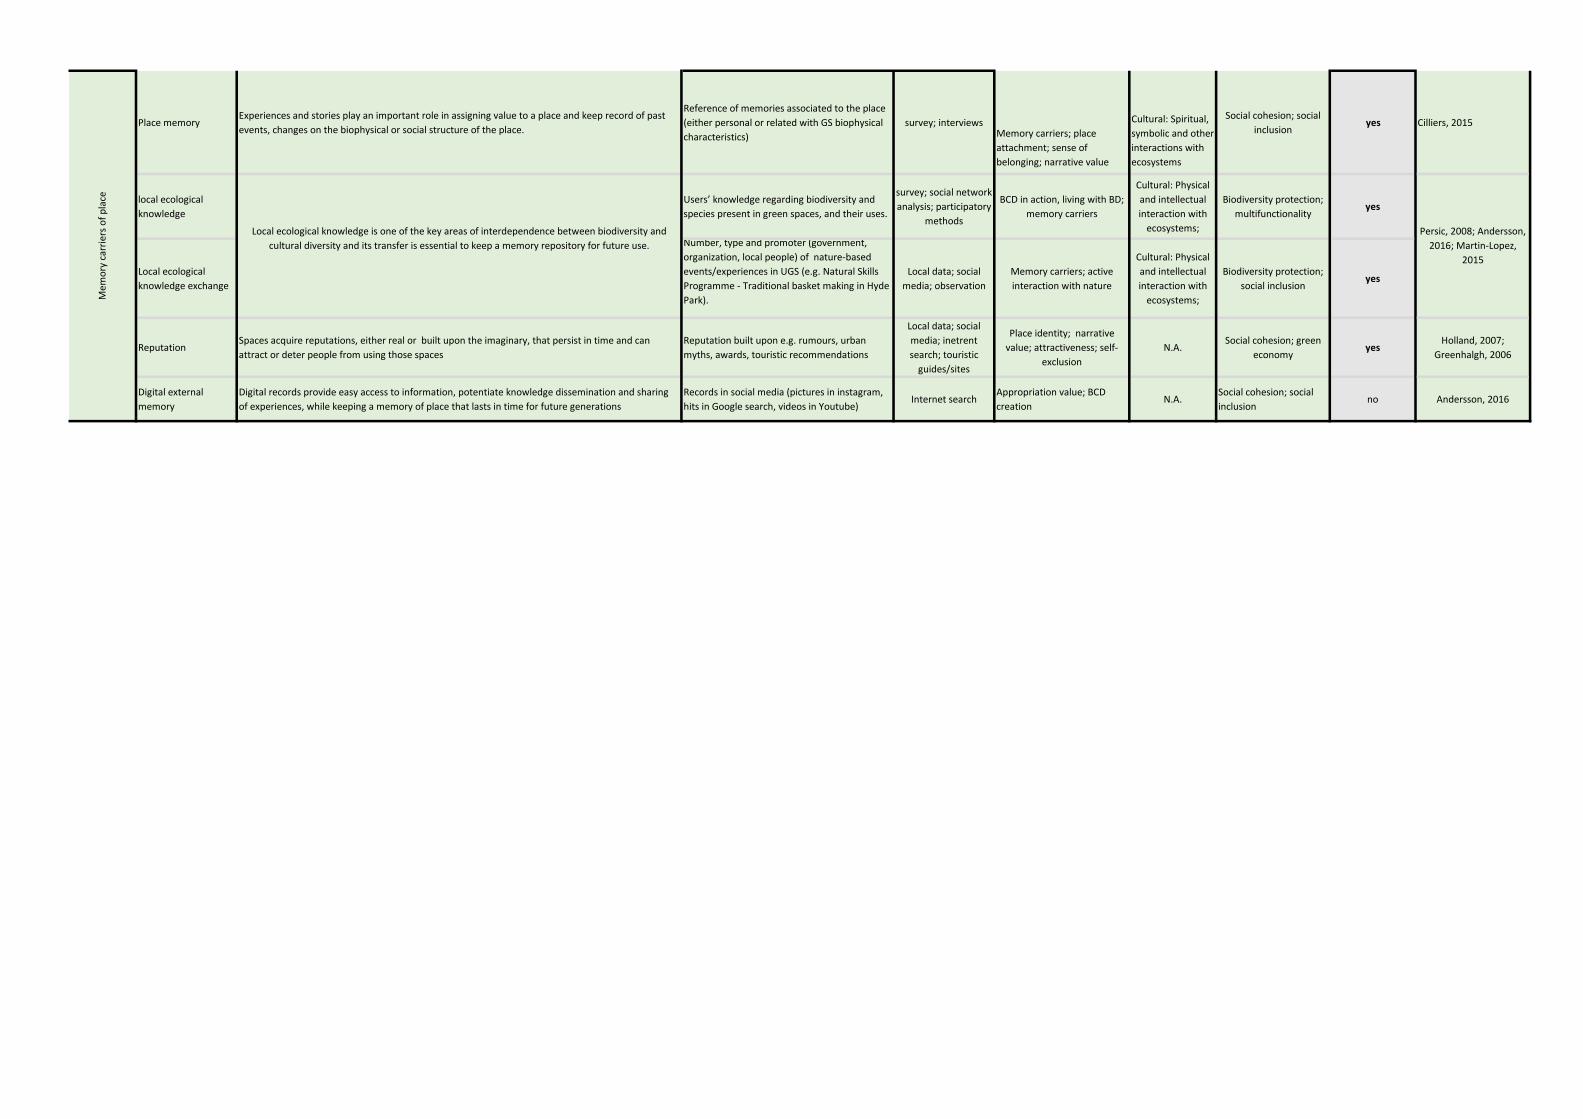
Place memoryExperiences and stories play an important role in assigning value to a place and keep record of past
events, changes on the biophysical or social structure of the place.
Reference of memories associated to the place
(either personal or related with GS biophysical
characteristics)
survey; interviewsMemory carriers; place
attachment; sense of
belonging; narrative value
Cultural: Spiritual,
symbolic and other
interactions with
ecosystems
Social cohesion; social
inclusionyes Cilliers, 2015
local ecological
knowledge
Users’ knowledge regarding biodiversity and
species present in green spaces, and their uses.
survey; social network
analysis; participatory
methods
BCD in action, living with BD;
memory carriers
Cultural: Physical
and intellectual
interaction with
ecosystems;
Biodiversity protection;
multifunctionalityyes
Local ecological
knowledge exchange
Number, type and promoter (government,
organization, local people) of nature-based
events/experiences in UGS (e.g. Natural Skills
Programme - Traditional basket making in Hyde
Park).
Local data; social
media; observation
Memory carriers; active
interaction with nature
Cultural: Physical
and intellectual
interaction with
ecosystems;
Biodiversity protection;
social inclusionyes
ReputationSpaces acquire reputations, either real or built upon the imaginary, that persist in time and can
attract or deter people from using those spaces
Reputation built upon e.g. rumours, urban
myths, awards, touristic recommendations
Local data; social
media; inetrent
search; touristic
guides/sites
Place identity; narrative
value; attractiveness; self-
exclusion
N.A.Social cohesion; green
economyyes
Holland, 2007;
Greenhalgh, 2006
Digital external
memory
Digital records provide easy access to information, potentiate knowledge dissemination and sharing
of experiences, while keeping a memory of place that lasts in time for future generations
Records in social media (pictures in instagram,
hits in Google search, videos in Youtube)Internet search
Appropriation value; BCD
creation N.A.
Social cohesion; social
inclusionno Andersson, 2016
Mem
ory
car
rier
s o
f p
lace
Local ecological knowledge is one of the key areas of interdependence between biodiversity and
cultural diversity and its transfer is essential to keep a memory repository for future use.
Persic, 2008; Andersson,
2016; Martin-Lopez,
2015


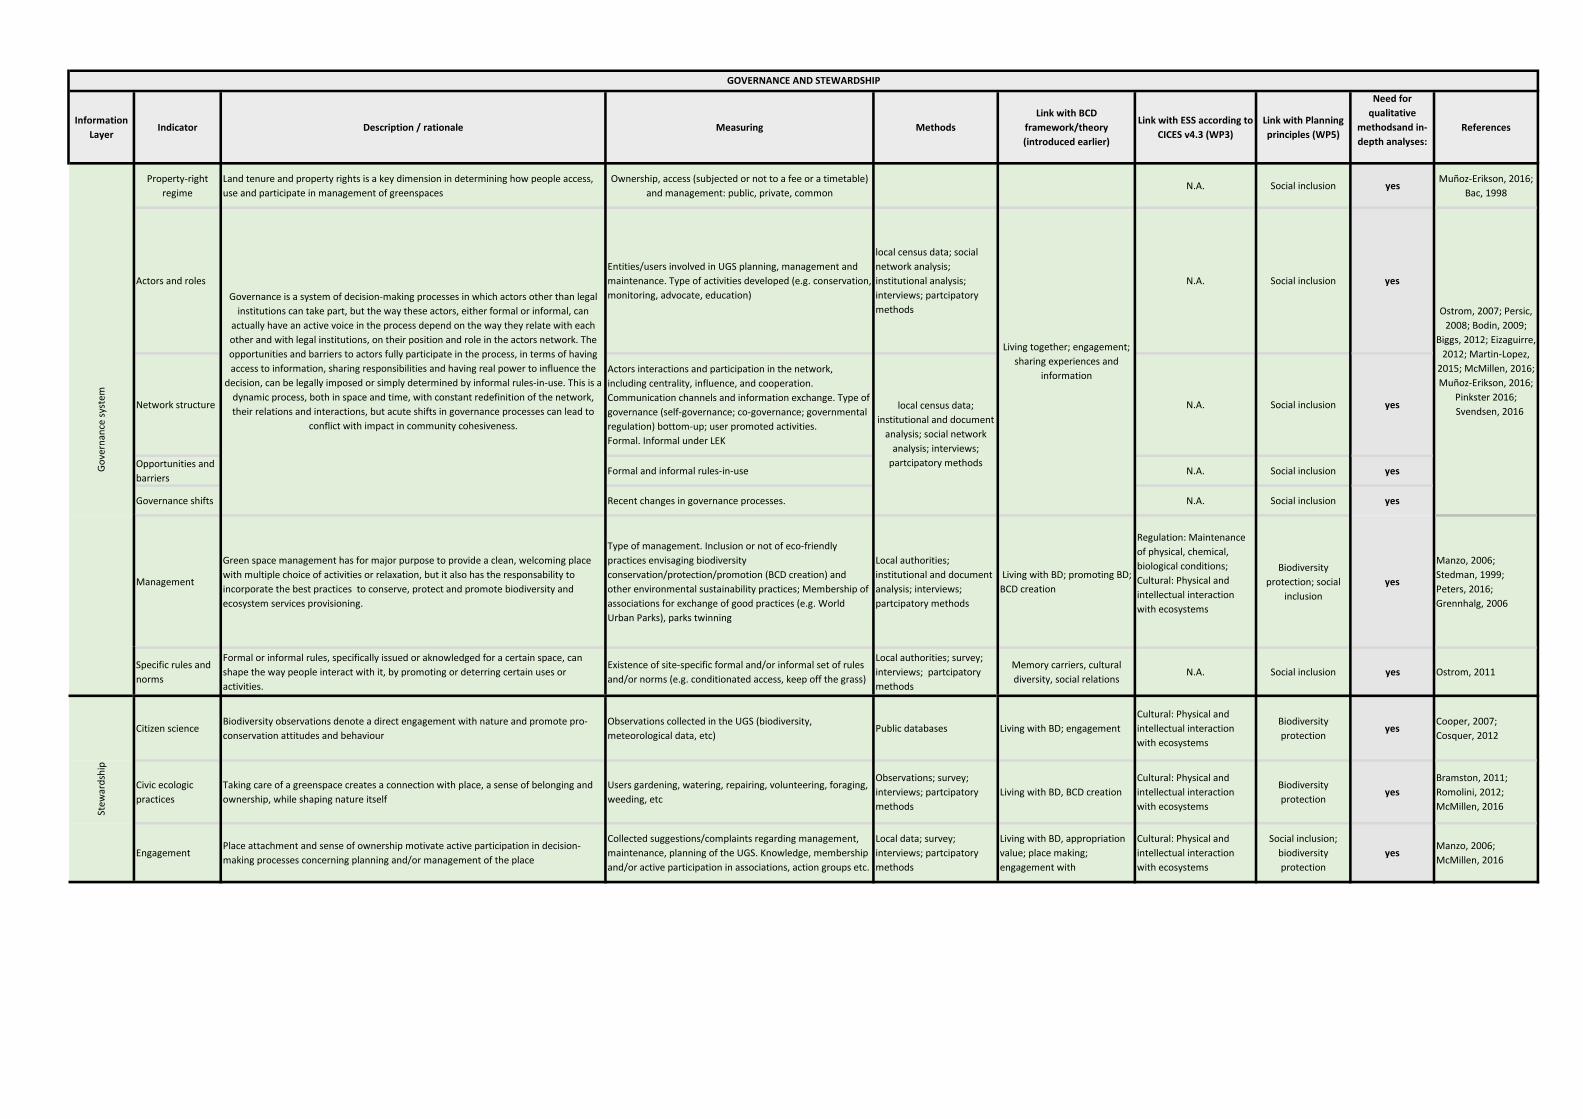
Information
LayerIndicator Description / rationale Measuring Methods
Link with BCD
framework/theory
(introduced earlier)
Link with ESS according to
CICES v4.3 (WP3)
Link with Planning
principles (WP5)
Need for
qualitative
methodsand in-
depth analyses:
References
Property-right
regime
Land tenure and property rights is a key dimension in determining how people access,
use and participate in management of greenspaces
Ownership, access (subjected or not to a fee or a timetable)
and management: public, private, commonN.A. Social inclusion yes
Muñoz-Erikson, 2016;
Bac, 1998
Actors and roles
Entities/users involved in UGS planning, management and
maintenance. Type of activities developed (e.g. conservation,
monitoring, advocate, education)
local census data; social
network analysis;
institutional analysis;
interviews; partcipatory
methods
N.A. Social inclusion yes
Network structure
Actors interactions and participation in the network,
including centrality, influence, and cooperation.
Communication channels and information exchange. Type of
governance (self-governance; co-governance; governmental
regulation) bottom-up; user promoted activities.
Formal. Informal under LEK
N.A. Social inclusion yes
Opportunities and
barriersFormal and informal rules-in-use N.A. Social inclusion yes
Governance shifts Recent changes in governance processes. N.A. Social inclusion yes
Management
Green space management has for major purpose to provide a clean, welcoming place
with multiple choice of activities or relaxation, but it also has the responsability to
incorporate the best practices to conserve, protect and promote biodiversity and
ecosystem services provisioning.
Type of management. Inclusion or not of eco-friendly
practices envisaging biodiversity
conservation/protection/promotion (BCD creation) and
other environmental sustainability practices; Membership of
associations for exchange of good practices (e.g. World
Urban Parks), parks twinning
Local authorities;
institutional and document
analysis; interviews;
partcipatory methods
Living with BD; promoting BD;
BCD creation
Regulation: Maintenance
of physical, chemical,
biological conditions;
Cultural: Physical and
intellectual interaction
with ecosystems
Biodiversity
protection; social
inclusion
yes
Manzo, 2006;
Stedman, 1999;
Peters, 2016;
Grennhalg, 2006
Specific rules and
norms
Formal or informal rules, specifically issued or aknowledged for a certain space, can
shape the way people interact with it, by promoting or deterring certain uses or
activities.
Existence of site-specific formal and/or informal set of rules
and/or norms (e.g. conditionated access, keep off the grass)
Local authorities; survey;
interviews; partcipatory
methods
Memory carriers, cultural
diversity, social relationsN.A. Social inclusion yes Ostrom, 2011
Citizen scienceBiodiversity observations denote a direct engagement with nature and promote pro-
conservation attitudes and behaviour
Observations collected in the UGS (biodiversity,
meteorological data, etc)Public databases Living with BD; engagement
Cultural: Physical and
intellectual interaction
with ecosystems
Biodiversity
protectionyes
Cooper, 2007;
Cosquer, 2012
Civic ecologic
practices
Taking care of a greenspace creates a connection with place, a sense of belonging and
ownership, while shaping nature itself
Users gardening, watering, repairing, volunteering, foraging,
weeding, etc
Observations; survey;
interviews; partcipatory
methods
Living with BD, BCD creation
Cultural: Physical and
intellectual interaction
with ecosystems
Biodiversity
protectionyes
Bramston, 2011;
Romolini, 2012;
McMillen, 2016
EngagementPlace attachment and sense of ownership motivate active participation in decision-
making processes concerning planning and/or management of the place
Collected suggestions/complaints regarding management,
maintenance, planning of the UGS. Knowledge, membership
and/or active participation in associations, action groups etc.
Local data; survey;
interviews; partcipatory
methods
Living with BD, appropriation
value; place making;
engagement with
Cultural: Physical and
intellectual interaction
with ecosystems
Social inclusion;
biodiversity
protection
yesManzo, 2006;
McMillen, 2016
GOVERNANCE AND STEWARDSHIP
Ostrom, 2007; Persic,
2008; Bodin, 2009;
Biggs, 2012; Eizaguirre,
2012; Martin-Lopez,
2015; McMillen, 2016;
Muñoz-Erikson, 2016;
Pinkster 2016;
Svendsen, 2016
Living together; engagement;
sharing experiences and
information
Stew
ard
ship
Go
vern
ance
sys
tem
Governance is a system of decision-making processes in which actors other than legal
institutions can take part, but the way these actors, either formal or informal, can
actually have an active voice in the process depend on the way they relate with each
other and with legal institutions, on their position and role in the actors network. The
opportunities and barriers to actors fully participate in the process, in terms of having
access to information, sharing responsibilities and having real power to influence the
decision, can be legally imposed or simply determined by informal rules-in-use. This is a
dynamic process, both in space and time, with constant redefinition of the network,
their relations and interactions, but acute shifts in governance processes can lead to
conflict with impact in community cohesiveness.
local census data;
institutional and document
analysis; social network
analysis; interviews;
partcipatory methods

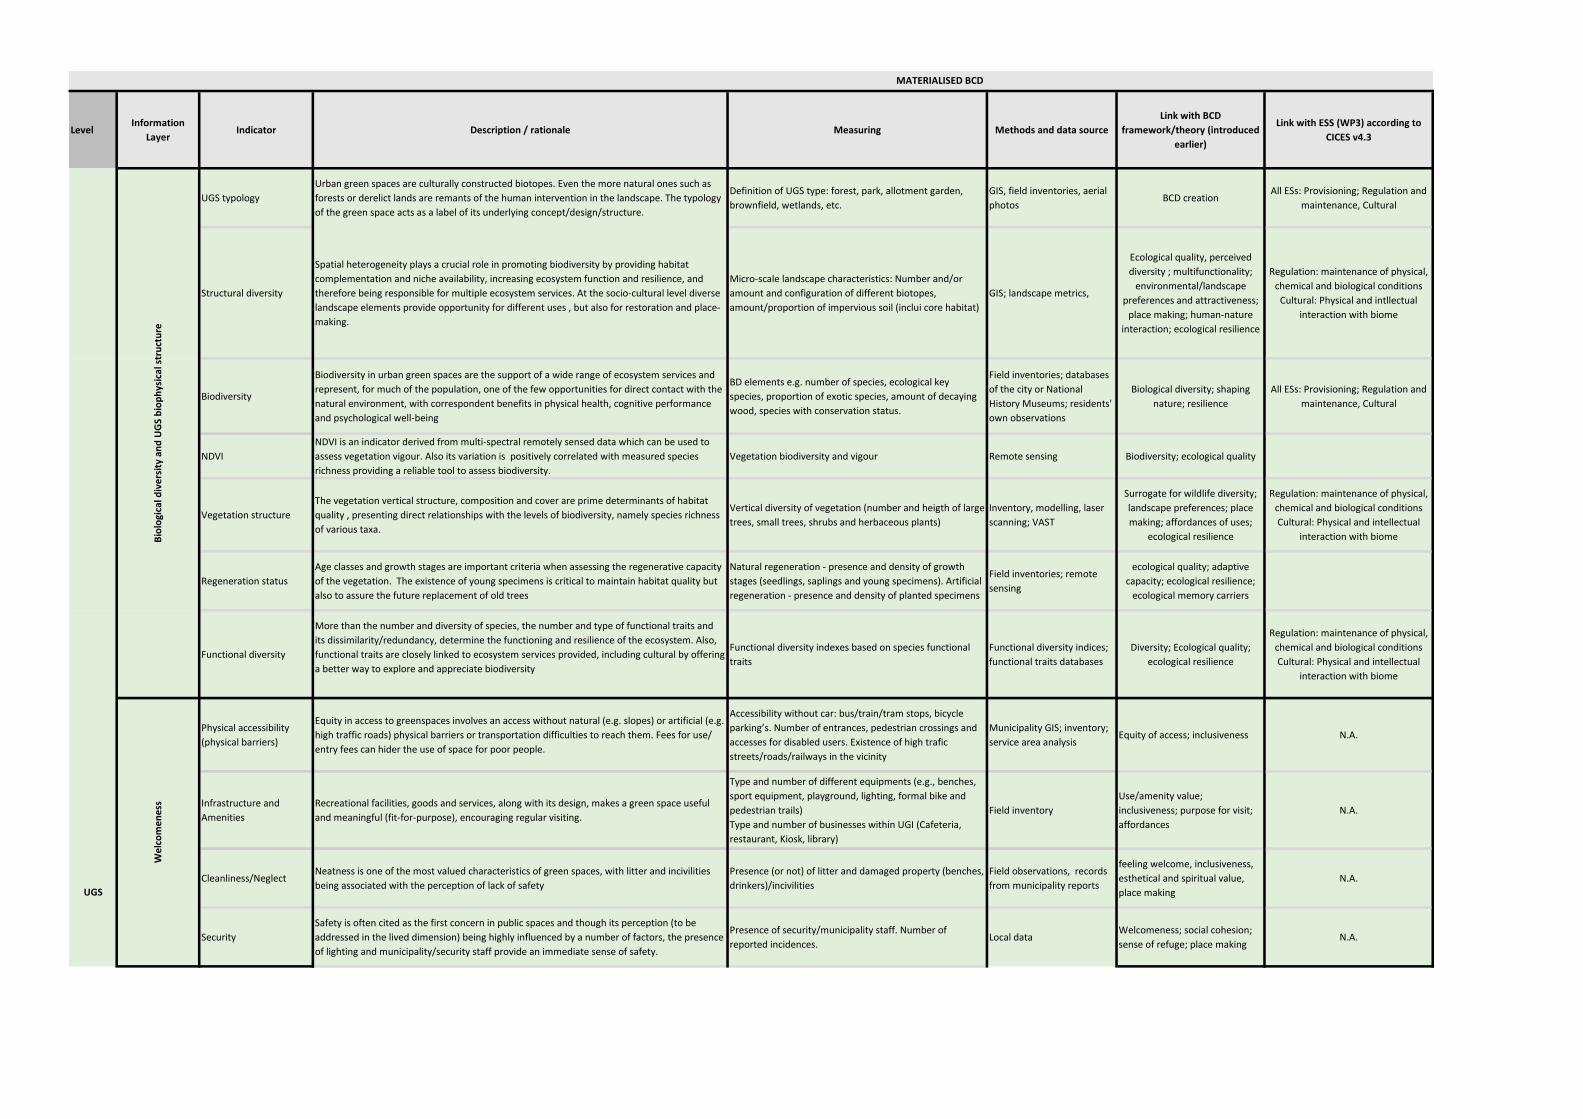
LevelInformation
LayerIndicator Description / rationale Measuring Methods and data source
Link with BCD
framework/theory (introduced
earlier)
Link with ESS (WP3) according to
CICES v4.3
UGS typology
Urban green spaces are culturally constructed biotopes. Even the more natural ones such as
forests or derelict lands are remants of the human intervention in the landscape. The typology
of the green space acts as a label of its underlying concept/design/structure.
Definition of UGS type: forest, park, allotment garden,
brownfield, wetlands, etc.
GIS, field inventories, aerial
photosBCD creation
All ESs: Provisioning; Regulation and
maintenance, Cultural
Structural diversity
Spatial heterogeneity plays a crucial role in promoting biodiversity by providing habitat
complementation and niche availability, increasing ecosystem function and resilience, and
therefore being responsible for multiple ecosystem services. At the socio-cultural level diverse
landscape elements provide opportunity for different uses , but also for restoration and place-
making.
Micro-scale landscape characteristics: Number and/or
amount and configuration of different biotopes,
amount/proportion of impervious soil (inclui core habitat)
GIS; landscape metrics,
Ecological quality, perceived
diversity ; multifunctionality;
environmental/landscape
preferences and attractiveness;
place making; human-nature
interaction; ecological resilience
Regulation: maintenance of physical,
chemical and biological conditions
Cultural: Physical and intllectual
interaction with biome
Biodiversity
Biodiversity in urban green spaces are the support of a wide range of ecosystem services and
represent, for much of the population, one of the few opportunities for direct contact with the
natural environment, with correspondent benefits in physical health, cognitive performance
and psychological well-being
BD elements e.g. number of species, ecological key
species, proportion of exotic species, amount of decaying
wood, species with conservation status.
Field inventories; databases
of the city or National
History Museums; residents'
own observations
Biological diversity; shaping
nature; resilience
All ESs: Provisioning; Regulation and
maintenance, Cultural
NDVI
NDVI is an indicator derived from multi-spectral remotely sensed data which can be used to
assess vegetation vigour. Also its variation is positively correlated with measured species
richness providing a reliable tool to assess biodiversity.
Vegetation biodiversity and vigour Remote sensing Biodiversity; ecological quality
Vegetation structure
The vegetation vertical structure, composition and cover are prime determinants of habitat
quality , presenting direct relationships with the levels of biodiversity, namely species richness
of various taxa.
Vertical diversity of vegetation (number and heigth of large
trees, small trees, shrubs and herbaceous plants)
Inventory, modelling, laser
scanning; VAST
Surrogate for wildlife diversity;
landscape preferences; place
making; affordances of uses;
ecological resilience
Regulation: maintenance of physical,
chemical and biological conditions
Cultural: Physical and intellectual
interaction with biome
Regeneration status
Age classes and growth stages are important criteria when assessing the regenerative capacity
of the vegetation. The existence of young specimens is critical to maintain habitat quality but
also to assure the future replacement of old trees
Natural regeneration - presence and density of growth
stages (seedlings, saplings and young specimens). Artificial
regeneration - presence and density of planted specimens
Field inventories; remote
sensing
ecological quality; adaptive
capacity; ecological resilience;
ecological memory carriers
Functional diversity
More than the number and diversity of species, the number and type of functional traits and
its dissimilarity/redundancy, determine the functioning and resilience of the ecosystem. Also,
functional traits are closely linked to ecosystem services provided, including cultural by offering
a better way to explore and appreciate biodiversity
Functional diversity indexes based on species functional
traits
Functional diversity indices;
functional traits databases
Diversity; Ecological quality;
ecological resilience
Regulation: maintenance of physical,
chemical and biological conditions
Cultural: Physical and intellectual
interaction with biome
Physical accessibility
(physical barriers)
Equity in access to greenspaces involves an access without natural (e.g. slopes) or artificial (e.g.
high traffic roads) physical barriers or transportation difficulties to reach them. Fees for use/
entry fees can hider the use of space for poor people.
Accessibility without car: bus/train/tram stops, bicycle
parking’s. Number of entrances, pedestrian crossings and
accesses for disabled users. Existence of high trafic
streets/roads/railways in the vicinity
Municipality GIS; inventory;
service area analysisEquity of access; inclusiveness N.A.
Infrastructure and
Amenities
Recreational facilities, goods and services, along with its design, makes a green space useful
and meaningful (fit-for-purpose), encouraging regular visiting.
Type and number of different equipments (e.g., benches,
sport equipment, playground, lighting, formal bike and
pedestrian trails)
Type and number of businesses within UGI (Cafeteria,
restaurant, Kiosk, library)
Field inventory
Use/amenity value;
inclusiveness; purpose for visit;
affordances
N.A.
Cleanliness/NeglectNeatness is one of the most valued characteristics of green spaces, with litter and incivilities
being associated with the perception of lack of safety
Presence (or not) of litter and damaged property (benches,
drinkers)/incivilities
Field observations, records
from municipality reports
feeling welcome, inclusiveness,
esthetical and spiritual value,
place making
N.A.
Security
Safety is often cited as the first concern in public spaces and though its perception (to be
addressed in the lived dimension) being highly influenced by a number of factors, the presence
of lighting and municipality/security staff provide an immediate sense of safety.
Presence of security/municipality staff. Number of
reported incidences. Local data
Welcomeness; social cohesion;
sense of refuge; place makingN.A.
MATERIALISED BCD
UGS
Bio
logi
cal d
ive
rsit
y an
d U
GS
bio
ph
ysic
al s
tru
ctu
reW
elc
om
en
ess
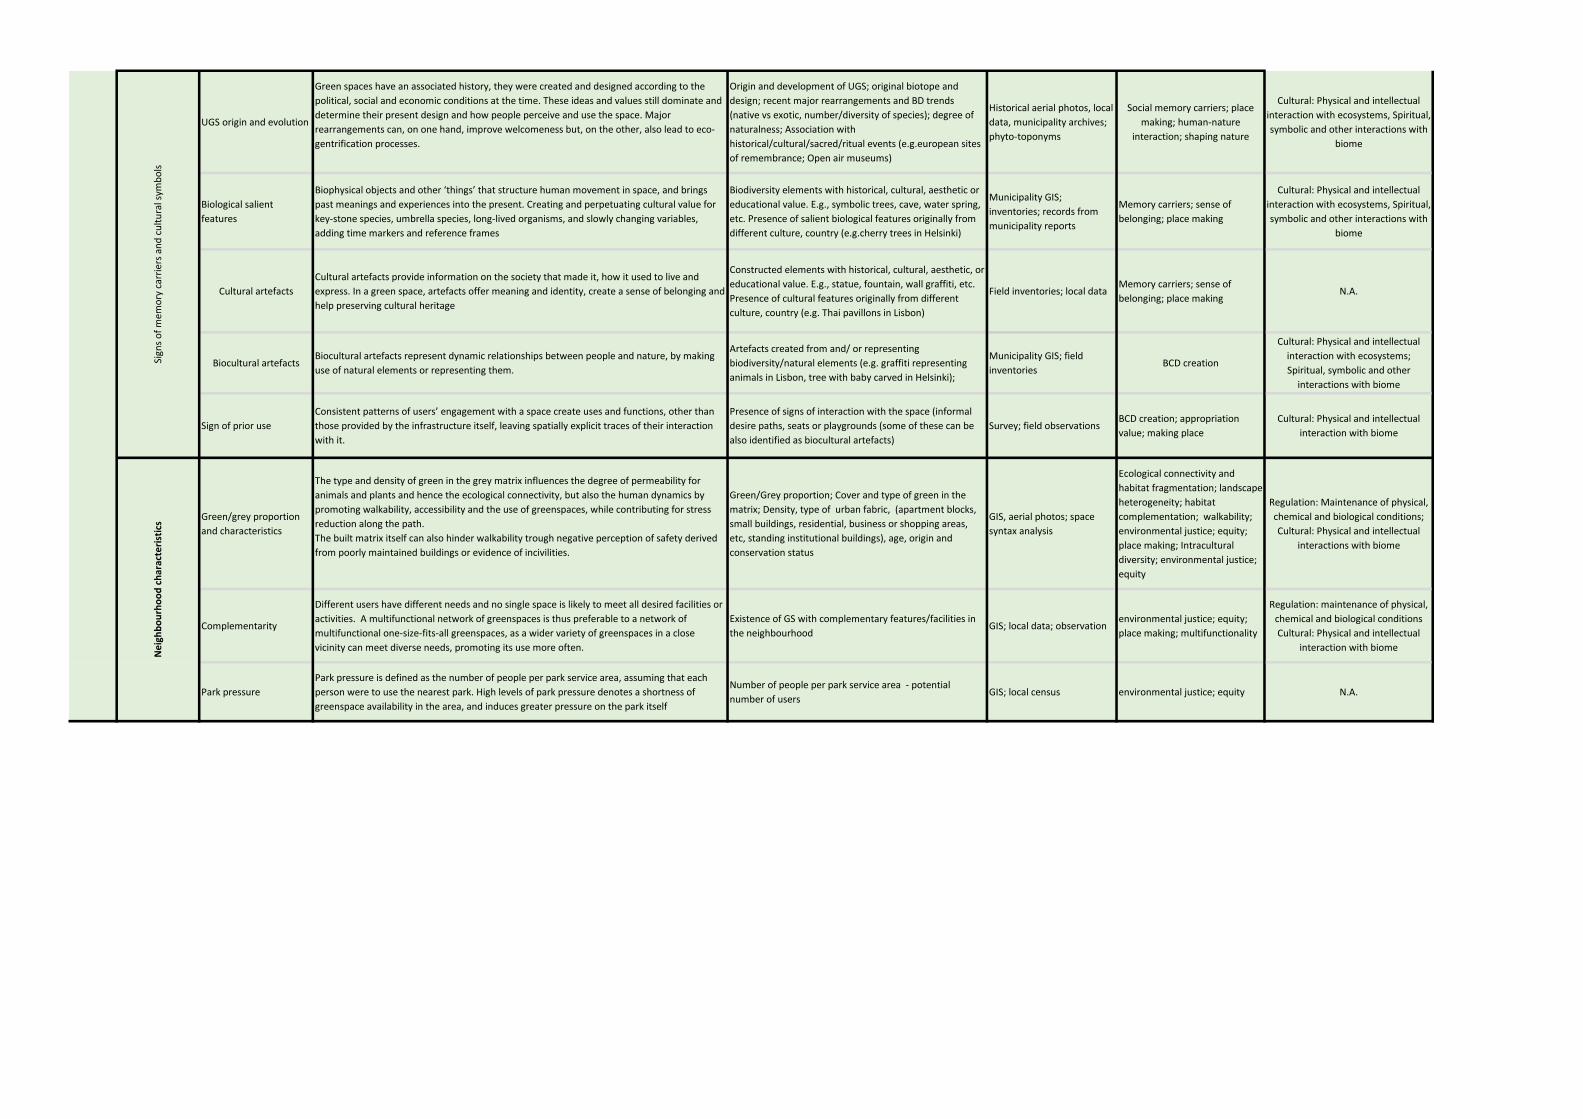
UGS origin and evolution
Green spaces have an associated history, they were created and designed according to the
political, social and economic conditions at the time. These ideas and values still dominate and
determine their present design and how people perceive and use the space. Major
rearrangements can, on one hand, improve welcomeness but, on the other, also lead to eco-
gentrification processes.
Origin and development of UGS; original biotope and
design; recent major rearrangements and BD trends
(native vs exotic, number/diversity of species); degree of
naturalness; Association with
historical/cultural/sacred/ritual events (e.g.european sites
of remembrance; Open air museums)
Historical aerial photos, local
data, municipality archives;
phyto-toponyms
Social memory carriers; place
making; human-nature
interaction; shaping nature
Cultural: Physical and intellectual
interaction with ecosystems, Spiritual,
symbolic and other interactions with
biome
Biological salient
features
Biophysical objects and other ‘things’ that structure human movement in space, and brings
past meanings and experiences into the present. Creating and perpetuating cultural value for
key-stone species, umbrella species, long-lived organisms, and slowly changing variables,
adding time markers and reference frames
Biodiversity elements with historical, cultural, aesthetic or
educational value. E.g., symbolic trees, cave, water spring,
etc. Presence of salient biological features originally from
different culture, country (e.g.cherry trees in Helsinki)
Municipality GIS;
inventories; records from
municipality reports
Memory carriers; sense of
belonging; place making
Cultural: Physical and intellectual
interaction with ecosystems, Spiritual,
symbolic and other interactions with
biome
Cultural artefacts
Cultural artefacts provide information on the society that made it, how it used to live and
express. In a green space, artefacts offer meaning and identity, create a sense of belonging and
help preserving cultural heritage
Constructed elements with historical, cultural, aesthetic, or
educational value. E.g., statue, fountain, wall graffiti, etc.
Presence of cultural features originally from different
culture, country (e.g. Thai pavillons in Lisbon)
Field inventories; local dataMemory carriers; sense of
belonging; place makingN.A.
Biocultural artefactsBiocultural artefacts represent dynamic relationships between people and nature, by making
use of natural elements or representing them.
Artefacts created from and/ or representing
biodiversity/natural elements (e.g. graffiti representing
animals in Lisbon, tree with baby carved in Helsinki);
Municipality GIS; field
inventoriesBCD creation
Cultural: Physical and intellectual
interaction with ecosystems;
Spiritual, symbolic and other
interactions with biome
Sign of prior use
Consistent patterns of users’ engagement with a space create uses and functions, other than
those provided by the infrastructure itself, leaving spatially explicit traces of their interaction
with it.
Presence of signs of interaction with the space (informal
desire paths, seats or playgrounds (some of these can be
also identified as biocultural artefacts)
Survey; field observationsBCD creation; appropriation
value; making place
Cultural: Physical and intellectual
interaction with biome
Green/grey proportion
and characteristics
The type and density of green in the grey matrix influences the degree of permeability for
animals and plants and hence the ecological connectivity, but also the human dynamics by
promoting walkability, accessibility and the use of greenspaces, while contributing for stress
reduction along the path.
The built matrix itself can also hinder walkability trough negative perception of safety derived
from poorly maintained buildings or evidence of incivilities.
Green/Grey proportion; Cover and type of green in the
matrix; Density, type of urban fabric, (apartment blocks,
small buildings, residential, business or shopping areas,
etc, standing institutional buildings), age, origin and
conservation status
GIS, aerial photos; space
syntax analysis
Ecological connectivity and
habitat fragmentation; landscape
heterogeneity; habitat
complementation; walkability;
environmental justice; equity;
place making; Intracultural
diversity; environmental justice;
equity
Regulation: Maintenance of physical,
chemical and biological conditions;
Cultural: Physical and intellectual
interactions with biome
Complementarity
Different users have different needs and no single space is likely to meet all desired facilities or
activities. A multifunctional network of greenspaces is thus preferable to a network of
multifunctional one-size-fits-all greenspaces, as a wider variety of greenspaces in a close
vicinity can meet diverse needs, promoting its use more often.
Existence of GS with complementary features/facilities in
the neighbourhoodGIS; local data; observation
environmental justice; equity;
place making; multifunctionality
Regulation: maintenance of physical,
chemical and biological conditions
Cultural: Physical and intellectual
interaction with biome
Park pressure
Park pressure is defined as the number of people per park service area, assuming that each
person were to use the nearest park. High levels of park pressure denotes a shortness of
greenspace availability in the area, and induces greater pressure on the park itself
Number of people per park service area - potential
number of usersGIS; local census environmental justice; equity N.A.
Ne
igh
bo
urh
oo
d c
har
acte
rist
ics
UGS
Sign
s o
f m
emo
ry c
arri
ers
and
cu
ltu
ral s
ymb
ols

Link with Planning principles
and/or challenges (WP5)
Need for
qualitative
methods and in-
depth analyses:
References: Here we
introduce most important
literature, methodological
books
Multifunctionality no
Multifunctionality; biodiversity
protection; climate changeno
Tews, 2003; Fischer, 2006;
Lovell, 2009; Dobbs, 2014;
Hunter, 2015
Multifunctionality; biodiversity
protection; climate changeno
Biggs, 2012; Elmqvist, 2013;
Keniger, 2013; Coutts, 2015
biodiversity protection;
multifunctionalityno Gould, 2000; Bailey, 2004
Multifunctionality; biodiversity
protection; climate changeno Beninde, 2015
Biodiversity protection; climate
changeno
Thackway, 2006; Greenberg,
2011; Le Roux, 2016
Multifunctionality; biodiversity
protection; climate changeno
Peterson, 1998; Diaz, 2001;
Tilman, 2001; Hooper, 2002;
Cornelissen, 2003; de Bello,
2010;Biggs, 2012; Goodness,
2016
Green-gray infrastructure
integration; multifunctionality;
connectivity; green economy,
social cohesion
noHolland, 2007; Mehta, 2014;
Ngom, 2015
Multifunctionality; green
economy; social cohesionno
Francis, 2012a;
Kazmierczak,2013; Mehta,
2014
Multifunctionality; social cohesion no Bertram, 2015; Mehta, 2014
Multifunctionality; social cohesion noDunnet, 2002; Holland, 2007;
Mehta, 2014; Bertram, 2015;
MATERIALISED BCD
Social cohesion; biodiversity
protection; multifunctionality;
climate change
yesLoukaitou-Sideris, 1995;
Byrne, 2009; Wolch, 2014
Biodiversity protection;
multifunctionality; social cohesionno Andersson, 2016
Multifunctionality; social cohesion;
green economyno
Andersson, 2016; Petersen,
2013; Axelsson, 2013
Multifunctionality; (biodiversity
protection) no Salick, 2014
Multifunctionality; social cohesion no Campbell, 2016
Connectivity; green-grey
integration; climate change;
biodiversity protection;
multifunctionality; social cohesion
no
Werner, 2011; Biggs, 2012;
Ellaway in Cooper (ed) 2014;
Mehta, 2014; Beninde, 2015;
Figueiredo, 2016; Sarkar,
2015; Soga, 2015; Marcus,
2016; Ward Thompson, 2016
Multifunctionality; green-gray
infrastructure integration;
connectivity; social cohesion
no
Loukaitou-Sideris, 1995;
Cattell, 2008; Dobson, 2012;
Soga, 2015
Social inclusion no Sister, 2007; Tan, 2016