Embed Size (px)
Citation preview

BCC PROJECT: LMR/NANSEN/1/10 CRUISE REPORTS “DR. FRIDTJOF NANSEN”
A TRANSBOUNDARY STUDY OF THE PELAGIC FISH STOCKS OF SOUTHERN
ANGOLA AND NORTHERN NAMBIA
BCC Cruise Report No 2/2012
22 September – 06 October 2012
by
Jens-Otto Krakstad1, Aristóteles P. da S. Amaro
2 and Vaino Shigwedha
3
1) Institute of Marine Research, Bergen, Norway
2) Instituto Nacional de Investigação Pesqueira, Luanda, Angola
3) National Marine Information and Research Centre, Swakopmund, Namibia
Bergen 2012
BCC Project: LMR/NANSEN/1/10
2
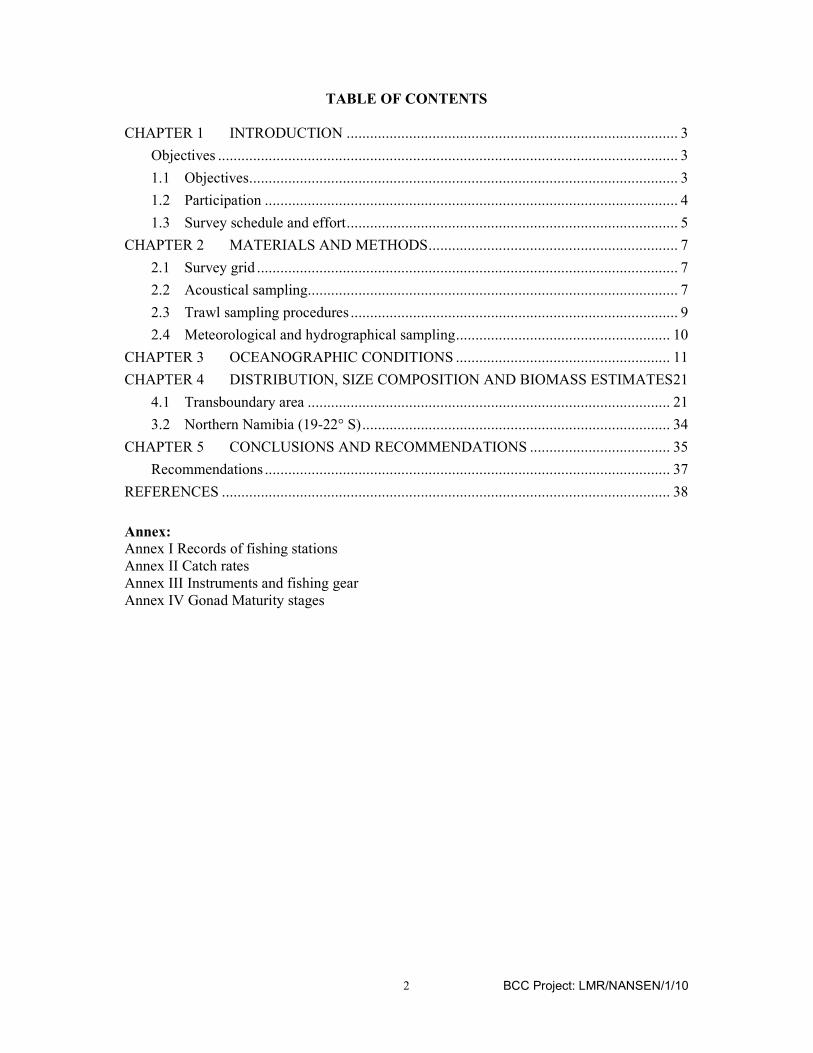
TABLE OF CONTENTS
CHAPTER 1 INTRODUCTION ..................................................................................... 3
Objectives ...................................................................................................................... 3
1.1 Objectives .............................................................................................................. 3
1.2 Participation .......................................................................................................... 4
1.3 Survey schedule and effort ..................................................................................... 5
CHAPTER 2 MATERIALS AND METHODS ................................................................ 7
2.1 Survey grid ............................................................................................................ 7
2.2 Acoustical sampling ............................................................................................... 7
2.3 Trawl sampling procedures .................................................................................... 9
2.4 Meteorological and hydrographical sampling ....................................................... 10
CHAPTER 3 OCEANOGRAPHIC CONDITIONS ....................................................... 11
CHAPTER 4 DISTRIBUTION, SIZE COMPOSITION AND BIOMASS ESTIMATES 21
4.1 Transboundary area ............................................................................................. 21
3.2 Northern Namibia (19-22° S) ............................................................................... 34
CHAPTER 5 CONCLUSIONS AND RECOMMENDATIONS .................................... 35
Recommendations ........................................................................................................ 37
REFERENCES ................................................................................................................... 38
Annex:
Annex I Records of fishing stations Annex II Catch rates Annex III Instruments and fishing gear Annex IV Gonad Maturity stages
BCC Project: LMR/NANSEN/1/10
3
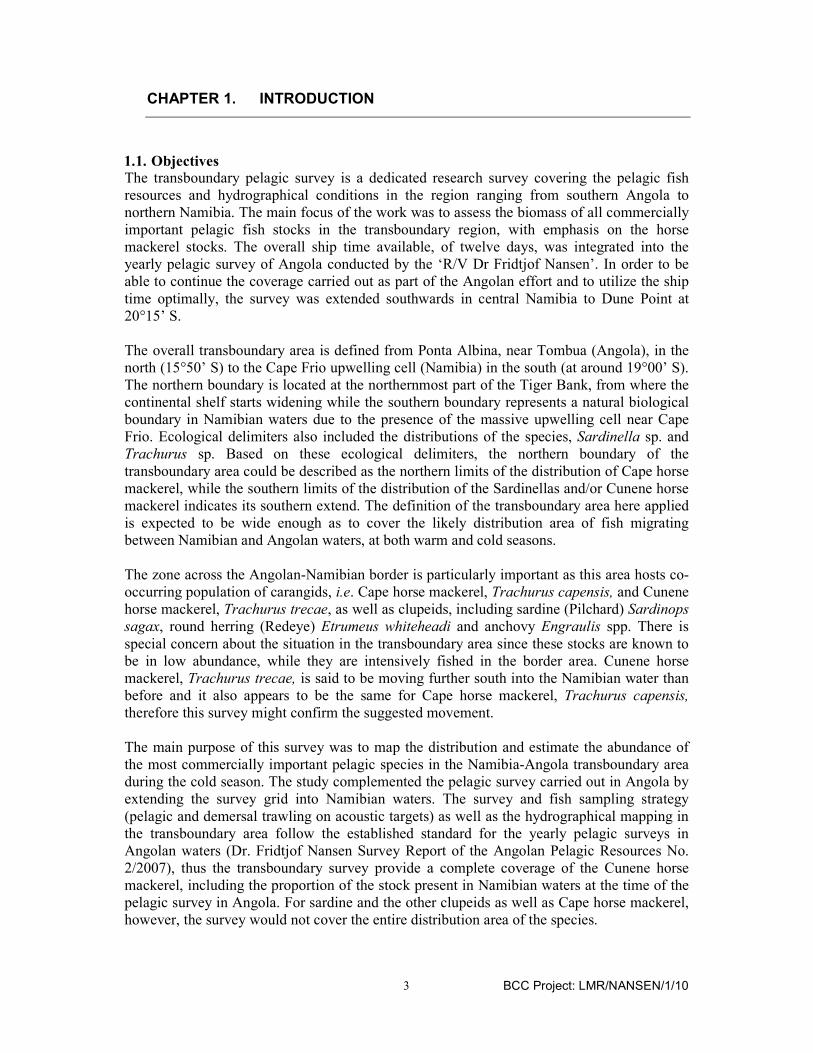
CHAPTER 1. INTRODUCTION
1.1. Objectives The transboundary pelagic survey is a dedicated research survey covering the pelagic fish resources and hydrographical conditions in the region ranging from southern Angola to northern Namibia. The main focus of the work was to assess the biomass of all commercially important pelagic fish stocks in the transboundary region, with emphasis on the horse mackerel stocks. The overall ship time available, of twelve days, was integrated into the yearly pelagic survey of Angola conducted by the ‘R/V Dr Fridtjof Nansen’. In order to be able to continue the coverage carried out as part of the Angolan effort and to utilize the ship time optimally, the survey was extended southwards in central Namibia to Dune Point at 20°15’ S. The overall transboundary area is defined from Ponta Albina, near Tombua (Angola), in the north (15°50’ S) to the Cape Frio upwelling cell (Namibia) in the south (at around 19°00’ S). The northern boundary is located at the northernmost part of the Tiger Bank, from where the continental shelf starts widening while the southern boundary represents a natural biological boundary in Namibian waters due to the presence of the massive upwelling cell near Cape Frio. Ecological delimiters also included the distributions of the species, Sardinella sp. and Trachurus sp. Based on these ecological delimiters, the northern boundary of the transboundary area could be described as the northern limits of the distribution of Cape horse mackerel, while the southern limits of the distribution of the Sardinellas and/or Cunene horse mackerel indicates its southern extend. The definition of the transboundary area here applied is expected to be wide enough as to cover the likely distribution area of fish migrating between Namibian and Angolan waters, at both warm and cold seasons. The zone across the Angolan-Namibian border is particularly important as this area hosts co-occurring population of carangids, i.e. Cape horse mackerel, Trachurus capensis, and Cunene horse mackerel, Trachurus trecae, as well as clupeids, including sardine (Pilchard) Sardinops
sagax, round herring (Redeye) Etrumeus whiteheadi and anchovy Engraulis spp. There is special concern about the situation in the transboundary area since these stocks are known to be in low abundance, while they are intensively fished in the border area. Cunene horse mackerel, Trachurus trecae, is said to be moving further south into the Namibian water than before and it also appears to be the same for Cape horse mackerel, Trachurus capensis, therefore this survey might confirm the suggested movement. The main purpose of this survey was to map the distribution and estimate the abundance of the most commercially important pelagic species in the Namibia-Angola transboundary area during the cold season. The study complemented the pelagic survey carried out in Angola by extending the survey grid into Namibian waters. The survey and fish sampling strategy (pelagic and demersal trawling on acoustic targets) as well as the hydrographical mapping in the transboundary area follow the established standard for the yearly pelagic surveys in Angolan waters (Dr. Fridtjof Nansen Survey Report of the Angolan Pelagic Resources No. 2/2007), thus the transboundary survey provide a complete coverage of the Cunene horse mackerel, including the proportion of the stock present in Namibian waters at the time of the pelagic survey in Angola. For sardine and the other clupeids as well as Cape horse mackerel, however, the survey would not cover the entire distribution area of the species.
BCC Project: LMR/NANSEN/1/10
4
The estimates presented are relative indices of the proportion of the stock units distributed within the transboundary area at the time of the survey, not absolute estimates of abundance, and so the population estimates should not be interpreted in absolute terms. For sardine, Cape horse mackerel and other pelagic (clupeids) the estimates do not cover the entire distribution of the sardine stock, of which e.g. sardine is known to migrate between Angolan and Namibian waters, and differences from one year to another may well be caused by migration patterns rather than population changes. As for all acoustic estimates, the indices presented here are prone to survey errors such as statistical sampling errors, vessel avoidance and the availability to acoustic sampling (Anon. 2003, 2004). 1.2. Objectives The main objectives of the survey were the following:
• To map the distribution and estimate the abundance of the most commercially important pelagic species in the Namibia-Angola transboundary area (15°50-19°00’), following the survey design utilized in Angolan waters (6 n.mi spacing between transect lines), with special emphasis on the two horse mackerel Cunene horse mackerel (Trachurus trecae) and Cape horse mackerel (Trachurus capensis), sardine “Pilchard” (Sardinops sagax) and other small pelagic species, including anchovy (Engraulis capensis) and round herring (Etrumeus whiteheadi).
• To map the distributions and estimate the abundance of the same species in central Namibia south to Dune Point (20°15’ S), following the established survey design with 10 n.mi spacing between the transect lines.
• To study and analyse the biological state of the main species, including length
frequencies, length-weight relationships, reproductive stages and length-at-maturity.
• To map the meteorological and hydrographical conditions in the survey area by means of continuous recordings of weather data such as Sea-surface temperature (SST), Sea-surface salinity (SSS), wind speed and direction, using CTD-casts (Temperature, Salinity and Oxygen).
1.3. Participation
The following scientific staff participated in the survey: From INIP, Angola: Aristoteles P. Da S. Amaro (Angolan team leader), Bomba Basíca Nsangolay, João Morais Domingos, Antonio Buco, Eridson Saquenha, Marisa F. De N. Macueria, Fátima Delicado, Geraldina Salvador and Eusébio Dos Santos. From NatMIRC, Namibia: Vaino Shigwedha (Namibian team leader) and Justine Kakuuai. From IMR, Norway: Jens Otto Krakstad (cruise leader), Diana Zaera, Tore Mørk and Jarle Kristiansen.
BCC Project: LMR/NANSEN/1/10
5
1.4. Survey schedule and effort
A full transceiver calibration of the 18, 38 and 120 and 200 kHz transducers was carried out prior to the survey. The calibration was done in Baía dos Elephantes, Angola, on 18th of September. The 200 kHz transducer was malfunctioning and no calibration was attempted. The vessel completed the pelagic survey in Angola, including the Angolan part of the transboundary area, and reached the Angolan-Namibian border at the Cunene River (17°15’ S) on the 25th of September. The coverage of the transboundary area south to Rocky Point at 19°00’S was completed on 3nd October. The survey was extended southwards and it ended at 20°15’S the 4th October, where the course track was then completed. The vessel docked in Walvis Bay 5th October in the evening.
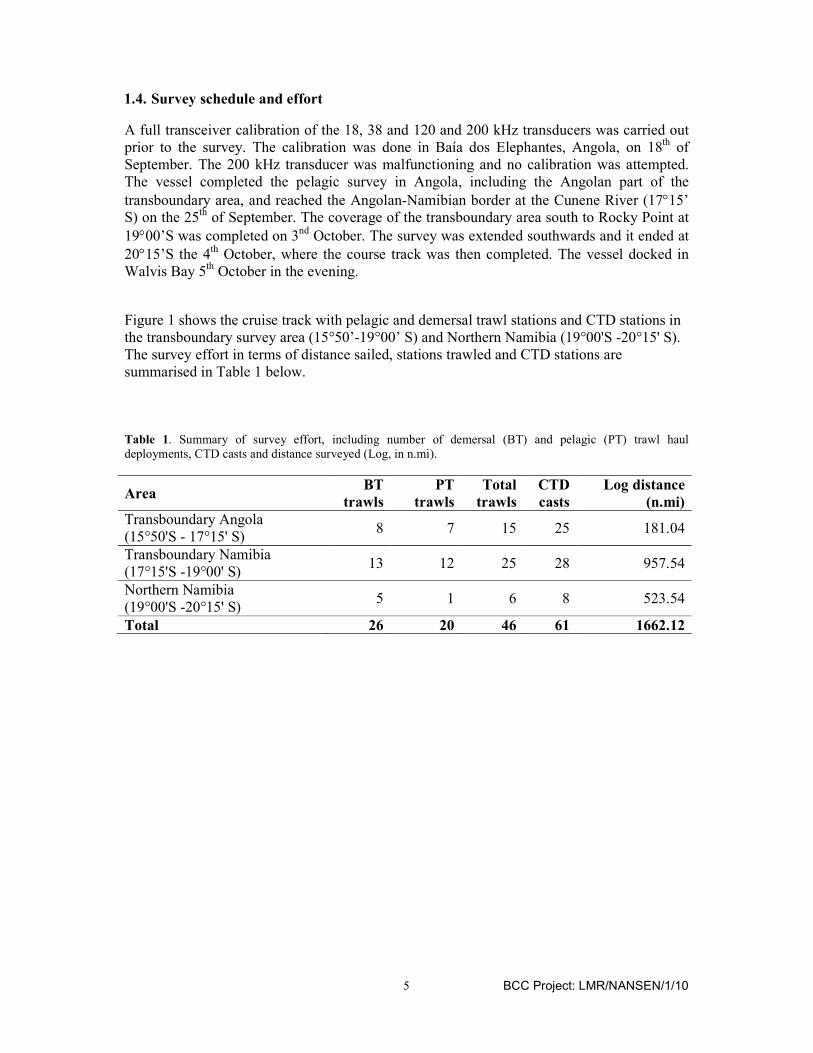
Table 1. Summary of survey effort, including number of demersal (BT) and pelagic (PT) trawl haul deployments, CTD casts and distance surveyed (Log, in n.mi).
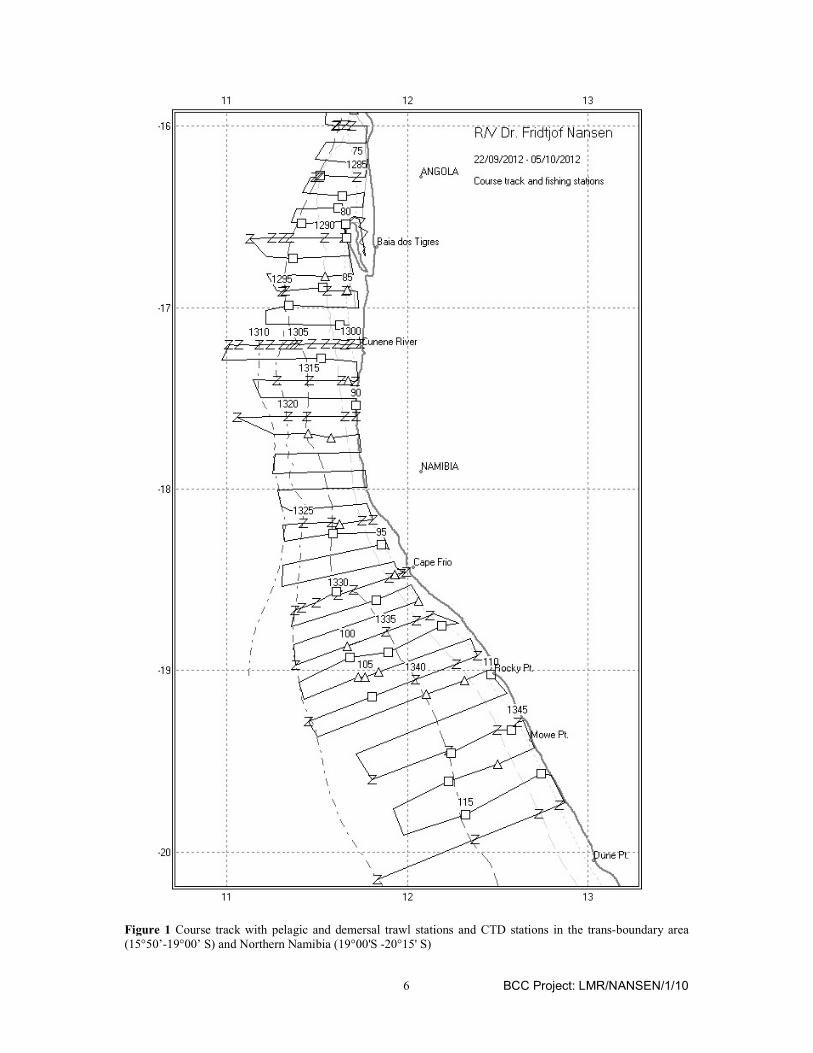
Figure 1 shows the cruise track with pelagic and demersal trawl stations and CTD stations in the transboundary survey area (15°50’-19°00’ S) and Northern Namibia (19°00'S -20°15' S). The survey effort in terms of distance sailed, stations trawled and CTD stations are summarised in Table 1 below.
Area BT
trawls
PT
trawls
Total
trawls
CTD
casts
Log distance
(n.mi)
Transboundary Angola (15°50'S - 17°15' S)
8 7 15 25 181.04
Transboundary Namibia (17°15'S -19°00' S)
13 12 25 28 957.54
Northern Namibia (19°00'S -20°15' S)
5 1 6 8 523.54
Total 26 20 46 61 1662.12
BCC Project: LMR/NANSEN/1/10
6
Figure 1 Course track with pelagic and demersal trawl stations and CTD stations in the trans-boundary area (15°50’-19°00’ S) and Northern Namibia (19°00'S -20°15' S)
BCC Project: LMR/NANSEN/1/10
7
CHAPTER 2. MATERIALS AND METHODS
2.1. Survey grid The survey design of equidistant pseudo-parallel transects (6 nautical miles apart) perpendicular to the coastline, as applied in Angola, was also followed in the extension into Namibian waters (Fig. 1), following the established practice for the transboundary surveys. Transects generally covered a depth range of 20-500 meters. As in previous surveys, some of the lines had to be stopped at 30-35 m depth due to the steeply inclining bottom near the shoreline. A few transect lines in the border area from the Cunene River to Cape Frio were extended to the 2000 m isobaths in order to check for possible offshore aggregations of horse mackerel. This strategy ensured that the Namibian component of the transboundary area was covered in a way that was comparable to the data already collected in Angola. In this way, distribution maps and biomass estimates could be drawn across the border area. 2.2. Acoustical sampling A standard sphere calibration was carried out at Baía dos Elephantes in Angola, on 18th of September 2012, before commencement of the survey. Standard calibration procedures were followed using the appropriate calibration spheres (18, 38 and 120 and kHz). The 200 kHz transducer was malfunctioning during the survey and no calibration was attempted. There were no significant deviations from the previous calibrations and subsequently no changes in the calibration parameters were made prior to the survey. The acoustic recordings were conducted using two Simrad ER 60 echosounders with keel mounted transducers at nominal operating frequencies of 18, 38 and 120 kHz. The technical specifications and operational settings of the echosounder used during the survey are given in Annex III. Acoustic data were post-processed using the latest acoustic data post-processing software, the Large Scale Survey System (LSSS) Version 1.61. The mean 5 n.mi area backscattering coefficients sA (m
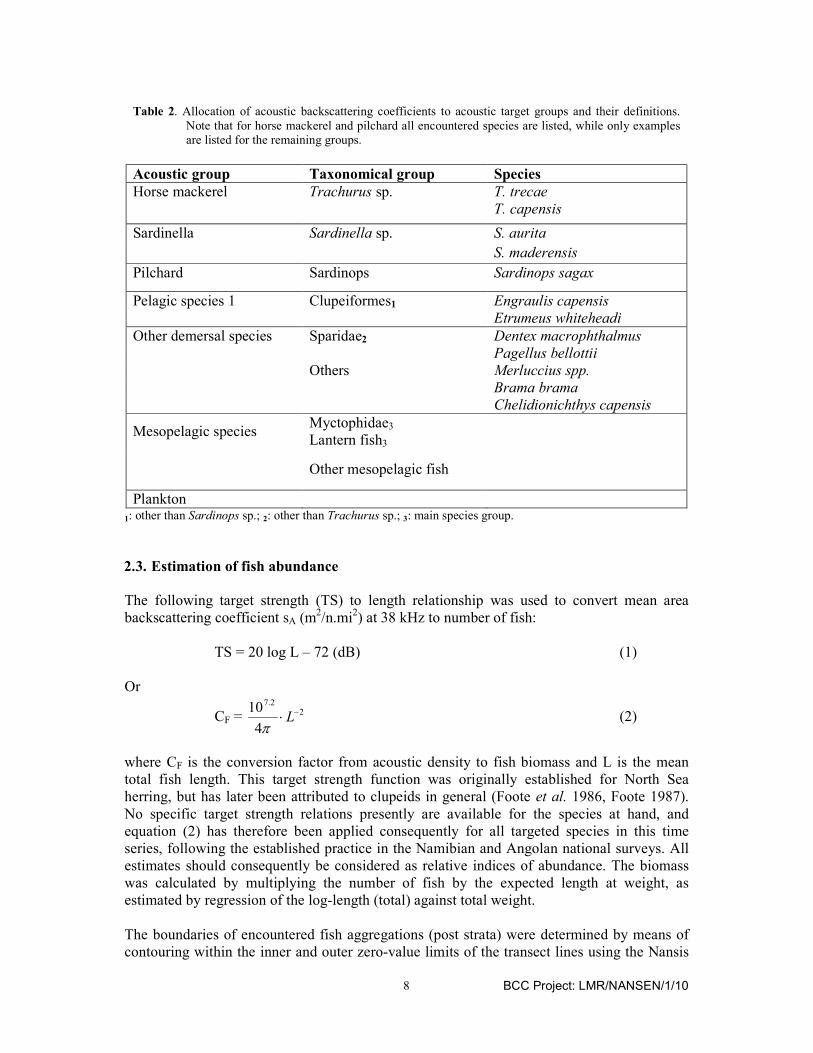
2/n.mi2) were allocated to a predefined set of acoustic target groups on the basis of characteristic echogram features in conjunction with information about the species - and size compositions - as derived from the trawl catches. Definitions of the acoustic target groups are given in Table 2 below.
BCC Project: LMR/NANSEN/1/10
8
Table 2. Allocation of acoustic backscattering coefficients to acoustic target groups and their definitions.
Note that for horse mackerel and pilchard all encountered species are listed, while only examples are listed for the remaining groups.
Acoustic group Taxonomical group Species
Horse mackerel Trachurus sp. T. trecae
T. capensis
Sardinella Sardinella sp. S. aurita
S. maderensis
Pilchard Sardinops Sardinops sagax
Pelagic species 1 Clupeiformes1 Engraulis capensis
Etrumeus whiteheadi
Other demersal species Sparidae2 Dentex macrophthalmus
Pagellus bellottii
Others Merluccius spp.
Brama brama
Chelidionichthys capensis
Mesopelagic species Myctophidae3
Lantern fish3
Other mesopelagic fish
Plankton
1: other than Sardinops sp.; 2: other than Trachurus sp.; 3: main species group.
2.3. Estimation of fish abundance The following target strength (TS) to length relationship was used to convert mean area backscattering coefficient sA (m2/n.mi2) at 38 kHz to number of fish:
TS = 20 log L – 72 (dB) (1) Or
CF = 22.7
4
10 −⋅ Lπ
(2)
where CF is the conversion factor from acoustic density to fish biomass and L is the mean total fish length. This target strength function was originally established for North Sea herring, but has later been attributed to clupeids in general (Foote et al. 1986, Foote 1987). No specific target strength relations presently are available for the species at hand, and equation (2) has therefore been applied consequently for all targeted species in this time series, following the established practice in the Namibian and Angolan national surveys. All estimates should consequently be considered as relative indices of abundance. The biomass was calculated by multiplying the number of fish by the expected length at weight, as estimated by regression of the log-length (total) against total weight. The boundaries of encountered fish aggregations (post strata) were determined by means of contouring within the inner and outer zero-value limits of the transect lines using the Nansis

BCC Project: LMR/NANSEN/1/10
9
Maptool software. Unfortunately, severe problems with the Nansis Maptool software precluded the definition of the aggregation polygons which considerably delayed the process of finalizing the abundance estimates. Distribution plots and areal calculations on the strata were carried out using IDL 5.6 for MS Windows. Sub-stratification was used to isolate areas of similar densities, using the following pre-defined, standard categories: 1: sA = 0-300; 2: sA = 300-1,000; 3: sA = 1,000-3,000; 4: sA > 3,000. Mean 5-n.mi integrator values (sA) computed along the transect lines were re-averaged for each stratum. The overall length frequency distributions within strata were estimated by weighting the sample-distributions with the nearest valid 5 n.mi integrator value, or the average of two adjacent values. The total number of fish in each length group was estimated as:
s
i Fi
i
ijiA
i A
C
u
uts⋅
⋅><=
∑
,ρ =
∑ +⋅
⋅><⋅⋅⋅
i
ii
sAiji
Lu
Asut
2
,2.7
)5.0(4
10
π
(3)
where: ρi = estimated number of fish in length group i <sA> = mean recorded area backscattering coefficient (m2/n.mi2) ti,j = proportion of species j sampled in length group i ui = proportion of fish sampled in length group i As = horizontal area of stratum s CFi = conversion factor for length group i Li = length group i (nearest full cm below total length) Li+0.5 = mean length in Li. 2.4. Trawl sampling procedures
Targeted trawling was carried out on identified acoustic targets using the smallest pelagic sample trawl (10 m vertical opening), the mid-sized pelagic sample trawl (12 m) and the demersal sample trawl (5 m). Samples were taken in baskets on deck and weighed, and the number of fish of each species was determined from a subsample of the collected sample. Scanmar sensors provided real-time information of the depth of the head rope, the vertical opening of the mouth of the trawl and the clearance between the ground gear and the bottom. The trawl eye and catch sensor gave information of fish entering into the trawl and the catch retained in the codend, respectively. All trawl catches were sampled for species composition by weight and numbers. Records of catch rates are given in Annex II. Other species (mostly of commercial value) were collected and identified to species level and length measurements were taken (Table 2). 2.5. Biological sampling
Samples of the main target species Trachurus capensis, Trachurus trecae and Sardinops sagax, as well as Etrumeus whiteheadi and Engraulis capensis were collected and measured for length and weight. Total length and body weight were determined to the nearest cm and g below, respectively. Sex and reproductive stages were determined by means of macroscopic examination, scoring each fish according to the six-point classification scale used during Angolan national surveys (Annex IV). Length-weight relationships of target species were

BCC Project: LMR/NANSEN/1/10
10
determined from the regression analysis (power fit, a, b) of the total weight to the total length recorded for all sampled specimens. W = a Lb
2.6. Meteorological and hydrographical sampling Wind direction and speed, air temperature, global radiation and sea surface temperature (at 5 m depth) were recorded using the Norwegian Meteorological Institute’s (DNMI) meteorological station on board. Values averaged over 10 min intervals were logged continuously. The weather station data were logged continuously throughout the survey. The results presented in this report are based on a standard output from the logging system, i.e. one nautical mile averages along the ship’s track. A Seabird 911+ CTD probe was used to obtain vertical profiles of the temperature, salinity and oxygen. Real time logging was carried out using the PC based Seabird Seasave software. CTD casts were conducted along the cruise track in transects at CTD lines with 60 n.mi distance and on every 2nd transect at 200, 100 and 50 m depths. The casts were stopped a few meters above the bottom. Hydrographical sections were carried out at Pta. Albina, Baía dos Tigres, Cunene River (17°15’ S), Cape Frio and at standard sections.
BCC Project: LMR/NANSEN/1/10
11
CHAPTER 3. OCEANOGRAPHIC CONDITIONS
3.1. Wind
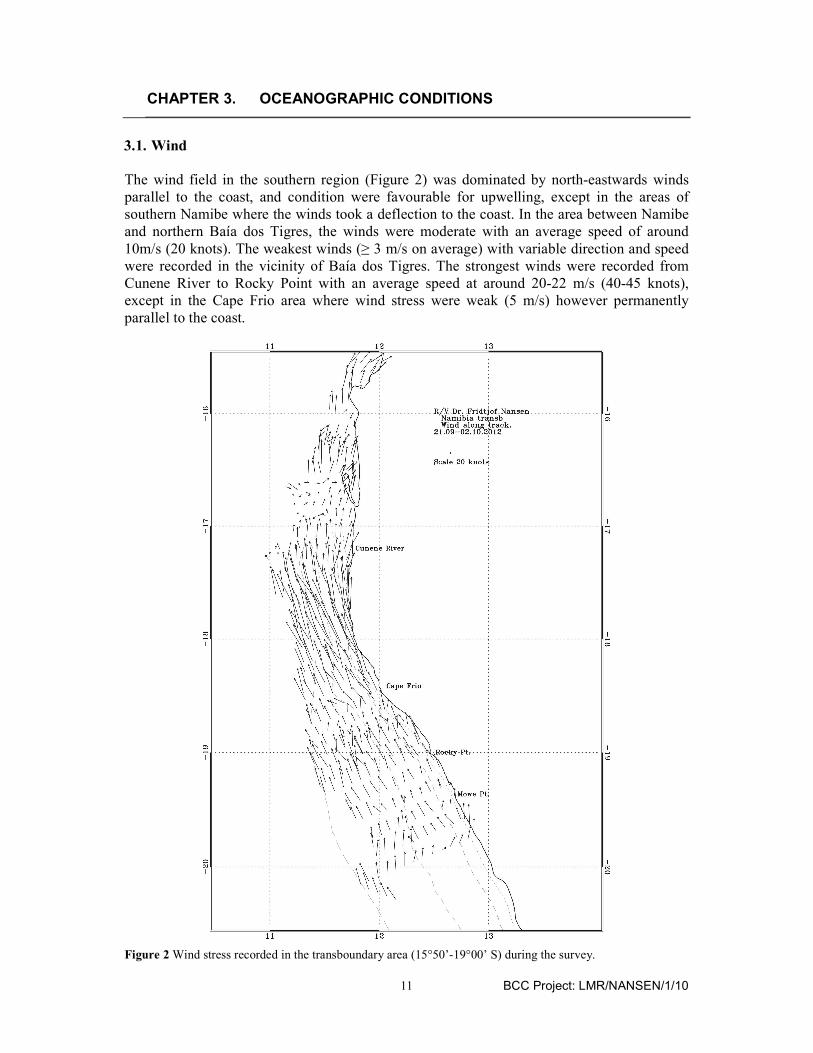
The wind field in the southern region (Figure 2) was dominated by north-eastwards winds parallel to the coast, and condition were favourable for upwelling, except in the areas of southern Namibe where the winds took a deflection to the coast. In the area between Namibe and northern Baía dos Tigres, the winds were moderate with an average speed of around 10m/s (20 knots). The weakest winds (≥ 3 m/s on average) with variable direction and speed were recorded in the vicinity of Baía dos Tigres. The strongest winds were recorded from Cunene River to Rocky Point with an average speed at around 20-22 m/s (40-45 knots), except in the Cape Frio area where wind stress were weak (5 m/s) however permanently parallel to the coast.
Figure 2 Wind stress recorded in the transboundary area (15°50’-19°00’ S) during the survey.
BCC Project: LMR/NANSEN/1/10
12
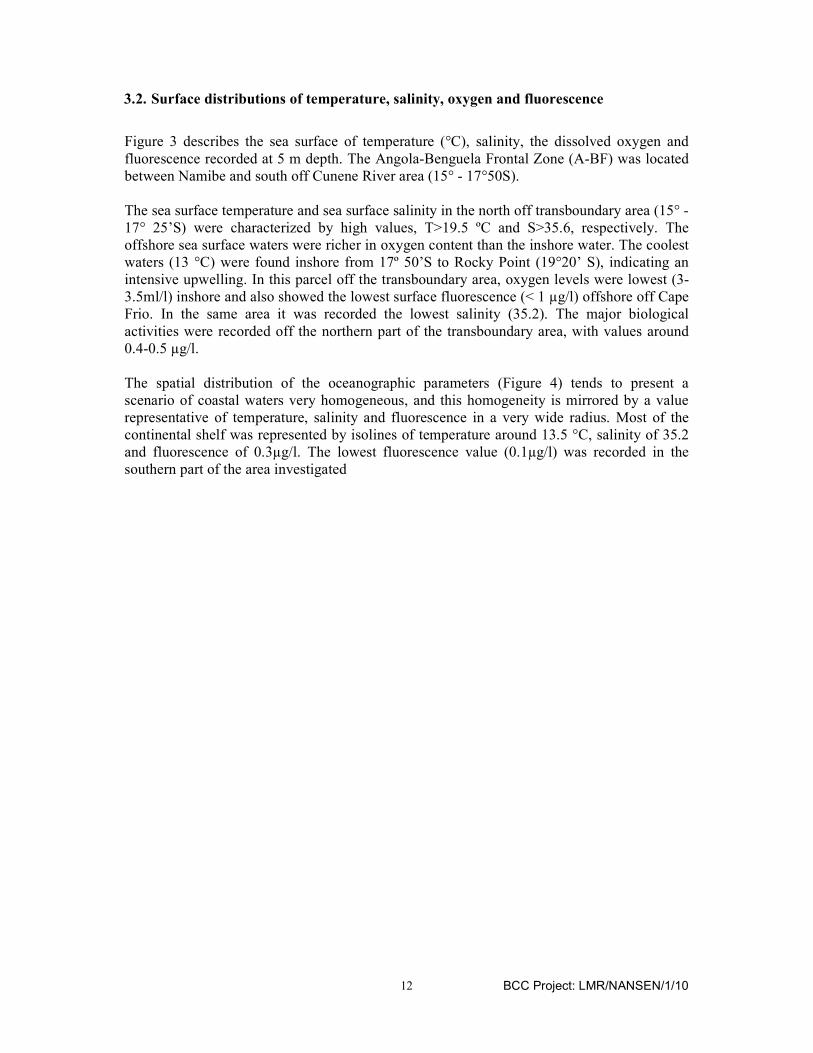
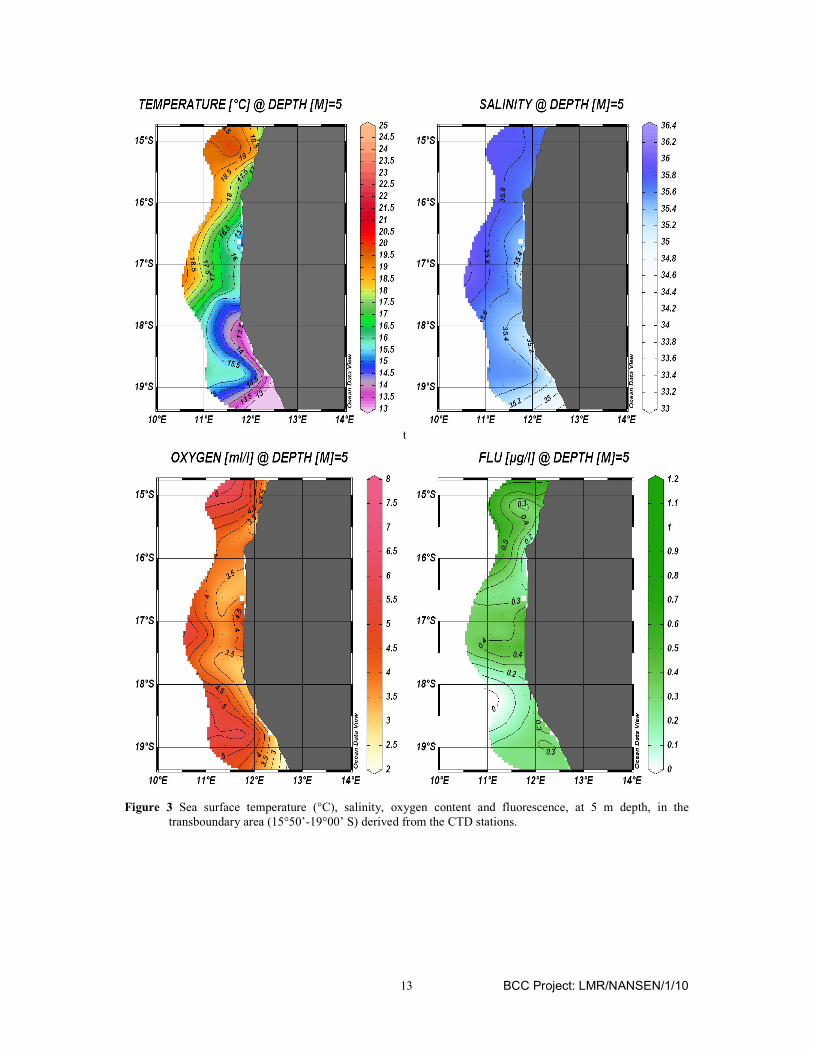
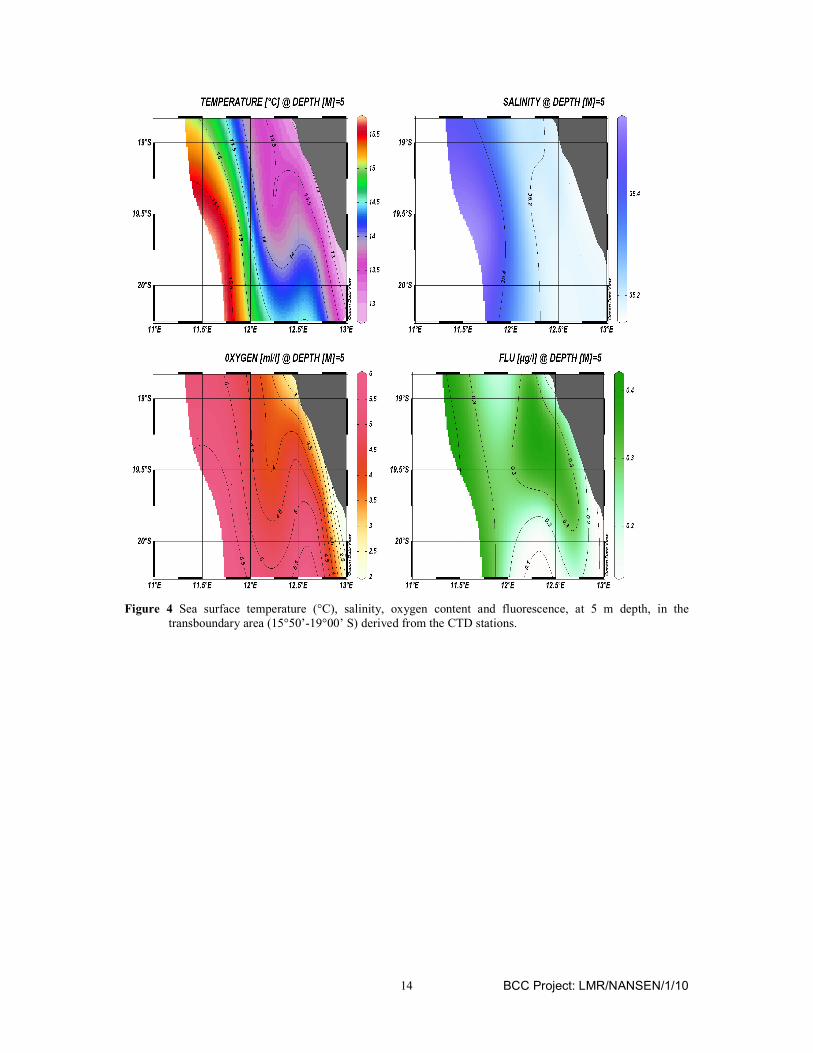
3.2. Surface distributions of temperature, salinity, oxygen and fluorescence
Figure 3 describes the sea surface of temperature (°C), salinity, the dissolved oxygen and fluorescence recorded at 5 m depth. The Angola-Benguela Frontal Zone (A-BF) was located between Namibe and south off Cunene River area (15° - 17°50S). The sea surface temperature and sea surface salinity in the north off transboundary area (15° -17° 25’S) were characterized by high values, T>19.5 ºC and S>35.6, respectively. The offshore sea surface waters were richer in oxygen content than the inshore water. The coolest waters (13 °C) were found inshore from 17º 50’S to Rocky Point (19°20’ S), indicating an intensive upwelling. In this parcel off the transboundary area, oxygen levels were lowest (3-3.5ml/l) inshore and also showed the lowest surface fluorescence (< 1 µg/l) offshore off Cape Frio. In the same area it was recorded the lowest salinity (35.2). The major biological activities were recorded off the northern part of the transboundary area, with values around 0.4-0.5 µg/l. The spatial distribution of the oceanographic parameters (Figure 4) tends to present a scenario of coastal waters very homogeneous, and this homogeneity is mirrored by a value representative of temperature, salinity and fluorescence in a very wide radius. Most of the continental shelf was represented by isolines of temperature around 13.5 °C, salinity of 35.2 and fluorescence of 0.3µg/l. The lowest fluorescence value (0.1µg/l) was recorded in the southern part of the area investigated
BCC Project: LMR/NANSEN/1/10
13
t
Figure 3 Sea surface temperature (°C), salinity, oxygen content and fluorescence, at 5 m depth, in the
transboundary area (15°50’-19°00’ S) derived from the CTD stations.
BCC Project: LMR/NANSEN/1/10
14
Figure 4 Sea surface temperature (°C), salinity, oxygen content and fluorescence, at 5 m depth, in the
transboundary area (15°50’-19°00’ S) derived from the CTD stations.
BCC Project: LMR/NANSEN/1/10
15
3.3. Vertical hydrographical sections
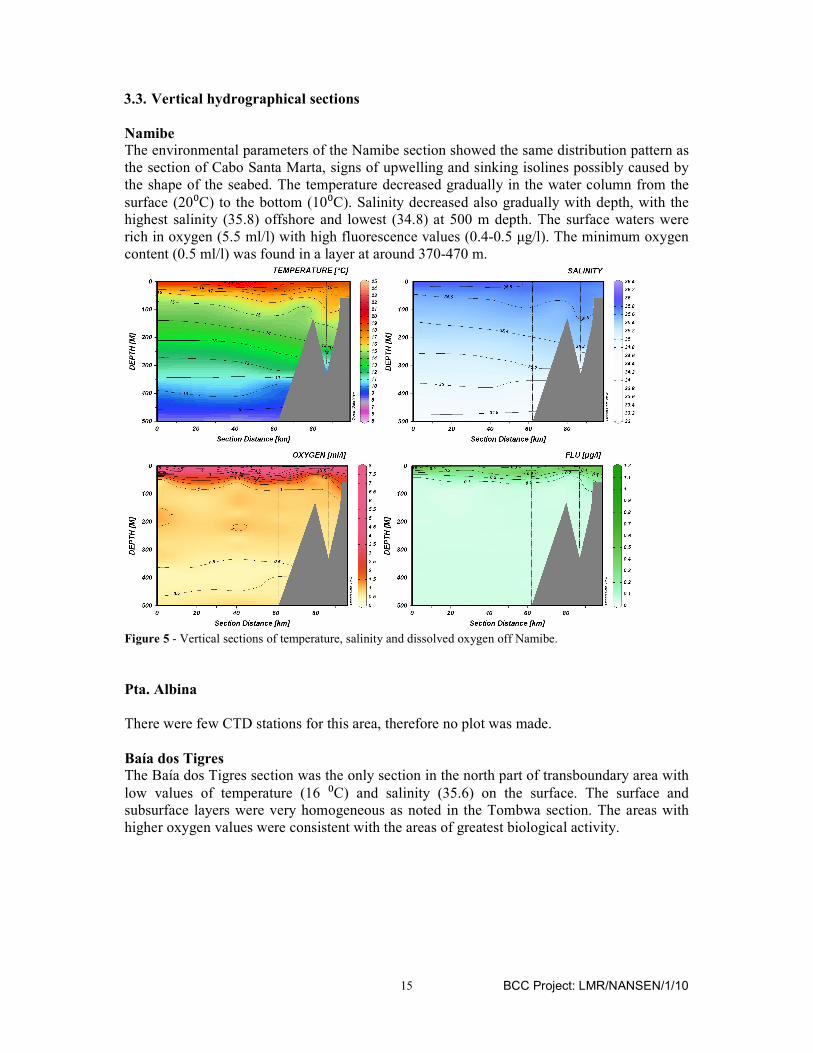
Namibe The environmental parameters of the Namibe section showed the same distribution pattern as the section of Cabo Santa Marta, signs of upwelling and sinking isolines possibly caused by the shape of the seabed. The temperature decreased gradually in the water column from the surface (20⁰C) to the bottom (10⁰C). Salinity decreased also gradually with depth, with the highest salinity (35.8) offshore and lowest (34.8) at 500 m depth. The surface waters were rich in oxygen (5.5 ml/l) with high fluorescence values (0.4-0.5 µg/l). The minimum oxygen content (0.5 ml/l) was found in a layer at around 370-470 m.
Figure 5 - Vertical sections of temperature, salinity and dissolved oxygen off Namibe.
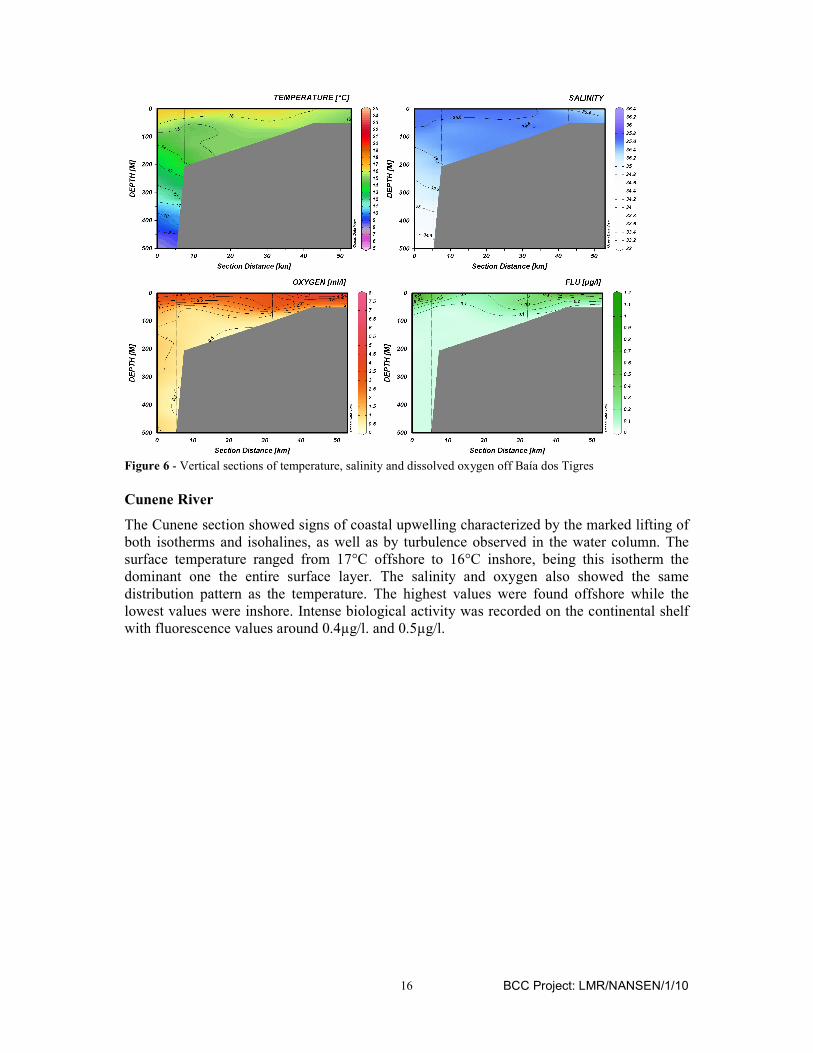
Pta. Albina There were few CTD stations for this area, therefore no plot was made. Baía dos Tigres The Baía dos Tigres section was the only section in the north part of transboundary area with low values of temperature (16 ⁰C) and salinity (35.6) on the surface. The surface and subsurface layers were very homogeneous as noted in the Tombwa section. The areas with higher oxygen values were consistent with the areas of greatest biological activity.
BCC Project: LMR/NANSEN/1/10
16
Figure 6 - Vertical sections of temperature, salinity and dissolved oxygen off Baía dos Tigres
Cunene River
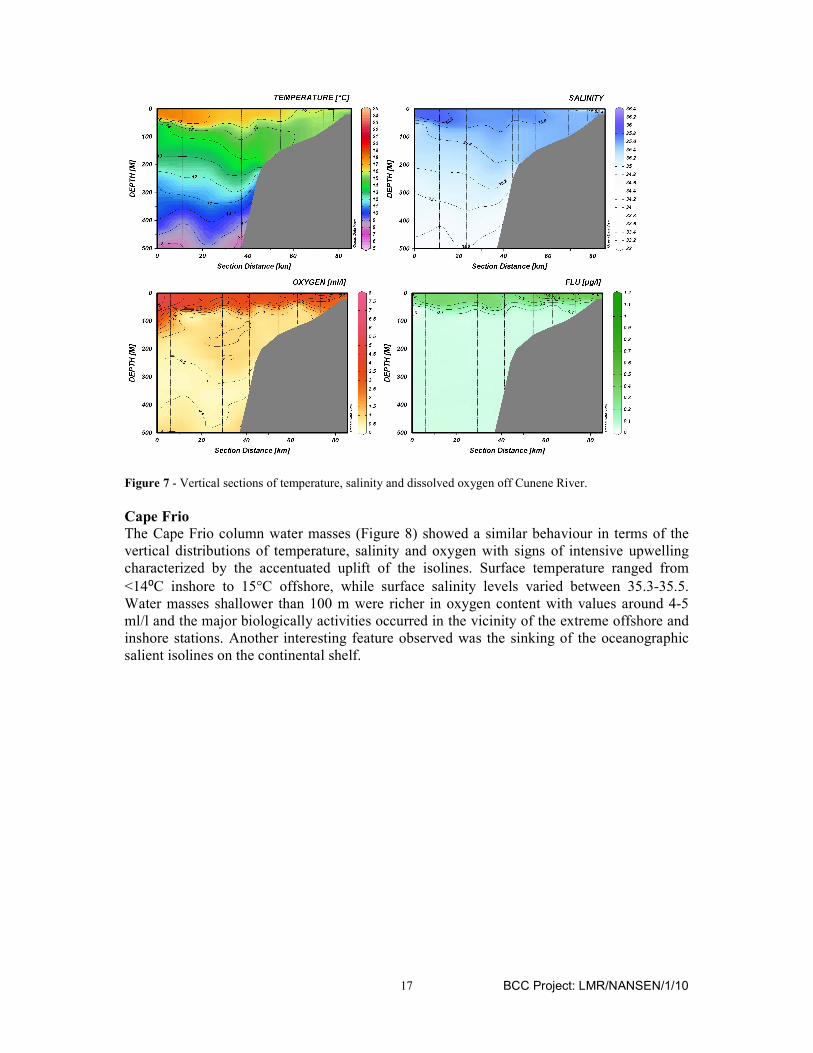
The Cunene section showed signs of coastal upwelling characterized by the marked lifting of both isotherms and isohalines, as well as by turbulence observed in the water column. The surface temperature ranged from 17°C offshore to 16°C inshore, being this isotherm the dominant one the entire surface layer. The salinity and oxygen also showed the same distribution pattern as the temperature. The highest values were found offshore while the lowest values were inshore. Intense biological activity was recorded on the continental shelf with fluorescence values around 0.4µg/l. and 0.5µg/l.
BCC Project: LMR/NANSEN/1/10
17
Figure 7 - Vertical sections of temperature, salinity and dissolved oxygen off Cunene River.
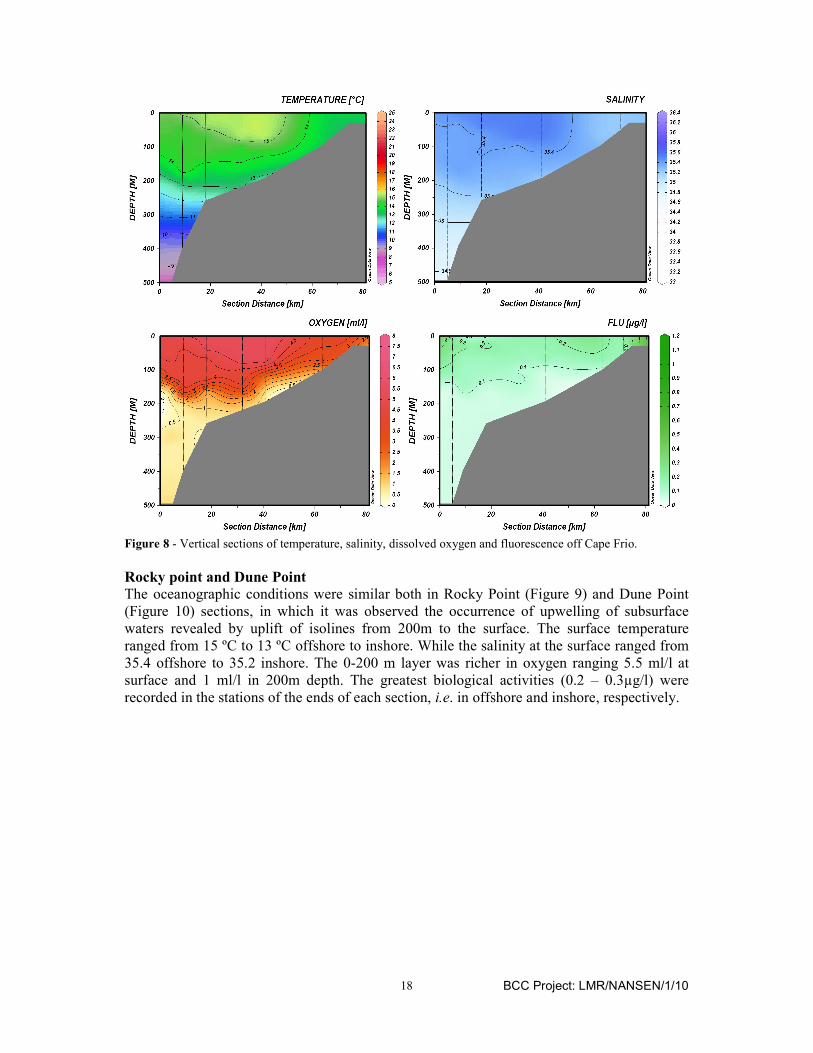
Cape Frio
The Cape Frio column water masses (Figure 8) showed a similar behaviour in terms of the vertical distributions of temperature, salinity and oxygen with signs of intensive upwelling characterized by the accentuated uplift of the isolines. Surface temperature ranged from <14⁰C inshore to 15°C offshore, while surface salinity levels varied between 35.3-35.5. Water masses shallower than 100 m were richer in oxygen content with values around 4-5 ml/l and the major biologically activities occurred in the vicinity of the extreme offshore and inshore stations. Another interesting feature observed was the sinking of the oceanographic salient isolines on the continental shelf.
BCC Project: LMR/NANSEN/1/10
18
Figure 8 - Vertical sections of temperature, salinity, dissolved oxygen and fluorescence off Cape Frio.
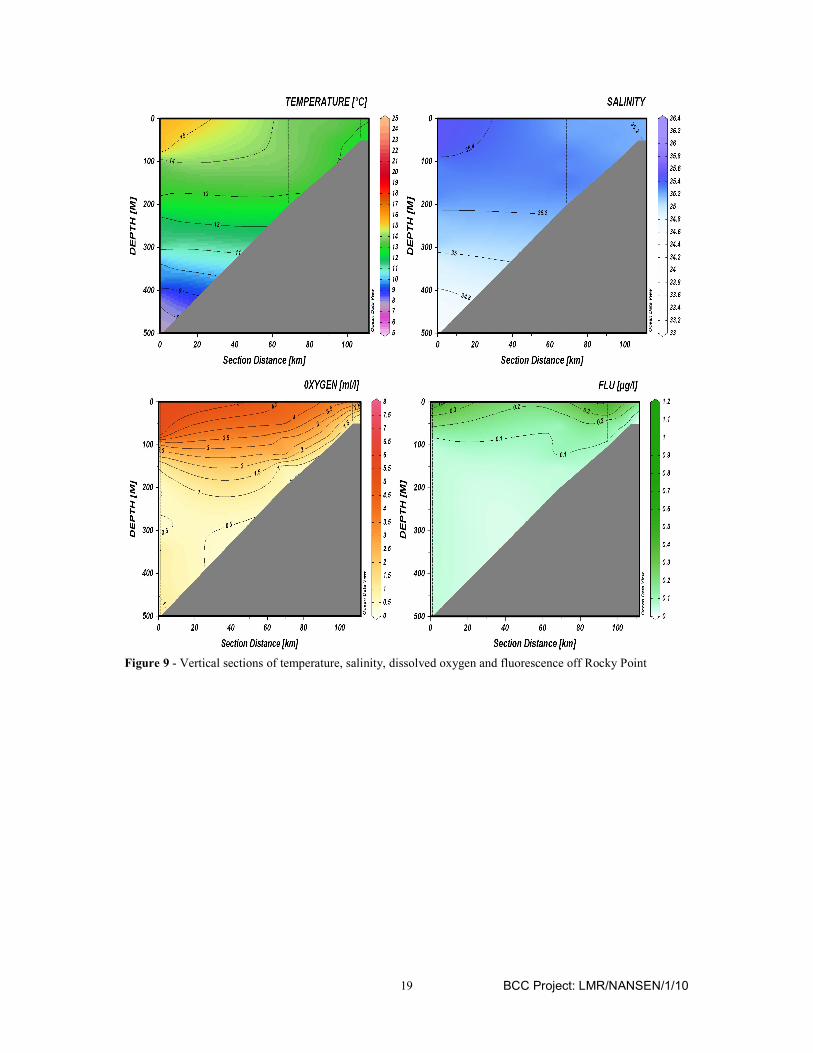
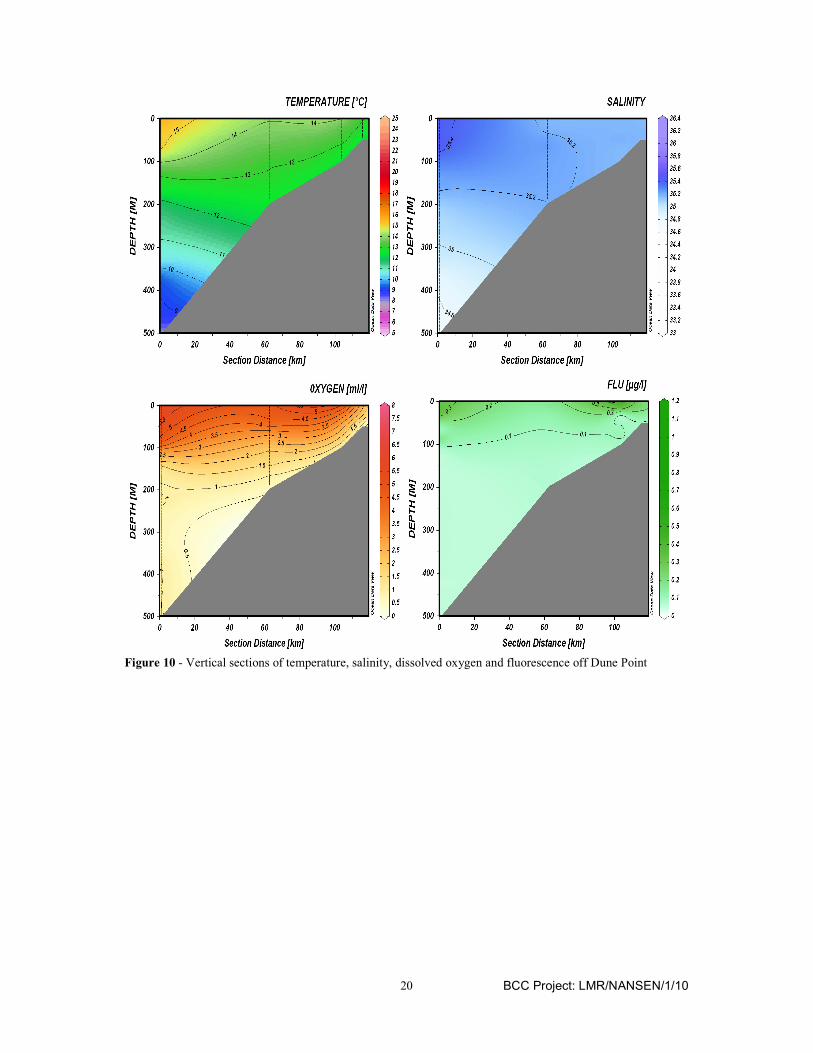
Rocky point and Dune Point
The oceanographic conditions were similar both in Rocky Point (Figure 9) and Dune Point (Figure 10) sections, in which it was observed the occurrence of upwelling of subsurface waters revealed by uplift of isolines from 200m to the surface. The surface temperature ranged from 15 ºC to 13 ºC offshore to inshore. While the salinity at the surface ranged from 35.4 offshore to 35.2 inshore. The 0-200 m layer was richer in oxygen ranging 5.5 ml/l at surface and 1 ml/l in 200m depth. The greatest biological activities (0.2 – 0.3µg/l) were recorded in the stations of the ends of each section, i.e. in offshore and inshore, respectively.
BCC Project: LMR/NANSEN/1/10
19
Figure 9 - Vertical sections of temperature, salinity, dissolved oxygen and fluorescence off Rocky Point
BCC Project: LMR/NANSEN/1/10
20
Figure 10 - Vertical sections of temperature, salinity, dissolved oxygen and fluorescence off Dune Point
BCC Project: LMR/NANSEN/1/10
21
CHAPTER 4. DISTRIBUTION, SIZE COMPOSITION AND BIOMASS
ESTIMATES
4.1. Transboundary area
Trachurus capensis
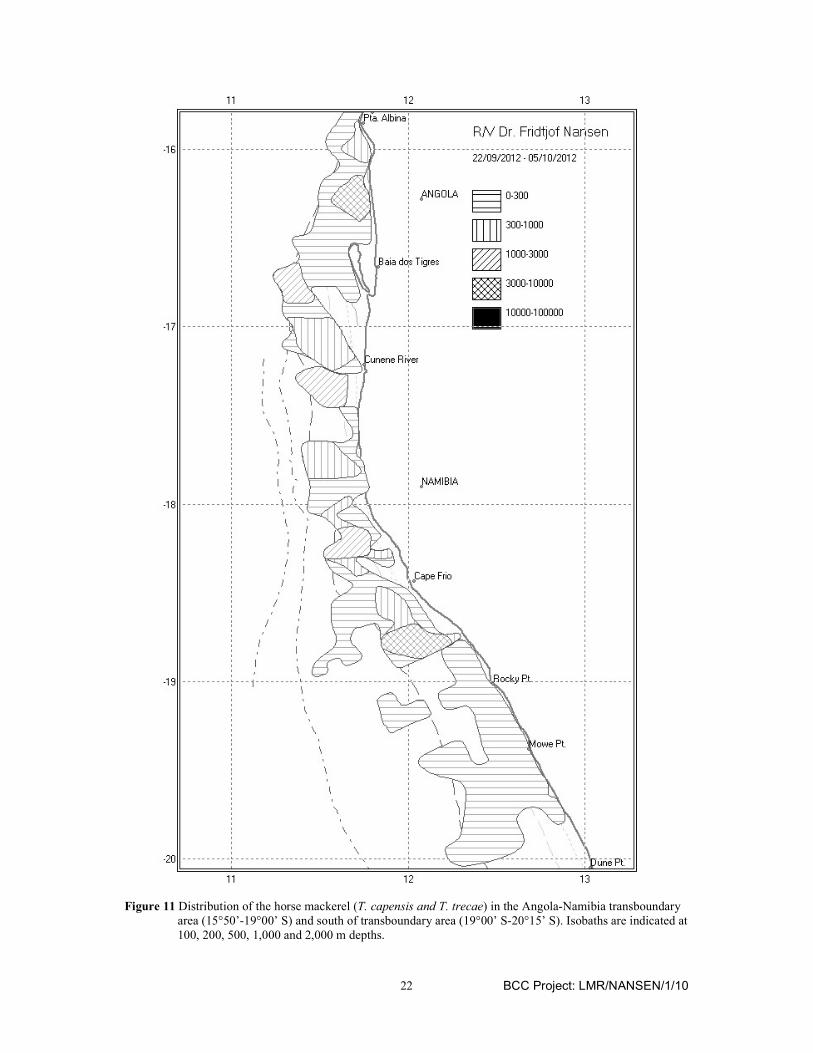
The first encounter of T. capensis this year was further north of the transboundary area, at S 15°33’67 as compared with last year’s position (S 16°12’23.4) and 2010 (S 16°18’10.1). The distribution of T. capensis was again discontinuous this year within the transboundary area as there was barely no encounter within the area between 17°24’19S and 17°40’53S. The discontinuity is hard to spot on the distribution figure (Figure 11) since this figure represent both the distribution of T. capensis and T. trecae. T. capensis was not found within Tiger Bay this year just like 2010, but there were aggregations just immediately before the bay and adjacent the bay further offshore up to 1 000 m isobaths (Figure 11). There were no trawls on three consecutive transects within the area north of Cape Frio due to a storm. However, the identification of species within this area was done based on trawls immediately before and after this area. There have been overlaps between shoals found offshore and inshore, this can clearly be seen within areas around 16°49’ S (south of Tiger Bay), North of Cape Frio (18°14’ S) and immediately before Rocky Point. Overall, most of the fish were offshore compared to those found inshore. There was an unusual behaviour for the Namibian T. capensis whereby there was no vertical migration (diurnal) during the night to the upper water column. Therefore, many bottom trawls done during the night contained significant amounts of T. capensis. This is typical of T. capensis found in Angola and South Africa. Three smaller, distinct aggregations were found within the transboundary area, one in the south, one in the central area and the other one in the north (16°27’ S, to 16°40’ S). The one in the south is specifically located north of Cape Frio (18°15’ S) and was the biggest of the three while the central aggregation is north of Cunene’s River mouth but somehow offshore. The last aggregation is from north of Tiger Bay, going around it and further offshore (16°27’ S, to 16°40’ S). The estimated total biomass of T. capensis was at 290 700 tonnes this year, this a significant decrease, by 48%, compared to 2011 biomass (558 500 tonnes). Taken from the maturity proportions, 41% of this year’s biomass was made up of adult fish (>17cm total length) as compared to 82% for previous year and 84% for 2010. This year the Namibian side of the transboundary area contributed 64% of the total biomass (187 300 tonnes), leaving the Angolan side with only 46% (103 400 tonnes). As for previous years (2008: 10 %; 2009: 11 %). Only approximately 13 % (by weight) of the total biomass of T. t capensis was found on the Angolan side of the transboundary area in 2010, contrasting the relative distribution found in Angola during the first transboundary survey in 2005, in which 64 % of the Cape horse mackerel biomass was found in Angolan waters.
BCC Project: LMR/NANSEN/1/10
22
Figure 11 Distribution of the horse mackerel (T. capensis and T. trecae) in the Angola-Namibia transboundary area (15°50’-19°00’ S) and south of transboundary area (19°00’ S-20°15’ S). Isobaths are indicated at 100, 200, 500, 1,000 and 2,000 m depths.
BCC Project: LMR/NANSEN/1/10
23
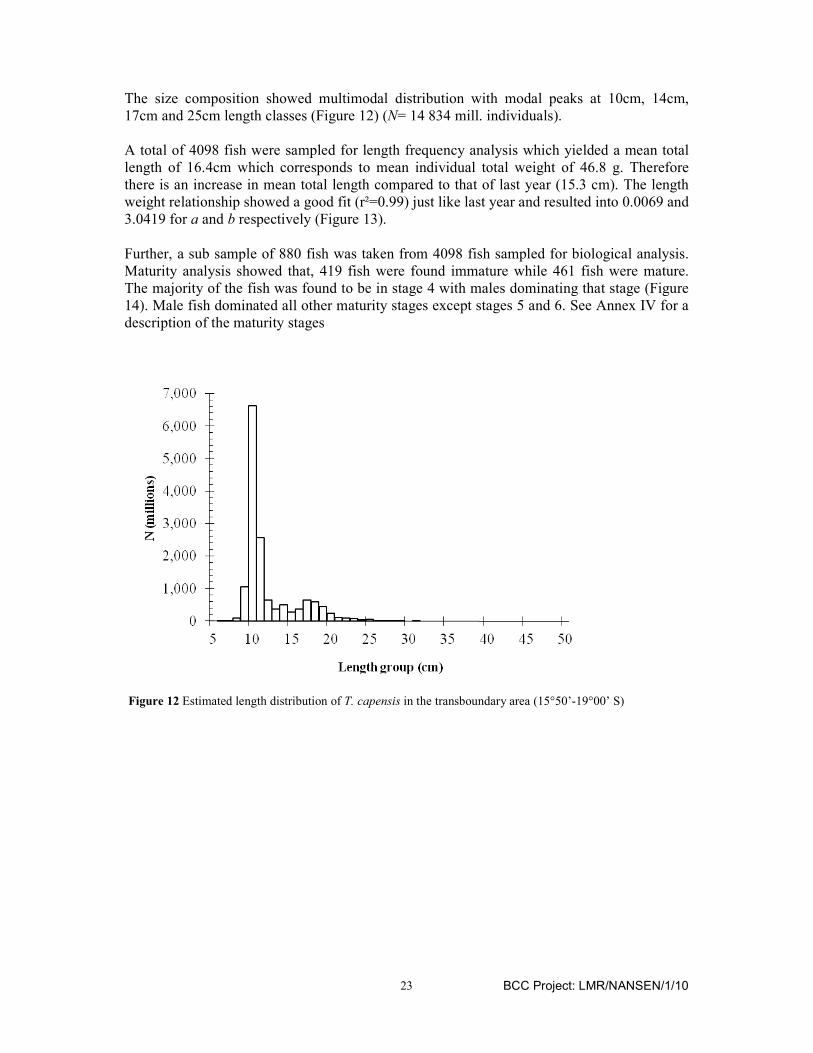
The size composition showed multimodal distribution with modal peaks at 10cm, 14cm, 17cm and 25cm length classes (Figure 12) (N= 14 834 mill. individuals). A total of 4098 fish were sampled for length frequency analysis which yielded a mean total length of 16.4cm which corresponds to mean individual total weight of 46.8 g. Therefore there is an increase in mean total length compared to that of last year (15.3 cm). The length weight relationship showed a good fit (r²=0.99) just like last year and resulted into 0.0069 and 3.0419 for a and b respectively (Figure 13). Further, a sub sample of 880 fish was taken from 4098 fish sampled for biological analysis. Maturity analysis showed that, 419 fish were found immature while 461 fish were mature. The majority of the fish was found to be in stage 4 with males dominating that stage (Figure 14). Male fish dominated all other maturity stages except stages 5 and 6. See Annex IV for a description of the maturity stages
Figure 12 Estimated length distribution of T. capensis in the transboundary area (15°50’-19°00’ S)
BCC Project: LMR/NANSEN/1/10
24
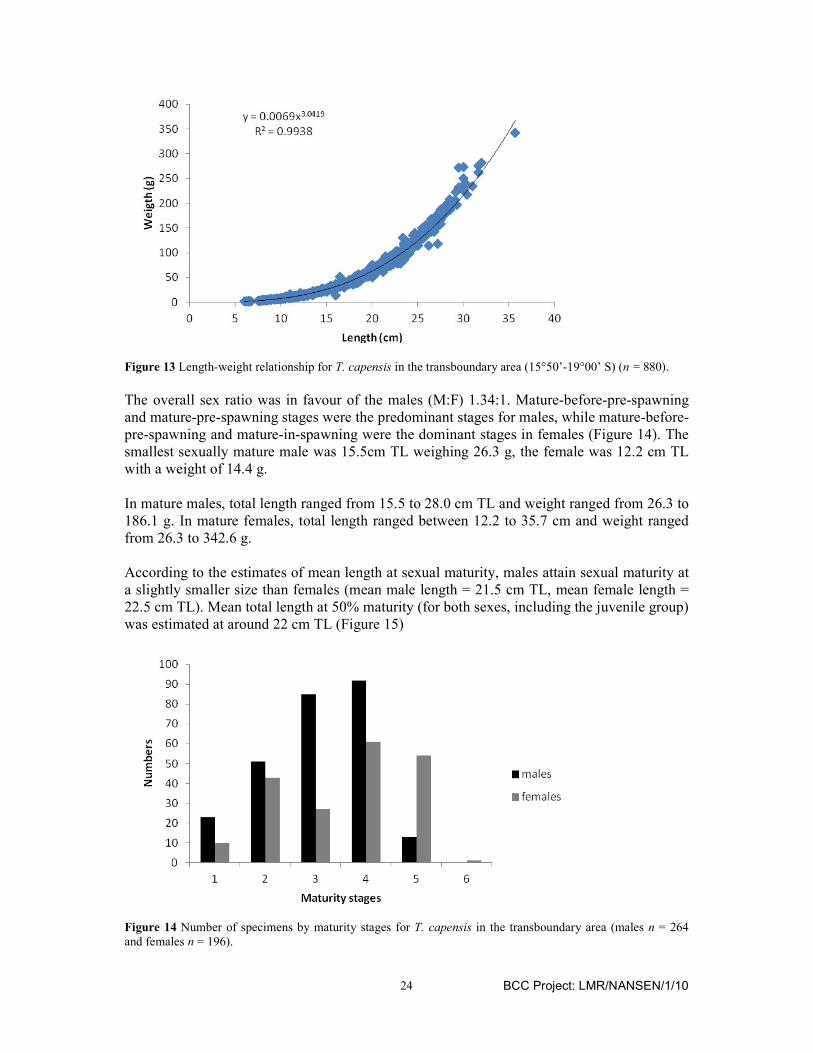
Figure 13 Length-weight relationship for T. capensis in the transboundary area (15°50’-19°00’ S) (n = 880).
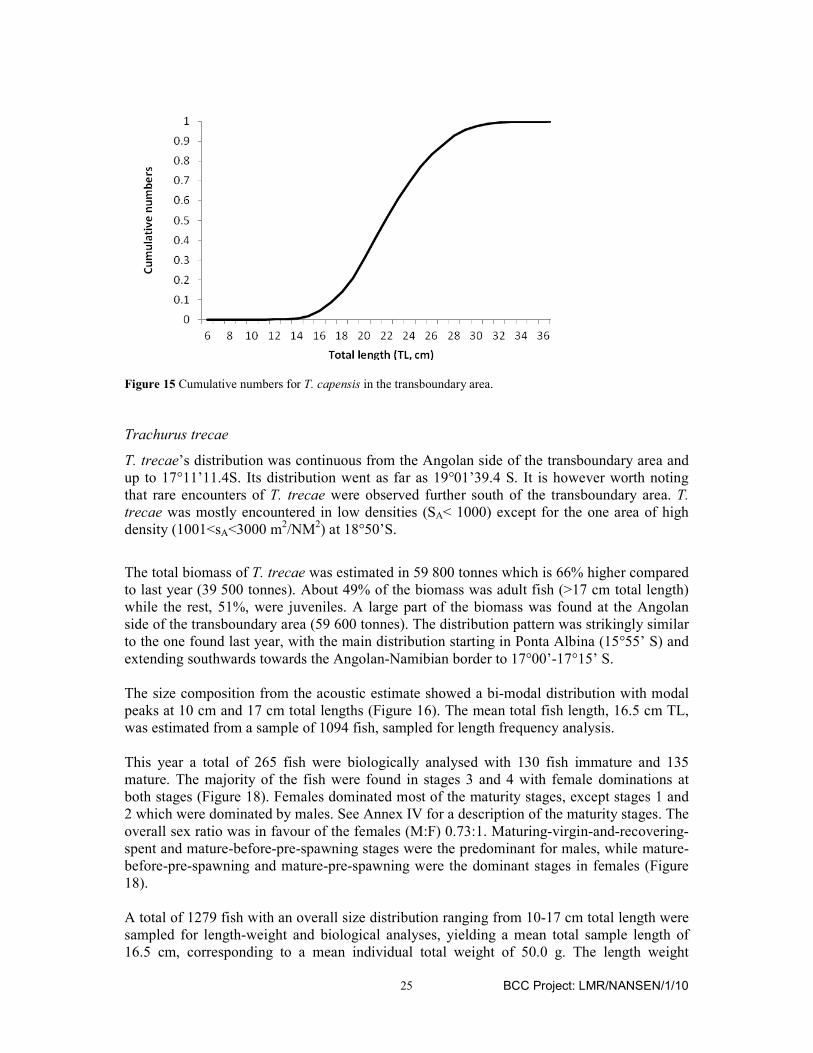
The overall sex ratio was in favour of the males (M:F) 1.34:1. Mature-before-pre-spawning and mature-pre-spawning stages were the predominant stages for males, while mature-before-pre-spawning and mature-in-spawning were the dominant stages in females (Figure 14). The smallest sexually mature male was 15.5cm TL weighing 26.3 g, the female was 12.2 cm TL with a weight of 14.4 g. In mature males, total length ranged from 15.5 to 28.0 cm TL and weight ranged from 26.3 to 186.1 g. In mature females, total length ranged between 12.2 to 35.7 cm and weight ranged from 26.3 to 342.6 g. According to the estimates of mean length at sexual maturity, males attain sexual maturity at a slightly smaller size than females (mean male length = 21.5 cm TL, mean female length = 22.5 cm TL). Mean total length at 50% maturity (for both sexes, including the juvenile group) was estimated at around 22 cm TL (Figure 15)
Figure 14 Number of specimens by maturity stages for T. capensis in the transboundary area (males n = 264 and females n = 196).
BCC Project: LMR/NANSEN/1/10
25
Figure 15 Cumulative numbers for T. capensis in the transboundary area.
Trachurus trecae
T. trecae’s distribution was continuous from the Angolan side of the transboundary area and up to 17°11’11.4S. Its distribution went as far as 19°01’39.4 S. It is however worth noting that rare encounters of T. trecae were observed further south of the transboundary area. T.
trecae was mostly encountered in low densities (SA< 1000) except for the one area of high density (1001<sA<3000 m2/NM2) at 18°50’S.
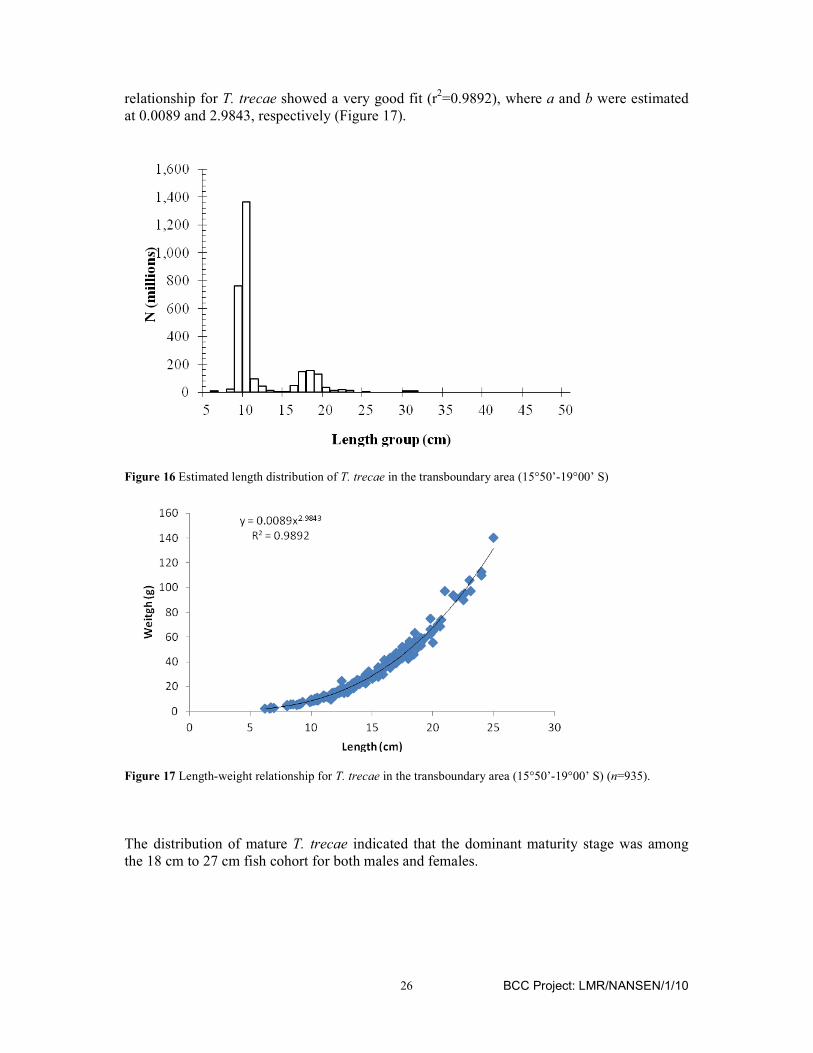
The total biomass of T. trecae was estimated in 59 800 tonnes which is 66% higher compared to last year (39 500 tonnes). About 49% of the biomass was adult fish (>17 cm total length) while the rest, 51%, were juveniles. A large part of the biomass was found at the Angolan side of the transboundary area (59 600 tonnes). The distribution pattern was strikingly similar to the one found last year, with the main distribution starting in Ponta Albina (15°55’ S) and extending southwards towards the Angolan-Namibian border to 17°00’-17°15’ S. The size composition from the acoustic estimate showed a bi-modal distribution with modal peaks at 10 cm and 17 cm total lengths (Figure 16). The mean total fish length, 16.5 cm TL, was estimated from a sample of 1094 fish, sampled for length frequency analysis. This year a total of 265 fish were biologically analysed with 130 fish immature and 135 mature. The majority of the fish were found in stages 3 and 4 with female dominations at both stages (Figure 18). Females dominated most of the maturity stages, except stages 1 and 2 which were dominated by males. See Annex IV for a description of the maturity stages. The overall sex ratio was in favour of the females (M:F) 0.73:1. Maturing-virgin-and-recovering-spent and mature-before-pre-spawning stages were the predominant for males, while mature-before-pre-spawning and mature-pre-spawning were the dominant stages in females (Figure 18). A total of 1279 fish with an overall size distribution ranging from 10-17 cm total length were sampled for length-weight and biological analyses, yielding a mean total sample length of 16.5 cm, corresponding to a mean individual total weight of 50.0 g. The length weight
BCC Project: LMR/NANSEN/1/10
26
relationship for T. trecae showed a very good fit (r2=0.9892), where a and b were estimated at 0.0089 and 2.9843, respectively (Figure 17).
Figure 16 Estimated length distribution of T. trecae in the transboundary area (15°50’-19°00’ S)
Figure 17 Length-weight relationship for T. trecae in the transboundary area (15°50’-19°00’ S) (n=935).
The distribution of mature T. trecae indicated that the dominant maturity stage was among the 18 cm to 27 cm fish cohort for both males and females.

BCC Project: LMR/NANSEN/1/10
27
Figure 18 Number of specimens by maturity stages for T. trecae in the transboundary area (males n = 57 and
females n = 78).
Figure 19 Cumulative numbers for T. trecae in the transboundary area.
Sardinops sagax
The distribution of Sardinops sagax is shown in Figure 22 below. An dense aggregation was found inshore (<200m) within the area north of Tiger Bay (16°15’-16°29’ S) while a continuous aggregation was also found in Angolan waters just west Tiger Bay, whereby it extend until the mouth of Cunene River (17°15’ S). The only two aggregations found in Namibian waters were north and south of Cape Frio (18°20’ S). The total biomass of S. sagax was estimated at 87 100 tonnes which is far less compared to the biomass of 2011 (132 300 tonnes). This represents a whopping of a 35 % decrease. It also represents a 78% dramatic decline as compared to 2010 (399 000 tonnes). However, these figures do not necessarily represent the state of the sardine stock. Caution should be taken when interpreting this dramatic change as a decline in stock size since first, the estimates are relative indices and not absolute estimates of abundance and so the population estimate should not be interpreted in absolute terms. Second, this was not a
BCC Project: LMR/NANSEN/1/10
28
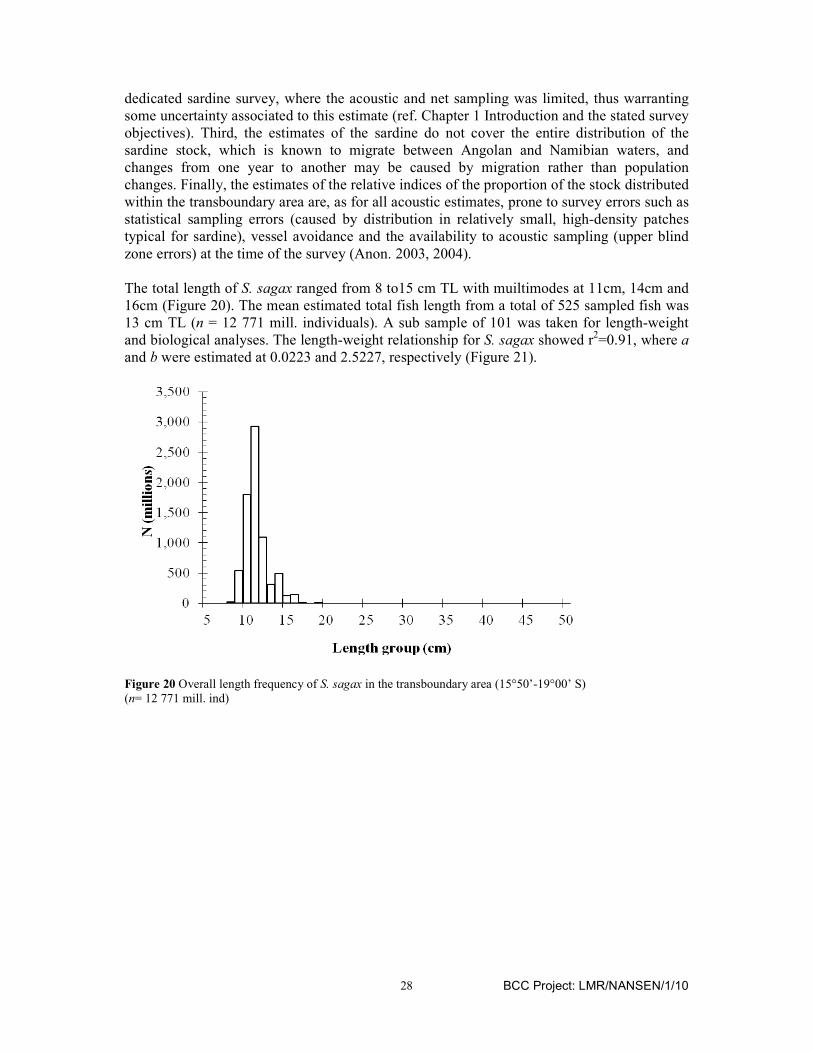
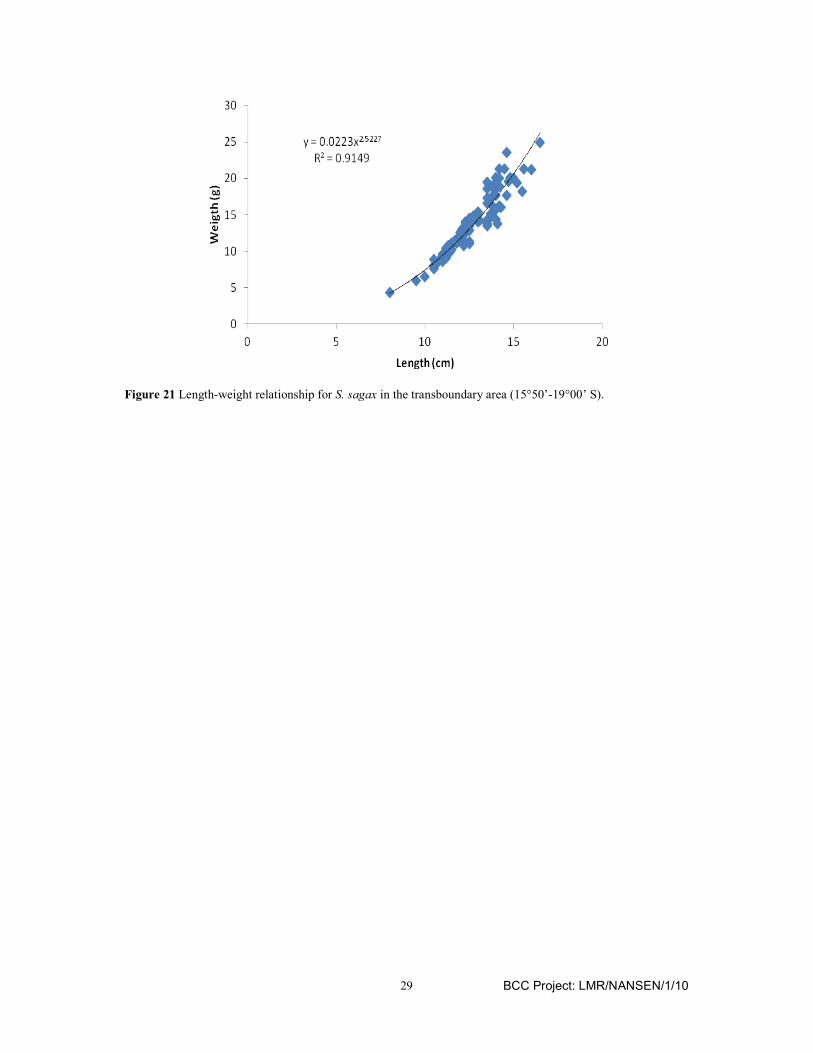
dedicated sardine survey, where the acoustic and net sampling was limited, thus warranting some uncertainty associated to this estimate (ref. Chapter 1 Introduction and the stated survey objectives). Third, the estimates of the sardine do not cover the entire distribution of the sardine stock, which is known to migrate between Angolan and Namibian waters, and changes from one year to another may be caused by migration rather than population changes. Finally, the estimates of the relative indices of the proportion of the stock distributed within the transboundary area are, as for all acoustic estimates, prone to survey errors such as statistical sampling errors (caused by distribution in relatively small, high-density patches typical for sardine), vessel avoidance and the availability to acoustic sampling (upper blind zone errors) at the time of the survey (Anon. 2003, 2004). The total length of S. sagax ranged from 8 to15 cm TL with muiltimodes at 11cm, 14cm and 16cm (Figure 20). The mean estimated total fish length from a total of 525 sampled fish was 13 cm TL (n = 12 771 mill. individuals). A sub sample of 101 was taken for length-weight and biological analyses. The length-weight relationship for S. sagax showed r2=0.91, where a and b were estimated at 0.0223 and 2.5227, respectively (Figure 21).
Figure 20 Overall length frequency of S. sagax in the transboundary area (15°50’-19°00’ S) (n= 12 771 mill. ind)
BCC Project: LMR/NANSEN/1/10
29
Figure 21 Length-weight relationship for S. sagax in the transboundary area (15°50’-19°00’ S).

BCC Project: LMR/NANSEN/1/10
30
Figure 22 Distribution of Sardinops sagax in the Angola-Namibian transboundary area (15°50’-19°00’ S). Isobaths are indicated at 50, 100, 200 and 500 m depths.
BCC Project: LMR/NANSEN/1/10
31
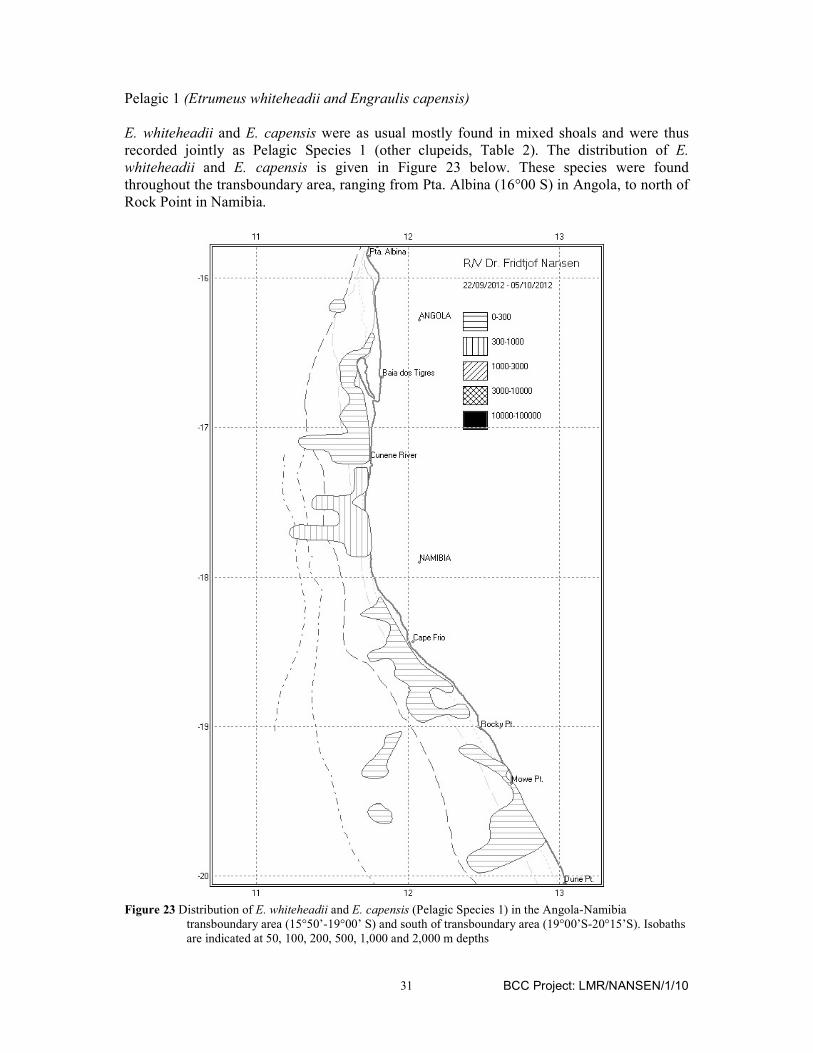
Pelagic 1 (Etrumeus whiteheadii and Engraulis capensis)
E. whiteheadii and E. capensis were as usual mostly found in mixed shoals and were thus recorded jointly as Pelagic Species 1 (other clupeids, Table 2). The distribution of E.
whiteheadii and E. capensis is given in Figure 23 below. These species were found throughout the transboundary area, ranging from Pta. Albina (16°00 S) in Angola, to north of Rock Point in Namibia.
Figure 23 Distribution of E. whiteheadii and E. capensis (Pelagic Species 1) in the Angola-Namibia
transboundary area (15°50’-19°00’ S) and south of transboundary area (19°00’S-20°15’S). Isobaths are indicated at 50, 100, 200, 500, 1,000 and 2,000 m depths
BCC Project: LMR/NANSEN/1/10
32
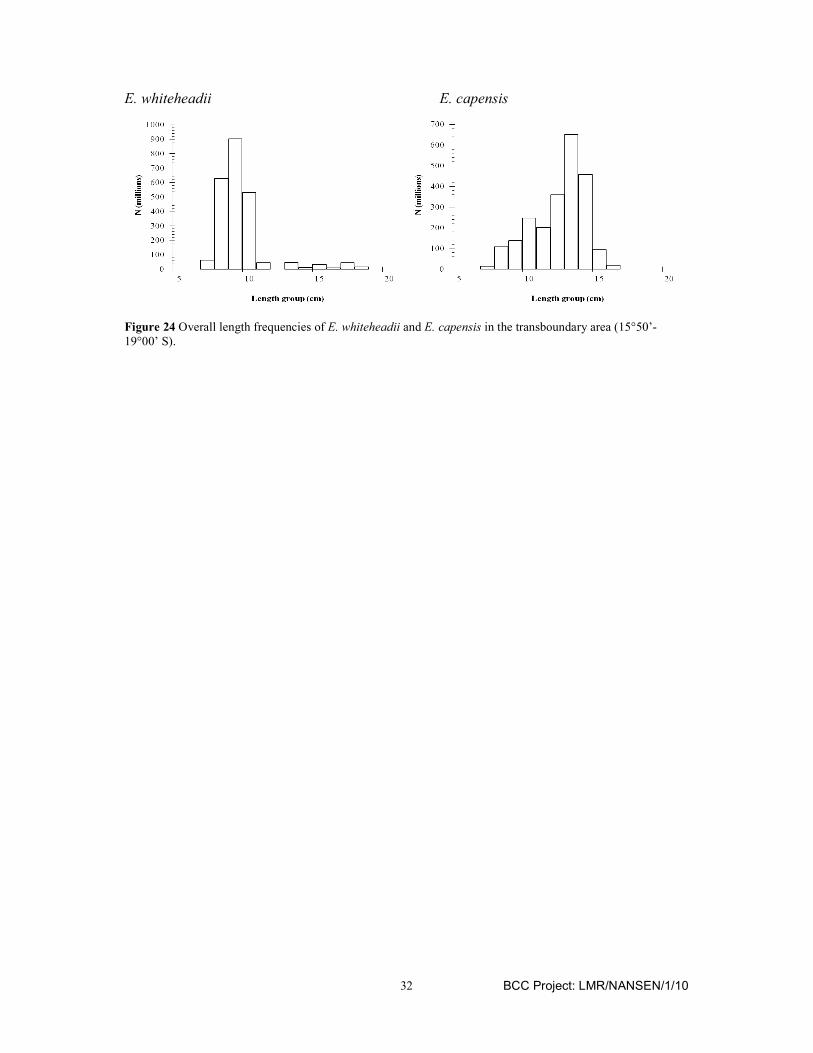
E. whiteheadii E. capensis
Figure 24 Overall length frequencies of E. whiteheadii and E. capensis in the transboundary area (15°50’-19°00’ S).
BCC Project: LMR/NANSEN/1/10
33
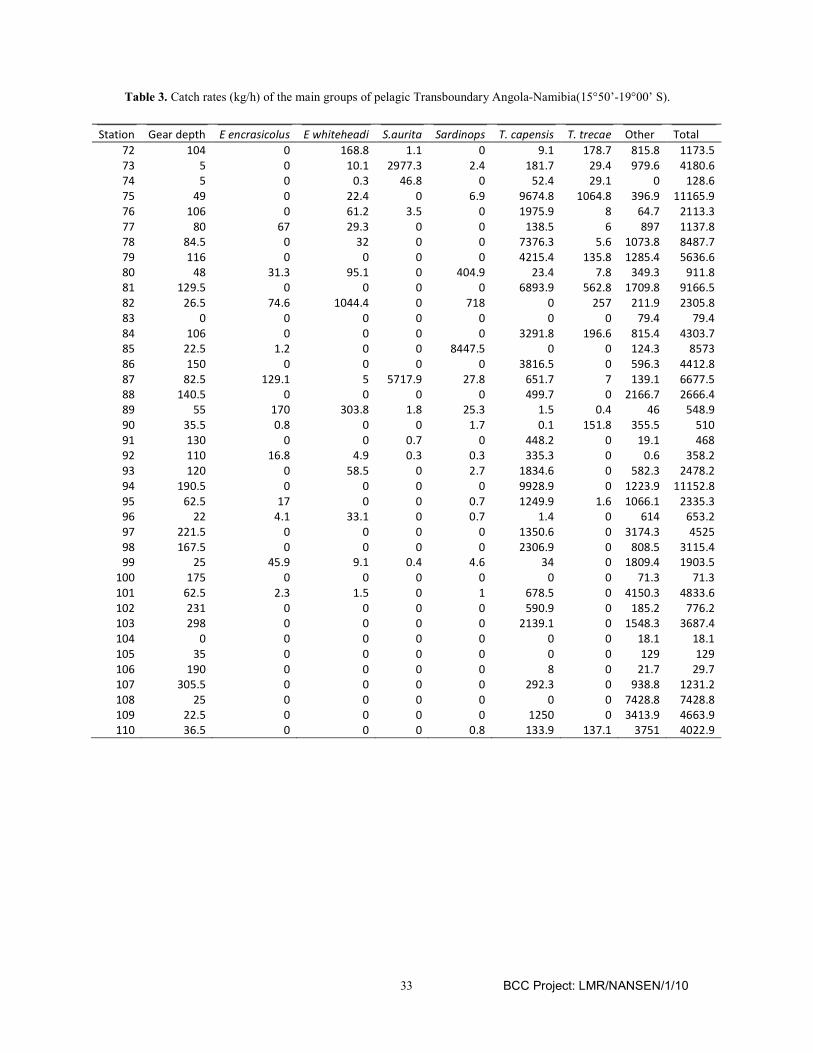
Table 3. Catch rates (kg/h) of the main groups of pelagic Transboundary Angola-Namibia(15°50’-19°00’ S).
Station Gear depth E encrasicolus E whiteheadi S.aurita Sardinops T. capensis T. trecae Other Total
72 104 0 168.8 1.1 0 9.1 178.7 815.8 1173.5
73 5 0 10.1 2977.3 2.4 181.7 29.4 979.6 4180.6
74 5 0 0.3 46.8 0 52.4 29.1 0 128.6
75 49 0 22.4 0 6.9 9674.8 1064.8 396.9 11165.9
76 106 0 61.2 3.5 0 1975.9 8 64.7 2113.3
77 80 67 29.3 0 0 138.5 6 897 1137.8
78 84.5 0 32 0 0 7376.3 5.6 1073.8 8487.7
79 116 0 0 0 0 4215.4 135.8 1285.4 5636.6
80 48 31.3 95.1 0 404.9 23.4 7.8 349.3 911.8
81 129.5 0 0 0 0 6893.9 562.8 1709.8 9166.5
82 26.5 74.6 1044.4 0 718 0 257 211.9 2305.8
83 0 0 0 0 0 0 0 79.4 79.4
84 106 0 0 0 0 3291.8 196.6 815.4 4303.7
85 22.5 1.2 0 0 8447.5 0 0 124.3 8573
86 150 0 0 0 0 3816.5 0 596.3 4412.8
87 82.5 129.1 5 5717.9 27.8 651.7 7 139.1 6677.5
88 140.5 0 0 0 0 499.7 0 2166.7 2666.4
89 55 170 303.8 1.8 25.3 1.5 0.4 46 548.9
90 35.5 0.8 0 0 1.7 0.1 151.8 355.5 510
91 130 0 0 0.7 0 448.2 0 19.1 468
92 110 16.8 4.9 0.3 0.3 335.3 0 0.6 358.2
93 120 0 58.5 0 2.7 1834.6 0 582.3 2478.2
94 190.5 0 0 0 0 9928.9 0 1223.9 11152.8
95 62.5 17 0 0 0.7 1249.9 1.6 1066.1 2335.3
96 22 4.1 33.1 0 0.7 1.4 0 614 653.2
97 221.5 0 0 0 0 1350.6 0 3174.3 4525
98 167.5 0 0 0 0 2306.9 0 808.5 3115.4
99 25 45.9 9.1 0.4 4.6 34 0 1809.4 1903.5
100 175 0 0 0 0 0 0 71.3 71.3
101 62.5 2.3 1.5 0 1 678.5 0 4150.3 4833.6
102 231 0 0 0 0 590.9 0 185.2 776.2
103 298 0 0 0 0 2139.1 0 1548.3 3687.4
104 0 0 0 0 0 0 0 18.1 18.1
105 35 0 0 0 0 0 0 129 129
106 190 0 0 0 0 8 0 21.7 29.7
107 305.5 0 0 0 0 292.3 0 938.8 1231.2
108 25 0 0 0 0 0 0 7428.8 7428.8
109 22.5 0 0 0 0 1250 0 3413.9 4663.9
110 36.5 0 0 0 0.8 133.9 137.1 3751 4022.9
BCC Project: LMR/NANSEN/1/10
34
4.2. Northern Namibia (19-22° S) Horse mackerel (Trachurus capensis):
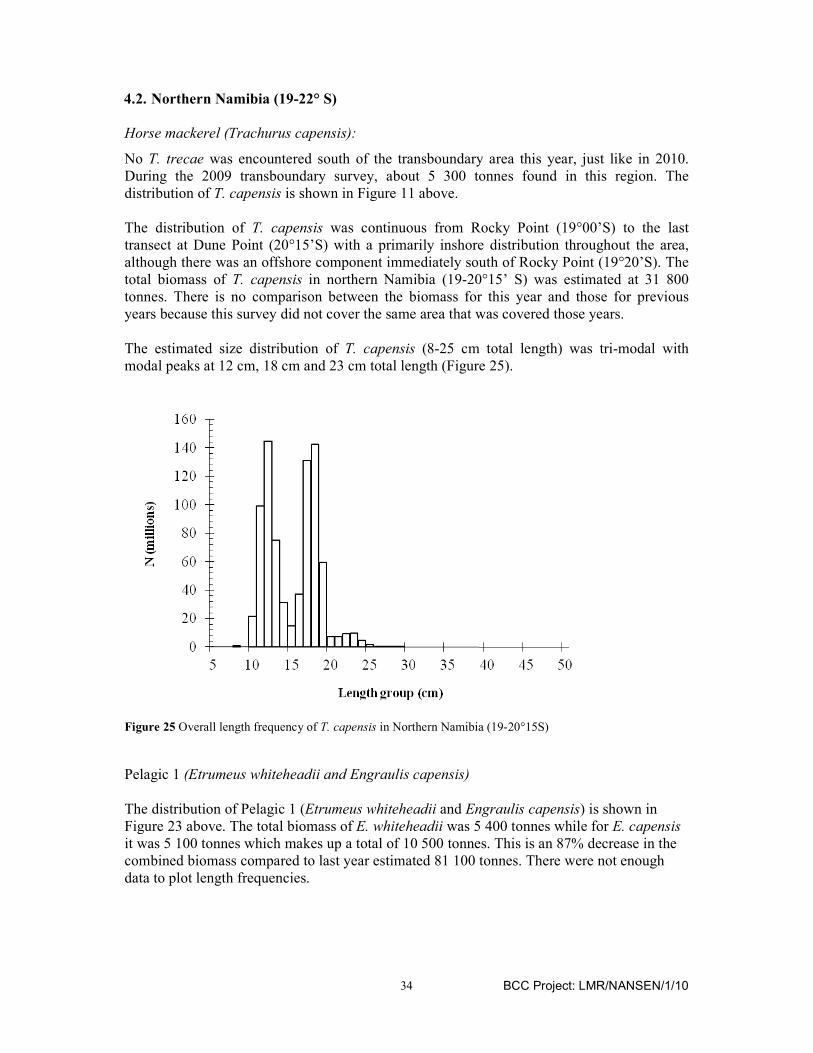
No T. trecae was encountered south of the transboundary area this year, just like in 2010. During the 2009 transboundary survey, about 5 300 tonnes found in this region. The distribution of T. capensis is shown in Figure 11 above. The distribution of T. capensis was continuous from Rocky Point (19°00’S) to the last transect at Dune Point (20°15’S) with a primarily inshore distribution throughout the area, although there was an offshore component immediately south of Rocky Point (19°20’S). The total biomass of T. capensis in northern Namibia (19-20°15’ S) was estimated at 31 800 tonnes. There is no comparison between the biomass for this year and those for previous years because this survey did not cover the same area that was covered those years. The estimated size distribution of T. capensis (8-25 cm total length) was tri-modal with modal peaks at 12 cm, 18 cm and 23 cm total length (Figure 25).
Figure 25 Overall length frequency of T. capensis in Northern Namibia (19-20°15S)
Pelagic 1 (Etrumeus whiteheadii and Engraulis capensis)
The distribution of Pelagic 1 (Etrumeus whiteheadii and Engraulis capensis) is shown in Figure 23 above. The total biomass of E. whiteheadii was 5 400 tonnes while for E. capensis it was 5 100 tonnes which makes up a total of 10 500 tonnes. This is an 87% decrease in the combined biomass compared to last year estimated 81 100 tonnes. There were not enough data to plot length frequencies.

BCC Project: LMR/NANSEN/1/10
35
CHAPTER 5. CONCLUSIONS AND RECOMMENDATIONS
The results from this year’s survey show the transboundary nature of the fish resources under study. The results still portray a more positive picture in terms of biomass for T. capensis and
T. trecae although the same cannot be said about S. sagax. But caution should be taken when interpreting the data, as changes from year to year may well reflect migration in and out of the transboundary area rather than increases/decreases in the biomass levels. It should also be noted that the estimates are relative indices, not absolute estimates of abundance, and that all estimates, in particular for the densely and patchily aggregated sardine, are prone to acoustical survey errors (Anon. 2003, 2004). As for previous years, the results also show that the T. capensis population is in comparatively much better condition than the T. trecae in terms of estimated biomass within the transboundary areas. It was also noted that T. capensis was not undergoing a vertical migration during the night. It should, however, be emphasized that the time series of the transboundary region cannot be interpreted as time-series of the stock units, as many of the populations have distribution areas that go far beyond the transboundary area and are characterized by migrations in and out of the transboundary area due to environmental factors and, in particular, the positioning of the Angola-Benguela Front (ABF). Fluctuations in the abundance estimates within the transboundary area do thus not necessarily reflect fluctuations in the stock units. Sardinella aurita has so far not been considered a transboundary species, but was in 2010 for the first time in the transboundary time series encountered in sizeable aggregations within the transboundary area (in Angola). The main findings from the survey can be summarized as:
1) The biomass estimate of Cape horse mackerel was lower (290 700) than last year’s (516 000 tonnes) but higher than in previous years (2008: 205 000 tonnes and 2009: 202 300 tonnes).
2) Approximately 46 % (by weight) of the Cape horse mackerel in the transboundary area was found in Angolan waters, which is far different to what has been found in recent years (2008: 10 %; 2009: 11 %; 2011: 13 %), but it still contrast the comparatively higher proportion found in Angola during the first transboundary survey in 2005 (64 %).
3) The variation in abundance of Cape horse mackerel in the transboundary area and the
relative distribution of the biomass in Angolan and Namibian waters between years, show that the aggregation dynamics is highly dynamic within the transboundary area at this time of the year, and that both the total biomass and the relative distribution in the countries may fluctuate considerably over time, largely reflecting the impacts of a changing positioning of the Angola-Benguela Front (ABF).
4) An unusual behaviour for the Namibian T. capensis was observed during this survey
whereby there was no vertical migration (diurnal) during the night to the upper part of the water column. Therefore, many bottom trawls done during the night contained
BCC Project: LMR/NANSEN/1/10
36
significant amounts of T. capensis. This is more typical of T. trecae in Angolan waters and T. capensis in South African waters and probably caused by more oxygenated water masses during the period of this survey, or possibly a lack of diurnal migration by the horse mackerel prey.
5) The estimate of Cunene horse mackerel was 59 800 tonnes which is relatively similar to
those found in previous years (2005: 44 000 tonnes, 2009: 50 700 tonnes and 2011: 45 500 tonnes).
6) The distribution pattern of Cunene horse mackerel was strikingly similar to that of last
year (2011) and 2009, with the majority of the biomass (66 %) found in Angolan waters, compared to 75 % in 2011, 78 % in 2009, 80 % in 2008 and 100 % in 2005.
7) Given yearly fluctuations due to oceanographic conditions (the position of the ABF), it
seems that the main bulk of the Cunene horse mackerel biomass within the transboundary region is presently found predominantly in Angolan waters (>99 %), while the bulk of the Cape horse mackerel biomass (>64 %) is found in Namibian waters.
8) The biomass of Sardine (Sardinops sagax, “pilchard”) decreased (87 100 tonnes)
compared to 2011 (132 000) and (399 000 tonnes) in 2010 but it is higher compared to previous years (2005: 0; 2008: 0; 2009: 35 700 tonnes). It should however be noted that these estimates are relative indices, not absolute estimates of abundance and so the population estimate should not be interpreted in absolute terms. Similarly, this was not a dedicated sardine survey and both acoustic and net sampling was limited, thus warranting some uncertainty associated to this estimate, as discussed above.
9) In 2012, the sardine biomass was not found in a single, fairly homogenous aggregation
like 2010 but there were aggregations in Namibian water as well. Nevertheless, the biggest aggregation was located in Angolan waters. As for Cape horse mackerel, both the aggregation pattern and the relative distribution between Angolan and Namibian zones within the transboundary area appear to fluctuate dramatically with environmental conditions between years. However, the more inshore-bound and short-lived life-history of the sardine compared to the carangid horse mackerels, combined with the fact that the sardine is still in a recovery phase from heavy fishing over the past decades, may add further to the dynamic picture for sardine compared to horse mackerel, rendering a yet more volatile and less predictable scenario in terms of abundance and distribution pattern for sardine compared to horse mackerel within the transboundary area.
10) This year, no Sardinella aurita was found in the transboundary area unlike in 2011
when 57 500 tonnes were found in the Angolan transboundary area.
11) The other clupeid species (round herring and anchovy) were found in extended, homogenous aggregation just like last year (2011), contrasting with the situation in 2009 where scattered, high-density aggregations were found.
BCC Project: LMR/NANSEN/1/10
37
5.1. Recommendations
The main recommendations are: 1) The time series should be continue, at the same time of the year, in order to monitor
changes within the transboundary area over time and to establish whether the observed patterns are persistent over time.
2) Additional surveys should be conducted also in the warm season, as the distribution patterns of all the targeted species are likely to be quite different in the alternate season. Horse mackerel distributions over the transboundary area generally follow the position of the Angola-Benguela front (ABF), i.e. both species have a more southern distribution in the warm season, leading expectations of more Cunene horse mackerel in Namibian waters and less Cape horse mackerel in Angolan waters during summer.
3) Angola and Namibia should, through the BCC, put in place mechanisms for continuing the monitoring of the transboundary area and expand on the established collaboration in the management of the transboundary pelagic fish resources there; all populations studied are to some extent transboundary, and most are in low abundance.
4) Collaborative monitoring should focus on joint training and harmonization of survey techniques, irrespective of the future of the transboundary surveys.
5) The quality and use of transboundary surveys will improve if participants are trained in
biological sampling, mostly on maturity and stomach fullness staging. Such information is subjective and requires consistency. That combined with retention of participants could help in data precision.
BCC Project: LMR/NANSEN/1/10
38
CHAPTER 6. REFERENCES
ANONYMOUS 2003 BENEFIT Report on Survey Errors workshop, Cape Town, South-
Africa 4–7 December 2000. BENEFIT Secretariat, Swakopmund, Namibia. 45 pp. ANONYMOUS 2004 BENEFIT Report on Survey Errors workshop, Cape Town, South-
Africa 14-15 November 2003. BENEFIT Secretariat, Swakopmund, Namibia. 31 pp.
FOOTE, K. G. 1987 Fish target strengths for use in echo integrator surveys. J. Acoust.
Soc. Am. 82(3): 981-987. FOOTE, K. G., AGLEN, A. and O. NAKKEN 1986 Measurements of fish target strength
with a split-beam echosounder. J. Acoust. Soc. Am. 80(2): 612-621. HOLDEN, M.J. and D.F.S. RAITT (Eds) 1974 Manual of fisheries science. Part 2-
Methods of resource investigation and their application. FAO Fish. Tech. Pap. 115(1). 214p.
KORNELIUSSEN, R.J., ONA, E., ELIASSEN, I.K., HEGGELUND, Y., PATEL, R., GODØ, O.R., GIERTSEN, C., PATEL, D., NORNES, E.H., BEKKVIK, T., KNUDSEN, H.P. and LIEN, G. 2006. The Large Scale Survey System-LSSS, a new post-processing system for multi-frequency echo sounder data. ICES WGFAST Report 2006
MISUND, O. A. and A. AGLEN 1992 Swimming behaviour of fish schools in the North Sea during acoustic surveying and pelagic trawl sampling. ICES J. Mar. Sci. 49: 3
CRUISE REPORT NO 2/2009. 2009. SURVEYS OF THE FISH RESOURCES OF ANGOLA, Survey of the pelagic resources, 23 May – 4 July 2009. Draft report. Unpublished
BCC Project: LMR/NANSEN/1/10
39
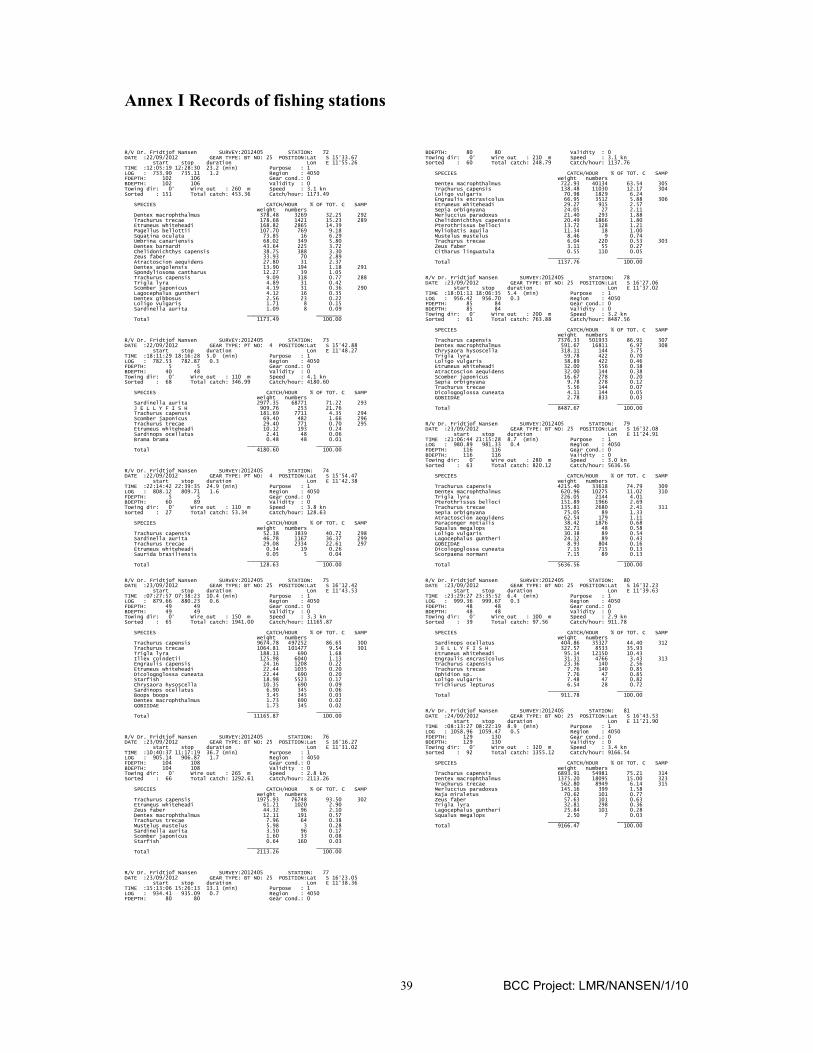
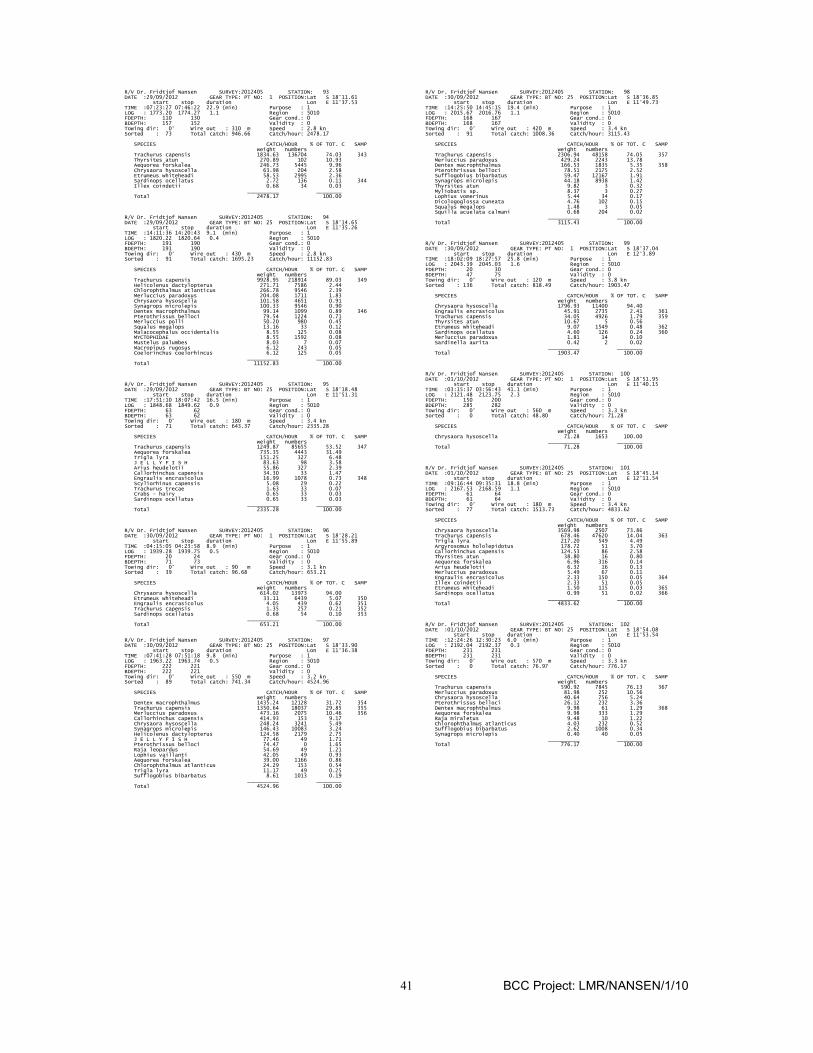
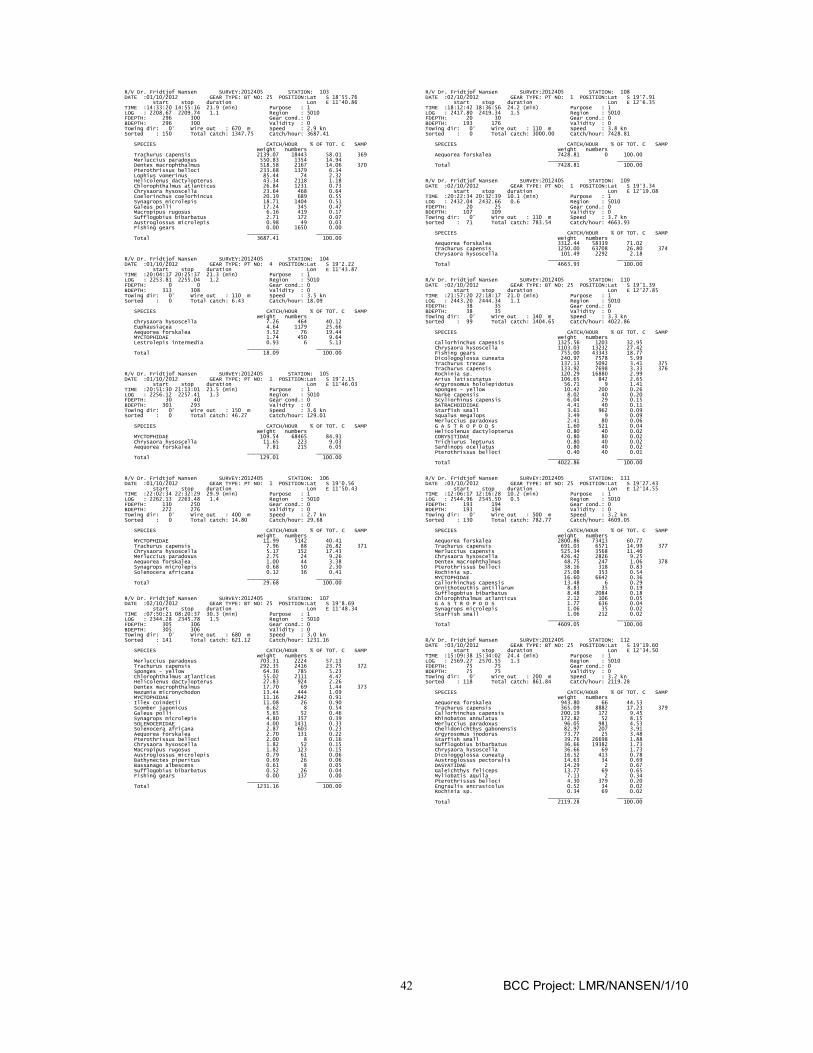
Annex I Records of fishing stations
R/V Dr. Fridtjof Nansen SURVEY:2012405 STATION: 72 DATE :22/09/2012 GEAR TYPE: BT NO: 25 POSITION:Lat S 15°33.67 start stop duration Lon E 11°55.26 TIME :12:05:19 12:28:30 23.2 (min) Purpose : 1 LOG : 733.90 735.11 1.2 Region : 4050 FDEPTH: 102 106 Gear cond.: 0 BDEPTH: 102 106 Validity : 0 Towing dir: 0° Wire out : 260 m Speed : 3.1 kn Sorted : 151 Total catch: 453.36 Catch/hour: 1173.49 SPECIES CATCH/HOUR % OF TOT. C SAMP weight numbers Dentex macrophthalmus 378.48 3269 32.25 292 Trachurus trecae 178.68 1421 15.23 289 Etrumeus whiteheadi 168.82 2865 14.39 Pagellus bellottii 107.70 769 9.18 Squatina oculata 73.85 16 6.29 Umbrina canariensis 68.02 349 5.80 Dentex barnardi 43.64 225 3.72 Chelidonichthys capensis 38.75 388 3.30 Zeus faber 33.93 70 2.89 Atractoscion aequidens 27.80 31 2.37 Dentex angolensis 13.90 194 1.18 291 Spondyliosoma cantharus 12.27 39 1.05 Trachurus capensis 9.09 318 0.77 288 Trigla lyra 4.89 31 0.42 Scomber japonicus 4.19 31 0.36 290 Lagocephalus guntheri 4.12 16 0.35 Dentex gibbosus 2.56 23 0.22 Loligo vulgaris 1.71 8 0.15 Sardinella aurita 1.09 8 0.09 __________ ________ Total 1173.49 100.00 R/V Dr. Fridtjof Nansen SURVEY:2012405 STATION: 73 DATE :22/09/2012 GEAR TYPE: PT NO: 4 POSITION:Lat S 15°42.88 start stop duration Lon E 11°48.27 TIME :18:11:29 18:16:28 5.0 (min) Purpose : 1 LOG : 782.53 782.87 0.3 Region : 4050 FDEPTH: 5 5 Gear cond.: 0 BDEPTH: 40 48 Validity : 0 Towing dir: 0° Wire out : 110 m Speed : 4.1 kn Sorted : 68 Total catch: 346.99 Catch/hour: 4180.60 SPECIES CATCH/HOUR % OF TOT. C SAMP weight numbers Sardinella aurita 2977.35 68771 71.22 293 J E L L Y F I S H 909.76 253 21.76 Trachurus capensis 181.69 7711 4.35 294 Scomber japonicus 69.40 482 1.66 296 Trachurus trecae 29.40 771 0.70 295 Etrumeus whiteheadi 10.12 193 0.24 Sardinops ocellatus 2.41 48 0.06 Brama brama 0.48 48 0.01 __________ ________ Total 4180.60 100.00 R/V Dr. Fridtjof Nansen SURVEY:2012405 STATION: 74 DATE :22/09/2012 GEAR TYPE: PT NO: 4 POSITION:Lat S 15°54.47 start stop duration Lon E 11°42.38 TIME :22:14:42 22:39:35 24.9 (min) Purpose : 1 LOG : 808.12 809.71 1.6 Region : 4050 FDEPTH: 5 5 Gear cond.: 0 BDEPTH: 60 89 Validity : 0 Towing dir: 0° Wire out : 110 m Speed : 3.8 kn Sorted : 27 Total catch: 53.34 Catch/hour: 128.63 SPECIES CATCH/HOUR % OF TOT. C SAMP weight numbers Trachurus capensis 52.38 3839 40.72 298 Sardinella aurita 46.78 1167 36.37 299 Trachurus trecae 29.08 2334 22.61 297 Etrumeus whiteheadi 0.34 19 0.26 Saurida brasiliensis 0.05 5 0.04 __________ ________ Total 128.63 100.00 R/V Dr. Fridtjof Nansen SURVEY:2012405 STATION: 75 DATE :23/09/2012 GEAR TYPE: BT NO: 25 POSITION:Lat S 16°12.42 start stop duration Lon E 11°43.53 TIME :07:27:57 07:38:23 10.4 (min) Purpose : 1 LOG : 879.66 880.23 0.6 Region : 4050 FDEPTH: 49 49 Gear cond.: 0 BDEPTH: 49 49 Validity : 0 Towing dir: 0° Wire out : 150 m Speed : 3.3 kn Sorted : 65 Total catch: 1941.00 Catch/hour: 11165.87 SPECIES CATCH/HOUR % OF TOT. C SAMP weight numbers Trachurus capensis 9674.78 497252 86.65 300 Trachurus trecae 1064.81 101477 9.54 301 Trigla lyra 188.11 690 1.68 Illex coindetii 125.98 6040 1.13 Engraulis capensis 24.16 1208 0.22 Etrumeus whiteheadi 22.44 1035 0.20 Dicologoglossa cuneata 22.44 690 0.20 Starfish 18.98 5523 0.17 Chrysaora hysoscella 10.35 690 0.09 Sardinops ocellatus 6.90 345 0.06 Boops boops 3.45 345 0.03 Dentex macrophthalmus 1.73 690 0.02 GOBIIDAE 1.73 345 0.02 __________ ________ Total 11165.87 100.00 R/V Dr. Fridtjof Nansen SURVEY:2012405 STATION: 76 DATE :23/09/2012 GEAR TYPE: BT NO: 25 POSITION:Lat S 16°16.27 start stop duration Lon E 11°31.02 TIME :10:40:37 11:17:19 36.7 (min) Purpose : 1 LOG : 905.14 906.87 1.7 Region : 4050 FDEPTH: 104 108 Gear cond.: 0 BDEPTH: 104 108 Validity : 0 Towing dir: 0° Wire out : 265 m Speed : 2.8 kn Sorted : 66 Total catch: 1292.61 Catch/hour: 2113.26 SPECIES CATCH/HOUR % OF TOT. C SAMP weight numbers Trachurus capensis 1975.93 76748 93.50 302 Etrumeus whiteheadi 61.21 1020 2.90 Zeus faber 44.32 96 2.10 Dentex macrophthalmus 12.11 191 0.57 Trachurus trecae 7.96 64 0.38 Mustelus mustelus 5.98 3 0.28 Sardinella aurita 3.50 96 0.17 Scomber japonicus 1.60 33 0.08 Starfish 0.64 160 0.03 __________ ________ Total 2113.26 100.00 R/V Dr. Fridtjof Nansen SURVEY:2012405 STATION: 77 DATE :23/09/2012 GEAR TYPE: BT NO: 25 POSITION:Lat S 16°23.05 start stop duration Lon E 11°38.36 TIME :15:13:06 15:26:13 13.1 (min) Purpose : 1 LOG : 934.41 935.09 0.7 Region : 4050 FDEPTH: 80 80 Gear cond.: 0
BDEPTH: 80 80 Validity : 0 Towing dir: 0° Wire out : 210 m Speed : 3.1 kn Sorted : 60 Total catch: 248.79 Catch/hour: 1137.76 SPECIES CATCH/HOUR % OF TOT. C SAMP weight numbers Dentex macrophthalmus 722.93 40134 63.54 305 Trachurus capensis 138.48 11030 12.17 304 Loligo vulgaris 70.98 1829 6.24 Engraulis encrasicolus 66.95 3512 5.88 306 Etrumeus whiteheadi 29.27 915 2.57 Sepia orbignyana 24.05 27 2.11 Merluccius paradoxus 21.40 293 1.88 Chelidonichthys capensis 20.49 1866 1.80 Pterothrissus belloci 13.72 128 1.21 Myliobatis aquila 11.34 18 1.00 Mustelus mustelus 8.46 9 0.74 Trachurus trecae 6.04 220 0.53 303 Zeus faber 3.11 55 0.27 Citharus linguatula 0.55 110 0.05 __________ ________ Total 1137.76 100.00 R/V Dr. Fridtjof Nansen SURVEY:2012405 STATION: 78 DATE :23/09/2012 GEAR TYPE: BT NO: 25 POSITION:Lat S 16°27.06 start stop duration Lon E 11°37.02 TIME :18:01:11 18:06:35 5.4 (min) Purpose : 1 LOG : 956.42 956.70 0.3 Region : 4050 FDEPTH: 85 84 Gear cond.: 0 BDEPTH: 85 84 Validity : 0 Towing dir: 0° Wire out : 200 m Speed : 3.2 kn Sorted : 61 Total catch: 763.88 Catch/hour: 8487.56 SPECIES CATCH/HOUR % OF TOT. C SAMP weight numbers Trachurus capensis 7376.33 501933 86.91 307 Dentex macrophthalmus 591.67 16811 6.97 308 Chrysaora hysoscella 318.11 144 3.75 Trigla lyra 59.78 422 0.70 Loligo vulgaris 38.89 422 0.46 Etrumeus whiteheadi 32.00 556 0.38 Atractoscion aequidens 32.00 144 0.38 Scomber japonicus 16.67 278 0.20 Sepia orbignyana 9.78 278 0.12 Trachurus trecae 5.56 144 0.07 Dicologoglossa cuneata 4.11 144 0.05 GOBIIDAE 2.78 833 0.03 __________ ________ Total 8487.67 100.00 R/V Dr. Fridtjof Nansen SURVEY:2012405 STATION: 79 DATE :23/09/2012 GEAR TYPE: BT NO: 25 POSITION:Lat S 16°32.08 start stop duration Lon E 11°24.91 TIME :21:06:44 21:15:28 8.7 (min) Purpose : 1 LOG : 980.89 981.33 0.4 Region : 4050 FDEPTH: 116 116 Gear cond.: 0 BDEPTH: 116 116 Validity : 0 Towing dir: 0° Wire out : 280 m Speed : 3.0 kn Sorted : 63 Total catch: 820.12 Catch/hour: 5636.56 SPECIES CATCH/HOUR % OF TOT. C SAMP weight numbers Trachurus capensis 4215.40 33618 74.79 309 Dentex macrophthalmus 620.96 10275 11.02 310 Trigla lyra 226.05 2144 4.01 Pterothrissus belloci 151.89 1966 2.69 Trachurus trecae 135.81 2680 2.41 311 Sepia orbignyana 75.05 89 1.33 Atractoscion aequidens 62.54 179 1.11 Paraconger notialis 38.42 1876 0.68 Squalus megalops 32.71 48 0.58 Loligo vulgaris 30.38 89 0.54 Lagocephalus guntheri 24.12 89 0.43 GOBIIDAE 8.93 804 0.16 Dicologoglossa cuneata 7.15 715 0.13 Scorpaena normani 7.15 89 0.13 __________ ________ Total 5636.56 100.00 R/V Dr. Fridtjof Nansen SURVEY:2012405 STATION: 80 DATE :23/09/2012 GEAR TYPE: BT NO: 25 POSITION:Lat S 16°32.23 start stop duration Lon E 11°39.63 TIME :23:29:27 23:35:52 6.4 (min) Purpose : 1 LOG : 999.36 999.67 0.3 Region : 4050 FDEPTH: 48 48 Gear cond.: 0 BDEPTH: 48 48 Validity : 0 Towing dir: 0° Wire out : 100 m Speed : 2.9 kn Sorted : 39 Total catch: 97.56 Catch/hour: 911.78 SPECIES CATCH/HOUR % OF TOT. C SAMP weight numbers Sardinops ocellatus 404.86 35327 44.40 312 J E L L Y F I S H 327.57 8533 35.93 Etrumeus whiteheadi 95.14 12150 10.43 Engraulis encrasicolus 31.31 4766 3.43 313 Trachurus capensis 23.36 140 2.56 Trachurus trecae 7.76 140 0.85 Ophidion sp. 7.76 47 0.85 Loligo vulgaris 7.48 47 0.82 Trichiurus lepturus 6.54 28 0.72 __________ ________ Total 911.78 100.00 R/V Dr. Fridtjof Nansen SURVEY:2012405 STATION: 81 DATE :24/09/2012 GEAR TYPE: BT NO: 25 POSITION:Lat S 16°43.53 start stop duration Lon E 11°21.90 TIME :08:13:27 08:22:19 8.9 (min) Purpose : 1 LOG : 1058.96 1059.47 0.5 Region : 4050 FDEPTH: 129 130 Gear cond.: 0 BDEPTH: 129 130 Validity : 0 Towing dir: 0° Wire out : 320 m Speed : 3.4 kn Sorted : 92 Total catch: 1355.12 Catch/hour: 9166.54 SPECIES CATCH/HOUR % OF TOT. C SAMP weight numbers Trachurus capensis 6893.91 54981 75.21 314 Dentex macrophthalmus 1375.20 18095 15.00 323 Trachurus trecae 562.80 8949 6.14 315 Merluccius paradoxus 145.16 399 1.58 Raja miraletus 70.62 101 0.77 Zeus faber 57.63 101 0.63 Trigla lyra 32.81 298 0.36 Lagocephalus guntheri 25.84 101 0.28 Squalus megalops 2.50 7 0.03 __________ ________ Total 9166.47 100.00
BCC Project: LMR/NANSEN/1/10
40
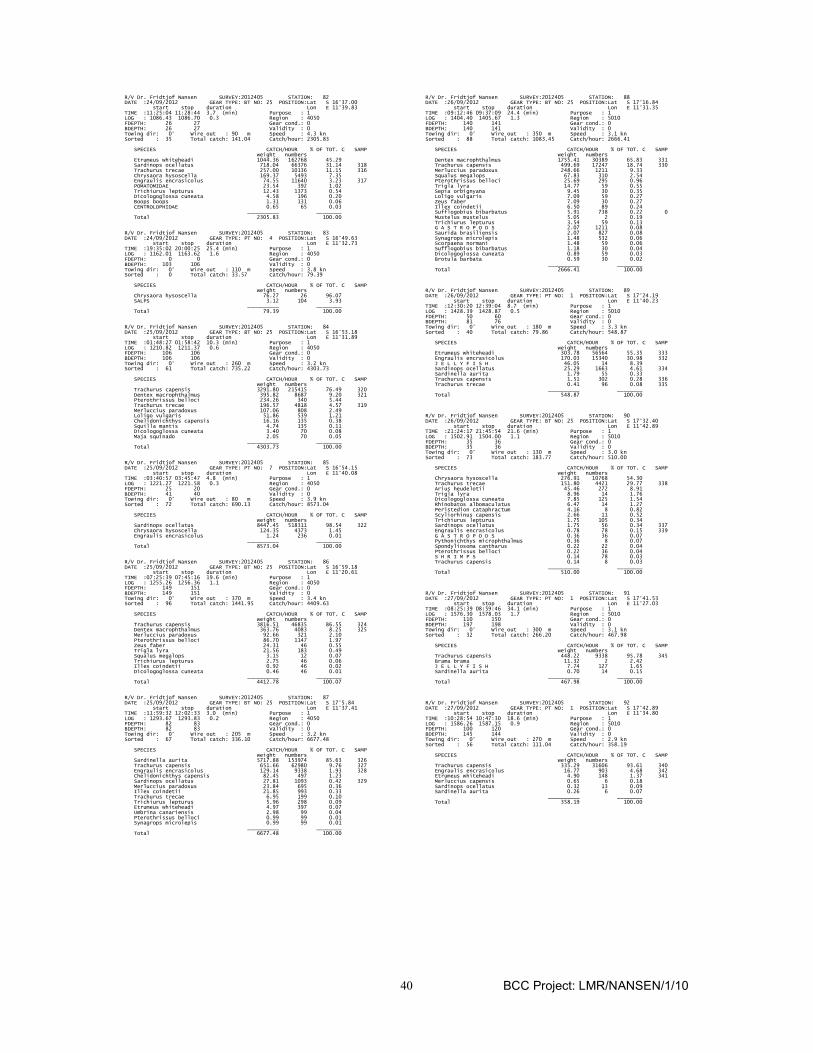
R/V Dr. Fridtjof Nansen SURVEY:2012405 STATION: 82 DATE :24/09/2012 GEAR TYPE: BT NO: 25 POSITION:Lat S 16°37.00 start stop duration Lon E 11°39.83 TIME :11:25:04 11:28:44 3.7 (min) Purpose : 1 LOG : 1086.43 1086.70 0.3 Region : 4050 FDEPTH: 26 27 Gear cond.: 0 BDEPTH: 26 27 Validity : 0 Towing dir: 0° Wire out : 90 m Speed : 4.3 kn Sorted : 35 Total catch: 141.04 Catch/hour: 2305.83 SPECIES CATCH/HOUR % OF TOT. C SAMP weight numbers Etrumeus whiteheadi 1044.36 162768 45.29 Sardinops ocellatus 718.04 66376 31.14 318 Trachurus trecae 257.00 10136 11.15 316 Chrysaora hysoscella 169.37 5493 7.35 Engraulis encrasicolus 74.55 11640 3.23 317 POMATOMIDAE 23.54 392 1.02 Trichiurus lepturus 12.43 1373 0.54 Dicologoglossa cuneata 4.58 196 0.20 Boops boops 1.31 131 0.06 CENTROLOPHIDAE 0.65 65 0.03 __________ ________ Total 2305.83 100.00 R/V Dr. Fridtjof Nansen SURVEY:2012405 STATION: 83 DATE :24/09/2012 GEAR TYPE: PT NO: 4 POSITION:Lat S 16°49.63 start stop duration Lon E 11°32.73 TIME :19:35:02 20:00:25 25.4 (min) Purpose : 1 LOG : 1162.01 1163.62 1.6 Region : 4050 FDEPTH: 0 0 Gear cond.: 0 BDEPTH: 103 106 Validity : 0 Towing dir: 0° Wire out : 110 m Speed : 3.8 kn Sorted : 0 Total catch: 33.57 Catch/hour: 79.39 SPECIES CATCH/HOUR % OF TOT. C SAMP weight numbers Chrysaora hysoscella 76.27 26 96.07 SALPS 3.12 104 3.93 __________ ________ Total 79.39 100.00 R/V Dr. Fridtjof Nansen SURVEY:2012405 STATION: 84 DATE :25/09/2012 GEAR TYPE: BT NO: 25 POSITION:Lat S 16°53.18 start stop duration Lon E 11°31.89 TIME :01:48:27 01:58:42 10.3 (min) Purpose : 1 LOG : 1210.82 1211.37 0.6 Region : 4050 FDEPTH: 106 106 Gear cond.: 0 BDEPTH: 106 106 Validity : 0 Towing dir: 0° Wire out : 260 m Speed : 3.2 kn Sorted : 61 Total catch: 735.22 Catch/hour: 4303.73 SPECIES CATCH/HOUR % OF TOT. C SAMP weight numbers Trachurus capensis 3291.80 215415 76.49 320 Dentex macrophthalmus 395.82 8687 9.20 321 Pterothrissus belloci 234.26 340 5.44 Trachurus trecae 196.57 4818 4.57 319 Merluccius paradoxus 107.06 808 2.49 Loligo vulgaris 51.86 539 1.21 Chelidonichthys capensis 16.16 135 0.38 Squilla mantis 4.74 135 0.11 Dicologoglossa cuneata 3.40 70 0.08 Maja squinado 2.05 70 0.05 __________ ________ Total 4303.73 100.00 R/V Dr. Fridtjof Nansen SURVEY:2012405 STATION: 85 DATE :25/09/2012 GEAR TYPE: PT NO: 7 POSITION:Lat S 16°54.15 start stop duration Lon E 11°40.08 TIME :03:40:57 03:45:47 4.8 (min) Purpose : 1 LOG : 1221.27 1221.58 0.3 Region : 4050 FDEPTH: 25 20 Gear cond.: 0 BDEPTH: 41 40 Validity : 0 Towing dir: 0° Wire out : 80 m Speed : 3.9 kn Sorted : 72 Total catch: 690.13 Catch/hour: 8573.04 SPECIES CATCH/HOUR % OF TOT. C SAMP weight numbers Sardinops ocellatus 8447.45 518311 98.54 322 Chrysaora hysoscella 124.35 4373 1.45 Engraulis encrasicolus 1.24 236 0.01 __________ ________ Total 8573.04 100.00 R/V Dr. Fridtjof Nansen SURVEY:2012405 STATION: 86 DATE :25/09/2012 GEAR TYPE: BT NO: 25 POSITION:Lat S 16°59.18 start stop duration Lon E 11°20.61 TIME :07:25:39 07:45:16 19.6 (min) Purpose : 1 LOG : 1255.26 1256.36 1.1 Region : 4050 FDEPTH: 149 151 Gear cond.: 0 BDEPTH: 149 151 Validity : 0 Towing dir: 0° Wire out : 370 m Speed : 3.4 kn Sorted : 96 Total catch: 1441.95 Catch/hour: 4409.63 SPECIES CATCH/HOUR % OF TOT. C SAMP weight numbers Trachurus capensis 3816.51 46835 86.55 324 Dentex macrophthalmus 363.76 4083 8.25 325 Merluccius paradoxus 92.66 321 2.10 Pterothrissus belloci 86.70 1147 1.97 Zeus faber 24.31 46 0.55 Trigla lyra 21.56 183 0.49 Squalus megalops 3.15 12 0.07 Trichiurus lepturus 2.75 46 0.06 Illex coindetii 0.92 46 0.02 Dicologoglossa cuneata 0.46 46 0.01 __________ ________ Total 4412.78 100.07 R/V Dr. Fridtjof Nansen SURVEY:2012405 STATION: 87 DATE :25/09/2012 GEAR TYPE: BT NO: 25 POSITION:Lat S 17°5.84 start stop duration Lon E 11°37.41 TIME :11:59:32 12:02:33 3.0 (min) Purpose : 1 LOG : 1293.67 1293.83 0.2 Region : 4050 FDEPTH: 82 83 Gear cond.: 0 BDEPTH: 82 83 Validity : 0 Towing dir: 0° Wire out : 205 m Speed : 3.2 kn Sorted : 67 Total catch: 336.10 Catch/hour: 6677.48 SPECIES CATCH/HOUR % OF TOT. C SAMP weight numbers Sardinella aurita 5717.88 153974 85.63 326 Trachurus capensis 651.66 62980 9.76 327 Engraulis encrasicolus 129.14 9338 1.93 328 Chelidonichthys capensis 82.45 497 1.23 Sardinops ocellatus 27.81 1093 0.42 329 Merluccius paradoxus 23.84 695 0.36 Illex coindetii 21.85 993 0.33 Trachurus trecae 6.95 199 0.10 Trichiurus lepturus 5.96 298 0.09 Etrumeus whiteheadi 4.97 397 0.07 Umbrina canariensis 2.98 99 0.04 Pterothrissus belloci 0.99 99 0.01 Synagrops microlepis 0.99 99 0.01 __________ ________ Total 6677.48 100.00
R/V Dr. Fridtjof Nansen SURVEY:2012405 STATION: 88 DATE :26/09/2012 GEAR TYPE: BT NO: 25 POSITION:Lat S 17°16.84 start stop duration Lon E 11°31.35 TIME :09:12:46 09:37:09 24.4 (min) Purpose : 1 LOG : 1404.40 1405.67 1.3 Region : 5010 FDEPTH: 140 141 Gear cond.: 0 BDEPTH: 140 141 Validity : 0 Towing dir: 0° Wire out : 350 m Speed : 3.1 kn Sorted : 88 Total catch: 1083.45 Catch/hour: 2666.41 SPECIES CATCH/HOUR % OF TOT. C SAMP weight numbers Dentex macrophthalmus 1755.41 30389 65.83 331 Trachurus capensis 499.69 17247 18.74 330 Merluccius paradoxus 248.66 1211 9.33 Squalus megalops 67.83 310 2.54 Pterothrissus belloci 25.69 295 0.96 Trigla lyra 14.77 59 0.55 Sepia orbignyana 9.45 30 0.35 Loligo vulgaris 7.09 59 0.27 Zeus faber 7.09 30 0.27 Illex coindetii 6.50 89 0.24 Sufflogobius bibarbatus 5.91 738 0.22 0 Mustelus mustelus 5.05 2 0.19 Trichiurus lepturus 3.54 59 0.13 G A S T R O P O D S 2.07 1211 0.08 Saurida brasiliensis 2.07 827 0.08 Synagrops microlepis 1.48 532 0.06 Scorpaena normani 1.48 59 0.06 Sufflogobius bibarbatus 1.18 30 0.04 Dicologoglossa cuneata 0.89 59 0.03 Brotula barbata 0.59 30 0.02 __________ ________ Total 2666.41 100.00 R/V Dr. Fridtjof Nansen SURVEY:2012405 STATION: 89 DATE :26/09/2012 GEAR TYPE: PT NO: 1 POSITION:Lat S 17°24.19 start stop duration Lon E 11°40.23 TIME :12:30:20 12:39:04 8.7 (min) Purpose : 1 LOG : 1428.39 1428.87 0.5 Region : 5010 FDEPTH: 50 60 Gear cond.: 0 BDEPTH: 81 76 Validity : 0 Towing dir: 0° Wire out : 180 m Speed : 3.3 kn Sorted : 40 Total catch: 79.86 Catch/hour: 548.87 SPECIES CATCH/HOUR % OF TOT. C SAMP weight numbers Etrumeus whiteheadi 303.78 56564 55.35 333 Engraulis encrasicolus 170.03 15340 30.98 332 J E L L Y F I S H 46.05 14 8.39 Sardinops ocellatus 25.29 1663 4.61 334 Sardinella aurita 1.79 55 0.33 Trachurus capensis 1.51 302 0.28 336 Trachurus trecae 0.41 96 0.08 335 __________ ________ Total 548.87 100.00 R/V Dr. Fridtjof Nansen SURVEY:2012405 STATION: 90 DATE :26/09/2012 GEAR TYPE: BT NO: 25 POSITION:Lat S 17°32.40 start stop duration Lon E 11°42.89 TIME :21:24:17 21:45:54 21.6 (min) Purpose : 1 LOG : 1502.91 1504.00 1.1 Region : 5010 FDEPTH: 35 36 Gear cond.: 0 BDEPTH: 35 36 Validity : 0 Towing dir: 0° Wire out : 130 m Speed : 3.0 kn Sorted : 73 Total catch: 183.77 Catch/hour: 510.00 SPECIES CATCH/HOUR % OF TOT. C SAMP weight numbers Chrysaora hysoscella 276.91 10768 54.30 Trachurus trecae 151.80 4421 29.77 338 Arius heudelotii 45.46 272 8.91 Trigla lyra 8.96 14 1.76 Dicologoglossa cuneata 7.85 125 1.54 Rhinobatos albomaculatus 6.47 14 1.27 Peristedion cataphractum 4.16 8 0.82 Scyliorhinus capensis 2.66 11 0.52 Trichiurus lepturus 1.75 105 0.34 Sardinops ocellatus 1.75 56 0.34 337 Engraulis encrasicolus 0.78 78 0.15 339 G A S T R O P O D S 0.36 36 0.07 Pythonichthys microphthalmus 0.36 8 0.07 Spondyliosoma cantharus 0.22 22 0.04 Pterothrissus belloci 0.22 36 0.04 S H R I M P S 0.14 78 0.03 Trachurus capensis 0.14 8 0.03 __________ ________ Total 510.00 100.00 R/V Dr. Fridtjof Nansen SURVEY:2012405 STATION: 91 DATE :27/09/2012 GEAR TYPE: PT NO: 1 POSITION:Lat S 17°41.53 start stop duration Lon E 11°27.03 TIME :08:25:39 08:59:46 34.1 (min) Purpose : 1 LOG : 1576.30 1578.03 1.7 Region : 5010 FDEPTH: 110 150 Gear cond.: 0 BDEPTH: 197 198 Validity : 0 Towing dir: 0° Wire out : 300 m Speed : 3.1 kn Sorted : 32 Total catch: 266.20 Catch/hour: 467.98 SPECIES CATCH/HOUR % OF TOT. C SAMP weight numbers Trachurus capensis 448.22 9338 95.78 345 Brama brama 11.32 2 2.42 J E L L Y F I S H 7.74 127 1.65 Sardinella aurita 0.70 14 0.15 __________ ________ Total 467.98 100.00 R/V Dr. Fridtjof Nansen SURVEY:2012405 STATION: 92 DATE :27/09/2012 GEAR TYPE: PT NO: 1 POSITION:Lat S 17°42.89 start stop duration Lon E 11°34.80 TIME :10:28:54 10:47:30 18.6 (min) Purpose : 1 LOG : 1586.26 1587.15 0.9 Region : 5010 FDEPTH: 100 120 Gear cond.: 0 BDEPTH: 145 144 Validity : 0 Towing dir: 0° Wire out : 270 m Speed : 2.9 kn Sorted : 56 Total catch: 111.04 Catch/hour: 358.19 SPECIES CATCH/HOUR % OF TOT. C SAMP weight numbers Trachurus capensis 335.29 31606 93.61 340 Engraulis encrasicolus 16.77 903 4.68 342 Etrumeus whiteheadi 4.90 148 1.37 341 Merluccius capensis 0.65 6 0.18 Sardinops ocellatus 0.32 13 0.09 Sardinella aurita 0.26 6 0.07 __________ ________ Total 358.19 100.00
BCC Project: LMR/NANSEN/1/10
41
R/V Dr. Fridtjof Nansen SURVEY:2012405 STATION: 93 DATE :29/09/2012 GEAR TYPE: PT NO: 1 POSITION:Lat S 18°11.61 start stop duration Lon E 11°37.53 TIME :07:23:27 07:46:22 22.9 (min) Purpose : 1 LOG : 1773.20 1774.27 1.1 Region : 5010 FDEPTH: 110 130 Gear cond.: 0 BDEPTH: 157 152 Validity : 0 Towing dir: 0° Wire out : 310 m Speed : 2.8 kn Sorted : 73 Total catch: 946.66 Catch/hour: 2478.17 SPECIES CATCH/HOUR % OF TOT. C SAMP weight numbers Trachurus capensis 1834.63 136704 74.03 343 Thyrsites atun 270.89 102 10.93 Aequorea forskalea 246.73 5445 9.96 Chrysaora hysoscella 63.98 204 2.58 Etrumeus whiteheadi 58.53 2995 2.36 Sardinops ocellatus 2.72 136 0.11 344 Illex coindetii 0.68 34 0.03 __________ ________ Total 2478.17 100.00 R/V Dr. Fridtjof Nansen SURVEY:2012405 STATION: 94 DATE :29/09/2012 GEAR TYPE: BT NO: 25 POSITION:Lat S 18°14.65 start stop duration Lon E 11°35.26 TIME :14:11:36 14:20:43 9.1 (min) Purpose : 1 LOG : 1820.22 1820.64 0.4 Region : 5010 FDEPTH: 191 190 Gear cond.: 0 BDEPTH: 191 190 Validity : 0 Towing dir: 0° Wire out : 430 m Speed : 2.8 kn Sorted : 91 Total catch: 1695.23 Catch/hour: 11152.83 SPECIES CATCH/HOUR % OF TOT. C SAMP weight numbers Trachurus capensis 9928.95 218914 89.03 349 Helicolenus dactylopterus 271.71 7586 2.44 Chlorophthalmus atlanticus 266.78 9546 2.39 Merluccius paradoxus 204.08 1711 1.83 Chrysaora hysoscella 101.58 4651 0.91 Synagrops microlepis 100.33 9546 0.90 Dentex macrophthalmus 99.14 1099 0.89 346 Pterothrissus belloci 79.54 1224 0.71 Merluccius polli 50.20 980 0.45 Squalus megalops 13.16 33 0.12 Malacocephalus occidentalis 8.55 125 0.08 MYCTOPHIDAE 8.55 1592 0.08 Mustelus palumbes 8.03 7 0.07 Macropipus rugosus 6.12 243 0.05 Coelorinchus coelorhincus 6.12 125 0.05 __________ ________ Total 11152.83 100.00 R/V Dr. Fridtjof Nansen SURVEY:2012405 STATION: 95 DATE :29/09/2012 GEAR TYPE: BT NO: 25 POSITION:Lat S 18°18.48 start stop duration Lon E 11°51.31 TIME :17:51:10 18:07:42 16.5 (min) Purpose : 1 LOG : 1848.68 1849.62 0.9 Region : 5010 FDEPTH: 63 62 Gear cond.: 0 BDEPTH: 63 62 Validity : 0 Towing dir: 0° Wire out : 180 m Speed : 3.4 kn Sorted : 71 Total catch: 643.37 Catch/hour: 2335.28 SPECIES CATCH/HOUR % OF TOT. C SAMP weight numbers Trachurus capensis 1249.87 85655 53.52 347 Aequorea forskalea 735.35 4443 31.49 Trigla lyra 151.25 327 6.48 J E L L Y F I S H 83.63 98 3.58 Arius heudelotii 55.86 327 2.39 Callorhinchus capensis 34.30 33 1.47 Engraulis encrasicolus 16.99 1078 0.73 348 Scyliorhinus capensis 5.08 29 0.22 Trachurus trecae 1.63 33 0.07 Crabs - hairy 0.65 33 0.03 Sardinops ocellatus 0.65 33 0.03 __________ ________ Total 2335.28 100.00 R/V Dr. Fridtjof Nansen SURVEY:2012405 STATION: 96 DATE :30/09/2012 GEAR TYPE: PT NO: 1 POSITION:Lat S 18°28.21 start stop duration Lon E 11°55.89 TIME :04:15:05 04:23:58 8.9 (min) Purpose : 1 LOG : 1939.28 1939.75 0.5 Region : 5010 FDEPTH: 20 24 Gear cond.: 0 BDEPTH: 71 73 Validity : 0 Towing dir: 0° Wire out : 90 m Speed : 3.1 kn Sorted : 39 Total catch: 96.68 Catch/hour: 653.21 SPECIES CATCH/HOUR % OF TOT. C SAMP weight numbers Chrysaora hysoscella 614.02 13973 94.00 Etrumeus whiteheadi 33.11 6439 5.07 350 Engraulis encrasicolus 4.05 439 0.62 351 Trachurus capensis 1.35 257 0.21 352 Sardinops ocellatus 0.68 54 0.10 353 __________ ________ Total 653.21 100.00 R/V Dr. Fridtjof Nansen SURVEY:2012405 STATION: 97 DATE :30/09/2012 GEAR TYPE: BT NO: 25 POSITION:Lat S 18°33.90 start stop duration Lon E 11°36.38 TIME :07:41:28 07:51:18 9.8 (min) Purpose : 1 LOG : 1963.22 1963.74 0.5 Region : 5010 FDEPTH: 222 221 Gear cond.: 0 BDEPTH: 222 221 Validity : 0 Towing dir: 0° Wire out : 550 m Speed : 3.2 kn Sorted : 89 Total catch: 741.34 Catch/hour: 4524.96 SPECIES CATCH/HOUR % OF TOT. C SAMP weight numbers Dentex macrophthalmus 1435.24 12128 31.72 354 Trachurus capensis 1350.64 18037 29.85 355 Merluccius paradoxus 473.16 2075 10.46 356 Callorhinchus capensis 414.93 153 9.17 Chrysaora hysoscella 248.24 3241 5.49 Synagrops microlepis 146.43 10083 3.24 Helicolenus dactylopterus 124.58 2179 2.75 J E L L Y F I S H 77.46 49 1.71 Pterothrissus belloci 74.47 0 1.65 Raja leopardus 54.69 49 1.21 Lophius vaillanti 42.05 49 0.93 Aequorea forskalea 39.00 1166 0.86 Chlorophthalmus atlanticus 24.29 153 0.54 Trigla lyra 11.17 49 0.25 Sufflogobius bibarbatus 8.61 1013 0.19 __________ ________ Total 4524.96 100.00
R/V Dr. Fridtjof Nansen SURVEY:2012405 STATION: 98 DATE :30/09/2012 GEAR TYPE: BT NO: 25 POSITION:Lat S 18°36.85 start stop duration Lon E 11°49.73 TIME :14:25:50 14:45:15 19.4 (min) Purpose : 1 LOG : 2015.67 2016.76 1.1 Region : 5010 FDEPTH: 168 167 Gear cond.: 0 BDEPTH: 168 167 Validity : 0 Towing dir: 0° Wire out : 420 m Speed : 3.4 kn Sorted : 91 Total catch: 1008.36 Catch/hour: 3115.43 SPECIES CATCH/HOUR % OF TOT. C SAMP weight numbers Trachurus capensis 2306.94 48158 74.05 357 Merluccius paradoxus 429.24 2243 13.78 Dentex macrophthalmus 166.53 1835 5.35 358 Pterothrissus belloci 78.51 2175 2.52 Sufflogobius bibarbatus 59.47 12167 1.91 Synagrops microlepis 44.18 8938 1.42 Thyrsites atun 9.82 3 0.32 Myliobatis sp. 8.37 3 0.27 Lophius vomerinus 5.44 34 0.17 Dicologoglossa cuneata 4.76 102 0.15 Squalus megalops 1.48 3 0.05 Squilla acuelata calmani 0.68 204 0.02 __________ ________ Total 3115.43 100.00 R/V Dr. Fridtjof Nansen SURVEY:2012405 STATION: 99 DATE :30/09/2012 GEAR TYPE: PT NO: 1 POSITION:Lat S 18°37.04 start stop duration Lon E 12°3.89 TIME :18:02:09 18:27:57 25.8 (min) Purpose : 1 LOG : 2043.39 2045.03 1.6 Region : 5010 FDEPTH: 20 30 Gear cond.: 0 BDEPTH: 47 75 Validity : 0 Towing dir: 0° Wire out : 120 m Speed : 3.8 kn Sorted : 136 Total catch: 818.49 Catch/hour: 1903.47 SPECIES CATCH/HOUR % OF TOT. C SAMP weight numbers Chrysaora hysoscella 1796.93 11400 94.40 Engraulis encrasicolus 45.91 2735 2.41 361 Trachurus capensis 34.05 4926 1.79 359 Thyrsites atun 10.67 5 0.56 Etrumeus whiteheadi 9.07 1549 0.48 362 Sardinops ocellatus 4.60 126 0.24 360 Merluccius paradoxus 1.81 14 0.10 Sardinella aurita 0.42 2 0.02 __________ ________ Total 1903.47 100.00 R/V Dr. Fridtjof Nansen SURVEY:2012405 STATION: 100 DATE :01/10/2012 GEAR TYPE: PT NO: 1 POSITION:Lat S 18°51.95 start stop duration Lon E 11°40.15 TIME :03:15:37 03:56:43 41.1 (min) Purpose : 1 LOG : 2121.48 2123.75 2.3 Region : 5010 FDEPTH: 150 200 Gear cond.: 0 BDEPTH: 285 282 Validity : 0 Towing dir: 0° Wire out : 560 m Speed : 3.3 kn Sorted : 0 Total catch: 48.80 Catch/hour: 71.28 SPECIES CATCH/HOUR % OF TOT. C SAMP weight numbers Chrysaora hysoscella 71.28 1653 100.00 __________ ________ Total 71.28 100.00 R/V Dr. Fridtjof Nansen SURVEY:2012405 STATION: 101 DATE :01/10/2012 GEAR TYPE: BT NO: 25 POSITION:Lat S 18°45.14 start stop duration Lon E 12°11.54 TIME :09:16:44 09:35:31 18.8 (min) Purpose : 1 LOG : 2167.53 2168.59 1.1 Region : 5010 FDEPTH: 61 64 Gear cond.: 0 BDEPTH: 61 64 Validity : 0 Towing dir: 0° Wire out : 180 m Speed : 3.4 kn Sorted : 77 Total catch: 1513.73 Catch/hour: 4833.62 SPECIES CATCH/HOUR % OF TOT. C SAMP weight numbers Chrysaora hysoscella 3569.98 2507 73.86 Trachurus capensis 678.46 47620 14.04 363 Trigla lyra 217.20 549 4.49 Argyrosomus hololepidotus 178.72 51 3.70 Callorhinchus capensis 124.53 86 2.58 Thyrsites atun 38.80 16 0.80 Aequorea forskalea 6.96 316 0.14 Arius heudelotii 6.32 16 0.13 Merluccius paradoxus 5.49 67 0.11 Engraulis encrasicolus 2.33 150 0.05 364 Illex coindetii 2.33 51 0.05 Etrumeus whiteheadi 1.50 115 0.03 365 Sardinops ocellatus 0.99 51 0.02 366 __________ ________ Total 4833.62 100.00 R/V Dr. Fridtjof Nansen SURVEY:2012405 STATION: 102 DATE :01/10/2012 GEAR TYPE: BT NO: 25 POSITION:Lat S 18°54.08 start stop duration Lon E 11°53.54 TIME :12:24:26 12:30:23 6.0 (min) Purpose : 1 LOG : 2192.04 2192.37 0.3 Region : 5010 FDEPTH: 231 231 Gear cond.: 0 BDEPTH: 231 231 Validity : 0 Towing dir: 0° Wire out : 570 m Speed : 3.3 kn Sorted : 0 Total catch: 76.97 Catch/hour: 776.17 SPECIES CATCH/HOUR % OF TOT. C SAMP weight numbers Trachurus capensis 590.92 7845 76.13 367 Merluccius paradoxus 81.98 252 10.56 Chrysaora hysoscella 40.64 756 5.24 Pterothrissus belloci 26.12 232 3.36 Dentex macrophthalmus 9.98 61 1.29 368 Aequorea forskalea 9.98 333 1.29 Raja miraletus 9.48 10 1.22 Chlorophthalmus atlanticus 4.03 232 0.52 Sufflogobius bibarbatus 2.62 1008 0.34 Synagrops microlepis 0.40 40 0.05 __________ ________ Total 776.17 100.00
BCC Project: LMR/NANSEN/1/10
42
R/V Dr. Fridtjof Nansen SURVEY:2012405 STATION: 103 DATE :01/10/2012 GEAR TYPE: BT NO: 25 POSITION:Lat S 18°55.76 start stop duration Lon E 11°40.86 TIME :14:33:20 14:55:16 21.9 (min) Purpose : 1 LOG : 2208.67 2209.74 1.1 Region : 5010 FDEPTH: 296 300 Gear cond.: 0 BDEPTH: 296 300 Validity : 0 Towing dir: 0° Wire out : 670 m Speed : 2.9 kn Sorted : 150 Total catch: 1347.75 Catch/hour: 3687.41 SPECIES CATCH/HOUR % OF TOT. C SAMP weight numbers Trachurus capensis 2139.07 18443 58.01 369 Merluccius paradoxus 550.83 1354 14.94 Dentex macrophthalmus 518.58 2167 14.06 370 Pterothrissus belloci 233.68 1379 6.34 Lophius vomerinus 85.44 74 2.32 Helicolenus dactylopterus 43.34 2118 1.18 Chlorophthalmus atlanticus 26.84 1231 0.73 Chrysaora hysoscella 23.64 468 0.64 Coelorinchus coelorhincus 20.19 689 0.55 Synagrops microlepis 18.71 1404 0.51 Galeus polli 17.24 345 0.47 Macropipus rugosus 6.16 419 0.17 Sufflogobius bibarbatus 2.71 172 0.07 Austroglossus microlepis 0.98 49 0.03 Fishing gears 0.00 1650 0.00 __________ ________ Total 3687.41 100.00 R/V Dr. Fridtjof Nansen SURVEY:2012405 STATION: 104 DATE :01/10/2012 GEAR TYPE: PT NO: 4 POSITION:Lat S 19°2.22 start stop duration Lon E 11°43.87 TIME :20:04:17 20:25:37 21.3 (min) Purpose : 1 LOG : 2253.81 2255.04 1.2 Region : 5010 FDEPTH: 0 0 Gear cond.: 0 BDEPTH: 313 308 Validity : 0 Towing dir: 0° Wire out : 110 m Speed : 3.5 kn Sorted : 0 Total catch: 6.43 Catch/hour: 18.09 SPECIES CATCH/HOUR % OF TOT. C SAMP weight numbers Chrysaora hysoscella 7.26 464 40.12 Euphausiacea 4.64 1179 25.66 Aequorea forskalea 3.52 76 19.44 MYCTOPHIDAE 1.74 450 9.64 Lestrolepis intermedia 0.93 6 5.13 __________ ________ Total 18.09 100.00 R/V Dr. Fridtjof Nansen SURVEY:2012405 STATION: 105 DATE :01/10/2012 GEAR TYPE: PT NO: 1 POSITION:Lat S 19°2.15 start stop duration Lon E 11°46.03 TIME :20:51:30 21:13:01 21.5 (min) Purpose : 1 LOG : 2256.12 2257.41 1.3 Region : 5010 FDEPTH: 30 40 Gear cond.: 0 BDEPTH: 301 293 Validity : 0 Towing dir: 0° Wire out : 150 m Speed : 3.6 kn Sorted : 0 Total catch: 46.27 Catch/hour: 129.01 SPECIES CATCH/HOUR % OF TOT. C SAMP weight numbers MYCTOPHIDAE 109.54 68465 84.91 Chrysaora hysoscella 11.65 223 9.03 Aequorea forskalea 7.81 215 6.05 __________ ________ Total 129.01 100.00 R/V Dr. Fridtjof Nansen SURVEY:2012405 STATION: 106 DATE :01/10/2012 GEAR TYPE: PT NO: 1 POSITION:Lat S 19°0.56 start stop duration Lon E 11°50.43 TIME :22:02:34 22:32:29 29.9 (min) Purpose : 1 LOG : 2262.13 2263.48 1.4 Region : 5010 FDEPTH: 130 250 Gear cond.: 0 BDEPTH: 272 276 Validity : 0 Towing dir: 0° Wire out : 400 m Speed : 2.7 kn Sorted : 0 Total catch: 14.80 Catch/hour: 29.68 SPECIES CATCH/HOUR % OF TOT. C SAMP weight numbers MYCTOPHIDAE 11.99 5142 40.41 Trachurus capensis 7.96 88 26.82 371 Chrysaora hysoscella 5.17 152 17.43 Merluccius paradoxus 2.75 24 9.26 Aequorea forskalea 1.00 44 3.38 Synagrops microlepis 0.68 50 2.30 Solenocera africana 0.12 36 0.41 __________ ________ Total 29.68 100.00 R/V Dr. Fridtjof Nansen SURVEY:2012405 STATION: 107 DATE :02/10/2012 GEAR TYPE: BT NO: 25 POSITION:Lat S 19°8.69 start stop duration Lon E 11°48.34 TIME :07:50:21 08:20:37 30.3 (min) Purpose : 1 LOG : 2344.28 2345.78 1.5 Region : 5010 FDEPTH: 305 306 Gear cond.: 0 BDEPTH: 305 306 Validity : 0 Towing dir: 0° Wire out : 680 m Speed : 3.0 kn Sorted : 141 Total catch: 621.12 Catch/hour: 1231.16 SPECIES CATCH/HOUR % OF TOT. C SAMP weight numbers Merluccius paradoxus 703.31 2224 57.13 Trachurus capensis 292.35 2416 23.75 372 Sponges - yellow 64.36 785 5.23 Chlorophthalmus atlanticus 55.02 2111 4.47 Helicolenus dactylopterus 27.83 924 2.26 Dentex macrophthalmus 17.70 69 1.44 373 Nezumia micronychodon 13.44 444 1.09 MYCTOPHIDAE 11.16 2842 0.91 Illex coindetii 11.08 26 0.90 Scomber japonicus 6.62 8 0.54 Galeus polli 5.65 52 0.46 Synagrops microlepis 4.80 357 0.39 SOLENOCERIDAE 4.00 1431 0.33 Solenocera africana 2.87 603 0.23 Aequorea forskalea 2.70 131 0.22 Pterothrissus belloci 2.00 8 0.16 Chrysaora hysoscella 1.82 52 0.15 Macropipus rugosus 1.82 123 0.15 Austroglossus microlepis 0.79 61 0.06 Bathynectes piperitus 0.69 26 0.06 Bassanago albescens 0.61 8 0.05 Sufflogobius bibarbatus 0.52 26 0.04 Fishing gears 0.00 137 0.00 __________ ________ Total 1231.16 100.00
R/V Dr. Fridtjof Nansen SURVEY:2012405 STATION: 108 DATE :02/10/2012 GEAR TYPE: PT NO: 1 POSITION:Lat S 19°7.91 start stop duration Lon E 12°6.35 TIME :18:12:42 18:36:56 24.2 (min) Purpose : 1 LOG : 2417.80 2419.34 1.5 Region : 5010 FDEPTH: 20 30 Gear cond.: 0 BDEPTH: 193 176 Validity : 0 Towing dir: 0° Wire out : 110 m Speed : 3.8 kn Sorted : 0 Total catch: 3000.00 Catch/hour: 7428.81 SPECIES CATCH/HOUR % OF TOT. C SAMP weight numbers Aequorea forskalea 7428.81 0 100.00 __________ ________ Total 7428.81 100.00 R/V Dr. Fridtjof Nansen SURVEY:2012405 STATION: 109 DATE :02/10/2012 GEAR TYPE: PT NO: 1 POSITION:Lat S 19°3.34 start stop duration Lon E 12°19.08 TIME :20:22:34 20:32:39 10.1 (min) Purpose : 1 LOG : 2432.04 2432.66 0.6 Region : 5010 FDEPTH: 20 25 Gear cond.: 0 BDEPTH: 107 109 Validity : 0 Towing dir: 0° Wire out : 110 m Speed : 3.7 kn Sorted : 71 Total catch: 783.54 Catch/hour: 4663.93 SPECIES CATCH/HOUR % OF TOT. C SAMP weight numbers Aequorea forskalea 3312.44 58339 71.02 Trachurus capensis 1250.00 63708 26.80 374 Chrysaora hysoscella 101.49 2292 2.18 __________ ________ Total 4663.93 100.00 R/V Dr. Fridtjof Nansen SURVEY:2012405 STATION: 110 DATE :02/10/2012 GEAR TYPE: BT NO: 25 POSITION:Lat S 19°1.39 start stop duration Lon E 12°27.85 TIME :21:57:20 22:18:17 21.0 (min) Purpose : 1 LOG : 2443.20 2444.34 1.1 Region : 5010 FDEPTH: 38 35 Gear cond.: 0 BDEPTH: 38 35 Validity : 0 Towing dir: 0° Wire out : 140 m Speed : 3.3 kn Sorted : 99 Total catch: 1404.65 Catch/hour: 4022.86 SPECIES CATCH/HOUR % OF TOT. C SAMP weight numbers Callorhinchus capensis 1325.56 1203 32.95 Chrysaora hysoscella 1103.03 13232 27.42 Fishing gears 755.00 43343 18.77 Dicologoglossa cuneata 240.97 7578 5.99 Trachurus trecae 137.13 5092 3.41 375 Trachurus capensis 133.92 7698 3.33 376 Rochinia sp. 120.29 16880 2.99 Arius latiscutatus 106.65 842 2.65 Argyrosomus hololepidotus 56.71 9 1.41 Sponges - yellow 10.42 200 0.26 Narke capensis 8.02 40 0.20 Scyliorhinus capensis 6.04 29 0.15 BATRACHOIDIDAE 4.41 40 0.11 Starfish small 3.61 962 0.09 Squalus megalops 3.49 9 0.09 Merluccius paradoxus 2.41 80 0.06 G A S T R O P O D S 1.60 521 0.04 Helicolenus dactylopterus 0.80 40 0.02 CORYSITIDAE 0.80 80 0.02 Trichiurus lepturus 0.80 40 0.02 Sardinops ocellatus 0.80 40 0.02 Pterothrissus belloci 0.40 40 0.01 __________ ________ Total 4022.86 100.00 R/V Dr. Fridtjof Nansen SURVEY:2012405 STATION: 111 DATE :03/10/2012 GEAR TYPE: BT NO: 25 POSITION:Lat S 19°27.43 start stop duration Lon E 12°14.55 TIME :12:06:17 12:16:28 10.2 (min) Purpose : 1 LOG : 2544.96 2545.50 0.5 Region : 5010 FDEPTH: 193 194 Gear cond.: 0 BDEPTH: 193 194 Validity : 0 Towing dir: 0° Wire out : 500 m Speed : 3.2 kn Sorted : 130 Total catch: 782.77 Catch/hour: 4609.05 SPECIES CATCH/HOUR % OF TOT. C SAMP weight numbers Aequorea forskalea 2800.86 73413 60.77 Trachurus capensis 691.03 6571 14.99 377 Merluccius capensis 525.34 3568 11.40 Chrysaora hysoscella 426.42 2826 9.25 Dentex macrophthalmus 48.75 247 1.06 378 Pterothrissus belloci 38.16 318 0.83 Rochinia sp. 25.08 353 0.54 MYCTOPHIDAE 16.60 6642 0.36 Callorhinchus capensis 13.48 6 0.29 Ornithoteuthis antillarum 8.83 35 0.19 Sufflogobius bibarbatus 8.48 2084 0.18 Chlorophthalmus atlanticus 2.12 106 0.05 G A S T R O P O D S 1.77 636 0.04 Synagrops microlepis 1.06 35 0.02 Starfish small 1.06 212 0.02 __________ ________ Total 4609.05 100.00 R/V Dr. Fridtjof Nansen SURVEY:2012405 STATION: 112 DATE :03/10/2012 GEAR TYPE: BT NO: 25 POSITION:Lat S 19°19.60 start stop duration Lon E 12°34.50 TIME :15:09:38 15:34:02 24.4 (min) Purpose : 1 LOG : 2569.27 2570.55 1.3 Region : 5010 FDEPTH: 75 75 Gear cond.: 0 BDEPTH: 75 75 Validity : 0 Towing dir: 0° Wire out : 200 m Speed : 3.2 kn Sorted : 118 Total catch: 861.84 Catch/hour: 2119.28 SPECIES CATCH/HOUR % OF TOT. C SAMP weight numbers Aequorea forskalea 943.80 66 44.53 Trachurus capensis 365.09 8882 17.23 379 Callorhinchus capensis 200.19 172 9.45 Rhinobatos annulatus 172.82 52 8.15 Merluccius paradoxus 96.05 981 4.53 Chelidonichthys gabonensis 82.97 207 3.91 Argyrosomus inodorus 73.77 25 3.48 Starfish small 39.76 26698 1.88 Sufflogobius bibarbatus 36.66 19382 1.73 Chrysaora hysoscella 36.66 69 1.73 Dicologoglossa cuneata 16.52 413 0.78 Austroglossus pectoralis 14.63 34 0.69 DASYATIDAE 14.29 2 0.67 Galeichthys feliceps 13.77 69 0.65 Myliobatis aquila 7.13 2 0.34 Pterothrissus belloci 4.30 379 0.20 Engraulis encrasicolus 0.52 34 0.02 Rochinia sp. 0.34 69 0.02 __________ ________ Total 2119.28 100.00

BCC Project: LMR/NANSEN/1/10
43
R/V Dr. Fridtjof Nansen SURVEY:2012405 STATION: 113 DATE :03/10/2012 GEAR TYPE: PT NO: 1 POSITION:Lat S 19°30.91 start stop duration Lon E 12°30.02 TIME :19:04:34 19:19:35 15.0 (min) Purpose : 1 LOG : 2600.72 2601.76 1.0 Region : 5010 FDEPTH: 17 20 Gear cond.: 0 BDEPTH: 124 128 Validity : 0 Towing dir: 0° Wire out : 110 m Speed : 4.1 kn Sorted : 70 Total catch: 351.50 Catch/hour: 1403.19 SPECIES CATCH/HOUR % OF TOT. C SAMP weight numbers Aequorea forskalea 780.04 15269 55.59 Trachurus capensis 500.20 9860 35.65 380 Chrysaora hysoscella 87.82 838 6.26 J E L L Y F I S H 35.13 20 2.50 __________ ________ Total 1403.19 100.00 R/V Dr. Fridtjof Nansen SURVEY:2012405 STATION: 114 DATE :03/10/2012 GEAR TYPE: BT NO: 25 POSITION:Lat S 19°36.56 start stop duration Lon E 12°13.65 TIME :21:26:09 21:56:03 29.9 (min) Purpose : 1 LOG : 2618.33 2619.83 1.5 Region : 5010 FDEPTH: 219 218 Gear cond.: 0 BDEPTH: 219 218 Validity : 0 Towing dir: 0° Wire out : 530 m Speed : 3.0 kn Sorted : 58 Total catch: 400.31 Catch/hour: 803.30 SPECIES CATCH/HOUR % OF TOT. C SAMP weight numbers Merluccius paradoxus 209.48 652 26.08 Trachurus capensis 208.31 1800 25.93 381 Pterothrissus belloci 94.43 771 11.76 Aequorea forskalea 87.53 2217 10.90 Dentex macrophthalmus 47.62 223 5.93 382 Starfish small 46.58 2466 5.80 Chrysaora hysoscella 46.58 1461 5.80 G A S T R O P O D S 26.23 7409 3.26 Chlorophthalmus atlanticus 12.26 730 1.53 Ornithoteuthis antillarum 8.87 66 1.10 Coelorinchus simorhynchus 7.71 157 0.96 Austroglossus pectoralis 4.43 14 0.55 Sufflogobius bibarbatus 3.27 1017 0.41 __________ ________ Total 803.30 100.00 R/V Dr. Fridtjof Nansen SURVEY:2012405 STATION: 115 DATE :04/10/2012 GEAR TYPE: BT NO: 25 POSITION:Lat S 19°47.69 start stop duration Lon E 12°19.26 TIME :04:08:58 04:39:32 30.6 (min) Purpose : 1 LOG : 2675.50 2677.09 1.6 Region : 5010 FDEPTH: 194 196 Gear cond.: 0 BDEPTH: 194 196 Validity : 0 Towing dir: 0° Wire out : 490 m Speed : 3.1 kn Sorted : 67 Total catch: 469.63 Catch/hour: 921.75 SPECIES CATCH/HOUR % OF TOT. C SAMP weight numbers Aequorea forskalea 328.36 8449 35.62 Merluccius capensis 136.15 247 14.77 Merluccius paradoxus 136.15 1017 14.77 Trachurus capensis 122.41 1223 13.28 383 Chrysaora hysoscella 62.92 467 6.83 Pterothrissus belloci 43.96 440 4.77 Dentex macrophthalmus 39.71 206 4.31 384 Lophius vomerinus 16.35 14 1.77 J E L L Y F I S H 13.05 14 1.42 Illex coindetii 7.42 55 0.80 Synagrops microlepis 6.18 921 0.67 Austroglossus pectoralis 5.50 14 0.60 Sufflogobius bibarbatus 1.92 742 0.21 Coelorinchus simorhynchus 0.96 41 0.10 Chlorophthalmus atlanticus 0.69 151 0.07 __________ ________ Total 921.75 100.00 R/V Dr. Fridtjof Nansen SURVEY:2012405 STATION: 116 DATE :04/10/2012 GEAR TYPE: BT NO: 25 POSITION:Lat S 19°34.24 start stop duration Lon E 12°44.58 TIME :08:13:46 08:15:59 2.2 (min) Purpose : 1 LOG : 2707.70 2707.82 0.1 Region : 5010 FDEPTH: 59 58 Gear cond.: 0 BDEPTH: 59 58 Validity : 0 Towing dir: 0° Wire out : 180 m Speed : 3.1 kn Sorted : 32 Total catch: 3557.54 Catch/hour: 97023.82 SPECIES CATCH/HOUR % OF TOT. C SAMP weight numbers Trachurus capensis 87837.27 5848036 90.53 385 Argyrosomus inodorus 2591.45 873 2.67 Chrysaora hysoscella 2334.55 40855 2.41 Fishing gears 2217.82 195518 2.29 Etrumeus whiteheadi 1400.73 37936 1.44 Sardinops ocellatus 437.73 26264 0.45 Aequorea forskalea 204.27 8755 0.21 __________ ________ Total 97023.82 100.00
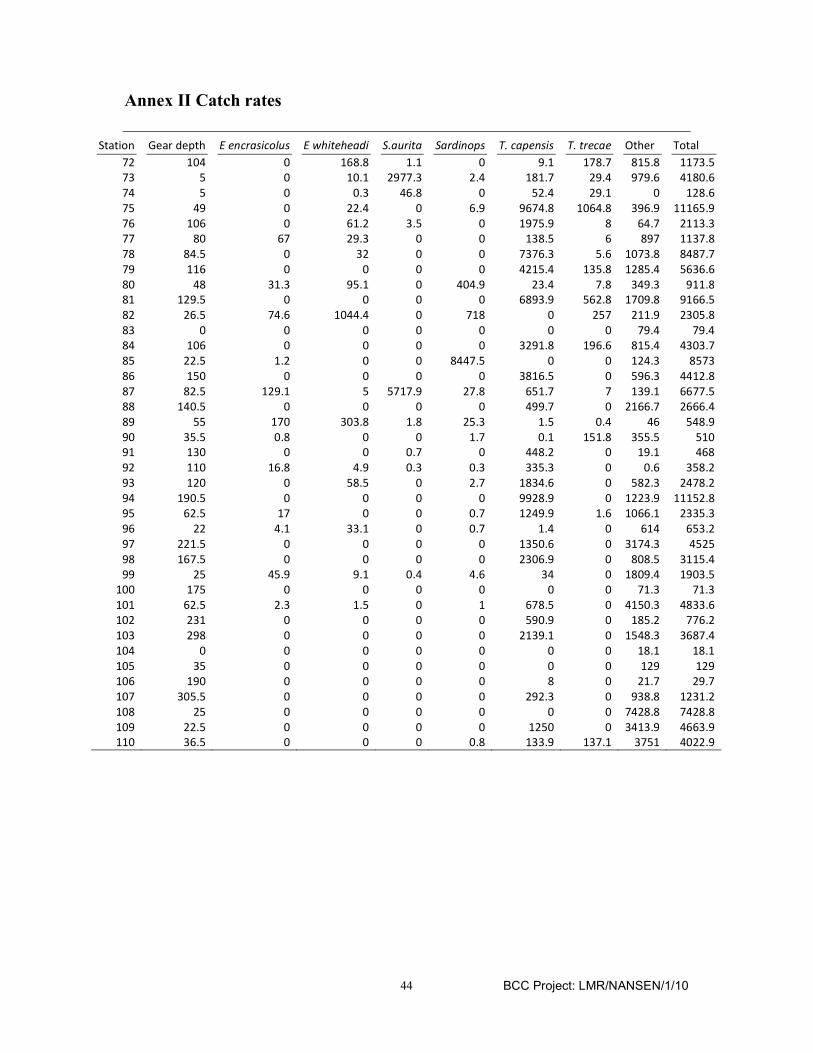
BCC Project: LMR/NANSEN/1/10
44
Annex II Catch rates
Station Gear depth E encrasicolus E whiteheadi S.aurita Sardinops T. capensis T. trecae Other Total
72 104 0 168.8 1.1 0 9.1 178.7 815.8 1173.5
73 5 0 10.1 2977.3 2.4 181.7 29.4 979.6 4180.6
74 5 0 0.3 46.8 0 52.4 29.1 0 128.6
75 49 0 22.4 0 6.9 9674.8 1064.8 396.9 11165.9
76 106 0 61.2 3.5 0 1975.9 8 64.7 2113.3
77 80 67 29.3 0 0 138.5 6 897 1137.8
78 84.5 0 32 0 0 7376.3 5.6 1073.8 8487.7
79 116 0 0 0 0 4215.4 135.8 1285.4 5636.6
80 48 31.3 95.1 0 404.9 23.4 7.8 349.3 911.8
81 129.5 0 0 0 0 6893.9 562.8 1709.8 9166.5
82 26.5 74.6 1044.4 0 718 0 257 211.9 2305.8
83 0 0 0 0 0 0 0 79.4 79.4
84 106 0 0 0 0 3291.8 196.6 815.4 4303.7
85 22.5 1.2 0 0 8447.5 0 0 124.3 8573
86 150 0 0 0 0 3816.5 0 596.3 4412.8
87 82.5 129.1 5 5717.9 27.8 651.7 7 139.1 6677.5
88 140.5 0 0 0 0 499.7 0 2166.7 2666.4
89 55 170 303.8 1.8 25.3 1.5 0.4 46 548.9
90 35.5 0.8 0 0 1.7 0.1 151.8 355.5 510
91 130 0 0 0.7 0 448.2 0 19.1 468
92 110 16.8 4.9 0.3 0.3 335.3 0 0.6 358.2
93 120 0 58.5 0 2.7 1834.6 0 582.3 2478.2
94 190.5 0 0 0 0 9928.9 0 1223.9 11152.8
95 62.5 17 0 0 0.7 1249.9 1.6 1066.1 2335.3
96 22 4.1 33.1 0 0.7 1.4 0 614 653.2
97 221.5 0 0 0 0 1350.6 0 3174.3 4525
98 167.5 0 0 0 0 2306.9 0 808.5 3115.4
99 25 45.9 9.1 0.4 4.6 34 0 1809.4 1903.5
100 175 0 0 0 0 0 0 71.3 71.3
101 62.5 2.3 1.5 0 1 678.5 0 4150.3 4833.6
102 231 0 0 0 0 590.9 0 185.2 776.2
103 298 0 0 0 0 2139.1 0 1548.3 3687.4
104 0 0 0 0 0 0 0 18.1 18.1
105 35 0 0 0 0 0 0 129 129
106 190 0 0 0 0 8 0 21.7 29.7
107 305.5 0 0 0 0 292.3 0 938.8 1231.2
108 25 0 0 0 0 0 0 7428.8 7428.8
109 22.5 0 0 0 0 1250 0 3413.9 4663.9
110 36.5 0 0 0 0.8 133.9 137.1 3751 4022.9

BCC Project: LMR/NANSEN/1/10
45
Annex III Instruments and fishing gear
Fishing gear
The vessel has two different sized "Åkrahamn" pelagic trawls and one "Gisund super bottom trawl". During the present survey only the bottom trawl was used. The bottom trawl has a headline of 31 m, footrope 47 m and 20 mm mesh size in the codend with an inner net of 10 mm mesh size. The trawl height was about 4.5 m and distance between wings during towing about 21 m. The sweeps are 40 m long. The trawl is equipped with a 12" rubber bobbins gear. Since 19.02.08 new and heavier “Thyborøn” combi trawl doors (7.41 m2, 1720 kg) have been in used. During the present survey the door distance was kept nearly constant at about 50 m at all depths by the use of a 9 m strap between the wires at 120 m distance from the doors (normally applied at depths greater than 80 m). At depths greater than 300 m the trawl was equipped with a tickler chain, which improves the catchability of bottom living and borrowing species, particularly shrimps. The SCANMAR system was used on all trawl hauls. This equipment consists of sensors, a hydrophone, a receiver, a display unit and a battery charger. Communication between sensors and ship is based on acoustic transmission. The doors are fitted with sensors to provide information on their distance, and the trawl was equipped with a trawl eye that provides information about the trawl opening. A catch sensor on the cod-end indicated the size of the catch. Acoustic instruments The Simrad ER-60/18, 38, 120 and 200 kHz scientific sounder was run during the survey only for observation of fish and bottom conditions. No scrutinizing of the recordings was done. Last standard sphere calibrations was carried out the 08.03.2012 in Baía dos Elefantes using Cu-64, Cu-60, WC-38.1 add WC-38.1 spheres for 18, 38, 120 and 200 kHz, respectively. The details of the settings for the 38 kHz echo sounder were as follows: Transceiver-2 menu (38 kHz)
Transducer depth 5.50 m / 8.0 m (when the keel was out) Absorbtion coeff. 9.6 dB/km Pulse duration medium (1,024ms) Bandwidth 2.43 kHz Max power 2000 Watt 2-way beam angle -20,6dB gain 25,24 dB SA correction -0.46 dB Angle sensitivity 21.9 3 dB beamwidth 7.31º along ship
7.34º athwardship Alongship offset 0.10º Athwardship offset 0.04º
Bottom detection menu Minimum level -43 dB

BCC Project: LMR/NANSEN/1/10
46
Annex IV Gonad Maturity stages
Stage Maturity status Description
I Immature
Ovary and testis lengths about 1/rd of body cavity length. Ovaries pinkish, translucent; testis whitish. Ova not visible to the naked eye. Ovary and testis quite narrow and have a tubular shape.
II Maturing virgin and recovering spent
Ovary and testis about ½ length of body cavity length. Ovary pinkish, translucent; testis whitish, more or less symmetrical. Ova not visible to the naked eye. Ovary more opaque; small specks make gonad appear more granular. Testes develop lobules, hence loosing the tubular shape. Some recovering spent ovaries have conspicuous blood vessels.
III Ripening
Ovary and testis about 2/3rds length of body cavity length. Ovary pinkish-yellow colour with granular appearance, testis whitish to creamy. No transparent ova visible. Milt can be seen inside testes when cut. Ovaries granular due to the presence of opaque oocytes. First time spawners have very swollen gonads. Ovaries that have spawned once lose consistency, but maintain the external appearance typical for this stage.
IV Ripe
Ovary and testis from 2/3rds to full length of body cavity. Ovary orange-pink in colour with conspicuous superficial blood vessels. Large transparent, ripe ova visible. Testis whitish to creamy, soft. Ovaries jelly-like due to the presence of translucent oocytes. Gonads extrude oocytes or milt when gently pressed.
V Spent
Ovary and testis shrunken to about ½ length of body cavity. Walls loose. Ovary may contain remnants of disintegrating opaque and ripe ova, darkened or translucent. Testis bloodshot and slack. Testes may have sperm remaining in the seminal duct. Pinkish areas appear in the periphery of the testes. Ovaries bloodshot and slack.