Embed Size (px)
Citation preview
March 2008
Columbia River Project Water Use Plan Middle Columbia River Ecological Productivity
Monitoring (2007) Reference: CLBMON-15b Columbia River Water Use Plan Monitoring Program:
Middle Columbia River Ecological Productivity Monitoring Study Period: 2007
Authors: Chris Perrin, Limnotek Research and Dev. Inc., Vancouver, B.C. Lynn Westcott, Golder Associates Ltd., Castlegar, B.C. Dana Schmidt, Golder Associates Ltd., Castlegar, B.C.

MIDDLE COLUMBIA RIVER ECOLOGICAL PRODUCTIVITY MONITORING, 2007
Final Report
April, 2008
.
Middle Columbia River Ecological Productivity Monitoring, 2007
Golder/Limnotek
April 2008
MIDDLE COLUMBIA RIVER ECOLOGICAL PRODUCTIVITY MONITORING, 2007
Final Report
Submitted to
BC Hydro Revelstoke, B.C.
Prepared by
C.J. Perrin
Limnotek Research and Development Inc., Vancouver, BC
L. Westcott, and D. Schmidt
Golder Associates, Castlegar, BC
April, 2008

Middle Columbia River Ecological Productivity Monitoring, 2007
Golder/Limnotek
April 2008
Citation: Perrin, C.J., L. Westcott, and D. Schmidt. 2008. Middle Columbia River ecological productivity monitoring, 2007. Report prepared by Golder Associates and Limnotek Research and Development Inc. for BC Hydro. 59p.
Cover photo: Reach 4 of the middle Columbia River at station R4S5 showing floats from deep
and shallow sampling arrays, September 2007. Photo by Chris Perrin. © 2008 BC Hydro. No part of this publication may be reproduced, stored in a retrieval system, or transmitted, in any form or by any means, electronic, mechanical, photocopying, recording, or otherwise, without prior permission from BC Hydro.
Middle Columbia River Ecological Productivity Monitoring, 2007
Golder/Limnotek
April 2008
EXECUTIVE SUMMARY
The Columbia River Water Use Plan supported implementation of a year-round minimum flow of 142 m3·s-1 to be released from Revelstoke Dam (REV). The result of minimum flow will be a shift, mainly in the spring and fall, from high flow during the day and little or no flow at night to a higher flow during the day and a minimum flow of 142 m3·s-1 at night. The higher daily maximum flows will be the result of the installation of Revelstoke Unit 5, which will provide additional peak generation capacity at REV. Some river substrata that are presently dewatered at night will remain continuously and permanently submerged with implementation of minimum flow. One of the key hypotheses behind the minimum flow decision is that maintaining a permanently wetted portion of the channel downstream of REV will result in the establishment of a benthic community in the new wetted area, with possible benefits to fish communities.
A multiyear project was started in 2007 to determine if minimum flow will modify the composition and biomass of periphyton and benthic invertebrates, thereby increasing availability of food for fish. Baseline data collections started in 2007 and are expected to continue during the late summer-fall period for four years. Measurements of periphyton and benthic invertebrate composition, abundance, and biomass were completed in September – October using a layout of 7 replicate sites within a deep and a shallow stratum in each of two reaches. Reach 4 extended 5 km from REV downstream to the confluence with the Jordan River. Reach 3 extended 3.5 km from the Jordan River to the confluence with the Illecillewaet River. Presently, the “deep” stratum is continuously wetted at night by water that leaks from the dam when turbines are shut down and from bank storage. During the day when power is being produced, this stratum is exposed to deeper water and higher velocities compared to the stratum at higher elevations. The higher “shallow” stratum is presently dewatered at night on most days in late summer and early fall but will be continuously submerged with the onset of minimum flow. Periphyton plates and benthic invertebrate baskets were used for sample collections. The samplers were placed at surveyed locations during night-time hours when there was minimal discharge from REV. Collections were made 42-45 days later by retrieving the samplers through the water column during the day from a boat. Average daily submergence time, estimated using temperature loggers attached to each shallow sampler, was 21.2 h in Reach 4 and 17.6 h in Reach 3. Deep samplers were verified to be submerged at all times, also based on data from temperature loggers attached to selected samplers. Habitat measurements were made during both sampler installation and retrieval and were compiled for later analysis to examine the relative importance of wide ranging habitat attributes in determining benthic assemblages. Samples of fish stomach contents were collected using gastric lavage techniques during fish sampling as part of the Middle Columbia River (MCR) fish indexing project that was conducted simultaneously with this study. These data will be used in ongoing analyses to examine presence or absence of links between organisms that are produced in the MCR and those ingested by fish in the MCR.
In total, 21 of 28 baskets and 19 of 28 plates were retrieved. The other samplers could not be retrieved due to a combination of gear wear and failure, damage by bears, and vandalism.
In 2007, daily dewatering of the shallow strata and location in the study area did not affect peak periphyton biomass (PB) measured as chlorophyll a (Chl a) concentration at the end of a set time of community development on the artificial

Middle Columbia River Ecological Productivity Monitoring, 2007
Golder/Limnotek
April 2008
substrates. PB was 1.4 – 1.9 µg Chl a·cm-2 across all reach and elevation combinations. The periphyton community at all locations and elevations was comprised almost entirely of diatoms. These findings showed that in late summer and fall 2007, algal mats were sustained despite the daily dewatering.
In multivariate analysis, four invertebrate taxa were found to be important indicators of elevation contrasts within reaches. They were Chironomidae (all chironomids), Hydridae (Hydra sp.), Naididae (naidid worms), and Enchytraeidae (enchytrid worms). Due to low biomass in Reach 3 and absence in Reach 4, aquatic insects other than the chironomids were notably lacking from this list. Biomass of the chironomids was consistently greater in deep than shallow samplers, implying loss of biomass in association with the daily dewatering of shallow substrata. The same was true of Hydra sp. although the difference in biomass between elevations in Reach 4 (40% difference) was less striking than that found in Reach 3 (3 times difference). In contrast, biomass of the oligochaete worms (Naididae and Enchytraeidae) changed little with elevation.
Fishes collected from the MCR were found to mainly ingest zooplankton entrained in water released from Revelstoke Reservoir. Benthic invertebrates produced in the MCR were only a minor part of prey used by all fish species. These preliminary observations suggest that production of food upstream of the MCR is more important than food produced within the MCR for supporting fish populations using habitat in the MCR.
Recommendations for continued monitoring in 2008 include:
1. Improvements to sampler rigging to reduce gear wear and failure. Specifications are provided.
2. Changes to rigging to improve ease of retrieval of basket samplers. Specifications are provided.
3. Minor changes to equipment used to accurately place samplers in the shallow river stratum. Upgrades to the rudimentary transit device used for sampler placement are specified.
4. Move shallow sample sites in Reach 3 to sites that are less accessible by the general public to reduce potential for vandalism.
5. Future analyses will require measurement of the added river bed surface area that will be continuously wetted with minimum flow. This calculation can be run using the HEC-RAS model that is presently available for the MRC. Following calibration of the model within the next two years, the required surface areas should be calculated.

Middle Columbia River Ecological Productivity Monitoring, 2007
Golder/Limnotek
April 2008
ACKNOWLEDGEMENTS
Many people are thanked for valuable contributions to this project. The work was completed under contract to BC Hydro. Karen Bray (BC Hydro, Environment and Social Issues, Revelstoke, B.C.) was the contract manager. Karen is thanked for numerous discussions and input throughout the project and for negotiating timely outages at the dam to allow sampler installation. We also thank Karen for provision of work and gear storage space at the BC Hydro compound in Revelstoke. Particular thanks goes to Bob Chapman (Golder, Castlegar) for ensuring safety on the water, expert boat operation, assistance with equipment assembly, and all sampling activities. Special thanks also goes to Kiyo Masuda (Limnotek) who organized all logistics, worked with suppliers to fabricate and deliver all sampling hardware and rigging, provided liaison with laboratories, assisted with all sampling activities, and compiled all data ready for analysis. Danusia Dolecki completed the benthic invertebrate enumerations. Mary Bolin completed the periphyton cell counts. Water lab services were provided by the Pacific Environmental Science Centre and the specialty low level nutrients lab located at Cultus Lake.
The HEC-RAS cross-section figures were generated by staff at Klohn Crippen Berger at the request of the Golder project manager.
GPS post-processing was carried out by Peter Srajer, Geomatics Engineer with Golder in the Calgary office. In order to set up an easily accessible base station for the Leica1200 RTK GPS system, survey monument coordinates at Revelstoke Dam were obtained from Don Anderson of BC Hydro’s surveying department in Burnaby, BC. A benchmark was set up atop a dredge pile on the gravel pit owned by Spears Construction of Revelstoke, BC. Permission was obtained from the owner of the gravel pit, Michael Speerbrecker, to access the property and set up the GPS equipment.

Middle Columbia River Ecological Productivity Monitoring, 2007
Golder/Limnotek
April 2008
TABLE OF CONTENTS
Page
EXECUTIVE SUMMARY ................................................................................................. III
ACKNOWLEDGEMENTS .................................................................................................V
TABLE OF CONTENTS...................................................................................................VI
LIST OF FIGURES.........................................................................................................VIII
LIST OF TABLES.............................................................................................................IX
1 INTRODUCTION ....................................................................................................... 1
2 MATERIALS AND METHODS................................................................................... 2
2.1 Approach ............................................................................................................ 2 2.2 Selection of Biological Metrics ............................................................................ 3 2.3 Timing of Sampling Effort ................................................................................... 4 2.4 Sample Size........................................................................................................ 4 2.5 Study Site ........................................................................................................... 4 2.6 Biological Sampling Equipment and Procedures................................................ 9 2.7 Habitat Measurements...................................................................................... 15 2.8 Fish Stomach Contents .................................................................................... 19 2.9 Safety in the Field ............................................................................................. 20 2.10 Data Analyses................................................................................................... 22
3 RESULTS ................................................................................................................ 24
3.1 Flow and Temperature...................................................................................... 24 3.2 Water chemistry................................................................................................ 28 3.3 Sampler Retrieval ............................................................................................. 30 3.4 Submergence Times for Shallow Samplers...................................................... 30 3.5 Periphyton Biomass and Composition.............................................................. 34 3.6 Benthic Invertebrate Biomass and Composition............................................... 36 3.7 Fish Stomach Contents .................................................................................... 39
4 DISCUSSION AND RECOMMENDATIONS............................................................ 40
4.1 Samplers........................................................................................................... 40 4.2 Flow and Wetted Surface Area......................................................................... 42 4.3 Periphyton......................................................................................................... 42 4.4 Benthic Invertebrates........................................................................................ 43 4.5 Fish Stomach Contents .................................................................................... 45
5 LIST OF REFERENCES.......................................................................................... 47

Middle Columbia River Ecological Productivity Monitoring, 2007
Golder/Limnotek
April 2008
APPENDIX A: CROSS SECTIONS OF THE MID-COLUMBIA RIVER AT EACH BENTHIC SAMPLING SITE, 2007.................................................................................. 51
6 APPENDIX B: RAW DATA APPENDICES .............................................................. 59
Middle Columbia River Ecological Productivity Monitoring, 2007
Golder/Limnotek
April 2008
LIST OF FIGURES
Page
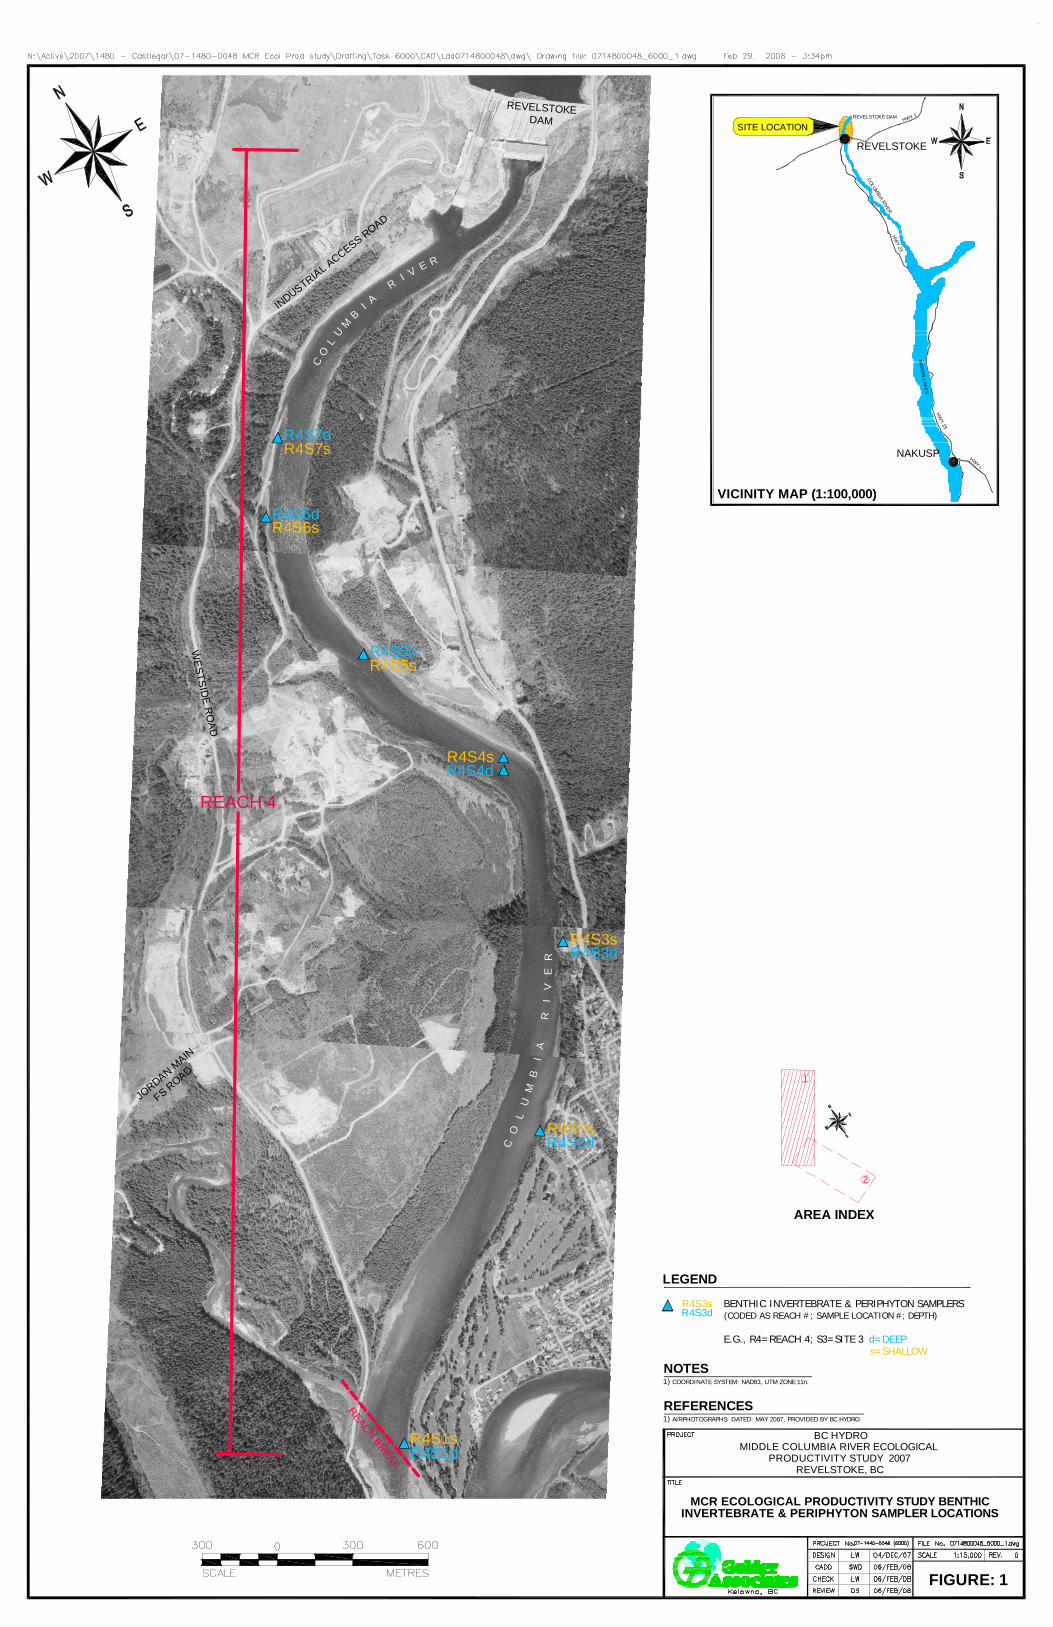
Figure 1. Orthophoto of Reach 4 of the middle Columbia River showing layout of sample sites and reach breaks. ................................................................................. 7
Figure 2. Orthophoto of Reach 3 of the middle Columbia River showing layout of sample sites and reach breaks. ................................................................................. 8
Figure 3. Wire basket filled with gravel used for sampling benthic invertebrates.............. 9
Figure 4. Periphyton plate sampler installed in the MCR. ............................................... 10
Figure 5. Schematic drawing of a standard artificial substrate sampler array used in 2007 in the MCR. ................................................................................................. 11
Figure 6. Images of Reach 3 looking downstream from the single lane road bridge near sampling station R3S5 (Figure 2) during midday at peak flows and early in the morning at zero discharge from REV (bottom)............................... 25
Figure 7. Mean daily water temperature at the downstream end of Reaches 4 (R4S1) and 3 (R3S1) during the study period, 2007. .............................................. 26
Figure 8. Daily water releases from REV during the study period. ................................. 27
Figure 9. Mean water release (±SE) from REV by hour during the study period of September 9 to October 23, 2007. .......................................................................... 28
Figure 10. Daily mean submergence time of shallow samplers in Reaches 4 (n=5) and 3 (n=5), 2007........................................................................................... 34
Figure 11. Mean periphyton PB (±SE) in the middle Columbia River by reach and elevation. ................................................................................................................. 35
Figure 12. MDS ordination of family-level benthic invertebrate biomass samples, displayed by elevation (two different symbols) and reach (3=Reach 3 and 4=Reach 4). ............................................................................................................. 37
Figure 13. Image of algal biomass on exposed cobble in the MCR at time of partial outage at REV............................................................................................... 43
Figure 14. Schematic drawing of the recommended artificial substrate sampler array for use in 2008. Compare with Figure 9. ........................................................ 45
Middle Columbia River Ecological Productivity Monitoring, 2007
Golder/Limnotek
April 2008
LIST OF TABLES
Page
Table 1. List of candidate habitat variables and associated descriptions to be considered in later modeling to examine the relative importance of habitat attributes in determining benthic invertebrate composition and abundance. ........... 15
Table 2.Mean (±SE) concentrations of chemical analytes by reach in the Middle Columbia River, 2007. ............................................................................................. 29
Table 3. Sampler retrieval success by reach and elevation. Original number of samplers = 7. ........................................................................................................... 30
Table 4. Sampler site coordinates and elevations in Reaches 4 and 3. ......................... 32
Table 5. Percent contribution of algal indicators to total cell count and to dissimilarities of algal communities between elevations, when blocked by reach, in 2007. ......................................................................................................... 36
Table 6. Percent contribution of invertebrate indicators to total invertebrate biomass and to contrasts of invertebrate communities between elevations in 2007......................................................................................................................... 38
Table 7. Mean value of selected invertebrate metrics stratified by elevation and reach with probabilities of elevation and reach effects. ........................................... 39
Table 8. Percent composition of stomach contents of fish captured in the MCR in fall 2007. Kokanee that are listed were found in stomachs of bull trout................... 40
Middle Columbia River Ecological Productivity Monitoring, 2007 1
Golder/Limnotek
April 2008
1 INTRODUCTION
The Columbia River Water Use Plan (BC Hydro 2005) supported implementation
of a year-round minimum flow of 142 m3·s-1 to be released from Revelstoke Dam (REV). Discharge from REV can vary from 0 to 1,700 m3·s-1 over a 24 hour period in response to power demand. These extremes in water release mostly occur in the spring and fall. At other times of the year, power demand occurs throughout the day and night, resulting in continuous water releases. There currently is no minimum flow or ramping restriction at REV at any time of the year. The result of implementation of the WUP minimum flow will be a shift, mainly in the spring and fall, from high flow during the day and little or no flow at night to high flow during the day and a minimum flow of 142 m3·s-1 at night. It will mean that some river substrata that are presently dewatered at night will remain continuously and permanently submerged with implementation of minimum flow.
One of the key hypotheses behind the minimum flow decision is that maintaining a permanently wetted portion of the channel downstream of REV will result in the establishment of a benthic community in the new wetted area, with possible benefits to fish communities. While there is little doubt that continuously submerged substrata will develop a benthic community, the composition and extent of biomass development by periphyton and benthic invertebrates is uncertain. The purpose of this project is twofold:
1. Describe variation in attributes of the benthic community as indicators of river health in the middle Columbia River (MCR) in years before and after implementation of minimum flow,
2. Determine if the WUP minimum flow results in changes to the composition and biomass of periphyton and benthic invertebrates, thereby increasing availability of food for fish.
The present monitoring schedule defined in the water use plan (BC Hydro 2005) provides four years of monitoring before minimum flow is implemented (2007 – 2010) and up to ten years of monitoring thereafter. Despite this long schedule, it is anticipated that evidence to determine the importance of minimum flow on benthic assemblages as indicators of river health and food availability for fish will be available within fewer than ten years after implementation of minimum flow.

Middle Columbia River Ecological Productivity Monitoring, 2007 2
Golder/Limnotek
April 2008
2 MATERIALS AND METHODS
2.1 Approach
In the multiyear project design, measurements of periphyton and invertebrate metrics among years before a change in flow (2007 – 2010) will be compared to the same measurements among years after the change in flow (up to ten years after 2010). The effect of minimum flow and the increased flows from Revelstoke 5 operations will eventually be tested as interventions superimposed on the time series of metric measurements. In this design, the change in flow is confounded with naturally occurring time effects because there is no control sampling area downstream of the dam that will not be receiving the minimum flow treatment.
This confounding will not be an analytical problem for testing substrata that are periodically dewatered under the present flow regime because any change will be unequivocally associated with a change in water release from the dam. The benthic community will essentially change from “nothing or something close to nothing” (i.e., few or no invertebrates due to daily desiccation) to “something” (i.e., some density or other metric in the continuously wetted portion of the channel).
For substrata that are presently wetted at all times, any change due to minimum flow may be more subtle as the effect of the changing flow regime must be higher than natural variation over time to be detected. The potentially large inter-year variations in discharge prior to and after flow changes may lead to uncertainties about causes of any significant time effect that is detected in that permanently wetted strata. If no time effect on benthos metrics is found among substrata that are sampled in the permanently wetted areas of the channel, those substrata may be used as a reference for testing the time effect on substrata at higher elevations in the channel and are presently dewatered for some period during the day.
To alleviate the confounding problem, multivariate tools will be used to examine what habitat attributes best explain dissimilarities among groups of samples that are collected across years and locations downstream of REV. For example, clustering and ordination using multidimensional scaling (Clarke and Gorley 2006) are powerful tools to reveal similarities among groups of samples. Once groups are defined, multivariate modeling tools like discriminant function analysis (DFA) can be used to determine what habitat attributes, including flow variables, are most important in defining those sample groups. This approach of linking multivariate analyses can be used to determine the importance of minimum flow in defining the composition of biological communities and abundance of invertebrates within those communities. The advantage of this approach is that insight can be gained about the importance of minimum flow on benthic community attributes within short periods of time.

Middle Columbia River Ecological Productivity Monitoring, 2007 3
Golder/Limnotek
April 2008
2.2 Selection of Biological Metrics
The first project objective (Section 1) implies need to investigate whether minimum flow improves “river health”. A “healthy” river is one having a wide diversity of benthic invertebrates that are characteristic of high water quality and diverse physical habitat (Reice and Wohlenberg 1993, Boulton 1999, Norris and Thoms 1999, Norris and Hawkins 2000). Because of continuous exposure to water flow, benthic invertebrates can provide an integrated record of physical and chemical environmental quality. They are ubiquitous, largely sedentary, and there are large numbers of species that can provide an integrated measure of response to stress. Their characteristics allow effective spatial and temporal analyses of disturbance among and within streams and rivers (Bailey et al. 2004). Benthic invertebrates, along with epilithic algae, are often the first organisms of an aquatic community to respond to environmental stress and are usually the first to recover from it. The result is that monitoring benthic invertebrates can provide a clear indication of ecosystem health and change in the quality of the water they inhabit.
The project objectives assume a functional link between benthic invertebrates and fish, implying that an invertebrate metric(s) must have relevance with regard to availability of invertebrate food for fish. The biomass of benthic invertebrates is relevant because this metric describes potential availability of fish food organisms. Fish species of interest in the MCR are bull trout, mountain whitefish, and rainbow trout. Comparison of fish stomach contents with benthic invertebrate composition is useful for examining similarities between food ingested by fish and food available for fish.
The link between benthic invertebrates and fish is part of the river food web, which is largely supported by the growth and biomass of periphyton. In streams, algal biomass is not static, but is constantly changing in relation to growth, scour, grazing, and substrata size distribution. In turn, availability of nutrients (Bothwell 1989), temperature (DeNicola 1996), and irradiance (Hill 1996) can influence specific growth rates. Measurement of algal biomass accruing over time integrates effects of these environmental factors. Algal accrual is a function of cell settlement during a colonisation phase, actual growth, and losses associated with insect grazing and sloughing. Colonisation largely determines biomass in the first week of accrual but thereafter colonisation is insignificant relative to growth (Bothwell and Jasper 1983). Peak biomass (PB) measured on substrata that are placed in the river to accrue a community over time is a function of actual growth (Bothwell 1989) and can be used in place of growth for spatial and temporal comparisons. PB is hereby defined as the highest concentration of chlorophyll-a (Chl a) attained on a substrate over time that includes phases of colonisation, growth, and biomass decline due to sloughing. Measurement of PB requires collection of biomass from artificial substrata that are placed in the river. These substrates provide a media for the development of a periphyton community. The length of time required for a periphyton community to approach PB is at least 40 days in the middle Columbia River (Perrin et al. 2004).

Middle Columbia River Ecological Productivity Monitoring, 2007 4
Golder/Limnotek
April 2008
2.3 Timing of Sampling Effort
Late summer and fall (August through October) was selected for sampling because this is the only time when elevation of the Arrow Lakes Reservoir is low enough to produce substantial riverine habitat in the MCR without backwatering. In late fall to early spring (November through April) tributary inflows are low and there is minimal reservoir backwatering. In spring and summer, rising water surface elevation of Arrow Lakes Reservoir progressively eliminates lotic habitat. This flooding progresses over 40 km, from Shelter Bay to approximately the Revelstoke airport near the confluence of the Illecillewaet River, with yearly variations. The flooding essentially leaves the upper portion of the river (REV to the Illecillewaet River) as the only effective lotic habitat in the MCR during the relatively warm and biologically productive time of year (June through September). In some years, the reach from the Jordan River to the Illecillewaet River will also be backwatered. Late summer and fall is a time when biological production is relatively high and backwatering effects from the reservoir are declining. More riverine habitat would be available in the winter months since this is a time when Arrow Lakes Reservoir is being drawn down but low biological production at that time makes the winter less attractive for assessing the effect of minimum flow.
2.4 Sample Size
Following testing of benthic sampling methods in the MCR in 2003, Perrin et al. (2004) recommended seven replicate benthic invertebrate samples be collected from each stratum within each reach to meet objectives of evaluating the effect of minimum flow on invertebrate metrics. This recommendation was based on the possible need for replicates to provide sufficient analytical power to test for a year effect on selected metrics using a two-way (year x reach) ANOVA. Loss of less than half the samplers in one or more years will limit testing of a year effect but it is not expected to reduce the ability to test for a treatment effect since data from the multiple years within a time block (i.e. years before change in flow or years after change in flow) can be pooled for analysis. This pooling increases sample size and degrees of freedom within either of the two blocks of years. Given that some gear loss will not affect the ultimate test of treatment effect, the use of seven replicates within each reach and elevation combination, as recommended by Perrin et al. (2004), was used in the 2007 sampling. The details of the analysis and specific criteria and reviewed literature used to support this recommendation are provided in Perrin et al. (2004).
2.5 Study Site
The riverine segment was divided into two reaches (Figures 1 and 2). Reach 4 extends 5 km from REV downstream to the confluence with the Jordan River. Reach 3

Middle Columbia River Ecological Productivity Monitoring, 2007 5
Golder/Limnotek
April 2008
extends 3.5 km from the Jordan River to the confluence with the Illecillewaet River. Reaches 2 and 1 are consecutively downstream of the Illecillewaet River and are not part of this project because they were lacustrine during the sampling period of late summer and fall.
Several hydrological attributes make Reaches 4 and 3 unique. The channel is mostly dewatered at night in the spring and fall when turbines are shut down at REV. An exception is a small part of the bottom of the channel throughout the reaches that remains wetted due to leakage from the dam. High flows occur during the day that can scour substrata. Invertebrate diversity and abundance can be greater in Reach 3 than upstream due to insect recruitment from the Jordan River (Perrin et al. 2004). Reach 3 is also characterized by more variable substrata sizes within a wider, less “U” shaped channel than is present upstream.
Channel cross sections and water surface elevations at various flows as defined with an HEC model (Korman et al. 2002) are shown in Appendix A. Reach 4 is characterized by a “U” shaped channel with moderate to steep submerged banks at peak water releases from the dam (1,700 m3·s-1 ; river flow when all four generating units are running). The banks grade to a flat bottom. Bankfull widths range from 147 – 223 m. The upper segment of Reach 3 is immediately downstream of the “Big Eddy” where the river turns approximately 120 degrees, forming a deeply incised thalweg on the left upstream bank. On the right side of the thalweg facing upstream, the river bed is flat and broad, resulting in a bankfull width of 360 m at the peak water release. Further downstream, the thalweg is central. Within 1,700 m downstream of the top of Reach 3, side or braided channels are present, and bankfull width at the peak water release increases to 489 m. A floodplain extends further, but is normally not wetted. At the downstream end of Reach 3, the channel narrows with some braiding and a relatively deep thalweg is located close to the left upstream bank. The river discharged into Upper Arrow Lake immediately downstream of this location in September – October, 2007. Bankfull width at that point was 358 m.
Within each reach two elevation strata were defined. A low elevation stratum is continuously wetted at present, by water that leaks from the dam when turbines are shut down, and as seepage from bank storage of near surface aquifers that are recharged during daily high flows. During the day when power is being produced, this low elevation stratum is exposed to the deepest water and the highest velocities compared to higher elevation substrata. A higher elevation stratum is presently dewatered at night on most days in late summer and early fall but will be continuously submerged with the onset of minimum flow. For this report, the two strata were called “shallow” for the higher elevation and “deep” for the low elevation. Actual elevations of both strata on several transects across Reaches 3 and 4, based on HEC model output (Korman et al. 2002), are shown on images in Appendix A.
Middle Columbia River Ecological Productivity Monitoring, 2007 6
Golder/Limnotek
April 2008
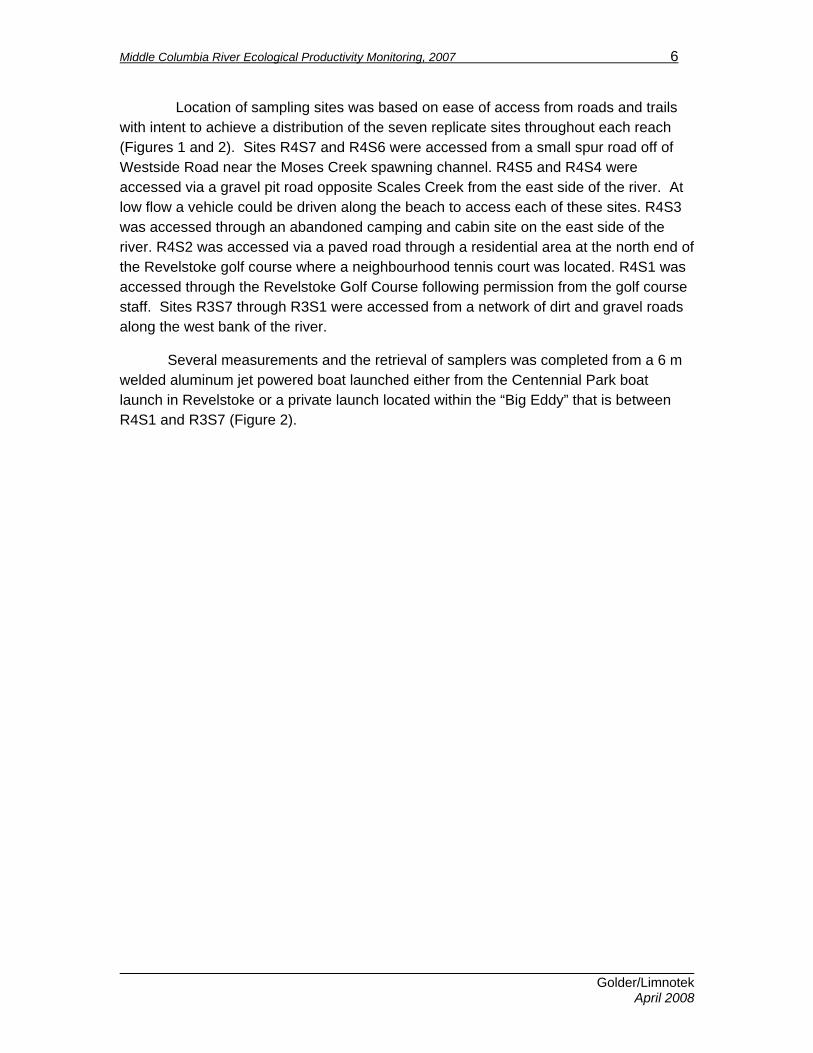
Location of sampling sites was based on ease of access from roads and trails with intent to achieve a distribution of the seven replicate sites throughout each reach (Figures 1 and 2). Sites R4S7 and R4S6 were accessed from a small spur road off of Westside Road near the Moses Creek spawning channel. R4S5 and R4S4 were accessed via a gravel pit road opposite Scales Creek from the east side of the river. At low flow a vehicle could be driven along the beach to access each of these sites. R4S3 was accessed through an abandoned camping and cabin site on the east side of the river. R4S2 was accessed via a paved road through a residential area at the north end of the Revelstoke golf course where a neighbourhood tennis court was located. R4S1 was accessed through the Revelstoke Golf Course following permission from the golf course staff. Sites R3S7 through R3S1 were accessed from a network of dirt and gravel roads along the west bank of the river.
Several measurements and the retrieval of samplers was completed from a 6 m welded aluminum jet powered boat launched either from the Centennial Park boat launch in Revelstoke or a private launch located within the “Big Eddy” that is between R4S1 and R3S7 (Figure 2).
R4S7dR4S7s
R4S6dR4S6s
R4S5dR4S5s
R4S4sR4S4d
R4S3sR4S3d
R4S2sR4S2d
R4S1sR4S1d
WE
STSID
E R
OA
D
INDUSTRIAL ACCESS ROAD
JORDAN M
AIN
FS ROAD
REACH 4
REVELSTOKEDAM
CO
LU
M
BI A
RI V E R
CO
LU
MB
IA
R
IV
ER
REACH BREAK
SITE LOCATION
COLUMBIA RIVER
HWY 1
HW
Y 23REVELSTOKE
NAKUSP
AR
ROW
LAKE
S
HW
Y 23
HWY 6
REVELSTOKE DAM
MCR ECOLOGICAL PRODUCTIVITY STUDY BENTHICINVERTEBRATE & PERIPHYTON SAMPLER LOCATIONS
BC HYDROMIDDLE COLUMBIA RIVER ECOLOGICAL
PRODUCTIVITY STUDY 2007REVELSTOKE, BC
FIGURE: 1
REFERENCES1) AIRPHOTOGRAPHS: DATED: MAY 2007, PROVIDED BY BC HYDRO.
LEGEND
R4S3sR4S3d
VICINITY MAP (1:100,000)
NOTES1) COORDINATE SYSTEM: NAD83, UTM ZONE 11n.
AREA INDEX
1
2
BENTHIC INVERTEBRATE & PERIPHYTON SAMPLERS(CODED AS REACH #; SAMPLE LOCATION #; DEPTH)
E.G., R4=REACH 4; S3=SITE 3 d=DEEP s=SHALLOW